Economic Impact of the Great East Japan Earthquake and Current Status of Recovery
May 16, 2011
Ministry of Economy, Trade and Industry
http://www.meti.go.jp/english/earthquake/recovery/index.html
Contents
1. Extent of the affected areas・・・・・・・・・・・・・・・・・・・・・・ ・・・ ・・・ ・・・ 22. Reconstruction and recovery following the Hanshin-Awaji earthquake 33. Reconstruction and recovery following the recent earthquake
(1) Tohoku Expressway ・・・・・・・・・・・・・・・・・・・・・・・・ ・・・ ・・・ ・・・ 4(2) Railroads ・・・・・・・・・・・・・・・・・・・・・・・・・・・・・・・・ ・・・ ・・・ ・・・ 5(3) Sea Ports・・・・・・・・・・・・・・・・・・・・・・・・・・・・・・・・・ ・・・ ・・・ ・・・ 6(4) Airports ・・・・・・・・・・・・・・・・・・・・・・・・・・・・・・・・・ ・・・ ・・・ ・・・ 7
4. Electricity supply/demand ・・・・・・・・・・・・・・・・・・・・・・ ・・・ ・・・ ・・ ・ 8
5. Present status and prospects of restoration of production bases in the affected areas ・・・・・・・・・・ ・・・ ・・・ ・・・ 9
6. Effects on specific industries(1) Steel ・・・・・・・・・・・・・・・・・・・・・・・・・・・・・・・・・・・・ ・・・ ・・・ ・・・ 10 (2) Petrochemical・・・・・・・・・・・・・・・・・・・・・・・・・・・・・ ・・・ ・・・ ・・・ 11(3) Auto and electronics ・・・・・・・・・・・・・・・・・・・・ ・・・ ・・・ ・・・ 12
7. Effects of radioactivity from Fukushima Dai-ichi NPS(1) Distance between Tokyo and Fukushima Plant ・・・・・ ・・・ ・・・ ・ 13(2) Effects of radioactivity ・・・・・・・・ ・・・・・・・・ ・・・・・・・ ・・・ ・・・ ・ 14
8. Macroeconomic impact(1) Comparison with the “Lehman Shock”・・・・・・・・・・・ ・・・ ・・・ ・ 16(2) Cabinet office estimate ・・・・・・・・・・・・・・・・・・・・・・ ・・・ ・・・ ・ 17
1
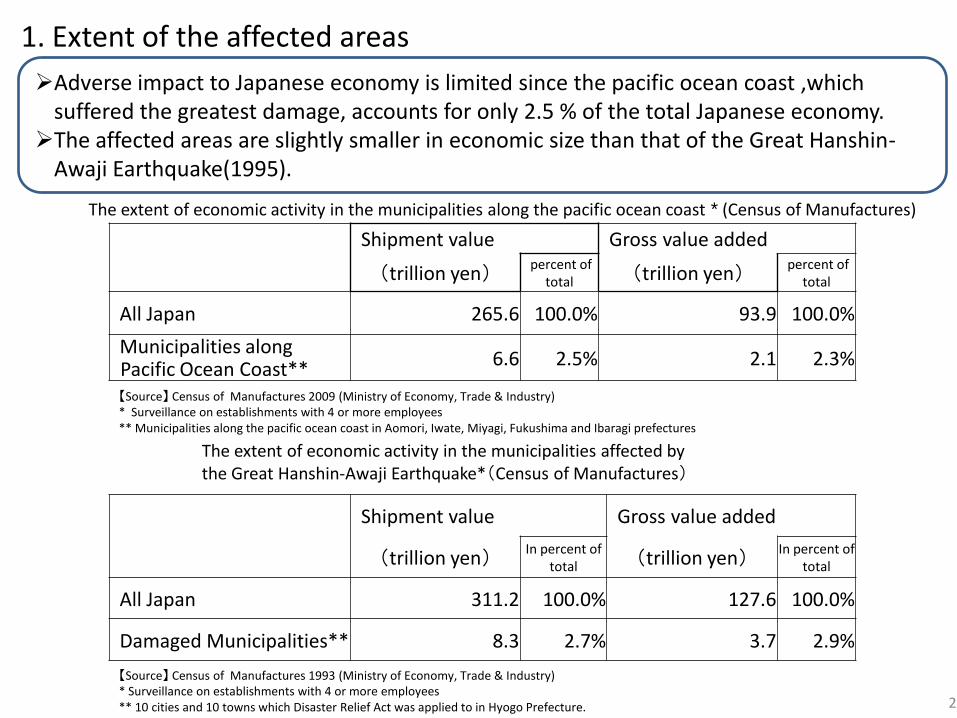
The extent of economic activity in the municipalities along the pacific ocean coast * (Census of Manufactures)
The extent of economic activity in the municipalities affected by the Great Hanshin-Awaji Earthquake*(Census of Manufactures)
1. Extent of the affected areas
2
Adverse impact to Japanese economy is limited since the pacific ocean coast ,which suffered the greatest damage, accounts for only 2.5 % of the total Japanese economy.The affected areas are slightly smaller in economic size than that of the Great Hanshin-
Awaji Earthquake(1995).
Shipment value Gross value added
(trillion yen)percent of
total (trillion yen)percent of
total
All Japan 265.6 100.0% 93.9 100.0%
Municipalities along Pacific Ocean Coast** 6.6 2.5% 2.1 2.3%
Shipment value Gross value added
(trillion yen)In percent of
total (trillion yen)In percent of
total
All Japan 311.2 100.0% 127.6 100.0%
Damaged Municipalities** 8.3 2.7% 3.7 2.9%
【Source】 Census of Manufactures 2009 (Ministry of Economy, Trade & Industry)* Surveillance on establishments with 4 or more employees** Municipalities along the pacific ocean coast in Aomori, Iwate, Miyagi, Fukushima and Ibaragi prefectures
【Source】 Census of Manufactures 1993 (Ministry of Economy, Trade & Industry)* Surveillance on establishments with 4 or more employees ** 10 cities and 10 towns which Disaster Relief Act was applied to in Hyogo Prefecture.
2. Reconstruction and recovery following the Hanshin-Awaji Earthquake
3
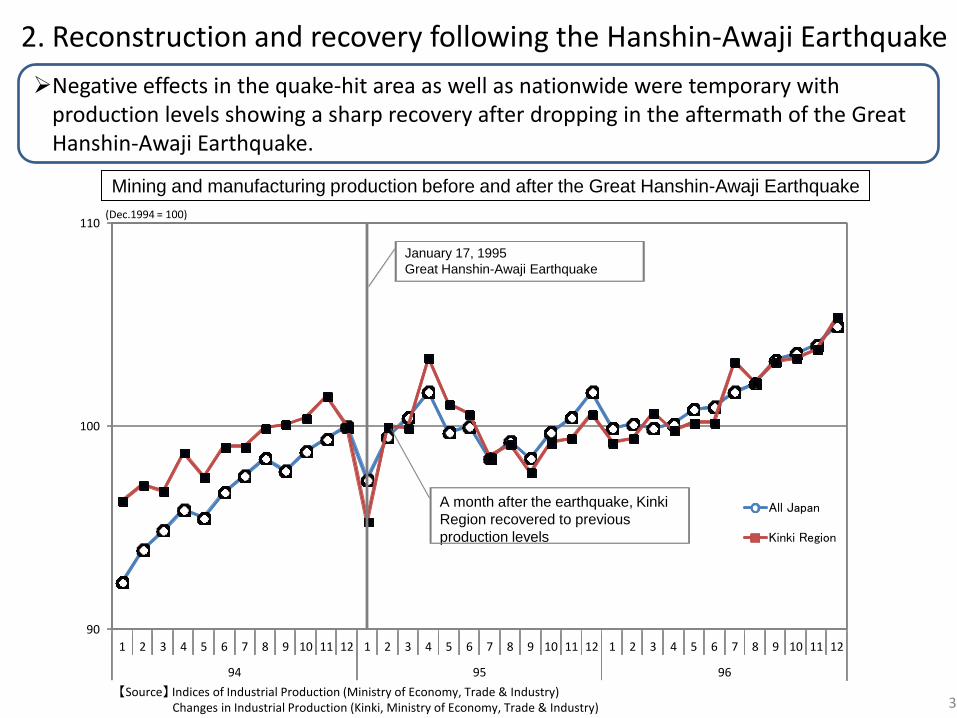
Negative effects in the quake-hit area as well as nationwide were temporary with production levels showing a sharp recovery after dropping in the aftermath of the Great Hanshin-Awaji Earthquake.
All Japan
Kinki Region
Great Hanshin-Awaji Earthquake
A month after the earth quake, Kinki Region recovered to the previous production level
90
100
110
1 2 3 4 5 6 7 8 9 10 11 12 1 2 3 4 5 6 7 8 9 10 11 12 1 2 3 4 5 6 7 8 9 10 11 12
94 95 96
All Japan
Kinki Region
Mining and manufacturing production before and after the Great Hanshin-Awaji Earthquake
January 17, 1995
Great Hanshin-Awaji Earthquake
(Dec.1994 = 100)
A month after the earthquake, Kinki
Region recovered to previous
production levels
【Source】 Indices of Industrial Production (Ministry of Economy, Trade & Industry)Changes in Industrial Production (Kinki, Ministry of Economy, Trade & Industry)
Tohoku Expressway
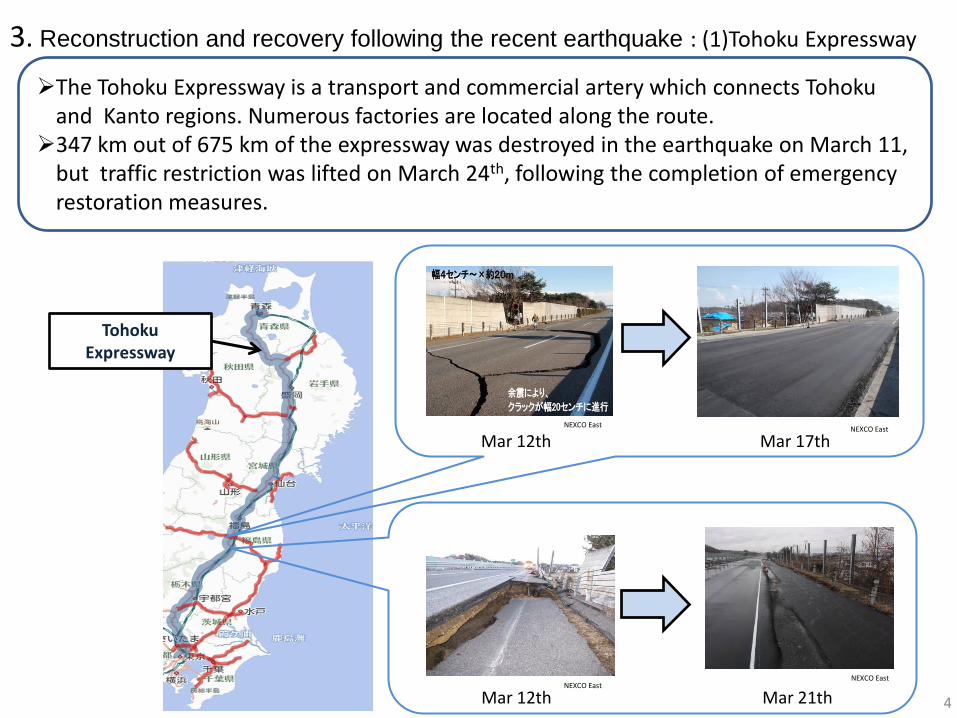
3. Reconstruction and recovery following the recent earthquake : (1)Tohoku Expressway
4
The Tohoku Expressway is a transport and commercial artery which connects Tohoku and Kanto regions. Numerous factories are located along the route.347 km out of 675 km of the expressway was destroyed in the earthquake on March 11,
but traffic restriction was lifted on March 24th, following the completion of emergency restoration measures.
Mar 12th Mar 21th
Mar 12th Mar 17thNEXCO East
NEXCO East
NEXCO EastNEXCO East
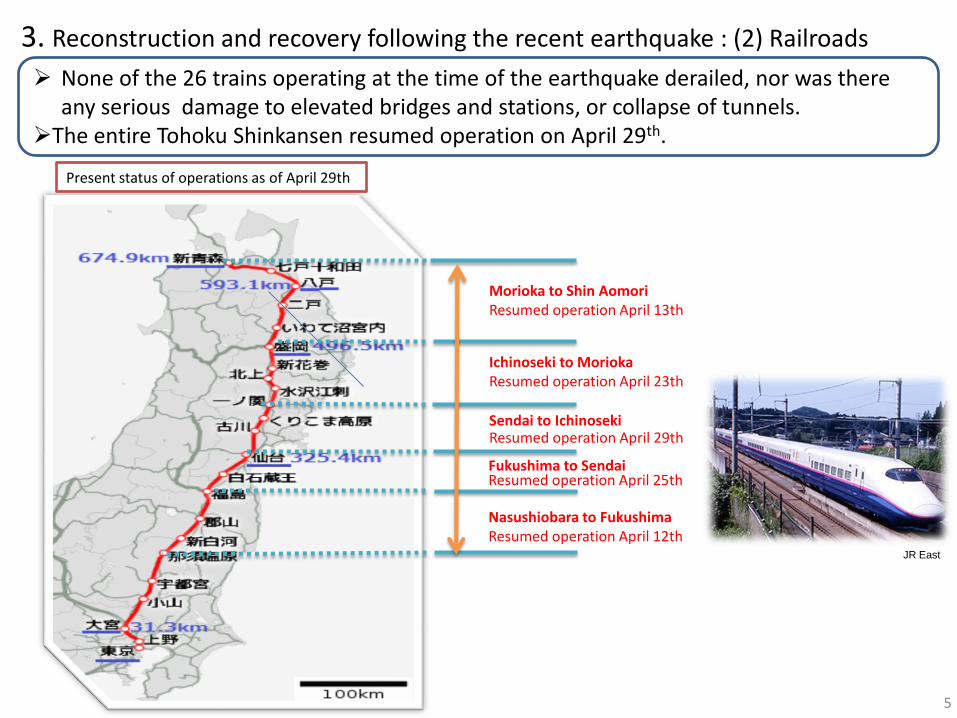
Present status of operations as of April 29th
3. Reconstruction and recovery following the recent earthquake : (2) Railroads
Fukushima to SendaiResumed operation April 25th
Nasushiobara to FukushimaResumed operation April 12th
Sendai to IchinosekiResumed operation April 29th
Ichinoseki to MoriokaResumed operation April 23th
Morioka to Shin AomoriResumed operation April 13th
5
None of the 26 trains operating at the time of the earthquake derailed, nor was there any serious damage to elevated bridges and stations, or collapse of tunnels.
The entire Tohoku Shinkansen resumed operation on April 29th.
JR East
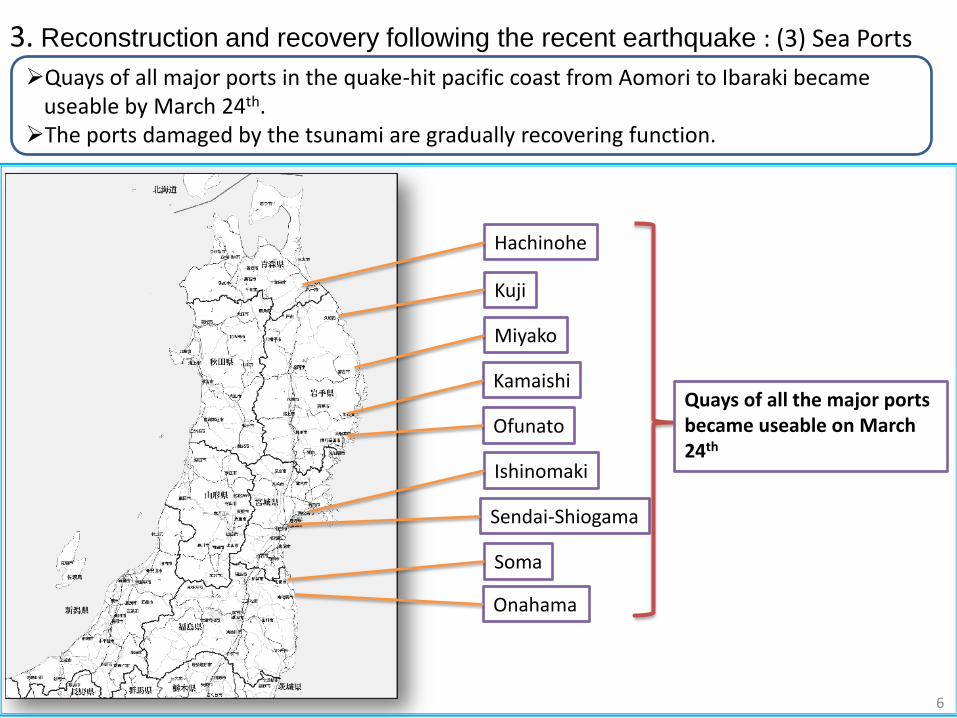
3. Reconstruction and recovery following the recent earthquake : (3) Sea Ports
6
Hachinohe
Kuji
Miyako
Kamaishi
Ofunato
Ishinomaki
Sendai-Shiogama
Soma
Onahama
Quays of all the major ports became useable on March 24th
Quays of all major ports in the quake-hit pacific coast from Aomori to Ibaraki became useable by March 24th.The ports damaged by the tsunami are gradually recovering function.
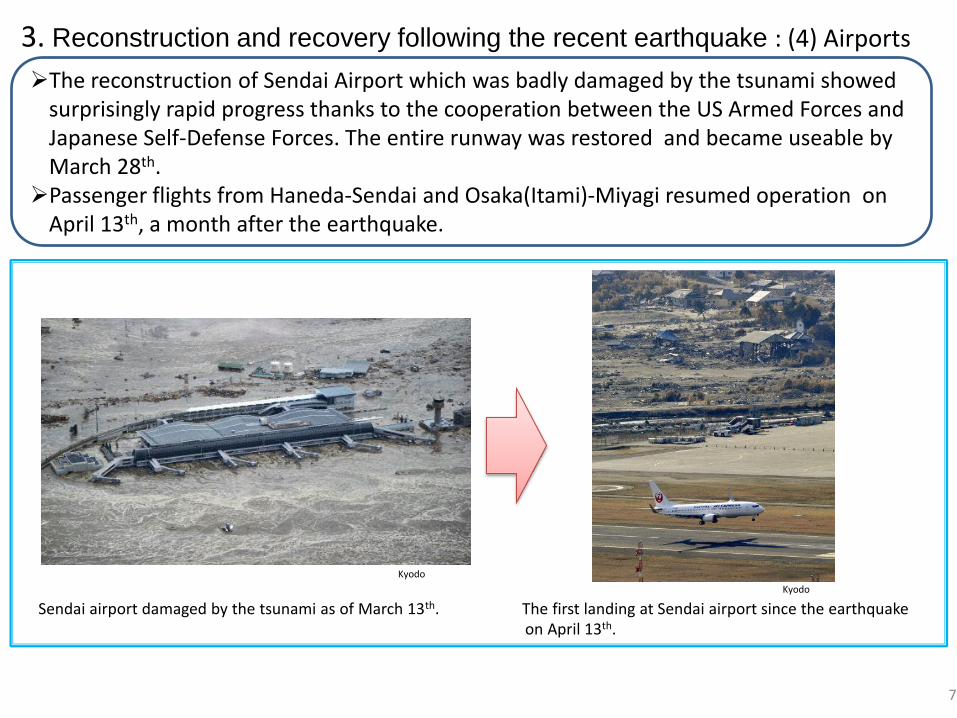
3. Reconstruction and recovery following the recent earthquake : (4) Airports
Sendai airport damaged by the tsunami as of March 13th. The first landing at Sendai airport since the earthquakeon April 13th.
7
Kyodo
The reconstruction of Sendai Airport which was badly damaged by the tsunami showed surprisingly rapid progress thanks to the cooperation between the US Armed Forces and Japanese Self-Defense Forces. The entire runway was restored and became useable by March 28th.Passenger flights from Haneda-Sendai and Osaka(Itami)-Miyagi resumed operation on
April 13th, a month after the earthquake.
Kyodo
30000
35000
40000
45000
50000
55000
60000
65000
4. Electricity supply/demand up to this summer
Mar 14th -20th
Mar 21th -27th
Mar 28th -Apr 3th
Apr 4th -10th
Apr 11th -17th
Apr 18th -
5
4
1
0 0 0
(Number)
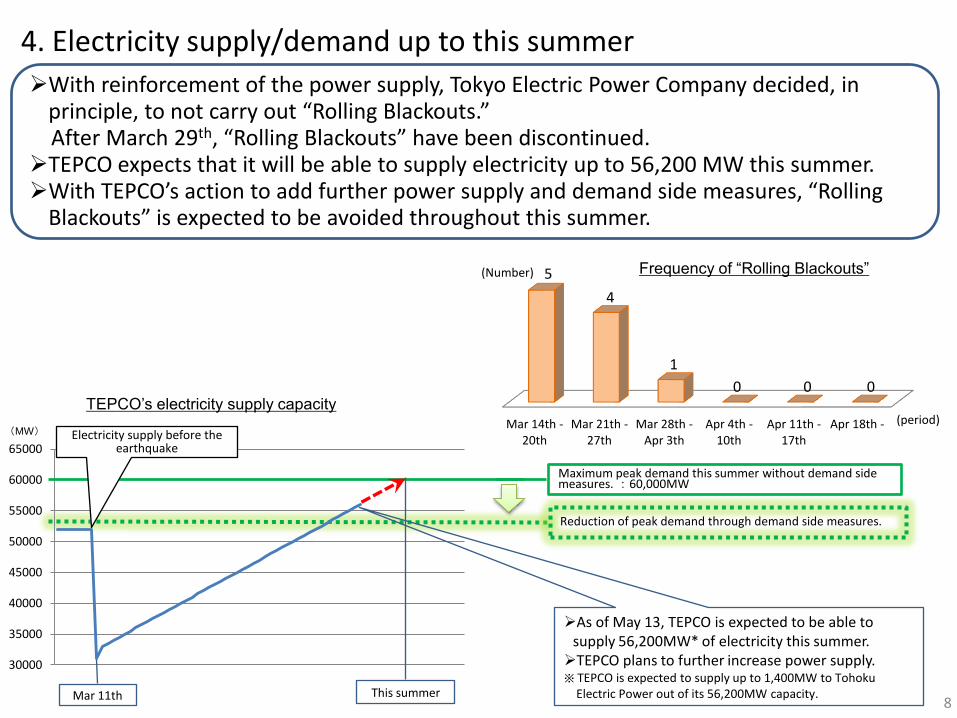
With reinforcement of the power supply, Tokyo Electric Power Company decided, in principle, to not carry out “Rolling Blackouts.” After March 29th, “Rolling Blackouts” have been discontinued.TEPCO expects that it will be able to supply electricity up to 56,200 MW this summer.With TEPCO’s action to add further power supply and demand side measures, “Rolling
Blackouts” is expected to be avoided throughout this summer.
TEPCO’s electricity supply capacity
Frequency of “Rolling Blackouts”
(MW)
Mar 11th
As of May 13, TEPCO is expected to be able to supply 56,200MW* of electricity this summer. TEPCO plans to further increase power supply.※ TEPCO is expected to supply up to 1,400MW to Tohoku
Electric Power out of its 56,200MW capacity.This summer
Maximum peak demand this summer without demand side measures. : 60,000MW
(period)
8
Electricity supply before the earthquake
Reduction of peak demand through demand side measures.
(Reference) The ratio of the number of establishments located in the municipalities in 7 prefectures (Aomori, Iwate, Miyagi, Fukushima, Tochigi, and Chiba) covered by the Disaster Relief Act in the total number of the manufacturing establishments all over the country, is about 7%. (The figure was calculated based on Census of Manufactures 2008, as of March 27th)
64%
11%
4%7%
3%
26%
3%7%
67%
9% 9%
2%
20%
4%9%
58%
17%13%
4% 4%
38%
4%
Finished
restoration
Within 1 month 1 month later 2 months later 3 months later By summer
(1 -3 months
later)
4-6 months
later
6 months
- 1 year
More than a
year
Not knowing
Whole manufacturing(70) Material Industry(46) Processing Industry(24)
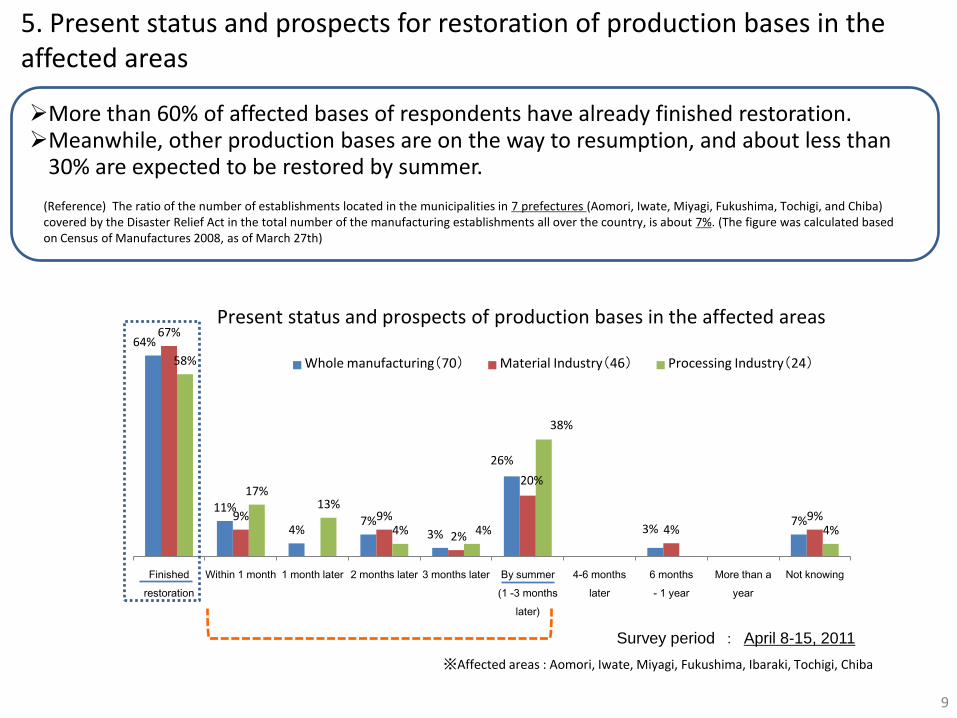
Present status and prospects of production bases in the affected areas
※Affected areas : Aomori, Iwate, Miyagi, Fukushima, Ibaraki, Tochigi, Chiba
5. Present status and prospects for restoration of production bases in the affected areas
9
More than 60% of affected bases of respondents have already finished restoration.Meanwhile, other production bases are on the way to resumption, and about less than
30% are expected to be restored by summer.
Survey period : April 8-15, 2011
Kashima
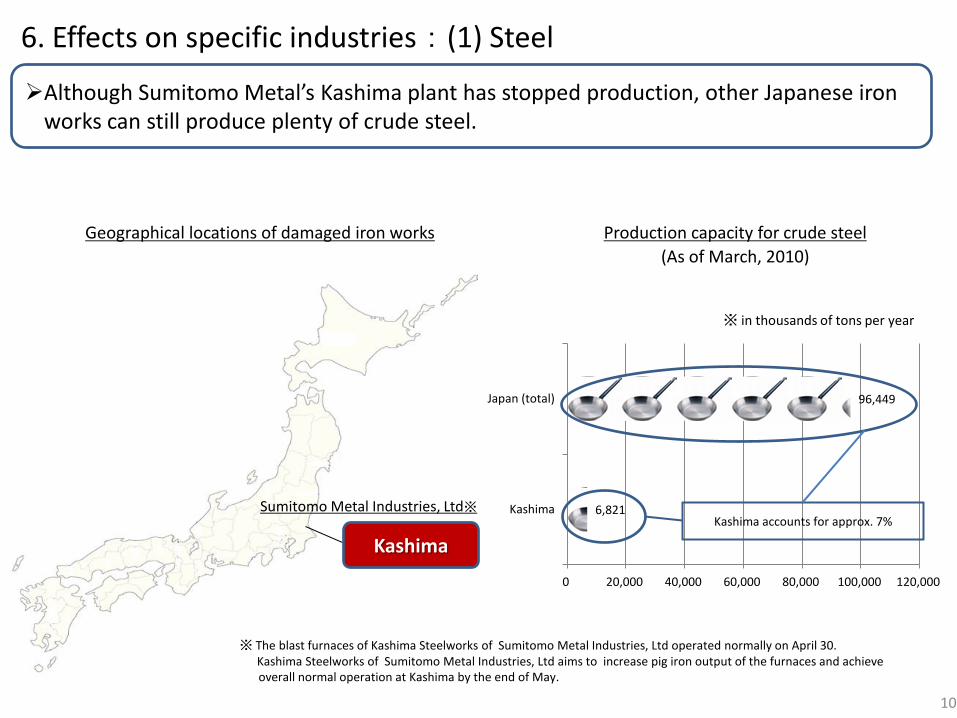
Production capacity for crude steel
(As of March, 2010)
※ in thousands of tons per year
Geographical locations of damaged iron works
Sumitomo Metal Industries, Ltd※
6. Effects on specific industries : (1) Steel
10
Although Sumitomo Metal’s Kashima plant has stopped production, other Japanese iron works can still produce plenty of crude steel.
6,821
96,449
0 20,000 40,000 60,000 80,000 100,000 120,000
Kashima
Japan (total)
Kashima accounts for approx. 7%
※ The blast furnaces of Kashima Steelworks of Sumitomo Metal Industries, Ltd operated normally on April 30. Kashima Steelworks of Sumitomo Metal Industries, Ltd aims to increase pig iron output of the furnaces and achieve overall normal operation at Kashima by the end of May.
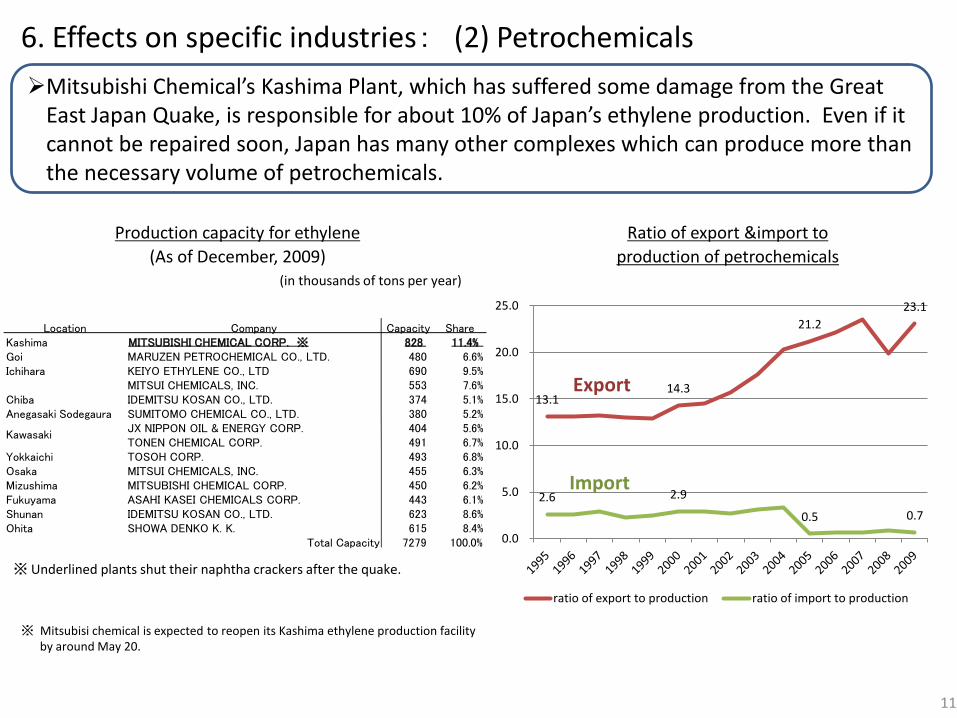
Production capacity for ethylene
(As of December, 2009)(in thousands of tons per year)
※ Underlined plants shut their naphtha crackers after the quake.
Ratio of export &import to
production of petrochemicals
6. Effects on specific industries: (2) Petrochemicals
11
13.1 14.3
21.2
23.1
2.6 2.9
0.5 0.7
0.0
5.0
10.0
15.0
20.0
25.0
ratio of export to production ratio of import to production
Export
Import
Mitsubishi Chemical’s Kashima Plant, which has suffered some damage from the Great East Japan Quake, is responsible for about 10% of Japan’s ethylene production. Even if it cannot be repaired soon, Japan has many other complexes which can produce more than the necessary volume of petrochemicals.
※ Mitsubisi chemical is expected to reopen its Kashima ethylene production facility by around May 20.
Location Company Capacity ShareKashima MITSUBISHI CHEMICAL CORP. ※ 828 11.4%Goi MARUZEN PETROCHEMICAL CO., LTD. 480 6.6%Ichihara KEIYO ETHYLENE CO., LTD 690 9.5%
MITSUI CHEMICALS, INC. 553 7.6%Chiba IDEMITSU KOSAN CO., LTD. 374 5.1%Anegasaki Sodegaura SUMITOMO CHEMICAL CO., LTD. 380 5.2%
JX NIPPON OIL & ENERGY CORP. 404 5.6%TONEN CHEMICAL CORP. 491 6.7%
Yokkaichi TOSOH CORP. 493 6.8%Osaka MITSUI CHEMICALS, INC. 455 6.3%Mizushima MITSUBISHI CHEMICAL CORP. 450 6.2%Fukuyama ASAHI KASEI CHEMICALS CORP. 443 6.1%Shunan IDEMITSU KOSAN CO., LTD. 623 8.6%Ohita SHOWA DENKO K. K. 615 8.4%
Total Capacity 7279 100.0%
Kawasaki
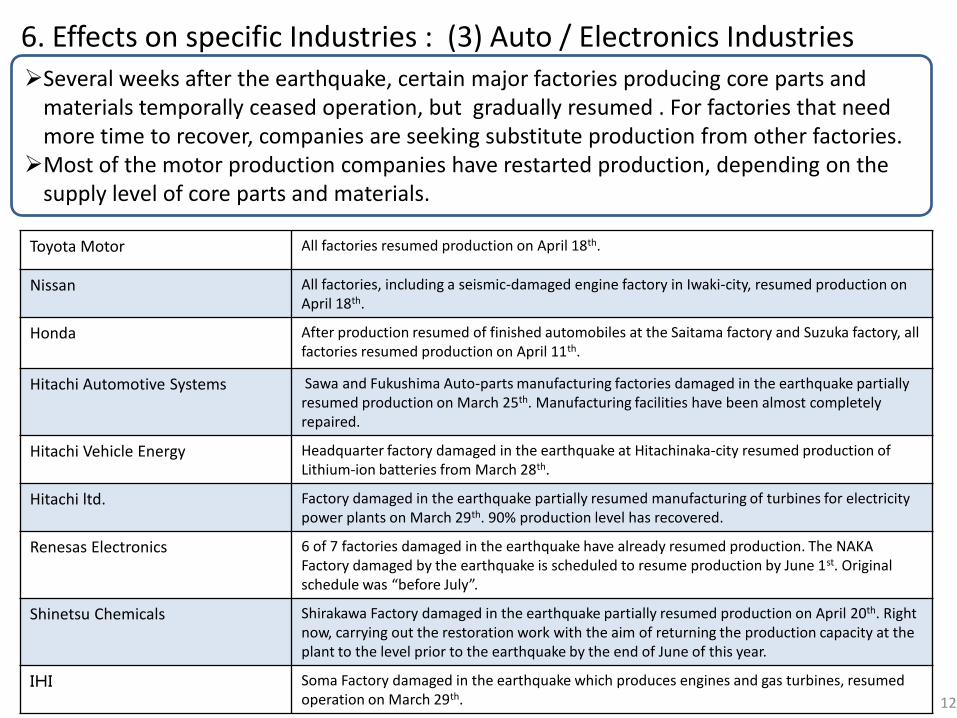
Toyota Motor All factories resumed production on April 18th.
Nissan All factories, including a seismic-damaged engine factory in Iwaki-city, resumed production on April 18th.
Honda After production resumed of finished automobiles at the Saitama factory and Suzuka factory, all factories resumed production on April 11th.
Hitachi Automotive Systems Sawa and Fukushima Auto-parts manufacturing factories damaged in the earthquake partially resumed production on March 25th. Manufacturing facilities have been almost completely repaired.
Hitachi Vehicle Energy Headquarter factory damaged in the earthquake at Hitachinaka-city resumed production of Lithium-ion batteries from March 28th.
Hitachi ltd. Factory damaged in the earthquake partially resumed manufacturing of turbines for electricity power plants on March 29th. 90% production level has recovered.
Renesas Electronics 6 of 7 factories damaged in the earthquake have already resumed production. The NAKA Factory damaged by the earthquake is scheduled to resume production by June 1st. Original schedule was “before July”.
Shinetsu Chemicals Shirakawa Factory damaged in the earthquake partially resumed production on April 20th. Right now, carrying out the restoration work with the aim of returning the production capacity at the plant to the level prior to the earthquake by the end of June of this year.
IHI Soma Factory damaged in the earthquake which produces engines and gas turbines, resumed operation on March 29th.
6. Effects on specific Industries : (3) Auto / Electronics Industries
12
Several weeks after the earthquake, certain major factories producing core parts and materials temporally ceased operation, but gradually resumed . For factories that need more time to recover, companies are seeking substitute production from other factories. Most of the motor production companies have restarted production, depending on the
supply level of core parts and materials.
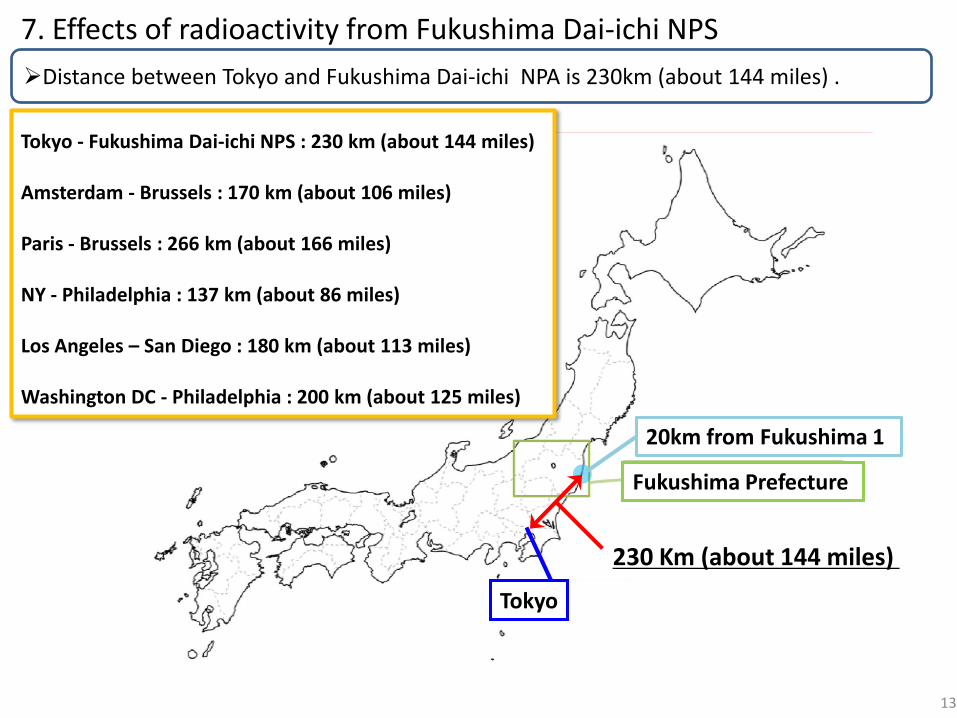
7. Effects of radioactivity from Fukushima Dai-ichi NPS
Tokyo
Fukushima Prefecture
230 Km (about 144 miles)
20km from Fukushima 1
Tokyo - Fukushima Dai-ichi NPS : 230 km (about 144 miles)
Amsterdam - Brussels : 170 km (about 106 miles)
Paris - Brussels : 266 km (about 166 miles)
NY - Philadelphia : 137 km (about 86 miles)
Los Angeles – San Diego : 180 km (about 113 miles)
Washington DC - Philadelphia : 200 km (about 125 miles)
13
Distance between Tokyo and Fukushima Dai-ichi NPA is 230km (about 144 miles) .
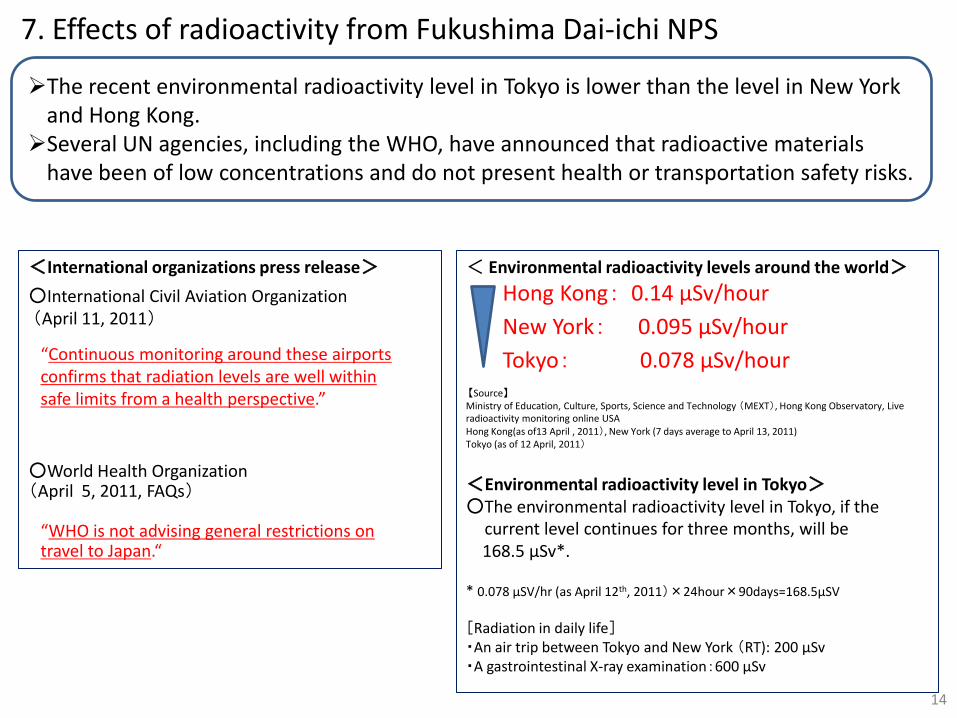
< Environmental radioactivity levels around the world>
Hong Kong: 0.14 μSv/hour
New York: 0.095 μSv/hour
Tokyo: 0.078 μSv/hour【Source】Ministry of Education, Culture, Sports, Science and Technology (MEXT), Hong Kong Observatory, Live radioactivity monitoring online USAHong Kong(as of13 April , 2011), New York (7 days average to April 13, 2011) Tokyo (as of 12 April, 2011)
<Environmental radioactivity level in Tokyo>○The environmental radioactivity level in Tokyo, if the
current level continues for three months, will be168.5 μSv*.
* 0.078 μSV/hr (as April 12th, 2011)×24hour×90days=168.5μSV
[Radiation in daily life]・An air trip between Tokyo and New York (RT): 200 μSv・A gastrointestinal X-ray examination:600 μSv
14
<International organizations press release>
○International Civil Aviation Organization(April 11, 2011)
“Continuous monitoring around these airports confirms that radiation levels are well within safe limits from a health perspective.”
○World Health Organization(April 5, 2011, FAQs)
“WHO is not advising general restrictions on travel to Japan.“
7. Effects of radioactivity from Fukushima Dai-ichi NPS
The recent environmental radioactivity level in Tokyo is lower than the level in New York and Hong Kong. Several UN agencies, including the WHO, have announced that radioactive materials
have been of low concentrations and do not present health or transportation safety risks.
15
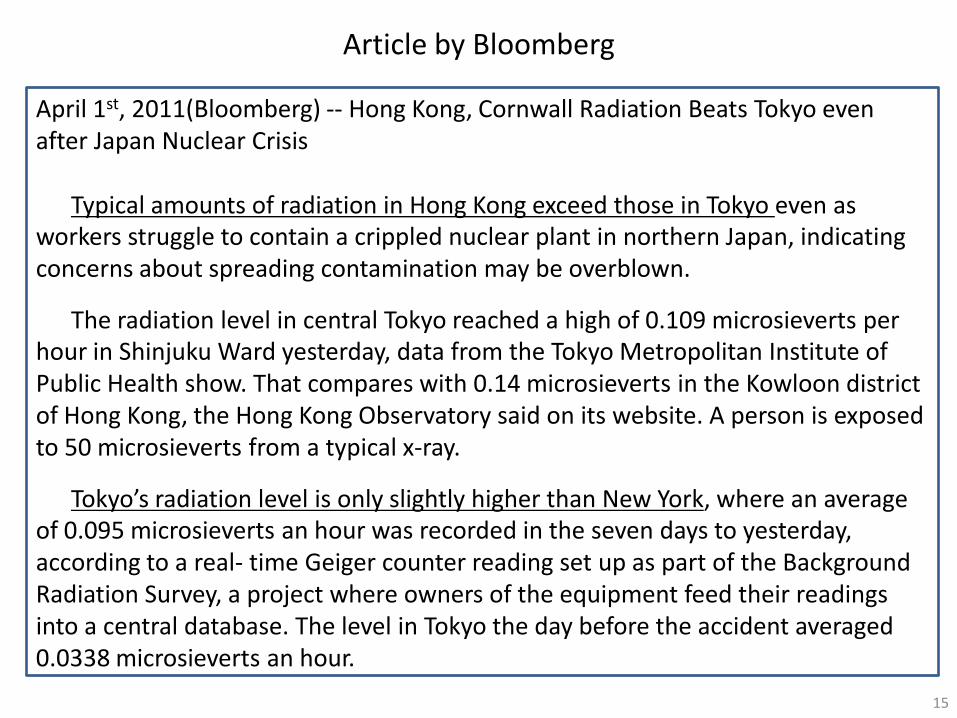
April 1st, 2011(Bloomberg) -- Hong Kong, Cornwall Radiation Beats Tokyo even after Japan Nuclear Crisis
Typical amounts of radiation in Hong Kong exceed those in Tokyo even as workers struggle to contain a crippled nuclear plant in northern Japan, indicating concerns about spreading contamination may be overblown.
The radiation level in central Tokyo reached a high of 0.109 microsieverts per hour in Shinjuku Ward yesterday, data from the Tokyo Metropolitan Institute of Public Health show. That compares with 0.14 microsieverts in the Kowloon district of Hong Kong, the Hong Kong Observatory said on its website. A person is exposed to 50 microsieverts from a typical x-ray.
Tokyo’s radiation level is only slightly higher than New York, where an average of 0.095 microsieverts an hour was recorded in the seven days to yesterday, according to a real- time Geiger counter reading set up as part of the Background Radiation Survey, a project where owners of the equipment feed their readings into a central database. The level in Tokyo the day before the accident averaged 0.0338 microsieverts an hour.
Article by Bloomberg
8. Macroeconomic impact : (1) Comparison with the “Lehman Shock”
16
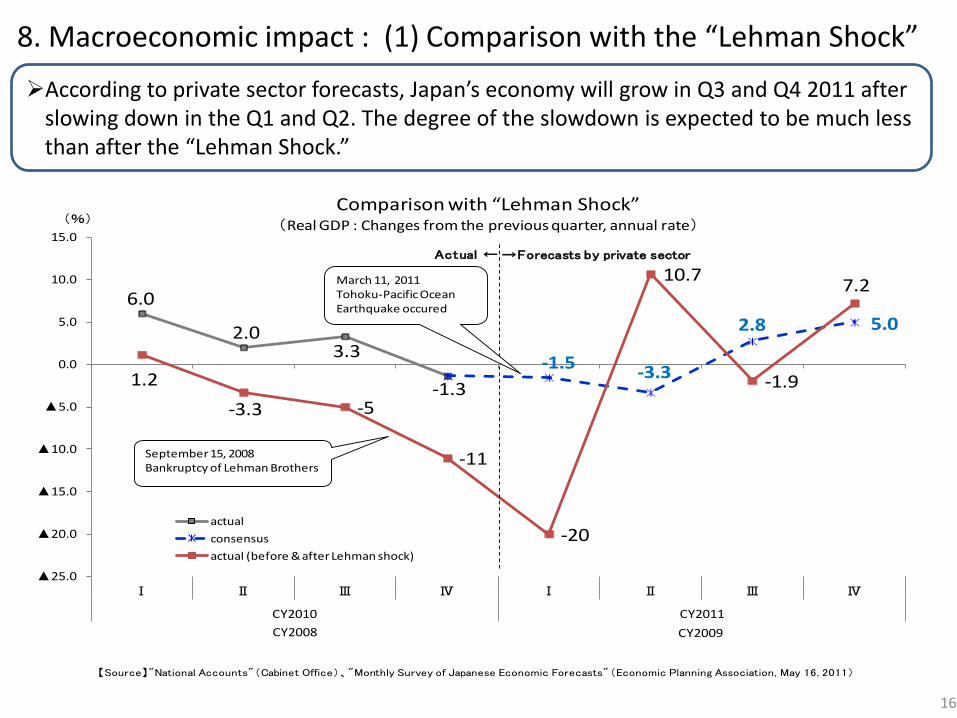
According to private sector forecasts, Japan’s economy will grow in Q3 and Q4 2011 after slowing down in the Q1 and Q2. The degree of the slowdown is expected to be much less than after the “Lehman Shock.”
6.0
2.03.3
-1.3
-1.5-3.3
2.8 5.0
1.2
-3.3 -5
-11
-20
10.7
-1.9
7.2
▲25.0
▲20.0
▲15.0
▲10.0
▲5.0
0.0
5.0
10.0
15.0
Ⅰ Ⅱ Ⅲ Ⅳ Ⅰ Ⅱ Ⅲ Ⅳ
CY2010 CY2011
(%)Comparison with “Lehman Shock”
(Real GDP : Changes from the previous quarter, annual rate)
actual
consensus
actual (before & after Lehman shock)
【Source】"National Accounts"(Cabinet Office)、"Monthly Survey of Japanese Economic Forecasts"(Economic Planning Association, May 16, 2011)
→Forecasts by private sectorActual ←
CY2008 CY2009
March 11, 2011Tohoku-Pacific Ocean Earthquake occured
September 15, 2008Bankruptcy of Lehman Brothers
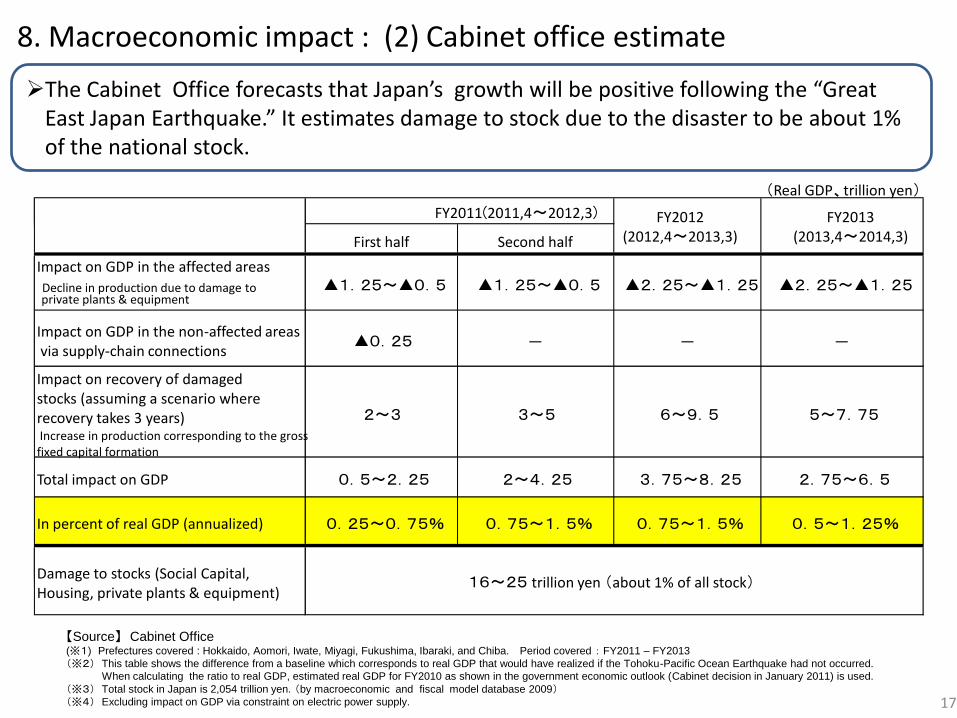
【Source】 Cabinet Office(※1) Prefectures covered : Hokkaido, Aomori, Iwate, Miyagi, Fukushima, Ibaraki, and Chiba. Period covered : FY2011 – FY2013
(※2) This table shows the difference from a baseline which corresponds to real GDP that would have realized if the Tohoku-Pacific Ocean Earthquake had not occurred.
When calculating the ratio to real GDP, estimated real GDP for FY2010 as shown in the government economic outlook (Cabinet decision in January 2011) is used.
(※3) Total stock in Japan is 2,054 trillion yen. (by macroeconomic and fiscal model database 2009)(※4) Excluding impact on GDP via constraint on electric power supply. 17
First half Second half
Impact on GDP in the affected areas
Decline in production due to damage toprivate plants & equipment
▲1.25~▲0.5 ▲1.25~▲0.5 ▲2.25~▲1.25 ▲2.25~▲1.25
Impact on GDP in the non-affected areasvia supply-chain connections
▲0.25 ― ― ―
Impact on recovery of damagedstocks (assuming a scenario whererecovery takes 3 years)Increase in production corresponding to the grossfixed capital formation
2~3 3~5 6~9.5 5~7.75
Total impact on GDP 0.5~2.25 2~4.25 3.75~8.25 2.75~6.5
In percent of real GDP (annualized) 0.25~0.75% 0.75~1.5% 0.75~1.5% 0.5~1.25%
Damage to stocks (Social Capital,Housing, private plants & equipment)
16~25 trillion yen (about 1% of all stock)
(Real GDP、trillion yen)
FY2011(2011,4~2012,3) FY2012(2012,4~2013,3)
FY2013(2013,4~2014,3)
8. Macroeconomic impact : (2) Cabinet office estimate
The Cabinet Office forecasts that Japan’s growth will be positive following the “Great East Japan Earthquake.” It estimates damage to stock due to the disaster to be about 1% of the national stock.
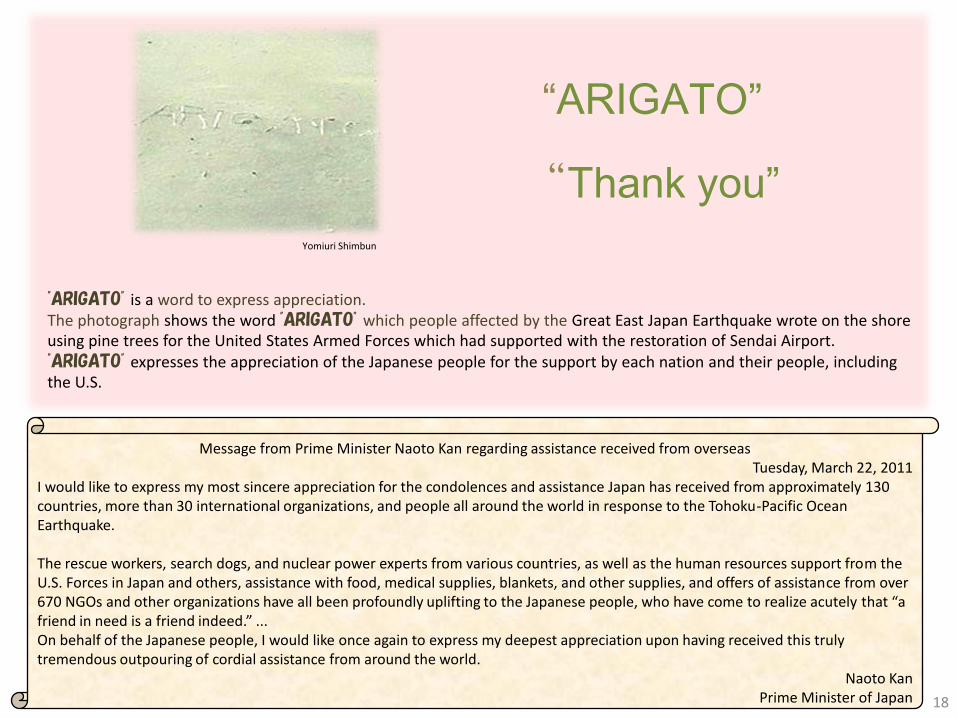
"ARIGATO" is a word to express appreciation.The photograph shows the word "ARIGATO" which people affected by the Great East Japan Earthquake wrote on the shore using pine trees for the United States Armed Forces which had supported with the restoration of Sendai Airport."ARIGATO" expresses the appreciation of the Japanese people for the support by each nation and their people, including the U.S.
18
Yomiuri Shimbun
Message from Prime Minister Naoto Kan regarding assistance received from overseas Tuesday, March 22, 2011
I would like to express my most sincere appreciation for the condolences and assistance Japan has received from approximately 130 countries, more than 30 international organizations, and people all around the world in response to the Tohoku-Pacific Ocean Earthquake.
The rescue workers, search dogs, and nuclear power experts from various countries, as well as the human resources support from the U.S. Forces in Japan and others, assistance with food, medical supplies, blankets, and other supplies, and offers of assistance from over 670 NGOs and other organizations have all been profoundly uplifting to the Japanese people, who have come to realize acutely that “a friend in need is a friend indeed.” ...On behalf of the Japanese people, I would like once again to express my deepest appreciation upon having received this truly tremendous outpouring of cordial assistance from around the world.
Naoto KanPrime Minister of Japan
“ARIGATO”
“Thank you”


