Differences in wildfires among ecoregions and land managementagencies in the Sierra Nevada region, California, USA
JAY D. MILLER,1,� BRANDON M. COLLINS,2 JAMES A. LUTZ,3 SCOTT L. STEPHENS,4
JAN W. VAN WAGTENDONK,5 AND DONALD A. YASUDA6
1USDA Forest Service, Pacific Southwest Region, Fire and Aviation Management, McClellan, California 95652 USA2USDA Forest Service, Pacific Southwest Research Station, Davis, California 95618 USA3College of the Environment, University of Washington, Seattle, Washington 98195 USA
4Ecosystem Sciences Division, Department of Environmental Science, Policy, and Management,University of California, Berkeley, California 94720 USA
5U.S. Geological Survey, Western Ecological Research Center, Yosemite Field Station, El Portal, California 95318 USA6USDA Forest Service, Pacific Southwest Region, McClellan, California 95652 USA
Citation:Miller, J. D., B. M. Collins, J. A. Lutz, S. L. Stephens, J. W. van Wagtendonk, and D. A. Yasuda. 2012. Differences
in wildfires among ecoregions and land management agencies in the Sierra Nevada region, California, USA. Ecosphere
3(9):80. http://dx.doi.org/10.1890/ES12-00158.1
Abstract. Recent research has indicated that in most of the western United States, fire size is increasing,
large fires are becoming more frequent, and in at least some locations percentage of high-severity fire is
also increasing. These changes in the contemporary fire regime are largely attributed to both changing
climate and land management practices, including suppression of fires and past timber harvesting, over the
last century. Fire management, including suppression and using wildfire for resource benefits, varies
among federal land management agencies, yet no published studies have directly compared fire statistics
between federal land management agencies in our study area. The primary response to wildfire on Forest
Service areas is immediate suppression, while the National Park Service is more likely to use wildfire for
resource benefits. We use fire perimeters and satellite-derived estimates of fire severity to compare fire
statistics for wildfires (fire size, percentage of high-severity fire and high-severity patch size) among
ecoregions, forest types, and land management agencies 1984–2009 in the Sierra Nevada, Southern
Cascades, and Modoc Plateau of California, USA. High-severity patch size and percentage of high-severity
fire, regardless of forest type, were less (P , 0.05) in Yosemite National Park than on Forest Service lands.
Yosemite fires were smaller on average than fires on Forest Service lands on the east side of the Sierra
Nevada, southern Cascades and Modoc Plateau. Depending upon whether fires that crossed boundaries
were included or not, mean size of Yosemite fires was either smaller or not significantly different from
Forest Service fires on the west side of the Sierra Nevada. Even under current conditions, it appears that
fire management practices that emulate those used in Yosemite could moderate effects of past land
management, restoring and helping to maintain old forest conditions within the greater Sierra Nevada
region, including the southern Cascades and Modoc Plateau.
Key words: fire effects; fire severity; fire suppression policy; Forest Service; National Park Service; RdNBR; Sierra
Nevada, USA; wildfire.
Received 1 June 2012; revised 14 August 2012; accepted 24 August 2012; published 24 September 2012. Corresponding
Editor: J. Thompson.
Copyright: � 2012 Miller et al. This is an open-access article distributed under the terms of the Creative Commons
Attribution License, which permits restricted use, distribution, and reproduction in any medium, provided the original
author and sources are credited.
� E-mail: [email protected]
v www.esajournals.org 1 September 2012 v Volume 3(9) v Article 80

INTRODUCTION
In dry forest types throughout the westernUnited States fire is the dominant process drivingacute change in forest structure and speciescomposition (Pyne et al. 1996). However, not allfire is equal; fire-caused change, or fire severity,can vary considerably. Species associated withdry forest types evolved largely with low tomoderate-severity fire, and in those forest typespost-fire landscapes are characterized by survivalof fire-tolerant, large-diameter individuals (Agee1993, Stephens et al. 2008, Larson and Churchill2012). Because large-diameter trees provide aseed source and ameliorate environmental stress,these forests can withstand or recover rapidlyfollowing low to moderate-severity fire. Further-more, dry forest tree species generally havelimited capacity to recover naturally followingextensive high-severity fire (Allen et al. 2002,Savage and Mast 2005).
Increases in tree density, especially of fireintolerant species, and decreases in the area ofpatchy forest cover resulting from past andcurrent land management practices (e.g., wide-spread grazing, extensive timber harvesting, firesuppression) have rendered large tracts of dryforests susceptible to extensive and uncharacter-istic high-severity fire (Fule et al. 2004, Hessburget al. 2005, Naficy et al. 2010, Collins et al. 2011).This increased susceptibility, combined with thelimited capacity to recover naturally from high-severity fire, has created great concern for federalland management agencies responsible for man-aging areas with these forest types (HFRA 2003,USDA 2011).
Developments in acquiring and analyzingspatial data to capture not only fire extents, butfire effects as well, have led to robust character-izations of contemporary fire patterns (e.g.,Morgan et al. 2001, Key and Benson 2006b, Millerand Thode 2007). These characterizations haveallowed for a number of analyses investigatingfactors influencing fire severity both withinindividual fires (Finney et al. 2005, Collins et al.2007, Roman-Cuesta et al. 2009, Collins andStephens 2010, Prichard et al. 2010) and amongnumerous fires within particular regions (Holdenet al. 2007, Miller et al. 2009b, Miller et al. 2012,van Wagtendonk et al. 2012, Kolden et al. Inpress). Additionally, fire extent and severity data
have been used to compare fire patterns amongregions (Dillon et al. 2011) and forest types(Miller et al. 2009b, Miller et al. 2012). Suchcomparisons are useful for identifying potentialdifferences in the processes driving fire (e.g.,climate, forest structure, topography). To datehowever, no previous studies have examinedwhether differences in land management prac-tices between land management agencies withina given region could be contributing to differ-ences in the fire regime (but see van Wagtendonkand Lutz [2007] for a comparison of fires used forresource benefit and prescribed fires with wild-fires).
Characterizing contemporary fire patterns (fireextent and effects) often involves an assessmentof whether or not current patterns are within thehistorical or natural range of variability (Landreset al. 1999, Schoennagel et al. 2004). However,issues associated with those types of assessmentscan lead to considerable uncertainty: (1) datafrom historical forest and fire reconstructionstudies can never achieve the level of detail orspatial coverage that contemporary characteriza-tions can, (2) historical reconstructions areinherently incomplete because they are basedon extant data (i.e., some data are lost from fireand decomposition; Heinselman 1973), and (3)due to a fairly ubiquitous and long-establishedpolicy of fire exclusion, there are very fewcontemporary reference sites with historic andintact fire regimes (Stephens et al. 2008, Scholland Taylor 2010), and the few that there are havebeen impacted by early fire suppression efforts(see Rollins et al. 2002, Collins and Stephens2007, Holden et al. 2007).
Because of these challenges, there is no perfectmethod for assessing current fire effects onforests relative to pre-settlement forest–fire dy-namics. However, some comparisons can pro-vide insight into the potential alteration ofcontemporary fire patterns. One such compari-son is between lands managed by the ForestService (FS) and National Park Service (NPS) inthe Sierra Nevada. Comparing fire patternsbetween the two agencies within the same regionallows for partial identification of past andcurrent management impacts on contemporaryfire patterns. Although both NPS and FS policieshave allowed the use of wildland fire for resourcebenefit since the late 1960s and early 1970s,
v www.esajournals.org 2 September 2012 v Volume 3(9) v Article 80
MILLER ET AL.
respectively, implementation has varied betweenthe two agencies (van Wagtendonk 2007). Whileimmediate suppression is the most commonresponse on all FS lands in our study area,managing fire for resource benefit has occurredto some extent since 1999, primarily in wilder-ness areas. In 2009, the US Department ofAgriculture and the US Department of theInterior issued updated guidance for implement-ing federal wildland fire policy (USDA-USDI2009). The guidance provides for the use ofwildland fire for resource benefits specified inland or resource management plans. Nationalparks in the Sierra Nevada, which were subjectedto fire exclusion policies similar to FS lands priorto the early 1970s, use both prescribed fire andmanaged wildfire on most NPS lands. Inaddition to the increased use of wildfire forresource benefit starting in the 1970s, NPS landshave not experienced extensive timber harvestingor recent livestock grazing since the current parkboundaries were established (Collins et al. 2011),making NPS lands at least partially capable ofserving as contemporary reference forests.
Our objectives with this study were to: (1)characterize fire patterns (effects, extents) for allfires . 80 ha that occurred between 1984 and2009 in the Sierra Nevada, southern Cascadesand Modoc Plateau; (2) summarize and comparefire patterns among ecoregions and land man-agement agencies, particularly FS and NPS lands;and (3) summarize and compare fire patterns byforest type within ecoregions, wilderness vs. non-wilderness, and agencies. Specifically, we wantedto examine the similarities or differences in high-severity fire among ecoregions, forest types, andfire management strategies.
METHODS
Study areaThe study area, which encompasses the extent
of the Sierra Nevada Forest Plan Amendment(SNFPA), is divided by three ecoregions asdefined by Bailey et al. (1994): the Sierra Nevadaproper, portions of the Modoc Plateau includingthe Warner Mountains, and the eastern portion ofthe southern Cascades (Bailey et al. 1994, Milesand Goudey 1997, USDA 2004). The ecoregionclassification system developed by Bailey et al.(1994), based upon climate, elevation and land-
form, has been used as a basis for examiningdifferences in fire regimes (e.g., Sugihara andBarbour 2006). The fire regime concept wasdeveloped to provide a framework for investi-gating differences in the way fire influencesecosystems (Heinselman 1981). Because climateand the distribution of forest types vary through-out our study area, we use the fire regimeconcept and Bailey’s ecoregions to define regionswithin our study area and examine differences infire statistics.
Climate throughout the study area is Mediter-ranean, characterized by warm, dry summersand cool, wet winters with almost all precipita-tion falling between October and April. Depend-ing upon elevation, much of the precipitation isin the form of snow. Variation in precipitationand vegetation is primarily due to elevation andrain shadow effects. The crest of the range, whichgenerally runs north-to-south, divides the SierraNevada ecoregion into two distinct precipitationsubregions usually denoted as the eastside andwestside (Major 1988). Precipitation on the west-side of the Sierra Nevada varies from about 500mm in the foothills to over 2000 mm at the crestin the northern end of the ecoregion. The ModocPlateau and most of the eastern portion of thesouthern Cascades ecoregions have precipitationamounts similar to the eastside of the SierraNevada, generally less than 1000 mm, due to rainshadow effects from Mt. Shasta and Mt. Lassen(Major 1988, Minnich 2006, Skinner and Taylor2006).
Vegetation on the westside of the SierraNevada crest is dominated by ponderosa pine(Pinus ponderosa) at lower elevations; white fir(Abies concolor), incense-cedar (Calocedrus decur-rens), sugar pine (P. lambertiana), ponderosa pine,and Douglas-fir (Pseudotsuga menziesii ) at inter-mediate elevations; and Jeffrey pine (P. jeffreyi )and red fir (A. magnifica) at higher elevations.Eastside forests are characteristically more openthan westside forests. Pinyon pine (P. monophylla)is common at lower elevations on the eastside ofthe Sierra Nevada, especially south of LakeTahoe. Jeffrey and ponderosa pine dominatemid-elevations, transitioning to mixed white firand pine forests at higher elevations. Douglas-fir,most common on the westside, reaches itssouthern extent within Yosemite National Park(NP) and only occurs in small amounts on the
v www.esajournals.org 3 September 2012 v Volume 3(9) v Article 80
MILLER ET AL.
eastside (Lanner 1999, van Wagtendonk andFites-Kaufman 2006, Sawyer et al. 2008). Thecrest is higher in the southern portion of therange, reaching its maximum at Mt. Whitney, thehighest peak in the continental US. The westernslopes are therefore generally steeper in thesouthern portion of the range due to the higherelevation of the crest, leading to much shortertransitions between forest types.
Similar to the Sierra Nevada, in the southernCascades mixed conifer forests dominate mid-elevations west of the crest; and east of the crestJeffrey and ponderosa pine dominate. At higherelevations forests transition to mixed white fir,red fir and pine forests, but species dominancevaries widely, influenced by precipitation, topog-raphy, and substrate (Skinner and Taylor 2006).Further to the east, forests on the Modoc Plateauare dominated by ponderosa pine at lowerelevation and transition to mixed ponderosapine, Jeffrey pine and white fir as elevationincreases. At upper elevations white fir can occurin almost pure stands but also mixes withwestern white (P. monicola), ponderosa, Jeffrey,and Washoe (P. washoenis) pines. Red fir does notoccur within the ecoregion, and Douglas-fir andsugar pine only occur on the extreme westernedge (Riegel et al. 2006).
Conifer forests throughout the region histori-cally experienced low to moderate-severity fire,falling into either fire regime group I or III (Table1; Sugihara et al. 2006b, Hann et al. 2010). Yellowpine forests dominated by either ponderosa orJeffrey pine and mixed conifer forests historicallyexperienced low-severity fires with mean firereturn intervals of 11 to 16 years (fire regimegroup I; Perry et al. 2011). Red fir forestsexperienced low to moderate-severity fires withmean fire return intervals of 40 years (fire regimegroup III; van Wagtendonk and Fites-Kaufman2006, Stephens et al. 2007, Van de Water andSafford 2011).
Four national parks exist within the study area:Lassen, Yosemite, Sequoia and Kings Canyon.Yosemite, Sequoia and Kings Canyon NPs occuron the westside of the Sierra Nevada. Yosemite ismost centrally located north-to-south and Se-quoia and Kings Canyon are the most southernof the parks. Lassen is the most northern park,occurring in the Southern Cascades ecoregion.Although the adjacent Sequoia and Kings Can-
yon NPs have the longest history of allowingnaturally ignited fires to burn (van Wagtendonk2007), an extensive fire severity database, match-ing the one we have compiled for fires on FSlands (see Data: Fires and severity section below),has not yet been assembled for those parks. Inaddition, most of the area comprised by thosetwo parks falls above the red fir zone and is notforested. The forests that do occur in the twoparks occupy only a narrow band due torelatively steeper slopes west of the crest incomparison to the northern portion of the range.Lassen, the smallest of the parks, occupies thehigher elevations in the southern Cascadesecoregion and falls almost exclusively into thered fir zone. Lassen has had only a few large(.400 ha) wildfires in the last two decades, andextensive areas in most of those fires were aresult of firing operations, i.e., ignitions used tomanage the fires (C. Farris, personal communica-tion). Of all the parks, Yosemite is the mostcentrally located, and therefore best representsthe forest types within our study area. Also, thecurrent fire management plan for Yosemiteallows naturally ignited fires to burn underprescribed conditions over 83% of the park (vanWagtendonk 2007). As a result, Yosemite pro-vides the best, though perhaps not perfect,comparison of the cumulative effects of theprimarily suppression based management phi-losophy of the FS, and the primarily fire usesuppression policy of the NPS on forests in ourstudy area.
We defined four ecological/management re-gions: Cascade-Modoc, eastside Sierra Nevada(eastside), westside Sierra Nevada (westside) andYosemite National Park (Yosemite) (Fig. 1).Although the east and west sides of the SierraNevada are delineated in the same ecoregionsection by Bailey et al. (1994), we hypothesizedthat the distinctly different precipitation patternsresult in fires of different severity and size andshould be designated as separate regions in ourstudy. However, we could find no formalboundary defining east and west sides. Wetherefore used Bailey’s ecoregion subsectionsand annual precipitation to define the boundarybetween the eastside and westside. Overlaying aspatial model of annual precipitation on theecological subsections, we designated subsec-tions east of the Sierra Nevada crest with
v www.esajournals.org 4 September 2012 v Volume 3(9) v Article 80
MILLER ET AL.
generally less than 1000 mm annual precipitationas eastside (Daly et al. 1994, Miles and Goudey1997). We combined the southeastern Cascadesand Modoc Plateau into one region due to theirsimilarity in precipitation and vegetation.
DataFires and severity.—The Forest Service Pacific
Southwest Region maintains a database of vegeta-tion severity data for wildfires due to lightning andhuman ignitions that have occurred at leastpartially on FS lands in California since 1984(available online at http://www.fs.usda.gov/wps/portal/fsinternet/main/r5/landmanagement/gis).For our study area the database contains allwildfires larger than 80 ha between 1984 and 2009that at least partially occurred on the ten nationalForests in the Forest Service’s Pacific SouthwestRegion, and fires over 400 ha on the one nationalForest in the IntermountainRegion for a total of 280fires, eight of which overlap boundaries withYosemite NP. Moderate resolution (30 m) Landsatthematic mapper (TM) satellite images used todevelop these severity data came from a number ofsources including the Monitoring Trends in BurnSeverity (MTBS) program (http://www.mtbs.gov/)and Rapid Assessment of Vegetation Condition(RAVG) program (http://www.fs.fed.us/postfirevegcondition/index.shtml). Both MTBSand RAVG programs only map fires larger than400 ha. To capture smaller fires Landsat imageswere acquired andmethods identical to those usedby MTBS and RAVG were used to process theimages. To permit inter-fire comparisons of sever-ity, the severity data we usedwere developed fromthe relativized differenced normalize burn ratio(RdNBR) data, which compensates for different
pre-fire vegetation and surface conditions (Millerand Thode 2007). We categorized the RdNBR datainto four levels of severity based on calibrationsderivedofRdNBR to theplot-levelCompositeBurnIndex (CBI) severity measure (unchanged¼ 0–0.1,low ¼ 0.1–1.24, moderate ¼ 1.25–2.24, and high¼2.25–3.0; Key and Benson 2006a, Miller and Thode2007, Miller et al. 2009a). Based upon regressionanalysis, our high-severity threshold is approxi-mately equal to 95% change in canopy cover (r2¼0.56, P , 0.0001; Miller et al. 2009a). FS vegetationclassification standards specify that 10% pre-firetree canopy cover is required for an area to bemapped as forested (Brohman and Bryant 2005). Inforested areas, our high-severity category thereforegenerally describes a conversion of forest to a non-forested condition. For Yosemite, we augmentedthe severity data we had previously developed tomatch the size (.80 ha) and time period (1984–2009) of the FS data (Collins et al. 2009, Lutz et al.2009). The Yosemite fire severity database includesdata for management ignited fires and wildfiresthat were either lightning or human caused. Weeliminated all management ignited fires for thisstudy because those fires were ignited and burnedunder conditions that produce lower severityeffects than wildfires, leaving a total of 72 fires(van Wagtendonk and Lutz 2007). Forty-seven ofthe firesweremanaged for resourcebenefit for theirduration. Twenty fires were actively suppressedfrom the time of ignition, and five fires that startedout being managed for resource benefit weresuppressed when they exceeded their prescrip-tions. The Yosemite severity datawere processed tomatch the severity categories used for the fires onFS lands. All severity data were converted fromraster to polygons using standard geographicinformation system(GIS)procedures toconsolidateindividual pixels into homogeneous patches. Se-verity data on FS lands were constrained to thoseadministrated by the FS to eliminate effects fromprivate managed in-holdings.
Vegetation.—Most previous studies that haveexamined severity by forest type have used mapsbased upon existing vegetation (but see Holdenet al. [2007] and Dillon et al. [2011] who usedpotential vegetation type derived from environ-mental site potential). Because high-severity fireevents cause at least temporary vegetation typechange, using maps of current vegetation as apre-fire condition to analyze severity by vegeta-
Table 1. Fire regime groups (from Hann et al. 2010).
Fireregimegroup Description
I �35-year fire return interval, low and mixed severityII �35-year fire return interval, replacement severityIII 35–200-year fire return interval, low and mixed
severityIV 35–200-year fire return interval, replacement severityV .200-year fire return interval, any severity
Notes: Hann et al. defined mixed and replacement severityas corresponding to 25–75% mortality and greater than 75%mortality over an entire fire, respectively. In contrast, themoderate and high categories in this manuscript aredescriptive at the 30-m Landsat pixel level.
v www.esajournals.org 5 September 2012 v Volume 3(9) v Article 80
MILLER ET AL.
tion type leads to an analysis of potential type
conversion (e.g., conversion of forest to a non-
forested condition). But when characterizing fire
regime characteristics over broad scales it may
make more sense to stratify with map data that
describe the geographic distribution of vegeta-
tion type regardless of stand development (seral
stage) (Van de Water and Safford 2011). For
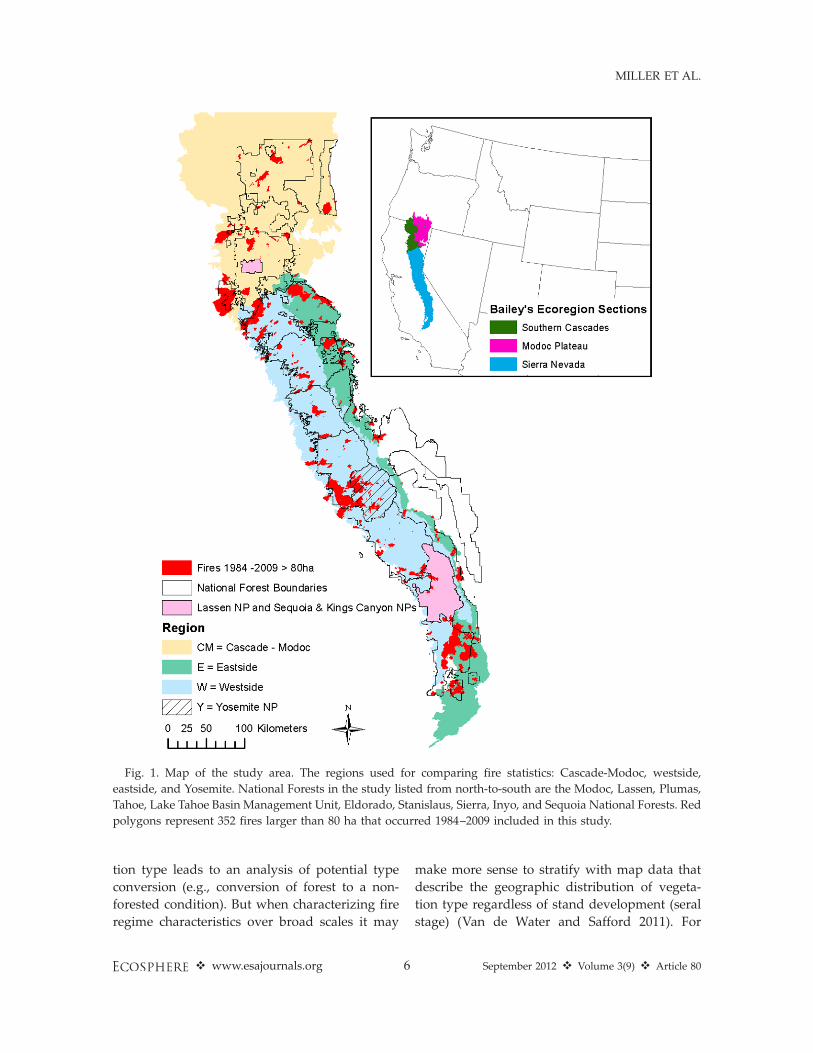
Fig. 1. Map of the study area. The regions used for comparing fire statistics: Cascade-Modoc, westside,
eastside, and Yosemite. National Forests in the study listed from north-to-south are the Modoc, Lassen, Plumas,
Tahoe, Lake Tahoe Basin Management Unit, Eldorado, Stanislaus, Sierra, Inyo, and Sequoia National Forests. Red
polygons represent 352 fires larger than 80 ha that occurred 1984–2009 included in this study.
v www.esajournals.org 6 September 2012 v Volume 3(9) v Article 80
MILLER ET AL.

example, a site that was able to support a matureforest (beyond stand initiation) prior to high-severity fire would always retain the same typelabel given that it could return to a forestedcondition provided that the fire return intervalwas of sufficient length, subsequent fire intensitywas low enough, seeds were available, andcompetition and herbivory allowed seedlings toestablish and grow back to mature trees (Oliverand Larson 1996).
For this study we used LANDFIRE-generatedBiophysical Settings (BpS) vegetation layer tostratify the fire severity data (data availableonline at www.landfire.gov). The BpS data areadvertised to provide a spatially explicit repre-sentation of the vegetation that may have beenpresent prior to Euro-American settlement (Roll-ins 2009). The data are based on the currentbiophysical environment (climate, soils and to-pography) and best estimate of the pre-Euro-American fire regime. BpS vegetation types arebased on Nature Serve’s Ecological Systemsclassification system, and are more broad indefinition and scale than National VegetationClassification System (NVCS) floristic units (alli-ances and associations) used by the FS’s Classifi-cation and Assessment with Landsat of VisibleEcological Groupings (CALVEG) vegetation clas-sification system (Comer et al. 2003, Keeler-Wolf2007, USDA 2008). Each BpS vegetation type islinked to state and transition models developedfrom published literature and expert opinion,which through a modeling process, resulted inestimated proportions of each successional stagethat should have occurred on the landscape, fromearly seral (stand initiation) through late-closed(old growth) (Rollins 2009).
Because of the broad scale of the BpS data, wedecided to perform an error analysis using forestinventory and analysis (FIA) intensification plotspreviously established for CALVEG accuracyassessment before determining which BpS foresttypes to include in our analysis. The intensifica-tion plots are based on a stratified randomsample of ecologically significant CALVEG veg-etation types within each bioregion. The FIAintensification plots that occurred only on FSmanaged lands were selected for use in the erroranalysis of BpS. Plots that fell within fires thatoccurred 1984–2009 were eliminated, leaving1190 plots for error analysis.
AnalysesPercentage of high-severity fire in wilderness vs.
non-wilderness by region.—To determine whetherpercentage of high-severity fire differed due towilderness designation, which can result indifferent fire management strategies, we strati-fied the high-severity data by wilderness bound-aries for FS lands. For Yosemite, we used the firemanagement unit boundaries that indicate whereall wildfires are either fully suppressed or, if theyare in prescription, are allowed to be managedfor resource benefit. For the sake of brevity,throughout the remainder of this manuscript weuse ‘‘wilderness designation’’ to mean wildernessvs. non-wilderness for FS lands, and suppressionvs. fire-use fire management units for Yosemite.Distribution analysis of the percent high-severitydata indicated they would best be fit by a gammafunction due to the number of fires with no orlow percentages of high severity. We thereforechose to use a Generalized Linear Mixed Model(GLMM) because this method does not requirethe dependent variable to be normally distribut-ed, but rather one of several probability distri-bution functions can be used to describe thedependent variable (Bolker et al. 2009). Regioncrossed by forest type and wilderness designa-tion was the fixed effect, and because thepercentage of high severity at which a givenforest type will burn can differ between fireevents, fires were considered a random effect. Apost hoc test was used to compare differences inmean percentage of high severity per firebetween wilderness designations. We set a ¼0.05, and used the Tukey-Kramer adjustment toaccount for multiple comparisons (Kramer 1956).
Percentage of high-severity fire by forest type andregion.—We calculated total area burned, totalarea burned at high severity and fire rotationperiods for each forest type per region. Firerotation, defined as the length of time necessaryto burn an area equal to the area of interest (inthis case, our study area) was calculated bydividing the time period of our severity data (26years) by the proportion of the study area burnedin that time period (Heinselman 1973).
Similar to the wilderness vs. non-wildernessanalysis, the severity data were best fit by agamma function and we chose to use a GLMM.Region crossed by forest type was the fixedeffect, and fires were considered a random effect.
v www.esajournals.org 7 September 2012 v Volume 3(9) v Article 80
MILLER ET AL.
Post hoc tests were used to compare differencesin mean percentages of high severity per firebetween and among regions. The GLMM wastherefore run twice, partitioning the interactioneffects by region and forest type in separate runs,and the Tukey-Kramer adjustment was used toaccount for multiple comparisons.
Fire size.—We used a one-way analysis ofvariance (ANOVA) to test for differences in meanfire size among regions. We used a Ryan-Einot-Gabriel-Welsch multiple range test because thenumber of samples among regions was uneven.Distribution analysis indicated that log trans-formed fire sizes best fit a normal distribution. Inseveral instances fire perimeters crossed regionboundaries. We therefore ran the ANOVA on twodifferent sets of fires. First, we counted fires thatcrossed region boundaries in each region; sec-ond, we deleted fires that crossed region bound-aries from the analysis.
High-severity patch size.—The BpS data werenot derived through an object oriented classifi-cation methodology that would identify foreststands, but rather the data were based upon amodeling exercise at the pixel level. As a result,we did not think the BpS data were conducive toanalyzing patch dynamics due to the high degreeof confusion among forest types. As a result, wedid not stratify high-severity patches by foresttype. We used a mixed model ANOVA to test fordifferences in high-severity patch size amongregions. Based upon the distribution analysis weconverted patch sizes to m2 and log transformedthem before running the ANOVA to satisfynormality assumptions. Region was the fixedeffect and fires were considered a random effect.We considered patches smaller than 900 m2
corresponding to the Landsat pixel size used tocreate the severity data were slivers created byGIS clipping operations, and we eliminated themfrom the analysis.
RESULTS
Assessment of BPS vegetation dataMost of the FS FIA intensification plots
(81.9%) coincided with four BpS forest types:dry-mesic mixed conifer, mesic mixed conifer,Jeffrey pine–ponderosa pine, and red fir (Table2). There was no clear distinction between dry-mesic and mesic mixed conifer BpS types
(results not shown). For example, plots identi-fied as Pacific Douglas-fir and Douglas-fir–ponderosa pine CALVEG types should haveappeared in the BpS mesic mixed conifer type,but instead most were classed as dry-mesic.Thus, we combined the dry-mesic and mesicmixed conifer BpS types and focused only on thethree major forest types: mixed conifer, yellowpine (Jeffrey and ponderosa pine) and red fir.Mixed conifer had the highest accuracy at 70.5%,and red fir was the least accurate at 29.8%. Mostplots mis-mapped in BpS were mapped in typesthat are normally geographically adjacent. Forexample, there were more ponderosa pine plotsmapped as mixed conifer than yellow pine, butponderosa pine elevational range overlaps withmixed conifer. The BpS red fir type had thelowest accuracy primarily because lodgepolepine and subalpine conifer plots were moreoften mapped as red fir even though those typesalso occur within the BpS classification system.Mixed conifer is the dominant forest typemapped on the westside (54.2%) and in theCascade-Modoc region (45.9%), although in theCascade-Modoc region yellow pine almostcovers an equivalent area (43.1%, Table 3). Redfir is the dominate forest type mapped inYosemite (66.3%), and yellow pine is dominanton the eastside (65.4%).
Percentage of high-severity fire in wilderness vs.non-wilderness by region
There were only two cases where the percent-age of high-severity fire differed by wildernessdesignation within a given region: mixed coniferand red fir on the eastside (P ¼ 0.003 and P ¼0.039, respectively, results not shown). Most ofthe area burned in eastside wilderness in thosetwo forest types occurred in two fires (61% and73%, respectively), both of which were fullysuppressed (B. Skaggs, personal communication).Since we found no other significant differencebetween wilderness and non-wilderness, we didnot account for a wilderness effect in any of theremaining analyses.
Percentage of high-severity fireby region and forest type
The westside and Cascade-Modoc regions hadthe lowest percentage of total area burned in eachforest type (Table 3). The eastside experienced the
v www.esajournals.org 8 September 2012 v Volume 3(9) v Article 80
MILLER ET AL.
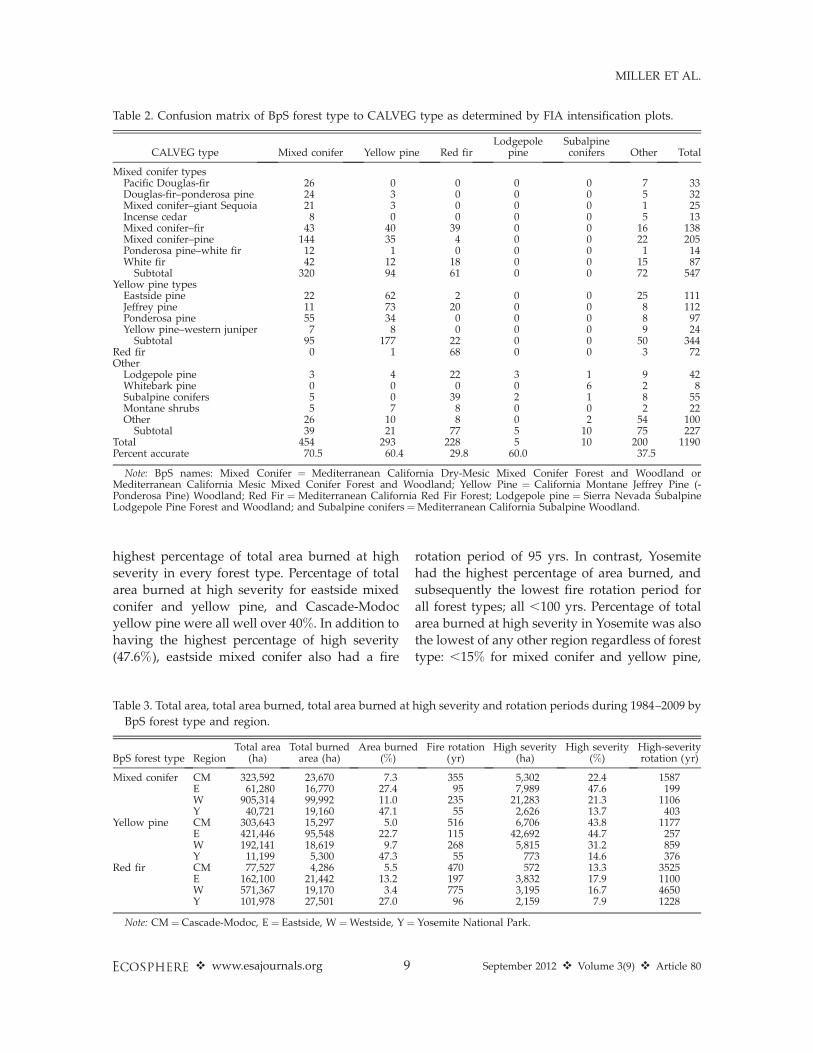
highest percentage of total area burned at high
severity in every forest type. Percentage of total
area burned at high severity for eastside mixed
conifer and yellow pine, and Cascade-Modoc
yellow pine were all well over 40%. In addition to
having the highest percentage of high severity
(47.6%), eastside mixed conifer also had a fire
rotation period of 95 yrs. In contrast, Yosemite
had the highest percentage of area burned, and
subsequently the lowest fire rotation period for
all forest types; all ,100 yrs. Percentage of total
area burned at high severity in Yosemite was also
the lowest of any other region regardless of forest
type: ,15% for mixed conifer and yellow pine,
Table 3. Total area, total area burned, total area burned at high severity and rotation periods during 1984–2009 by
BpS forest type and region.
BpS forest type RegionTotal area
(ha)Total burnedarea (ha)
Area burned(%)
Fire rotation(yr)
High severity(ha)
High severity(%)
High-severityrotation (yr)
Mixed conifer CM 323,592 23,670 7.3 355 5,302 22.4 1587E 61,280 16,770 27.4 95 7,989 47.6 199W 905,314 99,992 11.0 235 21,283 21.3 1106Y 40,721 19,160 47.1 55 2,626 13.7 403
Yellow pine CM 303,643 15,297 5.0 516 6,706 43.8 1177E 421,446 95,548 22.7 115 42,692 44.7 257W 192,141 18,619 9.7 268 5,815 31.2 859Y 11,199 5,300 47.3 55 773 14.6 376
Red fir CM 77,527 4,286 5.5 470 572 13.3 3525E 162,100 21,442 13.2 197 3,832 17.9 1100W 571,367 19,170 3.4 775 3,195 16.7 4650Y 101,978 27,501 27.0 96 2,159 7.9 1228
Note: CM ¼ Cascade-Modoc, E¼ Eastside, W¼Westside, Y¼ Yosemite National Park.
Table 2. Confusion matrix of BpS forest type to CALVEG type as determined by FIA intensification plots.
CALVEG type Mixed conifer Yellow pine Red firLodgepole
pineSubalpineconifers Other Total
Mixed conifer typesPacific Douglas-fir 26 0 0 0 0 7 33Douglas-fir–ponderosa pine 24 3 0 0 0 5 32Mixed conifer–giant Sequoia 21 3 0 0 0 1 25Incense cedar 8 0 0 0 0 5 13Mixed conifer–fir 43 40 39 0 0 16 138Mixed conifer–pine 144 35 4 0 0 22 205Ponderosa pine–white fir 12 1 0 0 0 1 14White fir 42 12 18 0 0 15 87Subtotal 320 94 61 0 0 72 547
Yellow pine typesEastside pine 22 62 2 0 0 25 111Jeffrey pine 11 73 20 0 0 8 112Ponderosa pine 55 34 0 0 0 8 97Yellow pine–western juniper 7 8 0 0 0 9 24Subtotal 95 177 22 0 0 50 344
Red fir 0 1 68 0 0 3 72Other
Lodgepole pine 3 4 22 3 1 9 42Whitebark pine 0 0 0 0 6 2 8Subalpine conifers 5 0 39 2 1 8 55Montane shrubs 5 7 8 0 0 2 22Other 26 10 8 0 2 54 100Subtotal 39 21 77 5 10 75 227
Total 454 293 228 5 10 200 1190Percent accurate 70.5 60.4 29.8 60.0 37.5
Note: BpS names: Mixed Conifer ¼ Mediterranean California Dry-Mesic Mixed Conifer Forest and Woodland orMediterranean California Mesic Mixed Conifer Forest and Woodland; Yellow Pine ¼ California Montane Jeffrey Pine (-Ponderosa Pine) Woodland; Red Fir ¼ Mediterranean California Red Fir Forest; Lodgepole pine ¼ Sierra Nevada SubalpineLodgepole Pine Forest and Woodland; and Subalpine conifers¼Mediterranean California Subalpine Woodland.
v www.esajournals.org 9 September 2012 v Volume 3(9) v Article 80
MILLER ET AL.

and ,8% for red fir. Mean percentage of highseverity per fire followed a similar pattern withCascade-Modoc and eastside experiencing thehighest percentages and Yosemite the lowest(Table 4). Mean percentage of high severity perfire was significantly less (P , 0.05) in Yosemitethan all other regions regardless of forest type(Fig. 2). Differences in mixed conifer or yellowpine between the Cascade-Modoc, eastside andwestside regions were not significant. Meanpercentage of high severity per fire for red firtended to be lower than any other type withinthe same region, except Cascade-Modoc andwestside mixed conifer. There were no significantdifferences in mean percentage of high severityamong any of the forest types within theCascade-Modoc region.
Fire sizeWhen fires that crossed region boundaries are
not considered, Yosemite fires were significantlysmaller (P , 0.05) on average than fires in any ofthe other regions (Table 5). When fires thatcrossed region boundaries were included in theanalysis, Yosemite fires were still smaller thanCascade-Modoc or eastside fires, but were notsignificantly different than westside fires eventhough the mean size of westside fires was morethan double that of Yosemite fires (2907.9 ha and1416.8 ha, respectively).
High-severity patch sizeYosemite mean high-severity patch size was
significantly smaller (P , 0.005) than mean patchsizes in all other regions (Table 6). Westside,
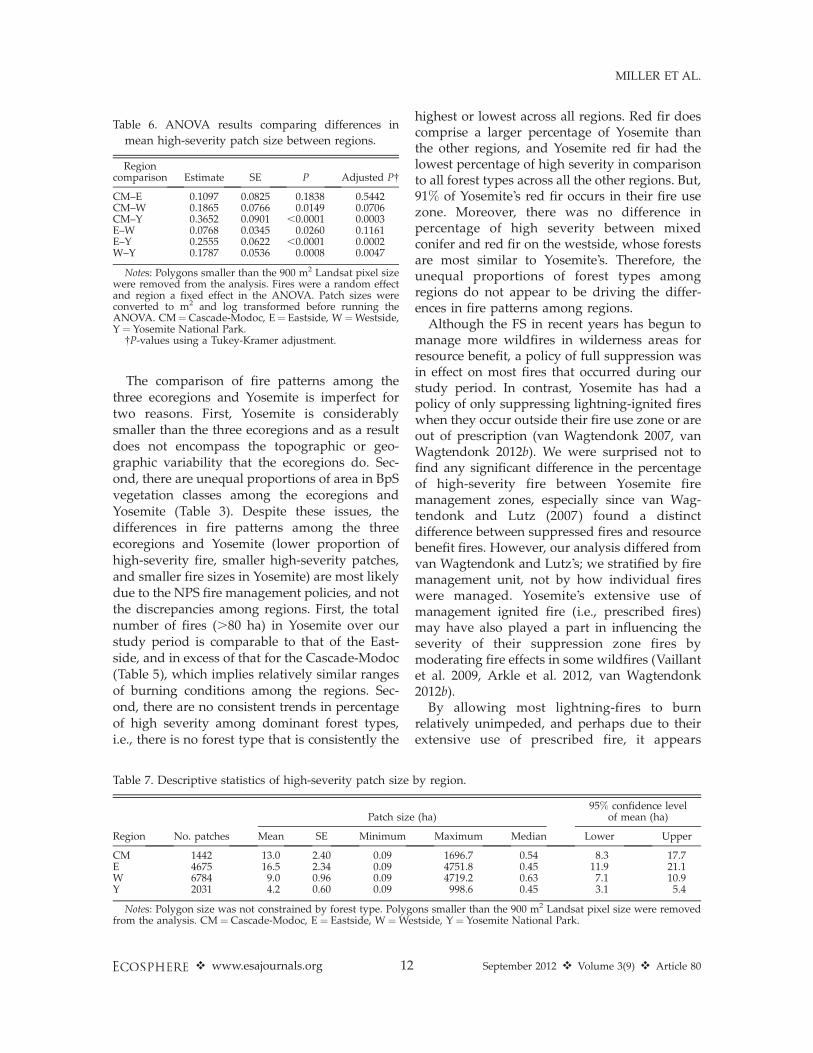
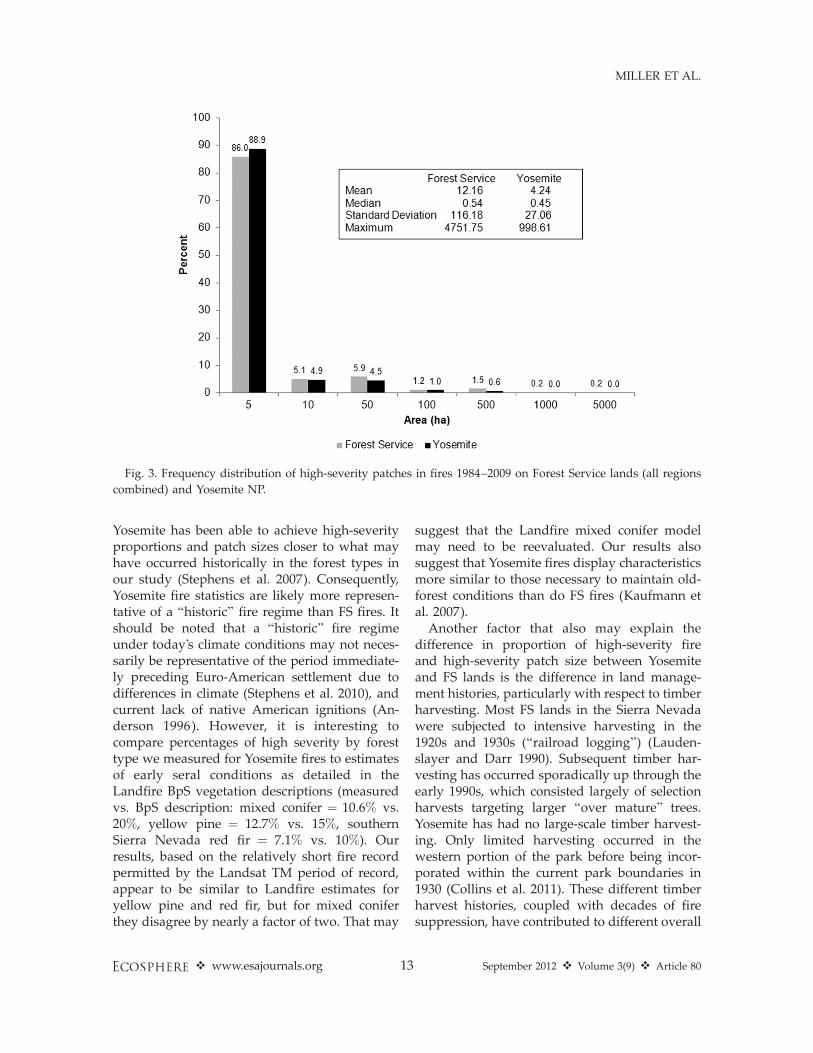
Cascade-Modoc and eastside mean high-severitypatch sizes were 2.12, 3.08, and 3.89 times larger,respectively, than the 4.2 ha mean Yosemite patchsize (Table 7). Cascade-Modoc and eastside, andeastside and westside were the only two regionpairs where the null hypothesis of equal meanpatch sizes could not be rejected (Table 6). Whilethe percentage of patches ,5 ha was similar onFS lands and Yosemite (86.0% and 88.9%,respectively), the percentage of patches .100 haand mean patch size was almost three timeshigher on FS lands (1.96% vs. 0.69% and 12.16 havs. 4.24 ha, respectively; Fig. 3).
DISCUSSION
Our study is the first to contrast fire statistics inthe Sierra Nevada among ecoregions, and be-tween federal land management agencies. Ourfindings indicating lower percentages of high-severity fire in Yosemite relative to FS lands in thethree ecoregions suggest a fundamental distinc-tion due to the differing land management andfire management policies of the FS and Yosemite(Fig. 2). Although fire regime characteristics canvary due to fine scale topography and variation instand history (Perry et al. 2011), the forest typeswe use are considered to have generally similarfire regime characteristics at the broad scale of thestudy area (Sugihara et al. 2006b, Stephens et al.2007, Van de Water and Safford 2011). Therefore,the differences in land management and firemanagement histories between the two agenciesare likely the major factor driving the distinctionin high-severity fire percentages.
Table 4. Descriptive statistics for percentage of high-severity per fire by BpS forest type and region.
BpS forest type Region No. fires
High severity (%)95% confidence level
of mean (%)
Mean SE Minimum Maximum Median Lower Upper
Mixed conifer CM 49 26.6 3.37 0 100.0 20.1 19.8 33.4E 65 23.9 2.76 0 86.1 22.5 18.4 29.4W 152 15.6 1.54 0 79.5 6.1 12.6 18.7Y 55 10.6 2.19 0 90.2 4.3 6.2 15.0
Yellow pine CM 46 31.6 3.63 0 96.6 32.9 24.3 39.0E 82 27.5 2.37 0 83.8 24.2 22.8 32.2W 144 22.9 2.01 0 97.2 16.6 18.9 26.9Y 69 12.7 1.80 0 66.9 6.6 9.1 16.3
Red fir CM 13 33.1 10.05 0 100.0 25.4 11.2 55.0E 50 16.3 2.69 0 80.7 10.3 10.9 21.7W 60 12.1 1.64 0 47.7 8.1 8.8 15.4Y 69 7.1 1.15 0 53.4 2.6 4.8 9.4
Note: CM ¼ Cascade-Modoc, E¼ Eastside, W¼Westside, Y¼ Yosemite National Park.
v www.esajournals.org 10 September 2012 v Volume 3(9) v Article 80
MILLER ET AL.
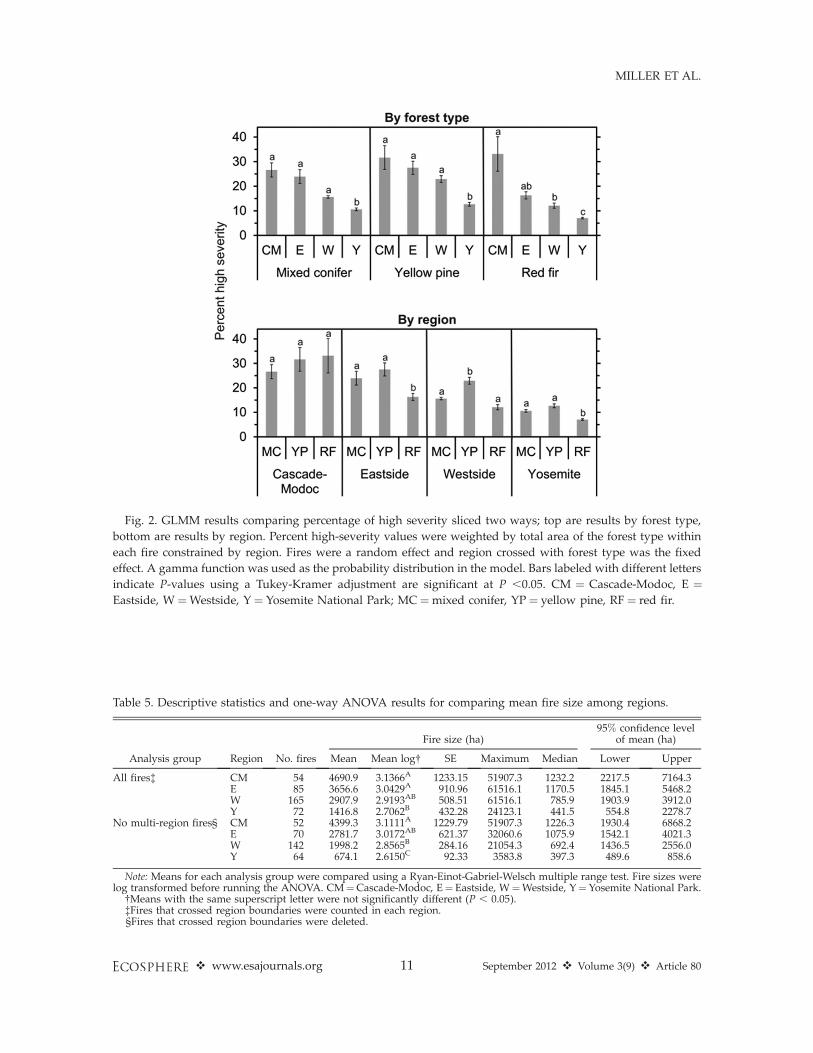
Fig. 2. GLMM results comparing percentage of high severity sliced two ways; top are results by forest type,
bottom are results by region. Percent high-severity values were weighted by total area of the forest type within
each fire constrained by region. Fires were a random effect and region crossed with forest type was the fixed
effect. A gamma function was used as the probability distribution in the model. Bars labeled with different letters
indicate P-values using a Tukey-Kramer adjustment are significant at P ,0.05. CM ¼ Cascade-Modoc, E ¼Eastside, W ¼Westside, Y ¼ Yosemite National Park; MC ¼mixed conifer, YP ¼ yellow pine, RF¼ red fir.
Table 5. Descriptive statistics and one-way ANOVA results for comparing mean fire size among regions.
Analysis group Region No. fires
Fire size (ha)95% confidence level
of mean (ha)
Mean Mean log� SE Maximum Median Lower Upper
All fires� CM 54 4690.9 3.1366A 1233.15 51907.3 1232.2 2217.5 7164.3E 85 3656.6 3.0429A 910.96 61516.1 1170.5 1845.1 5468.2W 165 2907.9 2.9193AB 508.51 61516.1 785.9 1903.9 3912.0Y 72 1416.8 2.7062B 432.28 24123.1 441.5 554.8 2278.7
No multi-region fires§ CM 52 4399.3 3.1111A 1229.79 51907.3 1226.3 1930.4 6868.2E 70 2781.7 3.0172AB 621.37 32060.6 1075.9 1542.1 4021.3W 142 1998.2 2.8565B 284.16 21054.3 692.4 1436.5 2556.0Y 64 674.1 2.6150C 92.33 3583.8 397.3 489.6 858.6
Note: Means for each analysis group were compared using a Ryan-Einot-Gabriel-Welsch multiple range test. Fire sizes werelog transformed before running the ANOVA. CM¼Cascade-Modoc, E¼ Eastside, W¼Westside, Y¼Yosemite National Park.
�Means with the same superscript letter were not significantly different (P , 0.05).�Fires that crossed region boundaries were counted in each region.§Fires that crossed region boundaries were deleted.
v www.esajournals.org 11 September 2012 v Volume 3(9) v Article 80
MILLER ET AL.
The comparison of fire patterns among thethree ecoregions and Yosemite is imperfect fortwo reasons. First, Yosemite is considerablysmaller than the three ecoregions and as a resultdoes not encompass the topographic or geo-graphic variability that the ecoregions do. Sec-ond, there are unequal proportions of area in BpSvegetation classes among the ecoregions andYosemite (Table 3). Despite these issues, thedifferences in fire patterns among the threeecoregions and Yosemite (lower proportion ofhigh-severity fire, smaller high-severity patches,and smaller fire sizes in Yosemite) are most likelydue to the NPS fire management policies, and notthe discrepancies among regions. First, the totalnumber of fires (.80 ha) in Yosemite over ourstudy period is comparable to that of the East-side, and in excess of that for the Cascade-Modoc(Table 5), which implies relatively similar rangesof burning conditions among the regions. Sec-ond, there are no consistent trends in percentageof high severity among dominant forest types,i.e., there is no forest type that is consistently the
highest or lowest across all regions. Red fir doescomprise a larger percentage of Yosemite thanthe other regions, and Yosemite red fir had thelowest percentage of high severity in comparisonto all forest types across all the other regions. But,91% of Yosemite’s red fir occurs in their fire usezone. Moreover, there was no difference inpercentage of high severity between mixedconifer and red fir on the westside, whose forestsare most similar to Yosemite’s. Therefore, theunequal proportions of forest types amongregions do not appear to be driving the differ-ences in fire patterns among regions.
Although the FS in recent years has begun tomanage more wildfires in wilderness areas forresource benefit, a policy of full suppression wasin effect on most fires that occurred during ourstudy period. In contrast, Yosemite has had apolicy of only suppressing lightning-ignited fireswhen they occur outside their fire use zone or areout of prescription (van Wagtendonk 2007, vanWagtendonk 2012b). We were surprised not tofind any significant difference in the percentageof high-severity fire between Yosemite firemanagement zones, especially since van Wag-tendonk and Lutz (2007) found a distinctdifference between suppressed fires and resourcebenefit fires. However, our analysis differed fromvan Wagtendonk and Lutz’s; we stratified by firemanagement unit, not by how individual fireswere managed. Yosemite’s extensive use ofmanagement ignited fire (i.e., prescribed fires)may have also played a part in influencing theseverity of their suppression zone fires bymoderating fire effects in some wildfires (Vaillantet al. 2009, Arkle et al. 2012, van Wagtendonk2012b).
By allowing most lightning-fires to burnrelatively unimpeded, and perhaps due to theirextensive use of prescribed fire, it appears
Table 6. ANOVA results comparing differences in
mean high-severity patch size between regions.
Regioncomparison Estimate SE P Adjusted P�
CM–E 0.1097 0.0825 0.1838 0.5442CM–W 0.1865 0.0766 0.0149 0.0706CM–Y 0.3652 0.0901 ,0.0001 0.0003E–W 0.0768 0.0345 0.0260 0.1161E–Y 0.2555 0.0622 ,0.0001 0.0002W–Y 0.1787 0.0536 0.0008 0.0047
Notes: Polygons smaller than the 900 m2 Landsat pixel sizewere removed from the analysis. Fires were a random effectand region a fixed effect in the ANOVA. Patch sizes wereconverted to m2 and log transformed before running theANOVA. CM¼Cascade-Modoc, E¼ Eastside, W¼Westside,Y ¼ Yosemite National Park.
�P-values using a Tukey-Kramer adjustment.
Table 7. Descriptive statistics of high-severity patch size by region.
Region No. patches
Patch size (ha)95% confidence level
of mean (ha)
Mean SE Minimum Maximum Median Lower Upper
CM 1442 13.0 2.40 0.09 1696.7 0.54 8.3 17.7E 4675 16.5 2.34 0.09 4751.8 0.45 11.9 21.1W 6784 9.0 0.96 0.09 4719.2 0.63 7.1 10.9Y 2031 4.2 0.60 0.09 998.6 0.45 3.1 5.4
Notes: Polygon size was not constrained by forest type. Polygons smaller than the 900 m2 Landsat pixel size were removedfrom the analysis. CM¼ Cascade-Modoc, E ¼ Eastside, W¼Westside, Y¼ Yosemite National Park.
v www.esajournals.org 12 September 2012 v Volume 3(9) v Article 80
MILLER ET AL.
Yosemite has been able to achieve high-severityproportions and patch sizes closer to what mayhave occurred historically in the forest types inour study (Stephens et al. 2007). Consequently,Yosemite fire statistics are likely more represen-tative of a ‘‘historic’’ fire regime than FS fires. Itshould be noted that a ‘‘historic’’ fire regimeunder today’s climate conditions may not neces-sarily be representative of the period immediate-ly preceding Euro-American settlement due todifferences in climate (Stephens et al. 2010), andcurrent lack of native American ignitions (An-derson 1996). However, it is interesting tocompare percentages of high severity by foresttype we measured for Yosemite fires to estimatesof early seral conditions as detailed in theLandfire BpS vegetation descriptions (measuredvs. BpS description: mixed conifer ¼ 10.6% vs.20%, yellow pine ¼ 12.7% vs. 15%, southernSierra Nevada red fir ¼ 7.1% vs. 10%). Ourresults, based on the relatively short fire recordpermitted by the Landsat TM period of record,appear to be similar to Landfire estimates foryellow pine and red fir, but for mixed coniferthey disagree by nearly a factor of two. That may
suggest that the Landfire mixed conifer modelmay need to be reevaluated. Our results alsosuggest that Yosemite fires display characteristicsmore similar to those necessary to maintain old-forest conditions than do FS fires (Kaufmann etal. 2007).
Another factor that also may explain thedifference in proportion of high-severity fireand high-severity patch size between Yosemiteand FS lands is the difference in land manage-ment histories, particularly with respect to timberharvesting. Most FS lands in the Sierra Nevadawere subjected to intensive harvesting in the1920s and 1930s (‘‘railroad logging’’) (Lauden-slayer and Darr 1990). Subsequent timber har-vesting has occurred sporadically up through theearly 1990s, which consisted largely of selectionharvests targeting larger ‘‘over mature’’ trees.Yosemite has had no large-scale timber harvest-ing. Only limited harvesting occurred in thewestern portion of the park before being incor-porated within the current park boundaries in1930 (Collins et al. 2011). These different timberharvest histories, coupled with decades of firesuppression, have contributed to different overall
Fig. 3. Frequency distribution of high-severity patches in fires 1984–2009 on Forest Service lands (all regions
combined) and Yosemite NP.
v www.esajournals.org 13 September 2012 v Volume 3(9) v Article 80
MILLER ET AL.
forest structures, mainly more small trees andfewer large trees on FS lands, which lead toincreased susceptibility to crown fire (Stephensand Moghaddas 2005).
Ecological theory dictates that high fire fre-quency and the self-organizing dependent natureof burn patterns create a fine scale heterogeneousforest-patch structure that is characteristic of oldforest conditions in mixed conifer forests of theSierra Nevada (Sugihara et al. 2006a, Beaty andTaylor 2007, Collins et al. 2009, Perry et al. 2011,Lutz et al. 2012, North et al. 2012). Topographyhowever, often influences severity with smallerareas of high severity on lower, mesic slopes andlarger areas on upper, xeric slopes (Beaty andTaylor 2001). Climate variations and short-termweather patterns can also influence the amountand size of high-severity patches. Large high-severity patches can occur under dry and windyweather conditions, but can be exacerbated bythe dense forest conditions and high fuel loadsthat have developed during the fire suppressionperiod (Scholl and Taylor 2010, Perry et al. 2011,Lutz et al. 2012). Our results, therefore, likely donot apply evenly across the landscape, but dodemonstrate that at least some contemporary fireregime characteristics differ among Sierra Neva-da regions. For example, percentage of high-severity fire in red fir forests was higher inCascade-Modoc than westside fires during 1984–2009 (Fig. 2). We believe short term climatepatterns (e.g., the El Nino Southern Oscillation)were not a significant factor in our resultsbecause the data span a wide range of year-to-year variation in annual (October–September)precipitation conditions over the twenty-six yearperiod, incorporating a full range of climaticconditions (Western Regional Climate CenterSierra Nevada region: mean¼944 mm, minimum¼ 527 mm, maximum¼ 1625 mm [Abatzoglou etal. 2009, WRCC 2012]).
In contrast, some researchers have recentlysuggested that large contemporary fires withinthe study area, which exhibited very large (1000–5000 ha) high-severity patches, fall within thenatural range of variation, and therefore aretypical of the historic fire regime (Odion andHanson 2006). However, variation of fire regimecharacteristics is better described by traditionalstatistics (i.e., mean, mode and standard devia-tion) rather than maxima, because maxima by
definition represent rare events (Burt and Barber1996, Landres et al. 1999, Sugihara and Barbour2006). It is much more likely that fire effects seenin the contemporary fires in the Odion andHanson (2006) study were actually rare histori-cally (Perry et al. 2011). For example, for the threefires analyzed by Odion and Hanson (2006)mean high-severity patch size was more thantwice as large as the mean high-severity patchsize in Yosemite fires from 1984–2009 (9.5 ha vs.4.2 ha), and patches larger than 100 ha occurredmore than twice as often (1.49% vs. 0.69%). Anyincrease in the distribution of large patch sizeand occurrence, both in time and space, incomparison to historical conditions has impor-tant implications to forest recovery and specieshabitat (Pickett and White 1985, Roberts et al.2008, Roberts et al. 2011). Large proportions oftwo of the three fires Odion and Hanson studiedoccurred on the westside (1/3 and 2/3), but meanpercentages of high severity by forest type in theOdion and Hanson study (mixed conifer¼ 25.8%,yellow pine ¼ 34.2%, and red fir ¼ 13.4%) weremore representative of percentages of Cascade-Modoc and eastside fires that were more thantwo times higher and significantly different thanpercentages in Yosemite fires (Table 4 and Fig. 2).Historic regime characteristics for the westsidemay have been different from Cascade-Modocand eastside due to the differences in precipita-tion patterns, but we have no analog for Yosemitein those regions for comparison. Regardless,current eastside fire regime characteristics arelikely not representative of ‘‘historic’’ conditionsthat result in old-forest conditions in frequent firedry forests (Smith 1991, Stephens et al. 2008,Larson and Churchill 2012).
Retention of forests with conditions indicativeof a late successional stage of forest developmentis desirable to maintain wildlife habitat, biolog-ical diversity, carbon sequestration, and otherecosystem values (Binkley et al. 2007, Luyssaertet al. 2008, Stephens et al. 2012a). Forestsuccessional stages are most often describedusing structural characteristics such as tree size,density by tree size class, number of canopylayers, tree cover as well as the distribution ofunderstory species and downed wood (Franklinand Fites-Kaufmann 1996, Oliver and Larson1996). Stand age is less often used to describesuccessional stages because the rate of stand
v www.esajournals.org 14 September 2012 v Volume 3(9) v Article 80
MILLER ET AL.
development also depends upon site conditionsand fire history. However, if a ‘‘historic’’ fireregime were to be maintained, stand age couldbe indicative of developmental stage (Fites et al.1992). Our results indicate that eastside mixedconifer and yellow pine high-severity fire rota-tions (199 years and 257 years respectively; Table3) over the 1984–2009 period are likely shorterthan those required to maintain old-forest con-ditions (Smith 1991, Fites et al. 1992, Beardsley etal. 1999). However, most of the high severity ineastside types occurred on the east side of thePlumas National Forest in the northern portion ofthe region, and on the Kern Plateau in thesouthern portion of the region. As a result, fewerforests have been retained in those areas thathave the potential for exhibiting old forestconditions, while other eastside locations (e.g.,the Lake Tahoe Basin) have seen relatively littlefire (Fig. 1). In contrast, high-severity rotationsmay be too long in most Cascade-Modoc andwestside FS locations, especially in comparisonto Yosemite, leading to a homogenization ofdense forest conditions, which is also uncharac-teristic of old forest conditions (Perry et al. 2011).However, when high-severity patches are un-characteristically large, forest homogenizationcan also occur (Perry et al. 2011). When SierraNevada conifer forest types are converted tomontane chaparral by high-severity fire, there isa high probability of subsequent fires alsoburning at high severity, perpetuating or enlarg-ing the montane chaparral patch (Nagel andTaylor 2005, Collins and Stephens 2010, vanWagtendonk et al. 2012, van Wagtendonk 2012a).Therefore, large high-severity patches could be amanagement concern where old-forest condi-tions are desired.
Our use of the Landfire BpS vegetation data tostratify by forest type likely impacted our resultsfor red fir more than mixed conifer and yellowpine. Classification accuracies for mixed coniferand yellow pine were similar to those achievedby other researchers using similar techniques toLandfire, but the red fir classification accuracywas low (Cairns 2001, Rollins et al. 2004). Also,historical mixed conifer and yellow pine fireregimes were similar (Sugihara et al. 2006b, Vande Water and Safford 2011), and, therefore, eventhough those two types were confused mostoften, it likely did not make very much difference
when interpreting our results. However, red firwas confused with mixed conifer–fir types andsubalpine conifers, both of which historically hadfire regimes that were different from red fir(shorter and longer, respectively) (Sugihara et al.2006b, Van de Water and Safford 2011).
Our results support the hypothesis that thecurrent patterns of large wildfires and large high-severity patch sizes in the dry forest types on FSlands in the greater Sierra Nevada region,including the southern Cascades and ModocPlateau, is to a large extent due to the lack ofan agent to remove forest fuels at a ratecommensurate with their accumulation (Abellaet al. 2007, Miller et al. 2009b, Collins et al. 2011).Smaller Yosemite fire size and high-severitypatch size in comparison with FS fires alsosuggests that the larger percentages of highseverity on FS lands are not due to suppressionlimiting the amount of low severity in individualfires. Rather, it is the cumulative effect ofsuppression that has led to an accumulation offuels, and subsequent higher percentages of highseverity. As a corollary, our results support thehypothesis that restoring ecological processes,e.g., allowing more wildfires to burn underweather conditions less conducive to producinghigh intensities and severe effects, would reducefuel loads and stand densities across broad scaleseven under current climate conditions, resultingin forests that may be more resilient to futureclimate change (Miller and Urban 2000, Stephenset al. 2010). Federal fire management policyallows for fires to be managed for resourcebenefit, provided such fire management strate-gies are identified in the Land and ResourceManagement Plans (LMP) and Fire ManagementPlans (FMP) (USDA-USDI 2009). Current LMPsand FMPs that call for suppressing all wildfireswould need to be altered to allow for increasingthe number and extent of wildfires managed forresource benefit (Steelman and McCaffrey 2011).There is an opportunity to do so with the new2012 forest planning rule, and upcoming LMPand FMP revisions scheduled for the Forests inthe greater Sierra Nevada region (North et al.2012, USDA 2012).
Numerous challenges remain, however. Oftensocial–political pressures are placed upon firemanagers and land managers to quickly extin-guish fires. As a result, there is a tendency for
v www.esajournals.org 15 September 2012 v Volume 3(9) v Article 80
MILLER ET AL.
managers to avoid long-duration fires and riskfires escaping onto private lands. Some centraland northern Sierra Nevada Forests are achecker-board of Federal and private ownership,and extensive co-operation between private landowners and federal, state and local fire managerswill be required before allowing more wildfiresto burn (Black et al. 2008, Canton-Thompson etal. 2008, Steelman and McCaffrey 2011). Publicconcern over air quality and air quality regula-tory issues have also been a factor in limiting theuse of prescribed fires or amount of timewildfires are allowed to burn (Winter et al.2002, Quinn-Davidson and Varner 2012). Toalleviate smoke concerns, managing fuelsthrough mechanical treatments has been pro-posed as an option for meeting restorationobjectives in some locations (Dombeck et al.2004). Mechanical treatments are also usuallypreferred by the general public for meeting fuelsmanagement objectives in wildland-urban inter-face areas (Winter et al. 2002). Moreover, a recentstudy found few, if any, undesirable effects frommechanical fuels treatments (Stephens et al.2012b). Mechanical treatments are not allowedin wilderness areas; nevertheless, using fire forresource benefit could be further emphasized.Regardless of where mechanical treatmentspotentially could be used, currently there islimited infrastructure that could economicallytreat enormous quantities of biomass material(Nicholls et al. 2008). Therefore, managingwildfire for resource benefit is likely the bestoption for fuels reduction and forest restorationover a large proportion of the landscape.
ACKNOWLEDGMENTS
J. W. van Wagtendonk is retired from the U.S.Geological Survey. We thank two anonymous review-ers who helped improve the manuscript.
LITERATURE CITED
Abatzoglou, J. T., K. T. Redmond, and L. M. Edwards.2009. Classification of regional climate variabilityin the state of California. Journal of AppliedMeteorology and Climatology 48:1527–1541.
Abella, S. R., W. W. Covington, P. Z. Fule, L. B. Lentile,A. J. Sanchez Meador, and P. Morgan. 2007. Past,present, and future old growth in frequent-fireconifer forests of the western United States.
Ecology and Society 12:art16.Agee, J. K. 1993. Fire ecology of Pacific Northwest
forests. Island Press, Washington, D.C., USA.Allen, C. D., M. Savage, D. A. Falk, K. F. Suckling, T.
W. Swetnam, T. Schulke, P. B. Stacey, P. Morgan, M.Hoffman, and J. T. Klingel. 2002. Ecologicalrestoration of southwestern ponderosa pine eco-systems: A broad perspective. Ecological Applica-tions 12:1418–1433.
Anderson, M. K. 1996. Native American land-usepractices and ecological impacts. Pages 187–206 inSierra Nevada Ecosystems Project: Final Report toCongress. University of California, Davis, Califor-nia, USA.
Arkle, R. S., D. S. Pilliod, and J. L. Welty. 2012. Patternand process of prescribed fires influence effective-ness at reducing wildfire severity in dry coniferousforests. Forest Ecology and Management 276:174–184.
Bailey, R. G., P. E. Avers, T. King, and W. H. McNab.1994. Ecoregions and subregions of the UnitedStates (map). U.S. Geological Survey, Washington,D.C., USA.
Beardsley, D., C. Bolsinger, and R. Warbington. 1999.Old-growth forests in the Sierra Nevada: by type in1945 and 1993 and ownership in 1993. ResearchPaper PNW-RP-516. USDA Forest Service, PacificNorthwest Research Station, Portland, Oregon,USA.
Beaty, R. M., and A. H. Taylor. 2001. Spatial andtemporal variation of fire regimes in a mixedconifer forest landscape, Southern Cascades, Cal-ifornia, USA. Journal of Biogeography 28:955–966.
Beaty, R. M., and A. H. Taylor. 2007. Fire disturbanceand forest structure in old-growth mixed coniferforests in the northern Sierra Nevada, California.Journal of Vegetation Science 18:879–890.
Binkley, D., T. Sisk, C. Chambers, J. Springer, and W.Block. 2007. The role of old-growth forest infrequent-fire landscapes. Ecology and Society12:art18.
Black, A. E., K. M. Gebert, T. A. Steelman, S.McCaffrey, J. Canton-Thompson, and C. Stalling.2008. The interplay of AMR, suppression costs,agency-community interaction, and organizationalperformance: a multi-disciplinary approach. JointFire Science Program, Final Report 08-1-4-01.
Bolker, B. M., M. E. Brooks, C. J. Clark, S. W. Geange, J.R. Poulsen, M. H. H. Stevens, and J.-S. S. White.2009. Generalized linear mixed models: a practicalguide for ecology and evolution. Trends in Ecology& Evolution 24:127–135.
Brohman, R., and L. Bryant, editors. 2005. Existingvegetation classification and mapping technicalguide. General Technical Report WO-67. USDAForest Service, Washington, D.C., USA.
Burt, J. E., and G. M. Barber. 1996. Elementary statistics
v www.esajournals.org 16 September 2012 v Volume 3(9) v Article 80
MILLER ET AL.
for geographers. Second edition. Guilford Press,New York, New York, USA.
Cairns, D. M. 2001. A comparison of methods forpredicting vegetation type. Plant Ecology 156:3–18.
Canton-Thompson, J., K. M. Gebert, B. Thompson, G.Jones, D. Calkin, and G. Donovan. 2008. Externalhuman factors in incident management teamdecision making and their effect on large firesuppression expenditures. Journal of Forestry106:416–424.
Collins, B., M. Kelly, J. van Wagtendonk, and S.Stephens. 2007. Spatial patterns of large naturalfires in Sierra Nevada wilderness areas. LandscapeEcology 22:545–557.
Collins, B., and S. Stephens. 2010. Stand-replacingpatches within a ‘mixed severity’ fire regime:quantitative characterization using recent fires ina long-established natural fire area. LandscapeEcology 25:927–939.
Collins, B. M., R. G. Everett, and S. L. Stephens. 2011.Impacts of fire exclusion and recent managed fireon forest structure in old growth Sierra Nevadamixed-conifer forests. Ecosphere 2:art51.
Collins, B. M., J. D. Miller, A. E. Thode, M. Kelly, J. W.van Wagtendonk, and S. L. Stephens. 2009.Interactions among wildland fires in a long-established Sierra Nevada natural fire area. Eco-systems 12:114–128.
Collins, B. M., and S. L. Stephens. 2007. Managingnatural wildfires in Sierra Nevada wildernessareas. Frontiers in Ecology and the Environment5:523–527.
Comer, P., D. Faber-Langendoen, R. Evans, S. Gawler,C. Josse, G. Kittel, S. Menard, M. Pyne, M. Reid, K.Schulz, K. Snow, and J. Teague. 2003. Ecologicalsystems of the United States: a working classifica-tion of US terrestrial systems. NatureServe, Arling-ton, Virginia, USA.
Daly, C., R. P. Neilson, and D. L. Phillips. 1994. Astatistical-topographic model for mapping climato-logical precipitation over mountainous terrain.Journal of Applied Meteorology 33:140–158.
Dillon, G. K., Z. A. Holden, P. Morgan, M. A.Crimmins, E. K. Heyerdahl, and C. H. Luce. 2011.Both topography and climate affected forest andwoodland burn severity in two regions of thewestern US, 1984 to 2006. Ecosphere 2:art130.
Dombeck, M. P., J. E. Williams, and C. A. Wood. 2004.Wildfire policy and public lands: Integratingscientific understanding with social concerns acrosslandscapes. Conservation Biology 18:883–889.
Finney, M. A., C. W. McHugh, and I. C. Grenfell. 2005.Stand- and landscape-level effects of prescribedburning on two Arizona wildfires. CanadianJournal of Forest Research 35:1714–1722.
Fites, J., M. Chappel, B. Corbin, M. Newman, T.Ratcliff, and D. Thomas. 1992. Preliminary ecolog-
ical old-growth definitions for mixed conifer (SAFtype 243) in California. USDA Forest Service,Pacific Southwest Region.
Franklin, J., and J. Fites-Kaufmann. 1996. Assessmentof Late-successional forests of the Sierra Nevada.Pages 627–656 in Sierra Nevada Ecosystems Pro-ject: Final Report to Congress. University ofCalifornia, Davis, California, USA.
Fule, P. Z., J. E. Crouse, A. E. Cocke, M. M. Moore, andW. W. Covington. 2004. Changes in canopy fuelsand potential fire behavior 1880-2040: GrandCanyon, Arizona. Ecological Modelling 175:231–248.
Hann, W., A. Shlisky, D. Havlina, K. Schon, S. Barrett,T. DeMeo, K. Pohl, J. Menakis, D. Hamilton, J.Jones, and M. Levesque. 2010. Interagency fireregime condition class guidebook. Version 3.0.USDA Forest Service, US Department of theInterior, The Nature Conservancy, and Systemsfor Environmental Management.
Heinselman, M. L. 1973. Fire in the virgin forests of theBoundary Waters Canoe Area, Minnesota. Quater-nary Research 3:329–382.
Heinselman, M. L. 1981. Fire intensity and frequencyas factors in the distribution and structure ofnorthern ecosystem. Pages 7–57 in H. A. Mooney,T. M. Bonnicksen, N. L. Christensen, Jr., J. E. Lotan,and W. A. Reiners, editors. Conference on fireregimes and ecosystem properties. USDA ForestService.
Hessburg, P. F., J. K. Agee, and J. F. Franklin. 2005. Dryforests and wildland fires of the inland NorthwestUSA: Contrasting the landscape ecology of the pre-settlement and modern eras. Forest Ecology andManagement 211:117–139.
HFRA. 2003. Healthy Forest Restoration Act [H.R.1904]. Public Law 108-148.
Holden, Z. A., P. Morgan, M. A. Crimmins, R. K.Steinhorst, and A. M. S. Smith. 2007. Fire seasonprecipitation variability influences fire extent andseverity in a large southwestern wilderness area,United States. Geophysical Research Letters34:L16708.
Kaufmann, M. R., D. Binkley, P. Z. Fule, M. Johnson, S.L. Stephens, and T. W. Swetnam. 2007. Defining oldgrowth for fire-adapted forests of the westernUnited States. Ecology and Society 12:art15.
Keeler-Wolf, T. 2007. The history of vegetation classi-fication and mapping in California. Pages 1–42 inM. G. Barbour, T. Keller-Wolf, and A. A. Schoen-herr, editors. Terrestrial vegetation of California.University of California Press, Berkeley, California,USA.
Key, C. H., and N. C. Benson. 2006a. Landscapeassessment: ground measure of severity, the Com-posite Burn Index. Pages LA8–LA15 in D. C. Lutes,editor. FIREMON: Fire Effects Monitoring and
v www.esajournals.org 17 September 2012 v Volume 3(9) v Article 80
MILLER ET AL.
Inventory System. USDA Forest Service, RockyMountain Research Station, Fort Collins, Colorado,USA.
Key, C. H., and N. C. Benson. 2006b. Landscapeassessment: remote sensing of severity, the Nor-malized Burn Ratio. Pages LA25–LA41 in D. C.Lutes, editor. FIREMON: Fire Effects Monitoringand Inventory System. USDA Forest Service, RockyMountain Research Station, Fort Collins, Colorado,USA.
Kolden, C. A., J. A. Lutz, C. H. Key, J. T. Kane, and J. W.van Wagtendonk. In press. Mapped versus actualburned area within wildfire perimeters: character-izing the unburned. Forest Ecology and Manage-ment.
Kramer, C. Y. 1956. Extension of multiple range tests togroup means with unequal number of replications.Biometrics 12:307–310.
Landres, P. B., P. Morgan, and F. J. Swanson. 1999.Overview of the use of natural variability conceptsin managing ecological systems. Ecological Appli-cations 9:1179–1188.
Lanner, R. M. 1999. Conifers of California. CachumaPress, Los Olivos, California, USA.
Larson, A. J., and D. Churchill. 2012. Tree spatialpatterns in fire-frequent forests of western NorthAmerica, including mechanisms of pattern forma-tion and implications for designing fuel reductionand restoration treatments. Forest Ecology andManagement 267:74–92.
Laudenslayer, W. F., and H. H. Darr. 1990. Historicaleffects of logging on the forests of the Cascade andSierra Nevada ranges of California. Transactions ofthe Western Section of the Wildlife Society 26:12–23.
Lutz, J., J. van Wagtendonk, A. Thode, J. Miller, and J.Franklin. 2009. Climate, lightning ignitions, andfire severity in Yosemite National Park, California,USA. International Journal of Wildland Fire18:765–774.
Lutz, J. A., A. J. Larson, M. E. Swanson, and J. A.Freund. 2012. Ecological importance of large-diameter trees in a temperate mixed-conifer forest.PLoS ONE 7:e36131.
Luyssaert, S., E. D. Schulze, A. Borner, A. Knohl, D.Hessenmoller, B. E. Law, P. Ciais, and J. Grace.2008. Old-growth forests as global carbon sinks.Nature 455:213–215.
Major, J. 1988. California climate in relation tovegetation. Pages 11–74 in M. G. Barbour and J.Major, editors. Terrestrial vegetation of California.California Native Plant Society, Sacramento, Cal-ifornia, USA.
Miles, S. R., and C. B. Goudey. 1997. Ecologicalsubregions of California: section and subsectiondescriptions. R5-EM-TP-005. USDA Forest Service,Pacific Southwest Region, San Francisco, Califor-
nia, USA.Miller, C., and D. Urban. 2000. Modeling the effects of
fire management alternatives on Sierra Nevadamixed conifer forests. Ecological Applications10:85–94.
Miller, J. D., E. E. Knapp, C. H. Key, C. N. Skinner, C. J.Isbell, R. M. Creasy, and J. W. Sherlock. 2009a.Calibration and validation of the relative differ-enced Normalized Burn Ratio (RdNBR) to threemeasures of fire severity in the Sierra Nevada andKlamath Mountains, California, USA. RemoteSensing of Environment 113:645–656.
Miller, J. D., H. D. Safford, M. A. Crimmins, and A. E.Thode. 2009b. Quantitative evidence for increasingforest fire severity in the Sierra Nevada andsouthern Cascade Mountains, California and Ne-vada, USA. Ecosystems 12:16–32.
Miller, J. D., C. N. Skinner, H. D. Safford, E. E. Knapp,and C. M. Ramirez. 2012. Trends and causes ofseverity, size and number of fires in northwesternCalifornia, USA. Ecological Applications 22:184–203.
Miller, J. D., and A. E. Thode. 2007. Quantifying burnseverity in a heterogeneous landscape with arelative version of the delta Normalized Burn Ratio(dNBR). Remote Sensing of Environment 109:66–80.
Minnich, R. A. 2006. California climate and fireweather. Pages 13–37 in N. G. Sugihara, J. W. VanWagtendonk, J. A. Fites-Kaufman, K. E. Shaffer,and A. E. Thode, editors. Fire in California’secosystems. University of California, Berkeley,California, USA.
Morgan, P., C. C. Hardy, T. W. Swetnam, M. G. Rollins,and D. G. Long. 2001. Mapping fire regimes acrosstime and space: Understanding coarse and fine-scale fire patterns. International Journal of Wild-land Fire 10:329–342.
Naficy, C., A. Sala, E. G. Keeling, J. Graham, and T. H.DeLuca. 2010. Interactive effects of historicallogging and fire exclusion on ponderosa pine foreststructure in the northern Rockies. EcologicalApplications 20:1851–1864.
Nagel, T. A., and A. H. Taylor. 2005. Fire andpersistence of montane chaparral in mixed coniferforest landscapes in the northern Sierra Nevada,Lake Tahoe Basin, California, USA. Journal of theTorrey Botanical Society 132:442–457.
Nicholls, D. L., R. A. Monserud, and D. P. Dykstra.2008. A synthesis of biomass utilization forbioenergy production in the Western United States.General Technical Report PNW-GTR-753. USDAForest Service, Pacific Northwest Research Station,Portland, Oregon, USA.
North, M. P., B. M. Collins, and S. L. Stephens. 2012.Using fire to increase the scale, benefits and futuremaintenance of fuels treatments. Journal of Forest-
v www.esajournals.org 18 September 2012 v Volume 3(9) v Article 80
MILLER ET AL.
ry, in press.Odion, D. C., and C. T. Hanson. 2006. Fire severity in
conifer forests of the Sierra Nevada, California.Ecosystems 9:1177–1189.
Oliver, C. D., and B. C. Larson. 1996. Forest standdynamics. John Wiley & Sons, Hoboken, NewJersey, USA.
Perry, D. A., P. F. Hessburg, C. N. Skinner, T. A. Spies,S. L. Stephens, A. H. Taylor, J. F. Franklin, B.McComb, and G. Riegel. 2011. The ecology ofmixed severity fire regimes in Washington, Oregon,and Northern California. Forest Ecology andManagement 262:703–717.
Pickett, S. T. A., and P. S. White, editors. 1985. Theecology of natural disturbance and patch dynam-ics. Academic Press, New York, New York, USA.
Prichard, S. J., D. L. Peterson, and K. Jacobson. 2010.Fuel treatments reduce the severity of wildfireeffects in dry mixed conifer forest, Washington,USA. Canadian Journal of Forest Research 40:1615–1626.
Pyne, S. J., P. L. Andrews, and R. D. Laven. 1996.Introduction to wildland fire. Second edition. JohnWiley & Sons, New York, New York, USA.
Quinn-Davidson, L. N., and J. M. Varner. 2012.Impediments to prescribed fire across agency,landscape and manager: an example from northernCalifornia. International Journal of Wildland Fire21:210–218.
Riegel, G. M., R. F. Miller, C. N. Skinner, and S. E.Smith. 2006. Northeastern plateaus bioregion.Pages 225–263 in N. G. Sugihara, J. W. VanWagtendonk, J. A. Fites-Kaufman, K. E. Shaffer,and A. E. Thode, editors. Fire in California’secosystems. University of California, Berkeley,California, USA.
Roberts, S. L., J. W. van Wagtendonk, A. K. Miles, andD. A. Kelt. 2011. Effects of fire on spotted owl siteoccupancy in a late-successional forest. BiologicalConservation 144:610–619.
Roberts, S. L., J. W. van Wagtendonk, A. K. Miles, D. A.Kelt, and J. A. Lutz. 2008. Modeling the effects offire severity and spatial complexity on smallmammals in Yosemite National Park, California.Fire Ecology 4(2):83–104.
Rollins, M. G. 2009. LANDFIRE: a nationally consis-tent vegetation, wildland fire, and fuel assessment.International Journal of Wildland Fire 18:235–249.
Rollins, M. G., R. E. Keane, and R. A. Parsons. 2004.Mapping fuels and fire regimes using remotesensing, ecosystem simulation, and gradient mod-eling. Ecological Applications 14:75–95.
Rollins, M. G., P. Morgan, and T. Swetnam. 2002.Landscape-scale controls over 20th century fireoccurrence in two large Rocky Mountain (USA)wilderness areas. Landscape Ecology 17:539–557.
Roman-Cuesta, R. M., M. Gracia, and J. Retana. 2009.
Factors influencing the formation of unburnedforest islands within the perimeter of a large forestfire. Forest Ecology and Management 258:71–80.
Savage, M., and J. N. Mast. 2005. How resilient aresouthwestern ponderosa pine forests after crownfires? Canadian Journal of Forest Research 35:967–977.
Sawyer, J. O., T. Keeler-Wolf, and J. M. Evens. 2008. Amanual of California vegetation. Second edition.California Native Plant Society Press, Sacramento,California, USA.
Schoennagel, T., T. T. Veblen, and W. H. Romme. 2004.The interaction of fire, fuels, and climate acrossRocky Mountain forests. BioScience 54:661–676.
Scholl, A. E., and A. H. Taylor. 2010. Fire regimes,forest change, and self-organization in an old-growth mixed-conifer forest, Yosemite NationalPark, USA. Ecological Applications 20:362–380.
Skinner, C. N., and A. H. Taylor. 2006. SouthernCascades bioregion. Pages 195–224 in N. G.Sugihara, J. W. Van Wagtendonk, J. A. Fites-Kaufman, K. E. Shaffer, and A. E. Thode, editors.Fire in California’s ecosystems. University ofCalifornia, Berkeley, California, USA.
Smith, S. 1991. Revised interim old-growth definitionsfor interior ponderosa pine (SAF 237) in NortheastCalifornia. USDA Forest Service, Pacific SouthwestRegion.
Steelman, T. A., and S. M. McCaffrey. 2011. What islimiting more flexible fire management - public oragency pressure? Journal of Forestry 109:454–461.
Stephens, S. L., R. E. J. Boerner, J. J. Moghaddas, E. E.Y. Moghaddas, B. M. Collins, C. B. Dow, C.Edminster, C. E. Fiedler, D. L. Fry, B. R. Hartsough,J. E. Keeley, E. E. Knapp, J. D. McIver, C. N.Skinner, and A. Youngblood. 2012a. Fuel treatmentimpacts on estimated wildfire carbon loss fromforests in Montana, Oregon, California, and Arizo-na. Ecosphere 3:art38.
Stephens, S. L., D. L. Fry, and E. Franco-Vizcaıno. 2008.Wildfire and spatial patterns in forests in north-western Mexico: The United States wishes it hadsimilar fire problems. Ecology and Society 13:art10.
Stephens, S. L., R. E. Martin, and N. E. Clinton. 2007.Prehistoric fire area and emissions from California’sforests, woodlands, shrublands and grasslands.Forest Ecology and Management 251:205–216.
Stephens, S. L., J. D. McIver, R. E. J. Boerner, C. J.Fettig, J. B. Fontaine, B. R. Hartsough, P. L.Kennedy, and D. W. Schwilk. 2012b. The effects offorest fuel-reduction treatments in the UnitedStates. BioScience 62:549–560.
Stephens, S. L., C. I. Millar, and B. M. Collins. 2010.Operational approaches to managing forests of thefuture in Mediterranean regions within a context ofchanging climates. Environmental Research Letters5(024003):1–9.
v www.esajournals.org 19 September 2012 v Volume 3(9) v Article 80
MILLER ET AL.
Stephens, S. L., and J. J. Moghaddas. 2005. Silviculturaland reserve impacts on potential fire behavior andforest conservation: Twenty-five years of experi-ence from Sierra Nevada mixed conifer forests.Biological Conservation 125:369–379.
Sugihara, N. G., and M. G. Barbour. 2006. Fire andCalifornia vegetation. Pages 1–9 in N. G. Sugihara,J. W. Van Wagtendonk, J. A. Fites-Kaufman, K. E.Shaffer, and A. E. Thode, editors. Fire in Califor-nia’s ecosystems. University of California, Berkeley,California, USA.
Sugihara, N. G., J. W. van Wagtendonk, J. Fites-Kaufman, K. E. Shaffer, and A. E. Thode. 2006a.The future of fire in California’s ecosytems. Pages538–543 in N. G. Sugihara, J. W. Van Wagtendonk,J. Fites-Kaufman, K. E. Shaffer, and A. E. Thode,editors. Fire in California’s ecosystems. Universityof California Press, Berkeley, California, USA.
Sugihara, N. G., J. W. van Wagtendonk, K. E. Shaffer, J.Fites-Kaufman, and A. E. Thode, editors. 2006b.Fire in California’s ecosystems. University ofCalifornia Press, Berkeley, California, USA.
USDA-USDI. 2009. Guidance for Implementation ofFederal Wildland Fire Management Policy. U.S.Department of Agriculture, U.S. Department of theInterior, Boise, Idaho, USA.
USDA. 2004. Sierra Nevada Forest Plan AmendmentFinal Supplemental Environmental Impact State-ment. Technical Report R5-MB-046. USDA ForestService, Pacific Southwest Region.
USDA. 2008. CALVEG zones and alliances: vegetationdescriptions. USDA Forest Service, Pacific South-west Region, Remote Sensing Lab. http://www.fs.usda.gov/detail/r5/landmanagement/resourcemanagement/?cid¼stelprdb5347192
USDA. 2011. Region Five ecological restoration:leadership intent. USDA Forest Service, PacificSouthwest Region.
USDA. 2012. National forest system land managementplanning. Federal Register 77:21162–21276.
Vaillant, N. M., J. A. Fites-Kaufman, and S. L.Stephens. 2009. Effectiveness of prescribed fire as
a fuel treatment in Californian coniferous forests.International Journal of Wildland Fire 18:165–175.
Van de Water, K., and H. D. Safford. 2011. A summaryof fire frequency estimates for California vegetationbefore Euro-American settlement. Fire Ecology7(3):26–58.
van Wagtendonk, J. W. 2007. The history and evolutionof wildland fire use. Fire Ecology 3(2):3–17.
van Wagtendonk, J. W., and J. Fites-Kaufman. 2006.Sierra Nevada bioregion. Pages 264–294 in N. G.Sugihara, J. W. Van Wagtendonk, J. A. Fites-Kaufman, K. E. Shaffer, and A. E. Thode, editors.Fire in California’s ecosystems. University ofCalifornia, Berkeley, California, USA.
van Wagtendonk, J. W., and J. A. Lutz. 2007. Fireregime attributes of wildland fires in YosemiteNational Park, USA. Fire Ecology 3(2):34–52.
van Wagtendonk, J. W., K. A. van Wagtendonk, and A.E. Thode. 2012. Factors associated with the severityof intersecting fires in Yosemite National Park,California, USA. Fire Ecology 8(1):11–31.
van Wagtendonk, K. A. 2012a. Fires in previouslyburned areas: fire severity and vegetation interac-tions in Yosemite National Park. Pages 356–363 inS. Weber, editor. 2011 George Wright SocietyBiennial Conference on Parks, Protected Areas,and Cultural Sites. George Wright Society, Han-cock, Michigan, USA.
van Wagtendonk, K. A. 2012b. Lightning fire ignitionpatterns in Yosemite National Park. Pages 364–371in S. Weber, editor. 2011 George Wright SocietyBiennial Conference on Parks, Protected Areas, andCultural Sites. George Wright Society, Hancock,Michigan, USA.
Winter, G. J., C. Vogt, and J. S. Fried. 2002. Fueltreatments at the wildland-urban interface: com-mon concerns in diverse regions. Journal ofForestry 100:15–21.
WRCC. 2012. California climate tracker. WesternRegional Climate Center. http://www.wrcc.dri.edu/monitor/cal-mon/index.html
v www.esajournals.org 20 September 2012 v Volume 3(9) v Article 80
MILLER ET AL.


