Determining the Correct Mixing and Compaction Temperatures for Using High RAP Content in HMA
Huachun Zhai, Ph.D, P.E.Alejandro Rosales
Erin L. Russell
1. Introduction
2. Objectives
3. Material and Test Methods
4. Results and Discussion
5. Summary of Findings
2017 Idaho Asphalt Conference
10/26/2017 2
57th Idaho Asphalt Conference, October 26, 2017
1
Introduction
2017 Idaho Asphalt Conference
• Significant increase in RAP% in HMA designs in Northwest region
• Washington: Less than 20% in 2014 to amount allowed to meet the target PG grade (Based onBlending Chart)
• Target PG 70-28, RAP grade PG 88.7-16.5
• 20% RAP: PG 65.8-30.8; 40% RAP: PG 59.8-35.7
• Idaho: Open the 20% limit in 2014 to basically 100% Cap at 30% currently
• Based on Blending Chart to the designed grade
• ODOT: 20% RAP and RAS Combined. Pushing for up to 40%.
Introduction
10/26/2017 4
57th Idaho Asphalt Conference, October 26, 2017
2

2017 Idaho Asphalt Conference
Introduction• Problems
• Too many different low temperature grades
• PG 52-34, PG 52-40, PG 58-40, PG 64-40, PG 70-34,PG 76-34, etc
• Mix Design Failures (Repeatability)
• Hamburg (Washington)
• Stripping Inflection Point
• No stripping at 15,000 passes
• Rut Depth
• 10 mm at 15,000 passes
• Immersion-Compression Test (Idaho)
• 85% Retained Strength
10/26/2017 Joe Devol, Presentation at 2014 Washington Asphalt Conference 5
2017 Idaho Asphalt Conference
Introduction
10/26/2017 6
• Current Solutions (It is always the oil):
• Adding antistrip ( up to 1.5%)
• Changing grade
• Changing formulation
• Changing Supplier
• Possible Causes: (It is not always the oil)
• RAP quality (Source/Grade/Gradation)
• Interaction between RAP and Virgin Oil (Coating)
57th Idaho Asphalt Conference, October 26, 2017
3
• Coating of the Agg/RAP
• Not enough binder Need more virgin binder
• Mixing and Compaction (Temperatures too low)
• The mixing and compaction temperatures
• The virgin binder (Low) NCHRP 452
• The blended virgin/RAP binder (Medium)
• The RAP binder (High)
2017 Idaho Asphalt Conference
Introduction
10/26/2017 7
Objectives
57th Idaho Asphalt Conference, October 26, 2017
4

2017 Idaho Asphalt Conference
Objectives
10/26/2017 9
• Will higher mixing and compaction temperatures affect the OAC for HMA using RAP ?
• NCHRP 9-36: SGC compaction process is insensitive to binder stiffness
• FHWA/TX-11/0-6092-2: Increasing the mixing and compaction temperatures significantly lowersthe OAC
• Will higher mixing and compaction temperatures affect the mechanical properties for HMA using RAP ?
• NCHRP 9-36: Mechanical tests on HMA are affected by mixing and compaction temperatures
• FHWA/TX-11/0-6092-2: Lower temperature higher OAC More Durable Mixes
Materials and Test Methods
57th Idaho Asphalt Conference, October 26, 2017
5
2017 Idaho Asphalt Conference
Materials and Test Methods
10/26/2017 11
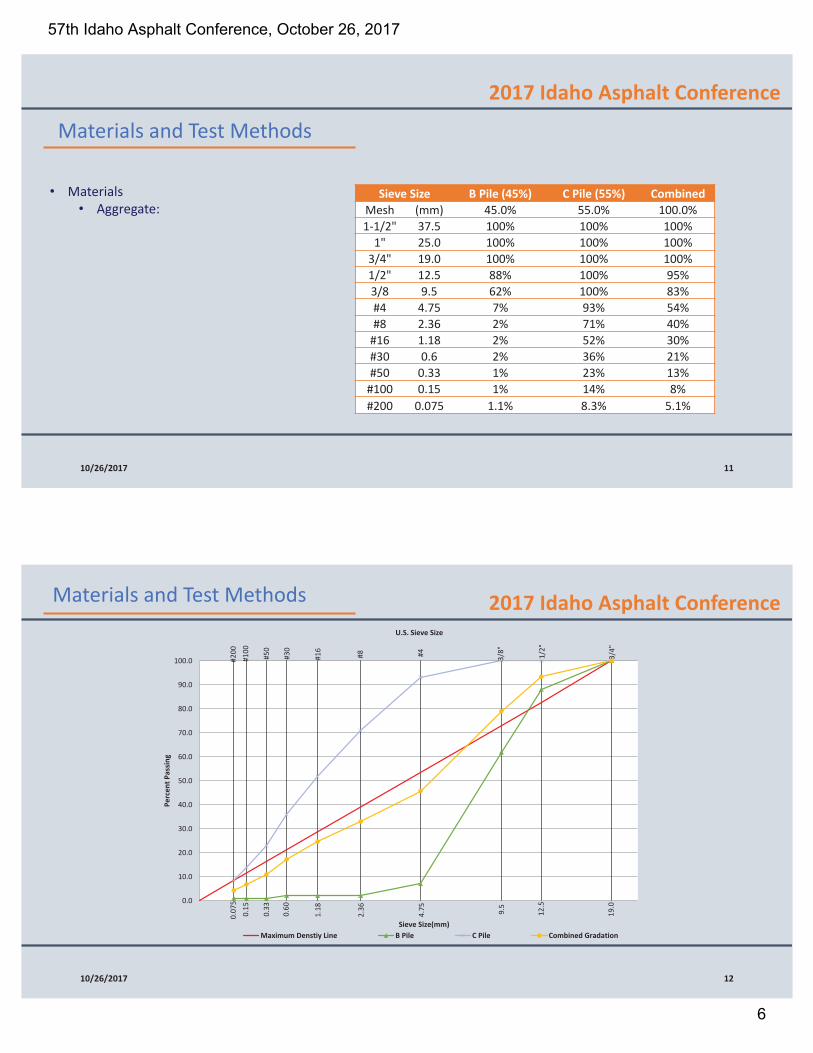
Sieve Size B Pile (45%) C Pile (55%) CombinedMesh (mm) 45.0% 55.0% 100.0%1-1/2" 37.5 100% 100% 100%
1" 25.0 100% 100% 100%3/4" 19.0 100% 100% 100%1/2" 12.5 88% 100% 95%3/8 9.5 62% 100% 83%#4 4.75 7% 93% 54%#8 2.36 2% 71% 40%
#16 1.18 2% 52% 30%#30 0.6 2% 36% 21%#50 0.33 1% 23% 13%
#100 0.15 1% 14% 8%#200 0.075 1.1% 8.3% 5.1%
• Materials• Aggregate:
19.0
3/4"
12.5
1/2"
9.5
3/8"
4.75
#4
2.36
#8
1.18
#16
0.60
#30
0.33
#50
0.15
#100
0.07
5#2
00
0.0
10.0
20.0
30.0
40.0
50.0
60.0
70.0
80.0
90.0
100.0
Perc
ent P
assin
g
Sieve Size(mm)Maximum Denstiy Line B Pile C Pile Combined Gradation
U.S. Sieve Size
2017 Idaho Asphalt ConferenceMaterials and Test Methods
10/26/2017 12
57th Idaho Asphalt Conference, October 26, 2017
6
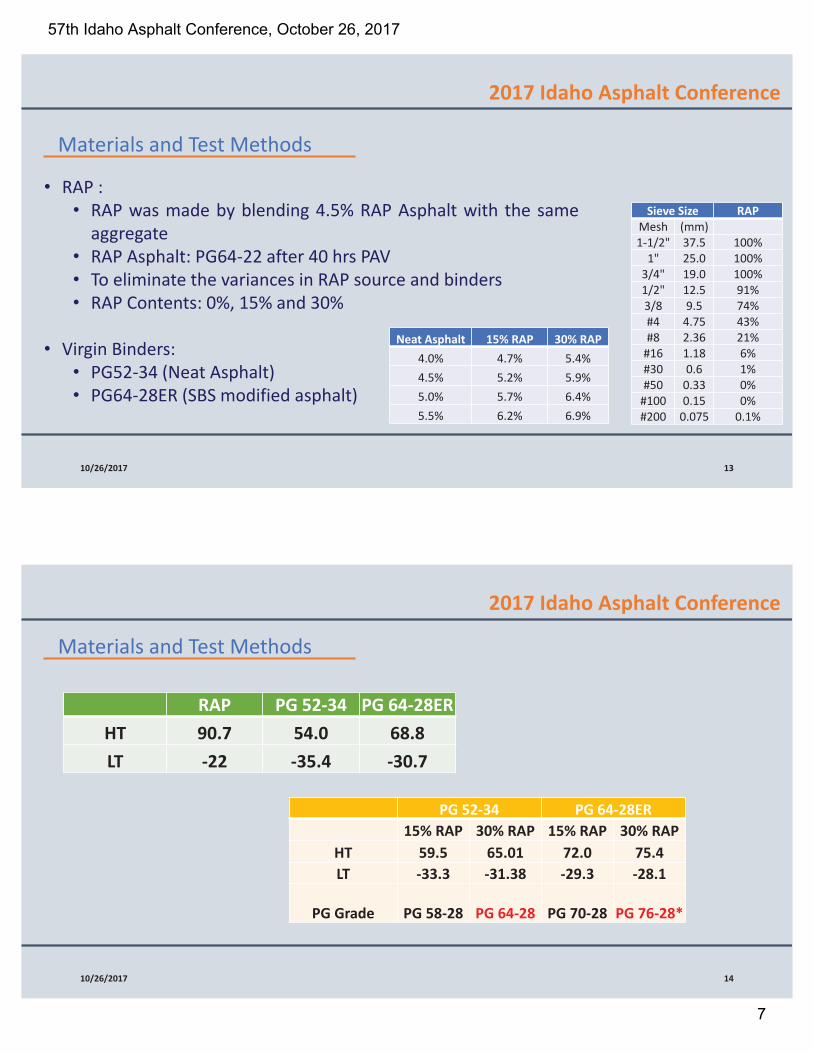
• RAP :• RAP was made by blending 4.5% RAP Asphalt with the same
aggregate• RAP Asphalt: PG64-22 after 40 hrs PAV• To eliminate the variances in RAP source and binders• RAP Contents: 0%, 15% and 30%
• Virgin Binders:• PG52-34 (Neat Asphalt)• PG64-28ER (SBS modified asphalt)
2017 Idaho Asphalt Conference
Materials and Test Methods
10/26/2017 13
Sieve Size RAPMesh (mm)1-1/2" 37.5 100%
1" 25.0 100%3/4" 19.0 100%1/2" 12.5 91%3/8 9.5 74%#4 4.75 43%#8 2.36 21%
#16 1.18 6%#30 0.6 1%#50 0.33 0%
#100 0.15 0%#200 0.075 0.1%
Neat Asphalt 15% RAP 30% RAP4.0% 4.7% 5.4%4.5% 5.2% 5.9%5.0% 5.7% 6.4%5.5% 6.2% 6.9%
2017 Idaho Asphalt Conference
Materials and Test Methods
10/26/2017 14
RAP PG 52-34 PG 64-28ERHT 90.7 54.0 68.8LT -22 -35.4 -30.7
PG 52-34 PG 64-28ER15% RAP 30% RAP 15% RAP 30% RAP
HT 59.5 65.01 72.0 75.4LT -33.3 -31.38 -29.3 -28.1
PG Grade PG 58-28 PG 64-28 PG 70-28 PG 76-28*
57th Idaho Asphalt Conference, October 26, 2017
7
2017 Idaho Asphalt Conference
Materials and Test Methods
10/26/2017 15
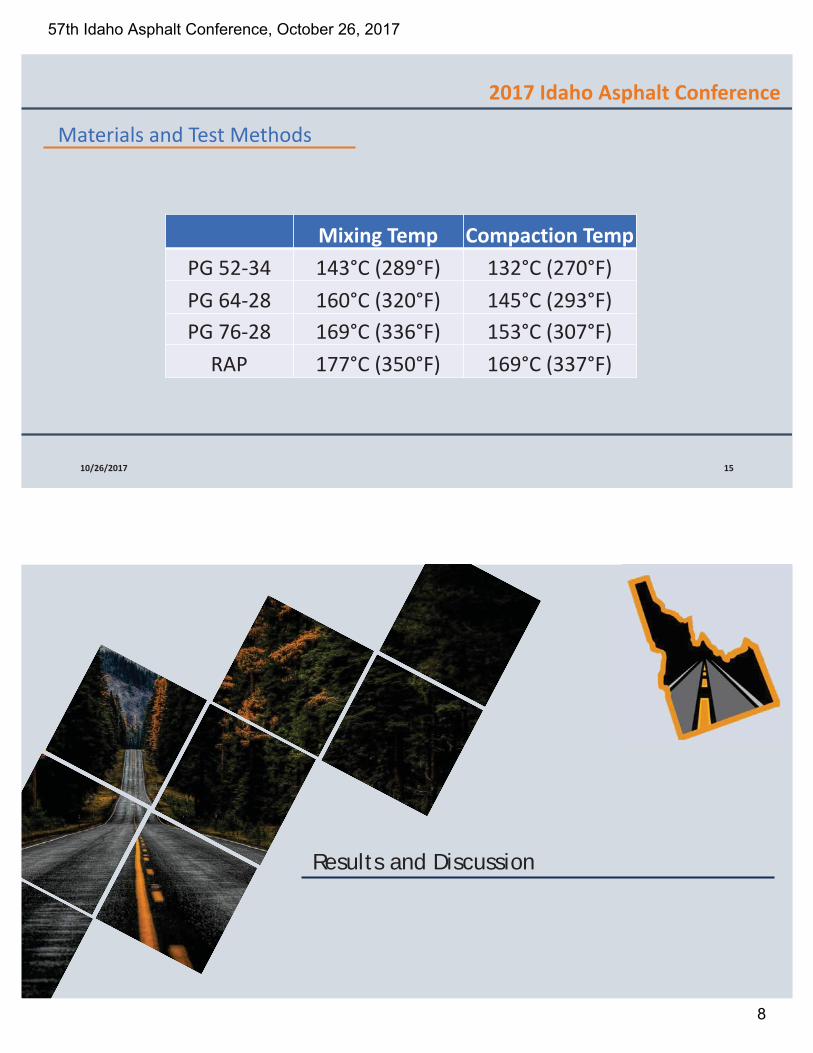
Mixing Temp Compaction TempPG 52-34 143°C (289°F) 132°C (270°F)PG 64-28 160°C (320°F) 145°C (293°F)PG 76-28 169°C (336°F) 153°C (307°F)
RAP 177°C (350°F) 169°C (337°F)
Results and Discussion
57th Idaho Asphalt Conference, October 26, 2017
8
2017 Idaho Asphalt Conference
Results and Discussion
10/26/2017 17
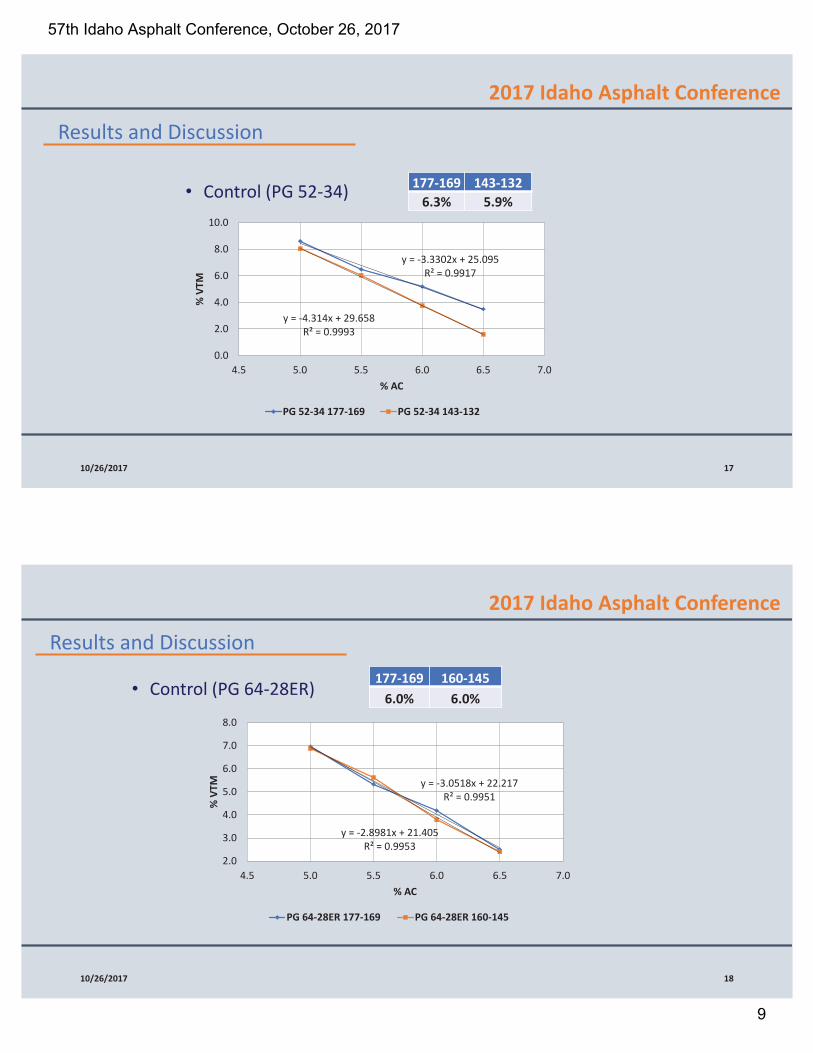
y = -3.3302x + 25.095R² = 0.9917
y = -4.314x + 29.658R² = 0.9993
0.0
2.0
4.0
6.0
8.0
10.0
4.5 5.0 5.5 6.0 6.5 7.0
% V
TM
% AC
PG 52-34 177-169 PG 52-34 143-132
• Control (PG 52-34) 177-169 143-1326.3% 5.9%
2017 Idaho Asphalt Conference
Results and Discussion
10/26/2017 18
• Control (PG 64-28ER) 177-169 160-1456.0% 6.0%
y = -2.8981x + 21.405R² = 0.9953
y = -3.0518x + 22.217R² = 0.9951
2.0
3.0
4.0
5.0
6.0
7.0
8.0
4.5 5.0 5.5 6.0 6.5 7.0
% V
TM
% AC
PG 64-28ER 177-169 PG 64-28ER 160-145
57th Idaho Asphalt Conference, October 26, 2017
9

2017 Idaho Asphalt Conference
Results and Discussion
10/26/2017 19
PG52-34 PG64-28ER135°C 235 mPas 624 mPas150°C 127 mPas 326 mPas165°C 69 mPas 186 mPas
• Absorption:• At 177C, PG52-34 viscosity around 40 mPas; PG64-28ER, 123 mPas
• Polymer network may limited the extend of absorption.
2017 Idaho Asphalt ConferenceResults and Discussion
10/26/2017 20
y = -3.12x + 23.476R² = 0.9901
y = -3.0938x + 23.764R² = 0.9597
1.0
2.0
3.0
4.0
5.0
6.0
7.0
8.0
9.0
10.0
3.5 4.0 4.5 5.0 5.5 6.0 6.5 7.0 7.5
% V
TM
% AC
PG 52-34 15% RAP 177-169 PG 52-34 30% RAP 177-169 PG52-34 0% RAP
0% 15% 30%6.3 6.2 6.4
57th Idaho Asphalt Conference, October 26, 2017
10

y = -3.2953x + 24.346R² = 0.978
y = -4.5589x + 32.41R² = 0.9972
1.0
2.0
3.0
4.0
5.0
6.0
7.0
8.0
9.0
10.0
3.5 4.0 4.5 5.0 5.5 6.0 6.5 7.0 7.5
% V
TM
% AC
PG 64-28ER 15% RAP 177-169 PG 64-28ER 30% RAP 177-169 PG64-28ER 0% RAP
2017 Idaho Asphalt ConferenceResults and Discussion
10/26/2017 21
0% 15% 30%6.0% 6.2% 6.2%
2017 Idaho Asphalt Conference
Results and Discussion
10/26/2017 22
RAP % has no effect on OAC (Total AC) at temperatures between Neat and target PG
PG52-34 PG64-28ER
Temp 0 15 30 Temp 0 15 30
177/169 6.3 6.2 6.4 177/169 6.0 6.2 6.2
160/145 N/A 5.8 5.9 169/153 N/A 6.1 6.3
143/132 5.9 5.9 6.0 160/145 6.0 6.1 6.1
57th Idaho Asphalt Conference, October 26, 2017
11
2017 Idaho Asphalt Conference
Results and Discussion
10/26/2017 23
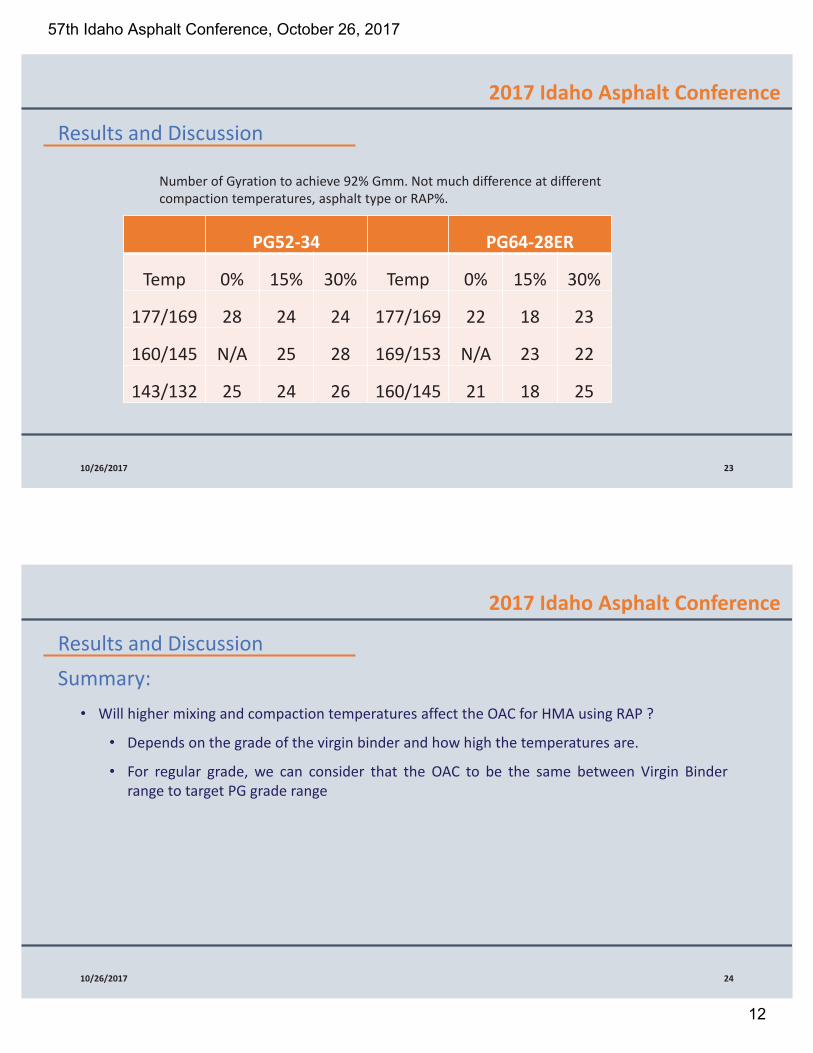
Number of Gyration to achieve 92% Gmm. Not much difference at differentcompaction temperatures, asphalt type or RAP%.
PG52-34 PG64-28ER
Temp 0% 15% 30% Temp 0% 15% 30%
177/169 28 24 24 177/169 22 18 23
160/145 N/A 25 28 169/153 N/A 23 22
143/132 25 24 26 160/145 21 18 25
2017 Idaho Asphalt Conference
Results and Discussion
10/26/2017 24
Summary:• Will higher mixing and compaction temperatures affect the OAC for HMA using RAP ?
• Depends on the grade of the virgin binder and how high the temperatures are.
• For regular grade, we can consider that the OAC to be the same between Virgin Binderrange to target PG grade range
57th Idaho Asphalt Conference, October 26, 2017
12

Results and Discussion
Performance Testing: Hamburg
2017 Idaho Asphalt Conference
10/26/2017 26
Performance Testing: Hamburg
James Cox & Sons, Hamburg Wheel TrackerMike Anderson AI Presentation Spring 2002 Meeting, Houston, TX
62.0 mm
AASHTO T324
• 62.0 mm height• 150 mm diameter• 7.0%±1.0% air voids
Stripping Slope
Rutting Slope
Inflection Point
Load Cycles
Rut D
epth
• Minimum Criteria WSDOT• 50°C • 10 mm Rut Depth at
15,000 passes• No stripping at
15,000 passes
57th Idaho Asphalt Conference, October 26, 2017
13
2017 Idaho Asphalt Conference
10/26/2017 27
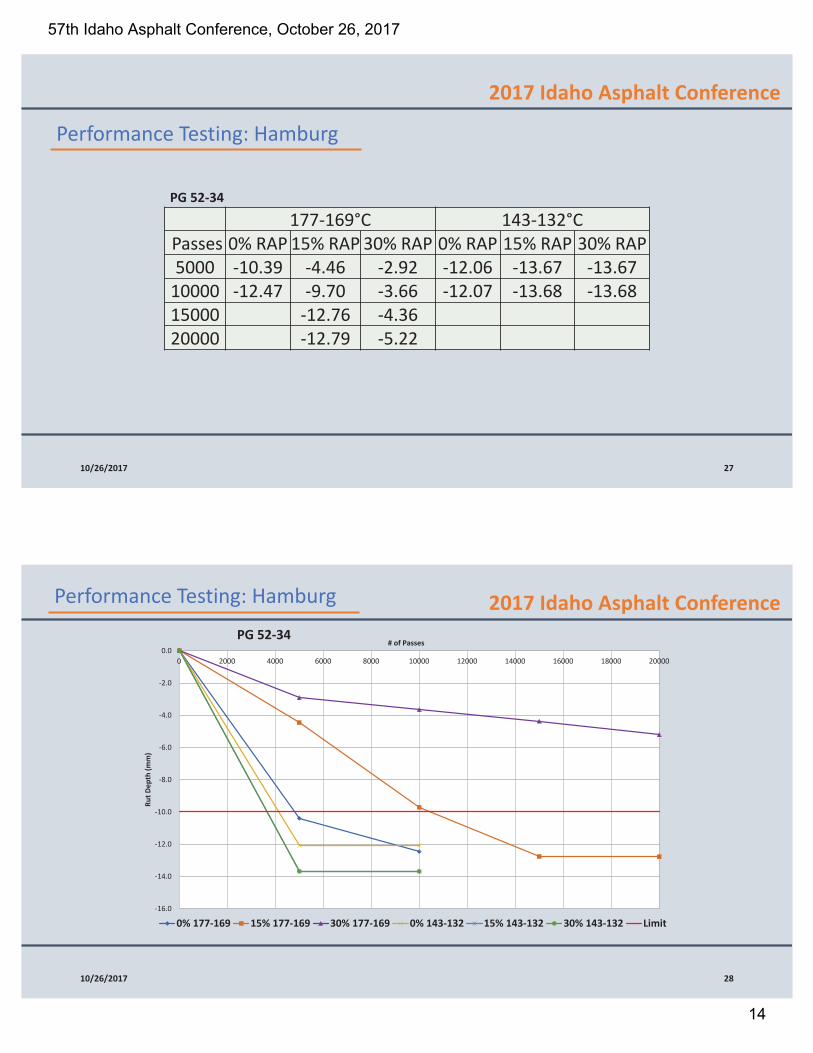
177-169°C 143-132°CPasses 0% RAP 15% RAP 30% RAP 0% RAP 15% RAP 30% RAP5000 -10.39 -4.46 -2.92 -12.06 -13.67 -13.67
10000 -12.47 -9.70 -3.66 -12.07 -13.68 -13.6815000 -12.76 -4.3620000 -12.79 -5.22
PG 52-34
Performance Testing: Hamburg
-16.0
-14.0
-12.0
-10.0
-8.0
-6.0
-4.0
-2.0
0.00 2000 4000 6000 8000 10000 12000 14000 16000 18000 20000
Rut D
epth
(mm
)
# of PassesPG 52-34
0% 177-169 15% 177-169 30% 177-169 0% 143-132 15% 143-132 30% 143-132 Limit
2017 Idaho Asphalt Conference
10/26/2017 28
Performance Testing: Hamburg
57th Idaho Asphalt Conference, October 26, 2017
14
2017 Idaho Asphalt Conference
10/26/2017 29
Performance Testing: Hamburg
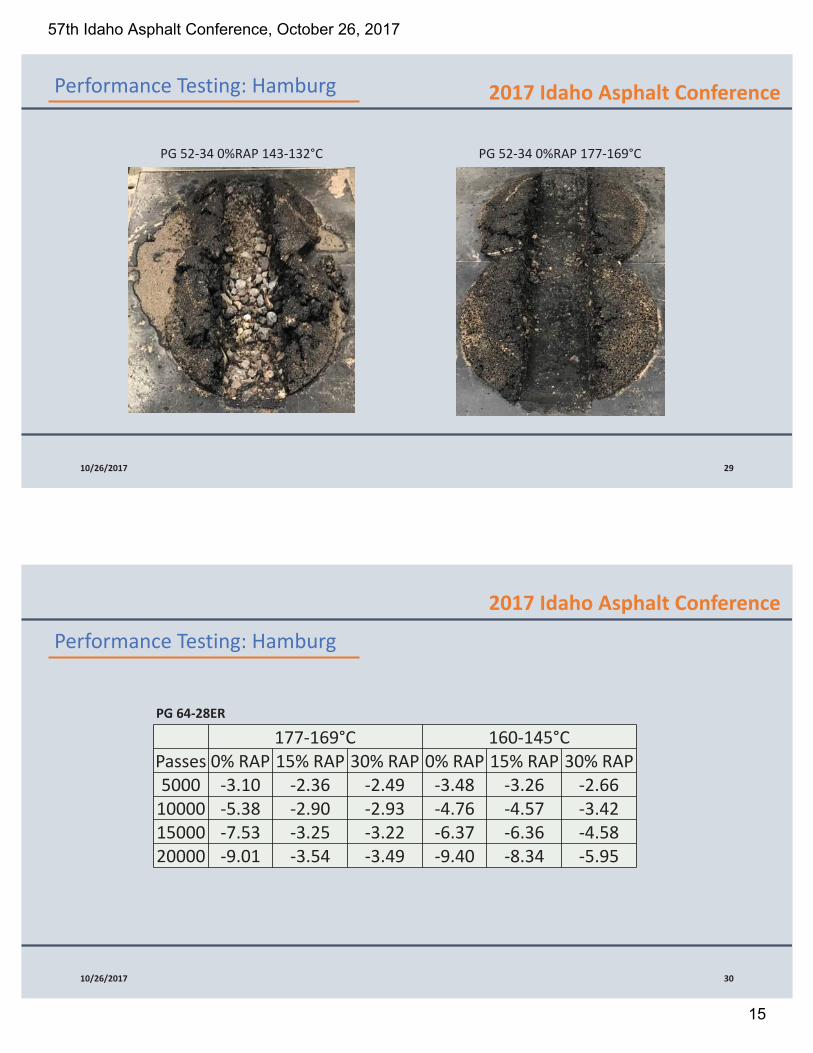
PG 52-34 0%RAP 143-132°C PG 52-34 0%RAP 177-169°C
2017 Idaho Asphalt Conference
10/26/2017 30
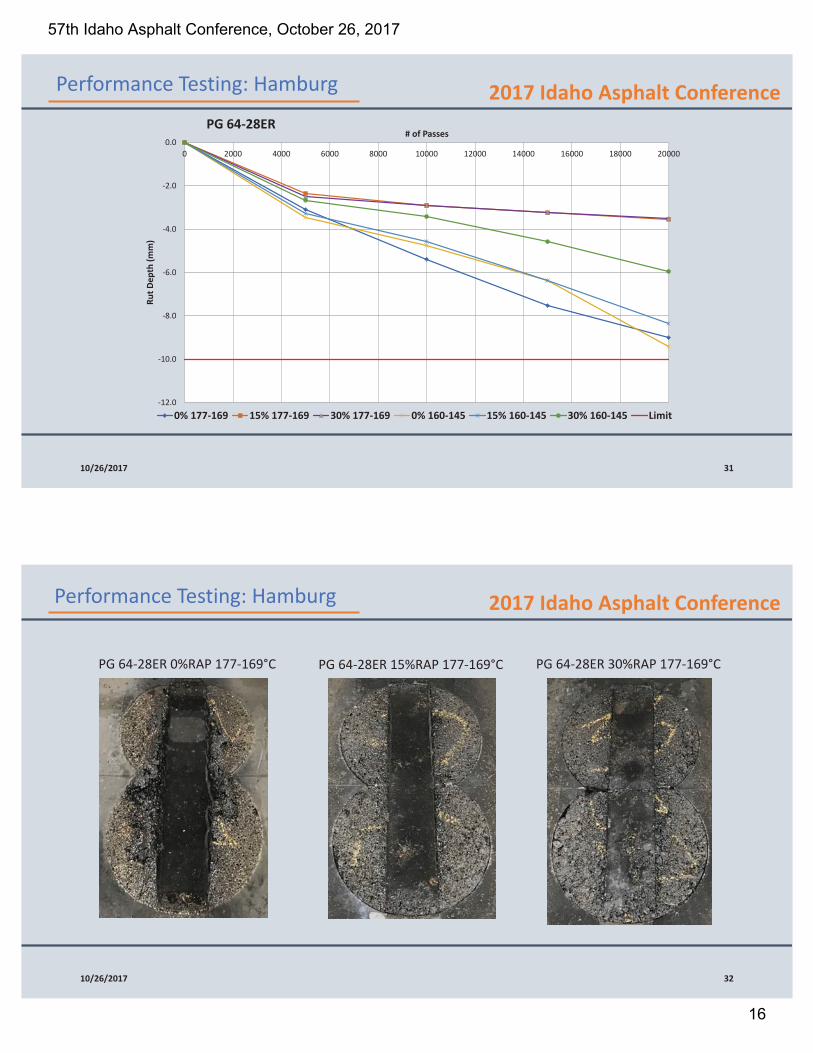
177-169°C 160-145°CPasses 0% RAP 15% RAP 30% RAP 0% RAP 15% RAP 30% RAP5000 -3.10 -2.36 -2.49 -3.48 -3.26 -2.66
10000 -5.38 -2.90 -2.93 -4.76 -4.57 -3.4215000 -7.53 -3.25 -3.22 -6.37 -6.36 -4.5820000 -9.01 -3.54 -3.49 -9.40 -8.34 -5.95
PG 64-28ER
Performance Testing: Hamburg
57th Idaho Asphalt Conference, October 26, 2017
15
-12.0
-10.0
-8.0
-6.0
-4.0
-2.0
0.00 2000 4000 6000 8000 10000 12000 14000 16000 18000 20000
Rut D
epth
(mm
)
# of PassesPG 64-28ER
0% 177-169 15% 177-169 30% 177-169 0% 160-145 15% 160-145 30% 160-145 Limit
2017 Idaho Asphalt Conference
10/26/2017 31
Performance Testing: Hamburg
2017 Idaho Asphalt Conference
10/26/2017 32
Performance Testing: Hamburg
PG 64-28ER 0%RAP 177-169°C PG 64-28ER 15%RAP 177-169°C PG 64-28ER 30%RAP 177-169°C
57th Idaho Asphalt Conference, October 26, 2017
16
2017 Idaho Asphalt Conference
10/26/2017 33
Performance Testing: Hamburg
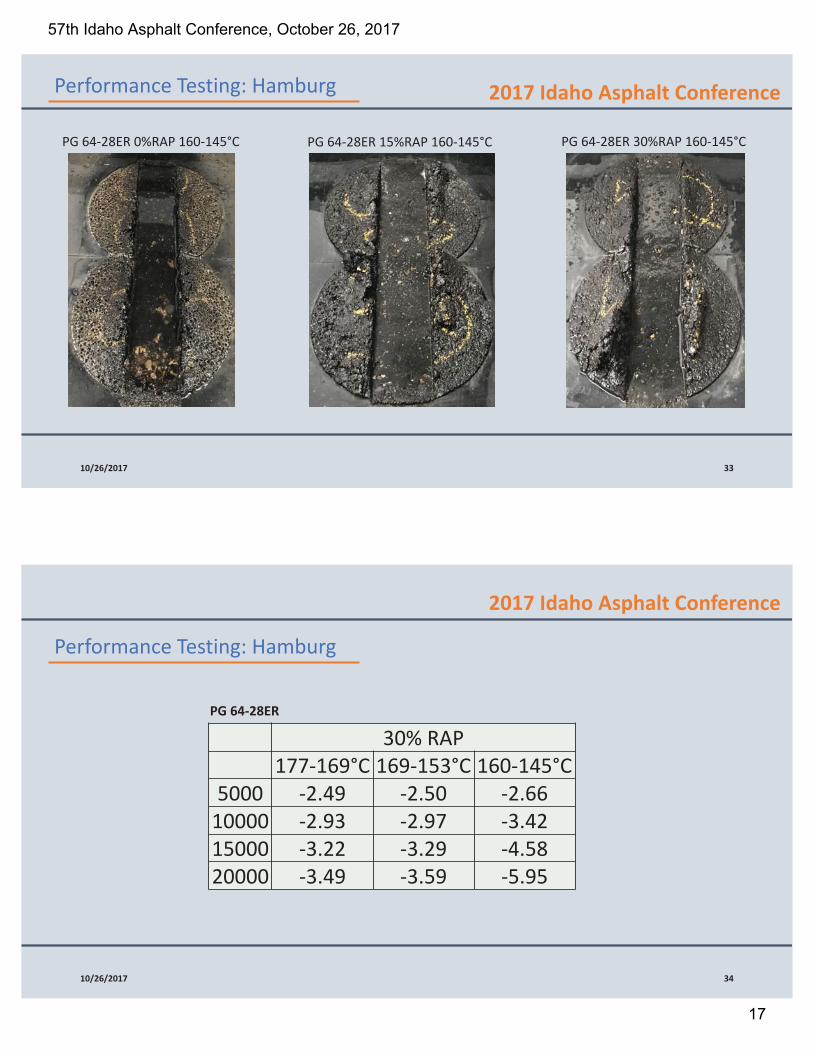
PG 64-28ER 0%RAP 160-145°C PG 64-28ER 15%RAP 160-145°C PG 64-28ER 30%RAP 160-145°C
2017 Idaho Asphalt Conference
10/26/2017 34
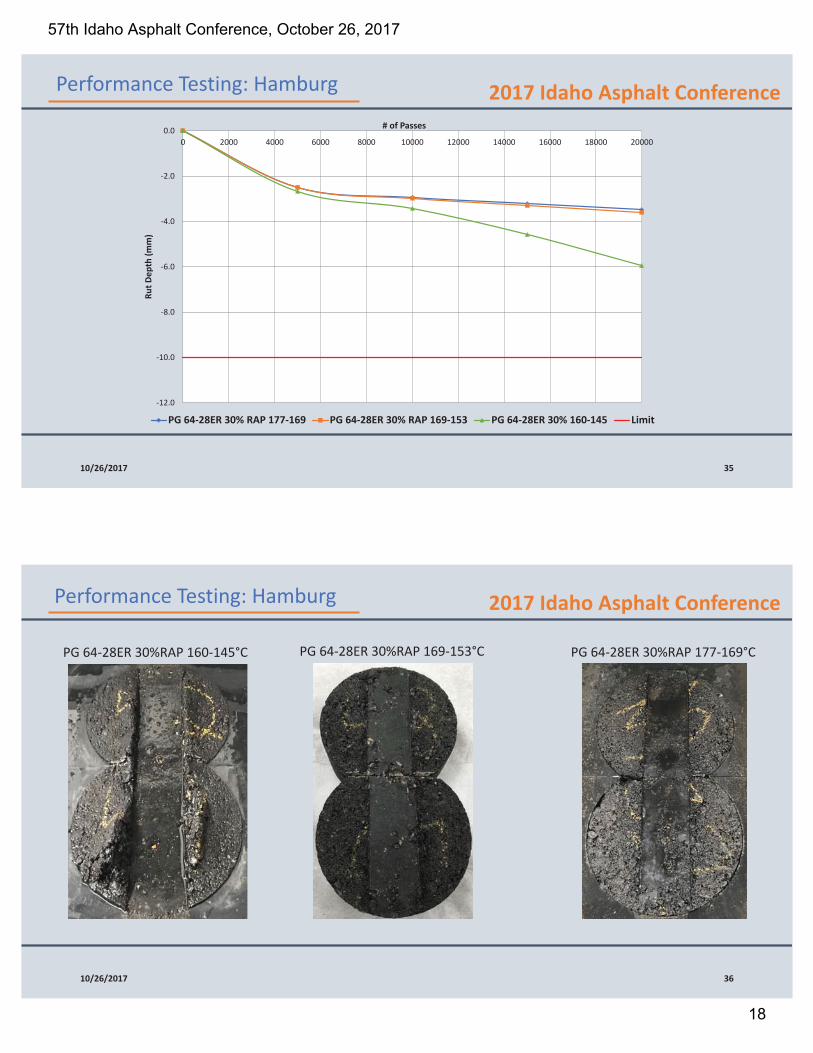
Performance Testing: Hamburg
30% RAP177-169°C 169-153°C 160-145°C
5000 -2.49 -2.50 -2.6610000 -2.93 -2.97 -3.4215000 -3.22 -3.29 -4.5820000 -3.49 -3.59 -5.95
PG 64-28ER
57th Idaho Asphalt Conference, October 26, 2017
17
-12.0
-10.0
-8.0
-6.0
-4.0
-2.0
0.00 2000 4000 6000 8000 10000 12000 14000 16000 18000 20000
Rut D
epth
(mm
)
# of Passes
PG 64-28ER 30% RAP 177-169 PG 64-28ER 30% RAP 169-153 PG 64-28ER 30% 160-145 Limit
2017 Idaho Asphalt Conference
10/26/2017 35
Performance Testing: Hamburg
2017 Idaho Asphalt Conference
10/26/2017 36
Performance Testing: Hamburg
PG 64-28ER 30%RAP 160-145°C PG 64-28ER 30%RAP 177-169°C PG 64-28ER 30%RAP 169-153°C
57th Idaho Asphalt Conference, October 26, 2017
18
Results and Discussion
Performance Testing: Tensile Strength Ratio
2017 Idaho Asphalt Conference
Results and Discussion
10/26/2017 38
Performance Testing: Tensile Strength Ratio AASHTO T283 (Modified Lottman Test)• Method 1: Freeze Thaw Cycle• Method 2: No Freeze Thaw Cycle• 3 Samples prepared for each condition
Tens
ile Lo
ad (l
bf)
Time (sec)
Peak Load at Failure
S=S= ( )P= ( )D= ( )t= ( )
• Method 1: Freeze Thaw Cycle• 70%-80% Vacuum Saturation• 16 hr -18°C Freeze Cycle• 24 hr 60°C Thaw Cycle• 2 hr 25°C Equilibration Cycle
• Method 2: No Freeze Thaw Cycle• 70%-80% Vacuum Saturation• 24 hr 60°C Conditioning Cycle• 2 hr 25°C Equilibration Cycle
Loading Rate: 2 in/min (50 mm/min)
(%) = ,,
Minimum TSR value 80%
57th Idaho Asphalt Conference, October 26, 2017
19
2017 Idaho Asphalt Conference
Results and Discussion
10/26/2017 39
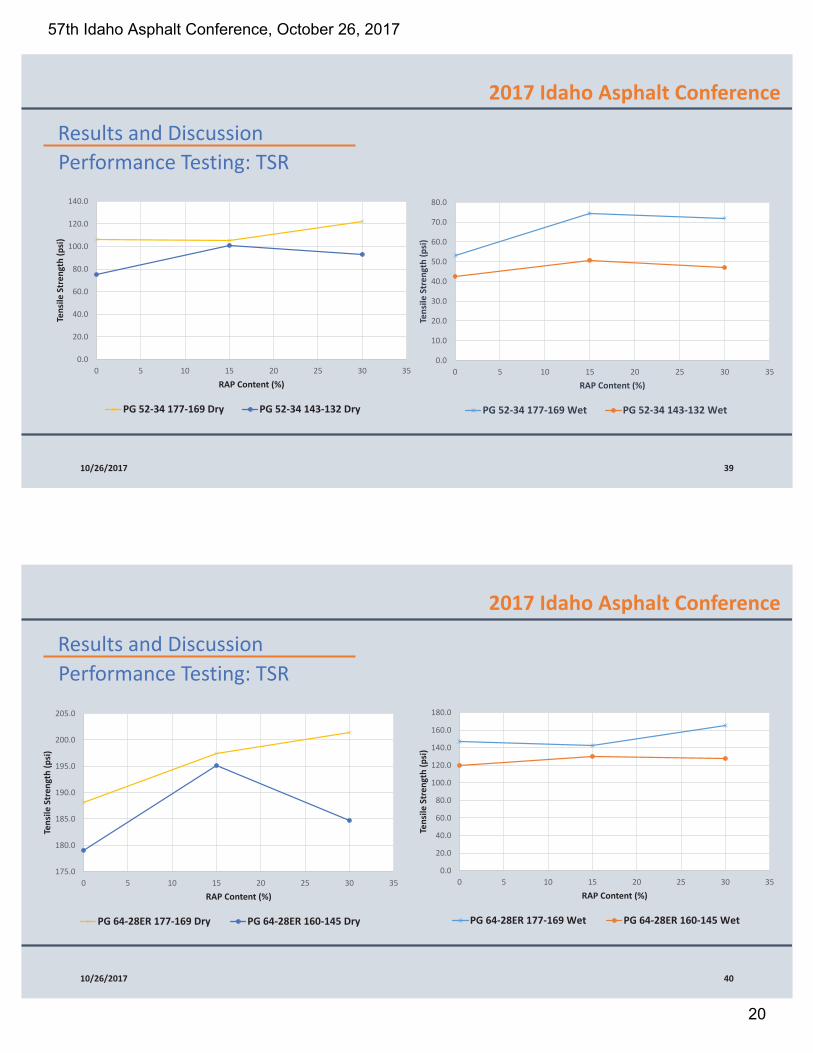
Performance Testing: TSR
0.0
20.0
40.0
60.0
80.0
100.0
120.0
140.0
0 5 10 15 20 25 30 35
Tens
ile S
tren
gth
(psi)
RAP Content (%)
PG 52-34 177-169 Dry PG 52-34 143-132 Dry
0.0
10.0
20.0
30.0
40.0
50.0
60.0
70.0
80.0
0 5 10 15 20 25 30 35
Tens
ile S
tren
gth
(psi)
RAP Content (%)
PG 52-34 177-169 Wet PG 52-34 143-132 Wet
2017 Idaho Asphalt Conference
Results and Discussion
10/26/2017 40
Performance Testing: TSR
175.0
180.0
185.0
190.0
195.0
200.0
205.0
0 5 10 15 20 25 30 35
Tens
ile S
tren
gth
(psi)
RAP Content (%)
PG 64-28ER 177-169 Dry PG 64-28ER 160-145 Dry
0.0
20.0
40.0
60.0
80.0
100.0
120.0
140.0
160.0
180.0
0 5 10 15 20 25 30 35
Tens
ile S
tren
gth
(psi)
RAP Content (%)
PG 64-28ER 177-169 Wet PG 64-28ER 160-145 Wet
57th Idaho Asphalt Conference, October 26, 2017
20
2017 Idaho Asphalt ConferenceResults and Discussion
10/26/2017 41
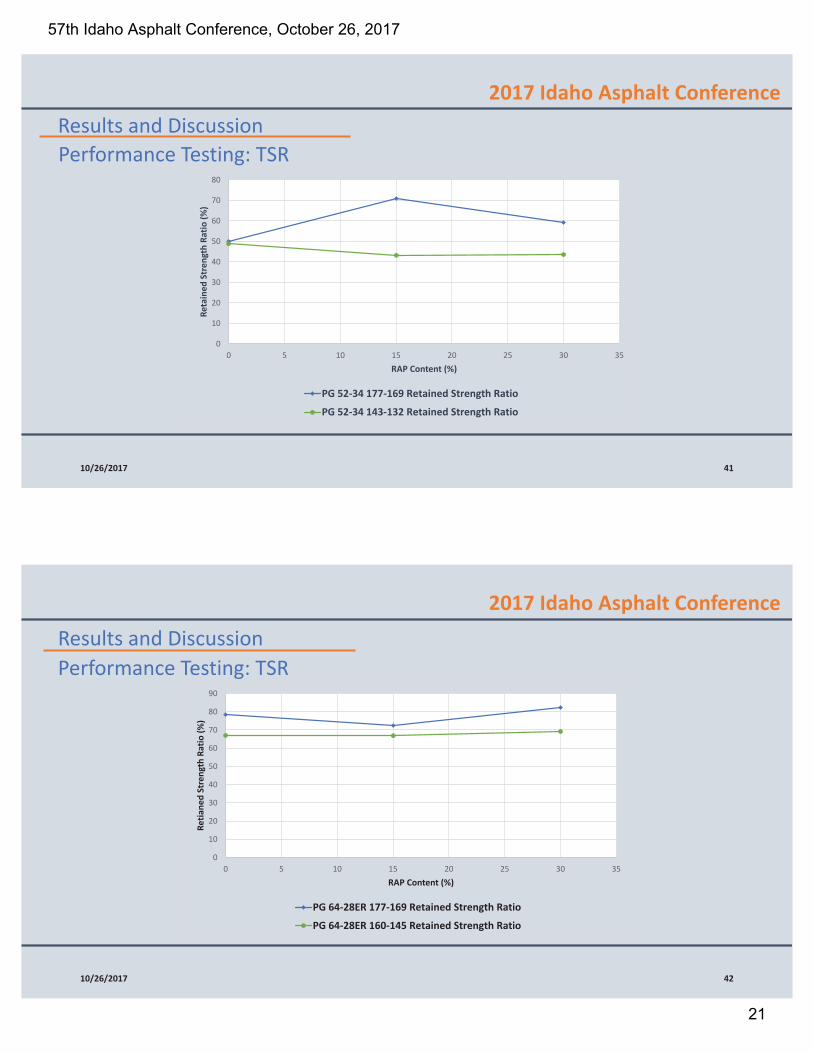
Performance Testing: TSR
0
10
20
30
40
50
60
70
80
0 5 10 15 20 25 30 35
Reta
ined
Str
engt
h Ra
tio (%
)
RAP Content (%)
PG 52-34 177-169 Retained Strength RatioPG 52-34 143-132 Retained Strength Ratio
2017 Idaho Asphalt ConferenceResults and Discussion
10/26/2017 42
Performance Testing: TSR
0
10
20
30
40
50
60
70
80
90
0 5 10 15 20 25 30 35
Retia
ned
Stre
ngth
Rat
io (%
)
RAP Content (%)
PG 64-28ER 177-169 Retained Strength RatioPG 64-28ER 160-145 Retained Strength Ratio
57th Idaho Asphalt Conference, October 26, 2017
21
Results and Discussion
Performance Testing: Immersion Compression
2017 Idaho Asphalt Conference
Results and Discussion
10/26/2017 44
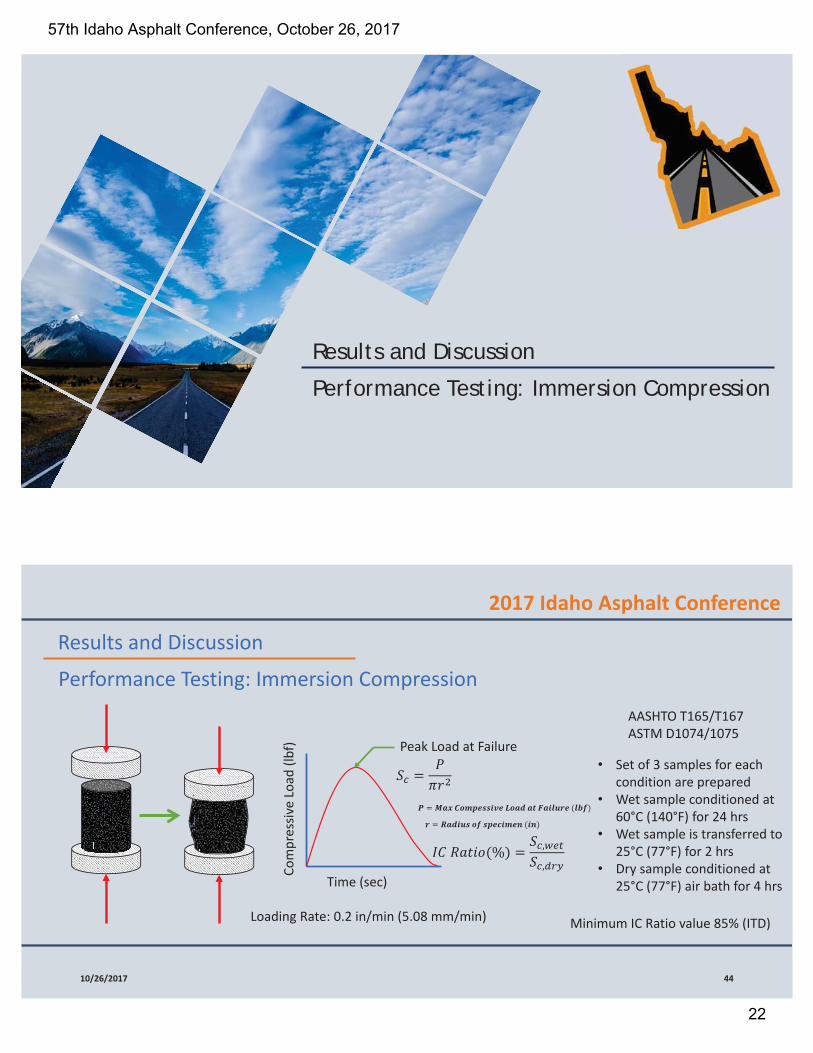
Performance Testing: Immersion CompressionAASHTO T165/T167ASTM D1074/1075
Com
pres
sive
Load
(lbf
)
Time (sec)
Peak Load at Failure
Loading Rate: 0.2 in/min (5.08 mm/min)
• Set of 3 samples for each condition are prepared
• Wet sample conditioned at 60°C (140°F) for 24 hrs
• Wet sample is transferred to 25°C (77°F) for 2 hrs
• Dry sample conditioned at 25°C (77°F) air bath for 4 hrs
== ( )= ( )
Minimum IC Ratio value 85% (ITD)
(%) = ,,
57th Idaho Asphalt Conference, October 26, 2017
22

2017 Idaho Asphalt Conference
Results and Discussion
10/26/2017 45
Performance Testing: Immersion Compression
0
50
100
150
200
250
300
350
400
450
500
0 5 10 15 20 25 30 35
Com
pres
sive
Stre
ngth
(psi)
RAP Content (%)
PG 52-34 177-169 Dry PG 52-34 143-132 Dry
0
50
100
150
200
250
300
350
400
450
0 5 10 15 20 25 30 35
Com
pres
sive
Stre
ngth
(psi)
RAP Content (%)
PG 52-34 177-169 Wet PG 52-34 143-132 Wet
2017 Idaho Asphalt Conference
Results and Discussion
10/26/2017 46
Performance Testing: Immersion Compression
500
520
540
560
580
600
620
640
0 5 10 15 20 25 30 35
Com
pres
sive
Stre
ngth
(psi)
RAP Content (%)
PG 64-28ER 177-169 Dry PG 64-28ER 160-145 Dry
0
100
200
300
400
500
600
700
0 5 10 15 20 25 30 35
Com
pres
sive
Stre
ngth
(psi)
RAP Content (%)
PG 64-28ER 177-169 Wet PG 64-28ER 160-145 Wet
57th Idaho Asphalt Conference, October 26, 2017
23
2017 Idaho Asphalt Conference
Results and Discussion
10/26/2017 47
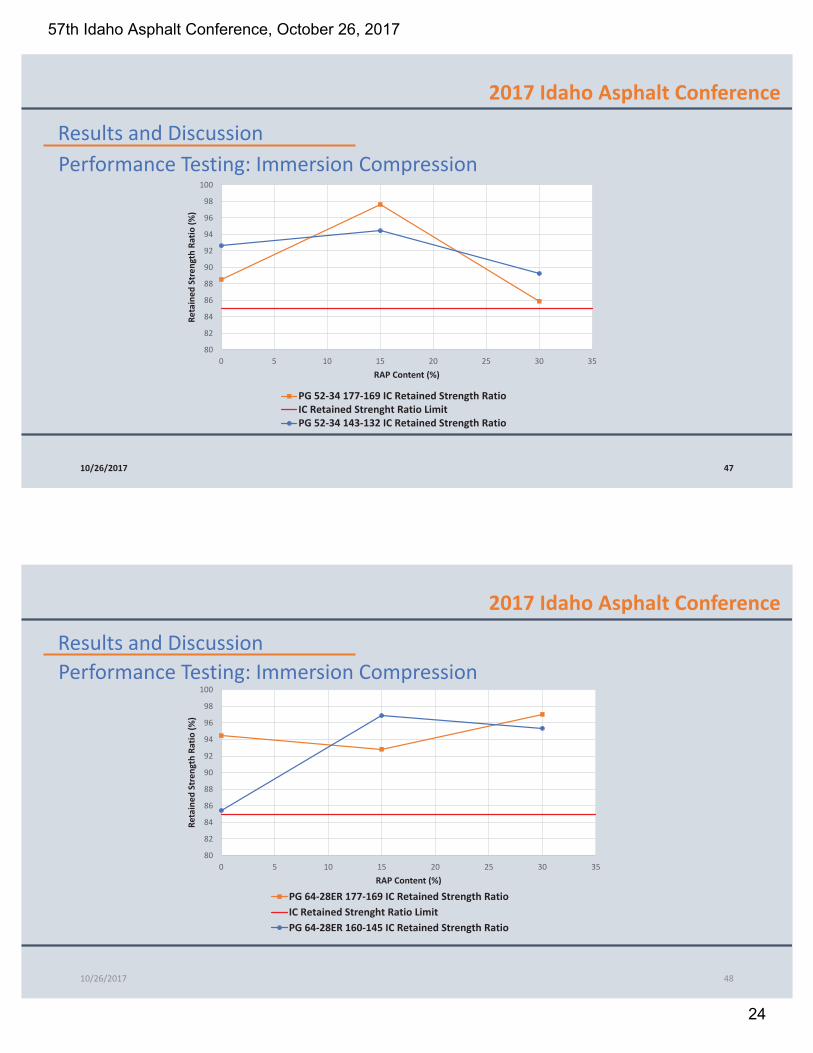
Performance Testing: Immersion Compression
80
82
84
86
88
90
92
94
96
98
100
0 5 10 15 20 25 30 35
Reta
ined
Str
engt
h Ra
tio (%
)
RAP Content (%)
PG 52-34 177-169 IC Retained Strength RatioIC Retained Strenght Ratio LimitPG 52-34 143-132 IC Retained Strength Ratio
2017 Idaho Asphalt Conference
Results and Discussion
10/26/2017 48
Performance Testing: Immersion Compression
80
82
84
86
88
90
92
94
96
98
100
0 5 10 15 20 25 30 35
Reta
ined
Str
engt
h Ra
tio (%
)
RAP Content (%)
PG 64-28ER 177-169 IC Retained Strength RatioIC Retained Strenght Ratio LimitPG 64-28ER 160-145 IC Retained Strength Ratio
57th Idaho Asphalt Conference, October 26, 2017
24
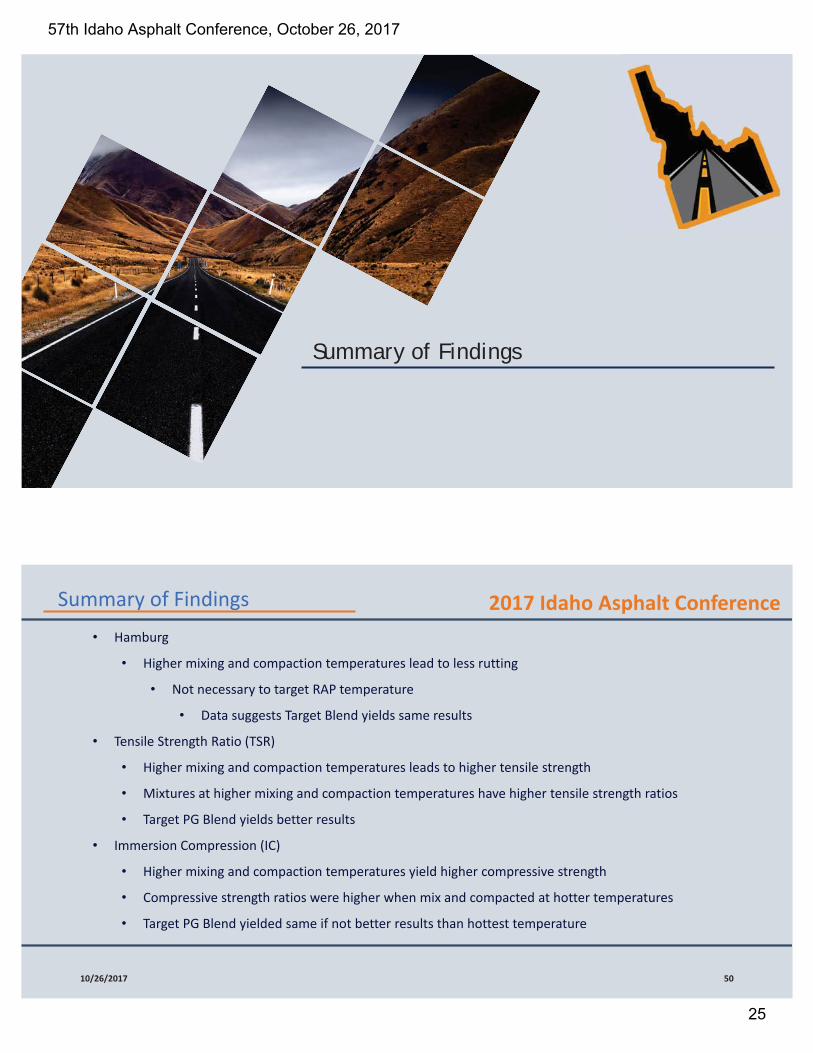
Summary of Findings
2017 Idaho Asphalt Conference
10/26/2017 50
• Hamburg
• Higher mixing and compaction temperatures lead to less rutting
• Not necessary to target RAP temperature
• Data suggests Target Blend yields same results
• Tensile Strength Ratio (TSR)
• Higher mixing and compaction temperatures leads to higher tensile strength
• Mixtures at higher mixing and compaction temperatures have higher tensile strength ratios
• Target PG Blend yields better results
• Immersion Compression (IC)
• Higher mixing and compaction temperatures yield higher compressive strength
• Compressive strength ratios were higher when mix and compacted at hotter temperatures
• Target PG Blend yielded same if not better results than hottest temperature
Summary of Findings
57th Idaho Asphalt Conference, October 26, 2017
25
2017 Idaho Asphalt Conference
Summary of Findings
10/26/2017 51
• Will higher mixing and compaction temperatures affect the mechanical properties for HMA usingRAP ?
• Yes. Higher temperatures less Distresses (Rut and Stripping)
• We should target the mixing and compact temperatures of final/blend PG grade.
2017 Idaho Asphalt Conference
Going Forward
10/26/2017 52
• Finish performance tests at target blend temperature
• Include testing with other asphalt grades
• Include other types of polymers
• Investigate the effect of Warm Mix Additives and temperature on mixture performance
• Include higher RAP content (50% RAP)
• Include field RAP
• Investigate Viscosity Temperature Curve
• Recommended minimum viscosity to achieve better mixture performance
57th Idaho Asphalt Conference, October 26, 2017
26
Questions?Contact:Huachun Zhai, Ph.D., [email protected]
Alejandro [email protected]
57th Idaho Asphalt Conference, October 26, 2017
27


