Data Evaluation in High-Performance Liquid Chromatography-Diode-ArrayDetection-Fluorescence Detection by Information Theory
Victor David* and Andrei Medvedovici
Department of Analytical Chemistry, Faculty of Chemistry, University of Bucharest,Sos. Panduri, No. 90, 76.235, Section 5, Bucharest, Romania
Received November 7, 1999
The concepts of information theory were applied to the high-performance liquid chromatography (HPLC)technique, with diode-array (DAD) and/or fluorescence (FLD) detections. The information amount for acomplete analysis can be computed as a function of analytical parameters, such as the number of analytes,level of concentration, and standard deviation of determinations. By means of the proposed method, theinformation content of a qualitative and quantitative analysis accomplished by HPLC-DAD-FLD wasestimated, and sensitivity was optimized taking into account a maximum information content, while thedetection limit was estimated considering that at this level of concentration the information content approacheszero.
INTRODUCTION
Evaluation of analytical data is usually focused on theprecision and accuracy of determinations during an analyticalprocess. Depending on their sizes, and a criterion chosen tosatisfy a standard quality,1,2 these statistical parameters canbe used in optimization of experimental parameters to yieldmaximum information from the process. Thus, the informa-tion theory is deeply involved in analytical chemistry, mainlyas a consequence between an analytical and a communicationprocess.3 Moreover, the advantage of using the new pos-sibility of data processing with the aid of a computer in-linewith the analytical instrument can be used in evaluation ofthe analytical information. Those techniques, such as GC-MS, GC-FTIR, HPLC-MS, or HPLC-DAD (DAD )diode-array detection), which finally report an analyticalresult as a raw of components identified in a sample togetherwith the so-called similarity index, can be easily discussedin terms of information theory. Thus, in a previous paperwe proposed a new method for estimation of analytical datafrom GC-MS, with very good results in the case of verycomplex mixtures.4
High-performance liquid chromatography (HPLC), withone or two detections, diode-array detection (DAD) andfluorescence detection (FLD), is an analytical technique withlarge applications in separation and determination of non-volatile compounds from different mixtures. Due to the recentdevelopment in the field of data acquisition and processing,the analytical results can be reported from qualitative andquantitative points of view. For this reason, these results canbe characterized by means of information theory. By theapplication of the information theory in data evaluating acertain analytical process, we usually estimate quantitativelyits information amount (content) dependent on the analyticalparameters and optimize them to obtain as much information
as possible. Up to the present, there have been severalattempts in the literature to apply the information theory inthe field of HPLC techniques. According to Matsuda et al5,6
the information theory can be used to select the most efficientHPLC conditions for dissolution testing of multiingredientpharmaceuticals in the framework of a total chromatographicoptimization procedure. Information content, sample com-plexity, physicochemical detectors, and chromatographictechniques are investigated in the analysis of plant extracts.7
Even the homogeneity of the distribution of an analyte in amatrix has been characterized in terms of information theory.8
Nevertheless, there is not now a comprehensive treatise ofthis analytical technique by means of the information theory.Therefore, it is the purpose of the present study to applythis theory to this field in view of measuring the informationcontent obtained from such a determination.
INFORMATION ENTROPY
An analytical process compared with a communicationprocess can be represented by means of the following twofields of probabilities:9
In this representation the main role is played by the eventsX i, the number of which being denoted byn. The event Xican be in HPLC-FLD-DAD a certain compound to beidentified with the aid of its UV-vis absorption spectrum,a value of the measured absorbance (in DAD), or a value ofthe emission intensity (in FLD). The main role of the HPLCprocess played from the information point of view is toimprove the values of a posteriori probabilities, assigned toeach chemical compound to be found in the sample, due tothe separation process that takes place during this analysis.* Corresponding author. E-mail: [email protected].
sample: a priori{X i, pi, i ) 1, 2, ...n}
f analytical processf
a posterioriresult: {X i, qi, i ) 1, 2, ...,n}
976 J. Chem. Inf. Comput. Sci.2000,40, 976-980
10.1021/ci990139x CCC: $19.00 © 2000 American Chemical SocietyPublished on Web 06/02/2000
With these two probabilities the information entropies canbe computed by Shannon’s formula:
The information content,∆Hi, will be the difference betweenthe two entropies:
Depending on the values ofpi andqi, we can encounter oneof the following situations with corresponding significance.10
(1) pi ) 0; qi ) 0 (∆Hi ) 0). In this case the process isproving our knowledge about the analyte Xi: without anydoubt it is not possible to be found in the sample. The processconfirms that the sample does not possibly contain analyteX i, and thus it does not carry out any information with regardto the analyte Xi.
(2) pi ) 1; qi ) 1 (∆Hi ) 0). This is a situation similar tothat described above, but with another conclusion: theanalyte Xi is undoubtedly present in the sample.
(3) pi ) 1; qi ) 0 (∆Hi questionable). This is a wrongsupposition by assigning to the analyte Xi a sure presencein the sample, while the determination process does not provethis presence. In this rare case it is difficult to estimate theinformation content of the process.
(4) pi ) 0; qi ) 1 (∆Hi questionable). This is the samesituation as described above, but the supposition that Xi isnot found in the sample seems not to be true after thedetermination.
(5) 0 < pi ) qi < 1 (∆Hi ) 0). The uncertainty assignedto the compound Xi to be present in the sample has not beenchanged, making the analytical process inopportune in thedetermination of this compound.
(6) 0 < pi < qi < 0.5 (∆Hi < 0). Although the probabilitythat Xi is found in the sample has increased, the uncertaintyabout this compound has also increased, leading to a negativeinformation content of the determination.
(7) 0 < pi < qi < 0.5 (∆Hi > 0). The certainty for Xi notto be found in the sample has increased, and consequently apositive value of the information content of the determinationis obtained.
(8) 0.5< pi < qi < 1 (∆Hi > 0). The certainty that Xi isfound in the sample has increased.
(9) 0.5< qi < pi < 1 (∆Hi < 0). The uncertainty that Xiis found in the sample has increased.
The main conclusion arising from these situations is thatan analytical process is useful for determining an analyte Xi
if and only if the a posteriori probabilityqi is closer to thevalues 0, or 1, than the a priori probabilitypi. In the case ofa maximum uncertainty a priori to the analysis, i.e.,pi )1/2 for all the eventsi ) 1, 2, ..., n, and a lack of anyuncertainty a posteriori to the analysis, i.e.,qi ) 0, or 1, forall the eventsi ) 1, 2, ...,n, the value of the informationamount isn bits. Moreover, if the uncertainty of the aposteriori probability field is zero, then the informationamount obtained from analysis is given by the a prioriinformation entropy.
INFORMATION CONTENT
The semiquantitative analysis of a sample consists ofsetting up a number of intervals [Cj(lower),Cj(upper)] within
which the concentration of the analyzed component of theanalytical sample is situated. These concentration intervalswithin which the value of the concentration of a certaincompoundXi identified to be present in a sample by a DADdetection could be practically represented as follows:
The probabilityqij that the value of the concentration of thecomponenti lies in one of theν intervals is
Therefore, the information amount corresponding to theprobability field of a semiquantitative analysis for onecomponenti and a lack of any uncertainty in a final result isgiven by
For instance, if a semiquantitative analysis for a certaincompound is carried out down to the parts per million level(10-4%, i.e., ν ) 6) by means of DAD detection, theinformation content of this analysis has the value of 2.57bits, whereas if the analysis is carried out down to the partsper billion level (ν ) 9) by means of FLD detection, thevalue is 3.14 bits.
The information content corresponding to the events of asemiquantitative analysis for all the components of thesample has the expression
By carrying out a quantitative analysis for a certaincomponent, a confidence intervalcj ( µσ is set up, withinwhich the value of the concentration of the analyzedcomponent can be situated; hereσ is the standard deviationof the analytical resultc, andµ is a number, set after analysis,which indicates the magnitude of the confidence interval inσ units (usually the valueµ ) 3 is considered). The valueof the concentration of a certain componenti, after theanalysis has been carried out, iscjij ( µijσij, cjij ∈ [cj(lower),cj(upper)],j ) 1, ν. Hence, the events of the probability field,before a quantitative analysis has been carried out, are certainconcentration microintervals, with a magnitude of 2µijσij, j) 1,ν, i ) 1, n. Besides, the events of the probability fieldcorresponding to a quantitative analysis depend on the eventsof a semiquantitative analysis.11
According to this procedure, the semiquantitative intervalscould be chosen such thatσij is constant over one of theseintervals.
If 2µijσij is the magnitude of the confidence interval forthe quantitative results, relative to the chemical componenti and to the concentrationj, the intervalj can be dividedinto sij microintervals of magnitude 2µijσij; their number isgiven by the relation
Hi(a priori) ) -pi log2 pi - (1 - pi) log2(1 - pi) (1)
Hi(a posteriori)) -qi log2 qi - (1 - qi) log2(1 - qi) (2)
∆Hi ) Hi(a priori) - Hi(a posteriori) (3)
Cj(lower) ) 102-j%, Cj(upper)) 103-j%,j ) 1,2, ..,ν (4)
qij ) 1/ν;∑j)1
V
qij ) 1, i ) 1, n (5)
∆Hi(semiquant)) log2 ν (6)
∆H(semiquant)) ∑i)1
n
∆Hi(semiquant)) n log2 ν (7)
sij )Cj(upper)- Cj(lower)
2µijσij) 9 × 10²-j
2µijσij(8)
DATA EVALUATION IN HPLC-DAD-FLD J. Chem. Inf. Comput. Sci., Vol. 40, No. 4, 2000977
Since the obtained microintervals are independent of oneanother, the probabilityp′ij of a microinterval from theinterval j, for a componenti, is the reverse ofsij:
The described procedure of dividing before the analysisan intervalj into microintervals of magnitude 2µijσij impliesanother probability, after the analysis has taken place,namely, the probability that the corresponding microintervalrepresents the true concentration, denoted byCh ij. Theprobability that a resultCij deviates from the true valueCij
is a Gauss function. Therefore, the probability that a certainobtained resultCij ∈ [Cj(lower), Cj(upper)] belongs to anintervalCh ij ( µijσij can be estimated by the following relation:
After the variable changez ) (Cij - Ch ij)/σij is performed,the integral (10) becomes
where Φ(µij) is the Laplace function, which is knowndependent onµ.
If multiplied by p′′ij, the probabilityp′ij gives the prob-ability pij of obtaining a microinterval of magnitude 2µijσij,which would represent the true valueCij. Hence,pij is givenby
The probability of obtaining by quantitative analysis amicrointerval of the intervalj, of magnitude 2µijσij, whenthe interval k has been determined previously by semi-quantitative analysis, represents the probabilityπ(2µijσij|k)of an event of the quantitative analysis conditioned by theevent of a semiquantitative analysis, having the expression
whereδjk is Kronecker’s symbol (δjk ) 1 if j ) k, andδjk )0 if j * k). In the case of an in-line analysis, HPLC-DAD-FLD, this conditional probability has an important signifi-cance: it gives the probability of a fluorescent compoundto give an analytical signal in FLD, when it gives a signalin DAD, at a proper spectral domain, where it can absorbUV radiation.
The information content of the probability field that hasas events the microintervals of magnitude 2µijσij and theprobabilitiespij conditioned by the eventk of a semiquan-titative analysis is given by
The information content of the probability field correspond-ing to a HPLC quantitative analysis of componenti,
conditioned by the probability field corresponding to asemiquantitative analysis, denoted by∆Hi(quant/semiquant),has the expression
Replacing expressions 5 and 12 forqij andpij, respectively,the following expression is obtained for the informationcontent of the probability field corresponding to the eventsof a quantitative analysis of componenti, depending on theprobability field of the events of a semiquantitative analysis:
Taking into account all the components of the sample,expression 16 becomes
The information content∆H corresponding to the eventsof a complete HPLC analysis is given by
or more explicitly
Expression 19 depends on four variables:n, ν, σij, andµij
(i ) 1, n; j ) 1, ν). The information amount∆H is a linearfunction ofn and a logarithmic function ofν andσij; it is aconvex function ofµ, so that a value ofµ can be found forwhich the function∆H(µ) has a maximum.
APPLICATIONS
Information Content in Qualitative Analysis. The mainproblem related to the computation of information amountobtained from a qualitative analysis by HPLC-DAD is givenby the difficulty of establishing the a posteriori probabilityassigned to each component identified in a sample. This istranslated into the problem of how much a spectrum of onecomponent during a chromatographic run is similar to thereal one, because many times small changes in chromato-graphic separation can influence an UV-vis spectrum, notdeeply, but enough to introduce from the probability pointof view an uncertainty a posteriori to the analysis. Ourassumption is that the degree of overlapping of two spectraof one component (one being a reference, while the otherbeing investigated) gives the probability of an experimentalspectrum to belong to a certain component. Many times thisdegree of overlapping of two spectra is called a similarity
p′ij )2µijσij
9 × 10²-j(9)
p′′ij ) 1
σij(2π)1/2 ∫A
Bexp[- (Cij - Ch ij)
2
2σij2 ] dCij (10)
(A ) Ch ij - µijσij; B ) Ch ij + µijσij)
p′′ij ) 2[ 1
(2π)1/2 ∫0
µij exp(- z2
2) dz] 2Φ(µij) (11)
pij )4µijσijΦ(µij)
9 × 10²-j(12)
π(2µijσij/k) ) pijδjk (13)
∆H(2µijσij/k) ) -sijπ(2µijσij/k) log2 π(2µijσij/k) (14)
∆Hi(quant/semiquant)) ∑k)1
ν
∑j)1
ν
qijH(2µijσij/k) )
- ∑k)1
ν
∑j)1
ν
sijqijpijδij log2 pij (15)
∆Hi(quant/semiquant))2
ν∑j)1
ν
Φ(µij) log2
9 × 10²-j
4µijσijΦ(µij)(16)
∆Hi(quant/semiquant))2
ν∑i)1
n-1
∑j)1
ν
Φ(µij) log2
9 × 10²-j
4µijσijΦ(µij)(17)
∆H ) H(qual)+ H(semiquant)+ H(quant|semiquant)(18)
∆H ) n log2 2ν +2
ν∑i)1
n-1
∑j)1
n
Φ(µij) log2
9 × 10²-j
4µijσijΦ(µij)(19)
978 J. Chem. Inf. Comput. Sci., Vol. 40, No. 4, 2000 DAVID AND MEDVEDOVICI
index, and new analytical instruments facilitate to do thatby means of special data processing. For example, Lepadatu12
proposed a general method for comparing two spectra: oneof them has to be searched, and the other is a knownspectrum of the compound to be identified. The similaritybetween two spectra (Dn), which has the meaning of adistance between these two spectra, is given by the formula
where Ak and Bk are the values of absorbance from theunknown spectrum and a known spectrum, respectively.According to this method the more closed to 1 is the valueof Dn, the more probable is it that the two searched spectrabelong to the same compound. In terms of a posterioriprobability, this one can be easily computed by the ratioq) 1/Dn. In a previous paper13 we already proved that anestimating factor of the information content of a spectrumbelonging to a certain compound can be used in theestimation of the degree of overlapping between two spectra.This factor was called a minimum information content, andit is similar to formula 20 given above.
In Table 1 we give several examples of hypotethicalcomponents found with an equal probability to be presentin a sample.
Information Content in Quantitative Analysis. Thestandard deviationσij for componenti ) 1, n and concentra-tion interval j ) 1, ν may be expressed as a function of theproportionality of the lower limit of the correspondingconcentration interval,Cj(lower) ) 102-j, as follows:
In this case, the function∆H can be written in a simplerform:
In what follows, we will take some examples of estimatingthe values of∆H, considering the ideal case in whichâij
andµij are constant, having the valuesâ andµ for any i )1, n and j ) 1, ν. The following expression of∆H is thusobtained:
The values of the information content obtained for a set of
n ) 10 analytes as a function ofâ andµ parameters, for anHPLC analysis carried out down to the parts per million level(ν ) 6) by DAD, and to the parts per billion level (ν ) 9)by FLD, are given in Table 2. It can be seen that theinformation content of the analytical results increases withthe increase of the precision of the measurements, representedhere by the parameterâ.
Sensitivity. An important application of the proposedmodel consists of setting up an optimum value of thesensitivity of the measurements (noted byS, and defined asa change in the analytical response to the change in theconcentration of an analyte14) by this technique, which isbeing used in the analytical process as a function of thestandard deviation of the whole analytical process.15 It resultsfrom the described model that the optimum value of themeasurement sensitivity, denoted bySopt, is that value whichcorresponds to a maximum information content of theanalytical results as a function ofµij andσij, that is,Sopt )µijσij so that∆H(µijσij) ) maximum; forS< µijσij one wouldobtain a large numbersij of concentration microintervals, butwith a low probability of representing the true value, whereasfor S > µijσij one would obtain a small numbersij and ahigh probability of representing the true value of theconcentration of the componenti. In this way, one can selectthe analytical results as a function of standard deviation, soas to carry out a maximum possible information content.
To exemplify, we will consider here the quantitativedetermination of one component by this analytical technique,in the range of parts per million, that is [1, 1000] ppm, witha standard deviation of the measurementsσ ) 0.1 ppm,assumed to be constant over the entire given concentrationrange. According to Table 2, the valueµ ) 1.5 correspondsto a maximum information content of the analytical results,so that the results carrying out a maximum informationamount are those from the following series, or any otherseries having 0.15 ppm as a microinterval of variation:
The above series of results has therefore an informationcontent larger than that of the series of results given below,obtained with a similar standard deviation:
Table 1. Information Content for a Qualitative Analysis of 10Analytes, Depending on the Value of a Posteriori Probability
qi H(a posteriori) ∆H (bits) qi H(a posteriori) ∆H (bits)
0.55 9.909 0.091 0.80 7.206 2.7940.60 9.691 0.309 0.85 6.087 3.9130.65 9.323 0.677 0.90 4.681 5.3190.70 8.796 1.204 0.95 2.859 7.1410.75 8.098 1.902 1.00 0.000 10.00
Dn )(∑
k)1
n Ak
Bk)2
n∑k)1
n (Ak
Bk)2
g 1 (20)
σij ) âij × 102-j (21)
∆H ) n log2 2ν +2
ν∑i)1
n-1
∑i)1
ν
Φ(µij) log2
9
4âijµijΦ(µij)(22)
∆H ) n log2 2ν + 2(n - 1)Φ(µ) log29
2âµΦ(µ)(23)
Table 2. Values of the Information Content (bits) for a Set ofn )10 Analytes, as a Function ofâ andµ, for a Quantitative HPLCAnalysis Carried out Down to Parts per Million and Parts perBillion Levels
â ) 0.1 â ) 0.01 â ) 0.001
µ Φ(µ) ν ) 6 ν ) 9 ν ) 6 ν ) 9 ν ) 6 ν ) 9
0.25 0.0987 53.32 59.17 59.22 65.07 65.12 70.970.50 0.1915 63.00 68.85 74.45 80.30 85.90 91.750.75 0.2734 69.20 75.05 85.55 91.40 101.90 107.751.00 0.3413 72.98 78.83 93.38 99.23 113.79 119.641.25 0.3944 74.98 80.83 98.56 104.42 122.15 128.001.50 0.4332 75.72a 81.57a 101.62 107.48 127.53 133.381.75 0.4599 75.62 81.47 103.13 108.98 130.63 136.482.00 0.4772 75.01 80.86 103.55a 109.40a 132.08 137.932.25 0.4878 74.11 79.96 103.28 109.13 132.45a 138.30a
2.50 0.4938 73.07 78.92 102.60 108.45 132.12 137.972.75 0.4970 72.00 77.85 101.72 107.57 131.44 137.293.00 0.4987 70.95 76.80 100.77 106.62 130.59 136.44
a Indicates the maximum of∆H for constantν andâ.
[1; 1.15; 1.30; 1.45; 1.60; 1.75; ...; 1000] ppm
[1; 1.01; 1.02; 1.03; 1.04; 1.05; ...; 1000] ppm
DATA EVALUATION IN HPLC-DAD-FLD J. Chem. Inf. Comput. Sci., Vol. 40, No. 4, 2000979
To conclude, by means of this procedure the value of theinformation entropy of the analytical results in HPLC-DAD-FLD can be estimated and optimized as a function of thenumber of analyzed components, the number of concentrationdomains, the standard deviation, and the sensitivity of theanalytical process.
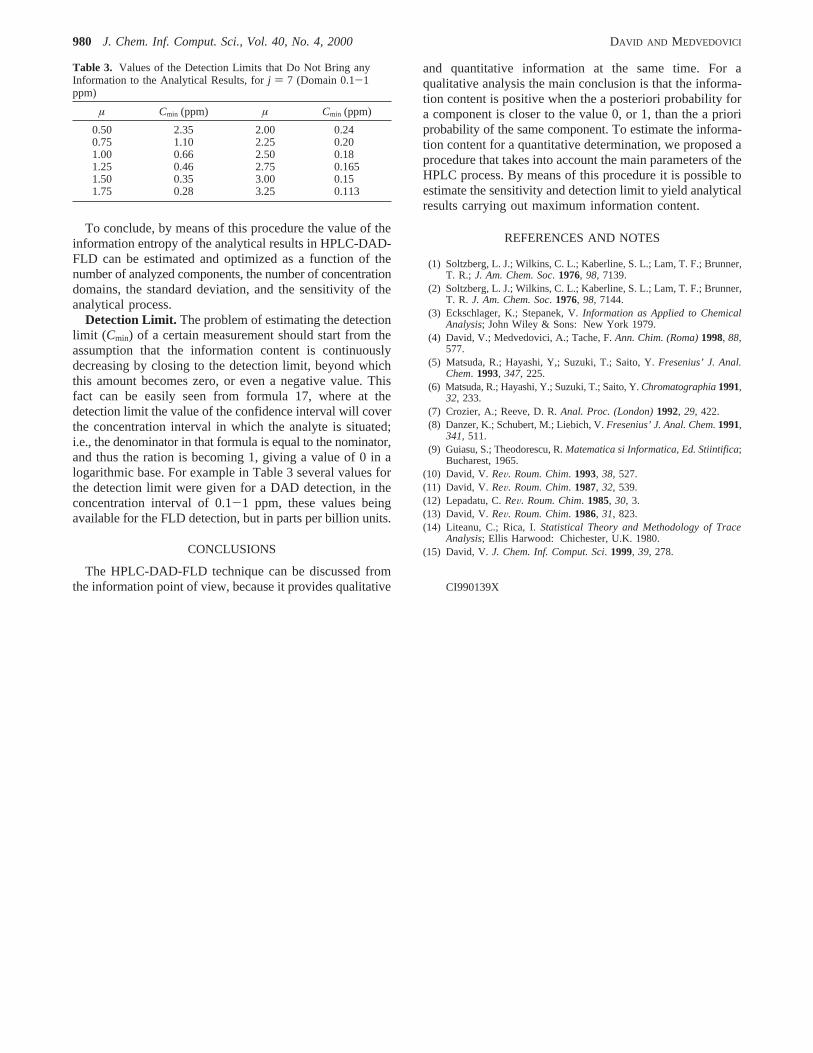
Detection Limit. The problem of estimating the detectionlimit (Cmin) of a certain measurement should start from theassumption that the information content is continuouslydecreasing by closing to the detection limit, beyond whichthis amount becomes zero, or even a negative value. Thisfact can be easily seen from formula 17, where at thedetection limit the value of the confidence interval will coverthe concentration interval in which the analyte is situated;i.e., the denominator in that formula is equal to the nominator,and thus the ration is becoming 1, giving a value of 0 in alogarithmic base. For example in Table 3 several values forthe detection limit were given for a DAD detection, in theconcentration interval of 0.1-1 ppm, these values beingavailable for the FLD detection, but in parts per billion units.
CONCLUSIONS
The HPLC-DAD-FLD technique can be discussed fromthe information point of view, because it provides qualitative
and quantitative information at the same time. For aqualitative analysis the main conclusion is that the informa-tion content is positive when the a posteriori probability fora component is closer to the value 0, or 1, than the a prioriprobability of the same component. To estimate the informa-tion content for a quantitative determination, we proposed aprocedure that takes into account the main parameters of theHPLC process. By means of this procedure it is possible toestimate the sensitivity and detection limit to yield analyticalresults carrying out maximum information content.
REFERENCES AND NOTES
(1) Soltzberg, L. J.; Wilkins, C. L.; Kaberline, S. L.; Lam, T. F.; Brunner,T. R.; J. Am. Chem. Soc. 1976, 98, 7139.
(2) Soltzberg, L. J.; Wilkins, C. L.; Kaberline, S. L.; Lam, T. F.; Brunner,T. R. J. Am. Chem. Soc. 1976, 98, 7144.
(3) Eckschlager, K.; Stepanek, V.Information as Applied to ChemicalAnalysis; John Wiley & Sons: New York 1979.
(4) David, V.; Medvedovici, A.; Tache, F.Ann. Chim. (Roma)1998, 88,577.
(5) Matsuda, R.; Hayashi, Y,; Suzuki, T.; Saito, Y.Fresenius’ J. Anal.Chem. 1993, 347, 225.
(6) Matsuda, R.; Hayashi, Y.; Suzuki, T.; Saito, Y.Chromatographia1991,32, 233.
(7) Crozier, A.; Reeve, D. R.Anal. Proc. (London)1992, 29, 422.(8) Danzer, K.; Schubert, M.; Liebich, V.Fresenius’ J. Anal. Chem.1991,
341, 511.(9) Guiasu, S.; Theodorescu, R.Matematica si Informatica, Ed. Stiintifica;
Bucharest, 1965.(10) David, V.ReV. Roum. Chim. 1993, 38, 527.(11) David, V.ReV. Roum. Chim. 1987, 32, 539.(12) Lepadatu, C.ReV. Roum. Chim. 1985, 30, 3.(13) David, V.ReV. Roum. Chim. 1986, 31, 823.(14) Liteanu, C.; Rica, I.Statistical Theory and Methodology of Trace
Analysis; Ellis Harwood: Chichester, U.K. 1980.(15) David, V.J. Chem. Inf. Comput. Sci. 1999, 39, 278.
CI990139X
Table 3. Values of the Detection Limits that Do Not Bring anyInformation to the Analytical Results, forj ) 7 (Domain 0.1-1ppm)
µ Cmin (ppm) µ Cmin (ppm)
0.50 2.35 2.00 0.240.75 1.10 2.25 0.201.00 0.66 2.50 0.181.25 0.46 2.75 0.1651.50 0.35 3.00 0.151.75 0.28 3.25 0.113
980 J. Chem. Inf. Comput. Sci., Vol. 40, No. 4, 2000 DAVID AND MEDVEDOVICI


