1616 P St. NW Washington, DC 20036 202-328-5000 www.rff.org
March 2009
Current Challenges, Funding, and Popularity Trends in Local Parks and Recreation Areas
Responses to a Survey of Park Directors
Margare t Wa l l s , Juha S i i kamäk i , Sa rah Dar l e y ,
Je f f Fe r r i s , and Joe Maher
BAC
KG
ROU
ND
ER
Resources for the Future Walls et al.
1
Current Challenges, Funding, and Popularity Trends in Local Parks and Recreation Areas: Responses to a Survey of Park Directors
Margaret Walls, Juha Siikamäki, Sarah Darley, Jeff Ferris, and Joe Maher∗
Most outdoor recreation opportunities in the U.S. begin at a local neighborhood park. These parks, along with numerous nature centers, hiking trails, recreation facilities, and playing fields are provided and maintained by local governments. As part of a broader research study of conservation, recreation, and open space and in support of the bi-partisan review commission, the Outdoor Resources Review Group, Resources for the Future conducted a survey of city and county parks and recreation department directors in the fall of 2008. A structured mail-survey was sent electronically to 89 individuals identified by the National Recreation and Parks Association and the City Parks Alliance as city and county parks and recreation department directors. Forty-six out of 89 surveys were completed and returned, for a 52 percent response rate.
The survey included a wide range of questions regarding current issues and challenges facing local governments and the parks and recreation areas they provide. For example, we asked for budget information and sources of funding, including information on volunteers, park “friends” groups and conservancies; and financing referenda. We also inquired about the perceived popularity trends of a variety of local recreational activities, and asked about the primary challenges that the communities are facing. The survey instrument developed and used for this research is included in Appendix A.
The purpose of this document is to summarize responses to the survey. In the following, we present the key summary statistics of responses for each question. Our summary covers the entire survey and proceeds systematically, question by question, from the beginning of the survey to the end of it. The survey instrument in the Appendix provides a helpful context for examining the results. This report includes only summary statistics, and it does not comprise any further analyses or interpretation of the results. However, the survey responses, along with
∗ The authors are, respectively, Senior Fellow, Fellow, Research Associate, Research Assistant, and Research Assistant at Resources for the Future. This backgrounder is one in a series of backgrounders for the Outdoor Resources Review Group (see www.rff.org/orrg).
Resources for the Future Walls et al.
2
additional information and analysis, will contribute to broader research studies being conducted as part of the Outdoor Resources Review Group efforts.1
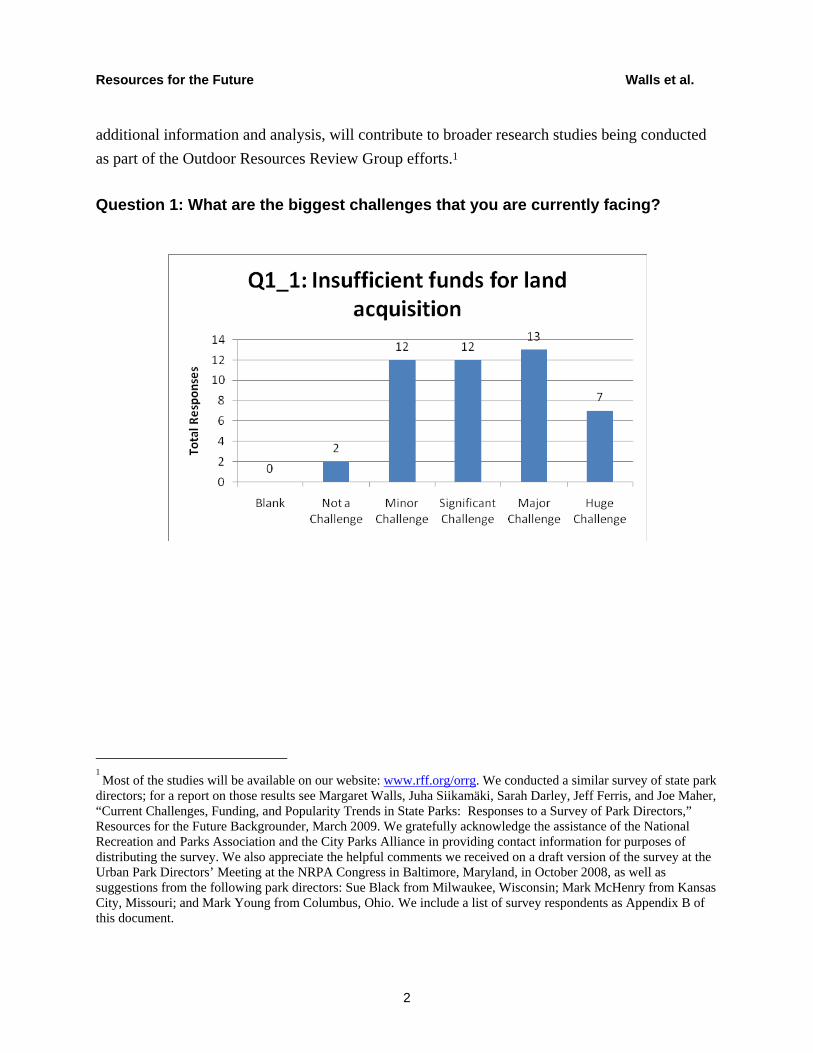
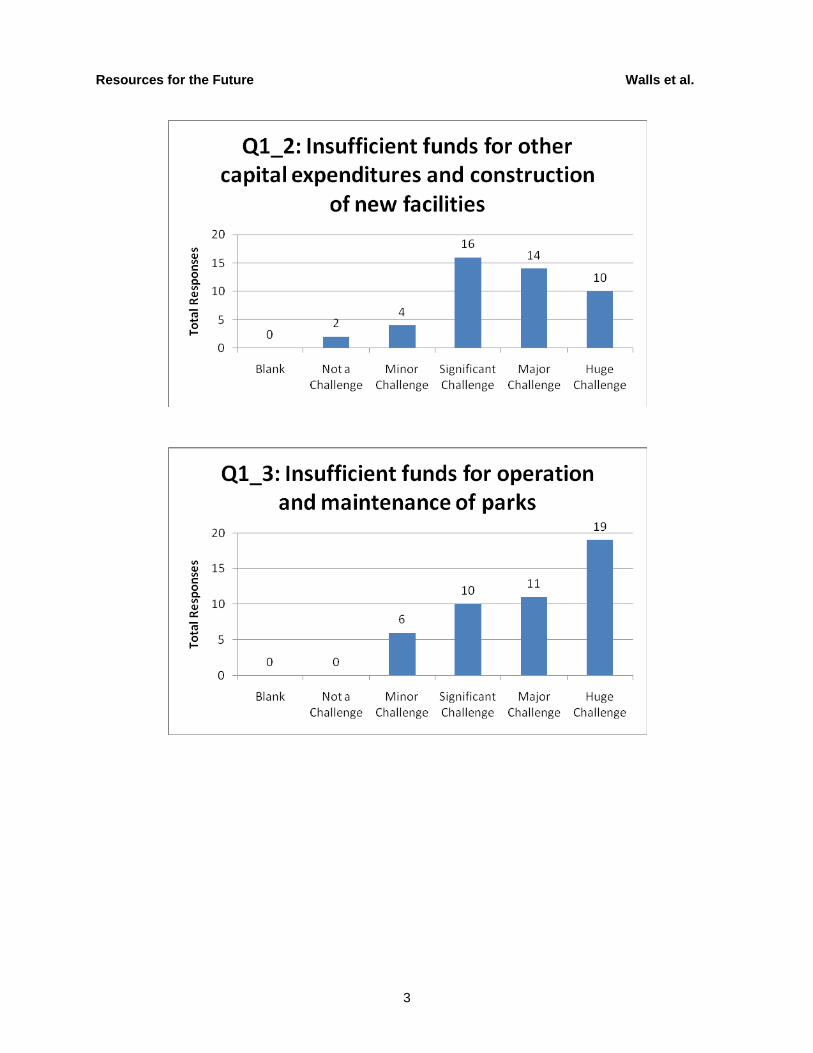
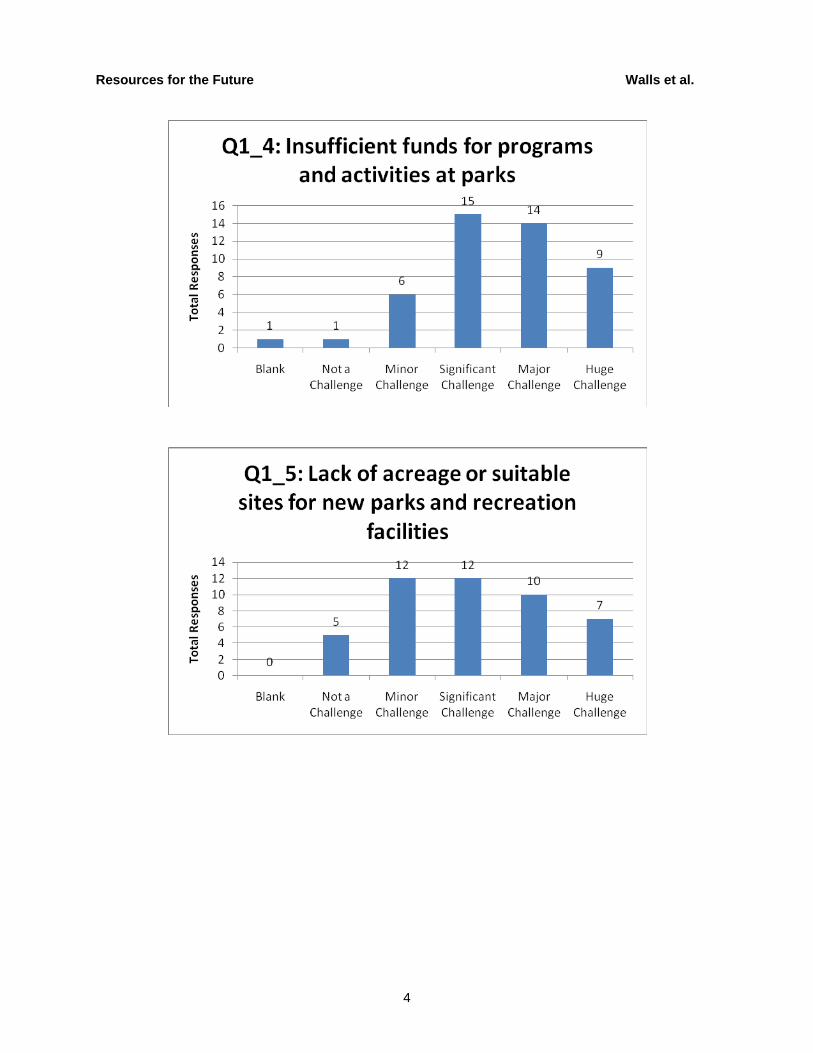
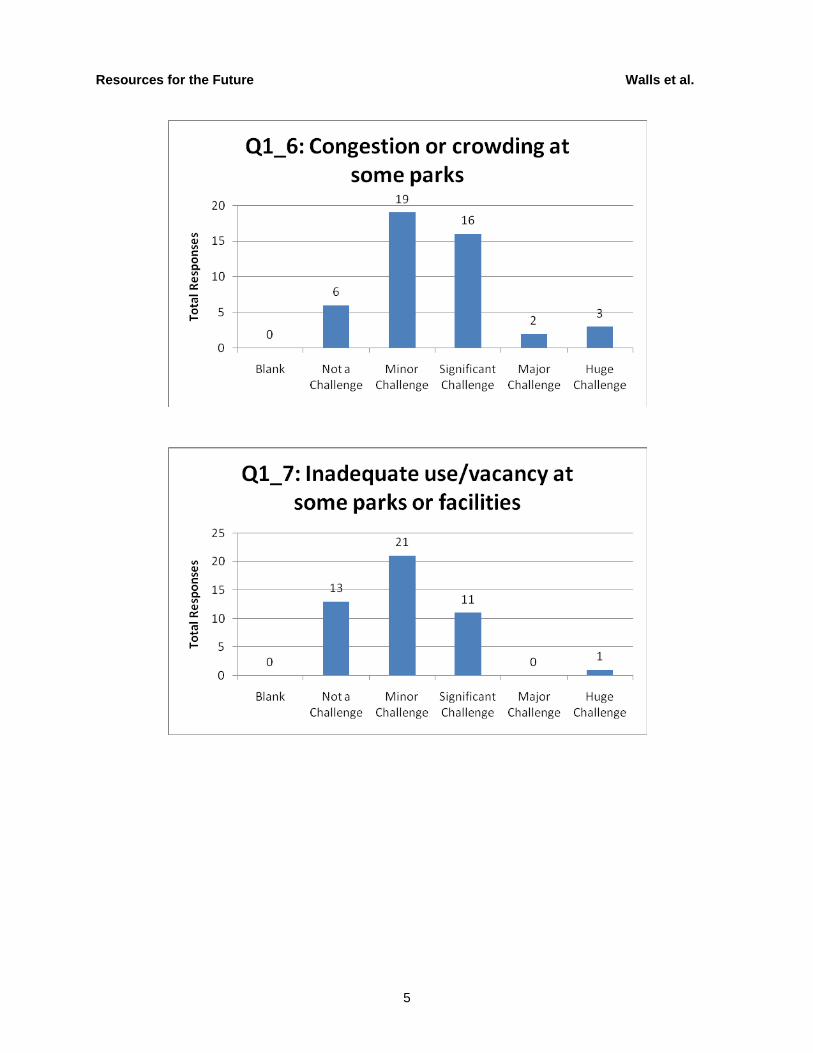
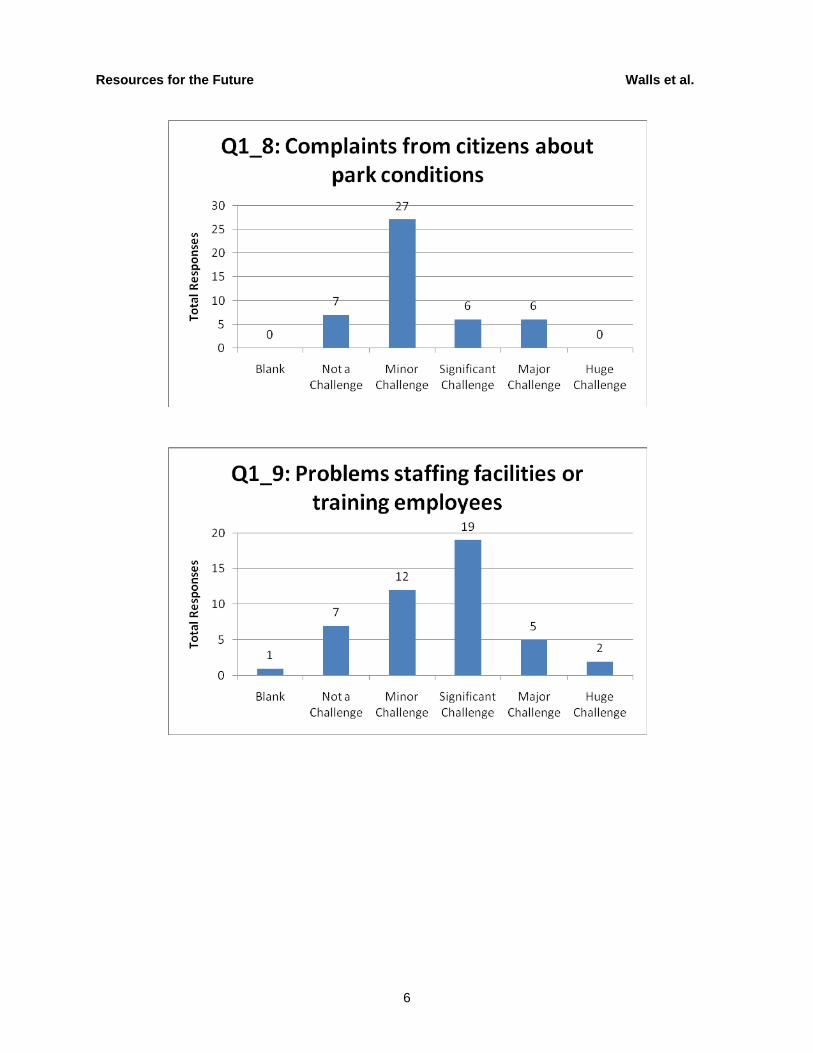
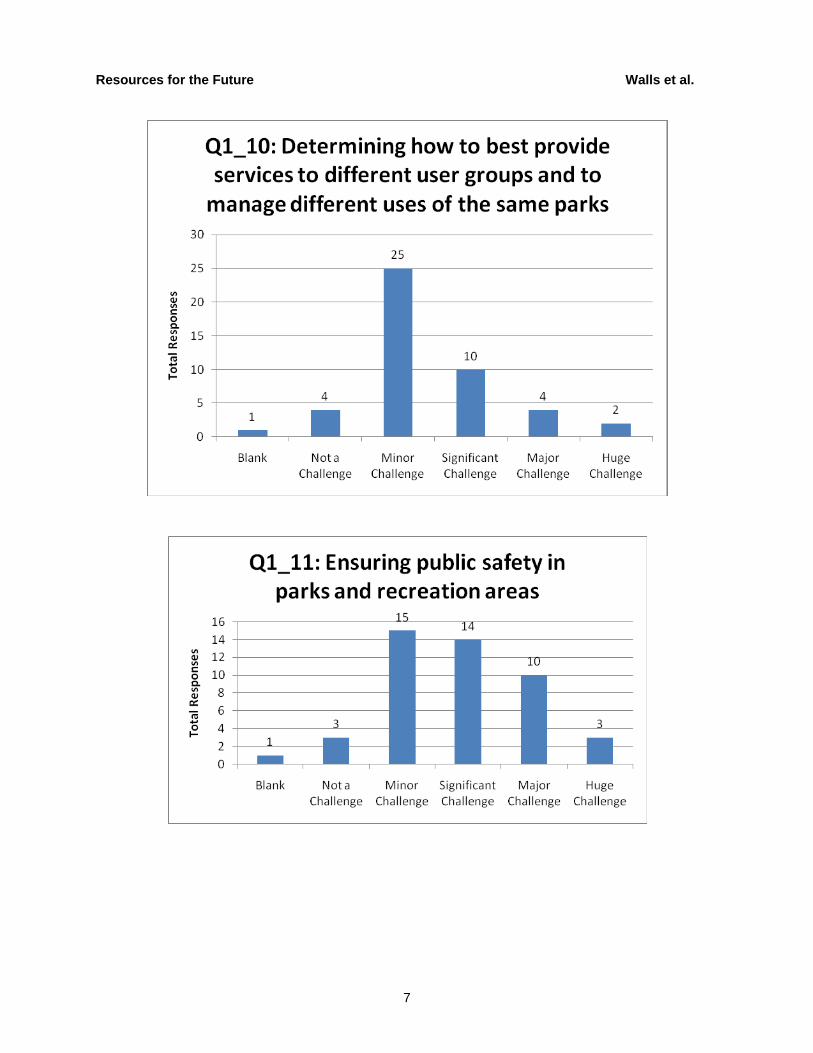
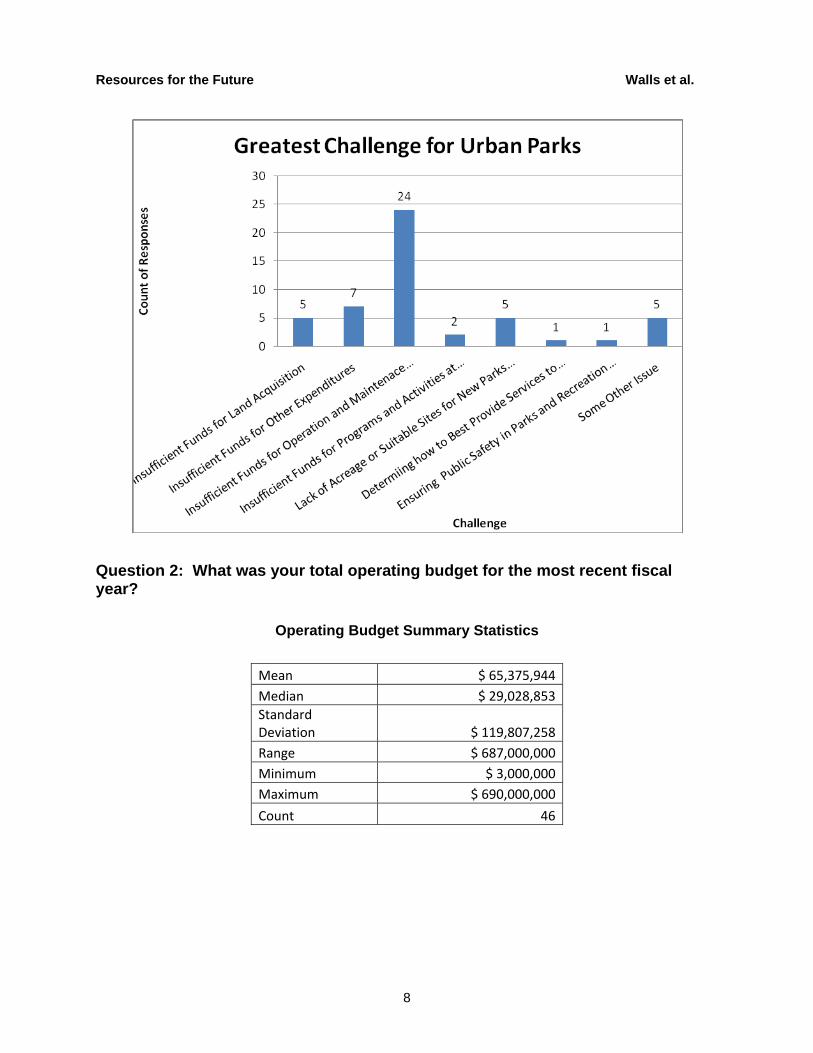
Question 1: What are the biggest challenges that you are currently facing?
1 Most of the studies will be available on our website: www.rff.org/orrg. We conducted a similar survey of state park directors; for a report on those results see Margaret Walls, Juha Siikamäki, Sarah Darley, Jeff Ferris, and Joe Maher, “Current Challenges, Funding, and Popularity Trends in State Parks: Responses to a Survey of Park Directors,” Resources for the Future Backgrounder, March 2009. We gratefully acknowledge the assistance of the National Recreation and Parks Association and the City Parks Alliance in providing contact information for purposes of distributing the survey. We also appreciate the helpful comments we received on a draft version of the survey at the Urban Park Directors’ Meeting at the NRPA Congress in Baltimore, Maryland, in October 2008, as well as suggestions from the following park directors: Sue Black from Milwaukee, Wisconsin; Mark McHenry from Kansas City, Missouri; and Mark Young from Columbus, Ohio. We include a list of survey respondents as Appendix B of this document.
Resources for the Future Walls et al.
3
Resources for the Future Walls et al.
4
Resources for the Future Walls et al.
5
Resources for the Future Walls et al.
6
Resources for the Future Walls et al.
7
Resources for the Future Walls et al.
8
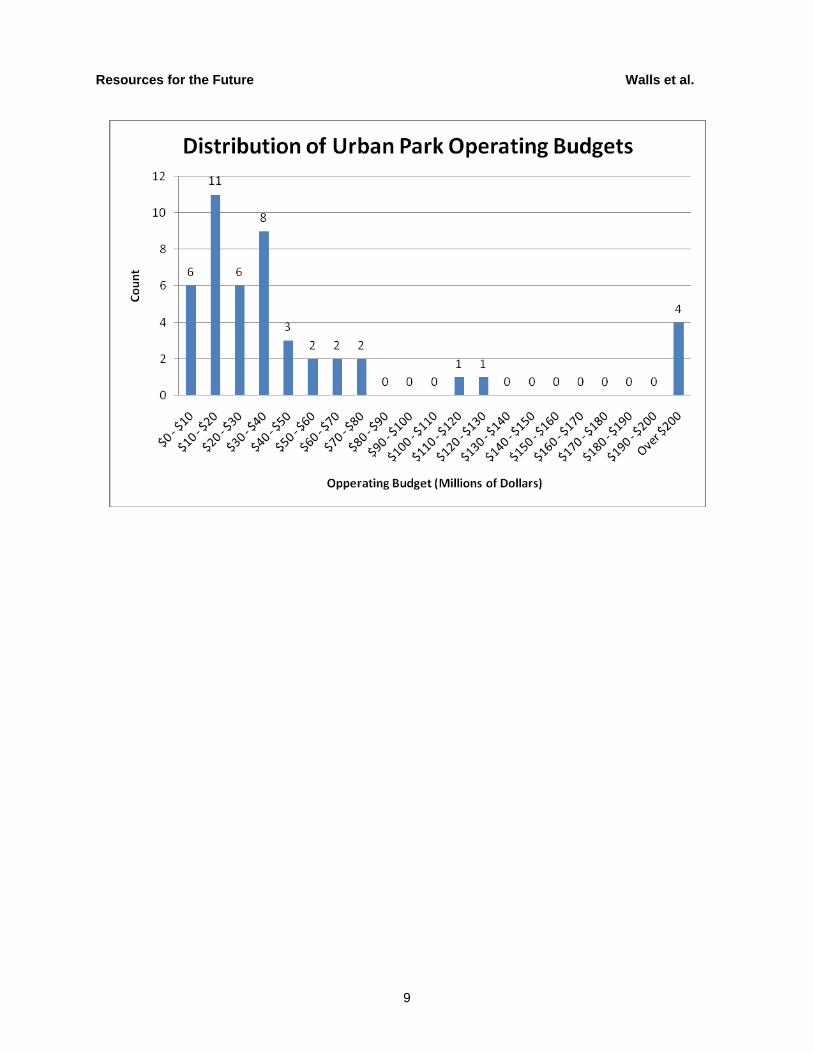
Question 2: What was your total operating budget for the most recent fiscal year?
Operating Budget Summary Statistics
Mean $ 65,375,944 Median $ 29,028,853 Standard Deviation $ 119,807,258 Range $ 687,000,000 Minimum $ 3,000,000 Maximum $ 690,000,000
Count 46
Resources for the Future Walls et al.
9
Resources for the Future Walls et al.
10
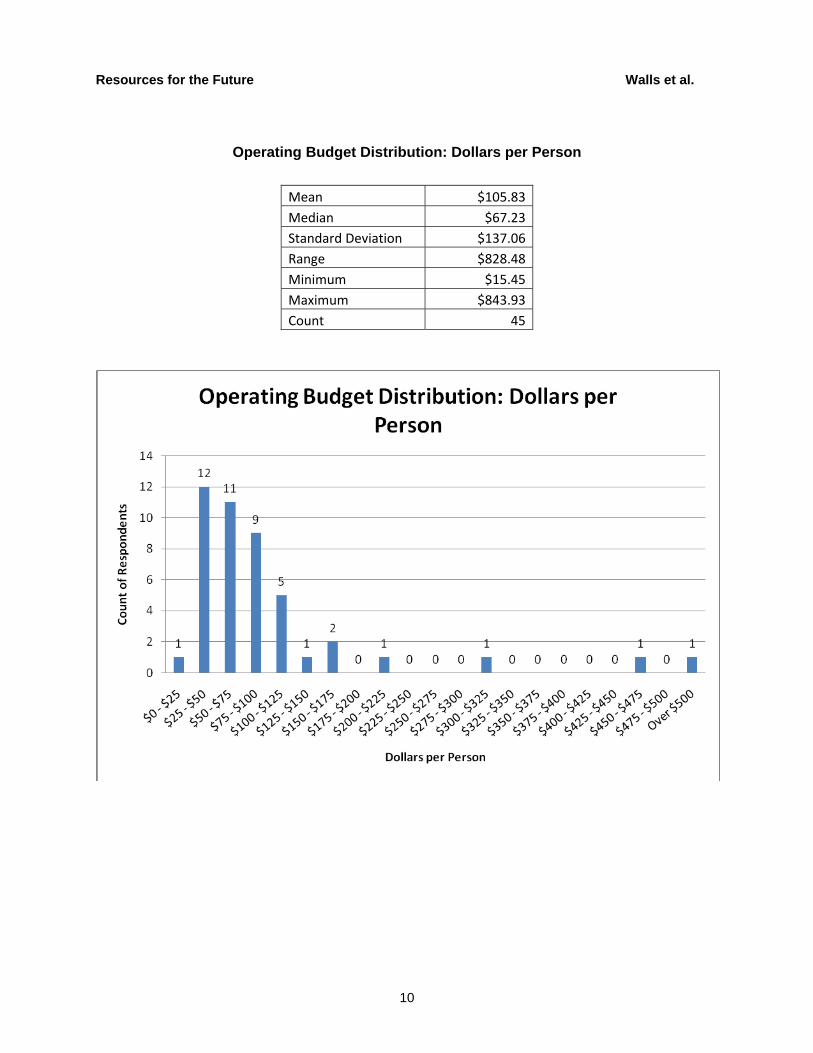
Operating Budget Distribution: Dollars per Person
Mean $105.83Median $67.23Standard Deviation $137.06Range $828.48Minimum $15.45Maximum $843.93Count 45
Resources for the Future Walls et al.
11
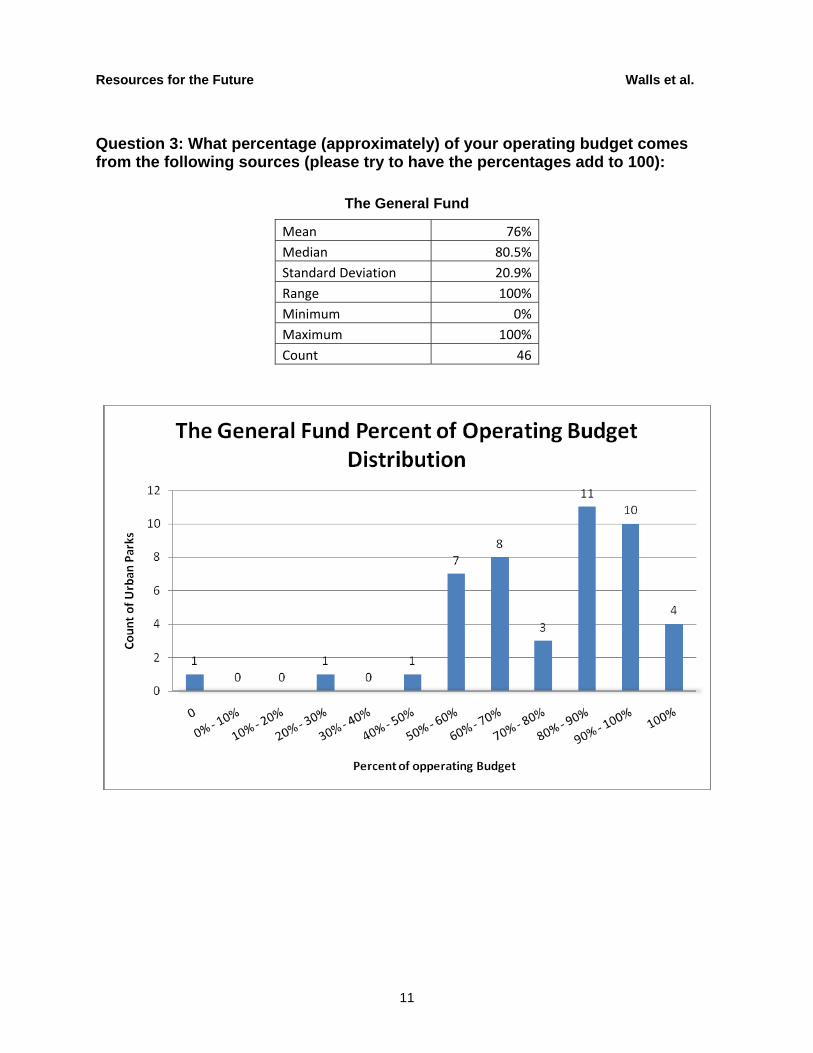
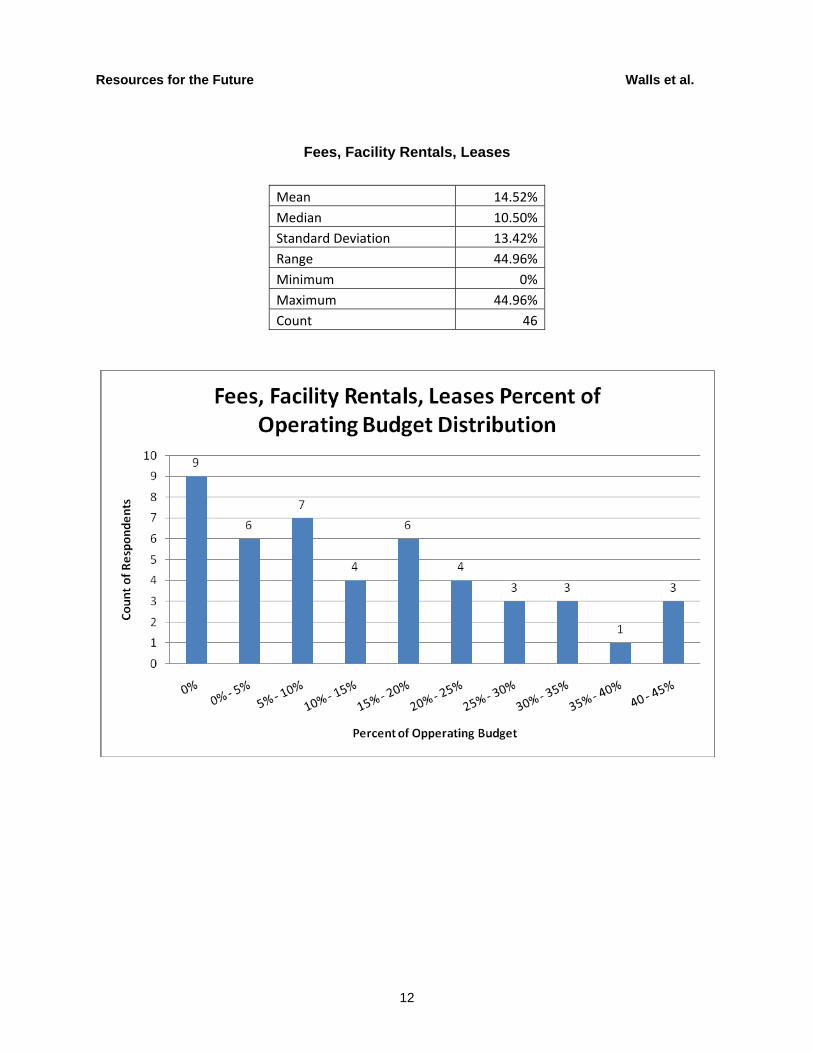
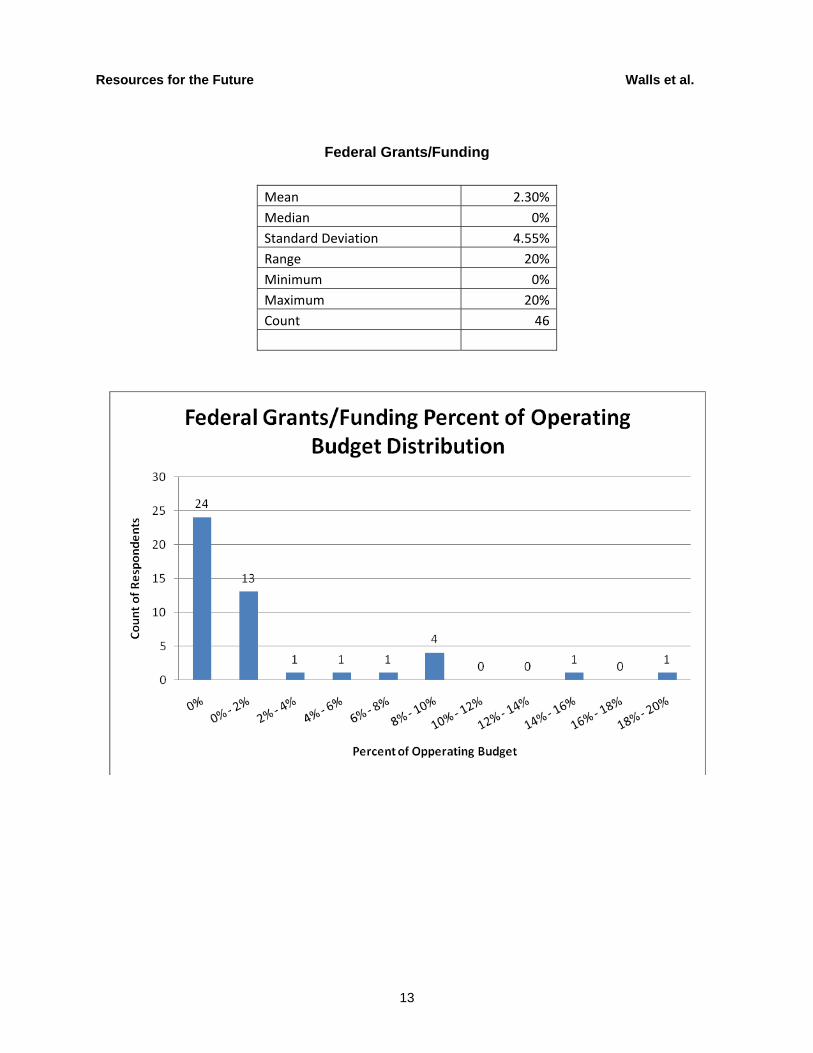
Question 3: What percentage (approximately) of your operating budget comes from the following sources (please try to have the percentages add to 100):
The General Fund
Mean 76%Median 80.5%Standard Deviation 20.9%Range 100%Minimum 0%Maximum 100%Count 46
Resources for the Future Walls et al.
12
Fees, Facility Rentals, Leases
Mean 14.52%Median 10.50%Standard Deviation 13.42%Range 44.96%Minimum 0%Maximum 44.96%Count 46
Resources for the Future Walls et al.
13
Federal Grants/Funding
Mean 2.30%Median 0%Standard Deviation 4.55%Range 20%Minimum 0%Maximum 20%Count 46
Resources for the Future Walls et al.
14
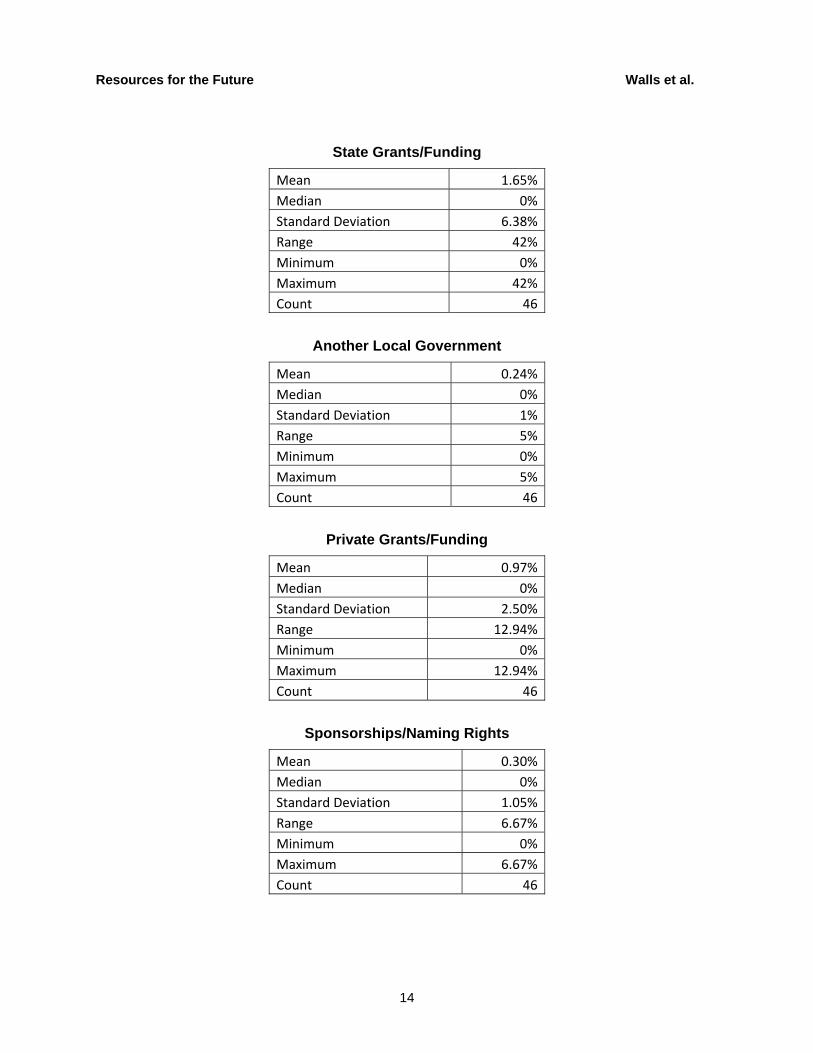
State Grants/Funding
Mean 1.65%Median 0%Standard Deviation 6.38%Range 42%Minimum 0%Maximum 42%Count 46
Another Local Government
Mean 0.24%Median 0%Standard Deviation 1%Range 5%Minimum 0%Maximum 5%Count 46
Private Grants/Funding
Mean 0.97%Median 0%Standard Deviation 2.50%Range 12.94%Minimum 0%Maximum 12.94%Count 46
Sponsorships/Naming Rights
Mean 0.30%Median 0%Standard Deviation 1.05%Range 6.67%Minimum 0%Maximum 6.67%Count 46

Resources for the Future Walls et al.
15
Other
Mean 4.61%Median 0%Standard Deviation 12.74%Range 73.70%Minimum 0%Maximum 73.70%Count 46
Resources for the Future Walls et al.
16
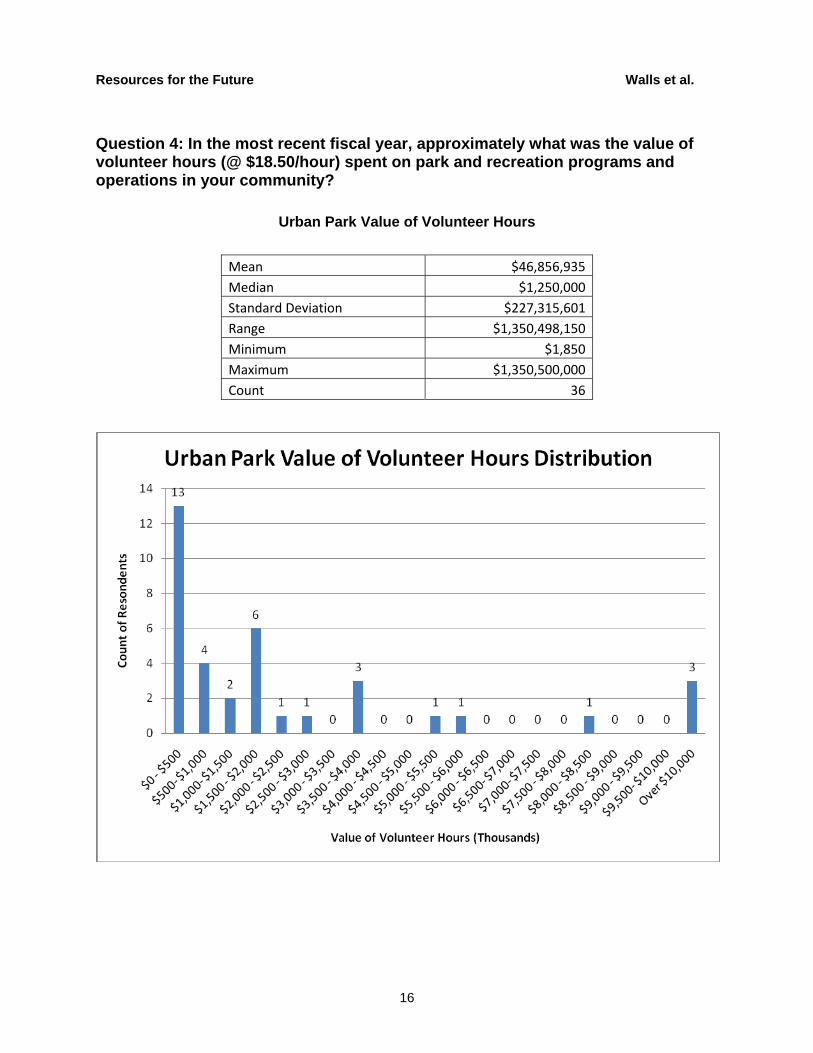
Question 4: In the most recent fiscal year, approximately what was the value of volunteer hours (@ $18.50/hour) spent on park and recreation programs and operations in your community?
Urban Park Value of Volunteer Hours
Mean $46,856,935 Median $1,250,000 Standard Deviation $227,315,601 Range $1,350,498,150 Minimum $1,850 Maximum $1,350,500,000 Count 36
Resources for the Future Walls et al.
17
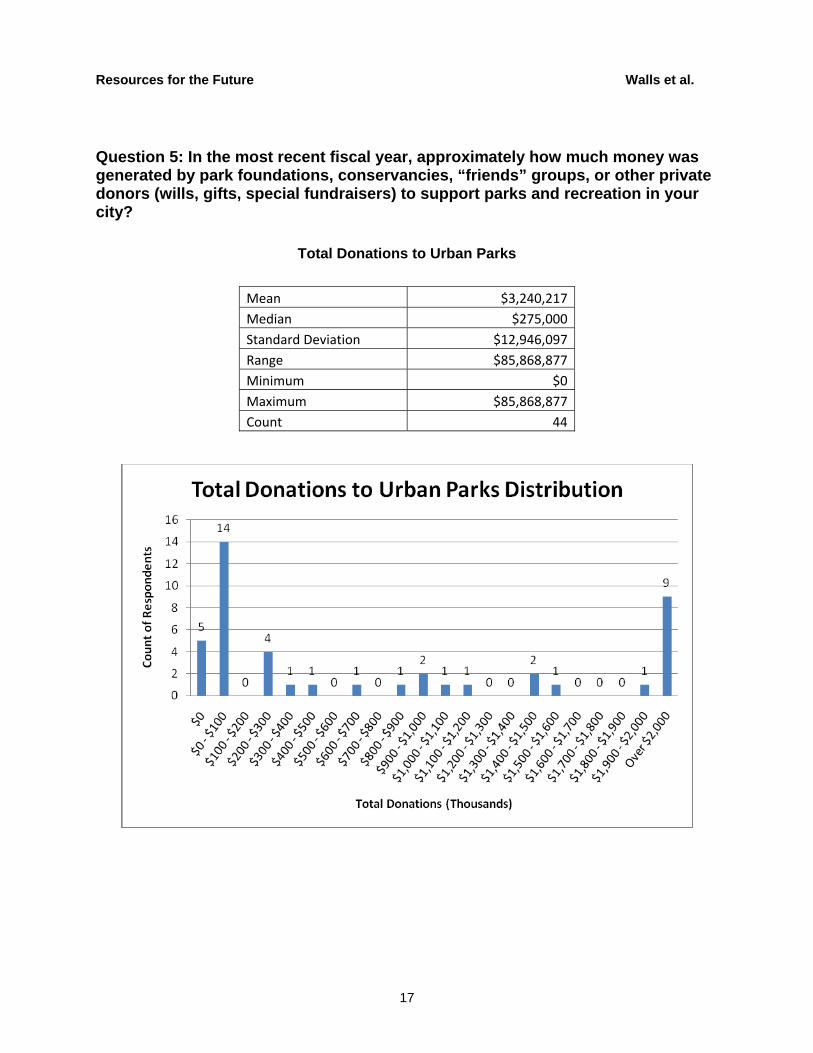
Question 5: In the most recent fiscal year, approximately how much money was generated by park foundations, conservancies, “friends” groups, or other private donors (wills, gifts, special fundraisers) to support parks and recreation in your city?
Total Donations to Urban Parks
Mean $3,240,217 Median $275,000 Standard Deviation $12,946,097 Range $85,868,877 Minimum $0 Maximum $85,868,877 Count 44
Resources for the Future Walls et al.
18
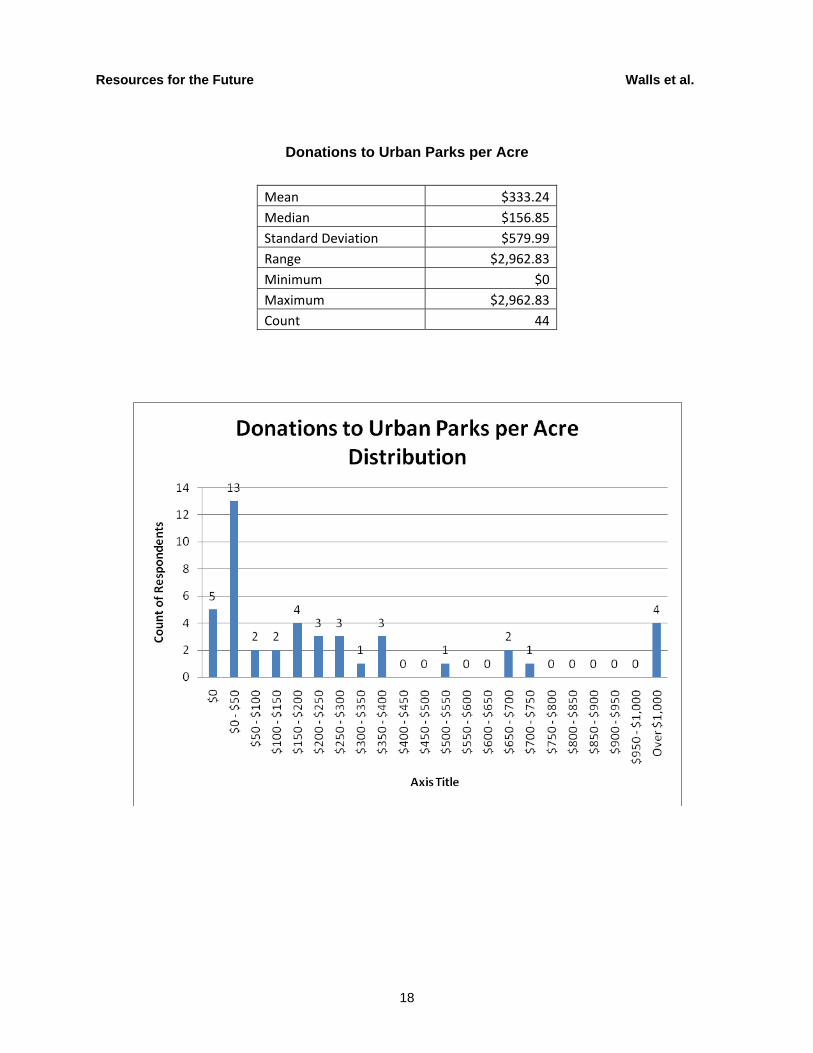
Donations to Urban Parks per Acre
Mean $333.24 Median $156.85 Standard Deviation $579.99 Range $2,962.83 Minimum $0 Maximum $2,962.83 Count 44
Resources for the Future Walls et al.
19
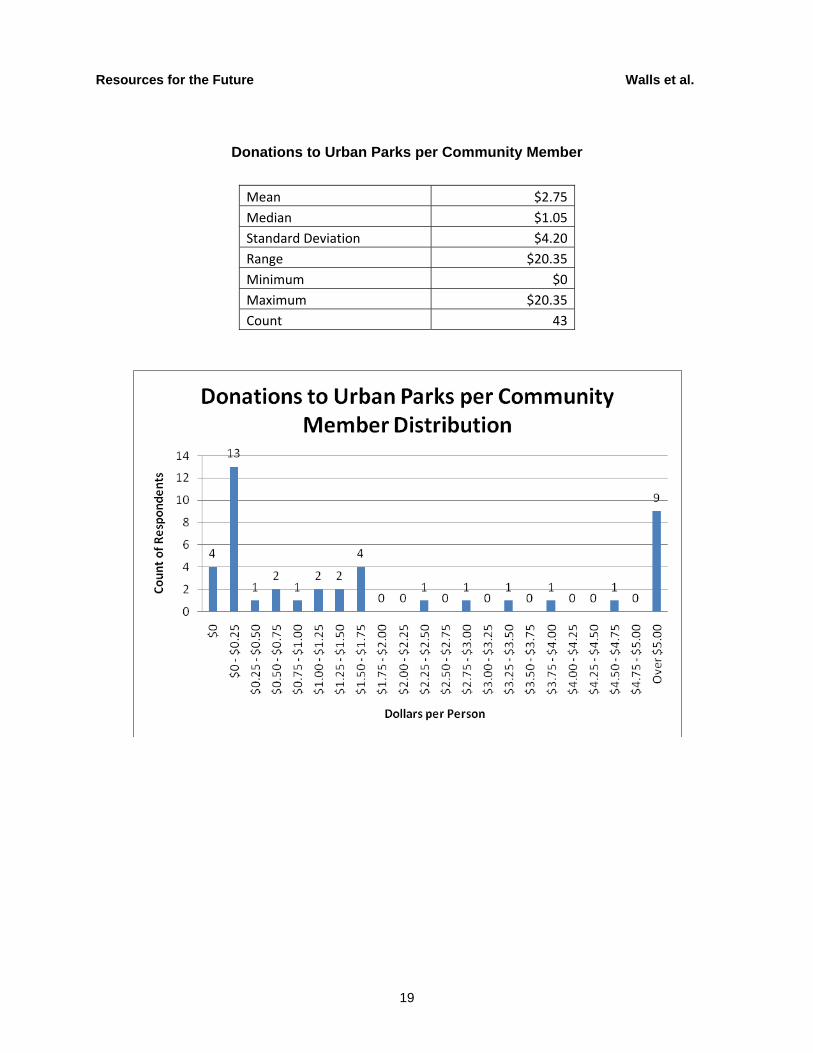
Donations to Urban Parks per Community Member
Mean $2.75 Median $1.05 Standard Deviation $4.20 Range $20.35 Minimum $0 Maximum $20.35 Count 43
Resources for the Future Walls et al.
20
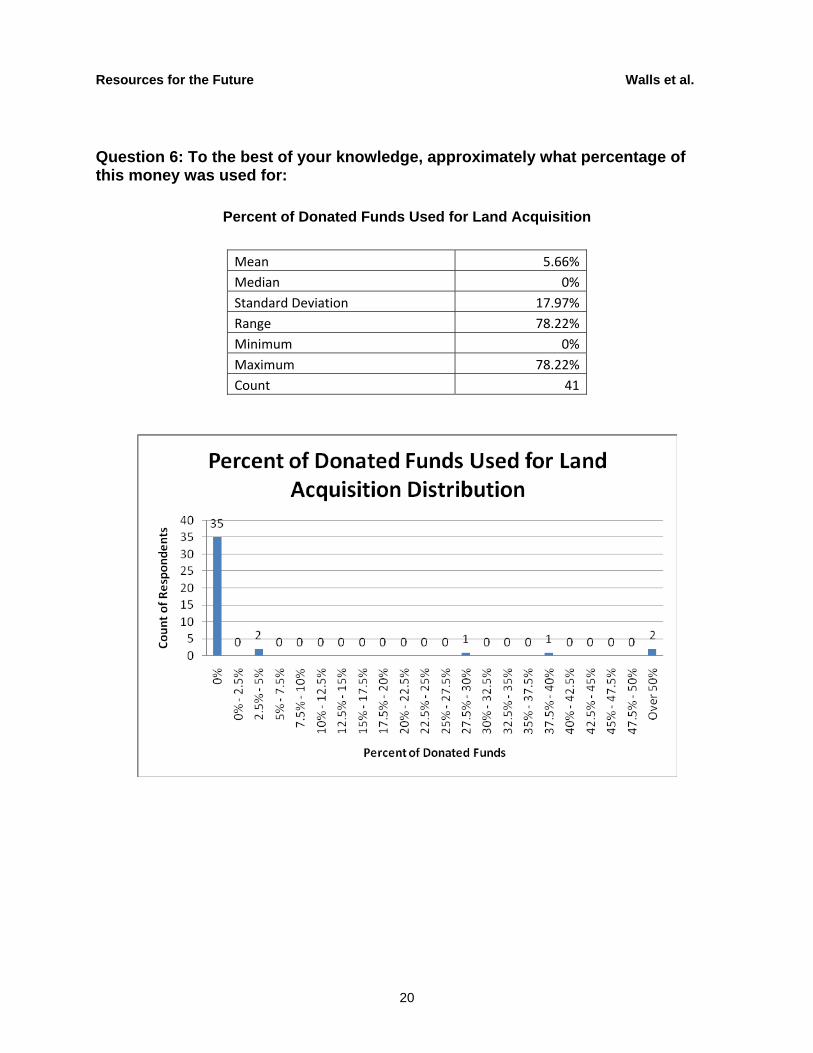
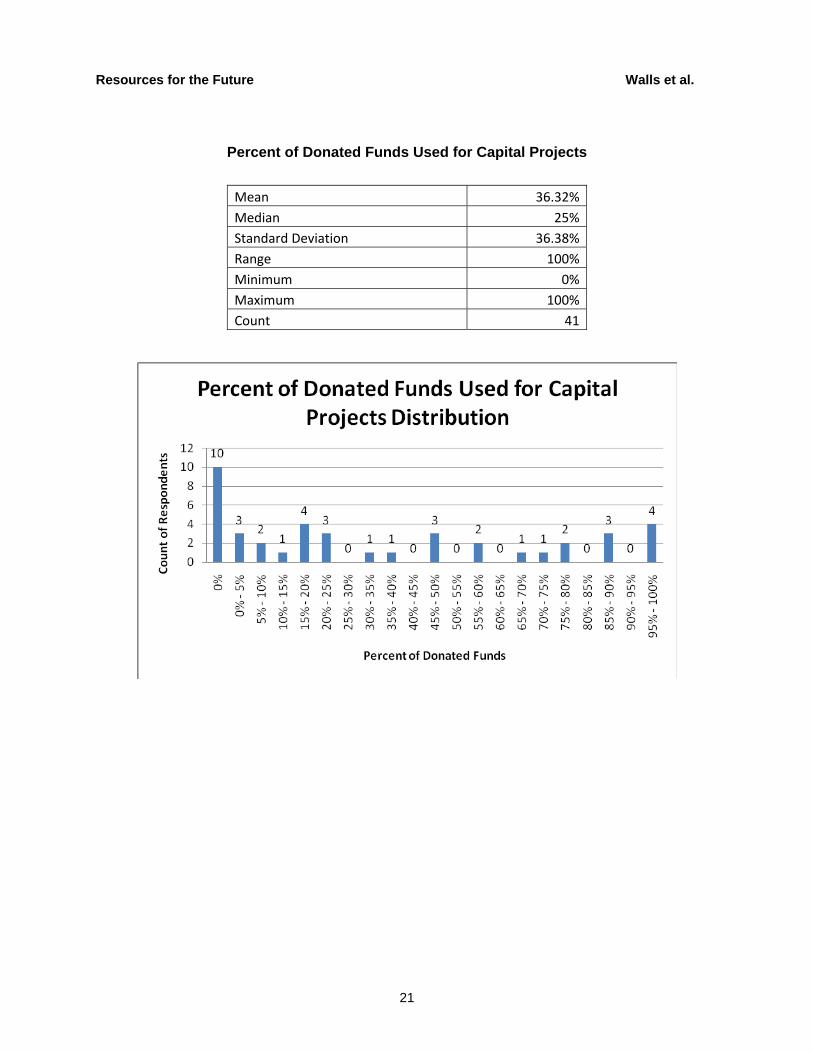
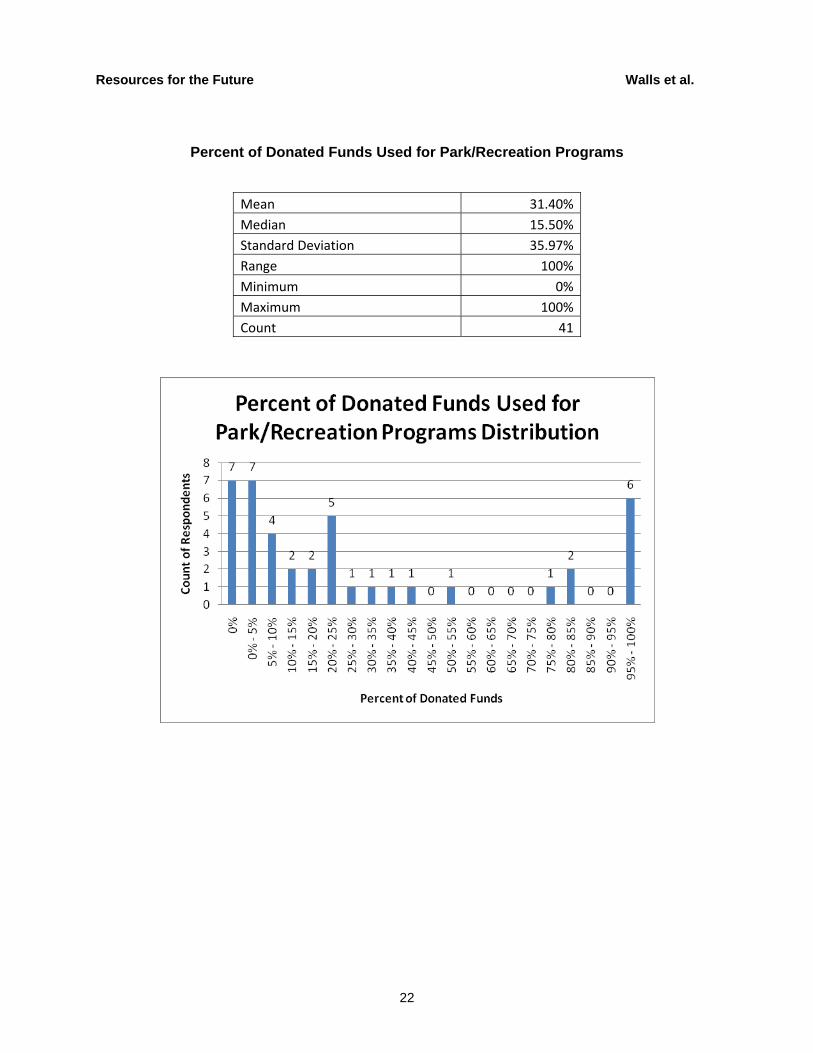
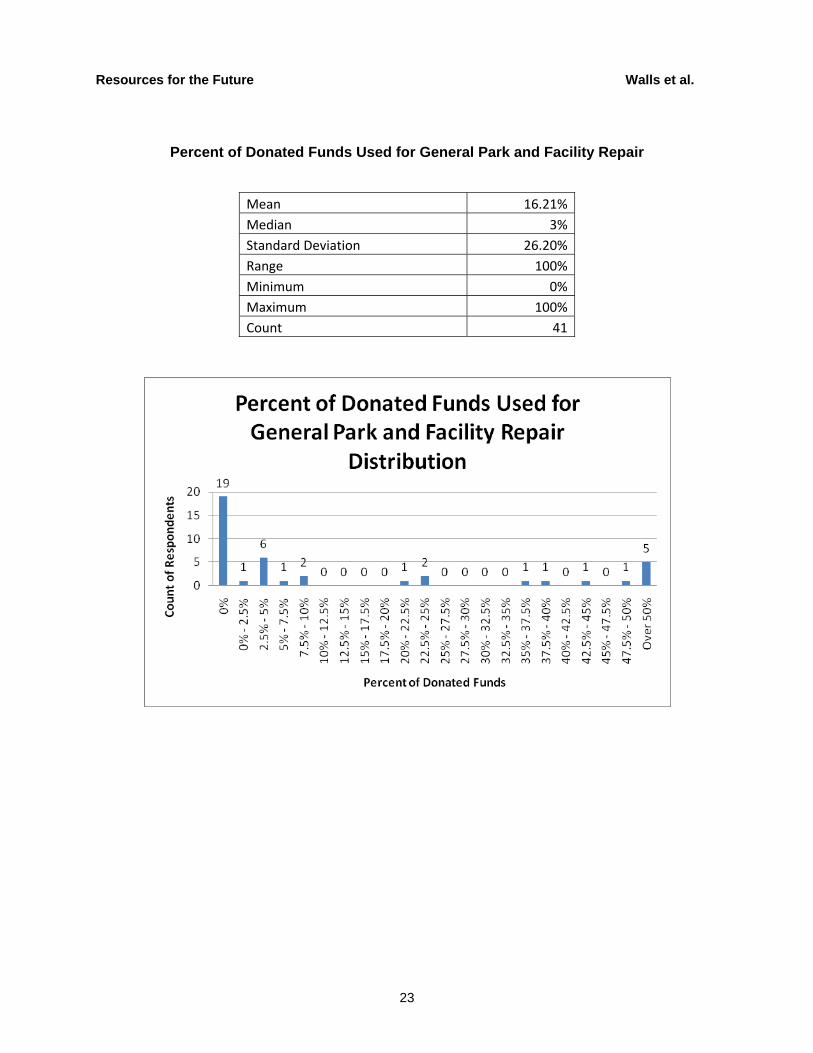
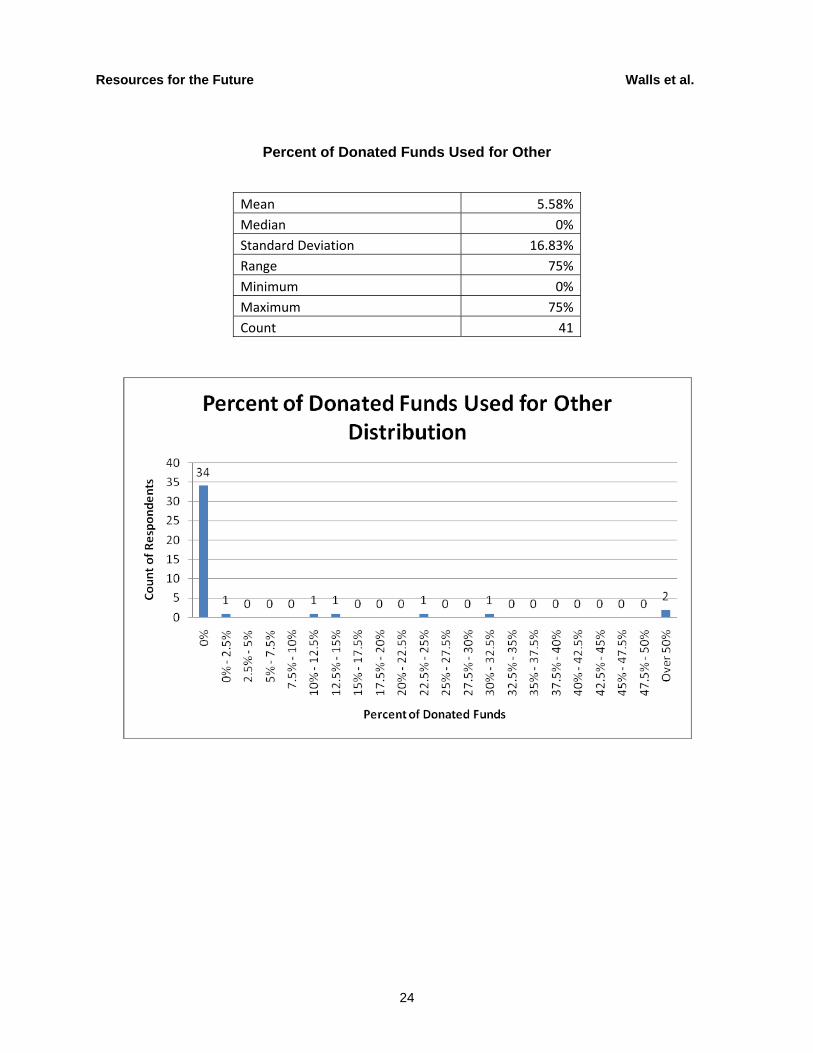
Question 6: To the best of your knowledge, approximately what percentage of this money was used for:
Percent of Donated Funds Used for Land Acquisition
Mean 5.66% Median 0% Standard Deviation 17.97% Range 78.22% Minimum 0% Maximum 78.22% Count 41
Resources for the Future Walls et al.
21
Percent of Donated Funds Used for Capital Projects
Mean 36.32% Median 25% Standard Deviation 36.38% Range 100% Minimum 0% Maximum 100% Count 41
Resources for the Future Walls et al.
22
Percent of Donated Funds Used for Park/Recreation Programs
Mean 31.40% Median 15.50% Standard Deviation 35.97% Range 100% Minimum 0% Maximum 100% Count 41
Resources for the Future Walls et al.
23
Percent of Donated Funds Used for General Park and Facility Repair
Mean 16.21%Median 3%Standard Deviation 26.20%Range 100%Minimum 0%Maximum 100%Count 41
Resources for the Future Walls et al.
24
Percent of Donated Funds Used for Other
Mean 5.58% Median 0% Standard Deviation 16.83% Range 75% Minimum 0% Maximum 75% Count 41
Resources for the Future Walls et al.
25
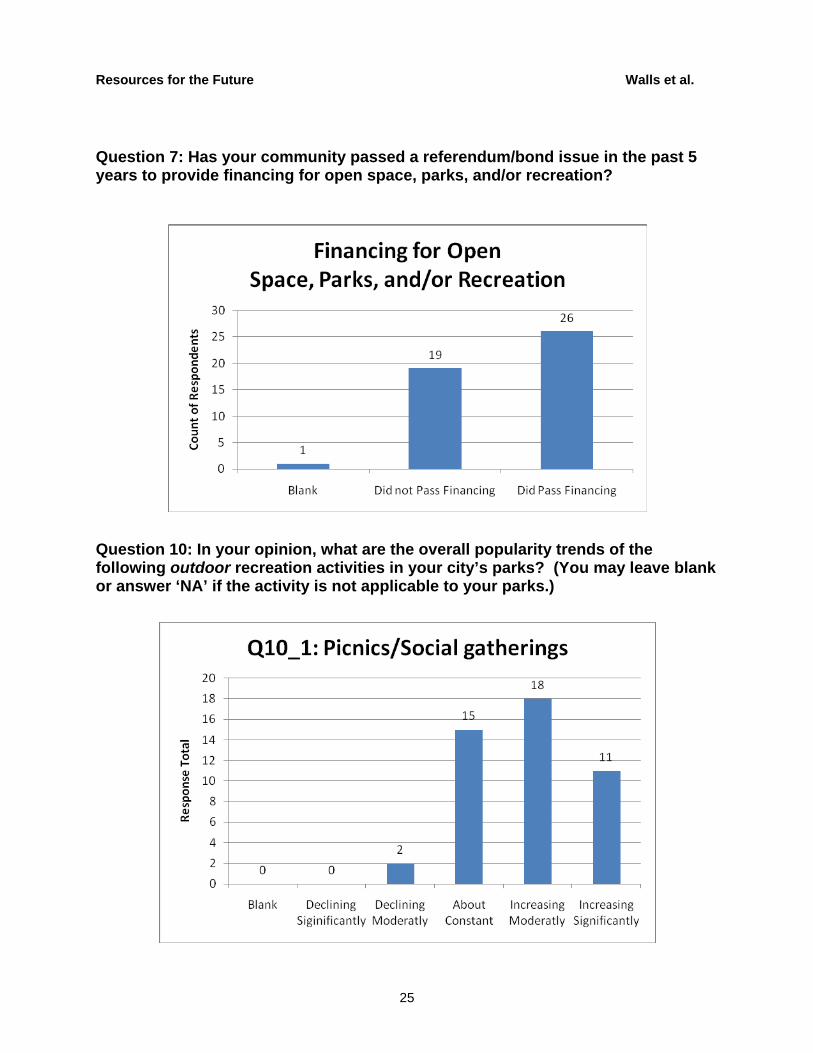
Question 7: Has your community passed a referendum/bond issue in the past 5 years to provide financing for open space, parks, and/or recreation?
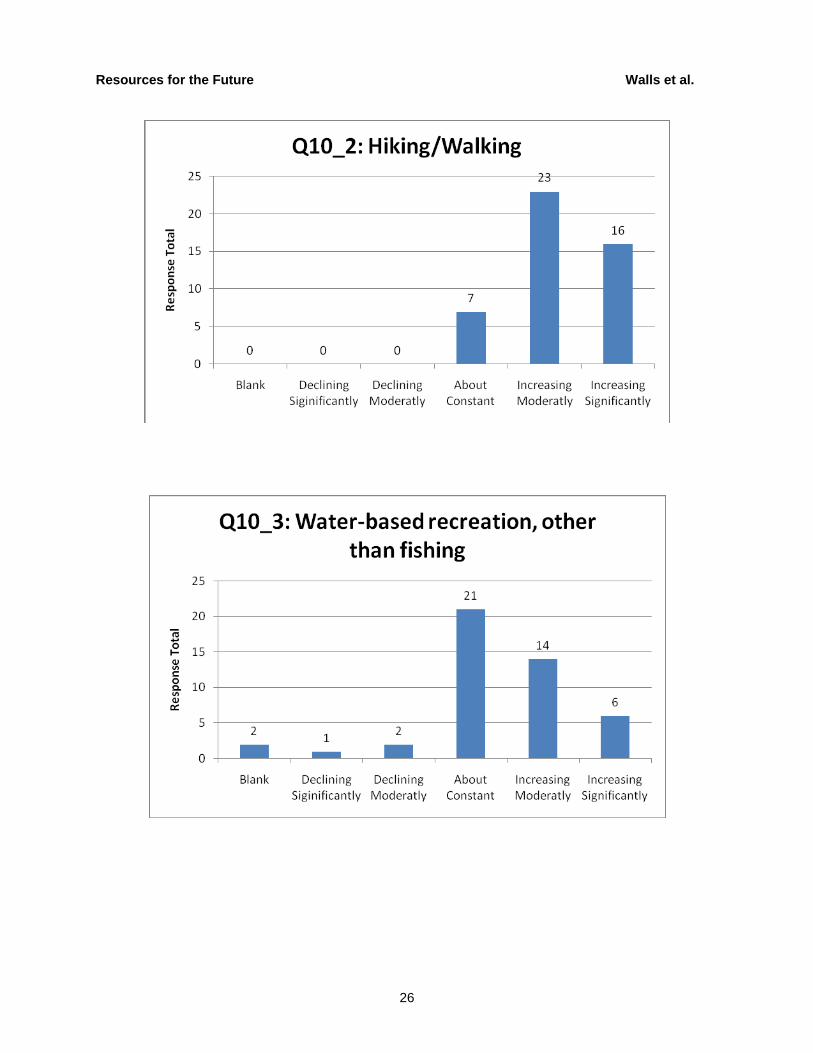
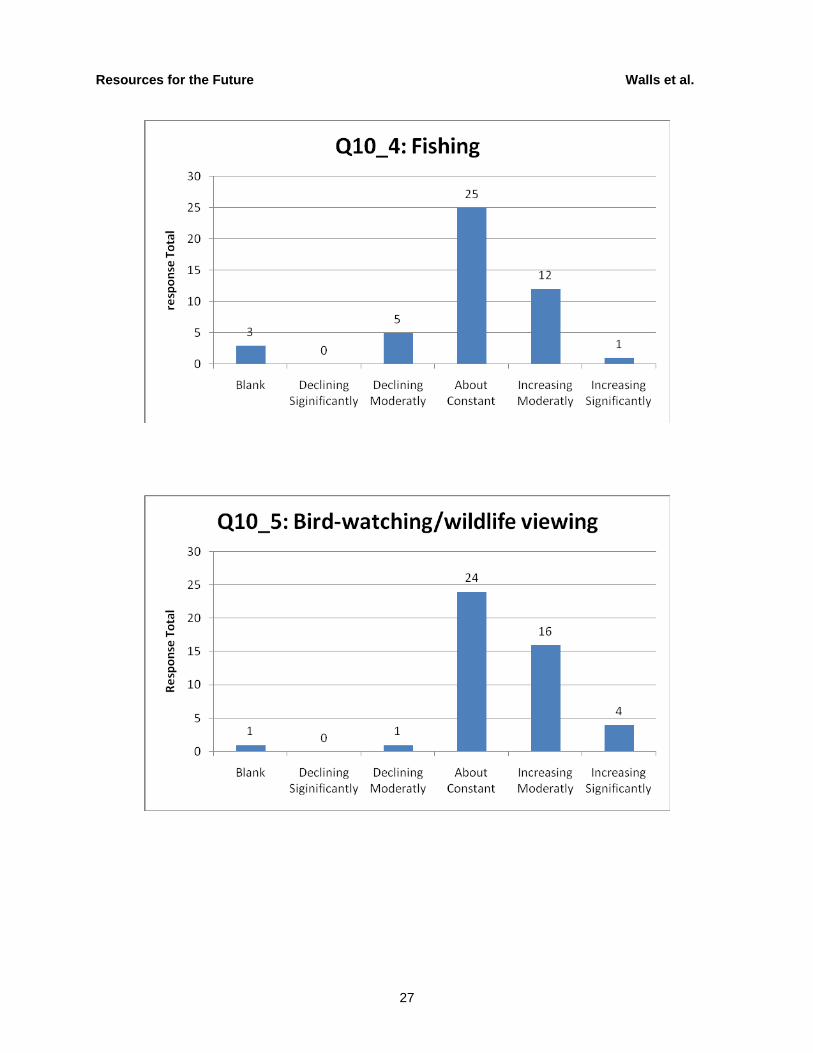
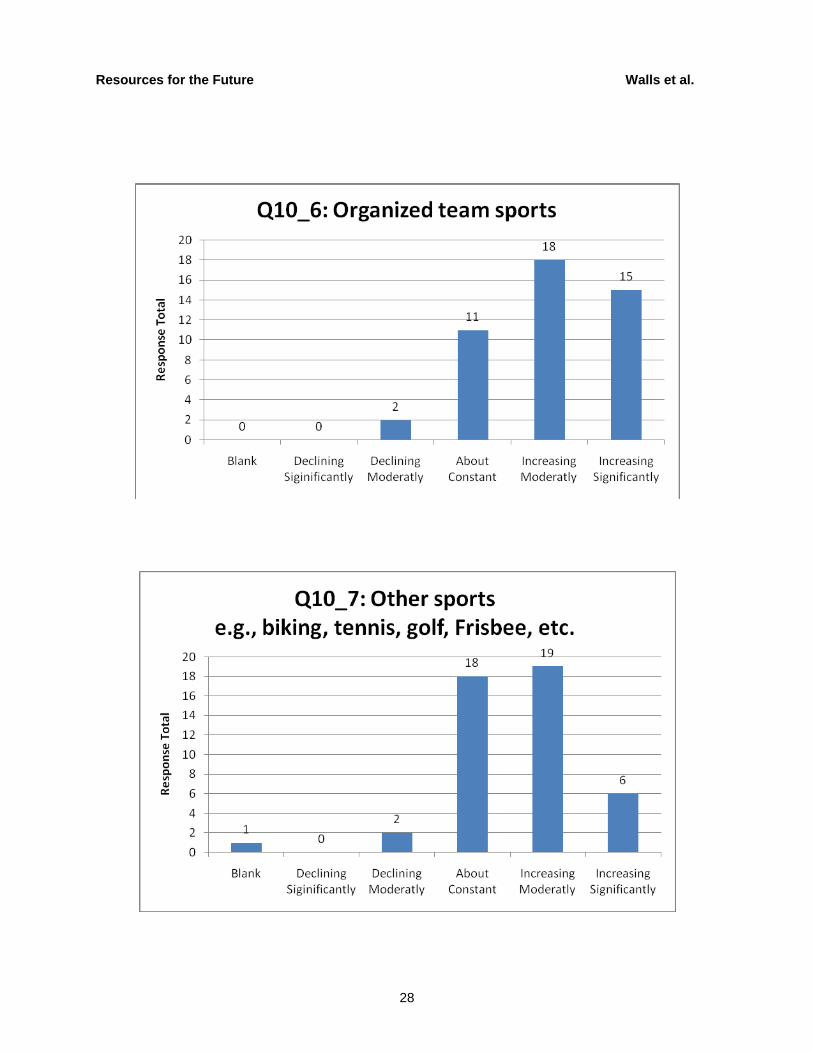
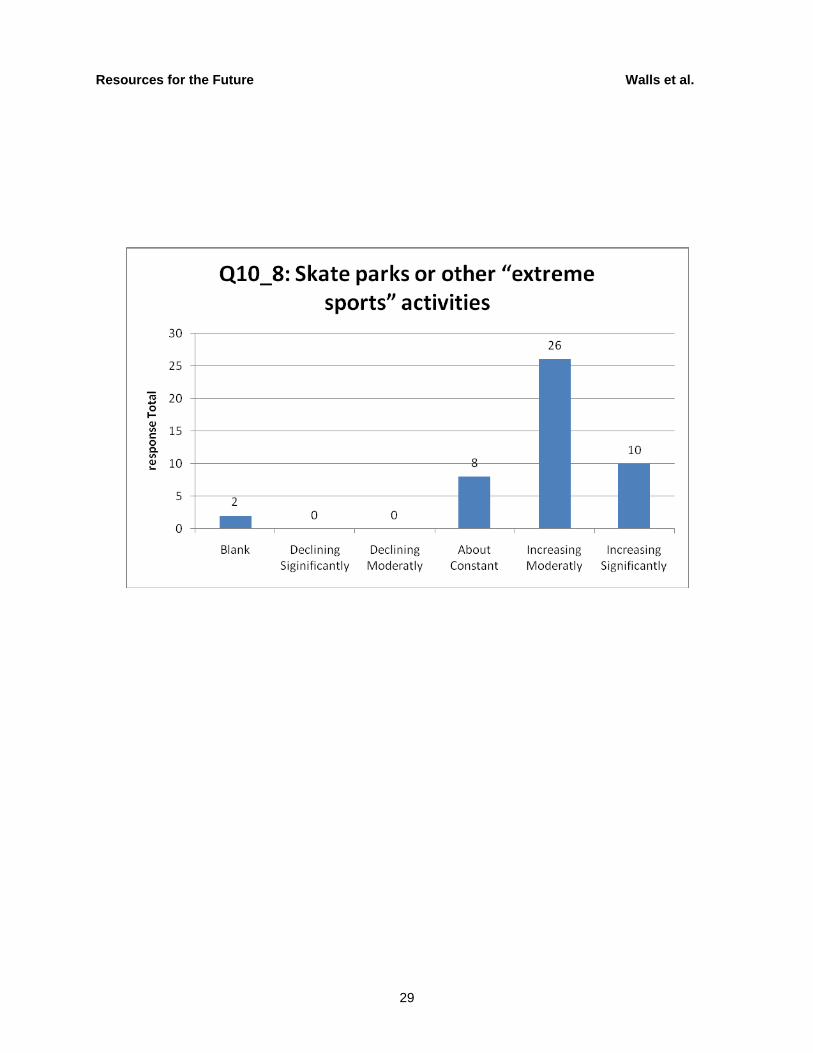
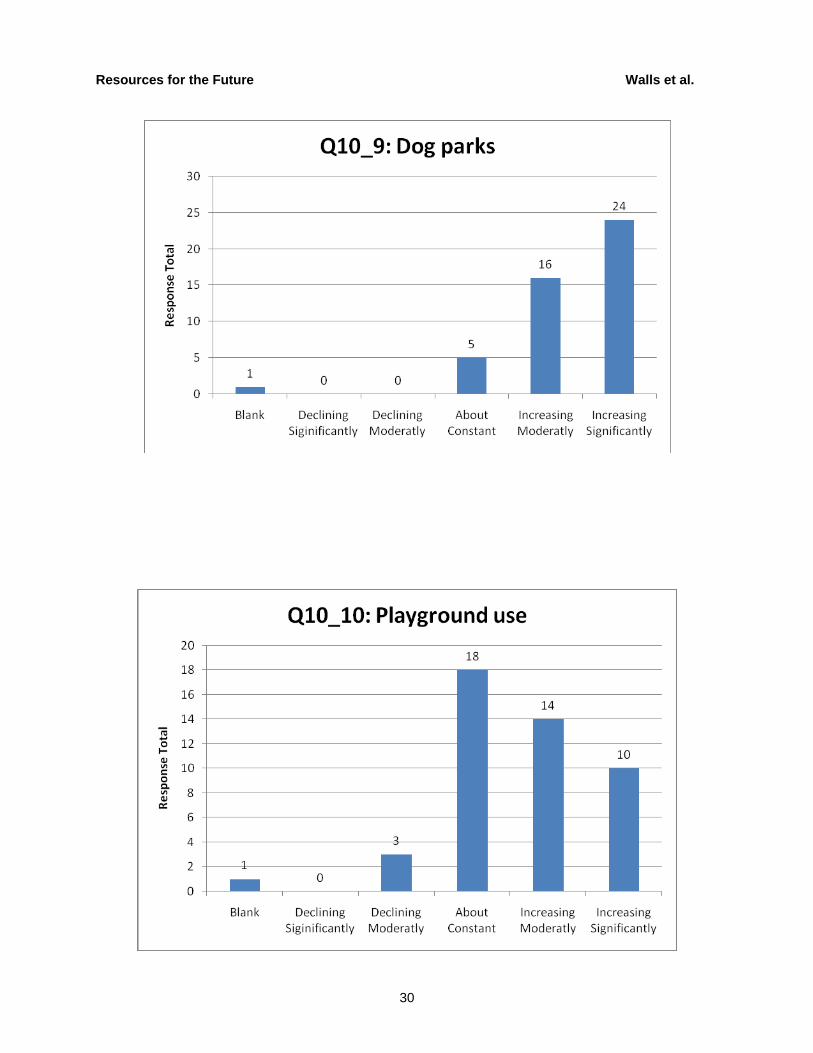
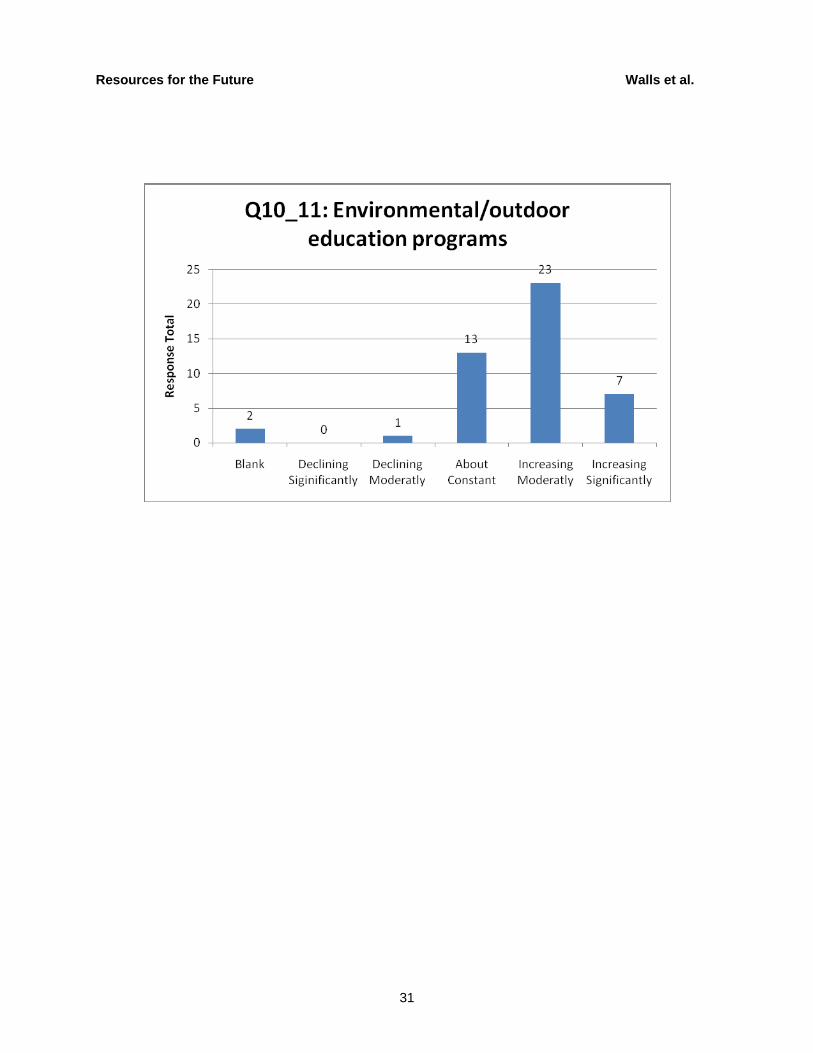
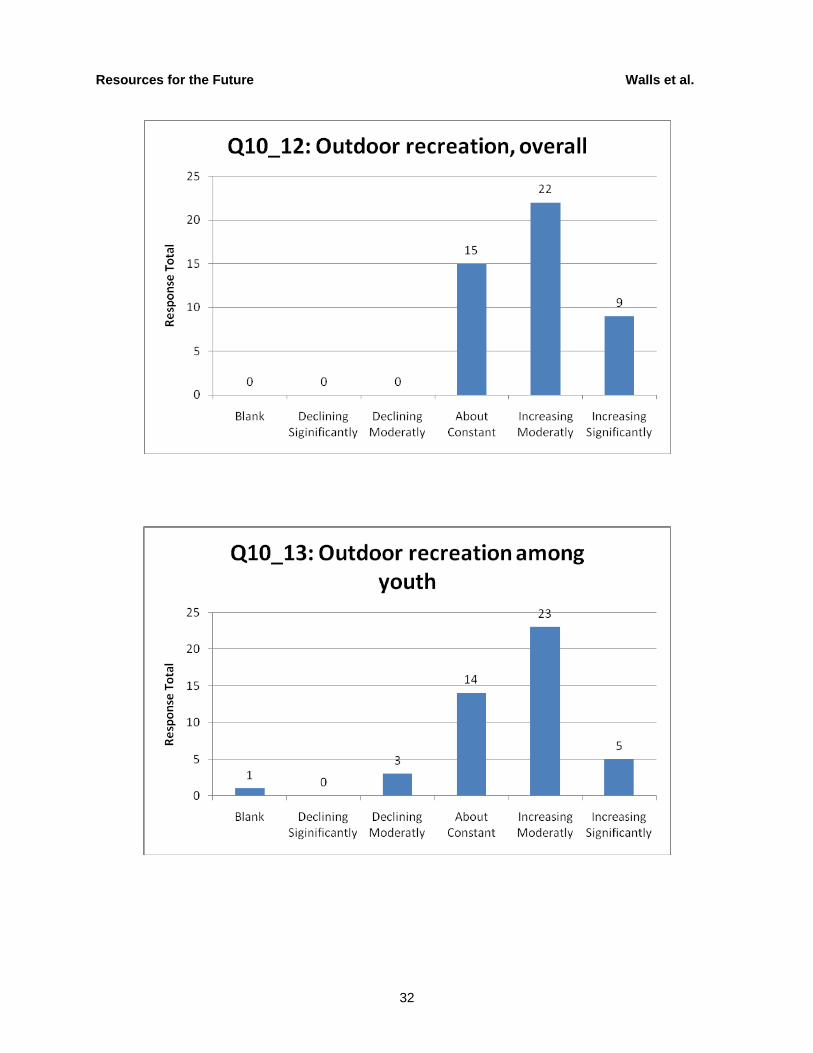
Question 10: In your opinion, what are the overall popularity trends of the following outdoor recreation activities in your city’s parks? (You may leave blank or answer ‘NA’ if the activity is not applicable to your parks.)
Resources for the Future Walls et al.
26
Resources for the Future Walls et al.
27
Resources for the Future Walls et al.
28
Resources for the Future Walls et al.
29
Resources for the Future Walls et al.
30
Resources for the Future Walls et al.
31
Resources for the Future Walls et al.
32
Resources for the Future Walls et al.
33
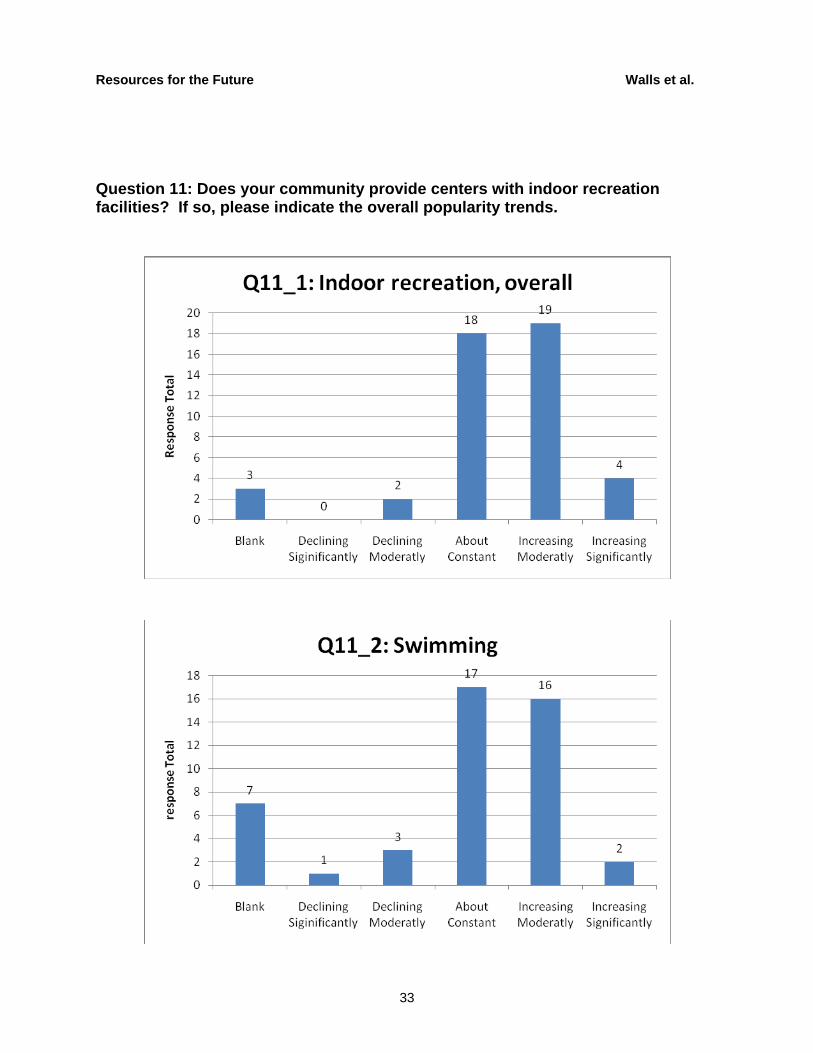
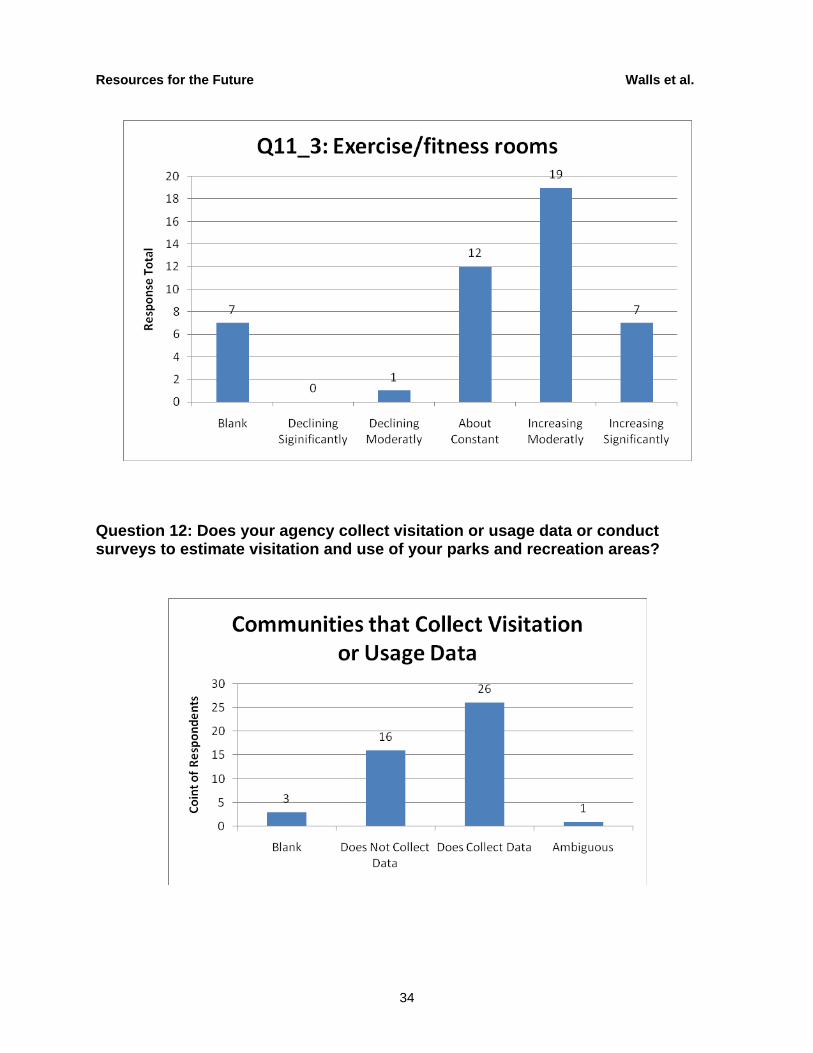
Question 11: Does your community provide centers with indoor recreation facilities? If so, please indicate the overall popularity trends.
Resources for the Future Walls et al.
34
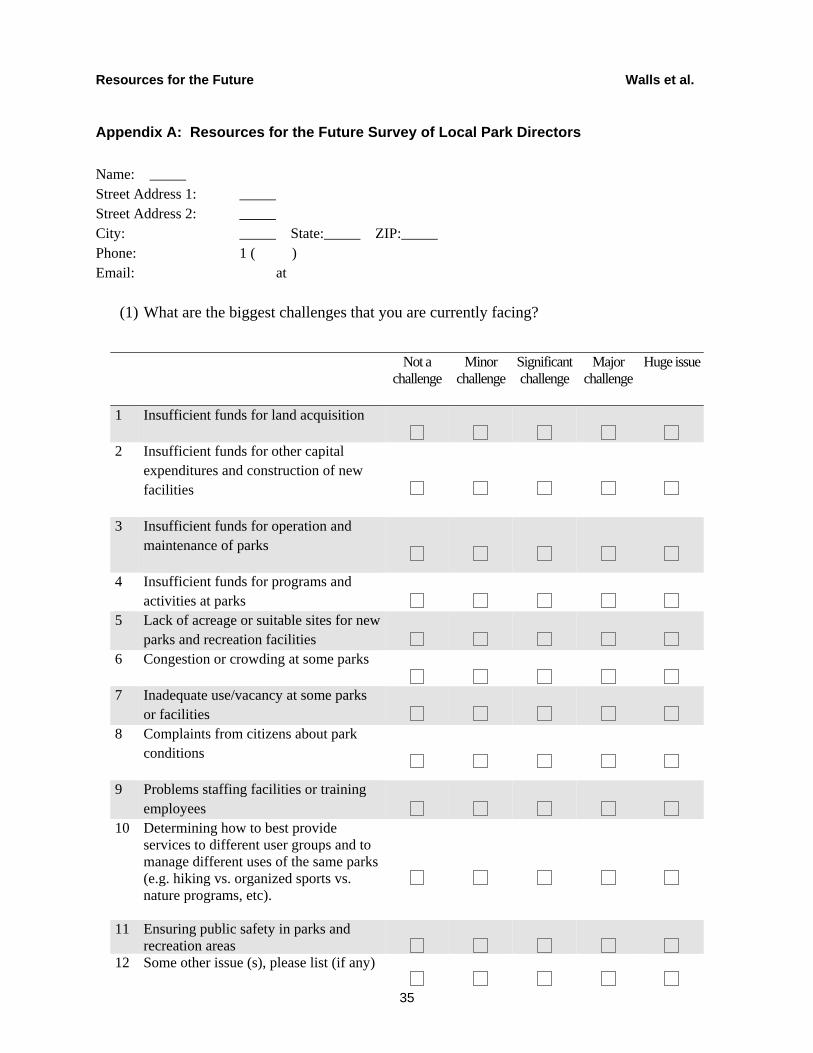
Question 12: Does your agency collect visitation or usage data or conduct surveys to estimate visitation and use of your parks and recreation areas?
Resources for the Future Walls et al.
35
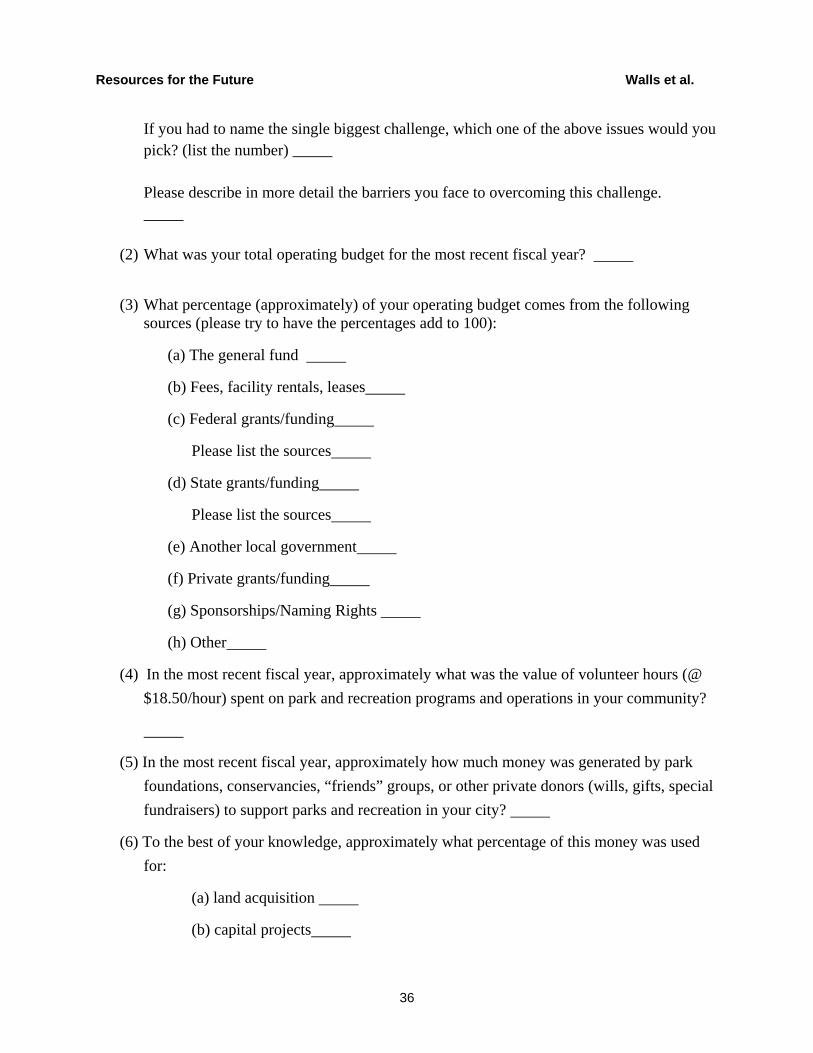
Appendix A: Resources for the Future Survey of Local Park Directors Name: Street Address 1: Street Address 2: City: State: ZIP: Phone: 1 ( ) Email: at
(1) What are the biggest challenges that you are currently facing?
Not a challenge
Minor challenge
Significant challenge
Major challenge
Huge issue
1 Insufficient funds for land acquisition
2 Insufficient funds for other capital expenditures and construction of new facilities
3 Insufficient funds for operation and maintenance of parks
4 Insufficient funds for programs and activities at parks
5 Lack of acreage or suitable sites for new parks and recreation facilities
6 Congestion or crowding at some parks
7 Inadequate use/vacancy at some parks or facilities
8 Complaints from citizens about park conditions
9 Problems staffing facilities or training employees
10 Determining how to best provide services to different user groups and to manage different uses of the same parks (e.g. hiking vs. organized sports vs. nature programs, etc).
11 Ensuring public safety in parks and recreation areas
12 Some other issue (s), please list (if any)
Resources for the Future Walls et al.
36
If you had to name the single biggest challenge, which one of the above issues would you pick? (list the number) Please describe in more detail the barriers you face to overcoming this challenge.
(2) What was your total operating budget for the most recent fiscal year?
(3) What percentage (approximately) of your operating budget comes from the following
sources (please try to have the percentages add to 100):
(a) The general fund
(b) Fees, facility rentals, leases
(c) Federal grants/funding
Please list the sources
(d) State grants/funding
Please list the sources
(e) Another local government
(f) Private grants/funding
(g) Sponsorships/Naming Rights
(h) Other
(4) In the most recent fiscal year, approximately what was the value of volunteer hours (@ $18.50/hour) spent on park and recreation programs and operations in your community?
(5) In the most recent fiscal year, approximately how much money was generated by park foundations, conservancies, “friends” groups, or other private donors (wills, gifts, special fundraisers) to support parks and recreation in your city?
(6) To the best of your knowledge, approximately what percentage of this money was used for:
(a) land acquisition
(b) capital projects
Resources for the Future Walls et al.
37
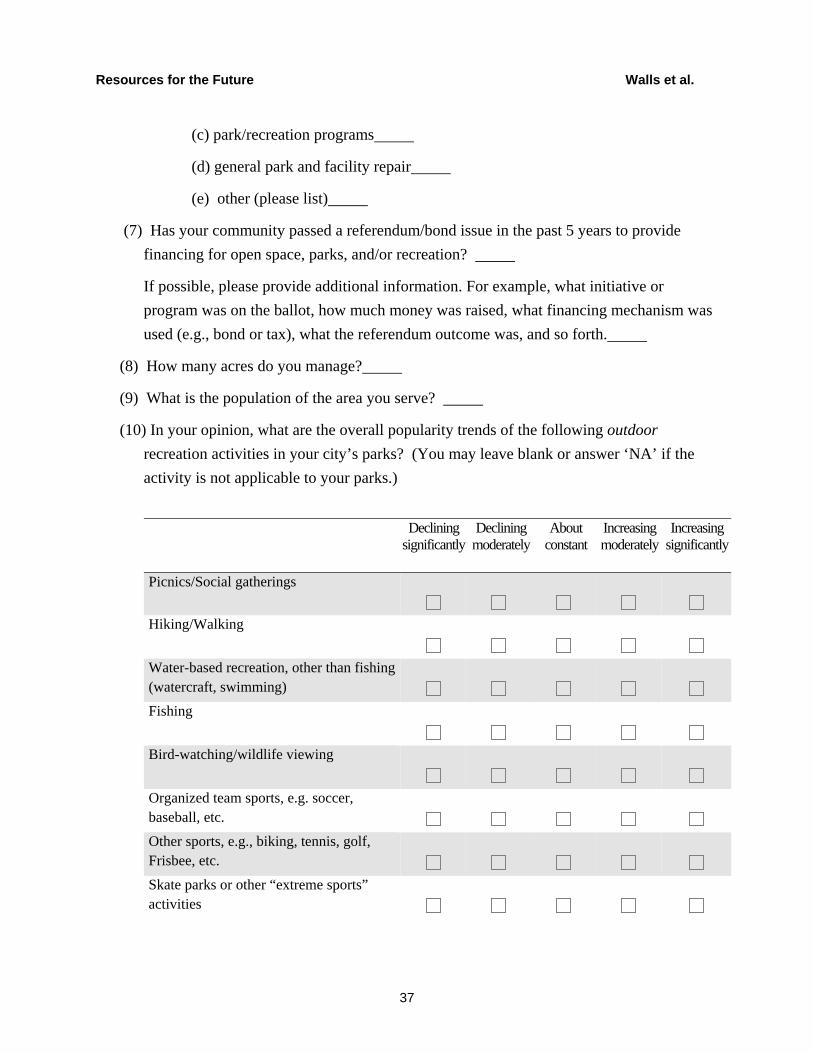
(c) park/recreation programs
(d) general park and facility repair
(e) other (please list)
(7) Has your community passed a referendum/bond issue in the past 5 years to provide financing for open space, parks, and/or recreation?
If possible, please provide additional information. For example, what initiative or program was on the ballot, how much money was raised, what financing mechanism was used (e.g., bond or tax), what the referendum outcome was, and so forth.
(8) How many acres do you manage?
(9) What is the population of the area you serve?
(10) In your opinion, what are the overall popularity trends of the following outdoor recreation activities in your city’s parks? (You may leave blank or answer ‘NA’ if the activity is not applicable to your parks.)
Declining
significantly Declining
moderately About
constant Increasing moderately
Increasing significantly
Picnics/Social gatherings
Hiking/Walking
Water-based recreation, other than fishing (watercraft, swimming)
Fishing
Bird-watching/wildlife viewing
Organized team sports, e.g. soccer, baseball, etc.
Other sports, e.g., biking, tennis, golf, Frisbee, etc.
Skate parks or other “extreme sports” activities
Resources for the Future Walls et al.
38
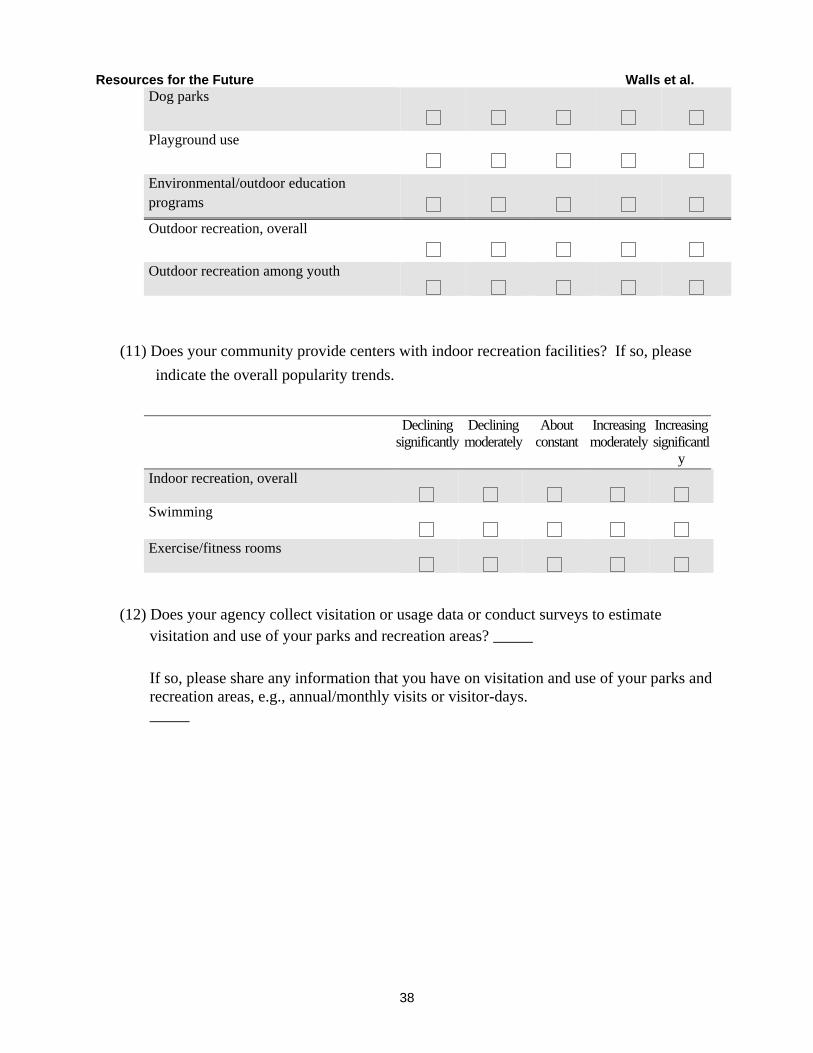
Dog parks
Playground use
Environmental/outdoor education programs
Outdoor recreation, overall
Outdoor recreation among youth
(11) Does your community provide centers with indoor recreation facilities? If so, please indicate the overall popularity trends.
Declining
significantly Declining
moderately About
constant Increasing moderately
Increasing significantl
y Indoor recreation, overall
Swimming
Exercise/fitness rooms
(12) Does your agency collect visitation or usage data or conduct surveys to estimate
visitation and use of your parks and recreation areas?
If so, please share any information that you have on visitation and use of your parks and recreation areas, e.g., annual/monthly visits or visitor-days.
Resources for the Future Walls et al.
39
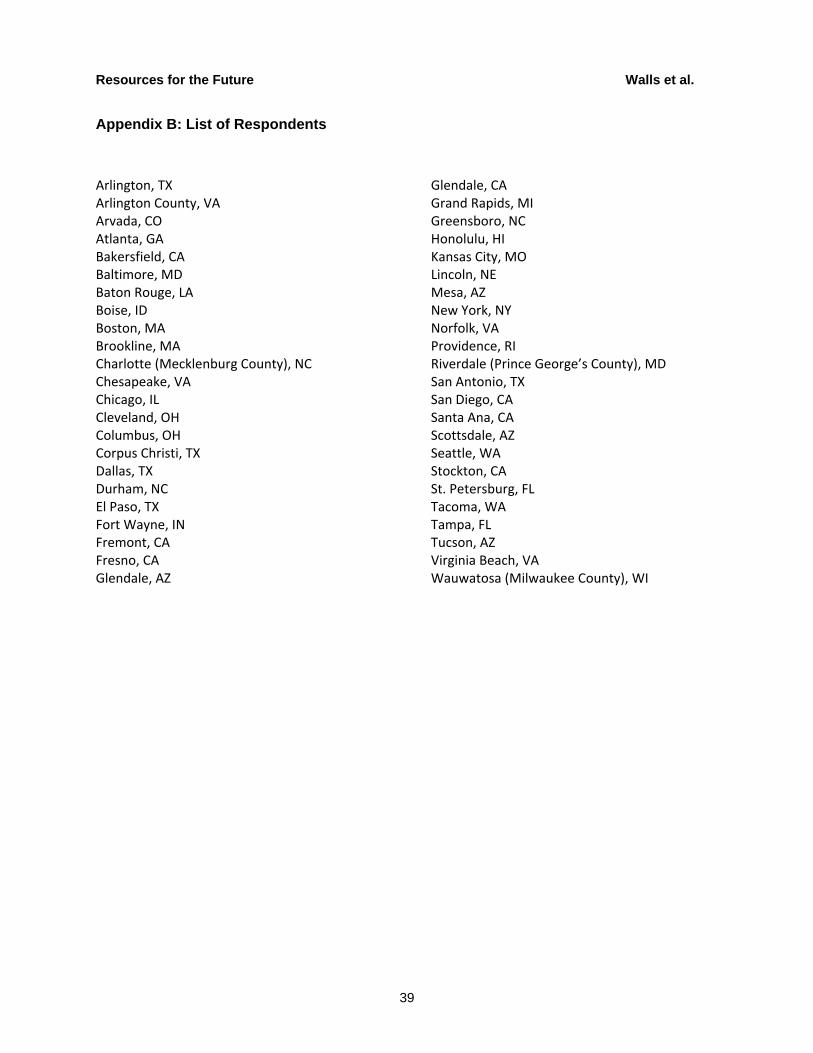
Appendix B: List of Respondents Arlington, TX Arlington County, VA Arvada, CO Atlanta, GA Bakersfield, CA Baltimore, MD Baton Rouge, LA Boise, ID Boston, MA Brookline, MA Charlotte (Mecklenburg County), NC Chesapeake, VA Chicago, IL Cleveland, OH Columbus, OH Corpus Christi, TX Dallas, TX Durham, NC El Paso, TX Fort Wayne, IN Fremont, CA Fresno, CA Glendale, AZ
Glendale, CA Grand Rapids, MI Greensboro, NC Honolulu, HI Kansas City, MO Lincoln, NE Mesa, AZ New York, NY Norfolk, VA Providence, RI Riverdale (Prince George’s County), MD San Antonio, TX San Diego, CA Santa Ana, CA Scottsdale, AZ Seattle, WA Stockton, CA St. Petersburg, FL Tacoma, WA Tampa, FL Tucson, AZ Virginia Beach, VA Wauwatosa (Milwaukee County), WI


