
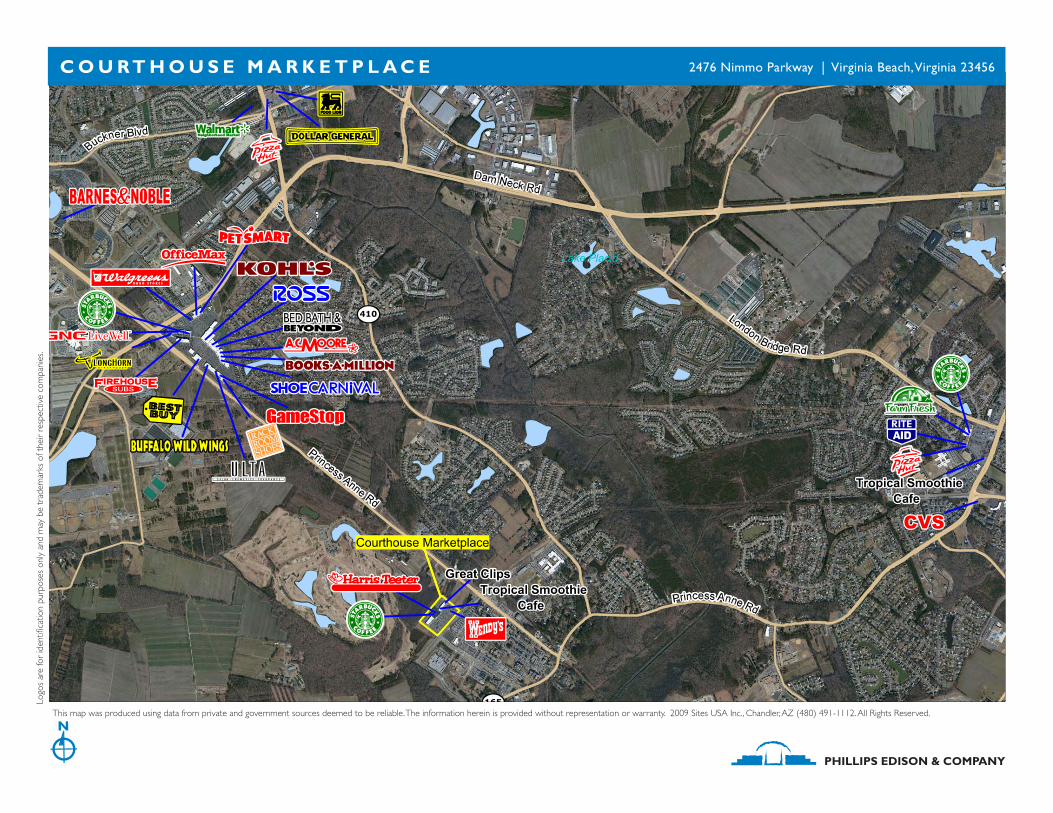
L O C AT I O N 2476 Nimmo Parkway | Virginia Beach, Virginia 23456
P RO P E RT Y H I G H L I G H T S
• AnchoredbyHarrisTeeter,oneoftheleadinggrocersin theMid-Atlantic
• NationaltenantsincludeTheUPSStore,GreatClips,Wendy’sand SunTrustBank
• LocatedacrossthestreetfromtheVirginiaBeachMunicipalCenter andCourthouseComplex,ahubforthecity’s7,000+full timeemployees
• Populationwithinathree-mileradiusexceeds49,000peoplewith anaveragehouseholdincomeofmorethan$75,700
P H I L L I P S E D I S O N & C O M P A N Y
VIRGINIA BEACH, VIRGINIA
Norfolk Virginia Beach
165
165
149
264
64
COURTHOUSE MARKETPLACE
CourthouseMarketplace
165
149
410
PrincessAnneRd
165
Nimmo P
ky
Virginia BeachNationalGolfClub
C O U R T H O U S E M A R K E T P L A C E VIRGINIA BEACH, VIRGINIA
S I Z E 106,863squarefeet
L E A S I N G C O N TAC T
Andy Schneider PhillipsEdison&Company11501NorthlakeDriveCincinnati,OH45249
Office(513)746-2605 Mobile(513)417-4369
MORE I N FO www.phillipsedison.com

NIMMO PARKWAY
PYLONSIGN
PYLONSIGN
113104101
102
125
124
118111
110
108 12
6
103 109
112 12
812
7
117
116
115
114 121 122
O-5O-6
PR
INC
ES
S A
NN
E R
OA
D28,000V
PD
SITE BOUNDARY
*Drawing not to scale
pecopublish
COURTHOUSE MARKETPLACE 2476 NIMMO PARKWAY | VIRGINIA BEACH, VA 23456
101 Som Bao Cafe 2,043102 AVAILABLE 2,046103 Stan's American
Bistro4,000
104 Taylor's DoIt Center
8,026
108 Total Access Fitness 2,500109 AVAILABLE 1,841110 AVAILABLE 2,000111 AVAILABLE 2,000112 AVAILABLE 2,000
SPACE TENANT SQ. FT.
113 Harris Teeter 48,756114 Albano Cleaners 1,608115 The UPS Store 1,603116 One Touch Nails 1,607117 Tropical Smoothie
Cafe1,668
118 AVAILABLE 3,212121 Slipow, Robusto
and Kellam P.C3,340
122 Beach MunicipalFederal Credit Union
3,243
SPACE TENANT SQ. FT.
124 Zero's Subs 1,606125 Soundvision Studios 1,664126 AVAILABLE 1,400127 East Wok 1,400128 Great Clips 1,400O-5 SunTrust 3,600O-6 Wendy's 4,300
TOTAL SQ. FT. 106,863
SPACE TENANT SQ. FT. SITE LEGEND
Available
Occupied
Leased (not occupied)
Owned by Others

C O U R T H O U S E M A R K E T P L A C E 2476 Nimmo Parkway | Virginia Beach, Virginia 23456
COURTHOUSE MARKETPLACE 2476 NIMMO PARKWAY | VIRGINIA BEACH, VA 23456
PHILLIPS EDISON & COMPANY
2/11/2014
Lake Placid
1
410
165
Logos are for identification purposes only and may be tradem
arks of their respective companies.
PHILLIPS EDISON & COMPANY
This map was produced using data from private and government sources deemed to be reliable. The information herein is provided without representation or warranty. 2009 Sites USA Inc., Chandler, AZ (480) 491-1112. All Rights Reserved.
Logo
s ar
e fo
r id
entifi
catio
n pu
rpos
es o
nly
and
may
be
trad
emar
ks o
f the
ir re
spec
tive
com
pani
es.
C O U R T H O U S E M A R K E T P L A C E 2476 Nimmo Parkway | Virginia Beach, Virginia 23456

Demographic Summary Report1990 - 2000 Census, 2013 Estimates & 2018 Projections
Calculated using TAS Retrieval Retrieval
Latitude: 36.754868 Longitude: -76.065112Mar 7, 2014
1.00 Mile Radius 3.00 Mile Radius 5.00 Mile Radius10.00 Mile
Radius
Courthouse Marketplace
Po
pu
lati
on
1.00 Mile Radius 3.00 Mile Radius 5.00 Mile Radius10.00 Mile
Radius
Courthouse Marketplace
Virginia Beach,VA
Q4 2013 Estimated Population 4,331 39,598 139,556 464,145
2018 Projected Population 4,268 40,222 142,316 477,637
2010 Census Population 4,434 38,874 136,994 452,410
2000 Census Population 3,620 32,513 124,418 434,137
1990 Census Population 1,671 17,371 98,466 387,633
Historical Annual Growth 1990 to 2000 8.03% 6.47% 2.37% 1.14%
Historical Annual Growth 2000 to 2010 2.05% 1.80% 0.97% 0.41%
Estimated Annual Growth 2010 to2013 -0.63% 0.49% 0.50% 0.69%
Projected Annual Growth 2013 to 2018 -0.29% 0.31% 0.39% 0.57%
Median Age 38.7 37.5 34.7 36.2
Q4 2013 Estimated Households 1,179 12,703 46,717 172,563
2018 Projected Households 1,161 12,905 47,598 177,665
2010 Census Households 1,206 12,458 45,827 168,248
2000 Census Households 997 10,114 39,530 155,273
1990 Census Households 495 5,373 30,246 133,296
Historical Annual Growth 1990 to 2000 7.26% 6.53% 2.71% 1.54%
Historical Annual Growth 2000 to 2013 1.92% 2.11% 1.49% 0.81%
Estimated Annual Growth 2000 to 2013 -0.62% 0.52% 0.51% 0.68%
Projected Annual Growth 2013 to 2018 -0.31% 0.32% 0.37% 0.58%
Population per Household 3.17 3.00 2.94 2.65
White 71.0% 68.1% 59.6% 64.1%
Black or African American 15.9% 14.9% 20.4% 19.5%
Asian & Pacific Islander 4.8% 7.4% 8.2% 6.1%
Other Races 3.5% 3.7% 4.3% 3.9%
Hispanic Population 4.8% 5.9% 7.5% 6.4%
Average Household Income $114,303 $99,369 $85,296 $83,334
Median Household Income $100,922 $89,047 $73,846 $67,748
Per Capita Income $34,403 $32,760 $28,930 $31,383
Elementary 0.9% 1.3% 2.2% 2.1%
Some High School 5.5% 3.2% 3.9% 5.1%
High School Graduate 22.2% 21.3% 24.8% 23.7%
Some College 25.4% 29.4% 28.8% 27.5%
Associates Degree Only 12.7% 11.5% 11.9% 10.2%
Bachelors Degree Only 18.5% 21.5% 19.2% 20.6%
Graduate Degree 14.8% 11.8% 9.2% 10.8%
Number of Businesses 59 926 2,932 12,992
Total Number of Employees 1,927 16,164 62,760 232,975
Employees per Business 32.45 17.45 21.41 17.93
Residential Population per Business 72.92 42.76 47.61 35.73
Po
pu
lati
on
Th
is r
ep
ort
wa
s p
rod
uce
d u
sin
g d
ata
fro
m p
riva
te a
nd
go
ve
rnm
en
t so
urc
es d
ee
me
d to
be
re
liab
le a
nd
is h
ere
in p
rovid
ed
with
ou
t re
pre
se
nta
tio
n o
r w
arr
an
ty.
Ho
us
eh
old
sP
op
ula
tio
n
by
Ra
ce
Ed
ucati
on
(Ag
e 2
5+
)B
us
ine
ss
Inco
me
©2008, Trade Area Systems Data Source: Synergos Technologies Inc Austin, TX


