Cost-Effective, Actionable Engagement Detection at Scale
Ryan S. Baker, Jaclyn OcumpaughTeachers College, Columbia University
525 W. 120th St., Box 118New York, NY 10027 USA
1-212-678-8329 and [email protected], [email protected]
ABSTRACTCosts of educational measures and interventions have importantreal-world implications, made more pertinent when used at scale.Traditional measures of engagement (e.g., video and fieldobservations) scale linearly, so that expanding from 10 classroomsto 100 can incur 10 times the cost. By contrast, the cost ofapplying an automated sensor-free detector of student engagementis independent of the size of the data set. While the developmentand validation of such detectors requires an initial investment,once this cost is amortized across large data sets, the cost perstudent/hour is quite modest. In addition, these detectors can bereused each year at minimal additional cost. In this paper, weprovide a formal cost analysis of automated detectors ofengagement for ASSISTments.
KeywordsAffective computing, sensor-free detection, ASSISTments,STEM, student engagement, cost-effectiveness
1. INTRODUCTIONAutomated sensor-free detectors of student engagement are nowavailable for several systems [3, 6], shifting the debate fromwhether this detection is possible to a discussion of the upperlimits of its performance and generalizability (see [5]). Automateddetectors have been used to drive interventions [1] and indiscovery with models analyses [6, 8]. As researchers and policy-makers seek to identify the teaching methods and online learningsystems that promote greater engagement, studies at considerablescale have become a priority [2]. Unfortunately, this scale is oftenachieved at considerable cost. An alternate option is to use EDMmodels on log files. With appropriately validated detectors,engagement among large numbers of students can be gaugedrapidly, and as students continue using the same learning system,extensive, individualized data can be applied to interventions andto long-term predictions through discovery with models.
In this paper, we examine the cost of developing detectors of 7constructs of student engagement for ASSISTments, outliningcurrent expenses and applications. We include a brief descriptionof their applicability towards discovery with models research, atechnique that leverages such existing models, substantiallyincreasing their worth.
2. ASSISTmentsDetectors in this study were developed for ASSISTments [7], aformative assessment system that provides scaffolded mathinstruction and targeted hints. ASSISTments was developed atWorcester Polytechnic Institute and is available to educators at nocost. Typically, students spend 1 regular class period per weekusing ASSISTments, and some also use it for homework [3].Currently, approximately 60,000 students use ASSISTments inschools throughout the Northeastern United States.
3. Methods3.1 Overview of Detector ConstructionFor this study, we consider the cost of producing detectors for 7different constructs, including 4 affective indicators ofengagement (boredom, confusion, engaged concentration, andfrustration) and 3 behavioral indicators of engagement (gamingthe system, off-task behavior, and carelessness). As reported inprevious research, different methods were used to obtain theground truth labels used to develop these detectors.
For the 4 affective detectors and for 2 of the behavioral detectors(gaming the system and off-task behavior), ground truth labelswere generated by BROMP-certified field observers [4].Observers spent 379 hours in field, obtaining 5,564 observationsof 590 students at 6 different schools. These observations werethen used to train separate detectors for each construct, each ofwhich was cross-validated at the student-level to ensuregeneralizability to new populations (e.g., [6]). Research showsthat rural students’ affect manifested differently in theirinteractions with ASSISTments compared to urban and suburbanstudents, so affect detectors were constructed to reflect thesedemographic differences [5].
The construction of the carelessness detector was different thanthe other six detectors as no fieldwork was required. Instead,programmers used Bayesian Knowledge Tracing (BKT)algorithms to calculate Contextual Slip (e.g., [1]). Each time astudent makes an incorrect answer on a problem, the probabilitythat a student is making a careless error is calculated based on hisor her previous performance on the same skill [8].
3.2 Calculation of CostTwo major sources of funding were used to create theASSISTments detectors. The first was a National ScienceFoundation award to the Pittsburgh Science of Learning Centerfor $100,000, used to develop initial detectors for ASSISTmentsand 4 other systems. The second, a grant from the Bill & MelindaGates Foundation for $277,044 funded further enhancement andvalidation of the ASSISTments detectors and models for 2 othersystems. Roughly, this means that the initial investment for cross-validated models of all seven constructs in ASSISTments (alsotested across 3 populations) totaled $117,348 ($16,050 per
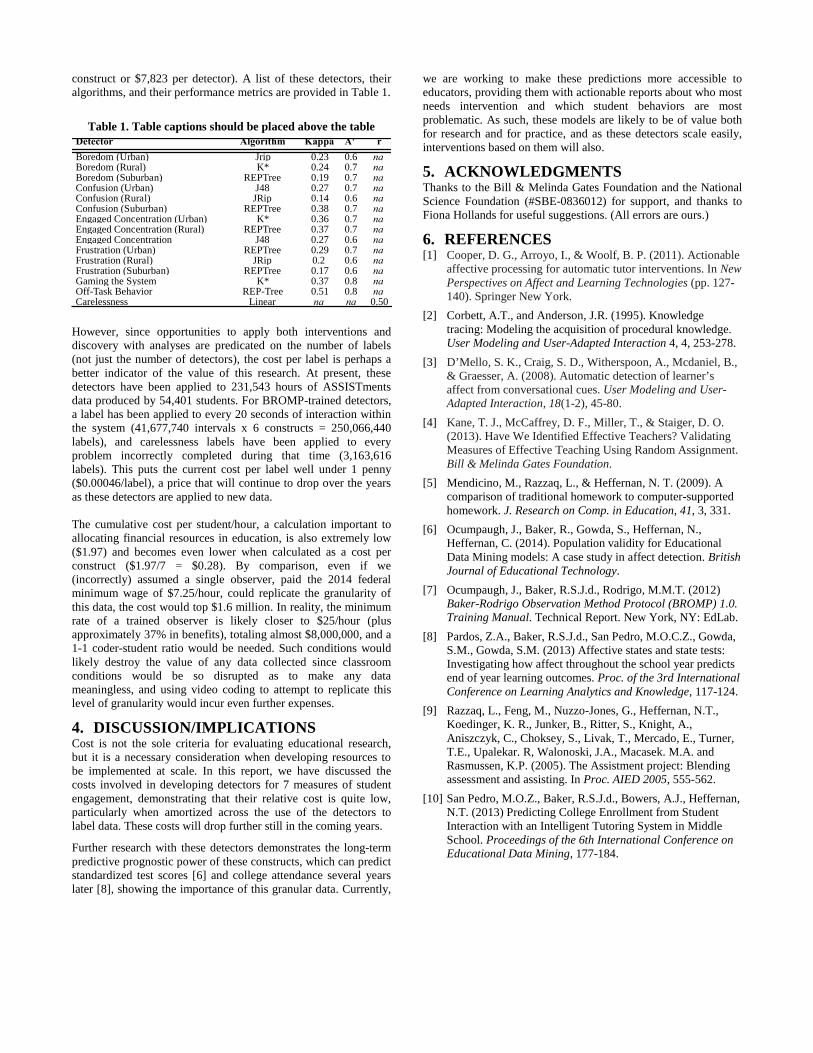
construct or $7,823 per detector). A list of these detectors, theiralgorithms, and their performance metrics are provided in Table 1.
Table 1. Table captions should be placed above the table
However, since opportunities to apply both interventions anddiscovery with analyses are predicated on the number of labels(not just the number of detectors), the cost per label is perhaps abetter indicator of the value of this research. At present, thesedetectors have been applied to 231,543 hours of ASSISTmentsdata produced by 54,401 students. For BROMP-trained detectors,a label has been applied to every 20 seconds of interaction withinthe system (41,677,740 intervals x 6 constructs = 250,066,440labels), and carelessness labels have been applied to everyproblem incorrectly completed during that time (3,163,616labels). This puts the current cost per label well under 1 penny($0.00046/label), a price that will continue to drop over the yearsas these detectors are applied to new data.
The cumulative cost per student/hour, a calculation important toallocating financial resources in education, is also extremely low($1.97) and becomes even lower when calculated as a cost perconstruct ($1.97/7 = $0.28). By comparison, even if we(incorrectly) assumed a single observer, paid the 2014 federalminimum wage of $7.25/hour, could replicate the granularity ofthis data, the cost would top $1.6 million. In reality, the minimumrate of a trained observer is likely closer to $25/hour (plusapproximately 37% in benefits), totaling almost $8,000,000, and a1-1 coder-student ratio would be needed. Such conditions wouldlikely destroy the value of any data collected since classroomconditions would be so disrupted as to make any datameaningless, and using video coding to attempt to replicate thislevel of granularity would incur even further expenses.
4. DISCUSSION/IMPLICATIONSCost is not the sole criteria for evaluating educational research,but it is a necessary consideration when developing resources tobe implemented at scale. In this report, we have discussed thecosts involved in developing detectors for 7 measures of studentengagement, demonstrating that their relative cost is quite low,particularly when amortized across the use of the detectors tolabel data. These costs will drop further still in the coming years.
Further research with these detectors demonstrates the long-termpredictive prognostic power of these constructs, which can predictstandardized test scores [6] and college attendance several yearslater [8], showing the importance of this granular data. Currently,
we are working to make these predictions more accessible toeducators, providing them with actionable reports about who mostneeds intervention and which student behaviors are mostproblematic. As such, these models are likely to be of value bothfor research and for practice, and as these detectors scale easily,interventions based on them will also.
5. ACKNOWLEDGMENTSThanks to the Bill & Melinda Gates Foundation and the NationalScience Foundation (#SBE-0836012) for support, and thanks toFiona Hollands for useful suggestions. (All errors are ours.)
6. REFERENCES[1] Cooper, D. G., Arroyo, I., & Woolf, B. P. (2011). Actionable
affective processing for automatic tutor interventions. In NewPerspectives on Affect and Learning Technologies (pp. 127-140). Springer New York.
[2] Corbett, A.T., and Anderson, J.R. (1995). Knowledgetracing: Modeling the acquisition of procedural knowledge.User Modeling and User-Adapted Interaction 4, 4, 253-278.
[3] D’Mello, S. K., Craig, S. D., Witherspoon, A., Mcdaniel, B.,& Graesser, A. (2008). Automatic detection of learner’saffect from conversational cues. User Modeling and User-Adapted Interaction, 18(1-2), 45-80.
[4] Kane, T. J., McCaffrey, D. F., Miller, T., & Staiger, D. O.(2013). Have We Identified Effective Teachers? ValidatingMeasures of Effective Teaching Using Random Assignment.Bill & Melinda Gates Foundation.
[5] Mendicino, M., Razzaq, L., & Heffernan, N. T. (2009). Acomparison of traditional homework to computer-supportedhomework. J. Research on Comp. in Education, 41, 3, 331.
[6] Ocumpaugh, J., Baker, R., Gowda, S., Heffernan, N.,Heffernan, C. (2014). Population validity for EducationalData Mining models: A case study in affect detection. BritishJournal of Educational Technology.
[7] Ocumpaugh, J., Baker, R.S.J.d., Rodrigo, M.M.T. (2012)Baker-Rodrigo Observation Method Protocol (BROMP) 1.0.Training Manual. Technical Report. New York, NY: EdLab.
[8] Pardos, Z.A., Baker, R.S.J.d., San Pedro, M.O.C.Z., Gowda,S.M., Gowda, S.M. (2013) Affective states and state tests:Investigating how affect throughout the school year predictsend of year learning outcomes. Proc. of the 3rd InternationalConference on Learning Analytics and Knowledge, 117-124.
[9] Razzaq, L., Feng, M., Nuzzo-Jones, G., Heffernan, N.T.,Koedinger, K. R., Junker, B., Ritter, S., Knight, A.,Aniszczyk, C., Choksey, S., Livak, T., Mercado, E., Turner,T.E., Upalekar. R, Walonoski, J.A., Macasek. M.A. andRasmussen, K.P. (2005). The Assistment project: Blendingassessment and assisting. In Proc. AIED 2005, 555-562.
[10] San Pedro, M.O.Z., Baker, R.S.J.d., Bowers, A.J., Heffernan,N.T. (2013) Predicting College Enrollment from StudentInteraction with an Intelligent Tutoring System in MiddleSchool. Proceedings of the 6th International Conference onEducational Data Mining, 177-184.
Detector Algorithm Kappa A' rBoredom (Urban) Jrip 0.23 0.6 naBoredom (Rural) K* 0.24 0.7 naBoredom (Suburban) REPTree 0.19 0.7 naConfusion (Urban) J48 0.27 0.7 naConfusion (Rural) JRip 0.14 0.6 naConfusion (Suburban) REPTree 0.38 0.7 naEngaged Concentration (Urban) K* 0.36 0.7 naEngaged Concentration (Rural) REPTree 0.37 0.7 naEngaged Concentration J48 0.27 0.6 naFrustration (Urban) REPTree 0.29 0.7 naFrustration (Rural) JRip 0.2 0.6 naFrustration (Suburban) REPTree 0.17 0.6 naGaming the System K* 0.37 0.8 naOff-Task Behavior REP-Tree 0.51 0.8 naCarelessness Linear na na 0.50


