September 2017
Corporate Presentation
September 2017
September 2017
Advisory This presentation should be read in conjunction with the Company’s Annual Information Form and the Consolidated Financial Statements and Management’s Discussion and Analysis as filed on SEDAR.
FORWARD LOOKING STATEMENTS: This presentation includes projections that are derived from certain assumptions with respect to (i) wells drilled and drilling success; (ii)production; (iii) future capital expenditures; (iv) future reserves ; (v) cash flow and (vi) operating costs. The reader is cautioned that assumptions used in the preparation of such information may prove to be incorrect.
Certain information regarding the Company set forth in this document, including management’s assessment of the Company’s future plans and operations, the planning and development of certain prospects, production estimates, reserve estimates, undeveloped land holdings, capital expenditures and the timing thereof and the total future capital required to bring undeveloped proved and probable reserves onto production, and expanded production growth may constitute forward-looking statements under applicable securities laws and necessarily involve substantial known and unknown risks and uncertainties. These forward-looking statements are subject to numerous risks and uncertainties, many of which are beyond the Company’s control, including without limitation, risks associated with oil and gas exploration, development, exploitation, production, marketing and transportation, loss of markets, volatility of commodity prices, currency fluctuations, environmental risks, competition, the lack of availability of qualified personnel or management, inability to obtain drilling rigs or other services, increasing capital expenditure costs, including drilling, completion and facility costs, unexpected decline rates in wells, wells not performing as expected, stock market volatility, delays resulting from or inability to obtain required regulatory approvals and ability to access sufficient capital from internal and external sources, the impact of general economic conditions in Canada, the United States and overseas, industry conditions, changes in laws and regulations (including the adoption of new environmental laws and regulations) and changes in how they are interpreted and enforced, increased competition and fluctuations in foreign exchange or interest rates. Readers are cautioned that the foregoing list of factors is not exhaustive. The Company’s actual results, performance or achievement could differ materially from those expressed in, or implied by, these forward-looking statements and, accordingly, no assurance can be given that any of the events anticipated by the forward-looking statements will transpire or occur, or if any of them do so, what benefits that the Company will derive therefrom. The foregoing and all subsequent forward-looking statements, whether written or oral, attributable to the Company or persons acting on its behalf are expressly qualified in their entirety by these cautionary statements. Additional information of these and other factors that could affect the Company’s operations and financial results are included in reports on file with Canadian securities regulatory authorities and may be accessed through the SEDAR website (www.sedar.com) or the Company’s website (www.sogoil.com).
The forward-looking statements contained in this document are made as of the date on the front page and the Company assumes no obligation to update publicly or to revise any of the included forward-looking statements, whether as a result of new information, future events or otherwise, except as may be required by applicable securities laws.
TEST AND INITIAL PRODUCTION RESULTS: Any references in this presentation to initial or test production rates are useful in confirming the presence of hydrocarbons, however such rates are not determinative of the rates at which such wells will continue production. While encouraging, readers are cautioned not to place reliance on such rates in calculating aggregate production. Initial production or test rates are not necessarily indicative of long-term performance of the relevant well or fields or of ultimate recovery of hydrocarbons. Test volumes are quoted on a raw basis before shrinkage on natural gas volumes. Total corporate production volumes include natural gas shrinkage.
DRILLING LOCATIONS: This presentation discloses drilling locations in three categories: (i) locations assigned proved reserves, (ii) locations assigned probable reserves and (iii) unbooked locations. Locations assigned reserves are derived from the Company’s independent reserves evaluation as of December 31, 2016. Unbooked locations are internal estimates based on the Company’s existing prospective acreage, current well lengths and an estimated number of wells drilled per section. Unbooked locations do not have reserves assigned. Of the 600 locations identified in the Company’s growth plan, 28 were assigned proved reserves, 26 were assigned probable reserves, and the remainder are unbooked locations. Unbooked locations have been identified by management based on application of industry standard geological, geophysical, engineering, production and reservoir information. There is no certainty that all unbooked locations will be drilled or that, if drilled, these locations will result in additional production and reserves for the Company. While certain unbooked locations are in close proximity to existing production, the majority are not in close proximity to existing producing wells and there is uncertainty as to the quality of the potential reserves and production to be obtained by drilling these locations.
GROWTH PLANS: Growth plans presented in this presentation are based on an internal conceptual development plan. The actual number of wells drilled and development undertaken in future periods will depend on capital availability, regulatory issues, seasonal restrictions, commodity prices, actual drilling results, cash flows, accessibility of equipment and qualified personnel and other factors.
BOE MEASUREMENT: "Boe“ means barrel of oil equivalent on the basis of 6 mcf of natural gas to 1 bbl of oil . Boe may be misleading, particularly if used in isolation. A boe conversion ratio of 6 mcf:1 bbl is based on an energy equivalency conversion method primarily applicable at the burner tip and does not represent a value equivalency at the wellhead.
ORIGINAL OIL IN PLACE: Original Oil in Place(“OOIP”) are the equivalent to Total Petroleum Initially In Place(“TPIIP") as defined by the COGEH Guidelines and are not reserves. There is no certainty that it will be commercially viable to produce any portion of OOIP except to the extent they are subsequently classified as proved or probable reserves.
2

September 2017
MULTI-ZONE LIGHT OIL RESOURCE PLAY
• Over 4 Billion barrels of light oil in stacked zones
• High quality conventional reservoir
• Profitable drilling at $50 WTI
• ~400,000 acres of land
2 BILLION BARRELS OF LIGHT OIL UNDER DEVELOPMENT IN MUSKEG ZONE
GROWTH TO 30,000 BOE/DAY WITH MUSKEG OIL DEVELOPMENT
Crain’s Petrophysical Handbook
3

September 2017
MARLOWE: UNIQUE ASSET WITH STACKED PAY
• Large structural trap created by the impact of an Asteroid ~100 million years ago that is charged with light oil and gas in six stacked horizons
• Muskeg zone is currently the key focus
Zone Prospective
Sections Net Pay
(feet) OOIP/Sec
(MMBBL)* OOIP
(MMBBL)
Muskwa 120 90 8 960
Slave 140 100 12 1,680
Sulphur 130 30 8 1,040 Muskeg 200 30 10 2,000 Zama 130 20 5 650 Keg Plat 140 90 8 1,120
* Company’s Internal Estimates
OVER 4 BILLION BARRELS OF LIGHT OIL IN STACKED ZONES
Slave
Sulphur
Muskeg
Keg
Single Pad Multi-Formation Development
4
September 2017
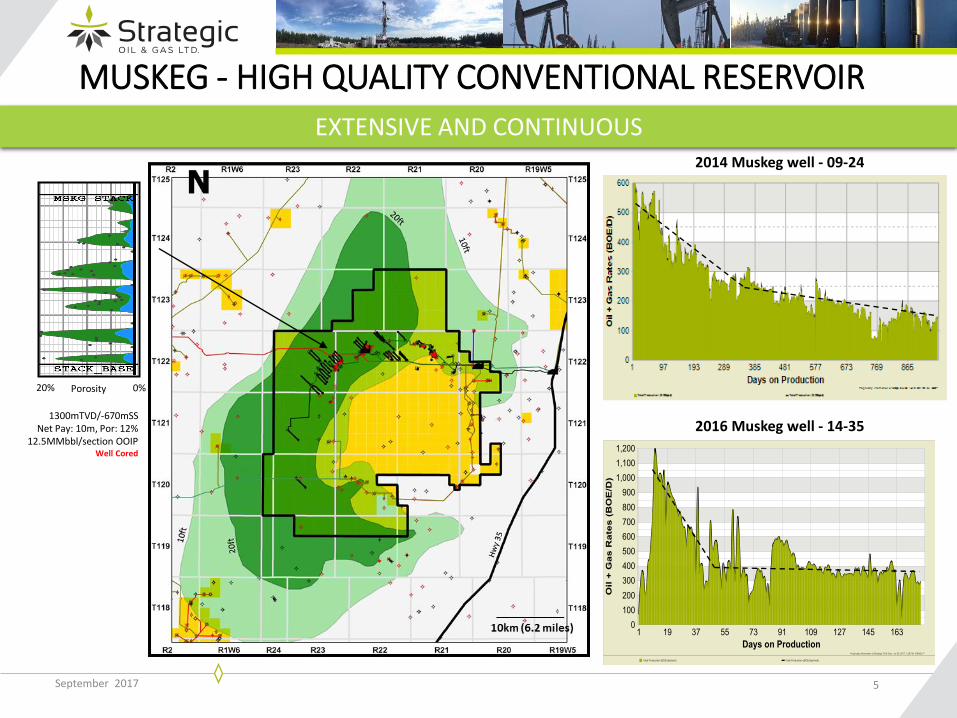
MUSKEG - HIGH QUALITY CONVENTIONAL RESERVOIR
5
14-18-122-23W5
1300mTVD/-670mSS Net Pay: 10m, Por: 12%
12.5MMbbl/section OOIP Well Cored
0% 20%
2014 Muskeg well - 09-24
2016 Muskeg well - 14-35
EXTENSIVE AND CONTINUOUS
Porosity
September 2017
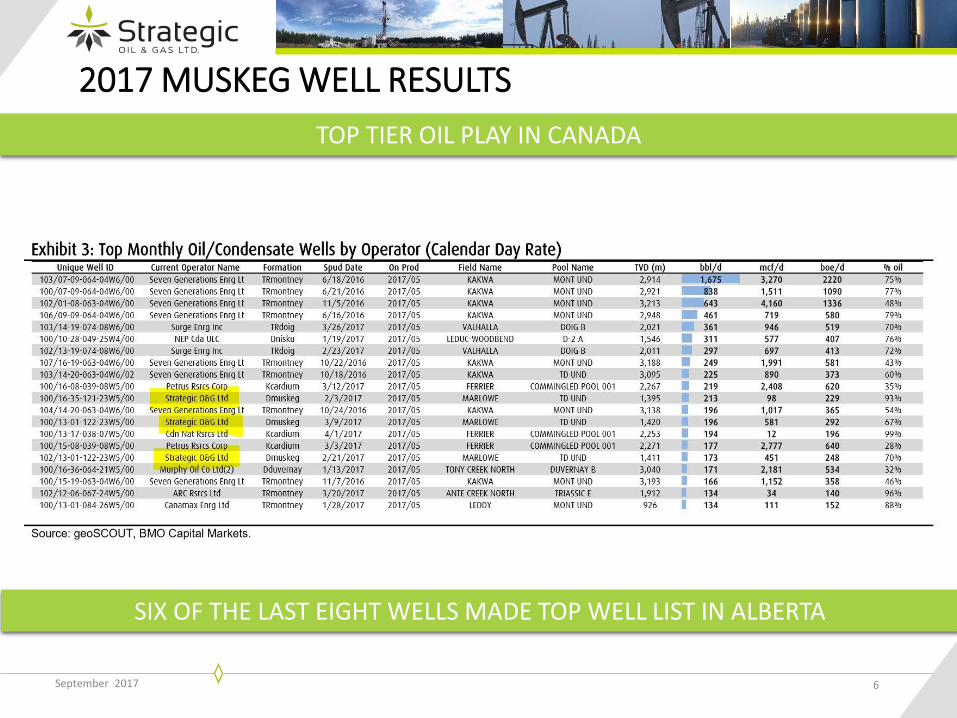
2017 MUSKEG WELL RESULTS
6
TOP TIER OIL PLAY IN CANADA
SIX OF THE LAST EIGHT WELLS MADE TOP WELL LIST IN ALBERTA

September 2017
Gross reserves are the estimated working interest reserves before the deduction of any royalties. Gross reserve estimates are based on Strategic’s internal evaluation and were prepared by a member of Strategic’s management who is a qualified reserves evaluator in accordance with National Instrument 51-101.
WELL TYPE CURVE & ECONOMICS
Total Capital Cost ($ MM) 3.5
IP30 BOED Sales 440
IP 365 BOED Sales 240
Reserves (MBOE) 400
F&D ($/BOE) 8.75
WTI Oil Price $US 50
Payout (years) 1.4
Rate Of Return (%) 73
Profit to Investment Ratio 2.2
BTAX NPV10 ($ MM) 4.1
7
RATE OF RETURN OVER 70% AT $50 WTI
MUSKEG TYPE CURVE
NETBACK Oil price =$50 US flat; Gas:US$2.25/mmbtu Henry Hub Oil ($CAD/bbl): 42.77 (until payout); 38.41 ( post payout) Gas ($CAD/mscf): 0.87 (until payout); 0.67 (post payout)

September 2017
EVOLUTION OF MUSKEG DEVELOPMENT
8
• Proved Oil & Gas Production from the Muskeg Zone
• Tested Various Drilling and Completion Techniques
• Frac. Fluid Optimization
• 1400 m HZ; 15 Stages • Dissolvable Frac. Balls • Geosteering: Target Specific
Dolomites
• Longer Wells, More Stages • 1900 m HZ • 20 to 40 Stages
• Frac Fluid Optimization • Optimizing Artificial lift
• HEAL/Rod Pump/ ESP
Phase 2: 2013 Trials & Assessment
Phase 3: 2014/15 Repeatable & Reliable
Phase 4: 2016/17 Increased Productivity
Phase 1: 2012 Proof of Concept

September 2017
CONTINUOUS IMPROVEMENT IN MUSKEG WELL PERFORMANCE
9
0
30
60
90
120
0
200
400
600
800
1 2 3 4 5
Cu
m 1
yr
Pro
d (
MB
OE)
IP 3
0 (
BO
ED)
Stage of Development
Cum 1 year IP30
0
10
20
30
40
0
1000
2000
1 2 3 4 5
Stag
es
HZ
Len
gth
(m
)
Stage of Development
Stages Hz Length

September 2017 10
DOMINANT LAND POSITION & INFRASTRUCTURE CONTROL
• 100% working interest • All petroleum & natural gas rights • Connected via pipeline, highway & rail
~400,000 ACRES OF LAND
Canada & US
HIGHWAY & RAIL
Strategic Lands

September 2017
OWNERSHIP & OPERATORSHIP OF FACILITIES INFRASTRUCTURE WITH REPLACEMENT VALUE >$500 MILLION
• 100% owned and operated • Underutilized oil & gas plant capacity for future growth • Sour gas and water handling on site
BISTCHO PLANT
5o MMscf/day STEEN PLANT 4o MMscf/day
11

September 2017 12
Spring Summer
Fall Winter
YEAR ROUND OPERATIONS

September 2017
SCALABLE GROWTH PLAN
13
EXISTING LAND BASE CAN KEEP PRODUCTION FLAT AT 30,000 BOED FOR 10+ YEARS
• Drill with one rig and grow to a two rig program • 250 wells drilled over 7 years (1/3rd of Muskeg Drilling Inventory) • Outspend Cash Flow for first four years at $50 WTI • Grow to 30,000 BOED in 7 years & keep production flat for additional 10 years • Generate significant free cash flow for over 10 years
PRODUCTION GROWTH TO 30,000 BOED OVER 7 YEARS
September 2017
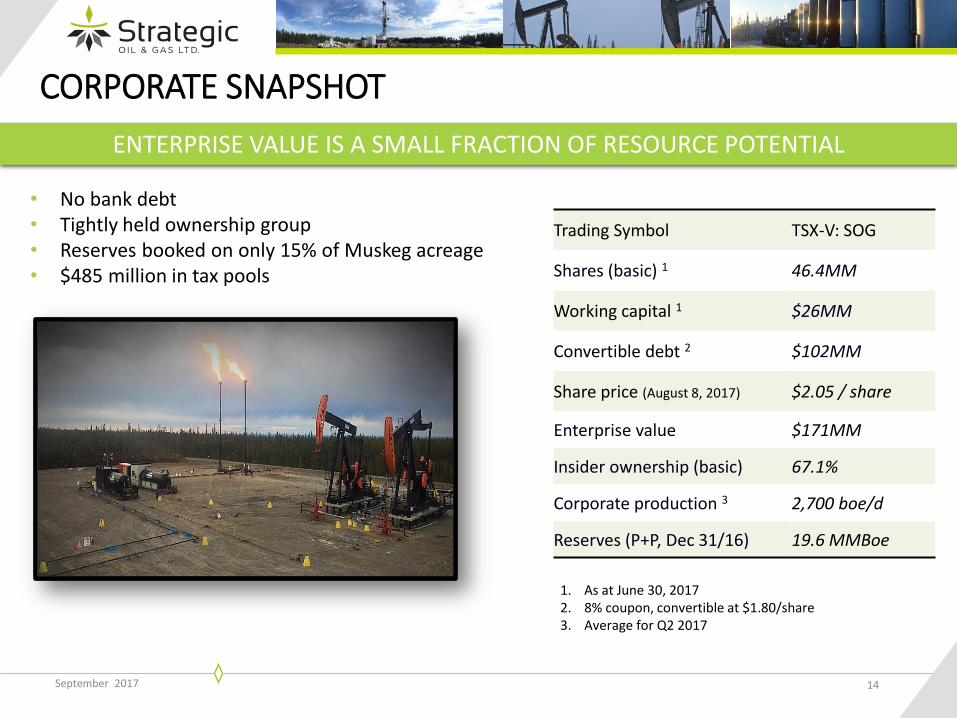
CORPORATE SNAPSHOT
Trading Symbol TSX-V: SOG
Shares (basic) 1 46.4MM
Working capital 1 $26MM
Convertible debt 2 $102MM
Share price (August 8, 2017) $2.05 / share
Enterprise value $171MM
Insider ownership (basic) 67.1%
Corporate production 3 2,700 boe/d
Reserves (P+P, Dec 31/16) 19.6 MMBoe
14
• No bank debt • Tightly held ownership group • Reserves booked on only 15% of Muskeg acreage • $485 million in tax pools
1. As at June 30, 2017 2. 8% coupon, convertible at $1.80/share 3. Average for Q2 2017
ENTERPRISE VALUE IS A SMALL FRACTION OF RESOURCE POTENTIAL
September 2017
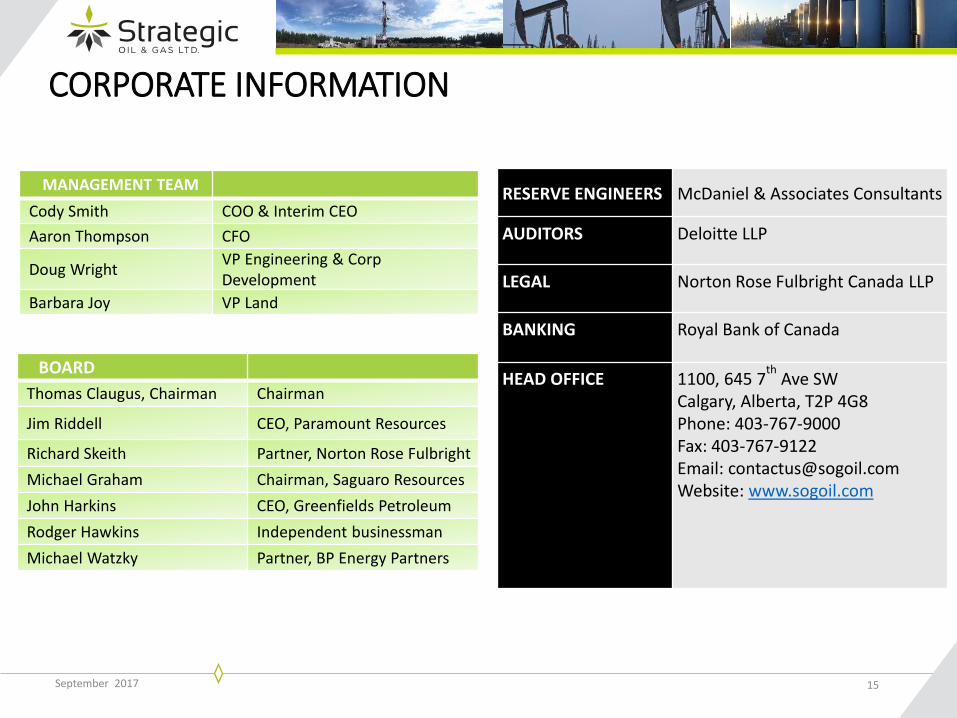
CORPORATE INFORMATION
MANAGEMENT TEAM
Cody Smith COO & Interim CEO
Aaron Thompson CFO
Doug Wright VP Engineering & Corp Development
Barbara Joy VP Land
RESERVE ENGINEERS McDaniel & Associates Consultants
AUDITORS Deloitte LLP
LEGAL Norton Rose Fulbright Canada LLP
BANKING Royal Bank of Canada
HEAD OFFICE 1100, 645 7th
Ave SW Calgary, Alberta, T2P 4G8 Phone: 403-767-9000 Fax: 403-767-9122 Email: [email protected] Website: www.sogoil.com
15
BOARD
Thomas Claugus, Chairman Chairman
Jim Riddell CEO, Paramount Resources
Richard Skeith Partner, Norton Rose Fulbright
Michael Graham Chairman, Saguaro Resources
John Harkins CEO, Greenfields Petroleum
Rodger Hawkins Independent businessman
Michael Watzky Partner, BP Energy Partners


