www.adelaide.edu.au/wine-econ
Convergence in National
Alcohol Consumption Patterns:
New Global Indicators
Alexander J. Holmes and Kym Anderson
March 2017
Wine Economics Research Centre
Working Papers Working Paper No. 0117
1
Convergence in National Alcohol Consumption Patterns:
New Global Indicators
Alexander J. Holmes and Kym Andersona
University of Adelaide
March 2017
Author contact: Kym Anderson Wine Economics Research Centre School of Economics University of Adelaide Adelaide SA 5005 Australia Phone +61 8 8313 4712 [email protected]
a The authors are grateful for financial support from the University of Adelaide’s EU Centre for Global Affairs.
2
Abstract
With increasing globalisation and interactions between cultures, countries are
converging in many ways, including in their consumption patterns. The extent to
which this has been the case in alcohol consumption has been the subject of
previous studies, but those studies have been limited in scope to a specific region or
group of high-income countries or to just one or two types of alcohol. The present
study updates earlier findings, covers all countries of the world since 1961,
introduces two new summary indicators to capture additional dimensions of the
extent of convergence in total alcohol consumption and in its mix of beverages, and
distinguishes countries according to whether their alcoholic focus was on wine,
beer or spirits in the early 1960s as well as to their geographic region and their real
per capita income. Also, for recent years we add expenditure data and compare
alcohol with soft drink retail expenditure, and we show what difference it makes
when unrecorded alcohol volumes are included as part of total alcohol
consumption. The final section summarizes the findings and suggests further
research could provide new demand elasticity estimates and use econometrics to
explain the varying extents of convergence over time, space and beverage type.
Keywords: Globalization of preferences; National beverage consumption mix; Beverage
consumption intensity index; Alcohol consumption mix similarity index
JEL Classifications: D12; L66; N10
Convergence in National Alcohol Consumption Patterns:
New Global Indicators
I. Introduction
With increasing globalization and interactions between cultures, countries are converging in
many ways, including in their consumption patterns. This raises concerns when consumers
in developing countries copy trends in high-income countries that are considered
undesirable from such viewpoints as human health consequences. Tobacco and sugar are
perhaps the most frequently mentioned items, as tobacco consumption globally has doubled
since the early 1960s and sugar has increased by nearly half and is contributing to the
spread of obesity. But the other item closely monitored by health authorities is the level of
consumption of both alcoholic and sweetened non-alcoholic drinks. Producers of beverages
also seek to monitor consumer trends. They focus not only on overall levels of
consumption, but also on its composition or mix to ascertain changes in consumer
preferences or behaviour.
The extent to which alcoholic beverage consumption patterns are converging across
countries has been the subject of many previous studies. Examples since the new
millennium include Smith and Solgaard (2000), Bentzen, Eriksson and Smith (2001),
Aizenman and Brooks (2008) and Colen and Swinnen (2016). However, those studies have
limited the scope of their analysis to a specific region or group of high-income countries, or
to just one or two types of alcohol. The present study updates earlier findings, covers all
countries of the world since 1961 and key high-income countries since 1888, introduces
new summary indicators to capture several dimensions of the extent of convergence in total
alcohol consumption and in its mix of beverages, distinguishes countries according to
whether their alcoholic focus was on wine, beer or spirits in the early 1960s as well as their
geographic region and their real per capita income. Also, for recent years we add
expenditure data and compare alcohol with soft drink retail spending; and we show what
difference it makes when unrecorded alcohol volumes are included as part of total alcohol
consumption.
In exploring alcohol consumption trends in European countries from 1960 to 2000,
Smith and Solgaard (2000) find that the market shares for traditional beverages declined. In
2
the Nordic countries, for example, the dominance of spirits in 1960 diminished as beer and
wine shares grew over those four decades. Bentzen, Eriksson and Smith (2001) use time
series techniques to study alcohol consumption convergence in a number of European
countries. They conclude from their unit root tests that differences in total alcohol
consumption levels are diminishing. Aizenman and Brooks (2008) studied convergence
during 1963 to 2000 across a larger sample of countries that included OECD and middle-
income countries, but only for beer and wine. Colen and Swinnen (2016) analyse mainly
beer but also wine consumption across a large sample of both high-income and developing
countries. Echoing the conclusions of Smith and Solgaard (2000), they find that in many
traditional beer- (wine-)drinking countries, the share of beer (wine) in total alcohol
consumption is declining and that of wine (beer) is increasing. They also show that beer
consumption increased in developing countries with rising incomes but fell once higher
levels of income were reached. However, spirits were omitted from their analysis.
The present paper first describes the data sources to be used. It then suggests a
number of ways to indicate convergence over time in both total recorded alcohol
consumption and in the mix of beverages. The main section then presents findings based on
annual data assembled for a large number of countries and regional residual country groups
spanning the world from 1961 to 2014 and for some high-income countries back to the late
19th century. The results from 1961 are shown also for groups of countries whose earlier
focus was either wine, beer or spirits, as well as for various regions of the world and by per
capita real income. Also shown is the relative importance of alcoholic versus various non-
alcoholic drinks in total beverage consumption volumes and expenditure since 2001.
Estimates of unrecorded alcohol consumption for the years 2000, 2005 and 2010 are then
used to test the robustness of the convergence findings when these estimates are included as
part of total alcohol consumption. The final section summarizes the findings and suggests
further research could provide new demand elasticity estimates and use econometrics to
explain the varying extents of convergence over time, space and beverage type.
II. Data Sources
The wine, beer and spirits consumption volume data in this study are sourced from two new
annual databases: one that includes wine, beer and spirits volumes and stretches from 2014
back to the 1880s for eleven high-income countries and back to 1961 for all other countries
3
(Anderson and Pinilla 2017), and another that includes wine, beer and spirits average
consumer expenditure data compiled for all countries back to 2001 and for some high-
income countries back to the 1950s (Holmes and Anderson 2017).
The longer time series on volumes consumed (in litres of alcohol or LAL)1 from
1961 includes 48 important wine-producing and/or wine-consuming countries plus five
residual regions (treated here as five extra ‘countries’) which together make up the world.
That database has a full panel of data for the period 1961 to 2014 apart from Croatia,
Georgia, Moldova and Ukraine, data for which became available only after the breakup of
the Soviet Union. The shorter times series (2001 to 2015) is available from Euromonitor
International (2016) for 80 countries plus, again, five residual regions.
To estimate average prices for wine, beer and spirits for each of the countries that
have expenditure data, we simply divide expenditure by the consumption volume. The
value data are expressed in current US dollars converted from local currencies using each
country’s annual average nominal exchange rate.
Euromonitor International (2016) also provides soft drink volume and expenditure
data from 2001, and total expenditure on all products. Other key statistics used include ones
compiled from the World Health Organization (WHO 2015) and, in the case of our proxy
for real per capita disposable income back to 1961, the Maddison GDP estimates in 1990
International Geary-Khamis dollars.2
All the consumption data mentioned above refer only to what has been recorded by
national governments. There is an additional amount of alcohol produced and consumed
each year that is not recorded. WHO (2015) reports estimates of that unrecorded alcohol
consumption volume for 98 countries for the three years 2000, 2005 and 2010. These are
used to test, in Section V below, the robustness of our findings on convergence in recorded
alcohol consumption levels and mixes.
1 The average alcohol content by volume is assumed to be 4.5% for beer, 12% for wine and 40% for spirits. Ready-to-drink spirits mixers are converted to spirits assuming their alcohol content is 5%. Throughout, ‘wine’ refers to grape wine. Wine from others fruits is very minor in almost all countries. Rice ‘wine’, which is made in many Asian countries but each under a different name (sake in Japan, mijiu in China, cheongju in Korea, …), is included in the spirits category: even though rice wine is fermented, it looks like a clear spirit, is brewed differently than beer, and is typically at least 15% alcohol. 2 The Maddison numbers, from www.ggdc.net/maddison/maddison-project/data.htm, have been updated to 2015 by taking the latest PPP estimates in 2011 dollars from the World Bank’s International Comparison Project at http://icp.worldbank.org and splicing them to the Maddison series.
4
III. Indicators of Convergence
To study convergence across countries in national alcohol consumption volumes and
beverage mixes, we employ a number of different indicators. One is simply the coefficient
of variation across countries each year. Then two indexes developed by Anderson (2014a)
to study winegrape varietal patterns across countries and regions are adapted to beverage
consumption to measure convergence over time in national beverage consumption mixes
towards the (changing) world average mix.
A. Coefficient of variation
The coefficient of variation can be calculated across countries each year for total alcohol
consumption volume, and for the share of each of the three main beverage types in the total
volume of recorded alcohol consumption. The coefficient of variation (CoV) measures the
concentration of data around the mean value: if it declines over time this serves as a simple
indicator of cross-country convergence. It is calculated for each year by taking the level of
consumption per capita across countries and dividing the standard deviation of the series,
σt, by the mean value of the sample, X¯t:
(1)
B. Beverage consumption intensity index
The beverage consumption intensity index indicates the importance in a particular year of
one type of alcoholic beverage in a country’s alcohol consumption relative to the average
share of that beverage in alcohol consumption by all countries of the world. We thus define
the consumption intensity index for country i as:
(2)
where there are i = 1,...,53 (or 85) countries, and n = 1,2,3 beverages corresponding to wine,
beer and spirits. We define fin as the fraction of wine, beer or spirits consumption in total
national alcohol consumption volume or expenditure in country i such that 0 ≤ fin ≤ 1 and
5
= 1. This is divided by the fraction for that same beverage in world total alcohol
consumption, fn, with 0 ≤ fn ≤ 1 and Σn fn = 1. For brevity we tabulate weighted averages of
intensity indexes for groups of countries, using as weights each country’s consumption of that
beverage as a fraction of the group’s total consumption of that beverage.
C. Alcohol consumption mix similarity index
The similarity index is a variant of an index developed by Anderson (2014a) that in turn
was adapted from one introduced by Griliches (1979) and Jaffe (1986). Anderson (2014a)
uses it to measure the extent to which the winegrape varietal mix in the vineyards of one
region or country matches that of another region or country or the world. Here we adapt it
for the purposes of comparing the beverage consumption mix of any one country with that
for any other country or the average for the world.
The index uses vector representation to project combinations of variables with
lengths determined by the shares of wine, beer and spirits in a country’s total alcohol
consumption volume or expenditure. The vector fim is again the fraction of beer, wine or
spirits consumption in the national alcohol consumption volume or expenditure in country i,
such that these fractions are between 0 and 1 and sum to 1. The index is defined as:
(3)
where i = 1,...,53 (or 85) countries, j = 1,...,53 (or 85) countries, and m = 1,2,3 beverages
corresponding again to wine, beer and spirits and so M = 3. This makes it possible to
indicate the degree of beverage mix “similarity” of any pair of countries. The index also can
be generated for each country relative to the average of a sample of countries or of all of the
world’s N countries. In short, ωij measures the degree of overlap between fi and fj. The
numerator of Equation (3) will be large when i’s and j’s beverage mixes are very similar.
The denominator normalizes the measure to unity when fi and fj are identical. Hence, ωij
will be close to 0 for pairs of countries with little similarity in their beverage mix, and 1 for
pairs of countries with identical beverage consumption mixes. For cases in between those
two extremes, 0 < ωij <1.
6
This index is conceptually similar to a correlation coefficient. Like a correlation
coefficient, it is completely symmetrical in that ωij = ωji. Thus the results can be
summarized in a symmetrical matrix plus a vector that reports the index for each country
relative to that for the world (as reported in Holmes and Anderson 2017).
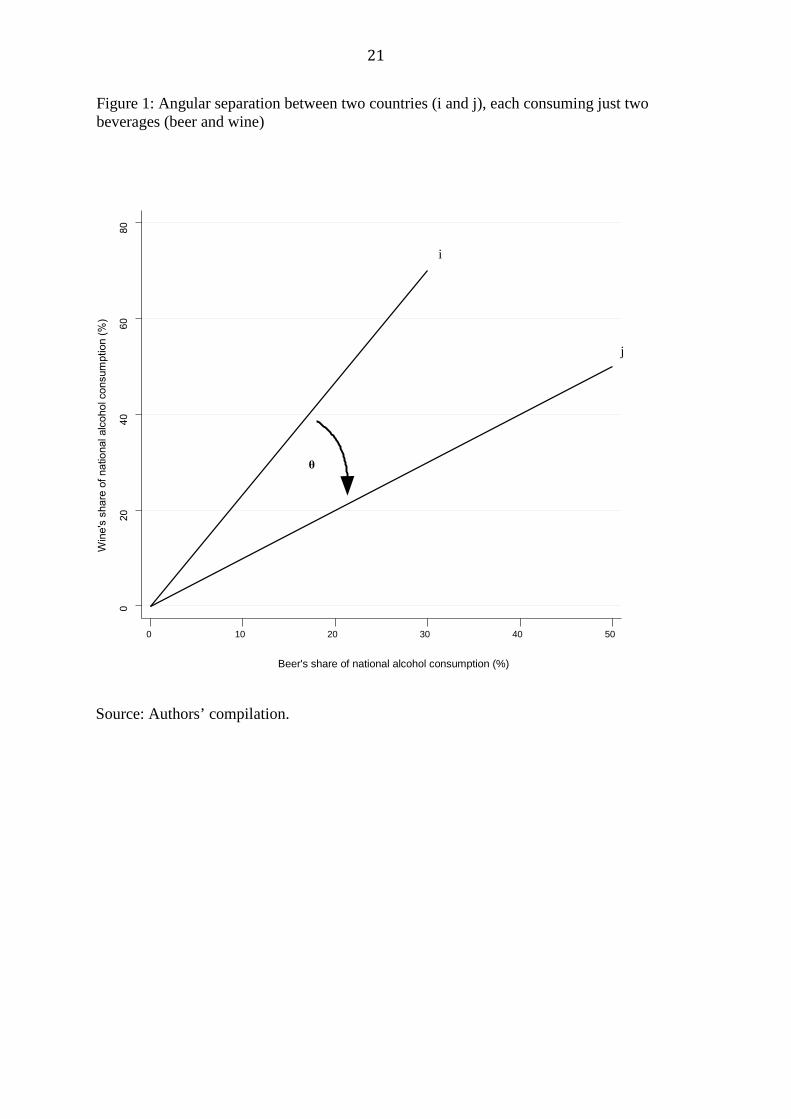
In a hypothetical two-beverage case, where country i has 50% of its alcohol
consumption consisting of beer and country j has 30%, then the index of consumption
similarity is the cosine of the angle between the two vectors in Figure 1. Therefore,
differences can be judged by the angular separation of the vectors fi and fj for the two
countries (Jaffe 1986).
It is possible to generate the similarity index for groups of countries by again using
as weights each country’s consumption of that beverage as a fraction of the group’s total
consumption of that beverage.
IV. Findings
In this section, we examine two types of convergence across countries in their alcohol
consumption patterns: in the aggregate level of alcohol consumed per capita per year, and
in the mix of wine, beer and spirits. The volumes of consumption, measured in litres of
alcohol, are compared where possible with values of consumption, since the latter also
incorporate changes in prices paid by consumers, for example because of a desire for
higher-quality beverages or a change in relative excise taxes.
Before examining our convergence indicators, it is worth reflecting on why
consumption patterns might differ. If all products could be traded costlessly around the
world, and there were no government interventions such as consumption (excise) or trade
taxes or differences in value added tax rates across jurisdictions, then the retail prices of
each type of beverage would be identical throughout the world. According to Stigler and
Becker (1977), the key reason then for major differences in alcohol consumption patterns
would be differences in per capita incomes. If all beverages were normal goods, we might
then expect convergence in the level and mix of alcoholic (or indeed all) beverages
consumed as convergence across countries occurs in national average per capita incomes
(which has been happening in recent decades – see, for example, Baldwin 2016).
In reality, costs of trading beverages across national borders are not zero (even
though they have declined greatly over the past 150 years), which means countries have

7
tended in the past to concentrate their consumption on those alcoholic beverages that can be
produced at lowest cost locally. Hence the dominance of spirits in cold countries, beer
where malting barley can be easily grown, and wine in the 30o to 50o latitude range near
maritime weather influences. Nor are excise and import taxes on beverages similar across
countries and they vary greatly across beverage types too (Anderson 2010, 2014b), in some
cases to protect local producers and so reinforcing climate-induced differences. Value-
added taxes also vary across countries. Moreover, temperance movements have had
different effects on the social acceptability of alcohol consumption at different times in
various places (see, for example, Wilson 1940, Briggs 1985, and Pinney 1989, 2005). So
too have concerns about human health: as per capita incomes rise, people can afford to
spend more on alcohol consumption but also choose to limit its volume for health reasons
(in some cases, switching to soft drinks including bottled water); and some people are also
substituting towards (especially still red) wine because of its perceived positive influence
on health when drunk in moderation. Given all the above possible influences on beverage
consumption patterns, it would not be surprising if convergence in those patterns was not
evident in the data.
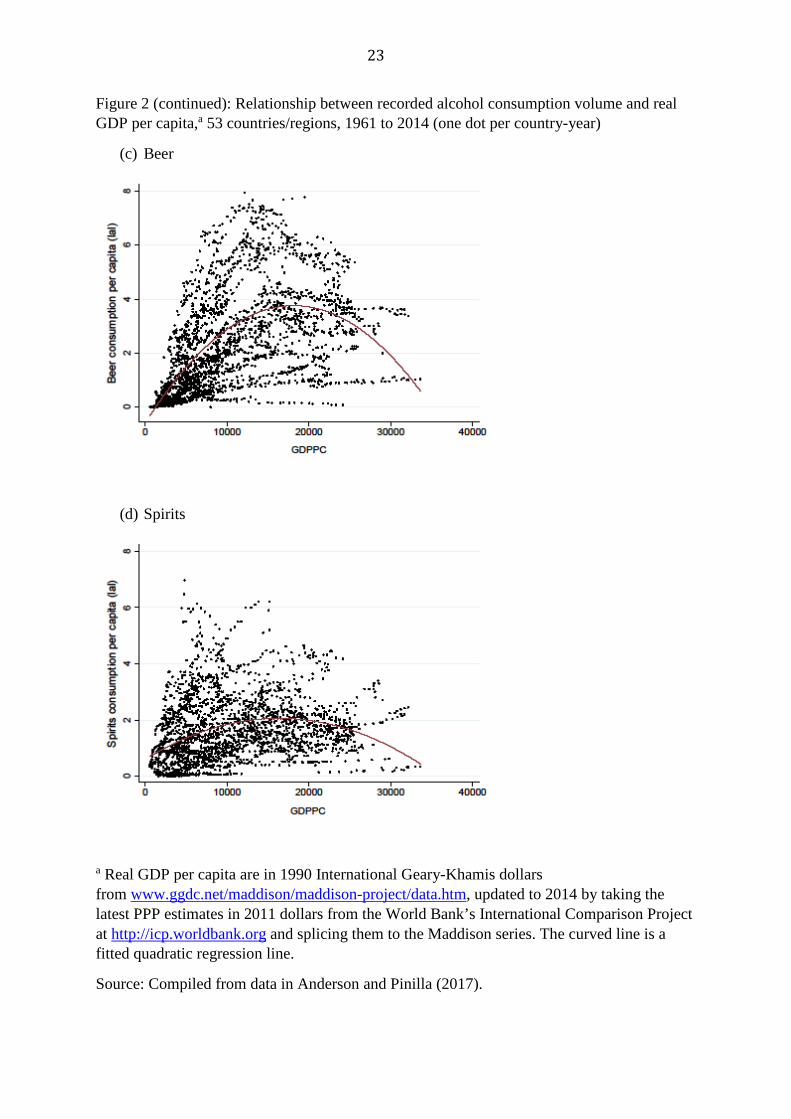
A. Alcohol consumption and income
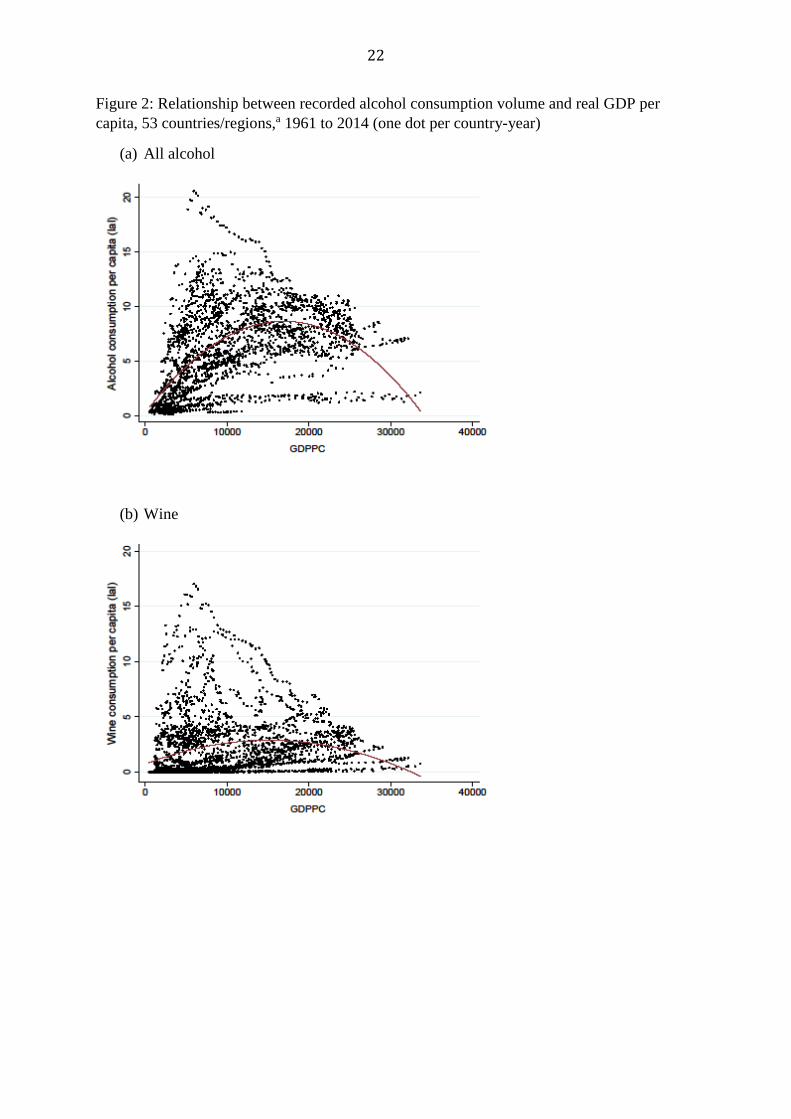
One way to begin to look for convergence in alcohol consumption patterns is to plot
consumption per capita against real income per capita. That is done in Figure 2 for our 53
countries and residual regions spanning the world from 1961 to 2014, for the volume of
total alcohol consumption as well as for each of wine, beer and spirits. Those charts suggest
the volume of consumption first tends to rise with per capita incomes but then falls. This is
the case for each of the three beverages. The peak consumption occurs at a real per capita
income (in 1990 International Geary-Khamis dollars) of $16,900 in the case of all alcohol.
That is just slightly above the average per capita income of Western Europe in 1990. The
peak consumption occurs at $15,100 for wine, $18,100 for beer, and $16,350 for spirits.
These inverted U-shaped figures suggest that income convergence alone (the gradual
catching up of developing countries to the per capita incomes of high-income countries)
would not necessarily lead to convergence in alcohol consumption patterns based on per
capita volumes.
B. Long-term trends in alcohol consumption per capita, total and by type
8
Trends in the volume of total alcohol consumption per capita and in shares of overall
alcohol consumption volume due to wine, beer and spirits are shown in Tables 1 and 2 for a
sample of high-income countries for which we have data from the late 19th century, and in
Table 3 for all of the world’s 53 countries/regions since 1961. For the larger set of
countries, consumption-weighted averages are shown for 7 regions and for the world as a
whole in the final rows of Table 3.
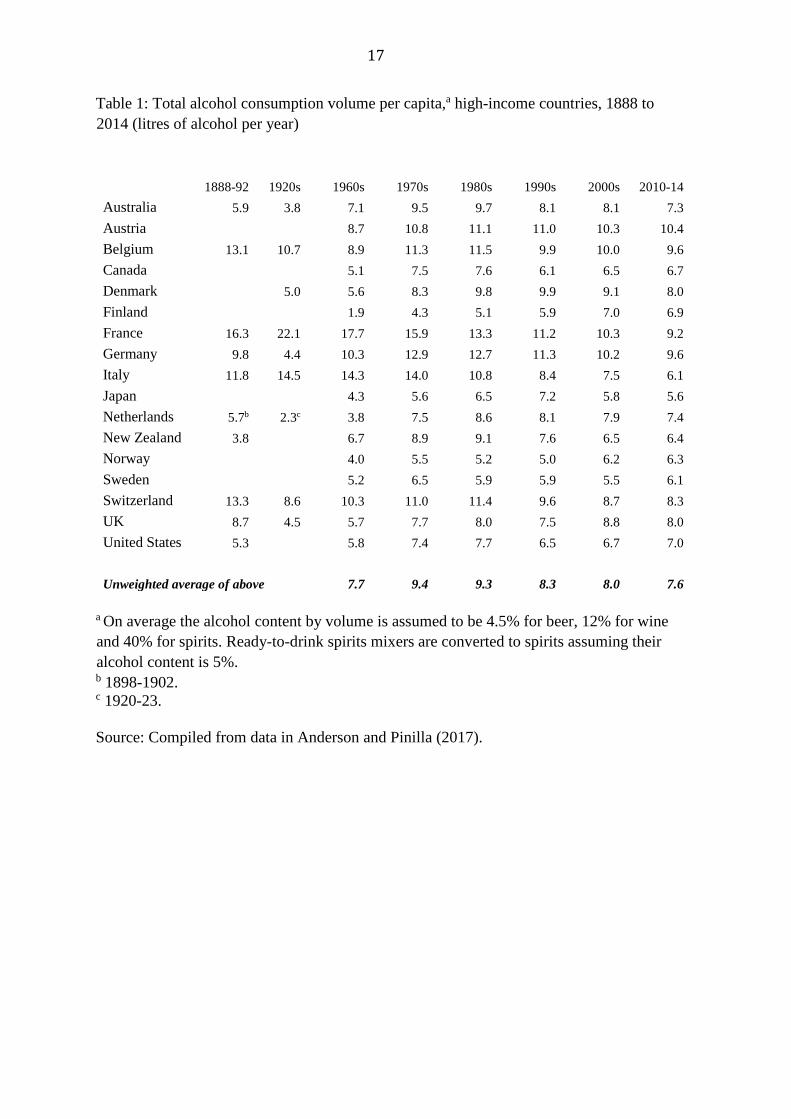
In terms of total alcohol consumption, for the majority of the eleven countries in
Table 1 with data back to the 19th century, their consumption was greater in the 1960s than
around 1890. For all but France and Italy consumption rose even more by the 1980s; but
then for all eleven countries their total alcohol consumption per capita fell over the
subsequent three decades to well below the unweighted average in the 1970s and 1980s.
Even in the global database, which includes numerous developing and transition
economies, their weighted average was almost the same in 2010-14 as it was in 1961-64
(last row of Table 3) – having been higher than both of those period averages in each of the
intervening decades. This is consistent with the inverted U-shaped trend of Figure 2(a).
As for the mix of alcohols, Table 2 shows that it was very different across the
eleven high-income countries up to the 1960s, especially with respect to wine which ranged
from 2% to 87% of all national alcohol sales during 1961-64 but also for beer (3-81%) and
Spirits (10-78%). By 2010-14 the ranges had narrowed somewhat for beer (19-53%) but
less so for wine (5-59%) and hardly at all for spirits (11-74%).
The mix across the global database changed very substantially over the past 55
years: wine’s share more than halved from 34% to 15%, beer’s rose by more than one-third
from 29% to 42%, and spirits’ rose but only a little from 37% to 43% (final row of Table
3). For eleven countries wine remained the main alcohol, for twelve countries beer
continued to dominate, and for ten countries spirits retained the largest share (see the bold
numbers in Table 3).
However, it is not possible to conclude from simply observing these per capita
volume trends whether alcohol consumption patterns are converging across countries.
Hence the need for better indicators, to which we now turn.
C. Coefficient of variation
9
Since 1961, the coefficient of variation has fallen for all three beverage groups, which
implies some convergence. This can be seen in Figure 3, where the coefficient of variation
across the full set of countries is shown for the per capita total volume of alcohol
consumption and for the shares of wine, beer and spirits in that total for each country. The
coefficient for the total volume of alcohol consumption has nearly halved over that half-
century, declining steadily throughout the period. There is very little decline in the
coefficient for the share of spirits, but there is a very steep decline for beer (falling from 0.8
to 0.4), while that for wine falls by more than one-quarter.
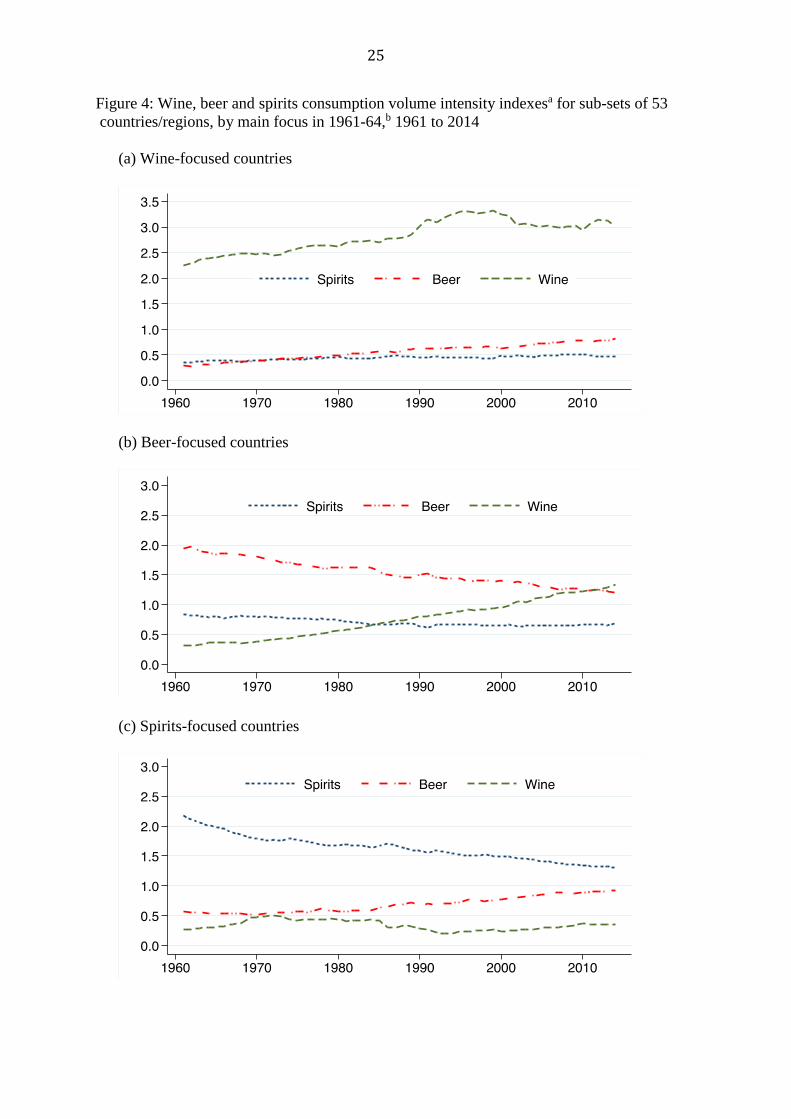
D. Beverage consumption intensity index
To examine trends in the beverage consumption intensity (and mix similarity) indexes, it is
helpful to divide into groups our 48 countries plus one residual sub-group of countries for
each of five geographic regions (called ‘countries’ too hereafter, for simplicity), so a total
of 53. Two groupings are used here. One is according to which of the three beverages has
the highest share of the volume of alcohol consumption in 1961-64. It turns out those three
groups have almost the same number of countries (19 wine-focused and 17 each for beer-
focused and spirits-focused, see footnote b of Figure 4). The other grouping is according to
geography, with six regions identified. Those regions have a varying number of countries,
ranging from 17 for Western Europe to 11 for Asia, 9 for Eastern Europe and Central Asia,
6 for Latin America, 6 for Africa and the Middle East, and 2 for North America. One
‘country’ in all but the last of those regions is the weighted average of all countries in the
region that have not been separately identified. Australasia is omitted for space reasons.
The decrease in the share of wine in the overall volume of global alcohol
consumption has been faster than the decrease in wine’s share of consumption in a number
of wine-focused countries, so that country group’s wine consumption intensity index has
risen over the past half-century, from 2.2 to around 3.0. That group’s spirits intensity index
has not risen much (at around 0.5), but its beer intensity index has nearly doubled, from less
than 0.4 to 0.75 (Figure 4(a)).
For the beer-focused countries, their beer intensity index has nearly halved, from
close to 2.0 down to 1.2, while their wine intensity index has trebled and is now slightly
above that for beer, and their spirits intensity index has fallen from just below a little further
below 1.0 (Figure 4(b)).
10
For the spirits-focused countries, their spirits intensity index has nearly halved in
falling to 1.25, their beer intensity index has risen from 0.5 to 0.9, and their wine intensity
index trend has remained flat at a little below 0.5 (Figure 4(c)).
Turning to the regions (Figure 5), the clearest convergence on intensity indexes of
unity for the three beverages is found in Eastern Europe, and the next clearest region is
North America. In Western Europe, by contrast, the beer and spirits intensity indexes have
changed little from around 1.0 and 0.5, respectively, while the wine intensity index has
risen from 1.6 to 2.7. The indexes for Africa/Middle East also have diverged, with beer’s
rising further above 1.0 and spirits’ falling further below 1.0 while wine’s remains just
below 1.0. In Latin America, wine and spirits have converged to just below 1.0 (wine from
above, spirits from below) while beer has risen from 1.0 to 1.5. And in Asia, beer’s index
has doubled to 0.8, the spirits index has fallen from 2.4 to 1.5, and the wine index has risen
from almost zero to 0.2.
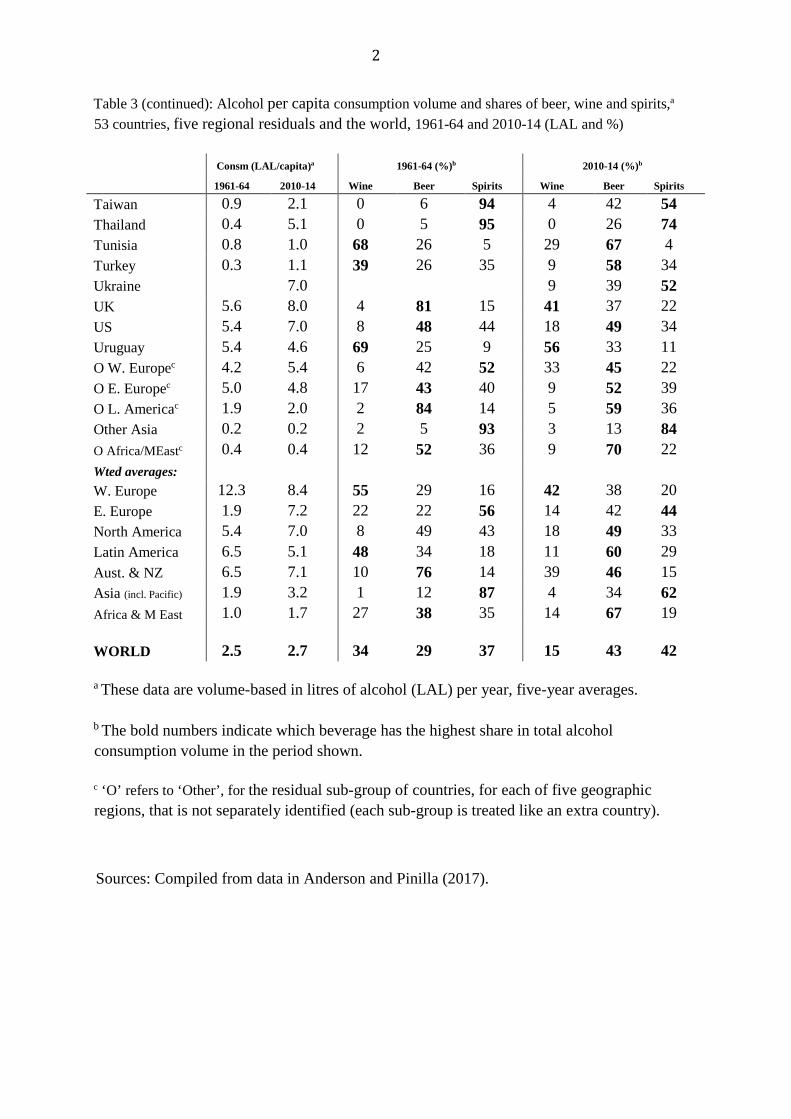
These volume indexes suggest there are still major differences across these region
of the world in their consumers’ beverage focus based on volumes. But what do value-
based indexes suggest, given that, as shown in Figure 6, tax-inclusive retail prices of
alcoholic beverages vary enormously across those regions? We do not have expenditure
data for all countries for the 20th century, but we do have them for recent years. Table 4
shows the differences by region between the consumption volume and value intensity
indexes for the period 2013-15. For three of the regions (Western Europe, Eastern Europe
and North America), all three value intensity indexes are closer to unity than are their
volume indexes; for two regions (Australasia and Africa/Middle East), two of the three
value indexes are closer to unity than are their volume indexes; and for the other two
regions, one of the three value indexes is closer to unity than their volume indexes. This
comparison suggests that part of the reason for the cross-country variation in volume
intensity indexes has to do with the variation in national average retail beverage prices.
E. Alcohol consumption mix similarity index
The alcohol consumption mix similarity indexes for various country groups are plotted in
Figure 7. The beer- and spirits-focused countries converged rapidly towards the world
average (that is, the indexes approached 1.0) from the early 1960s to the mid-1980s, and
then more slowly during the past two decades. By contrast, the consumption mix similarity
index for the wine-focused countries has not converged over this period. This again reflects
11
the fact that many of the wine-focused countries have reduced the share of wine in their
consumption mix less than has occurred in the rest of the world. This is the same
conclusion that was reached above by inspecting the intensity index for wine-focused
countries in Figure 4(a).
The same convergence toward unity in consumption mix similarity indexes is
evident when countries are differentiated by geographic region, as in Figure 7(b). The
convergence has been fastest for Asia and Latin America, albeit from a low base, but it is
also evident for the other five regions – including North America and Eastern Europe, even
though their indexes were already above 0.9 in the 1960s.
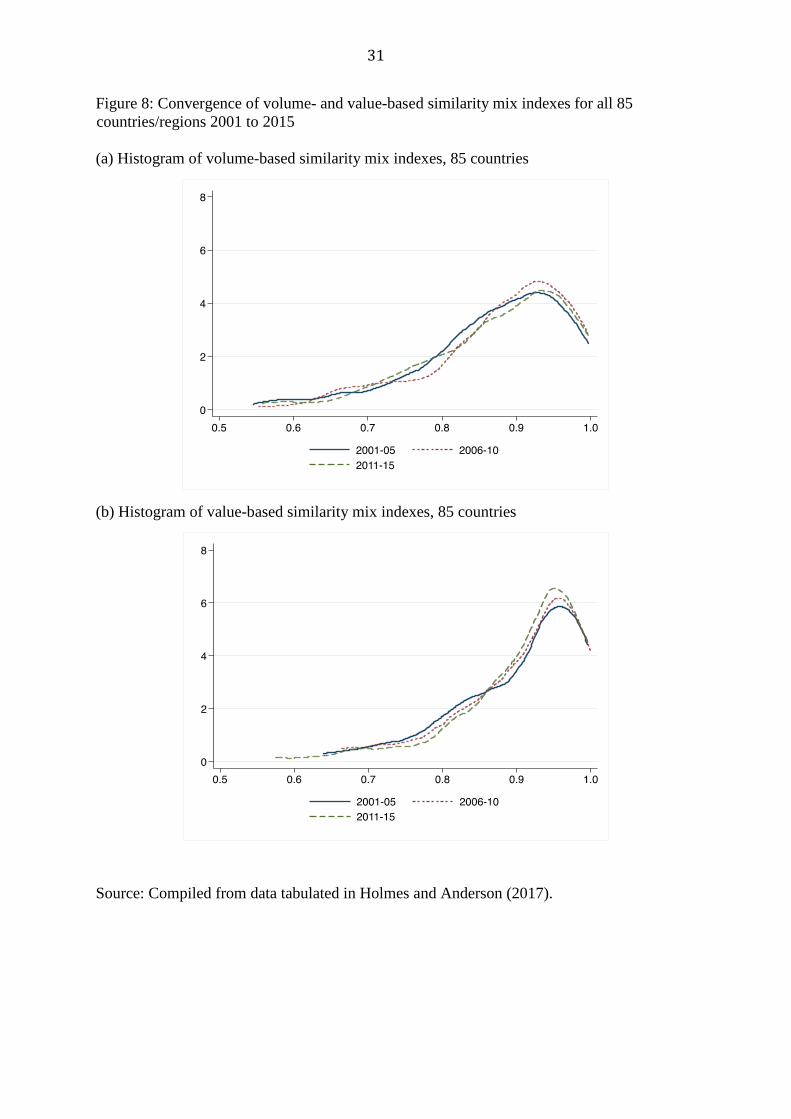
Even over the relatively short period of the 21st century for which we have data for
80 countries plus the 5 residual regions, it is evident from Figure 8(a) that the distribution
of similarity indexes is becoming more skewed over time toward unity.
The volume-based distributions are comparable with those for value-based
similarity indexes for the same three five-year periods. The latter distributions are even
more skewed toward unity than the volume-based similarity indexes (compare Figures 8(a)
and 8(b)). Together these findings indicate a general if not rapid global convergence in
national beverage mixes.
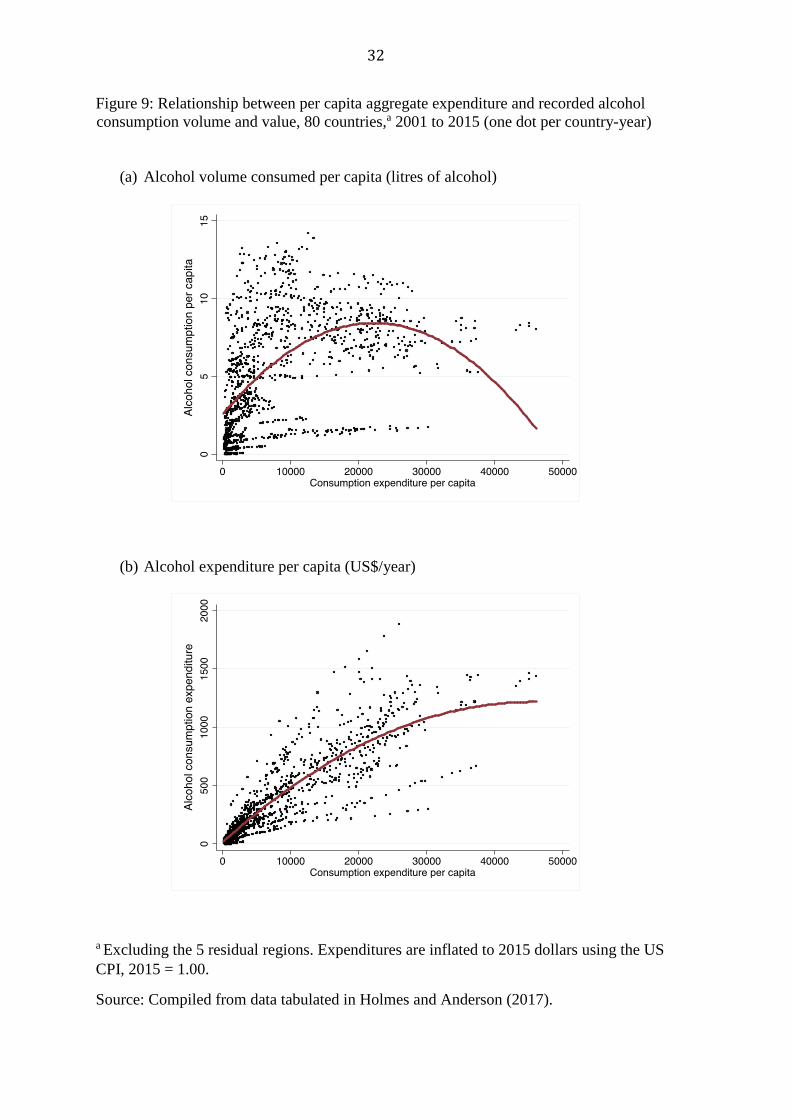
F. Alcohol consumption and aggregate expenditure
The moderating impact on indicators of the differences across countries in retail prices of
alcoholic beverages (both absolute and relative, see Figure 6) suggests the need to re-visit
the finding from Figure 2 of an inverted U-shaped relationship between national per capita
alcohol consumption volume and real GDP per capita. This is done for our larger sample of
85 countries for the years 2001 to 2015 in Figure 9, for both volumes and values of total
alcohol consumption per capita which are plotted against aggregate expenditure per capita
in 2015 US dollars. An inverted U-shape prevails for volume but not for value of alcohol
consumption as national aggregate expenditure rises.
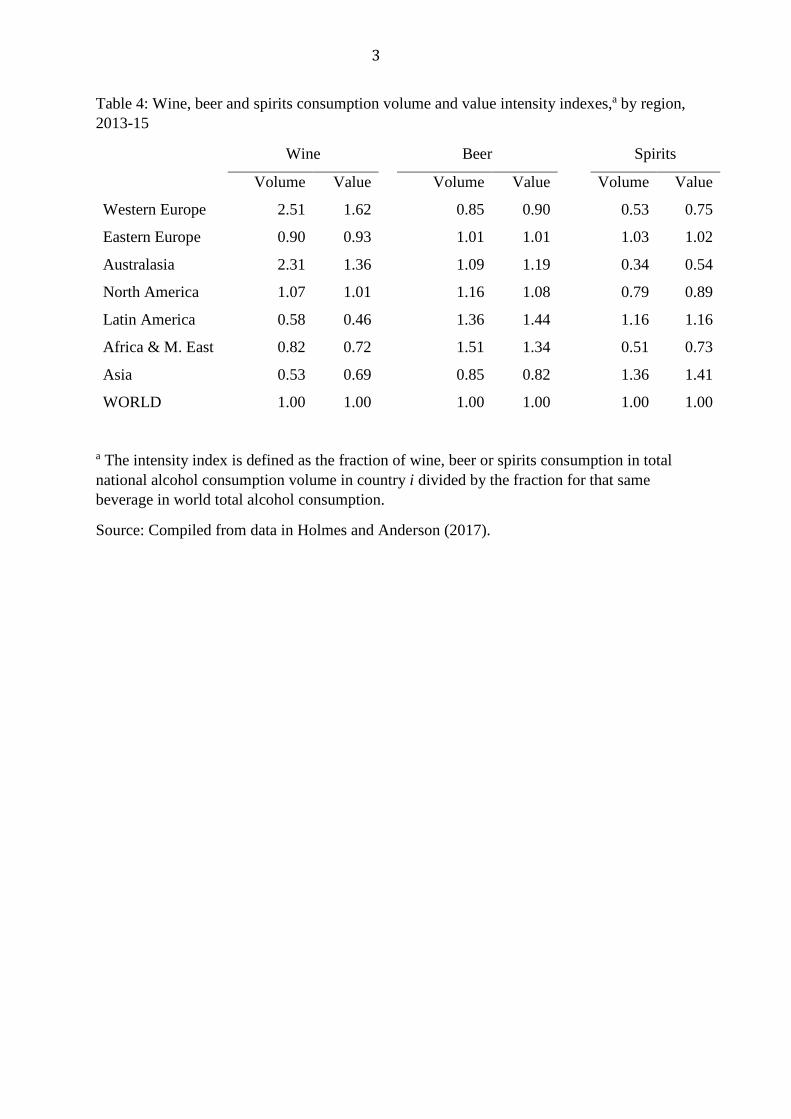
Also revealed in Figure 9 is the wide variance in per capita alcohol expenditure
across equally affluent countries. Partly that is due to differences across countries in value-
added or goods-and-services taxes and in alcohol excise or consumption taxes (Table 5).
When the expenditure data are disaggregated into the three beverage types, Figures
10(a) and 10(b) reveal that both wine and beer expenditures rise with aggregate
expenditure. However, Figure 10(c) suggests expenditure on spirits peaks at an aggregate
12
national expenditure level of US$27,800 per capita (in 2015 dollars) and declines
thereafter.
G. Alcoholic versus non-alcoholic beverages
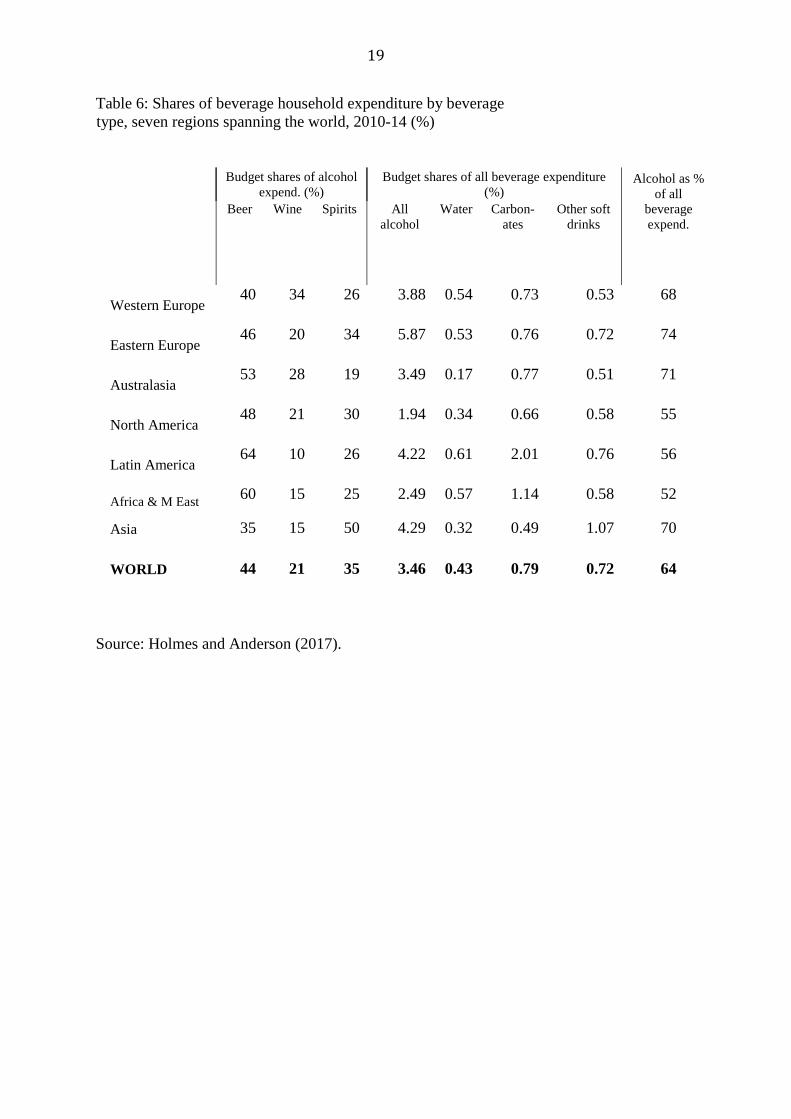
As of 2010-14, alcohol made up nearly two-thirds of the world’s recorded expenditure on
beverages, the rest being bottled water (8%), carbonated soft drinks (15%), and other soft
drinks such as fruit juices (13%). Those beverage shares vary widely across regions though
(Table 6). This is in part because again retail prices vary between countries: for all soft
drinks they range from an average for 2013-15 of 70 US cents per litre in Africa and the
Middle East to 260 cents in Australasia (Euromonitor International 2016). The degree of
substitutability between alcoholic and soft drink consumption also may vary across
countries. So too does the availability of low-cost reticulated potable water. These facts
suggest further reasons to expect differences across countries in alcohol consumption
volumes and mixes.
Globally, during 2001 to 2015 the world’s volume of alcohol consumption
increased by one-quarter while that of non-alcoholic beverages rose by two-thirds.
However, global retail expenditure (including taxes) on those two product groups rose by
similar current US dollar amounts: 81% for alcoholic and 90% for non-alcoholic beverages
(Euromonitor International 2016). That difference between the volume and value increases
for alcohol consumption is not inconsistent with the findings of the previous sub-section in
which the volume of alcohol consumption traces a much more-pronounced inverted U-
shape as total expenditure rises than does the value of alcohol consumption.
V. Robustness test
It needs to be kept in mind that all the consumption data reported above refer only to what
has been recorded by national governments. There is an additional amount of alcohol
produced and consumed each year that is not recorded. WHO (2015) has compiled
estimates of those amounts for 98 countries for 2000, 2005 and 2010.
13
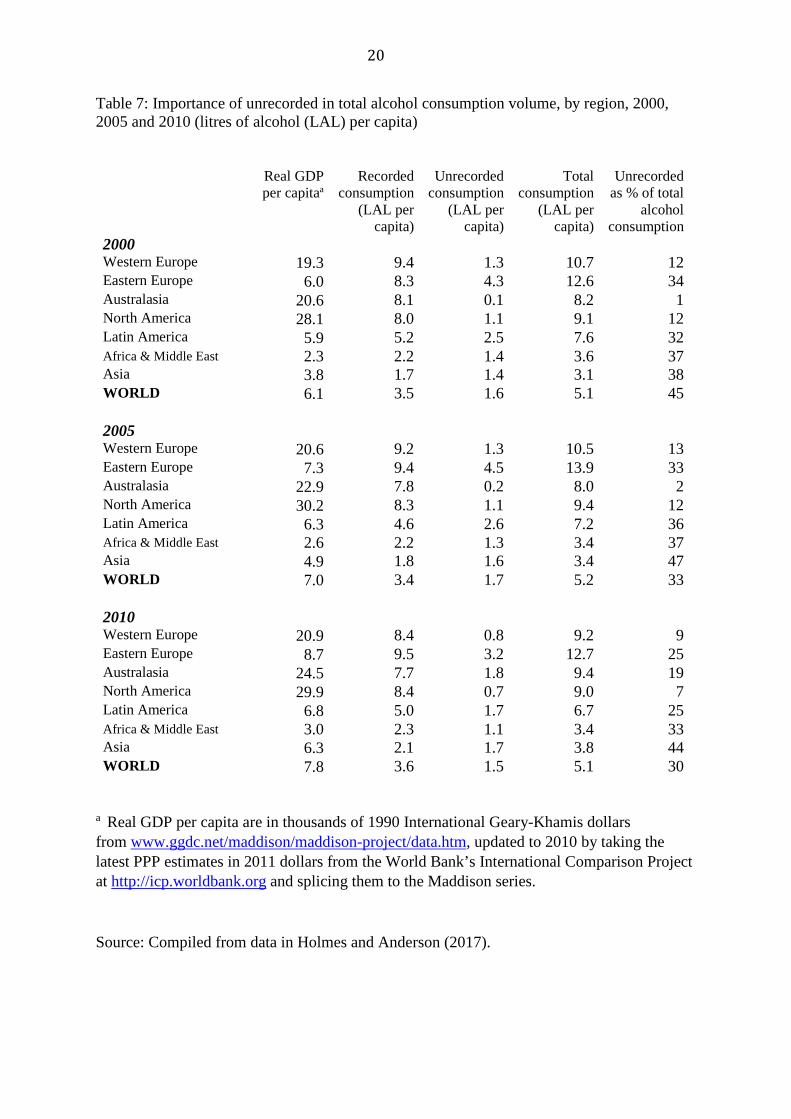
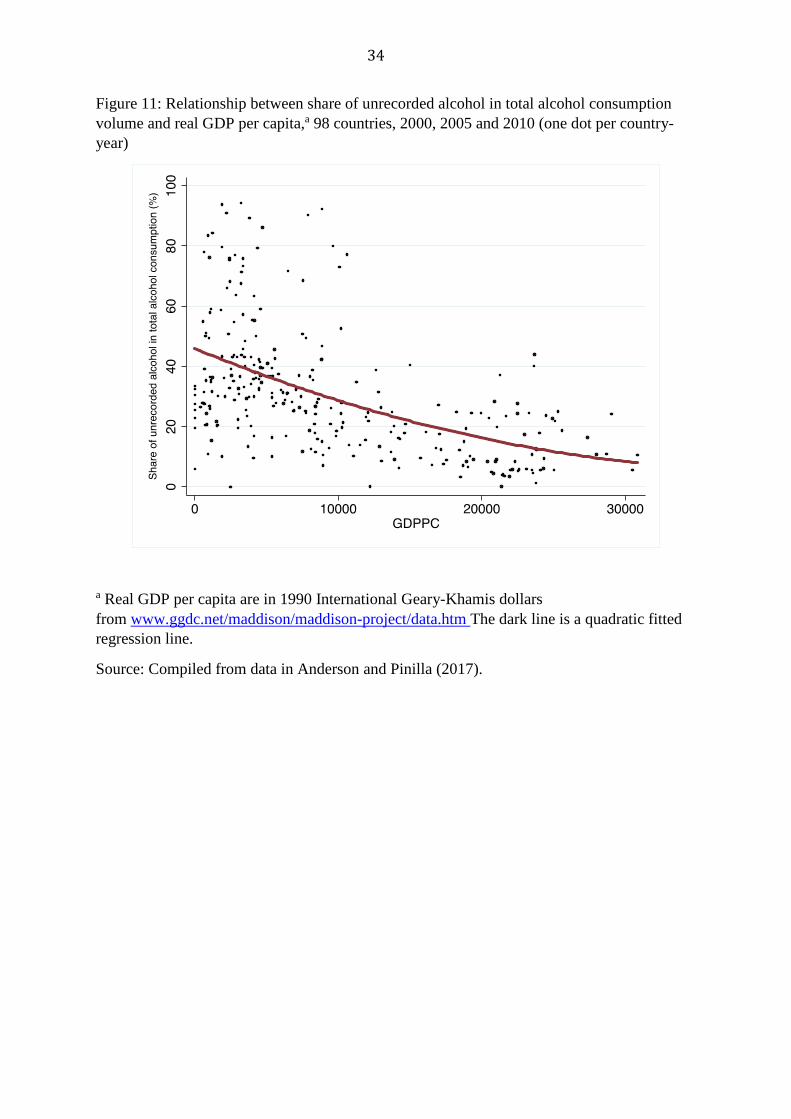
Evidently, the share of unrecorded in total alcohol consumption declines with real
GDP per capita (Figure 11 and Table 7).3 This exposes another aspect of convergence
across countries in alcohol consumption, namely, in the share of national consumption that
is unrecorded, which converges toward zero as per capita incomes grow.
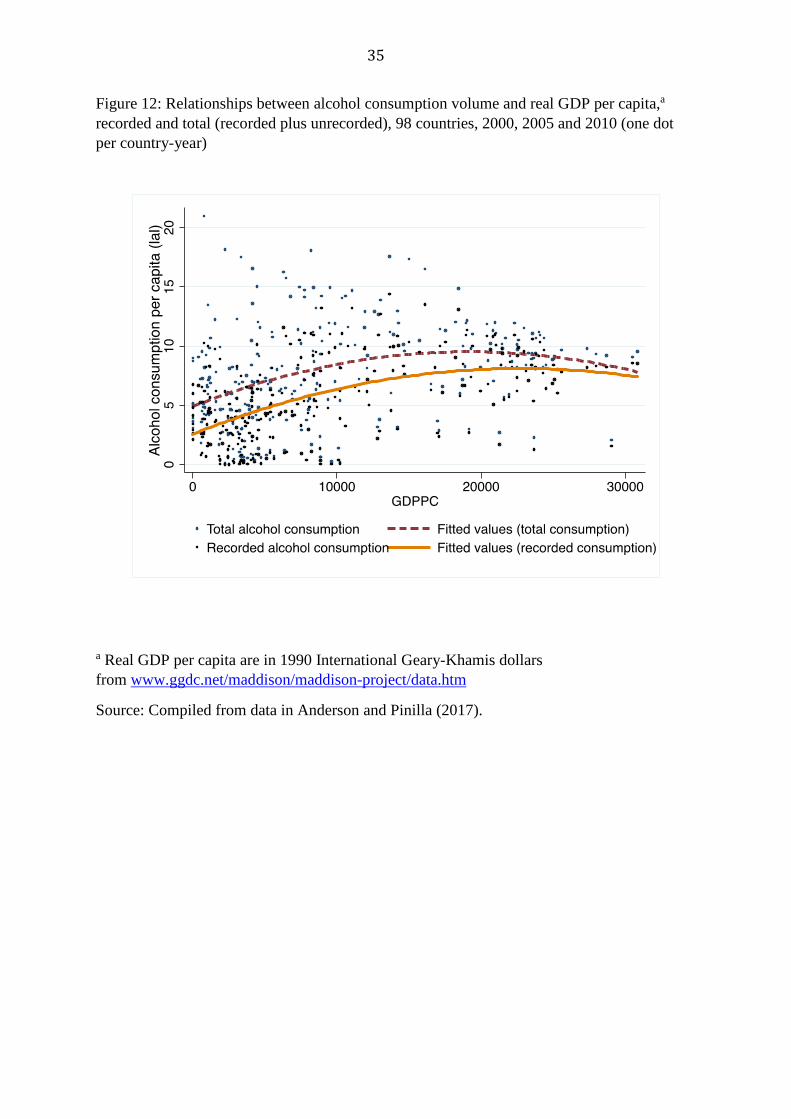
Another implication of this phenomenon is that the inverted U-shaped relationship
between per capita alcohol consumption and real GDP per capita is flatter once unrecorded
consumption is included, as shown by the quadratic fitted regression lines in Figure 12 for
the three years and 98 countries for which estimates are available.
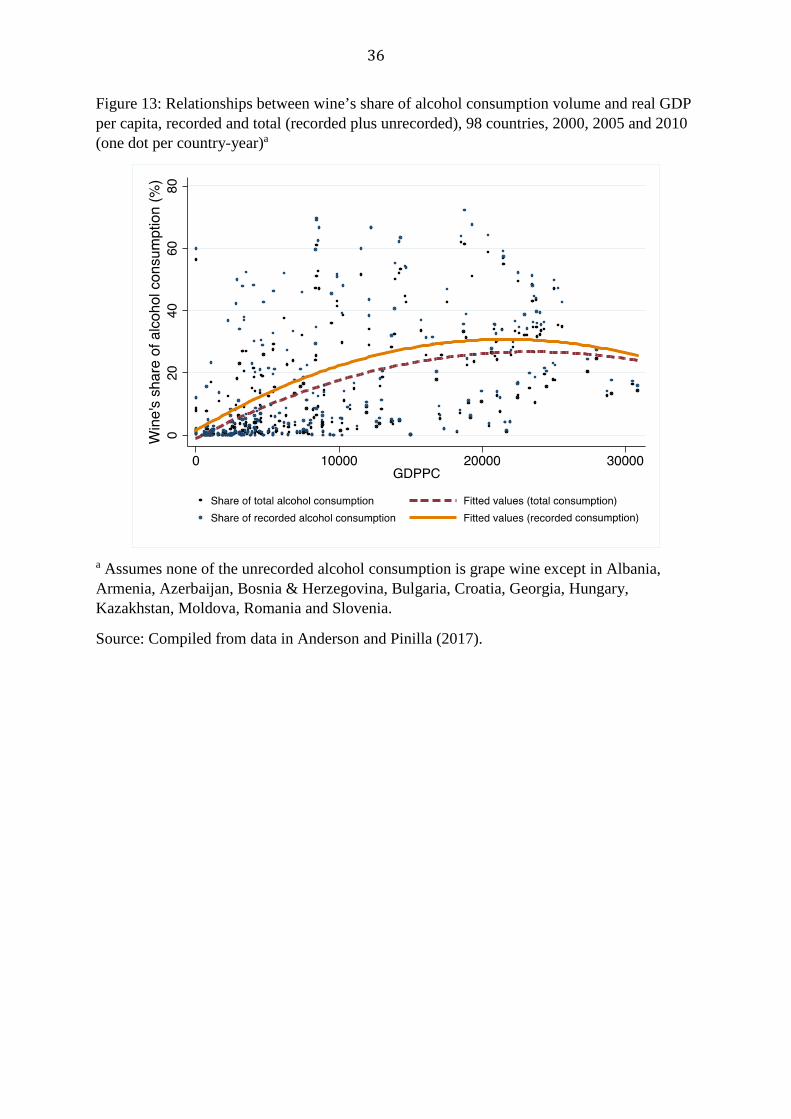
A more-specific implication is that the share of wine in total alcohol consumption
globally is lower than its share of recorded alcohol consumption, since very little of that
unrecorded alcohol is wine.4 But as Figure 13 shows, when unrecorded consumption is
included, the quadratic fitted regression line tracing wine’s share of total alcohol
consumption against real GDP per capita tends to plateau rather than turn down at high per
capita income.
VI. Conclusions
The above global data show big changes in national, regional and global alcohol
consumption patterns. At the global level it was noted that during 1961-2014, wine’s share
of the total volume of alcohol consumption more than halved from 34% to 15%, beer’s rose
by more than one-third (from 29% to 42%), and spirits’ rose but only a little (from 37% to
43%). That reveals a trend away from equal global shares of the three beverages. At the
national level, the above analysis provides a number of indicators of convergence in
national alcohol consumption patterns toward that changing global average mix, but also
some anomalies. Key findings include the following:
• The volume of total alcohol consumption per capita first rises as per capita income
rises, but beyond a threshold income level it falls
3 That share declined globally by one-eighth over the first decade of this century, and by 2010 was just under 25%. 4 The exceptions are a dozen transition economies of Eastern Europe: Albania, Armenia, Azerbaijan, Bosnia & Herzegovina, Bulgaria, Croatia, Georgia, Hungary, Kazakhstan, Moldova, Romania and Slovenia.
14
o However, that inverted U-shaped curve is flatter for per capita expenditure
on alcohol (at least for 2001-15), and when unrecorded consumption is taken
into account by adding it to recorded consumption;
• Each of the three types of alcohol consumption per capita also traces out an inverted
U-shaped curve over the per capita income spectrum in volume terms, but that is
true in value terms (at least for 2001-15) only for spirits;
• The coefficient of variation across countries in the total volume of alcohol
consumption, and in the shares of each beverage in that total consumption, fell
considerably over the 1961-2014 period (but least so for spirits);
• When countries are grouped by their main beverage focus as of 1961-64, the share
of that focus beverage in the total volume of alcohol consumption for that sub-group
of countries fell over the next five decades
o However, the consumption intensity index rose rather than fell for wine in
the wine-focused group of countries, due to the wine share falling less for
that group of countries than for the world as a whole;
• In beer-focused countries, it was wine’s share that grew rapidly, whereas in wine-
and spirits-focused countries it was beer that rose in importance;
• When countries are grouped by geographic region, all three beverage consumption
volume intensity indexes converged toward unity for North America and Eastern
Europe, but they diverged for Western Europe and Africa/Middle East;
• The consumption mix similarity indexes moved closer to one during 2001 to 2015
for most regional country groups, and also for beer-focused and spirits-focused
countries – but not for wine-focused countries and only barely for Western Europe.
In short, we find strong but not unequivocal indications of convergence in national
alcohol consumption patterns across the world. It remains to draw out their implications for
demand elasticity estimates and to explain these evolving patterns econometrically now that
we have a comprehensive global database. So our next step is to build on and extend the
seminal work by Selvanathan and Selvanathan (2007) to see to what extent income, own-
price, and cross-price elasticities of demand for alcoholic and non-alcoholic beverages
differ across countries and over time. Subsequent work could focus on explaining
econometrically the cross-country differences in our two indexes in terms of such variables
as beverage consumer tax rates, per capita incomes, and trade costs.
15
References
Aizenman, J. and Brooks, E. (2008). Globalization and taste convergence: the cases of wine
and beer. Review of International Economics 16(2): 217–33.
Anderson, K. (2010). Excise and import taxes on wine vs beer and spirits: an international
comparison. Economic Papers 29(2): 215-28.
Anderson, K. (2014a). Changing varietal distinctiveness of the world’s wine regions:
evidence from a new global database. Journal of Wine Economics 9(3): 249–72.
Anderson, K. (2014b). Excise taxes on wines, beers and spirits: An updated international
comparison. Wine & Viticulture Journal 29(6): 66-71.
Anderson, K. and Pinilla, V. (with the assistance of A. J. Holmes) (2017). Annual Database
of Global Wine Markets, 1835 to 2015. Wine Economics Research Centre,
University of Adelaide, to be posted at www.adelaide.edu.au/wine-
econ/databases/global-wine-history
Baldwin, R. (2016). The Great Convergence: Information Technology and the New
Globalization. Cambridge MA and London: Harvard University Press.
Bentzen, J., Eriksson, T., and Smith, V. (2001). Alcohol consumption in European
countries. Cahiers d’economie et sociologie rurales 60 and 61: 50-75.
Briggs, A. (1985). Wine for Sale: Victoria Wine and the Liquor Trade, 1860-1984. London:
B. T. Batsford.
Colen, L. and Swinnen, J. (2016). Economic growth, globalisation and beer consumption.
Journal of Agricultural Economics 67(1): 186–207.
Euromonitor International (2016). Passport. Global market information database.
Griliches, Z. (1979). Issues in assessing the contribution of research and development to
productivity growth. The Bell Journal of Economic 10: 92–116.
Holmes, A. J. and Anderson, K. (2017). Annual Database of National Beverage
Consumption Volumes and Expenditures, 1950 to 2015. Wine Economics Research
Centre, University of Adelaide, to be posted at www.adelaide.edu.au/wine-
econ/databases/alcohol-consumption
Jaffe, A. B. (1986). Technological opportunity and spillovers of R&D: evidence from
firms’ patents, profits and market value. American Economic Review 76(5): 984–
1001.
16
Pinney, T. (1989). A History of Wine in America: From Beginning to Prohibition, Volume 1,
Berkeley CA: University of California Press.
Pinney, T. (2005). A History of Wine in America: From Prohibition to the Present, Volume 2,
Berkeley CA: University of California Press.
Selvanathan, S. and Selvanathan, E. A. (2007). Another look at the identical tastes
hypothesis on the analysis of cross-country alcohol data. Empirical Economics
32(1): 185–215.
Smith, D. E. and Solgaard, H. S. (2000). The dynamics of shifts in European alcoholic
drinks consumption. Journal of International Consumer Marketing 12(3): 85–109.
Stigler, G. J. and Becker, G. S. (1977). De gustibus non est disputandum. American
Economic Review 67(2): 76–90.
WHO (2015). Global Health Observatory Data Repository. Accessed December 15
at http://apps.who.int/gho/data/node.main.A1022?lang=en&showonly=GISAH
Wilson, G.B. (1940). Alcohol and the Nation: A Contribution to the Study of the Liquor
Problem in the United Kingdom from 1800 to 1935, London: Nicholson and
Watson.
17
Table 1: Total alcohol consumption volume per capita,a high-income countries, 1888 to 2014 (litres of alcohol per year)
1888-92 1920s 1960s 1970s 1980s 1990s 2000s 2010-14 Australia 5.9 3.8 7.1 9.5 9.7 8.1 8.1 7.3 Austria 8.7 10.8 11.1 11.0 10.3 10.4 Belgium 13.1 10.7 8.9 11.3 11.5 9.9 10.0 9.6 Canada 5.1 7.5 7.6 6.1 6.5 6.7 Denmark 5.0 5.6 8.3 9.8 9.9 9.1 8.0 Finland 1.9 4.3 5.1 5.9 7.0 6.9 France 16.3 22.1 17.7 15.9 13.3 11.2 10.3 9.2 Germany 9.8 4.4 10.3 12.9 12.7 11.3 10.2 9.6 Italy 11.8 14.5 14.3 14.0 10.8 8.4 7.5 6.1 Japan 4.3 5.6 6.5 7.2 5.8 5.6 Netherlands 5.7b 2.3c 3.8 7.5 8.6 8.1 7.9 7.4 New Zealand 3.8 6.7 8.9 9.1 7.6 6.5 6.4 Norway 4.0 5.5 5.2 5.0 6.2 6.3 Sweden 5.2 6.5 5.9 5.9 5.5 6.1 Switzerland 13.3 8.6 10.3 11.0 11.4 9.6 8.7 8.3 UK 8.7 4.5 5.7 7.7 8.0 7.5 8.8 8.0 United States 5.3 5.8 7.4 7.7 6.5 6.7 7.0
Unweighted average of above 7.7 9.4 9.3 8.3 8.0 7.6
a On average the alcohol content by volume is assumed to be 4.5% for beer, 12% for wine and 40% for spirits. Ready-to-drink spirits mixers are converted to spirits assuming their alcohol content is 5%. b 1898-1902. c 1920-23. Source: Compiled from data in Anderson and Pinilla (2017).
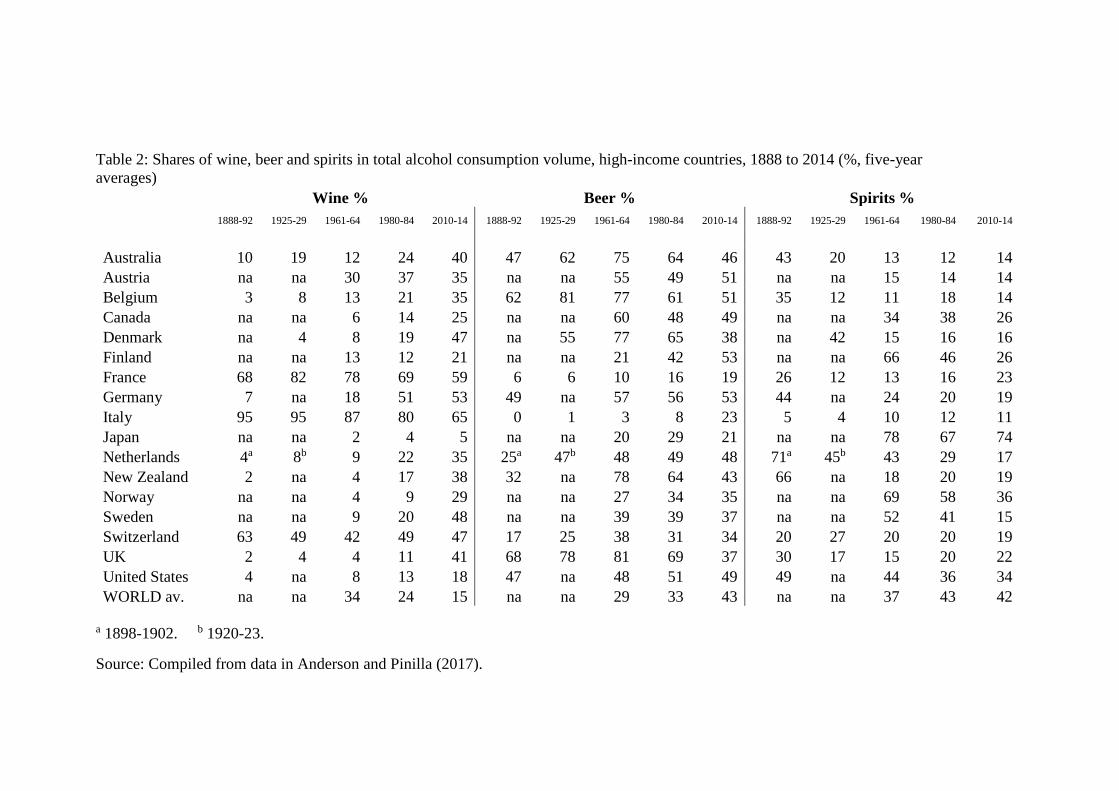
Table 2: Shares of wine, beer and spirits in total alcohol consumption volume, high-income countries, 1888 to 2014 (%, five-year averages) Wine % Beer % Spirits % 1888-92 1925-29 1961-64 1980-84 2010-14 1888-92 1925-29 1961-64 1980-84 2010-14 1888-92 1925-29 1961-64 1980-84 2010-14
Australia 10 19 12 24 40 47 62 75 64 46 43 20 13 12 14 Austria na na 30 37 35 na na 55 49 51 na na 15 14 14 Belgium 3 8 13 21 35 62 81 77 61 51 35 12 11 18 14 Canada na na 6 14 25 na na 60 48 49 na na 34 38 26 Denmark na 4 8 19 47 na 55 77 65 38 na 42 15 16 16 Finland na na 13 12 21 na na 21 42 53 na na 66 46 26 France 68 82 78 69 59 6 6 10 16 19 26 12 13 16 23 Germany 7 na 18 51 53 49 na 57 56 53 44 na 24 20 19 Italy 95 95 87 80 65 0 1 3 8 23 5 4 10 12 11 Japan na na 2 4 5 na na 20 29 21 na na 78 67 74 Netherlands 4a 8b 9 22 35 25a 47b 48 49 48 71a 45b 43 29 17 New Zealand 2 na 4 17 38 32 na 78 64 43 66 na 18 20 19 Norway na na 4 9 29 na na 27 34 35 na na 69 58 36 Sweden na na 9 20 48 na na 39 39 37 na na 52 41 15 Switzerland 63 49 42 49 47 17 25 38 31 34 20 27 20 20 19 UK 2 4 4 11 41 68 78 81 69 37 30 17 15 20 22 United States 4 na 8 13 18 47 na 48 51 49 49 na 44 36 34 WORLD av. na na 34 24 15 na na 29 33 43 na na 37 43 42
a 1898-1902. b 1920-23.
Source: Compiled from data in Anderson and Pinilla (2017).
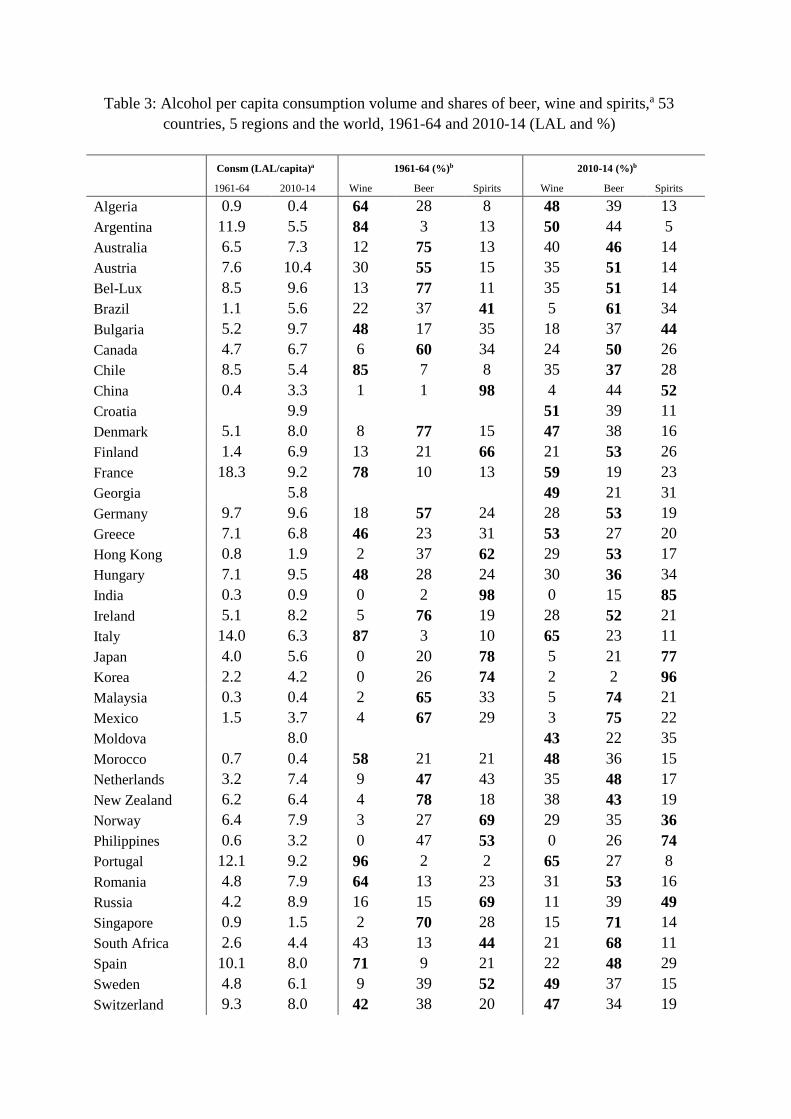
Table 3: Alcohol per capita consumption volume and shares of beer, wine and spirits,a 53 countries, 5 regions and the world, 1961-64 and 2010-14 (LAL and %)
Consm (LAL/capita)a 1961-64 (%)b 2010-14 (%)b
1961-64 2010-14 Wine Beer Spirits Wine Beer Spirits
Algeria 0.9 0.4 64 28 8 48 39 13 Argentina 11.9 5.5 84 3 13 50 44 5 Australia 6.5 7.3 12 75 13 40 46 14 Austria 7.6 10.4 30 55 15 35 51 14 Bel-Lux 8.5 9.6 13 77 11 35 51 14 Brazil 1.1 5.6 22 37 41 5 61 34 Bulgaria 5.2 9.7 48 17 35 18 37 44 Canada 4.7 6.7 6 60 34 24 50 26 Chile 8.5 5.4 85 7 8 35 37 28 China 0.4 3.3 1 1 98 4 44 52 Croatia 9.9 51 39 11 Denmark 5.1 8.0 8 77 15 47 38 16 Finland 1.4 6.9 13 21 66 21 53 26 France 18.3 9.2 78 10 13 59 19 23 Georgia 5.8 49 21 31 Germany 9.7 9.6 18 57 24 28 53 19 Greece 7.1 6.8 46 23 31 53 27 20 Hong Kong 0.8 1.9 2 37 62 29 53 17 Hungary 7.1 9.5 48 28 24 30 36 34 India 0.3 0.9 0 2 98 0 15 85 Ireland 5.1 8.2 5 76 19 28 52 21 Italy 14.0 6.3 87 3 10 65 23 11 Japan 4.0 5.6 0 20 78 5 21 77 Korea 2.2 4.2 0 26 74 2 2 96 Malaysia 0.3 0.4 2 65 33 5 74 21 Mexico 1.5 3.7 4 67 29 3 75 22 Moldova 8.0 43 22 35 Morocco 0.7 0.4 58 21 21 48 36 15 Netherlands 3.2 7.4 9 47 43 35 48 17 New Zealand 6.2 6.4 4 78 18 38 43 19 Norway 6.4 7.9 3 27 69 29 35 36 Philippines 0.6 3.2 0 47 53 0 26 74 Portugal 12.1 9.2 96 2 2 65 27 8 Romania 4.8 7.9 64 13 23 31 53 16 Russia 4.2 8.9 16 15 69 11 39 49 Singapore 0.9 1.5 2 70 28 15 71 14 South Africa 2.6 4.4 43 13 44 21 68 11 Spain 10.1 8.0 71 9 21 22 48 29 Sweden 4.8 6.1 9 39 52 49 37 15 Switzerland 9.3 8.0 42 38 20 47 34 19
2
Table 3 (continued): Alcohol per capita consumption volume and shares of beer, wine and spirits,a 53 countries, five regional residuals and the world, 1961-64 and 2010-14 (LAL and %)
Consm (LAL/capita)a 1961-64 (%)b 2010-14 (%)b
1961-64 2010-14 Wine Beer Spirits Wine Beer Spirits
Taiwan 0.9 2.1 0 6 94 4 42 54 Thailand 0.4 5.1 0 5 95 0 26 74 Tunisia 0.8 1.0 68 26 5 29 67 4 Turkey 0.3 1.1 39 26 35 9 58 34 Ukraine 7.0 9 39 52 UK 5.6 8.0 4 81 15 41 37 22 US 5.4 7.0 8 48 44 18 49 34 Uruguay 5.4 4.6 69 25 9 56 33 11 O W. Europec 4.2 5.4 6 42 52 33 45 22 O E. Europec 5.0 4.8 17 43 40 9 52 39 O L. Americac 1.9 2.0 2 84 14 5 59 36 Other Asia 0.2 0.2 2 5 93 3 13 84 O Africa/MEastc 0.4 0.4 12 52 36 9 70 22 Wted averages: W. Europe 12.3 8.4 55 29 16 42 38 20 E. Europe 1.9 7.2 22 22 56 14 42 44 North America 5.4 7.0 8 49 43 18 49 33 Latin America 6.5 5.1 48 34 18 11 60 29 Aust. & NZ 6.5 7.1 10 76 14 39 46 15 Asia (incl. Pacific) 1.9 3.2 1 12 87 4 34 62 Africa & M East 1.0 1.7 27 38 35 14 67 19 WORLD 2.5 2.7 34 29 37 15 43 42 a These data are volume-based in litres of alcohol (LAL) per year, five-year averages.
b The bold numbers indicate which beverage has the highest share in total alcohol consumption volume in the period shown. c ‘O’ refers to ‘Other’, for the residual sub-group of countries, for each of five geographic regions, that is not separately identified (each sub-group is treated like an extra country).
Sources: Compiled from data in Anderson and Pinilla (2017).
3
Table 4: Wine, beer and spirits consumption volume and value intensity indexes,a by region, 2013-15
Wine Beer Spirits
Volume Value
Volume Value
Volume Value
Western Europe 2.51 1.62
0.85 0.90
0.53 0.75
Eastern Europe 0.90 0.93
1.01 1.01
1.03 1.02
Australasia 2.31 1.36
1.09 1.19
0.34 0.54
North America 1.07 1.01
1.16 1.08
0.79 0.89
Latin America 0.58 0.46
1.36 1.44
1.16 1.16
Africa & M. East 0.82 0.72
1.51 1.34
0.51 0.73
Asia 0.53 0.69
0.85 0.82
1.36 1.41
WORLD 1.00 1.00
1.00 1.00
1.00 1.00
a The intensity index is defined as the fraction of wine, beer or spirits consumption in total national alcohol consumption volume in country i divided by the fraction for that same beverage in world total alcohol consumption.
Source: Compiled from data in Holmes and Anderson (2017).
Table 5: Per capita income, excise taxes on alcohol consumption by type, and VAT/GST, high-income countries, 2014 (% ad valorem equivalent)
Per capita income
(US$‘000)
Commercial wine excise
tax (%)
Beer excise
tax (%)
Spirits excise
tax (%)
VAT/ GST (%)
Australia 26.6 29 117 211 10
Austria 24.8 2 18 46 20
Canada 26.1 8 75 30 5
Finland 22.8 65 116 176 24
France 22.5 1 27 66 20
Japan 22.7 14 35 14 8
New Zealand 20.2 34 66 127 15
Norway 34.8 114 179 292 25
Sweden 25.9 49 70 213 25
United Kingdom 25.2 66 87 136 20
United States 32.1 7 58 28 0
Unweighted average of above 25.8 35 77 122 16
Source: Anderson and Pinilla (2017) and Anderson (2014b).
19
Table 6: Shares of beverage household expenditure by beverage type, seven regions spanning the world, 2010-14 (%)
Budget shares of alcohol expend. (%)
Budget shares of all beverage expenditure (%)
Alcohol as % of all
Beer Wine Spirits All alcohol
Water Carbon-ates
Other soft drinks
beverage expend.
Western Europe 40 34 26 3.88 0.54 0.73 0.53 68
Eastern Europe 46 20 34 5.87 0.53 0.76 0.72 74
Australasia 53 28 19 3.49 0.17 0.77 0.51 71
North America 48 21 30 1.94 0.34 0.66 0.58 55
Latin America 64 10 26 4.22 0.61 2.01 0.76 56
Africa & M East 60 15 25 2.49 0.57 1.14 0.58 52
Asia 35 15 50 4.29 0.32 0.49 1.07 70
WORLD 44 21 35 3.46 0.43 0.79 0.72 64
Source: Holmes and Anderson (2017).
20
Table 7: Importance of unrecorded in total alcohol consumption volume, by region, 2000, 2005 and 2010 (litres of alcohol (LAL) per capita) Real GDP
per capitaa Recorded
consumption (LAL per
capita)
Unrecorded consumption
(LAL per capita)
Total consumption
(LAL per capita)
Unrecorded as % of total
alcohol consumption
2000 Western Europe 19.3 9.4 1.3 10.7 12 Eastern Europe 6.0 8.3 4.3 12.6 34 Australasia 20.6 8.1 0.1 8.2 1 North America 28.1 8.0 1.1 9.1 12 Latin America 5.9 5.2 2.5 7.6 32 Africa & Middle East 2.3 2.2 1.4 3.6 37 Asia 3.8 1.7 1.4 3.1 38 WORLD 6.1 3.5 1.6 5.1 45 2005 Western Europe 20.6 9.2 1.3 10.5 13 Eastern Europe 7.3 9.4 4.5 13.9 33 Australasia 22.9 7.8 0.2 8.0 2 North America 30.2 8.3 1.1 9.4 12 Latin America 6.3 4.6 2.6 7.2 36 Africa & Middle East 2.6 2.2 1.3 3.4 37 Asia 4.9 1.8 1.6 3.4 47 WORLD 7.0 3.4 1.7 5.2 33 2010 Western Europe 20.9 8.4 0.8 9.2 9 Eastern Europe 8.7 9.5 3.2 12.7 25 Australasia 24.5 7.7 1.8 9.4 19 North America 29.9 8.4 0.7 9.0 7 Latin America 6.8 5.0 1.7 6.7 25 Africa & Middle East 3.0 2.3 1.1 3.4 33 Asia 6.3 2.1 1.7 3.8 44 WORLD 7.8 3.6 1.5 5.1 30
a Real GDP per capita are in thousands of 1990 International Geary-Khamis dollars from www.ggdc.net/maddison/maddison-project/data.htm, updated to 2010 by taking the latest PPP estimates in 2011 dollars from the World Bank’s International Comparison Project at http://icp.worldbank.org and splicing them to the Maddison series.
Source: Compiled from data in Holmes and Anderson (2017).
21
Figure 1: Angular separation between two countries (i and j), each consuming just two beverages (beer and wine)
Source: Authors’ compilation.
0 10 20 30 40 50
Beer's share of national alcohol consumption (%)
i
j
θ
22
Figure 2: Relationship between recorded alcohol consumption volume and real GDP per capita, 53 countries/regions,a 1961 to 2014 (one dot per country-year)
(a) All alcohol
(b) Wine
23
Figure 2 (continued): Relationship between recorded alcohol consumption volume and real GDP per capita,a 53 countries/regions, 1961 to 2014 (one dot per country-year)
(c) Beer
(d) Spirits
a Real GDP per capita are in 1990 International Geary-Khamis dollars from www.ggdc.net/maddison/maddison-project/data.htm, updated to 2014 by taking the latest PPP estimates in 2011 dollars from the World Bank’s International Comparison Project at http://icp.worldbank.org and splicing them to the Maddison series. The curved line is a fitted quadratic regression line.
Source: Compiled from data in Anderson and Pinilla (2017).
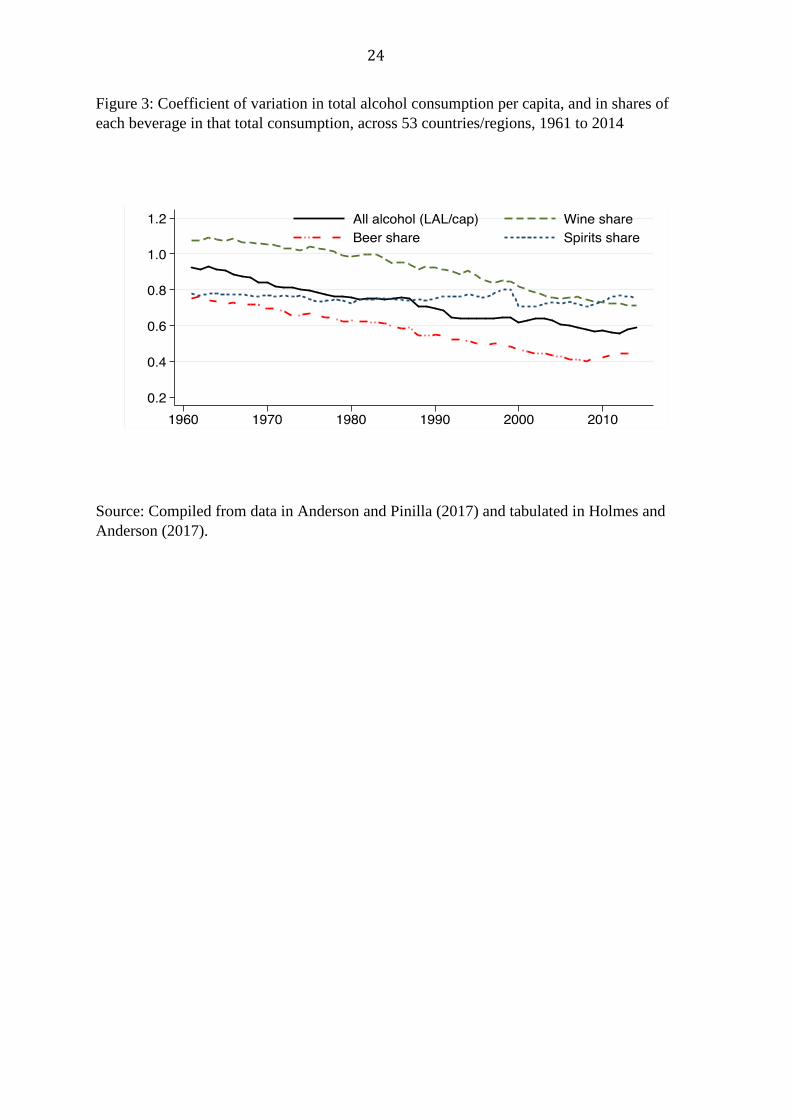
24
Figure 3: Coefficient of variation in total alcohol consumption per capita, and in shares of each beverage in that total consumption, across 53 countries/regions, 1961 to 2014
Source: Compiled from data in Anderson and Pinilla (2017) and tabulated in Holmes and Anderson (2017).
25
Figure 4: Wine, beer and spirits consumption volume intensity indexesa for sub-sets of 53 countries/regions, by main focus in 1961-64,b 1961 to 2014
(a) Wine-focused countries
(b) Beer-focused countries
(c) Spirits-focused countries
26
Figure 4 (continued): Wine, beer and spirits consumption volume intensity indexes for sub-sets of 53 countries/regions, by main focus in 1961-64,a 1961 to 2014 a The intensity index is defined as the fraction of wine, beer or spirits consumption in total national alcohol consumption volume in country i divided by the fraction for that same beverage in world total alcohol consumption. b Wine-focused: Algeria, Argentina, Bulgaria, Chile, Croatia, France, Georgia, Greece, Hungary, Italy, Moldova, Morocco, Portugal, Romania, Spain, Switzerland, Tunisia, Turkey, Uruguay; Beer-focused: Australia, Austria, Belgium-Luxembourg, Canada, Denmark, Germany, Ireland, Malaysia, Mexico, Netherlands, New Zealand, Singapore, United Kingdom, United States, Other Eastern Europe, Other Latin America, Other African and Middle East; Spirits-focused: Brazil, China, Finland, Hong Kong, India, Japan, Korea, Norway, Philippines, Russia, South Africa, Sweden, Taiwan, Thailand, Ukraine, Other Western Europe, Other Asia.
Source: Compiled from data in Anderson and Pinilla (2017) and tabulated in Holmes and Anderson (2017).
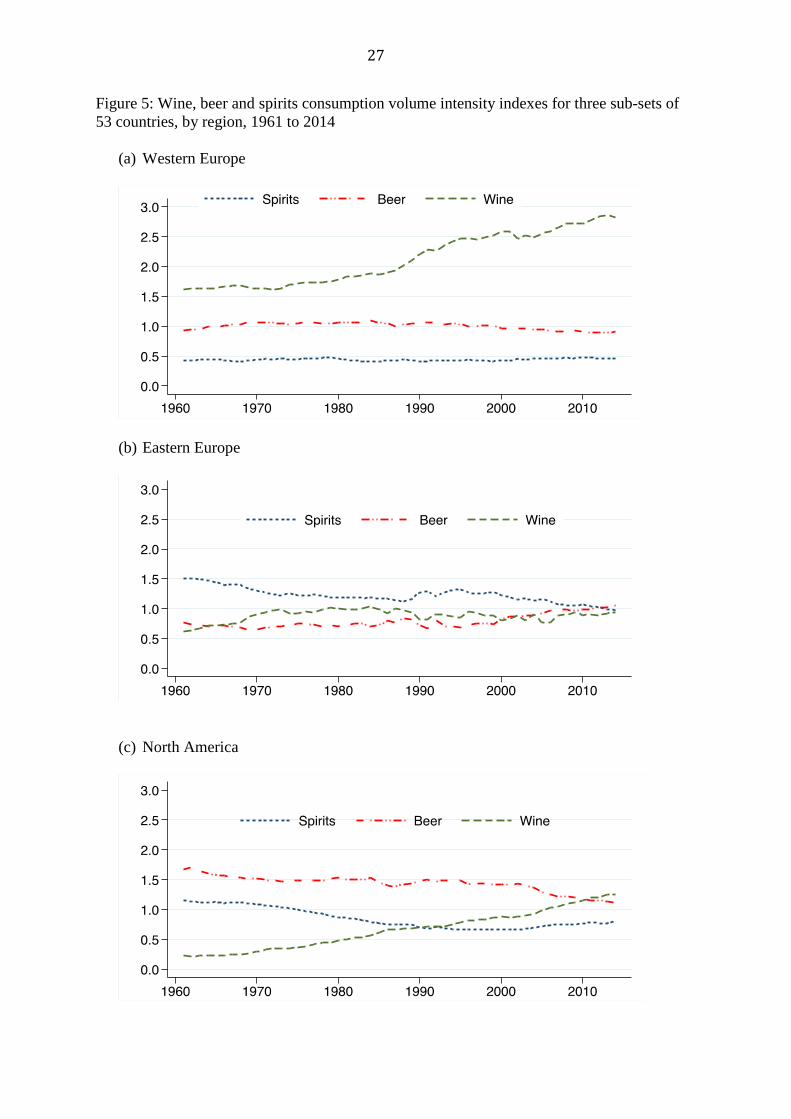
27
Figure 5: Wine, beer and spirits consumption volume intensity indexes for three sub-sets of 53 countries, by region, 1961 to 2014
(a) Western Europe
(b) Eastern Europe
(c) North America
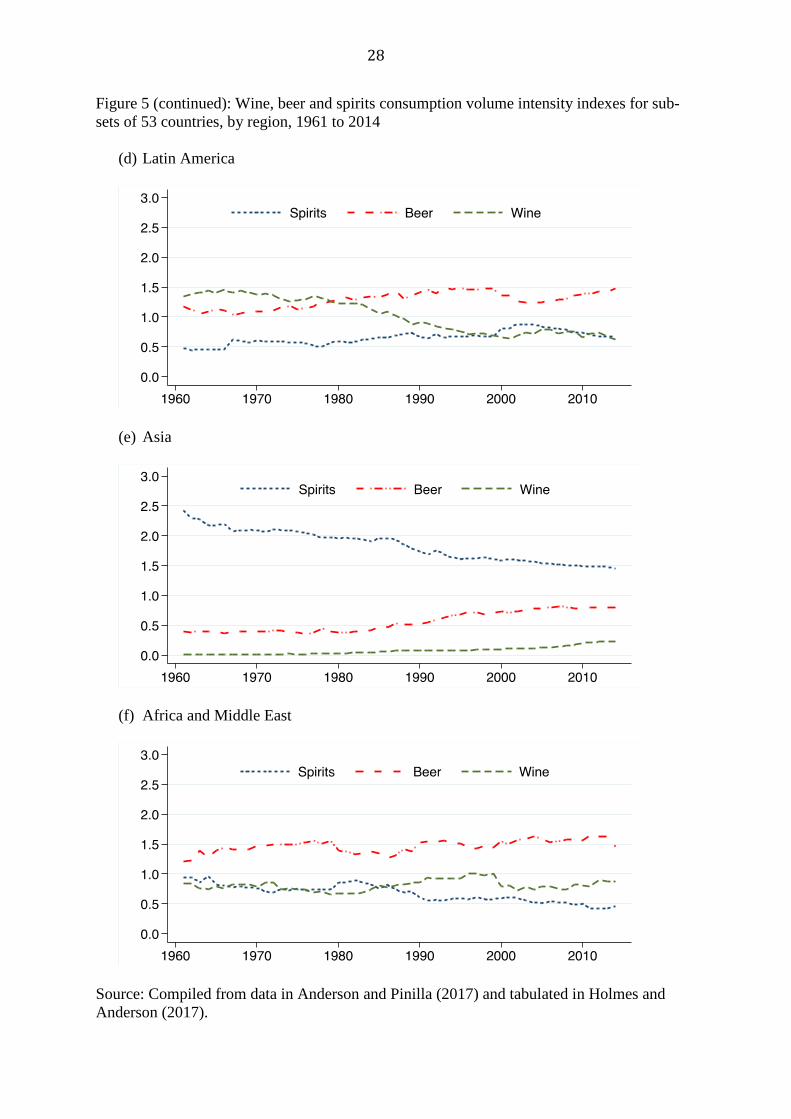
28
Figure 5 (continued): Wine, beer and spirits consumption volume intensity indexes for sub-sets of 53 countries, by region, 1961 to 2014
(d) Latin America
(e) Asia
(f) Africa and Middle East
Source: Compiled from data in Anderson and Pinilla (2017) and tabulated in Holmes and Anderson (2017).
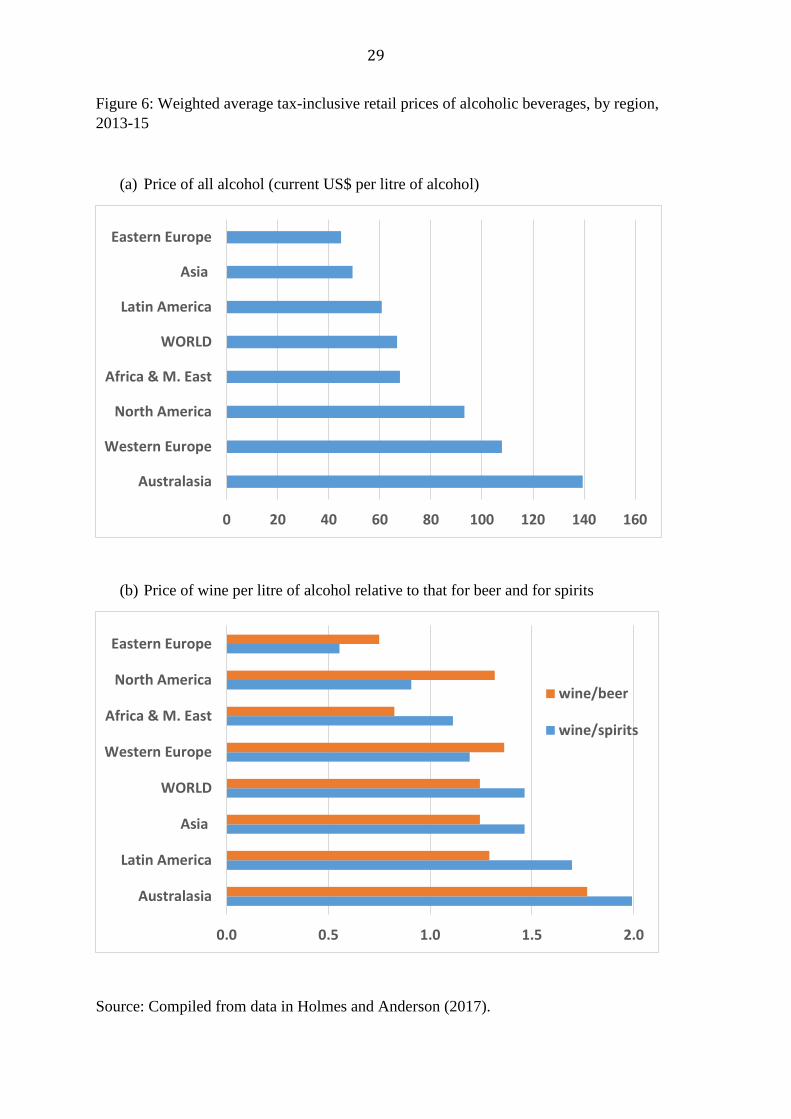
29
Figure 6: Weighted average tax-inclusive retail prices of alcoholic beverages, by region, 2013-15
(a) Price of all alcohol (current US$ per litre of alcohol)
(b) Price of wine per litre of alcohol relative to that for beer and for spirits
Source: Compiled from data in Holmes and Anderson (2017).
0 20 40 60 80 100 120 140 160
Australasia
Western Europe
North America
Africa & M. East
WORLD
Latin America
Asia
Eastern Europe
0.0 0.5 1.0 1.5 2.0
Australasia
Latin America
Asia
WORLD
Western Europe
Africa & M. East
North America
Eastern Europe
wine/beer
wine/spirits
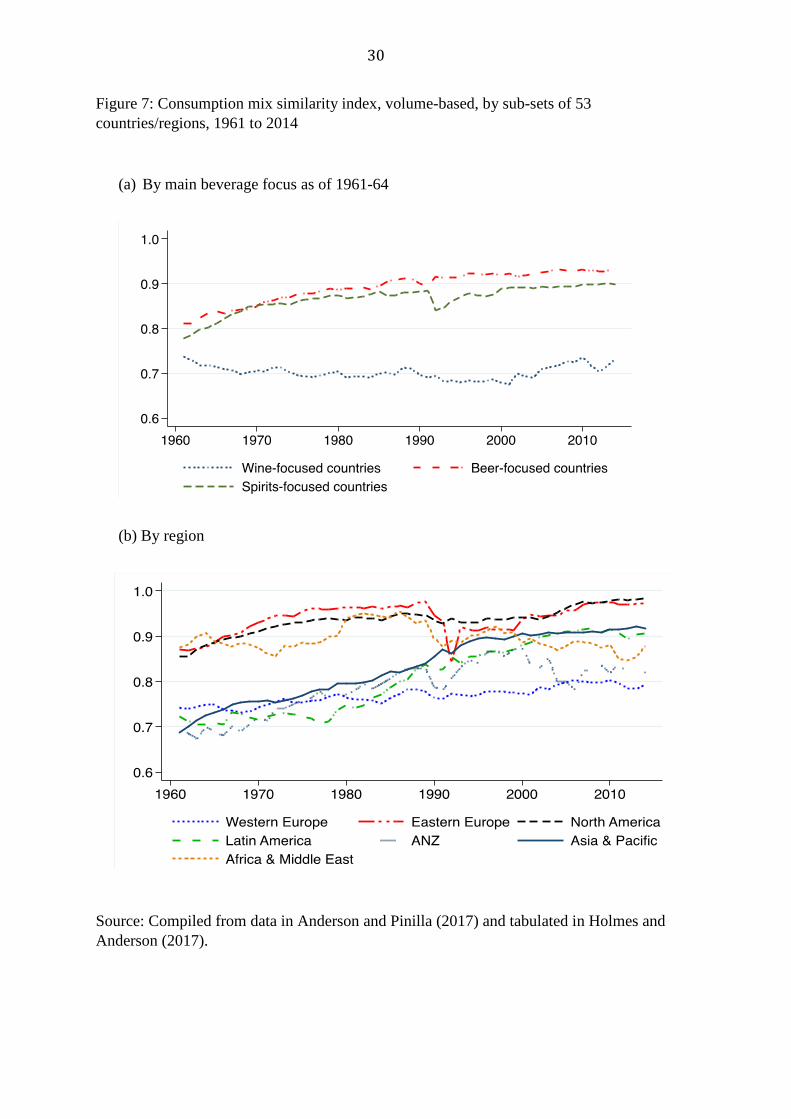
30
Figure 7: Consumption mix similarity index, volume-based, by sub-sets of 53 countries/regions, 1961 to 2014
(a) By main beverage focus as of 1961-64
(b) By region
Source: Compiled from data in Anderson and Pinilla (2017) and tabulated in Holmes and Anderson (2017).
31
Figure 8: Convergence of volume- and value-based similarity mix indexes for all 85 countries/regions 2001 to 2015 (a) Histogram of volume-based similarity mix indexes, 85 countries
(b) Histogram of value-based similarity mix indexes, 85 countries
Source: Compiled from data tabulated in Holmes and Anderson (2017).
32
Figure 9: Relationship between per capita aggregate expenditure and recorded alcohol consumption volume and value, 80 countries,a 2001 to 2015 (one dot per country-year)
(a) Alcohol volume consumed per capita (litres of alcohol)
(b) Alcohol expenditure per capita (US$/year)
a Excluding the 5 residual regions. Expenditures are inflated to 2015 dollars using the US CPI, 2015 = 1.00.
Source: Compiled from data tabulated in Holmes and Anderson (2017).
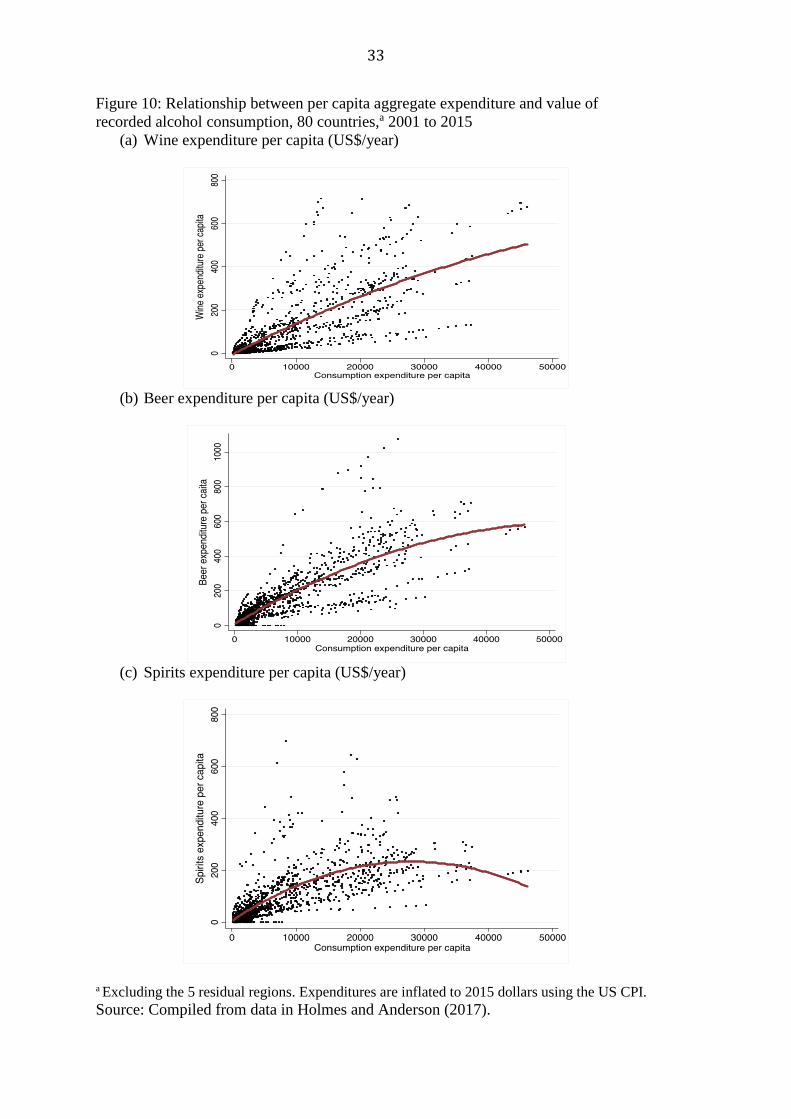
33
Figure 10: Relationship between per capita aggregate expenditure and value of recorded alcohol consumption, 80 countries,a 2001 to 2015
(a) Wine expenditure per capita (US$/year)
(b) Beer expenditure per capita (US$/year)
(c) Spirits expenditure per capita (US$/year)
a Excluding the 5 residual regions. Expenditures are inflated to 2015 dollars using the US CPI. Source: Compiled from data in Holmes and Anderson (2017).
34
Figure 11: Relationship between share of unrecorded alcohol in total alcohol consumption volume and real GDP per capita,a 98 countries, 2000, 2005 and 2010 (one dot per country-year)
a Real GDP per capita are in 1990 International Geary-Khamis dollars from www.ggdc.net/maddison/maddison-project/data.htm The dark line is a quadratic fitted regression line.
Source: Compiled from data in Anderson and Pinilla (2017).
35
Figure 12: Relationships between alcohol consumption volume and real GDP per capita,a recorded and total (recorded plus unrecorded), 98 countries, 2000, 2005 and 2010 (one dot per country-year)
a Real GDP per capita are in 1990 International Geary-Khamis dollars from www.ggdc.net/maddison/maddison-project/data.htm
Source: Compiled from data in Anderson and Pinilla (2017).
36
Figure 13: Relationships between wine’s share of alcohol consumption volume and real GDP per capita, recorded and total (recorded plus unrecorded), 98 countries, 2000, 2005 and 2010 (one dot per country-year)a
a Assumes none of the unrecorded alcohol consumption is grape wine except in Albania, Armenia, Azerbaijan, Bosnia & Herzegovina, Bulgaria, Croatia, Georgia, Hungary, Kazakhstan, Moldova, Romania and Slovenia.
Source: Compiled from data in Anderson and Pinilla (2017).


