WWW.AMERICANPROGRESS.ORG
AP PHO
TO/ED
AND
RIESKI
Common Core State Standards AssessmentsChallenges and Opportunities
By Morgan S. Polikoff April 2014
Common Core State Standards AssessmentsChallenges and Opportunities
By Morgan S. Polikoff April 2014
1 Introduction and summary
4 Standards and assessments in the NCLB era and today
12 Seven challenges facing assessment in the Common Core era
22 Recommendations for assessments in the Common Core era
30 Conclusion
32 Endnotes
Contents
1 Center for American Progress | Common Core State Standards Assessments
Introduction and summary
!e Common Core State Standards, or CCSS, represent a potential reboot for standards-based reform"an opportunity to address some of the design #aws that have diminished the policy’s e$ectiveness in the past. !is new set of standards can replace the various state benchmarks for learning that have dominated K-12 educa-tion policy in the United States for at least two decades. !ese new content stan-dards, which clearly detail the knowledge and skills that all students should possess in mathematics and English language arts, or ELA, are intended to be supported with aligned assessments that reinforce the content messages of the standards and provide evidence of student mastery. When tied with consequential accountability, the CCSS and assessments can lead to improved instruction and, subsequently, improved student learning. !is theory of change is intuitively appealing, and there is evidence of success at achieving intended e$ects on teachers’ instruction1 and student performance, including both test scores2 and longer-range outcomes.3
!e CCSS were created in response to the shortcomings of No Child Le% Behind-era standards and assessments. Among those failings were the poor quality of content standards4 and assessments5 and the variability in content expectations6 and pro&ciency targets7 across states, as well as concerns related to the economic competitiveness of the nation’s future workforce. !e CCSS in mathematics and ELA were developed in 2009 by governors and chief state school o'cers in association with educators and researchers. !e standards that they dra%ed were rapidly adopted in 45 states and the District of Columbia. In addition, two state consortia"the Smarter Balanced Assessment Consortium, or SBAC, and the Partnership for Assessment of Readiness for College and Careers, or PARCC"were created to develop new assessments aligned to the new standards.
In general, there is a good deal of enthusiasm for both the CCSS and the assess-ments forthcoming from the two consortia. Both major teachers’ unions, the National Education Association and the American Federation of Teachers, have endorsed the standards, and polls suggest that teachers are generally optimistic about the potential e$ects of the standards.8 Researchers have released a number of studies that have indicated that the standards are of higher quality than most of the state standards they replaced,9 more coherent from grade to grade than prior
2 Center for American Progress | Common Core State Standards Assessments
standards,10 and capture essential mathematics and ELA content.11 While the PARCC and SBAC tests have not yet been released, both consortia are planning several developments, discussed throughout this report, that would represent improvements over prior state achievement tests.
Despite the keenness for the CCSS and forthcoming tests, there are a number of likely challenges to the new standards and assessment systems. !e purpose of this report is to outline some of these key challenges and o$er suggestions for state and federal policymakers to mitigate them. !e assessment challenges addressed in this paper pertain to the following seven areas:
• Higher proficiency levels. Pro&ciency level cuto$s on the new assessments will be more challenging than those under the No Child Le% Behind Act, or NCLB. !ese higher pro&ciency cuts will result in more students failing than under prior assessments.
• Technology upgrades. !e new assessments emerging from both consortia will require a signi&cant investment in new computer technology. !is will prove costly, especially in an era of ever-tightening district budgets.
• Computer scoring. New constructed-response items and performance tasks will require either human or computer scoring. Computer scoring will require technological advancement, and there are legitimate questions as to whether computer scoring will be able to assess the full quality of student responses to more ambitious tasks.
• Content coverage. New assessments will need do a be(er job sampling from the full domain of the standards"in other words, cover the full range of standards content, rather than predictably focusing on certain objectives and ignoring oth-ers. While the consortia have stated plans to solve this problem, it will be a tall order given the poor quality of prior tests.
• Time investments. !e new assessments may require somewhat more time to take than prior state tests. While the time increase is relatively marginal, when combined with the general growth of assessment time, this may lead to concern regarding overtesting.
• Validating uses for expanded evaluation. Owing to the NCLB waivers, results from the new assessments are to be used for an increasingly wide array of pur-poses, including evaluating educators. !ese new uses will require new validity and reliability evidence.
3 Center for American Progress | Common Core State Standards Assessments
• Rollout coherence. !e new accountability systems developed through the waiv-ers are also being implemented at the same time as the new assessments, and tech-nical issues with the timing of the new assessments may complicate their rollout.
If the standards and assessments are to produce desired improvements in student outcomes, it is essential that policymakers and the developers of the CCSS assess-ments a(end to the above seven challenges. To that end, this report o$ers several recommendations for assessment and accountability systems in the CCSS era. !ese recommendations include:
• Test developers in the consortia must put assessment quality and alignment issues front and center. !is means ensuring the tests capture the full domain of the standards, maintain the cognitive demand level of the standards content, and include a wide variety of high-quality items.
• State and district policymakers promoting new uses for assessment data must provide reliability and validity evidence that supports their intended uses to ensure that appropriate decisions are made based on assessment data.
• To head o$ concerns about likely decreasing pro&ciency rates, actors at multiple levels"including state and district policymakers, researchers, educators, and test developers"must be proactive in explaining the new pro&ciency standards and why they ma(er.
• !e federal government, states, and districts must create and implement more thoughtful teacher- and school-accountability systems that minimize the perva-sive negative incentives seen under NCLB.
• !e federal government must encourage assessment quality in several areas, including giving the consortia the freedom to measure pro&ciency outside of grade level and re&ning the peer-review guidance used to evaluate assessments.
In short, the proposed recommendations include both political and technical activities on the part of test developers, state and district policymakers and lead-ers, federal policymakers, and CCSS assessment consortia members. If met, these recommendations can help quell many of the concerns about the CCSS, new assessments, and school- and teacher-accountability systems.
4 Center for American Progress | Common Core State Standards Assessments
Standards and assessments in the NCLB era and today
The No Child Left Behind era
To get a be(er sense of how the Common Core State Standards and assessments &t into the landscape of state and federal education policy, it is important to look at the evolution of standards from No Child Le% Behind to the present. Under NCLB, states were required to create grade-speci&c content standards in mathematics and English language arts to assess student mastery of these standards using aligned assessments and to use the results to hold schools accountable for student performance. Bowing to states’ historical control over education policies, the law le% important decisions about the content of state standards, the content and form of student-achievement tests, and the rigor of state pro&ciency thresholds up to states.
Research showed that the discretion granted to states resulted in substantial variation in state implementation of NCLB along these dimensions. In terms of the content of standards and assessments, several studies showed sizable between-state variations in content expectations in state standards and assessments,12 such that students from di$erent states were expected to learn vastly di$erent content in core subjects. Analyses rating the quality of state standards showed similar variation, with some states’ standards rating as coherent and academically rigorous while “most [lacked] the content and clarity needed to provide a solid foundation for e$ective curriculum, assessment, and instruction.”13 State assessments in the NCLB era were only moderately aligned with their corresponding state stan-dards,14 sending con#icting messages to teachers about what to teach and limiting the quality of achievement data available to inform instruction.15 Finally, analyses of state pro&ciency thresholds revealed that states established highly divergent de&nitions of the term “pro&cient,” such that a student labeled pro&cient in one state might be below basic in another.16 !ese were just a few of the ways that state policies responding to NCLB mandates were highly variable.17
5 Center for American Progress | Common Core State Standards Assessments
Responding to these issues and seizing upon a brief policy window that opened when research demonstrated the substantial di$erences in standards for student learning,18 state policymakers and educational experts came together in 2009 to create the CCSS. Later, two consortia of states, the Partnership for Assessment of Readiness for College and Careers and the Smarter Balanced Assessment Consortium, were awarded grants from the U.S. Department of Education19 to create aligned assessments to measure student mastery of the CCSS. !e CCSS and the consortia were designed to address each of the above issues by standard-izing content expectations across states, raising the quality of state tests, and increasing and leveling the rigor of state pro&ciency cuts. !e standards were also intended to address more fundamental concerns, such as issues related to interna-tional economic competitiveness and high college remediation rates.
!e adoption of the CCSS was subsequently encouraged by the Obama admin-istration through the Race to the Top program, or R). In addition, many states agreed to overhaul their standards, assessments, and accountability systems in order to take advantage of new #exibility from certain NCLB requirements that the Department of Education began o$ering states in 2012. As of December 2013, 43 states and the District of Columbia have received these #exibility waivers.20
!e adoption and ongoing implementation of the CCSS is a remarkable achieve-ment in the history of K-12 education policy in U.S. schools, especially given the repeated failures of earlier common standards e$orts21 and the historical degree of state and local control over educational decisions. At the same time, the e$ort is increasingly fragile due to resistance from both the political le% and the right. While standards advocates have sometimes made breathless claims about the promise of the standards for improving K-12 education, most understand that the standards will only have positive e$ects on student learning if they are implemented thought-fully and allowed to develop over time. Decades of educational research show that standards are not self-implementing"quite the contrary, as they require coherent, well-designed supporting materials and interventions to help educators understand how the standards are encouraging them to change their instructional practices.22
6 Center for American Progress | Common Core State Standards Assessments
The promise of Common Core
!ere are a number of ways in which the Common Core State Standards are an important development and likely an improvement over what came before. Perhaps most fundamentally, the CCSS are viewed by most who have studied them as se(ing appropriately high standards for student learning. For instance, content-area experts in mathematics concluded their analysis of the standards by noting:
Our overall assessment of the [Common Core for mathematics] is largely favor-able. In many respects, the [Common Core for mathematics] developers have set a new standard for the development of content standards. We appreciate that they have not taken an unduly narrow view of evidence but have instead displayed common sense by drawing on investigations of learning progressions that have been conducted using a number of di!erent methodologies.23
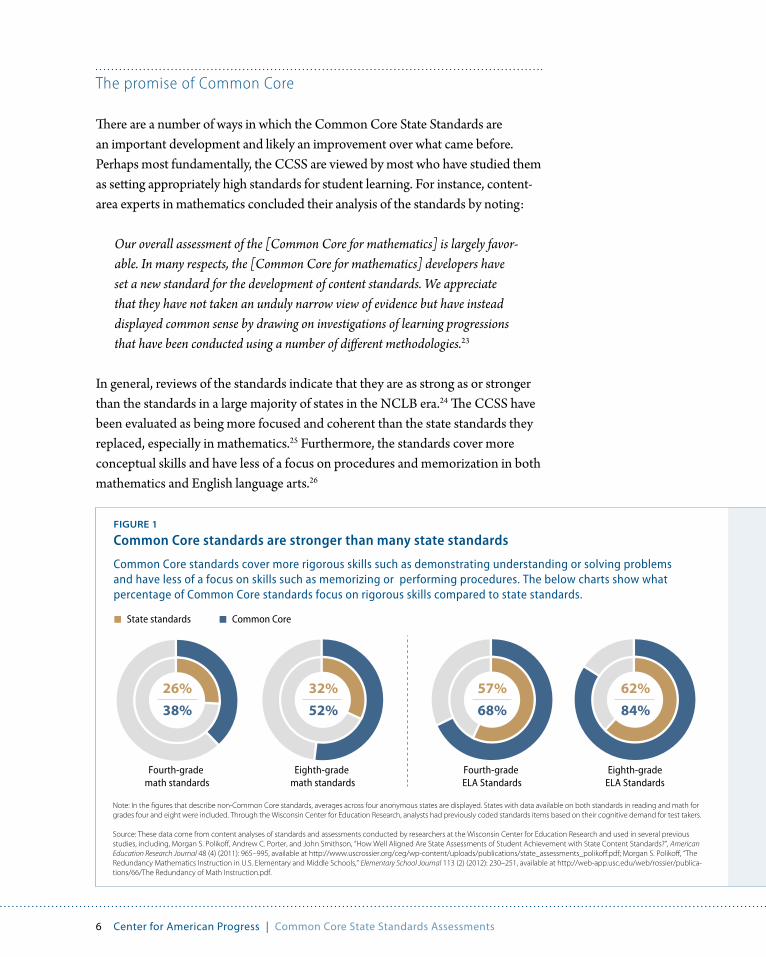
In general, reviews of the standards indicate that they are as strong as or stronger than the standards in a large majority of states in the NCLB era.24 !e CCSS have been evaluated as being more focused and coherent than the state standards they replaced, especially in mathematics.25 Furthermore, the standards cover more conceptual skills and have less of a focus on procedures and memorization in both mathematics and English language arts.26
FIGURE 1
Common Core standards are stronger than many state standards
Common Core standards cover more rigorous skills such as demonstrating understanding or solving problems and have less of a focus on skills such as memorizing or performing procedures. The below charts show what percentage of Common Core standards focus on rigorous skills compared to state standards.
State standards
Fourth-grade math standards
Eighth-grade math standards
Fourth-grade ELA Standards
Eighth-gradeELA Standards
Common Core
Note: In the !gures that describe non-Common Core standards, averages across four anonymous states are displayed. States with data available on both standards in reading and math for grades four and eight were included. Through the Wisconsin Center for Education Research, analysts had previously coded standards items based on their cognitive demand for test takers.
Source: These data come from content analyses of standards and assessments conducted by researchers at the Wisconsin Center for Education Research and used in several previous studies, including, Morgan S. Poliko", Andrew C. Porter, and John Smithson, “How Well Aligned Are State Assessments of Student Achievement with State Content Standards?”, American Education Research Journal 48 (4) (2011): 965–995, available at http://www.uscrossier.org/ceg/wp-content/uploads/publications/state_assessments_poliko".pdf; Morgan S. Poliko", “The Redundancy Mathematics Instruction in U.S. Elementary and Middle Schools,” Elementary School Journal 113 (2) (2012): 230–251, available at http://web-app.usc.edu/web/rossier/publica-tions/66/The Redundancy of Math Instruction.pdf.
57%68%
62%84%
32%52%
26%38%
7 Center for American Progress | Common Core State Standards Assessments
!e standards are also important because they have the opportunity to leverage economies of scale in curriculum materials, assessments, professional develop-ment, and other areas. !is is already taking place in the area of assessments: !e groups working on designing assessments will likely be able to deliver higher-quality, more-sophisticated assessments at a much lower cost than would be possible if states were going it alone.27 In terms of curriculum materials, a common complaint under NCLB standards was that curriculum developers were o%en beholden to the most populous states and that other states were given short shri% when it came to the content and quality of these materi-als.28 !e CCSS, in principle, allow for one text to apply across a much broader market"se(ing aside the 15 percent of content each state was allowed to add to the standards"potentially se(ing the stage for greater coherence of materials. Even online materials, which teachers increasingly use for the purposes of lesson planning, may bene&t from these economies of scale. Lesson-sharing websites such as Be(erLesson are increasingly focused on Common Core alignment. In January 2014, the National Education Association partnered with Be(erLesson to create a new website where master teachers can share Common Core-based lessons online.29 If there is a greater ability to evaluate the e'cacy of the materi-als against the Common Core, these economies of scale could help improve the quality of curriculum materials.
A third way the standards are an important development is in reducing the arbitrary, across-state di$erences in opportunity that plagued prior standards and assessment systems, which has several bene&ts. For one, it makes cross-state comparisons of performance clearer and starker"as evidenced by the fact that comparisons using the National Assessment of Educational Progress, or NAEP, are more meaningful than comparisons made using pro&ciency rates on state tests. For another, it reduces the costs associated with moving across states for both students and teachers; this may be especially important given the negative e$ects of transition on student performance.30 Finally, in an increasingly global economy, reducing arbitrary, across-state di$erences may help put students from historically lower-performing states on a be(er path toward national and interna-tional competitiveness.
8 Center for American Progress | Common Core State Standards Assessments
Of course, support of the standards is not universal. Some of the objections to the standards are mainly political"for instance, there is stated concern from both the political le% and the right about the proper role of the federal gov-ernment in standards-based reform. !e adoption incentives that the Obama administration o$ered through R) undoubtedly exacerbated these concerns.31 Other objections are based on the substance of the standards. For instance, some have objected to the perceived diminished role of &ction in the ELA standards, as the standards call for a substantial proportion of reading materials by the time students reach high school to be informational text.32 Others have expressed concern about the decision not to require algebra for all eighth graders in the standards"though the stan-dards do not forbid eighth-grade algebra.33 Some of these concerns may be allayed as the CCSS are implemented. However, the purpose of this paper is not to respond to substantive concerns about the standards. Given the reasons for potential optimism regarding the standards, as well as the popular support for them"particularly among those who know the most about the standards, teach-ers"implementation is the next critical step for the CCSS. !us, the remainder of this report turns &rst to a descrip-tion of how the assessments linked to the CCSS are being designed through unique groups of state organizations and then to strategies and policies to improve the imple-mentation of the standards and the assessments.
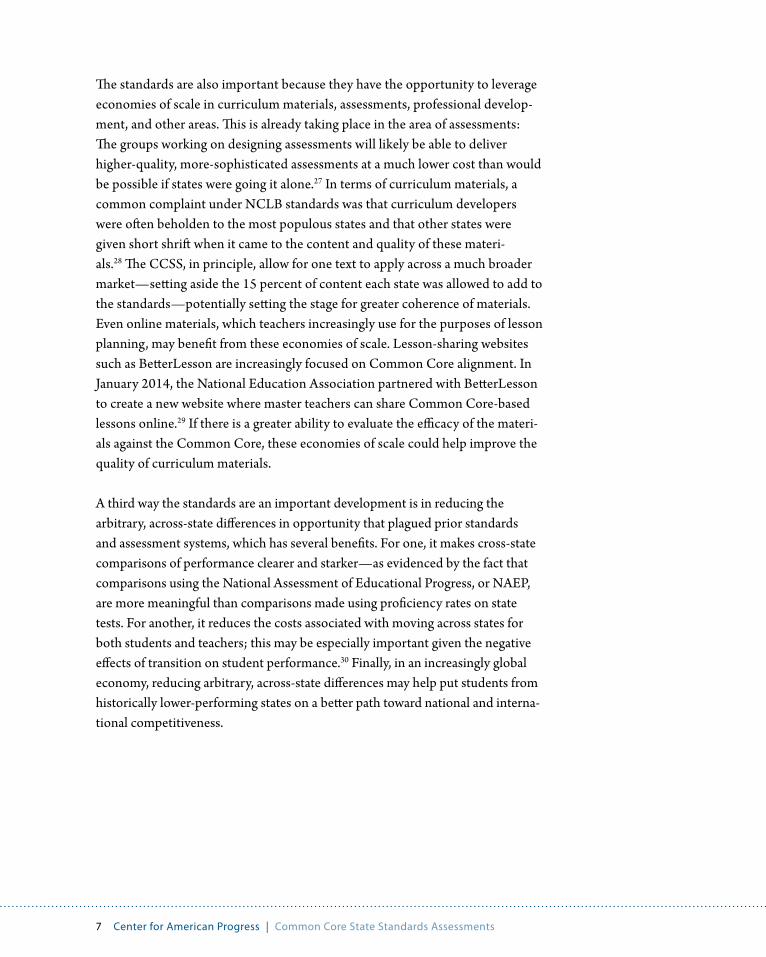
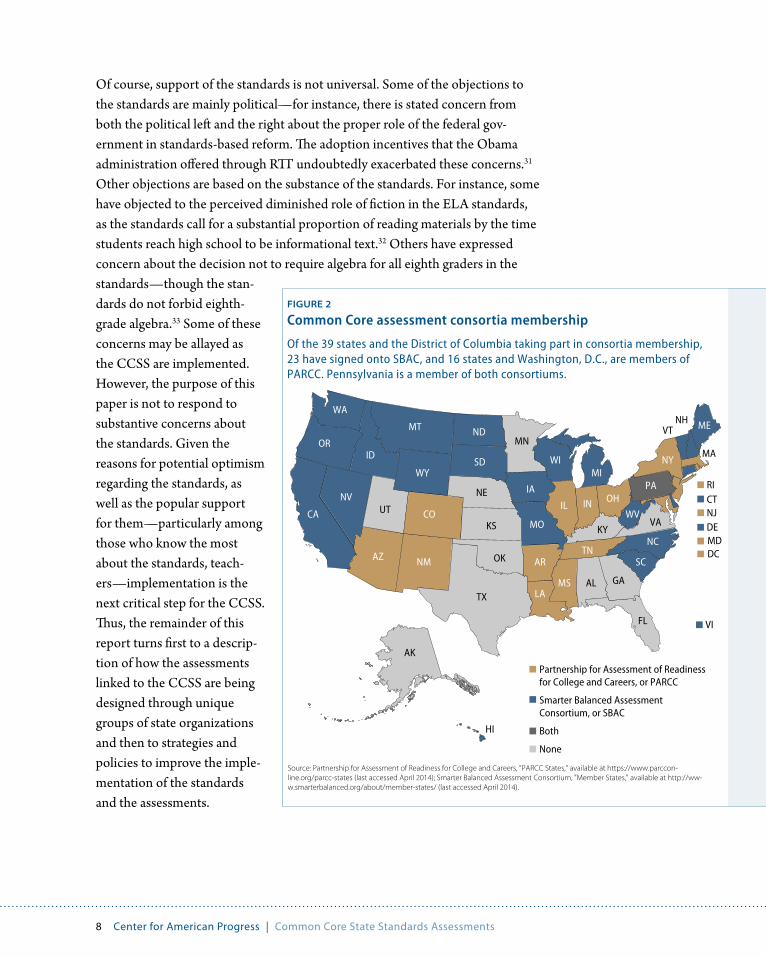
FIGURE 2
Common Core assessment consortia membership
Of the 39 states and the District of Columbia taking part in consortia membership, 23 have signed onto SBAC, and 16 states and Washington, D.C., are members of PARCC. Pennsylvania is a member of both consortiums.
Source: Partnership for Assessment of Readiness for College and Careers, "PARCC States," available at https://www.parccon-line.org/parcc-states (last accessed April 2014); Smarter Balanced Assessment Consortium, "Member States," available at http://ww-w.smarterbalanced.org/about/member-states/ (last accessed April 2014).
WA
MT ND
SDWY
IDOR
NV
CA
AZ NM
COUT
IA
MI
MOWV
ME
NC
SC
PA
LA
AR
IL IN OH
NY
TN
MS
MN
NE
KS
OK
TX
AK
AL GA
FL
KYVA
WI
NHVT
MA
RICT
DEMDDC
NJ
HI
VI
Partnership for Assessment of Readiness for College and Careers, or PARCC
Smarter Balanced Assessment Consortium, or SBAC
Both
None
9 Center for American Progress | Common Core State Standards Assessments
One of the key lessons of two decades of standards-based reform is that assessment quality ma(ers. It is among the most important drivers of standards implementa-tion. Indeed, this is one of the core principles of standards-based reform"that coherence of standards and assessments is essential to reinforce the content messages of standards.34 !e importance of coherence is borne out in empirical research that shows stronger instructional responses in states with more-coherent policy systems.35 Unfortunately, NCLB-era tests had numerous and severe short-comings that undermined the standards. Consider, for example, that despite federal requirements to the contrary, state tests were o%en poorly or modestly aligned to the standards. !is misalignment manifested itself in several ways:
• Tests routinely failed to reach the higher levels of cognitive demand called for in the standards.
• !e state tests sampled content predictably from the standards.• !ey le% vast swaths of that content untested or undertested.36
Tests in the NCLB era o%en relied almost exclusively on multiple-choice items; while this is not always a concern, there is evidence that when tests contain a single type of problem, teachers narrow test-preparation activities in response.37 Since the tests were pegged to the pro&ciency cut scores, they o%en su$ered from #oor and ceiling e$ects, which meant they were less e$ective at measuring student achieve-ment at the top and bo(om of the achievement distributions.38 Together, these and other design #aws of NCLB-era assessments limited their utility for accurately mea-suring performance across the spectrum of student-ability levels and contributed to the law’s unintended consequences and modest positive e$ects.
To improve on NCLB-era assessments and build new tests to capture the full range of the CCSS, the Department of Education invested $330 million from the American Recovery and Reinvestment Act to fund two assessment consortia"SBAC and PARCC.39 Clearly, the Obama administration had a goal of reducing the number of di$erent tests used to measure student pro&ciency nationwide. However, it funded two consortia rather than one, hoping to ensure competition, protect against the possibility of one consortium failing, and combat concerns about mandating a single system.40 On the one hand, it might be preferable if there were one common assessment across all states to ensure common de&nitions of pro&ciency nationwide. But on the other hand, the politics of ge(ing all states in one consortium may not be worth the small bene&t that could be realized from
10 Center for American Progress | Common Core State Standards Assessments
moving from two pro&ciency de&nitions to one"especially given that both of the consortia are planning to peg their cuts near the NAEP cut scores. Furthermore, there may be some usefulness in seeing how the two consortia play out over time. Regardless, there is no question that the two consortia are a dramatic step in the right direction to improve “commonness.”
Recognizing the problems with NCLB-era assessments and understanding the importance of ge(ing Common Core tests right, the Council of Chief State School O'cers, or CCSSO, recently released a document outlining important principles for the quality of CCSS assessments.41 !ese principles reiterate some of the key lessons learned in the NCLB era. !e principles include:
• Requiring a range of cognitive demand• Emphasizing writing, research, and inquiry skills• Connecting mathematical skills to practices• Focusing on student progress to readiness• Providing timely data that inform instruction• Ensuring appropriate accommodations for students with
disabilities and English language learners
Each of these principles is a direct response to the challenges of earlier assess-ments, and meeting them all will certainly be a tall order. SBAC and PARCC have plans in place to address some of these principles, as indicated on their websites and in the assessment plans they have released, which are explained more fully in the text box. !e testing consortia have laid out ambitious agendas that, if met, would dramatically raise the quality of assessments used to measure student pro&-ciency over what was typical in the NCLB era.

11 Center for American Progress | Common Core State Standards Assessments
One of the defining features of SBAC is that its tests will be computer adaptive. That is, as the student completes the examination, the di!culty of the items he or she takes will be based on how he or she has performed up to that point. Computer-adaptive tests allow for much more precise estimates of student performance, reducing the possibility of floor and ceiling e"ects.42 Computer-adaptive tests can also be shorter—they require fewer items to reach the same level of accuracy as fixed-form tests in classifying students’ perfor-mance. During the first few years of test rollout, SBAC plans to o"er paper-and-pencil tests—which obviously cannot be adaptive—as needed. Another key feature of SBAC tests is their planned use of technology-enhanced items and performance tasks that will expand the item types to which students are typically exposed. In addition, SBAC plans to create item banks to be used optionally by districts or schools for making interim assessments. The SBAC tests will have four performance levels—thorough, adequate, partial, and minimal. SBAC’s model is seen as very decentralized; the consortium is de-veloping items, but the states are in charge of test delivery, scoring, and reporting, with the caveat that the participating states must use consistent definitions of proficiency.43
For PARCC, the assessments will be computerized, fixed-form tests. Unlike the SBAC tests, they will not be computer adaptive. The PARCC tests will also include a range of item types, and the consortium states that it seeks to measure the full range of the standards—in-cluding di!cult-to-measure standards—and students at all achieve-ment levels. Furthermore, PARCC is creating optional diagnostics at the start of the year and interim assessments at the midpoint of the year that will be able to be used to measure student progress during the school year in localities that choose to use them. In addition, PARCC is building optional formative performance tasks for grades K-12, along with mandatory nonsummative speaking and listening assessments for third through eighth grade. The PARCC tests will have five performance levels—distinguished, strong, moderate, partial, and minimal. Just as states following the SBAC model must report their scores on the SBAC scale, states following the PARCC model will be required to report their scores on the common PARCC scale, though they will not be required to use the same scores for policy decisions. The PARCC model is much more centralized than the SBAC model—the consortium or its vendors are providing all test-related services, including administration and scoring.44
12 Center for American Progress | Common Core State Standards Assessments
Seven challenges facing assessment in the Common Core era
Test developers and assessment policymakers have an increasingly daunting task in the era of the Common Core State Standards. While the standards themselves remain the backbone of the K-12 policy system, assessments are clearly an integral component a$ecting the implementation of standards in the classroom. Given the wide array of uses for test scores"measuring student progress and pro&ciency, measuring school performance, and informing low- and high-stakes decisions about individual teachers"test quality is paramount. !is section lays out seven challenges facing assessment developers and policymakers in the coming years. !is is not intended to be an exhaustive list, but rather one that includes some of the most salient issues. If CCSS tests are to support the standards and help them achieve their desired outcomes, these issues will need to be addressed.
1. The proficiency challenge: Cut scores and proficiency rates
Under NCLB, states established their own pro&ciency cut scores on their state assessments. Not surprisingly, given the incentives of the law"with low-per-forming schools being sanctioned and potentially subject to restructuring a%er continued poor performance"some states chose to set woefully low cut scores.45 In contrast, other states set more ambitious cut scores. In practice, the rigor of the cut score was not strongly related to the number of schools that failed under NCLB,46 mainly because schools’ pro&ciency targets"the proportion of students needing to be pro&cient for a school to meet its target"were based on the initial percentage of students pro&cient in the 2002-03 school year. Nor is there good evidence that states that set more ambitious pro&ciency cuts saw greater achieve-ment gains in the NCLB era.47 Nevertheless, the variability in state cut scores alarmed researchers and policymakers, who argued that vast di$erences in the de&nitions of pro&ciency sent con#icting messages to parents and others about school and student performance. Furthermore, low overall cut scores, resulting in large numbers of students being labeled pro&cient, are inconsistent with the sub-stantial proportions of students who need remedial coursework upon enrollment in college.48 !us, raising and leveling expectations for pro&ciency was an explicit focus of the CCSS and related assessment consortia.
13 Center for American Progress | Common Core State Standards Assessments
!e idea of raising pro&ciency standards is an admirable one, as it makes li(le sense to declare large swaths of the student population pro&cient throughout K-12 and then send them to remedial education when they enroll in college. However, the practice of raising pro&ciency standards is likely to be fraught with political di'cul-ties, considering that the two consortia have not yet established their cut scores. One di'culty is the political challenge of ge(ing states to agree on cut scores that will necessarily make some states look be(er than others. Will Massachuse(s and New Mexico"both PARCC states"agree on pro&ciency cuts given that Massachuse(s has nearly twice as many students pro&cient in fourth-grade math-ematics on the National Assessment of Educational Progress? Or will states with lower-performing students revolt once the new pro&ciency levels are established? Doing so, and returning to the highly variable state-chosen de&nitions of pro&-ciency, would water down the consistency that the CCSS was intended to bring.
Another di'culty will be in ge(ing states to stay the course even when pro&ciency rates fall dramatically. In states that have adopted CCSS-aligned assessments early, such as New York, Kentucky, and North Carolina, pro&ciency rates have typically fallen 30 percent or more.49 !ese results can create political challenges if parents and legislators are not prepared for the results. !is may be especially the case if the new, higher pro&ciency cuts are used to make decisions about individual students.
To reduce surprise and anxiety, states will need to make clear well in advance why the new tests and standards are important and what purpose they serve. !e stron-gest arguments will likely focus on economic competitiveness and preparation for success in college, but each state may have its own arguments as to why the raised cut scores are necessary. Regardless, even with a well-orchestrated public relations campaign prior to the test scores’ release, there will likely be considerable push-back around the proportion of students labeled as not meeting standards. It will take political courage on the part of state policymakers to withstand the pressure to water down standards.
2. The technology challenge: Costs and upkeep
!e move to computerized testing o$ers many opportunities for improving assessment, some of which have already been discussed. But these new tests will not be free, and some policymakers and educators have expressed concern about the costs of implementing the new assessments. Indeed, some states withdraw-ing from PARCC have indicated testing costs as part of their rationale, though analyses of testing-cost data suggest leaving the consortia will result in li(le
14 Center for American Progress | Common Core State Standards Assessments
savings.50 One of the primary costs will be for the purchase of the computers to take the tests. !e two consortia have established instructional-technology-purchasing guidelines that lay out the hardware and infrastructure requirements for administering the new assessments.51 !ese guidelines include features such as screen resolution and size, internal memory, and bandwidth. In surveys of school districts, most responding districts met the consortia’s requirements, but certainly some districts will have to upgrade the number of their machines, the so%ware on those machines, the speed of the Internet, or a combination of these requirements.
Estimating the costs associated with the move to new computer-based assess-ments is perhaps more art than science. One type of expense is the one-time technology costs associated with purchasing hardware and upgrading technology to allow students to participate in computer-based assessments.
In addition to the one-time technology costs, there are the simple costs of taking the yearly assessments. Two recent reports from the Brookings Institution lay out these costs.52 !e reports estimate that prior state tests cost an average of $27 per pupil, ranging from less than $10 in New York to more than $100 in the District of Columbia per pupil. By way of contrast, the cost to administer the assessments is predicted to be between $23 to $30 per pupil in the new consortia, depending on the consortium"and more if states begin to drop out of the consortia, but not very much more. Because the assessments will be common to many states, &xed costs will be shared to some extent, and the savings from the economy of scale will be considerable. Other ongoing assessment-related costs include training, technology replacement and maintenance, and the costs of using and maintaining bandwidth.
Overall, the average costs between the old and new tests are fairly similar. But for about the same cost, states will have higher-quality assessments. And in and of themselves, even the high estimates of these costs from noted CCSS opponents are not especially high.53 For instance, given that the K-12 student population includes approximately 50 million students, the ongoing technology costs amount to approximately $12.50 per student per year. Given that states spend an average of $11,000 per pupil per year, $12.50 for technology represents a small fraction of 1 percent of total expenditures.54 Furthermore, the technology can certainly be used for instructional purposes as well, and smart districts will purchase technol-ogy that can be used outside of the testing window. It would be prudent for states and districts to not foolishly skimp on technology spending to save a few dollars.
15 Center for American Progress | Common Core State Standards Assessments
3. The scoring challenge: Grading nonmultiple-choice items
Both of the major assessment consortia have plans to include a meaningful propor-tion of nonmultiple-choice items in their summative examinations. Both consortia have plans to include open-ended performance tasks in both mathematics and English language arts, with PARCC planning on these items being assessed earlier in the spring and SBAC planning to assess them during the regular year-end test.55 !e consortia also have plans to use other constructed-response items that require students to give numerical or text responses but that are not as long as perfor-mance tasks. Finally, the consortia plan to include technology-enhanced items that allow for the assessment of skills not easily measured with multiple-choice tests. As an example of a performance-task type, PARCC plans for the ELA assessment to include having students read multiple texts and analyze arguments in an essay format. An analysis by UCLA researchers highlights that the planned performance task and constructed-response items will be essential to ensure that the new tests meet the higher levels of cognitive demand called for by the standards.56
With new item types come new challenges. Scoring is foremost among these challenges for the open-response items being included in the new assessments. Scoring can either be done by humans or by using automated computer scoring. Researchers analyzing these plans have expressed skepticism that automated scor-ing can be done for the stated costs of the tests.57 If automated scoring cannot be done for the given cost, this means that human scoring will be required. !is will likely add substantially to the tests’ costs and demands for human capital for scor-ing. Moreover, human scoring will also take much longer than automated scoring, undermining the promises of the consortia to inform instruction rapidly.
!e two types of scoring have obvious advantages and disadvantages. For rela-tively simple types of constrained responses that are typical in mathematics tasks"for example, numbers, equations, and certain kinds of graphs and con-structions"automated scoring is su'ciently advanced that human checkers are not needed. For essays, computer scoring is generally capable of scoring for grammar, usage, mechanics, spelling, and vocabulary, as well as some aspects of organization and responsiveness to the essay prompts. In contrast, computer-ized scoring may not be able to capture essay elements such as creativity, irony, or more artistic uses of writing. Furthermore, for constructed-response items calling for textual analysis, a key challenge is in developing a set of acceptable responses for the computer to use in grading. In terms of reliability, computer scoring can achieve levels of agreement comparable to the agreement among human scorers.58
16 Center for American Progress | Common Core State Standards Assessments
Computerized scoring experts have created guidelines for the consortia to use in building their planned automated scoring systems, and these guidelines should prove useful as the technology in this area develops.
!ere is no doubt that the consortia’s decisions to rely more on constructed-response items are motivated by concerns about the low quality of multiple-choice-only assessments used by many states under NCLB and the perceived negative e$ects of these item types on assessment quality and on teachers’ instruction. Research for more than two decades has demonstrated that the nature of assessment items can shape teachers’ instructional responses for be(er or for worse.59 And there is good reason to suspect that the reliance on multiple-choice items contributed to NCLB tests’ inability to meet the cognitive-demand levels called for in state standards. !us, the consortia should be applauded for expand-ing the assessed curriculum to include more than the skills that can be captured using multiple-choice questions.
4. The coverage challenge: Constructing item banks to measure the standards
!e principle of assessment in a standards-based policy system is that assessments will reinforce the content messages of the standards, sending teachers consistent messages about what to teach"the standards"and providing valid inferences about student mastery of those standards. Unfortunately, research suggests that NCLB-era assessments rarely lived up to this relatively fundamental goal. For instance, one study showed that NCLB-era assessments in ELA, mathematics, and science le% vast swaths of standards content untested. !is was particularly true on state ELA tests, where 50 percent or more of standards content"usually in areas of speaking, writing, and grammar and spelling"were not included on state assessments.60 Studies have illustrated how state tests predictably sampled content from the same areas of the standards across years.61 !us, educators who pay even scant a(ention know in advance that some skills are more likely to be tested and focus on teaching those skills. !is undermines the content messages of the stan-dards, and it also likely contributes to test-score in#ation.
An improved, CCSS-aligned assessment need not include every piece of stan-dards content on every student test. Rather, the goal for a new assessment system would be that it samples content from year to year so that the questions on the assessments perfectly mirror the content in the standards over time. !is ideal
17 Center for American Progress | Common Core State Standards Assessments
system would have the additional bene&t of reducing the likelihood of test-score in#ation by diminishing the ability of educators to predict the content to be tested. !e only rational teaching response to an assessment system such as this would be to focus on the content in the standards, which is exactly what is intended in standards-based reform policy.
!ere are several likely explanations for why state tests in the NCLB era were constructed in ways that led to these problems, and overcoming these issues may prove challenging for the consortia. For one, using similar test questions from similar content areas surely drives down item development costs, which are substantial contributors to total testing costs. For another, psychometricians are o%en understandably focused on addressing statistical issues, such as item or test bias, and parallel forms when constructing assessments. !us, alignment is gener-ally treated as an a%erthought"only a%er the test is constructed do we verify its alignment to the target.62 A third explanation is that some objectives in the stan-dards may simply be too di'cult to assess using traditional assessment formats.63 Whatever the reasons, the result has been that test item banks do not fully capture the content in the standards and tests have been only modestly aligned to the standards. Simply moving to computerized testing will not solve the problem"the consortia will have to work to ensure adequate domain coverage in their item banks and across test forms.
5. The time challenge: Measuring what matters without undue burden
In the past year, a number of critics have begun to condemn the possibility of increased testing of students in K-12 schools. !is backlash primarily comes from those who see testing as intertwined with punitive accountability policies that have moved from the school level to the teacher level. !e movement is manifested in the rise of organizations such as Diane Ravitch’s Network for Public Education.64 !ese organizations point to the amount of testing time associated with the new CCSS assessments as evidence of a test-obsessed education policy system that undermines teaching and learning. !e total testing time currently planned for summative assessments by SBAC is seven hours to eight-and-a-half hours, depend-ing on the grade"with earlier grades spending less total time. For PARCC, the total time ranges from 8 to 10 hours depending on the grade. Under NCLB, state testing times generally ranged from four to eight hours or more, so it appears likely that time spent on state-mandated, summative assessments will increase in some places in the CCSS era. However, 10 hours of state-mandated, summative assess-ment represents less than 1 percent of the 1,200 or so hours in a typical school year.
18 Center for American Progress | Common Core State Standards Assessments
Of course, state-mandated, summative assessments are just one part of the total testing time spent in K-12 schools. Some districts or schools choose to also use other types of assessments to measure readiness or gauge student progress during the school year"such as the Measures of Academic Progress tests or the Dynamic Indicators of Basic Early Literacy Skills, or DIBELS"and these locally selected tests add noticeably to testing time. Furthermore, the two consortia are developing optional interim benchmark assessments that are intended to gauge student progress toward pro&ciency throughout the school year, which districts and schools should consider using in place of some of the district-level assessments they currently use. !ere is some evidence that these sort of state- and/or district-selected interim tests can improve student performance.65 !oughtful benchmark assessments can be used to help teachers identify student misunderstandings and target instruction. However, they require additional testing time and are probably only useful insofar as they are well aligned with the summative assessments at the end of the year.
In some sense, states are in a predicament on the problem of testing time. Some educators have complained that the number of hours spent testing and preparing for tests is excessive and undermines instructional time. But the boost in test qual-ity from the more robust and sophisticated item types to measure higher-order thinking may come in exchange for additional testing time.
Another complaint about NCLB-era tests was that they pushed educators to nar-row the curriculum to focus almost exclusively on mathematics and ELA"the two subjects tested. Yet some critics are quite unhappy with proposals to expand testing to other subject areas, which would relieve the pressure to narrow the cur-riculum but would increase the amount of testing.
Given that parents and voters continue to see testing as an important measure providing accountability for school performance,66 it is unlikely testing time or the scope of testing will decrease substantially in the near future. On the other hand, the consortia and state policymakers should be cognizant of growing concern over the amount of time spent testing and work to ensure that this time is well spent. School districts also have a role to play here: !ey should gauge the quantity and quality of their current testing e$orts and verify that all tests are truly necessary, reducing or removing tests where possible.
19 Center for American Progress | Common Core State Standards Assessments
6. The validation challenge: Validating assessments for new uses
State assessments of student achievement used in the NCLB era were primarily constructed and validated for one use"to measure student pro&ciency against a set of content standards. For this use, the validity evidence is relatively strong, with the possible exception of the extent to which a test adequately covers the content in the standards. State tests were also used in the NCLB era to make judg-ments about the performance of schools as measured by aggregate pro&ciency rates. Here, the validity evidence is weaker, given that 70 percent to 90 percent of the variation in student-achievement levels lies within schools.67
Under the recently approved state waivers to NCLB, state tests are being used for an increasingly wide array of decisions, some of which have to do with teachers. !ese include both high-stakes actions, such as informing the evaluation of teach-ers for tenure or other purposes, and low-stakes actions, such as making decisions about professional development. !e new assessments have not been speci&cally designed for either of these uses, though they"along with other information"will be used for these purposes.
!e use of student-assessment data for these policy purposes has caused some scholars concern. For instance, some researchers have questioned whether it is wise to utilize a single assessment to a(empt to achieve the multiple, diverse goals of evaluating students, teachers, and schools"as opposed to, for example, a system of assessments that each have di$erent purposes.68 Furthermore, some have ques-tioned the sensitivity of state assessments to instructional content and quality, call-ing into question their validity for discerning e$ective from ine$ective teaching.69
On the other hand, research is quite clear that teachers are the most important within-school factor a$ecting student learning70 and that teacher e$ects are long lasting and a$ect key student outcomes, such as future earnings.71 !us, there is an intuitive appeal to using student-achievement outcomes as a gauge of teacher e$ectiveness"to motivate and inform instructional-improvement e$orts. !at appeal is particularly potent given that a central goal of schooling for students is learning, and assessments that measure learning seem like an obvious tool for accountability. Recent recommendations from high-pro&le research have encour-aged the use of assessment data for just this purpose, &nding that performance-based measures are predictive of future student outcomes.72
20 Center for American Progress | Common Core State Standards Assessments
Regardless of one’s views on the merits of using student-achievement results to evaluate teachers, it is clear that such a policy raises the bar in terms of the demands for test quality. !us, there remains a substantial amount of work to be done in terms of validating the new assessments for all their new intended uses. !is is largely why the Department of Education has provided states with the #ex-ibility to delay the use of teacher-evaluation results to inform personnel decisions such as tenure until the 2016-17 school year.73 A dozen states have requested this #exibility, and six states have already been approved.74
7. The rollout coherence challenge: Integrating new assessments with accountability systems
!e seventh and &nal challenge is implementing new assessments when many other policies are changing simultaneously. R) and NCLB waivers have pushed states to adopt substantial policy reforms, most notably the complete redesign of school accountability and the creation of new multiple-measure teacher-evalua-tion systems. Without debating the merits of these policies, a transition to new assessments could con#ict with some of these other ongoing policy changes.
One obstacle to integrating new assessments into accountability systems is in the calculation of school- and teacher-level growth scores on changing assessments. California recently backed o$ its plan to administer ELA and mathematics tests to only a subset of students, which would have made the calculation of growth measures impossible. Most states are planning to continue administering old assessments during the new test rollout, administering new assessments statewide anywhere between the 2012-13 and 2015-16 school years.
States that take this approach will have achievement data from old tests on which to base growth calculations, but how they will do so with data from the new assessments is not altogether straightforward. To be sure, many states are using growth measures that simply use students’ relative ranks in each year to determine growth in a subsequent year;75 these growth measures can be applied with old tests and new tests. But calculating growth scores this way requires the assumption that tests are tests; that is to say, the content and format of the test is irrelevant to the relative performance of students on that test, which is likely not true.76 Se(ing aside the issue of whether this is a sound assumption to make, there is the issue of how to explain growth scores to educators and the public when the tests have changed in the middle of the process. It is as if a waiter’s job
21 Center for American Progress | Common Core State Standards Assessments
performance was measured by the average tips per table one month and by the total number of customer complaints the next, and the results were such that the waiter’s growth was at the 80th percentile. Just because one could calculate growth scores on any two related measures does not make interpretation of the resulting scores particularly clear, so states and districts need to pay close a(en-tion to these measures and how they are compared across di$erent assessments.
22 Center for American Progress | Common Core State Standards Assessments
Recommendations for assessments in the Common Core era
!e challenges laid out here are truly daunting, and failing to meet these chal-lenges substantially increases the likelihood that the standards and assessment system will face increasing resistance and possibly rejection by educators, par-ents, and/or policymakers. If the consortia and advocates for assessment and accountability do not act quickly, this resistance will begin manifesting itself more frequently and forcefully. Because many who have judged the quality of the Common Core State Standards independent of political concerns view the stan-dards and forthcoming assessments as being a likely improvement over what was in place before, the remainder of this report is focused on making recommenda-tions to help address challenges and head o$ serious implementation problems.
Focus on test quality
Almost no one was satis&ed with the quality of No Child Le% Behind-era assessments, and there have been several recent, high-pro&le e$orts to pro-vide guidance on constructing higher-quality assessments.77 If the CCSS are to achieve their intended e$ects, there is no denying that the new assessments must improve on those they are replacing in several key ways. Perhaps most impor-tantly, the new tests must be be(er aligned to the CCSS than prior state tests were to their respective standards.
One way alignment must be improved is through raising the cognitive demand of the tests to meet the rigor of the standards. !is will be an especially large chal-lenge because the CCSS call for higher levels of cognitive demand than the typical state standards they replaced, especially in English language arts. For instance, an analysis found that approximately 40 percent of CCSS content in ELA was at the highest two levels of cognitive demand"analyzing and evaluating"and 31 percent was at the lowest two levels"memorizing and performing procedures. In contrast, typical state standards in the NCLB era had 24 percent of content at the top two levels and 38 percent at the bo(om two levels of cognitive demand.78
23 Center for American Progress | Common Core State Standards Assessments
Furthermore, state tests in the NCLB era systematically failed to meet the higher levels of cognitive demand in their corresponding standards,79 so the necessary increase in cognitive demand will be substantial.
One of the primary responsibilities of the consortia, therefore, is to ensure that the representation of cognitive demand on the new assessments mirrors that of the standards. Recent analyses indicate that the nonmultiple-choice items planned for the consortia will be essential to meet the cognitive-demand expectations of the standards.80 Many of the SBAC and PARCC sample items o$ered on the consor-tia’s websites ask for more-advanced skills. It is clear from these examples that the consortia are a(ending to cognitive demand in creating each test item; the next priority is ensuring the tests adequately represent the cognitive-demand expecta-tions of the standards. If CCSS assessments cannot meet the cognitive demand called for by the standards, the tests will undermine the instructional changes called for by the standards and potentially contribute to reductionist responses.
A second way alignment must be improved is by ensuring the tests cover the full domain of the standards. !is means constructing item banks that do not reliably leave certain content standards untested. To accomplish this, there are several steps test developers should take. !e &rst is at the item-writing phase, which should be guided by the objectives in the standards such that assessment items are explicitly wri(en to cover each objective"and perhaps in equal proportions, unless there is a compelling reason for another weighting. !is will be especially important in ELA, where the standards include writing and speaking skills, among others, that have historically gone unassessed.81 Of course, some of these skills may be di'cult to write items for, and the consortia have plans for these di'cult-to-assess skills, which are described in detail on the consortia’s websites.
Another thing to consider is moving the alignment argument so that it is a forethought of test construction and validation, rather than an a%erthought, as is currently the case. !at is, test developers might use recent advances in alignment methodology to create be(er-aligned tests that more fully cover the domain of the standards.82 !ese approaches can help improve alignment using existing item banks and also guide item writing for areas that are not well represented in the tests. However, they may be more suitable to the &xed-form assessments created by the Partnership for Assessment of Readiness for College and Careers than the adaptive tests of the Smarter Balanced Assessment Consortium.
24 Center for American Progress | Common Core State Standards Assessments
Finally, test developers and policymakers should take a more critical eye toward alignment evidence, perhaps by using multiple methods of evaluating test alignment to standards, to help ferret out alignment problems before they undermine the stan-dards. Of course, there are also other elements of test quality on which test develop-ers should focus, and the consortia have each laid out fairly detailed plans regarding test quality. !e consortia should be held closely to these plans, as the quality of tests is paramount for ensuring the response to the standards is not reductionist.
Improve validity and reliability evidence
Another important element of test quality that needs improvement is the provi-sion of validity and reliability evidence, particularly with regard to the multiple kinds of inferences being made on the basis of test results. Generally speaking, validity refers to the extent to which the judgments made from test results are accurate and appropriate. In contrast, reliability refers to the extent to which the results are consistent or stable across time or forms of the test. !e burden for meeting this element lies less with test developers than with states and districts that are using new assessment results to inform decisions about individual stu-dents, teacher evaluation and professional development, and school ratings.
Reliability is a necessary but not a su'cient precursor to validity. Ratings based on new assessments should not be excessively volatile, or they will send con#ict-ing messages to educators and the general public. !is is especially important for new teacher- and school-evaluation systems based on measures of student-achievement growth. Given that growth measures are considerably less reliable than pro&ciency-based measures of performance,83 there is the potential for sub-stantial year-to-year #uctuation in evaluation ratings. States and districts should consider using multiple years of data to smooth out #uctuations in ratings, which would enhance the credibility of performance ratings. Regardless, policymakers should provide clear reports of the reliability of classi&cations.
Beyond reliability, it is essential that the validity evidence for new kinds of infer-ences be solid. Each intended use of an assessment should have a sound, plausible validation argument that leads from the test scores to the statements or decisions made in the interpretation.84 For educators and the public to trust the data emerg-ing from school-accountability systems, validity and reliability evidence should be made clear and disseminated widely. Producing simple narrative reports that describe the intended uses of student-achievement test results and how the evi-dence supports the use of achievement data for these purposes will go a long way toward shoring up unwavering support.
25 Center for American Progress | Common Core State Standards Assessments
Stressing the importance of new proficiency definitions
Another key decision to be made by state policymakers is where to set pro&ciency cuts on the new assessments; here, too, validity evidence is important. One of the key goals of the common standards movement was to create more com-mon de&nitions of pro&ciency nationwide. Moreover, it was hoped that the new pro&ciency cuts would be higher in order to more accurately identify readiness for college or careers. As mentioned above, this means that pro&ciency rates are likely to drop in most locales, and students who were previously identi&ed as pro&cient may no longer be so under the new standards. !is change is sure to cause blow-back among educators and the general public.
As has been mentioned, to combat the blowback, states will need to focus argu-ments on how the new tests and standards be(er prepare students for economic competitiveness and success in college. !is will require a well-orchestrated public relations campaign well in advance of the test scores’ release, as there will likely be considerable pushback around the proportion of students labeled as not meet-ing standards. Managing this pushback is crucial, as the drive to lower pro&ciency standards and water down the power of higher expectations will be strong. Actors at multiple levels can play important roles in making the case for the new standards.
Perhaps the strongest case for the higher pro&ciency standards is that prior pro&-ciency cuts did not o$er accurate re#ections of student readiness for college. Under some state pro&ciency guidelines, for example, 80 percent or more of students were identi&ed as pro&cient in mathematics and ELA. Yet college enrollment rates are slightly more than 40 percent85"and substantial proportions of high school gradu-ates who are not enrolled in college are unemployed. Even among those gradu-ates who do enroll in college, remediation rates are at least 20 percent86"and far higher at two-year and less-selective institutions"again illustrating the disconnect between stated pro&ciency and actual readiness for success in college or careers. It is clear that prior state pro&ciency cuts were sending misleading messages to educators, parents, and students about achievement. !e higher standards coming from the consortia should help remedy this problem. Policymakers and educators should be prepared to make this argument to parents and students to help them understand the reasons for the new, higher pro&ciency cuts.
26 Center for American Progress | Common Core State Standards Assessments
Another important case for the new pro&ciency cuts is to provide comparable measures of student performance across states. Again, the variation in prior state pro&ciency cuts sent confusing messages about student performance. A series of reports wri(en during the NCLB era showed that pro&ciency cuts were gener-ally low"almost all were lower than the NAEP pro&ciency cut, and many were lower than NAEP’s basic score"and highly variable.87 Clearly, pu(ing states on a common pro&ciency scale has advantages in terms of understanding relative performance against the standard. Given an increasingly national and even global economy, it makes li(le sense to have wildly di$erent de&nitions of pro&ciency based on ZIP code. Again, policymakers and educators can make this case to parents and students, so they understand why pro&ciency rates are changing and what the bene&ts are of common expectations.
Given the impending drops in the percentage of students who earn a score of pro&cient on the new tests, it is imperative that policymakers and educators get in front of the criticism. Communication should &rst be targeted at parents. Possible approaches include sending home materials to help parents understand the reasons behind the changes and the intended bene&ts, as well as discussing the new expectations at parents’ nights or in conferences. More generally, the public also needs to be aware of the changes. Approaches here include public service announcements supported by industry, which is generally supportive of the standards; editorials aimed at making the case for the changes; and news stories describing how they will a$ect students. No state needs to reinvent the wheel here: Kentucky provides an example of a state that has rolled out new pro&ciency guidelines with relatively li(le negative reaction, and its experience and tactics could serve as a useful guide. States should also consider"and many already are considering"easing the transition to new and higher cut scores, especially for tests used to make decisions about individual students.88
Supporting new tests with good accountability policy
!e quality of new assessments and standards is important, but it is equally, if not more, important that the tests be supported with well-designed accountabil-ity policies. Accountability policies that incorrectly identify schools or teachers that are not performing well or that are overly punitive will dramatically under-mine the promise of new standards and assessments. States have had substantial opportunity to design more thoughtful accountability systems through #exibility
27 Center for American Progress | Common Core State Standards Assessments
granted by the Department of Education. Some states have moved to incorpo-rate measures of student growth, expanded the use of nontest-based outcomes, included subjects outside of mathematics and ELA, and explicitly focused on narrowing achievement gaps in new school-accountability systems. Some of these new accountability systems will go a long way toward identifying the schools most in need of intervention and targeting appropriate sanctions or support, but some systems are not a marked improvement over NCLB’s system.
As for teacher accountability, one of the focuses of the NCLB #exibility waivers and the Race to the Top program was on expanding accountability from schools to individual educators; strengthened teacher evaluation is now law in many states and districts as a result. !e design of these policies will almost certainly a$ect the extent to which they reinforce or undermine the standards. If well constructed, the assessments will reduce the negative consequences of teachers’ narrowing their instructional focus to what is tested. In a world where tests perfectly capture all we want students to know and do, teaching to the test may not be a bad outcome.
Because CCSS tests will not be perfect, however, evaluation policy design is important. For instance, an evaluation system that uses student-growth measures that do not fully account for student characteristics may encourage teachers to avoid teaching certain groups of students. And policies that tie student-learning objectives or other nonstate test measures of student performance to high stakes might lead teachers to game the system by se(ing easily a(ainable goals. !e next few years will be an opportunity for districts and states to address these chal-lenges. And because the Department of Education has provided states with the #exibility to delay the use of teacher-evaluation results to inform personnel conse-quences, such as tenure, until the 2016-17 school year, they will be able to test out their evaluation systems and new tests in a lower-stakes environment.
Encourage good assessment practices
!e U.S. Department of Education can play an important role in improving the quality of assessments by encouraging good assessment practices along several dimensions. While of course there are concerns about federal overreach associ-ated with the consortia, the federal government clearly has a role to play to help ensure good tests.
28 Center for American Progress | Common Core State Standards Assessments
Measuring pro&ciency levels is clearly important"when students are set to go o$ to college, what ma(ers most is the degree to which they are ready, not how much progress they have made over the past year. Nevertheless, one of the more onerous restrictions required by NCLB policy was the requirement that states measure the pro&ciency levels of all students on grade-speci&c standards. While this require-ment was perhaps needed in an era of &xed-form, paper-and-pencil tests, the con-sortia, and particularly SBAC, have moved beyond &xed-form and need #exibility. Forcing all students to take tests on grade level ensures that low-achieving and high-achieving students will be poorly measured, resulting in less useful informa-tion at the extremes of the achievement distribution. Especially as tests are used to measure growth, this may unfairly a$ect teachers who teach students of either very high or very low achievement, and it may also limit the utility of tests for helping target interventions to low performers, which is admi(edly not a major use of existing state summative tests.
!ere is reasonable concern among civil rights groups and disability advocacy groups that allowing tests to measure student performance based on grade level could lead to below-grade-level instruction for students from these groups, but there is li(le reason to think that would be the case if test results based on a combination of grade-level pro&ciency and student growth are used for account-ability purposes. As the computer-adaptive tests in SBAC use students’ early responses to select easier or harder items, it makes very li(le sense to constrain these tests to only include grade-level content. We should instead seek an accu-rate measure of each child’s performance relative to the range of K-12 content. Doing so will improve the measurement of each student’s performance and facilitate more accurate growth measures.
!e federal peer-review guidelines for ensuring test quality also have an impor-tant role to play in addressing the alignment problems mentioned previously. While the peer-review guidelines encourage the use of alignment methods that capture multiple dimensions of alignment"cognitive complexity, content, and process alignment"it is clear that these guidelines were not successful in result-ing in tests that actually were well aligned. !ese guidelines should be revised to encourage multiple alignment methods to triangulate results from alignment studies. !e guidelines could also be revised with speci&c criteria that would help ensure tighter alignment.
29 Center for American Progress | Common Core State Standards Assessments
For instance, one guideline could be that the cognitive-demand allocation on the tests di$ers by no more than 10 percent from the cognitive demand called for by the standards. If this guideline had been in place under NCLB, many of the state tests would have failed. Guidelines such as this would go a long way toward encouraging the type of assessments envisioned by the architects of the standards and the standards-based reform movement. !ere are surely other ways the peer-review guidelines could be improved as well.
!e federal government could also encourage be(er assessment practices through the #exibility-waiver-renewal process and perhaps targeted incentives or grants to states. !e waiver process gave states substantial #exibility around what grades and subjects to test and use for accountability. However, the majority of states chose to continue using only ELA and mathematics for accountability.89 States may want to consider including, at a minimum, science test results in school-accountability classi&cations. Given that all states are required to test science in at least three grades, this change would cost very li(le but would reduce the narrowing e$ects of accountability policy.90 !e U.S. Department of Education could also actively encourage the creation or adoption of tests in other subjects and perhaps o$er tar-geted grants to districts or states that demonstrate a clear commitment to maintain-ing a broad, rich curriculum. All subjects need not be tested in all grades to have the e$ect of limiting the curriculum narrowing that has taken place in the past decade.
30 Center for American Progress | Common Core State Standards Assessments
Conclusion
Most thoughtful analyses of the Common Core State Standards have indicated that they hold promise for improving the quality of K-12 schooling in the United States. And while states and districts are moving full speed ahead with standards implementation, there is some growing resistance from both the political le% and right. It is essential that CCSS advocates work to ensure quality implementation, and perhaps no supplementary policy ma(ers more for standards implementa-tion than assessment quality. !e low-quality assessments from the No Child Le% Behind-era dramatically undermined the law, contributing to its negative, unintended consequences, and there are important lessons to be learned for the renewed standards movement.
!e purpose of this report was to lay out some of the challenges facing test developers and policymakers in the Common Core era and o$er suggestions for educators, test developers, and policymakers to address these challenges. !ese challenges include technical and political issues that are not easily addressed. Five recommendations for meeting the challenges were o$ered, though there are undoubtedly other ways to address educators’ and parents’ concerns. Perhaps the most important recommendation is to act thoughtfully and not punitively in the immediate future, giving educators the time to implement the standards. In con-trast, if poorly designed accountability is pushed in the next several years, there is no question that it will undermine the CCSS and lead to an expansion of the kind of resistance that is already nascent.
31 Center for American Progress | Common Core State Standards Assessments
About the author
Morgan S. Poliko! is an assistant professor of education at the University of Southern California’s Rossier School of Education. His research focuses on the design and e$ects of standards, assessment, and accountability policies on teacher and school outcomes. His work has recently appeared in Educational Researcher, Educational Evaluation and Policy Analysis, and the Journal of Teacher Education.
Acknowledgements
!ank you to Kaitlin Pennington, Jenny DeMonte, and Melissa Lazarín at the Center for American Progress for their helpful comments on the paper.
32 Center for American Progress | Common Core State Standards Assessments
Endnotes
1 Morgan S. Poliko!, “Instructional Alignment under No Child Left Behind,” American Journal of Education 118 (3) (2012): 341–368, available at http://www.uscrossier.org/ceg/wp-content/uploads/2011/08/MP_No_Child_Left.pdf.
2 Thomas S. Dee and Brian Jacob, “The Impact of No Child Left Behind on Student Achievement,” Journal for Policy Analysis and Management 30 (3) (2011): 418–446, available at http://deepblue.lib.umich.edu/bitstream/handle/2027.42/86808/20586_ftp.pdf?sequence=1.
3 David J. Deming and others, “School Accountability, Postsecondary Attainment and Earnings.” Working Paper 19444 (National Bureau of Economic Research, 2013), available at http://www.nber.org/papers/w19444.pdf?new_window=1.
4 Chester E. Finn Jr., Liam Julian, and Michael J. Petrilli, “The State of State Standards 2006” (Washington: Thomas B. Fordham Institute, 2006), available at http://www.edexcellence.net/sites/default/"les/publication/pdfs/State of State Standards2006FINAL_9.pdf.
5 Morgan S. Poliko!, Andrew C. Porter, and John Smithson, “How Well Aligned Are State Assessments of Student Achievement with State Content Standards?”, American Educational Research Journal 48 (4) (2011): 965–995, available at http://www.uscrossier.org/ceg/wp-content/uploads/publications/state_assessments_poliko!.pdf.
6 Andrew C. Porter, Morgan S. Poliko!, and John Smith-son, “Is There a De Facto National Intended Curriculum? Evidence from State Content Standards,” Educational Evaluation and Policy Analysis 31 (3) (2009): 238–268.
7 National Center for Education Statistics, Mapping 2005 State Pro!ciency Standards Onto the NAEP Scales (De-partment of Education, 2007), available at http://nces.ed.gov/nationsreportcard/pdf/studies/2007482.pdf.
8 Tim Walker, “NEA Poll: Majority of Educators Support the Common Core State Standards,” NEA Today, September 12, 2013, available at http://neatoday.org/2013/09/12/nea-poll-majority-of-educators-sup-port-the-common-core-state-standards/.
9 Sheila Byrd Carmichael and others, “The State of State Standards—and the Common Core—in 2010” (Wash-ington: Thomas B. Fordham Institute, 2010), available at http://www.edexcellence.net/sites/default/"les/publi-cation/pdfs/SOSSandCC2010_FullReportFINAL_8.pdf.
10 See Morgan S. Poliko!, “The Redundancy of Mathemat-ics Instruction in U.S. Elementary and Middle Schools,” Elementary School Journal 113 (2) (2012): 230–251, available at http://web-app.usc.edu/web/rossier/publications/66/The Redundancy of Math Instruction.pdf. See also William H. Schmidt and Richard T. Houang, “Curricular Coherence and the Common Core State Standards for Mathematics,” Educational Researcher 41 (8) (2012): 294–308.
11 For mathematics, see Paul Cobb and Kara Jackson, “Assessing the Quality of the Common Core State Stan-dards for Mathematics,” Educational Researcher 40 (4) (2011): 183–185. For English language arts, see Richard W. Beach, “Issues in Analyzing Alignment of Language Arts Common Core Standards With State Standards,” Educational Researcher 40 (4) (2011): 179–182.
12 Porter, Poliko!, and Smithson, “Is There a De Facto National Intended Curriculum?”
13 Carmichael and others, “The State of State Standards,” p. 21.
14 Poliko!, Porter, and Smithson, “How Well Aligned Are State Assessments of Student Achievement with State Content Standards?”
15 Laura S. Hamilton and others, Standards-Based Account-ability Under No Child Left Behind: Experiences of Teachers and Administrators in Three States (Santa Monica, CA: RAND, 2007), available at http://www.rand.org/content/dam/rand/pubs/monographs/2007/RAND_MG589.pdf.
16 National Center for Education Statistics, Mapping 2005 State Pro!ciency Standards Onto the NAEP Scales.
17 For an excellent description of state-to-state variations in the implementation of No Child Left Behind, see Randall Reback and others, “Fifty Ways to Leave a Child Behind: Idiosyncrasies and Discrepancies in States’ Im-plementation of No Child Left Behind,” paper presented at the Association for Education Finance and Policy’s 38th annual conference, New Orleans, Louisiana, March 2013.
18 For a detailed political analysis of the origins of the Common Core State Standards, see Lorraine M. McDon-nell and M. Stephen Weatherford, “Evidence Use and the Common Core State Standards Movement: From Problem De"nition to Policy Adoption,” American Journal of Education 120 (1) (2013): 1–25.
19 Department of Education, “U.S. Secretary of Education Duncan Announces Winners of Competition to Improve Student Assessments,” Press release, September 2, 2010, available at http://www.ed.gov/news/press-releases/us-secretary-education-duncan-announces-winners-competition-improve-student-asse.
20 Morgan S. Poliko! and others, “The Waive of the Future? School Accountability in the Waiver Era,” Educa-tional Researcher (forthcoming).
21 There are many histories of the previous e!orts toward common standards. See, for example, K. R. Kosar, Fail-ing Grades: The Federal Politics of Education Standards (Boulder, CO: Lynne Rienner Publishers, 2005).
22 For an example from earlier standards eras, see William A. Firestone and others, “Performance-Based Assess-ment and Instructional Change: The E!ects of Testing in Maine and Maryland,” Educational Evaluation and Policy Analysis 20 (2) (1998): 95–113. In the NCLB era, research suggests that teachers in states with more coherent standards-based policy systems practice more standards- and test-aligned instruction. See Morgan S. Poliko!, “The Association of State Policy Attributes with Teachers’ Instructional Alignment,” Educational Evalua-tion and Policy Analysis 34 (3) (2012): 278–294.
23 Cobb and Jackson, “Assessing the Quality of the Com-mon Core State Standards for Mathematics,” p. 185.
24 Carmichael and others, “The State of State Standards.”
25 Schmidt and Houang, “Curriculum Coherence and the Common Core State Standards for Mathematics.”
33 Center for American Progress | Common Core State Standards Assessments
26 Andrew C. Porter and others, “Common Core Standards: The New U.S. Intended Curriculum,” Educational Researcher 40 (3) (2011): 103–116.
27 For two reports on testing costs and quality in the NCLB and Common Core eras, see Matthew M. Chingos, “Strength in Numbers: State Spending on K-12 Assess-ment Systems” (Washington: Brookings, 2012). See also Matthew M. Chingos, “Standardized Testing and the Common Core Standards: You Get What You Pay For?” (Washington: Brookings, 2013).
28 Erik W. Robelen, “Texas’ In#uence over Textbook Con-tent Could Shift with Changes in the Market,” Education Week, April 2010, pp. 14–15.
29 National Education Association, “NEA and BetterLesson launch new site with over 3,000 Common Core lessons,” Press release, January 15, 2014, available at http://www.nea.org/home/57683.htm.
30 M. Mehana and A.J. Reynolds, “School mobility and achievement: A meta-analysis,” Children and Youth Services Review 26 (1) (2004): 93–119.
31 Lorraine M. McDonnell and M. Stephen Weatherford, “Organized Interests and the Common Core,” Education-al Researcher 42 (9) (2013): 488–497, available at http://edr.sagepub.com/content/42/9/488.abstract?rss=1.
32 Ibid.
33 Ze’ev Wurman and Williamson M. Evers, “New Education Dashboard: Less Rigorous, Less Meaningful,” Education Week, February 11, 2011, p. 20.
34 Marshall S. Smith and Jennifer A. O’Day, “Systemic School Reform.” In Susan H. Fuhrman and Betty Malen, eds., The Politics of Curriculum and Testing: Politics of Education Association Yearbook (Bristol, PA: Falmer Press, 1991).
35 Poliko!, “The Association of State Policy Attributes with Teachers’ Instructional Alignment.”
36 One article found that 50 percent of the content in state standards was not assessed at all on state ELA tests. See Poliko!, Porter, and Smithson, “How Well Aligned Are State Assessments of Student Achievement with State Content Standards?”
37 Hamilton and others, Standards-Based Accountability Under No Child Left Behind: Experiences of Teachers and Administrators in Three States.
38 Julie Berry Cullen and Susanna Loeb, “School Finance Reform in Michigan: Evaluating Proposal A.” In John Yinger, ed., Helping Children Left Behind: State Aid and the Pursuit of Educational Equity (Cambridge, MA: MIT Press, 2004).
39 Department of Education, “U.S. Secretary of Education Duncan Announces Winners of Competition to Improve Student Assessments.”
40 Dylan Scott, “Two Paths Toward Common Core Stan-dards Assessments,” Governing, February 15, 2012, avail-able at http://www.governing.com/blogs/view/two-paths-toward-common-core-standards-assessments.html.
41 Council of Chief State School O$cers, “States’ Commit-ment to High-Quality Assessments Aligned to College- and Career-Readiness” (2013).
42 Richard C. Gershon, “Computer Adaptive Testing,” Journal of Applied Measurement 6 (1) (2005): 109–127.
43 For a summary of the potential bene"ts and drawbacks of SBAC’s decentralized model, see Chingos, “Standard-ized Testing and the Common Core Standards.”
44 Ibid.
45 National Center for Education Statistics, Mapping 2005 State Pro!ciency Standards Onto the NAEP Scales.
46 Reback and others, “Fifty Ways to Leave a Child Behind.”
47 Tom Loveless, “The 2012 Brown Center Report on American Education: How Well Are American Students Learning?” (Washington: Brookings, 2012), available at http://www.brookings.edu/~/media/newsletters/0216_brown_education_loveless.pdf.
48 Dinah Sparks and Nat Malkus, “First-Year Undergradu-ate Remedial Coursetaking: 1999–2000, 2003–04, 2007–08” (Washington: National Center for Education Statistics, 2013), available at http://nces.ed.gov/pubs2013/2013013.pdf.
49 Michael Morella, “Common Core Standards: Early Results From Kentucky Are In,” U.S. News & World Report, December 4, 2010, available at http://www.usnews.com/opinion/articles/2012/12/04/common-core-stan-dards-early-results-from-kentucky-are-in; The Editorial Board, “New York’s Common Core Tests,” The New York Times, August 7, 2013, available at http://www.nytimes.com/2013/08/08/opinion/new-yorks-common-core-test-scores.html; Lynn Bonner, “Lower test scores for NC schools show results of tougher standards,” Raleigh News & Observer, November 7, 2013, available at http://www.newsobserver.com/2013/11/07/3349011/test-scores-for-nc-schools-drop.html.
50
51 See for instance, Smarter Balanced Assessment Consor-tium, “Technology,” available at http://www.smarterbal-anced.org/smarter-balanced-assessments/technology/ (last accessed December 2013).
52 Chingos, “Standardized Testing and the Common Core Standards.” See also Chingos, “Strength in Numbers.”
53 Pioneer Institute, “National Cost of Aligning States and Localities to the Common Core Standards” (2012), available at http://pioneerinstitute.org/download/national-cost-of-aligning-states-and-localities-to-the-common-core-standards/.
54 National Center for Education Statistics, Digest of Educa-tion Statistics 2012 (Department of Education, 2013), available at http://nces.ed.gov/pubs2014/2014015.pdf.
55 Joan Herman and Robert Linn, “CRESST Report 823—On the Road to Assessing Deeper Learning: The Status of Smarter Balanced and PARCC Assessment Consortia” (Los Angeles, CA: National Center for Research on Evaluation, Standards, and Student Testing, 2013), avail-able at http://www.hewlett.org/uploads/documents/On_the_Road_to_Assessing_DL-The_Status_of_SBAC_and_PARCC_Assessment_Consortia_CRESST_Jan_2013.pdf.
56 Ibid.
57 Herman and Linn, “CRESST Report 823.”
58 David M. Williamson and others, “Automated Scoring for the Assessment of Common Core Standards” (Wash-ington, London, and New York: Educational Testing Service, Pearson PLC, and College Board, 2010), avail-able at https://www.ets.org/s/commonassessments/pdf/AutomatedScoringAssessCommonCoreStandards.pdf.
34 Center for American Progress | Common Core State Standards Assessments
59 See, for instance, Daniel M. Koretz and others, “The Vermont Portfolio Assessment Program: Findings and Implications,” Educational Measurement: Issues and Practice 13 (3) (1994): 5–16. See also Firestone and oth-ers, “Performance-based Assessment and Instructional Change.”
60 Poliko!, Porter, and Smithson, “How Well Aligned Are State Assessments of Student Achievement with State Content Standards?”
61 Rebecca Holcombe, Jennifer Jennings, and Daniel Koretz, “The Roots of Score In#ation: An Examination of Opportunities in Two States’ Tests.” In Gail L. Sunderman, ed., Charting Reform, Achieving Equity in a Diverse Nation (Greenwich, CT: Information Age Publishing, 2013).
62 A recent paper argues that alignment could be fore-grounded in the test-construction process using an algo-rithm to create more-aligned tests. See Andrew C. Porter and others, “Constructing Aligned Assessments Using Automated Test Construction,” Educational Researcher 42 (8) (2013): 415–423, available at http://edr.sagepub.com/content/42/8/415.full.pdf+html?ijkey=kOCc8/rVD7hXc&keytype=ref&siteid=spedr.
63 David T. Conley and Linda Darling-Hammond, “Creating Systems of Assessment for Deeper Learning” (Stanford, CA: Stanford Center for Opportunity Policy in Educa-tion, 2013), available at https://edpolicy.stanford.edu/sites/default/"les/publications/creating-systems-assessment-deeper-learning_0.pdf.
64 Moyers & Company, “Public Schools for Sale?”, March 28, 2014, available at http://billmoyers.com/episode/public-schools-for-sale/. See also The Network for Public Education, available at http://www.networkfor-publiceducation.org/ (last accessed April 2014).
65 Spyros Konstantopoulos, Shazia R. Miller, and Arie van der Ploeg, “The Impact of Indiana’s System of Interim Assessments on Mathematics and Reading Achieve-ment,” Educational Evaluation and Policy Analysis 35 (4) (2013): 481–499.
66 For instance, a recent poll by the Associated Press and the National Opinion Research Council found that 74 percent of parents thought it was very or extremely important that “their child’s school regularly assess whether or not their child is meeting the statewide expectations for the grade level.” See Associated Press and National Opinion Research Council, “National Education Survey” (2013), available at http://www.apnorc.org/PDFs/Parent Attitudes/AP-NORC National Education Survey Topline_FINAL.pdf. Similarly, a Califor-nia poll found 66.1 percent of parents in agreement that, “California should test students in each grade to make sure they are progressing.” See MFour and Tulchin Research, “Pace/USC Rossier School of Education Poll 2013” (2013), available at http://www.edpolicyinca.org/sites/default/"les/PACE_USC_Poll2013_Topline.pdf.
67 Larry V. Hedges and Eric C. Hedberg, “Intraclass Correla-tion Values for Planning Group Randomized Trials in Education,” Educational Evaluation and Policy Analysis 29 (1) (2007): 60–87, available at http://drdc.uchicago.edu/what/hedges-hedberg.pdf.
68 Conley and Darling-Hammond, “Creating Systems of Assessment for Deeper Learning.”
69 James W. Popham, “Instructional Insensitivity of Tests: Accountability’s Dire Drawback,” Phi Delta Kappan 89 (2) (2007): 146–155, available at http://www.pdk-members.org/members_online/publications/Archive/pdf/k0710pop.pdf. For a review of the concept and measurement of instructional sensitivity, see Morgan S. Poliko!, “Instructional Sensitivity as a Psychometric Property of Assessments,” Educational Measurement: Issues and Practice 29 (4) (2013): 3–14, available at http://web-app.usc.edu/web/rossier/publications/66/Instructional%20Sensitivity%20as%20a%20Psycho-metric%20Property.pdf.
70 Barbara Nye, Spyros Konstantopoulos, and Larry V. Hedges, “How Large are Teacher E!ects?”, Educational Evaluation and Policy Analysis 26 (3) (2004): 237–257.
71 Raj Chetty, John N. Friedman, and Jonah E. Rocko!, “Measuring the Impacts of Teachers II: Teacher Value-Added and Student Outcomes in Adulthood.” Working Paper 19424 (National Bureau of Economic Research, 2013), available at http://www.nber.org/papers/w19424.pdf?new_window=1.
72 Bill and Melinda Gates Foundation, “Ensuring Fair and Reliable Measures of E!ective Teaching: Culminating Findings from the MET Project’s Three-Year Study” (2013), available at http://www.metproject.org/downloads/MET_Ensuring_Fair_and_Reliable_Mea-sures_Practitioner_Brief.pdf.
73 Letter from Arne Duncan to Chief State School O$cers, “Key Policy Letters from the Education Secretary and Deputy Secretary,” June 18, 2013, available at http://www2.ed.gov/policy/elsec/guid/secletter/130618.html.
74 Letter from Deborah S. Delisle and Ann Whalen to Terry Holliday, January 30, 2014, available at http://www2.ed.gov/policy/esea#ex/secretary-letters/ky4ltr.html; letter from Deborah S. Delisle to Carey Wright, December 8, 2013, available at http://www2.ed.gov/policy/esea#ex/secretary-letters/msevalltr.html; letter from Deborah S. Delisle to Dale Erquiaga, December 8, 2013, available at http://www2.ed.gov/policy/esea#ex/secretary-letters/nv4ltr.html; letter from Deborah S. Delisle to Mick Zais, January 14, 2014, available at http://www2.ed.gov/policy/esea#ex/secretary-letters/sc4ltr.html; Michele McNeil, “Ed. Dept. Rejects, For Now, Utah and Arkansas Teacher-Evaluation Waivers,” Politics K-12, February 20, 2014, available at http://blogs.edweek.org/edweek/campaign-k-12/2014/02/educa-tion_department_rejects_f.html?cmp=SOC-SHR-TW.
75 Damian W. Betebenner, “Norm- and Criterion-Refer-enced Student Growth,” Educational Measurement: Issues and Practice 28 (4) (2009): 42–51.
76 For example, one study "nds correlations of 0.15 to 0.58 between ranks based on value-added measures, or VAM, constructed from di!erent tests. This is not a perfect analogy to the present situation, as the ques-tion here is how highly correlated growth scores would be if calculated based on a common baseline test but di!erent outcome tests. See John P. Papay, “Di!erent Tests, Di!erent Answers: The Stability of Teacher Value-Added Estimates Across Outcome Measures,” American Educational Research Journal 48 (1) (2011): 163–193. This study also "nds that the correlations of VAM based on di!erent subscales of the same test are in the range of 0.52 to 0.65, suggesting that the content of the test matters—though the author argues it does not matter as much as test timing or measurement error for reduc-ing the correlations.
35 Center for American Progress | Common Core State Standards Assessments
77 See, for instance, The Gordon Commission on the Future of Assessment in Education, “A Public Policy Statement” (2013), available at http://www.gordon-commission.org/rsc/pdfs/gordon_commission_pub-lic_policy_report.pdf. See also Linda Darling-Hammond and others, “Criteria for High-Quality Assessments” (Stanford, CA: Stanford Center for Opportunity Policy in Education, 2013), available at https://edpolicy.stanford.edu/sites/default/"les/publications/criteria-higher-quality-assessment_2.pdf.
78 Porter and others, “Common Core Standards.”
79 Poliko!, Porter, and Smithson, “How Well Aligned Are State Assessments of Student Achievement with State Content Standards?”
80 Herman and Linn, “CRESST Report 823.”
81 Poliko!, Porter, and Smithson, “How Well Aligned Are State Assessments of Student Achievement with State Content Standards?”
82 Porter and others, “Constructing Aligned Assessments Using Automated Test Construction.”
83 At the teacher level, see Daniel F. McCa!rey and oth-ers, “The Intertemporal Variability of Teacher E!ect Estimates,” Education Finance and Policy 4 (4) (2009): 572–606. At the school level, see Andrew McEachin and Morgan S. Poliko!, “We Are the 5%: Which Schools Would be Held Accountable under a Proposed Revision of the Elementary and Secondary Education Act?”, Educational Researcher 41 (7) (2012): 243–251, available at http://www-bcf.usc.edu/~poliko!/WeAreTheFivePercent.pdf.
84 Michael T. Kane, “An Argument-based Approach to Validation” (Iowa City, IA: ACT, 1990), available at http://www.act.org/research/researchers/reports/pdf/ACT_RR90-13.pdf; Michael T. Kane, “Validating the Interpretations and Uses of Test Scores,” Journal of Educational Measurement 50 (1) (2013): 1–73, avail-able at http://onlinelibrary.wiley.com/doi/10.1111/jedm.12000/abstract.
85 Thomas D. Snyder and Sally A. Dillow, “Digest of Educa-tion Statistics, 2011” (Washington: National Center for Education Statistics, 2012), available at http://nces.ed.gov/pubs2012/2012001.pdf.
86 Sparks and Malkus, “First Year Undergraduate Remedial Coursetaking.”
87 National Center for Education Statistics, Mapping 2005 State Pro!ciency Standards Onto the NAEP Scales.
88 Catherine Gewertz, “States Grapple With Common Test-Score Cuto!s,” Education Week, December 11, 2013, available at http://www.edweek.org/ew/articles/2013/12/11/14naep.h33.html.
89 Poliko! and others, “The Waive of the Future?”
90 Ibid.
The Center for American Progress is a nonpartisan research and educational institute
dedicated to promoting a strong, just and free America that ensures opportunity
for all. We believe that Americans are bound together by a common commitment to
these values and we aspire to ensure that our national policies reflect these values.
We work to find progressive and pragmatic solutions to significant domestic and
international problems and develop policy proposals that foster a government that
is “of the people, by the people, and for the people.”
1333 H STREET, NW, 10TH FLOOR, WASHINGTON, DC 20005 • TEL: 202!682!1611 • FAX: 202!682!1867 • WWW.AMERICANPROGRESS.ORG


