Cognitive Pharmaceutical Services in Community
Pharmacy
Prof Charlie BenrimojProfessor of Pharmacy Practice &Head of Graduate School of Health
CHERE October 2013
Overview
• National and International Context• Australian Environment & Research
– Pharmacy Barometer– Implementation and Sustainability Model– Piloting of Model
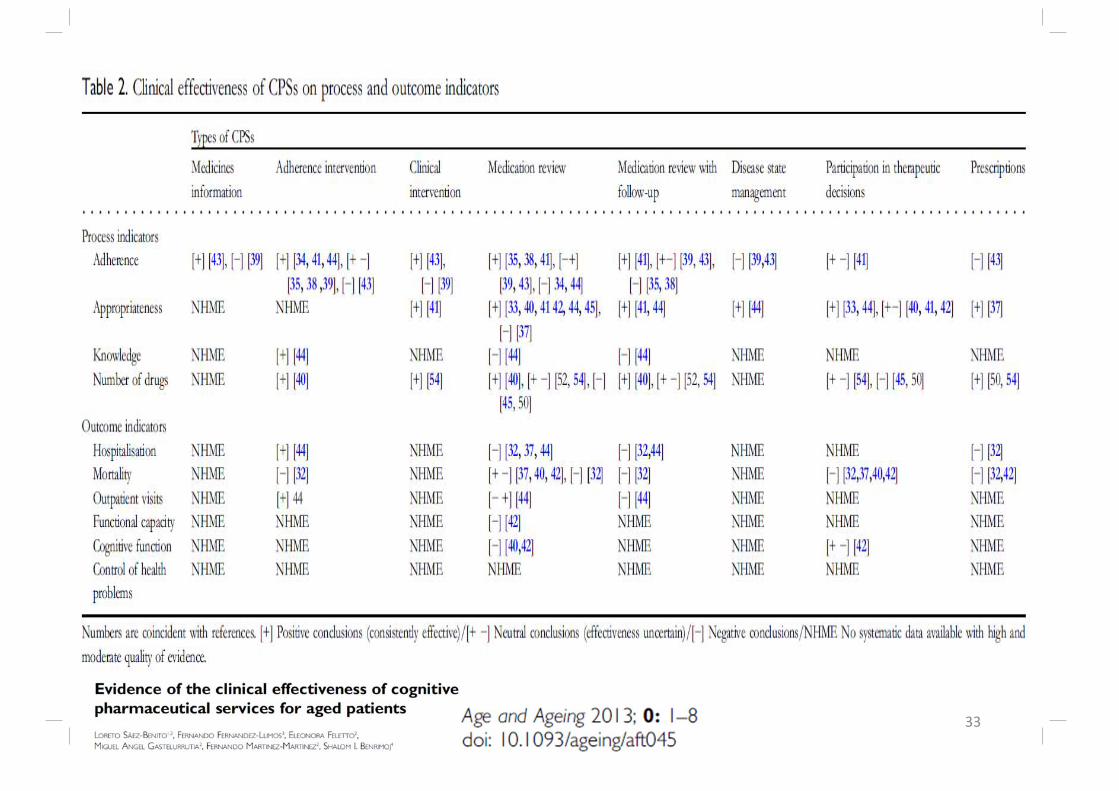
• International Impact Study (ECHO) in Spain• Conclusion
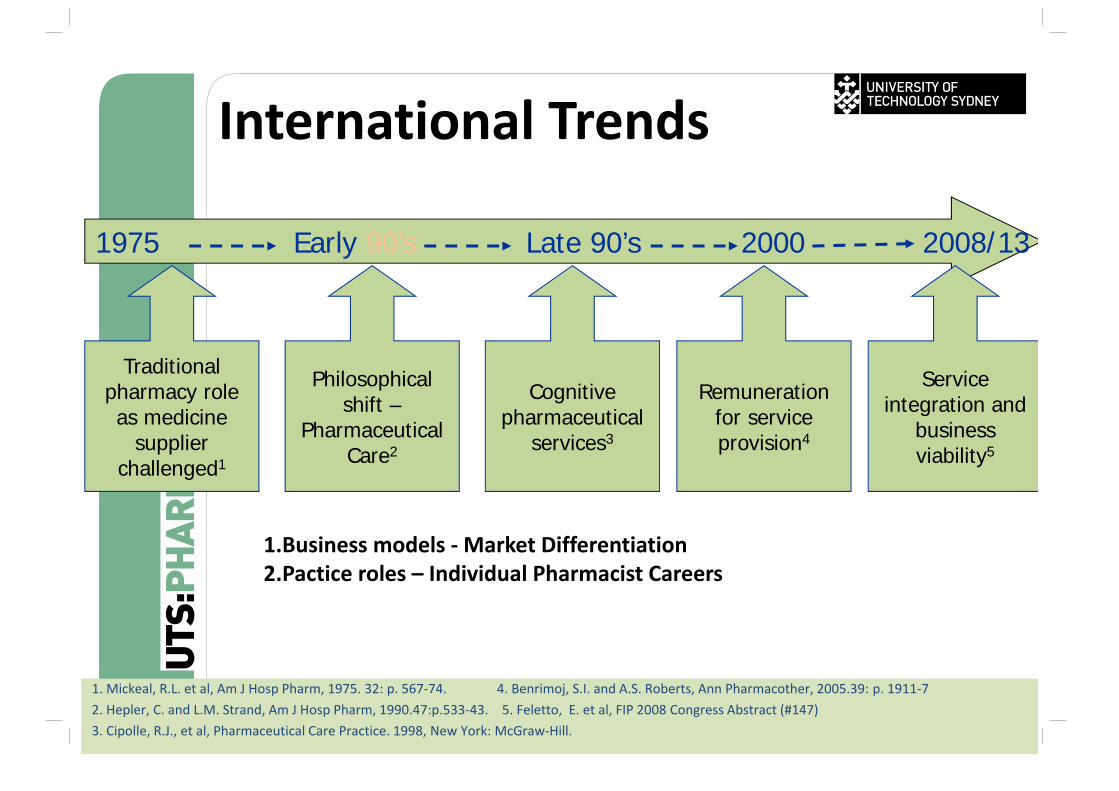
International Trends
Traditional pharmacy role as medicine
supplier challenged1
1975 Early 90’s Late 90’s 2000 2008/13
Philosophical shift –
Pharmaceutical Care2
Cognitive pharmaceutical
services3
Remuneration for service provision4
Service integration and
business viability5
1. Mickeal, R.L. et al, Am J Hosp Pharm, 1975. 32: p. 567‐74. 4. Benrimoj, S.I. and A.S. Roberts, Ann Pharmacother, 2005.39: p. 1911‐72. Hepler, C. and L.M. Strand, Am J Hosp Pharm, 1990.47:p.533‐43. 5. Feletto, E. et al, FIP 2008 Congress Abstract (#147)3. Cipolle, R.J., et al, Pharmaceutical Care Practice. 1998, New York: McGraw‐Hill.
1.Business models ‐Market Differentiation2.Pactice roles – Individual Pharmacist Careers
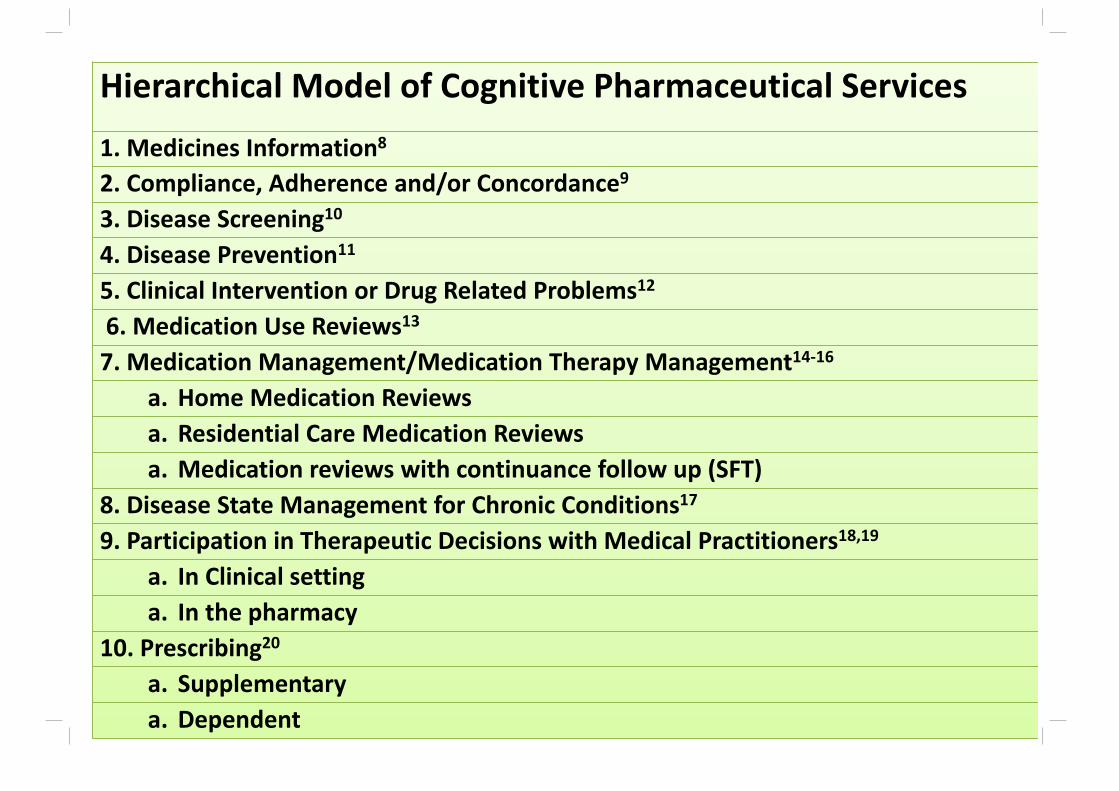
Hierarchical Model of Cognitive Pharmaceutical Services
1. Medicines Information8
2. Compliance, Adherence and/or Concordance9
3. Disease Screening10
4. Disease Prevention11
5. Clinical Intervention or Drug Related Problems12
6. Medication Use Reviews13
7. Medication Management/Medication Therapy Management14‐16
a. Home Medication Reviewsa. Residential Care Medication Reviewsa. Medication reviews with continuance follow up (SFT)
8. Disease State Management for Chronic Conditions17
9. Participation in Therapeutic Decisions with Medical Practitioners18,19
a. In Clinical settinga. In the pharmacy
10. Prescribing20
a. Supplementary a. Dependent
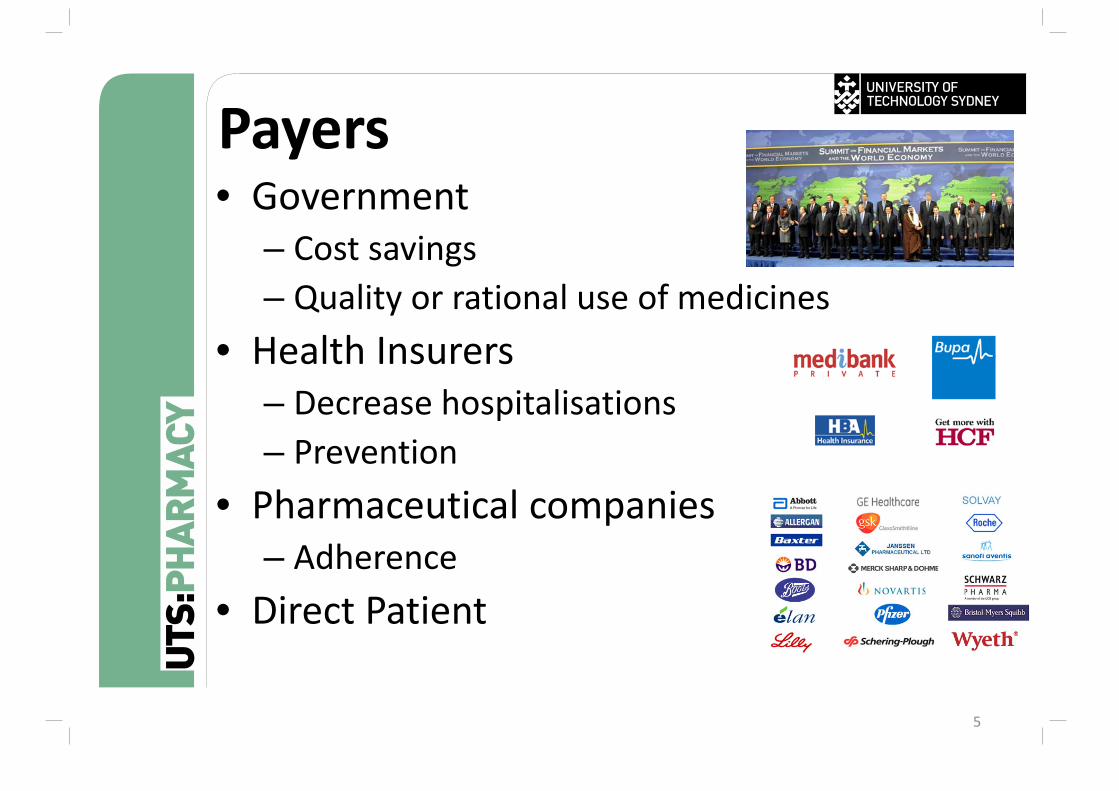
Payers• Government
– Cost savings– Quality or rational use of medicines
• Health Insurers– Decrease hospitalisations– Prevention
• Pharmaceutical companies– Adherence
• Direct Patient
5
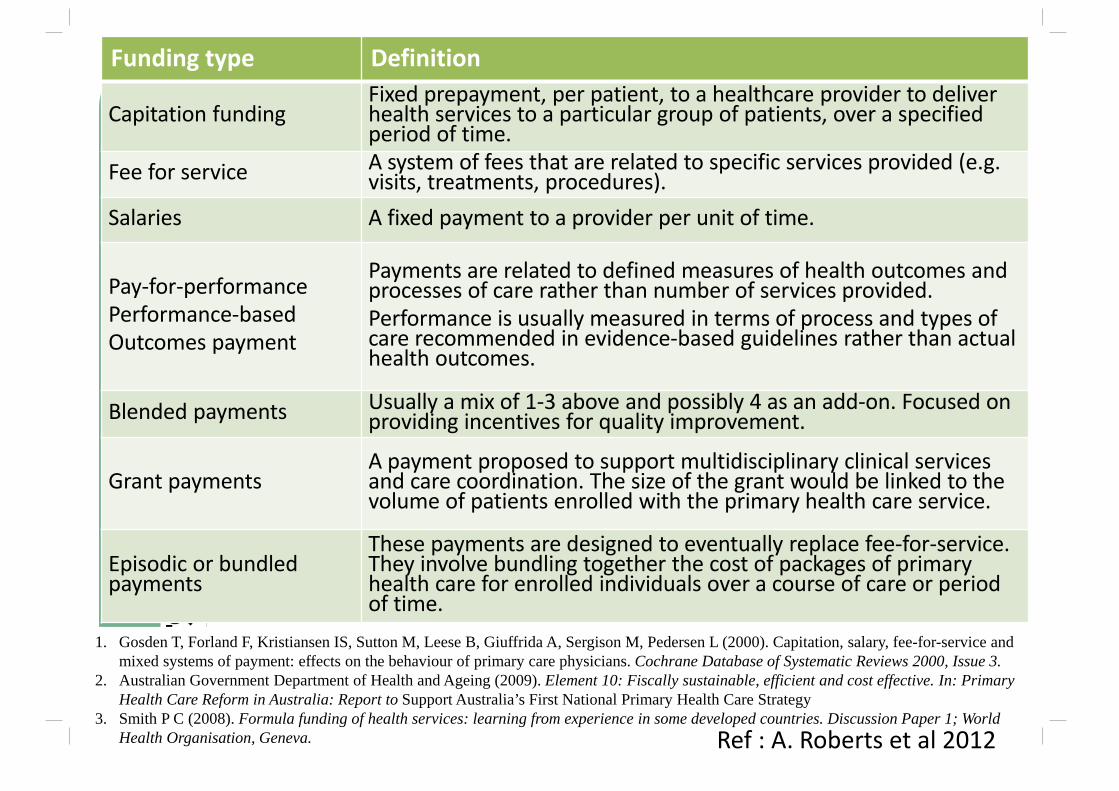
Funding type Definition
Capitation fundingFixed prepayment, per patient, to a healthcare provider to deliver health services to a particular group of patients, over a specified period of time.
Fee for service A system of fees that are related to specific services provided (e.g. visits, treatments, procedures).
Salaries A fixed payment to a provider per unit of time.
Pay‐for‐performance Performance‐basedOutcomes payment
Payments are related to defined measures of health outcomes and processes of care rather than number of services provided. Performance is usually measured in terms of process and types of care recommended in evidence‐based guidelines rather than actual health outcomes.
Blended payments Usually a mix of 1‐3 above and possibly 4 as an add‐on. Focused on providing incentives for quality improvement.
Grant paymentsA payment proposed to support multidisciplinary clinical services and care coordination. The size of the grant would be linked to the volume of patients enrolled with the primary health care service.
Episodic or bundled payments
These payments are designed to eventually replace fee‐for‐service. They involve bundling together the cost of packages of primary health care for enrolled individuals over a course of care or period of time.
1. Gosden T, Forland F, Kristiansen IS, Sutton M, Leese B, Giuffrida A, Sergison M, Pedersen L (2000). Capitation, salary, fee-for-service and mixed systems of payment: effects on the behaviour of primary care physicians. Cochrane Database of Systematic Reviews 2000, Issue 3.
2. Australian Government Department of Health and Ageing (2009). Element 10: Fiscally sustainable, efficient and cost effective. In: Primary Health Care Reform in Australia: Report to Support Australia’s First National Primary Health Care Strategy
3. Smith P C (2008). Formula funding of health services: learning from experience in some developed countries. Discussion Paper 1; World Health Organisation, Geneva. Ref : A. Roberts et al 2012
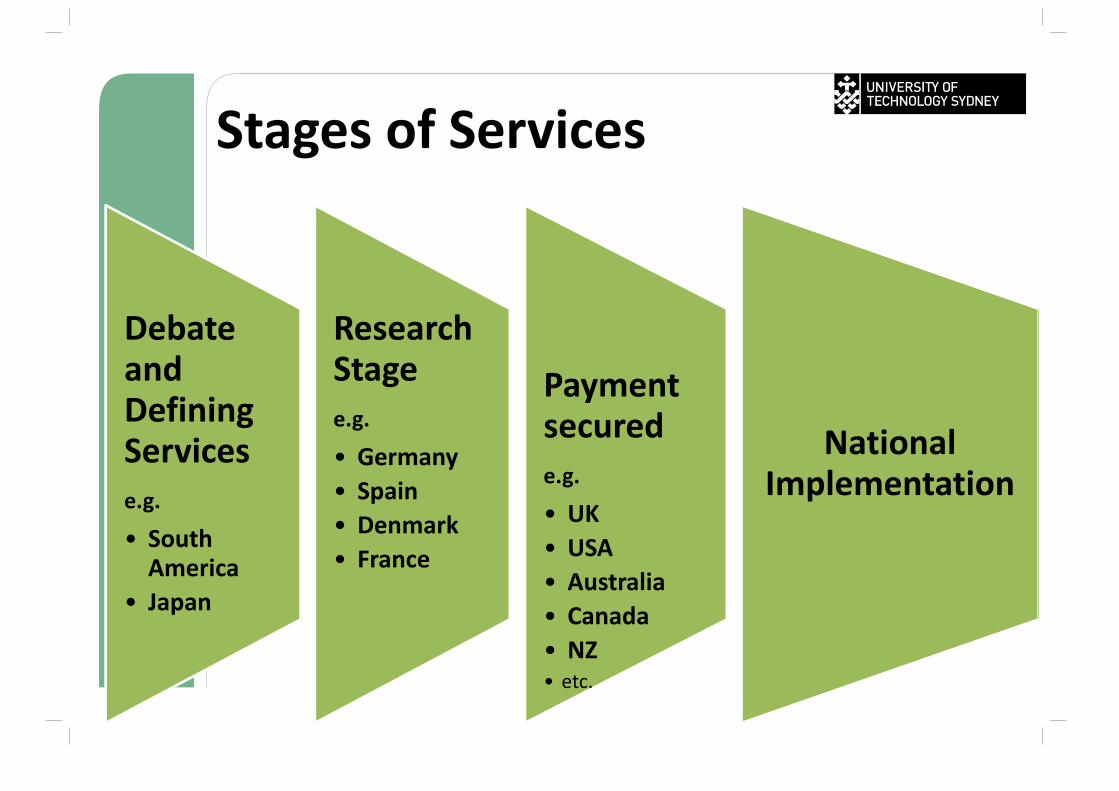
Stages of Services
Debate and Defining Servicese.g.
• South America
• Japan
Research Stagee.g.
• Germany• Spain• Denmark• France
Payment securede.g.
• UK• USA• Australia• Canada• NZ• etc.
National Implementation
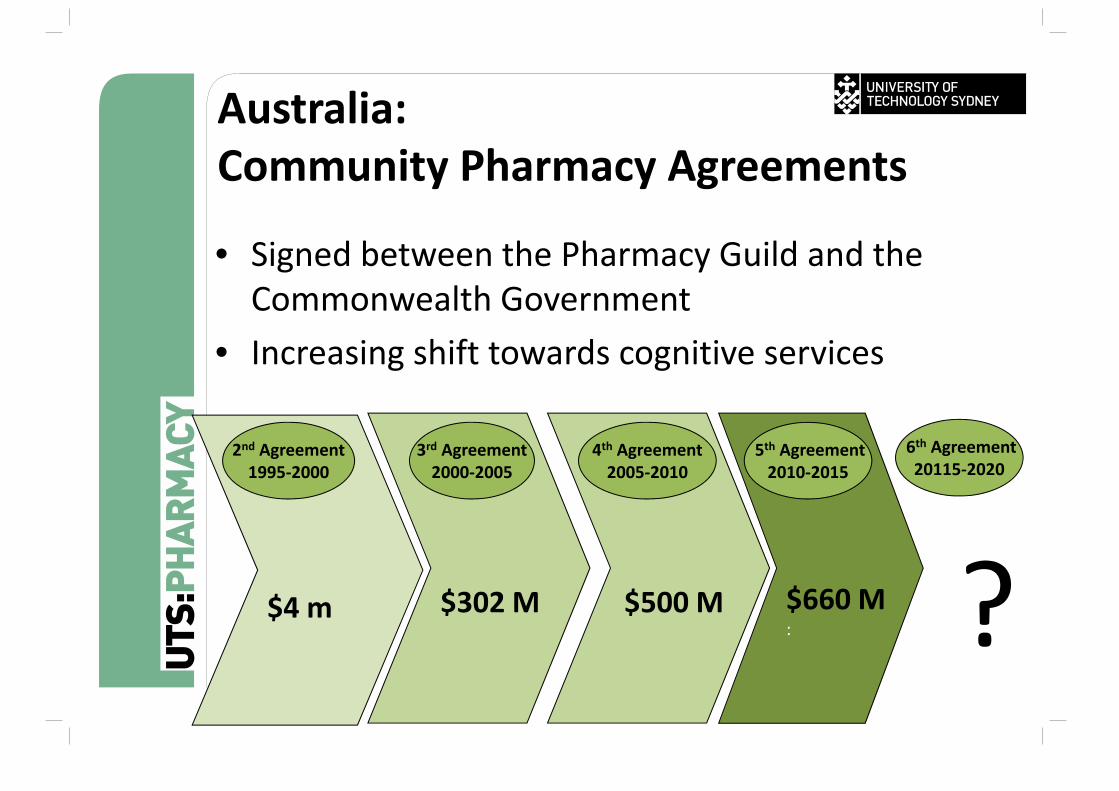
Australia:Community Pharmacy Agreements
• Signed between the Pharmacy Guild and the Commonwealth Government
• Increasing shift towards cognitive services
$4 m
2nd Agreement1995‐2000
$302 M
3rd Agreement2000‐2005
$500 M
4th Agreement2005‐2010
$660 M:
6th Agreement20115‐2020
5th Agreement2010‐2015
?
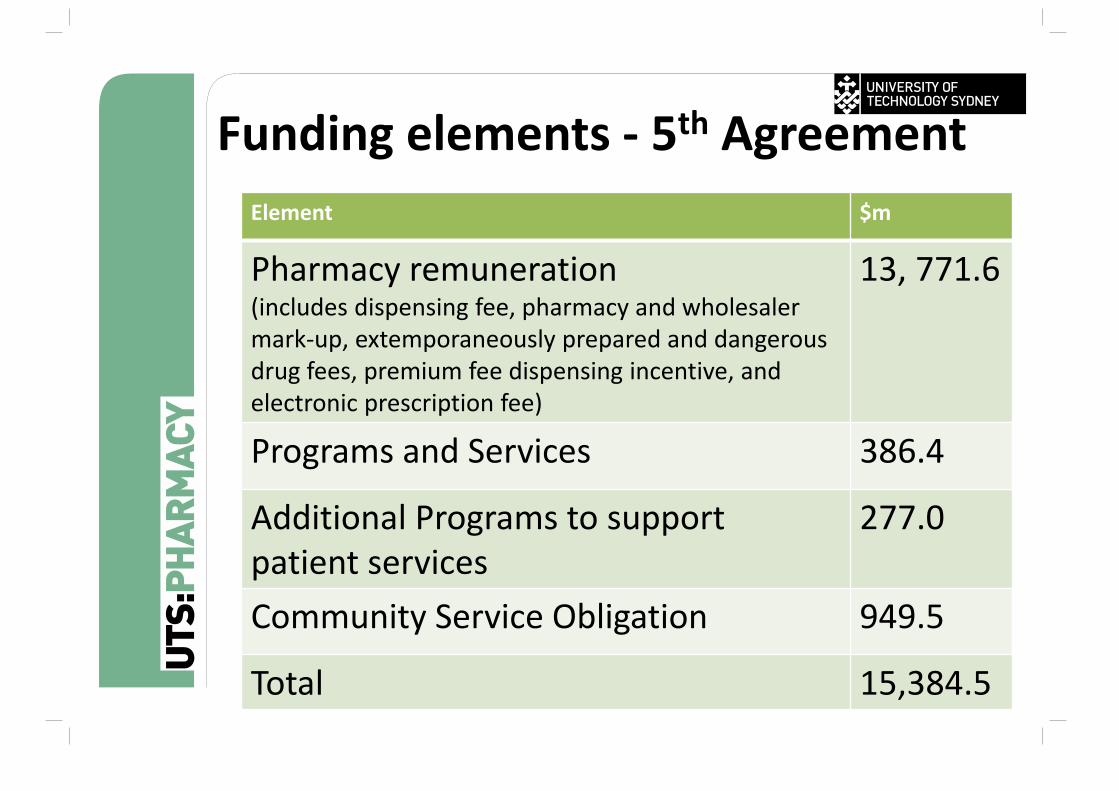
Funding elements ‐ 5th AgreementElement $m
Pharmacy remuneration(includes dispensing fee, pharmacy and wholesaler mark‐up, extemporaneously prepared and dangerous drug fees, premium fee dispensing incentive, and electronic prescription fee)
13, 771.6
Programs and Services 386.4
Additional Programs to support patient services
277.0
Community Service Obligation 949.5
Total 15,384.5
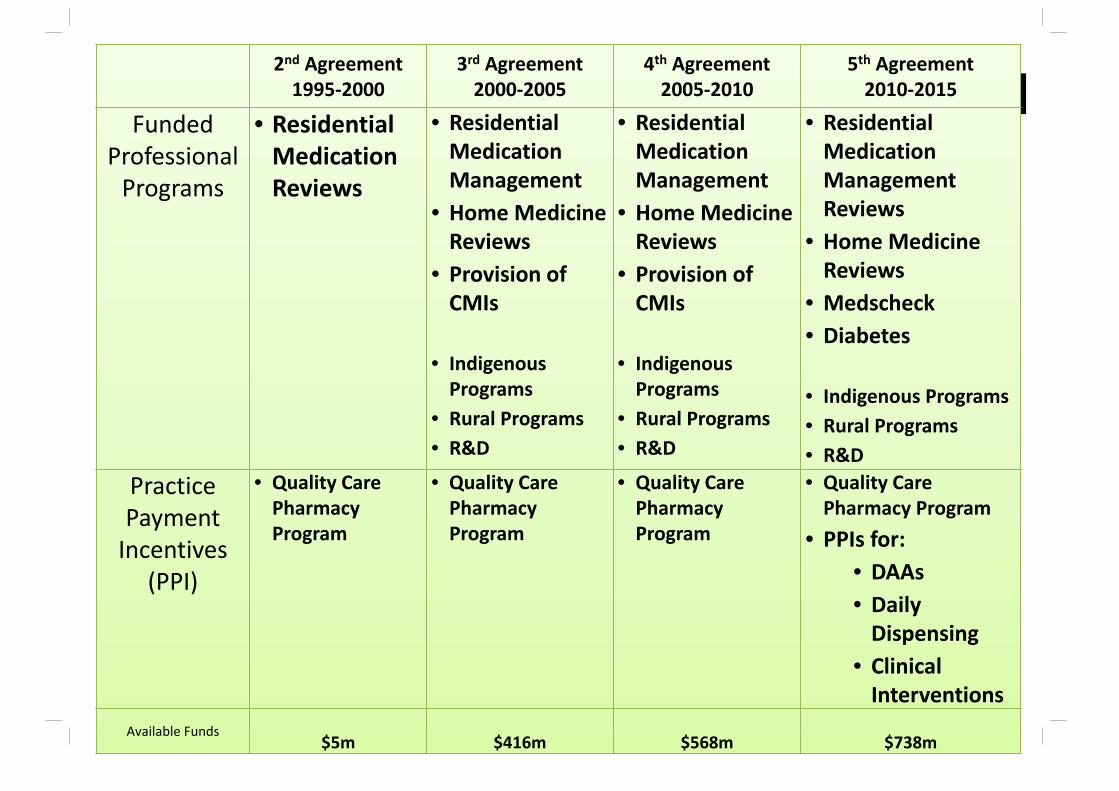
2nd Agreement1995‐2000
3rd Agreement2000‐2005
4th Agreement2005‐2010
5th Agreement2010‐2015
Funded Professional Programs
• Residential Medication Reviews
• Residential Medication Management
• Home Medicine Reviews
• Provision of CMIs
• Indigenous Programs
• Rural Programs• R&D
• Residential Medication Management
• Home MedicineReviews
• Provision of CMIs
• Indigenous Programs
• Rural Programs• R&D
• Residential Medication Management Reviews
• Home Medicine Reviews
• Medscheck• Diabetes
• Indigenous Programs• Rural Programs• R&D
Practice Payment Incentives
(PPI)
• Quality Care Pharmacy Program
• Quality Care Pharmacy Program
• Quality Care Pharmacy Program
• Quality Care Pharmacy Program
• PPIs for:• DAAs• Daily Dispensing
• Clinical Interventions
Available Funds$5m $416m $568m $738m
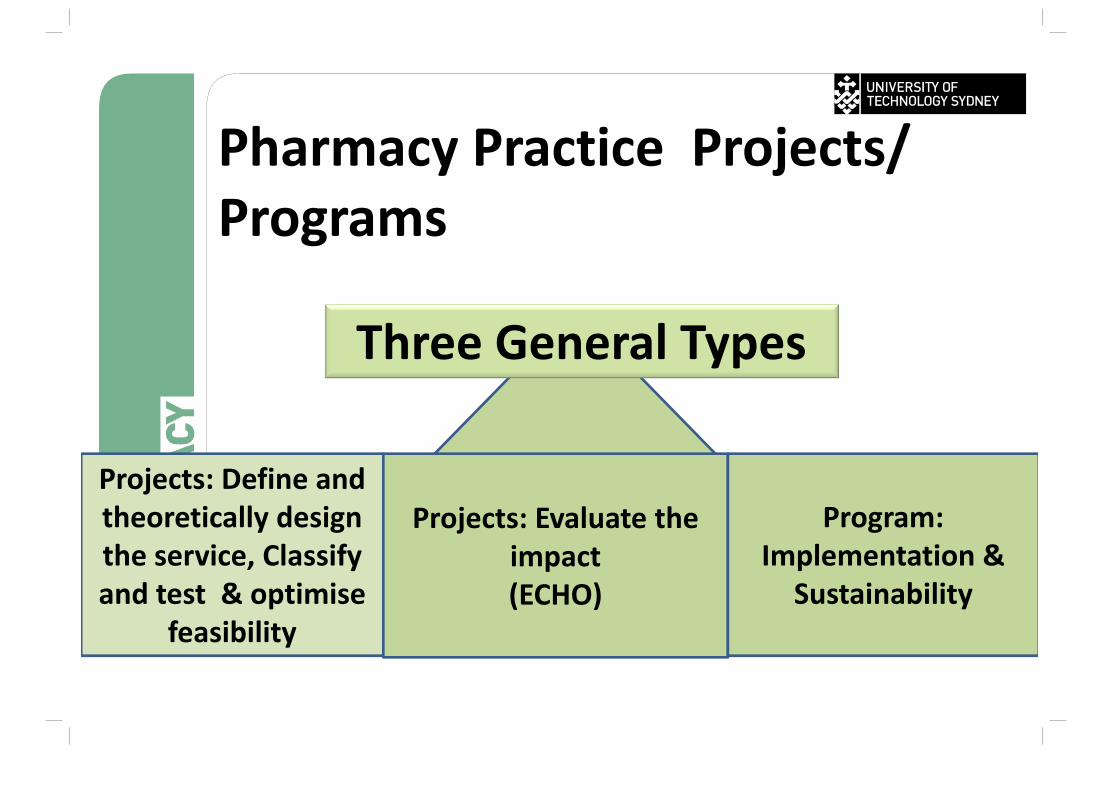
Pharmacy Practice Projects/ Programs
Three General Types
Projects: Define and theoretically design the service, Classify and test & optimise
feasibility
Projects: Evaluate the impact(ECHO)
Program: Implementation &
Sustainability
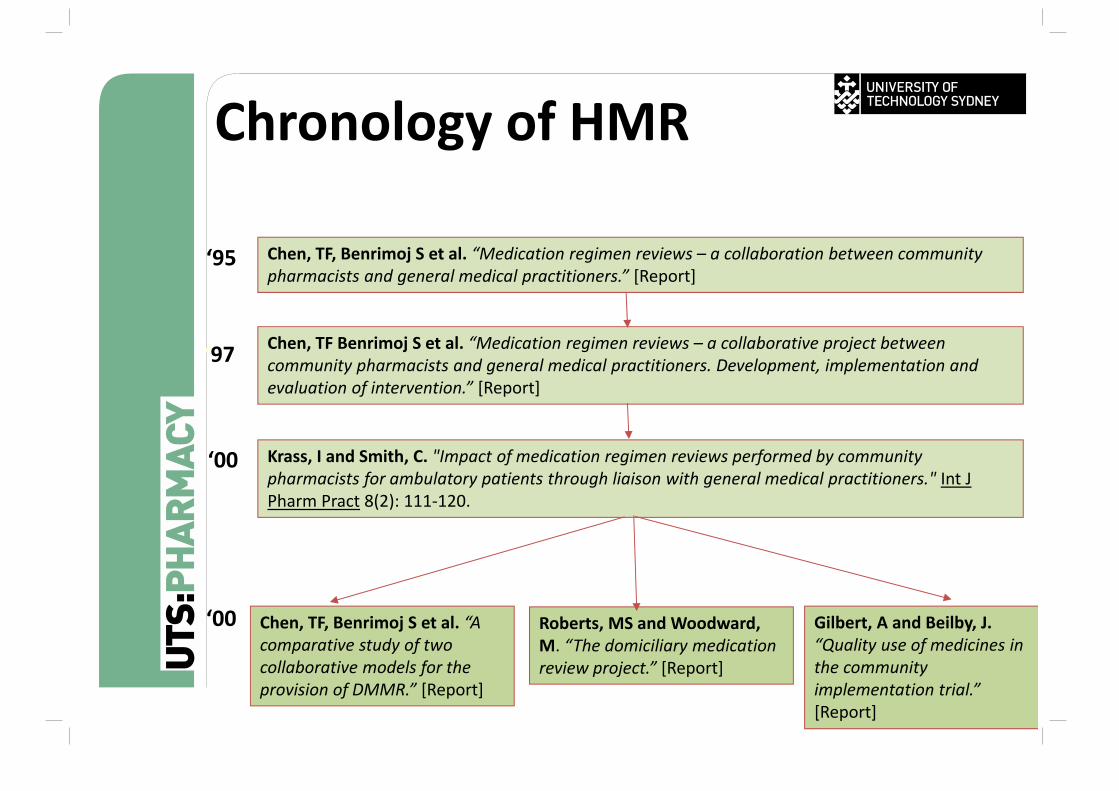
Chronology of HMR
Chen, TF, Benrimoj S et al. “Medication regimen reviews – a collaboration between community pharmacists and general medical practitioners.” [Report]
‘95
Chen, TF Benrimoj S et al. “Medication regimen reviews – a collaborative project between community pharmacists and general medical practitioners. Development, implementation and evaluation of intervention.” [Report]
‘97
Krass, I and Smith, C. "Impact of medication regimen reviews performed by community pharmacists for ambulatory patients through liaison with general medical practitioners." Int J Pharm Pract 8(2): 111‐120.
‘00
Chen, TF, Benrimoj S et al. “A comparative study of two collaborative models for the provision of DMMR.” [Report]
Roberts, MS and Woodward, M. “The domiciliary medication review project.” [Report]
Gilbert, A and Beilby, J.“Quality use of medicines in the community implementation trial.” [Report]
‘00
See also: http://beta.guild.org.au/research/
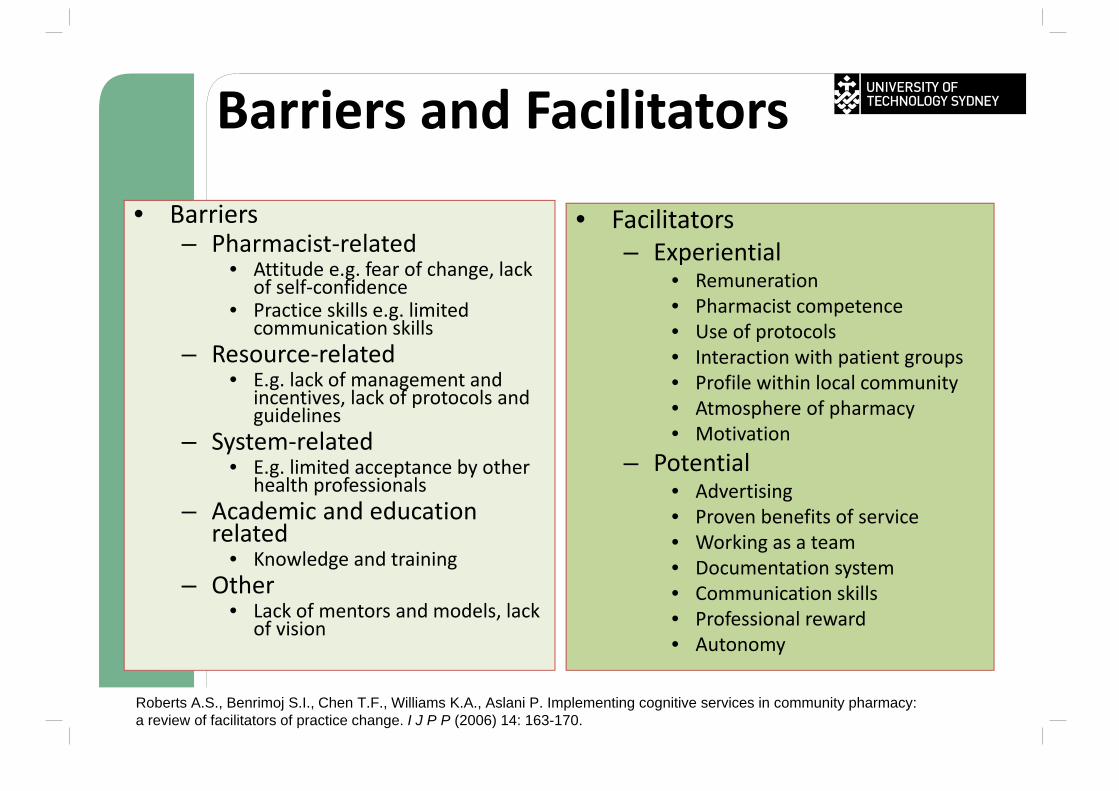
Barriers and Facilitators
• Barriers– Pharmacist‐related
• Attitude e.g. fear of change, lack of self‐confidence
• Practice skills e.g. limited communication skills
– Resource‐related• E.g. lack of management and
incentives, lack of protocols and guidelines
– System‐related• E.g. limited acceptance by other
health professionals– Academic and education
related• Knowledge and training
– Other • Lack of mentors and models, lack
of vision
• Facilitators– Experiential
• Remuneration• Pharmacist competence• Use of protocols• Interaction with patient groups• Profile within local community• Atmosphere of pharmacy• Motivation
– Potential• Advertising• Proven benefits of service• Working as a team• Documentation system• Communication skills• Professional reward• Autonomy
Roberts A.S., Benrimoj S.I., Chen T.F., Williams K.A., Aslani P. Implementing cognitive services in community pharmacy: a review of facilitators of practice change. I J P P (2006) 14: 163-170.
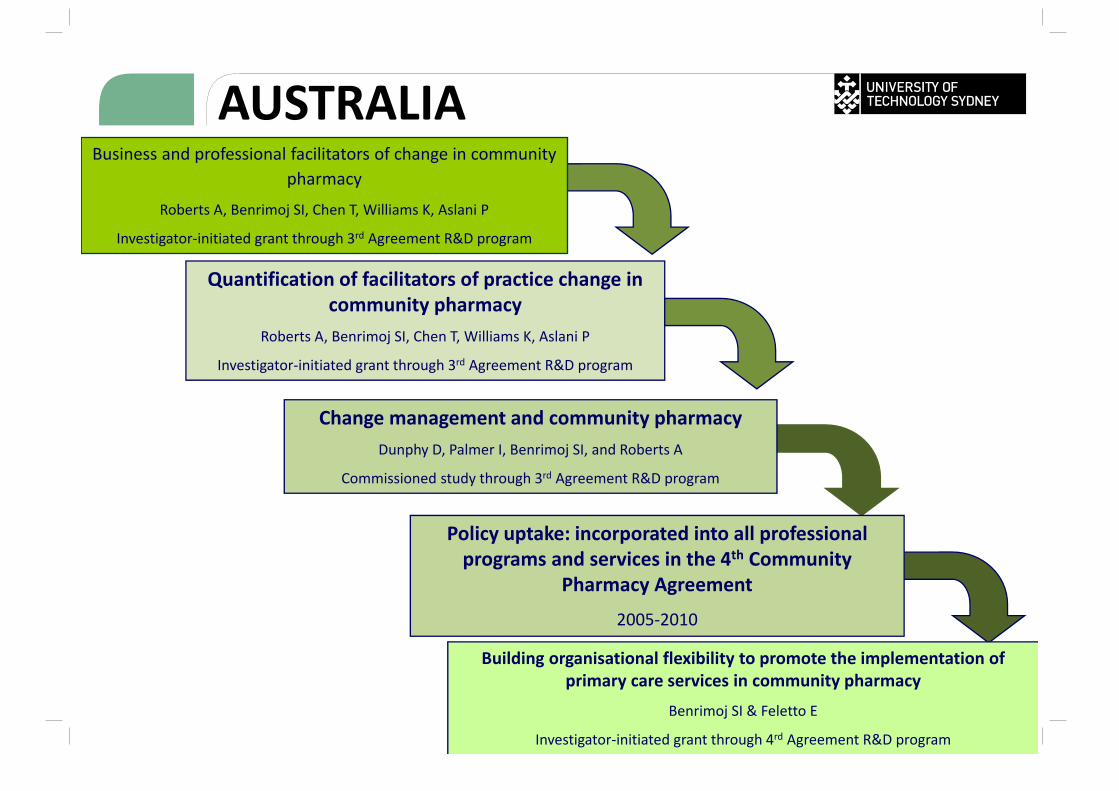
Quantification of facilitators of practice change in community pharmacy
Roberts A, Benrimoj SI, Chen T, Williams K, Aslani P
Investigator‐initiated grant through 3rd Agreement R&D program
Policy uptake: incorporated into all professional programs and services in the 4th Community
Pharmacy Agreement
2005‐2010
SOURCE17. http://beta.guild.org.au/research/funded_projects.asp
Building organisational flexibility to promote the implementation of primary care services in community pharmacy
Benrimoj SI & Feletto E
Investigator‐initiated grant through 4rd Agreement R&D program
Business and professional facilitators of change in community pharmacy
Roberts A, Benrimoj SI, Chen T, Williams K, Aslani P
Investigator‐initiated grant through 3rd Agreement R&D program
Change management and community pharmacyDunphy D, Palmer I, Benrimoj SI, and Roberts A
Commissioned study through 3rd Agreement R&D program
AUSTRALIA
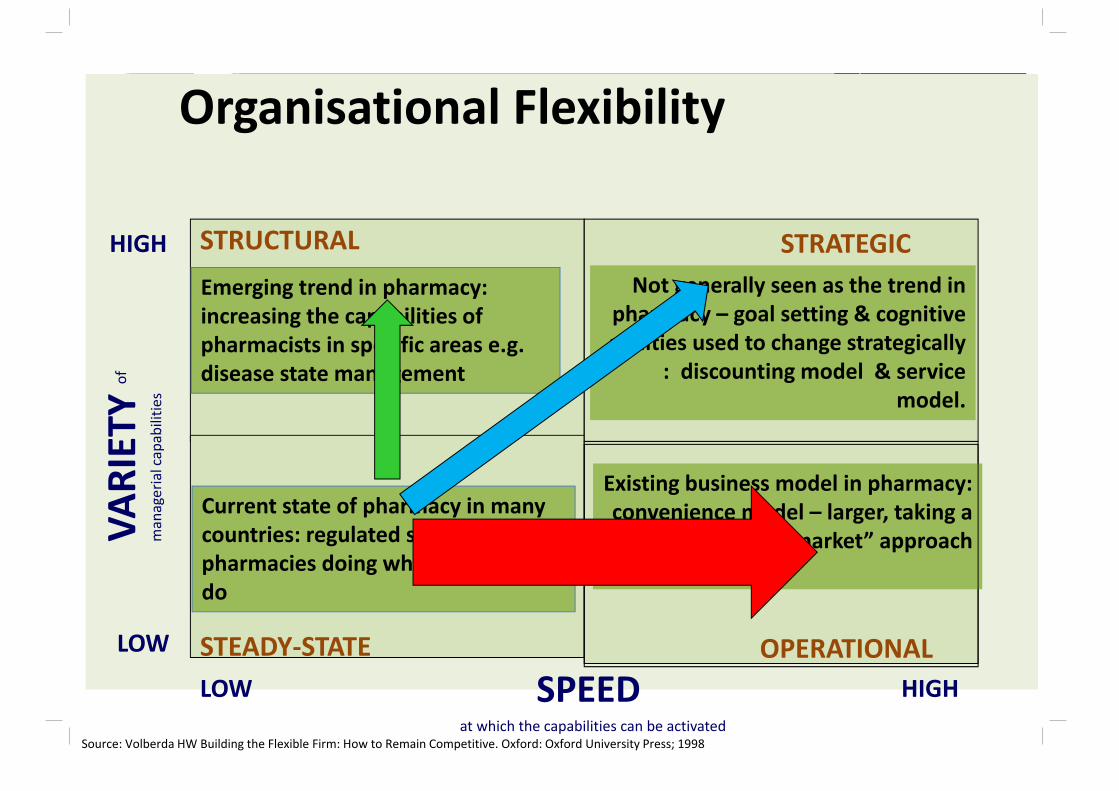
Organisational Flexibility
LOW HIGH
LOW
HIGH
SPEED at which the capabilities can be activated
VARIETY
of
managerial capabilitie
s
STRUCTURAL
STEADY‐STATE
STRATEGIC
OPERATIONAL
Source: Volberda HW Building the Flexible Firm: How to Remain Competitive. Oxford: Oxford University Press; 1998
Current state of pharmacy in many countries: regulated system, pharmacies doing what they always do
Emerging trend in pharmacy: increasing the capabilities of pharmacists in specific areas e.g. disease state management
Not generally seen as the trend in pharmacy – goal setting & cognitive abilities used to change strategically
: discounting model & service model.
Existing business model in pharmacy: convenience model – larger, taking a
“supermarket” approach
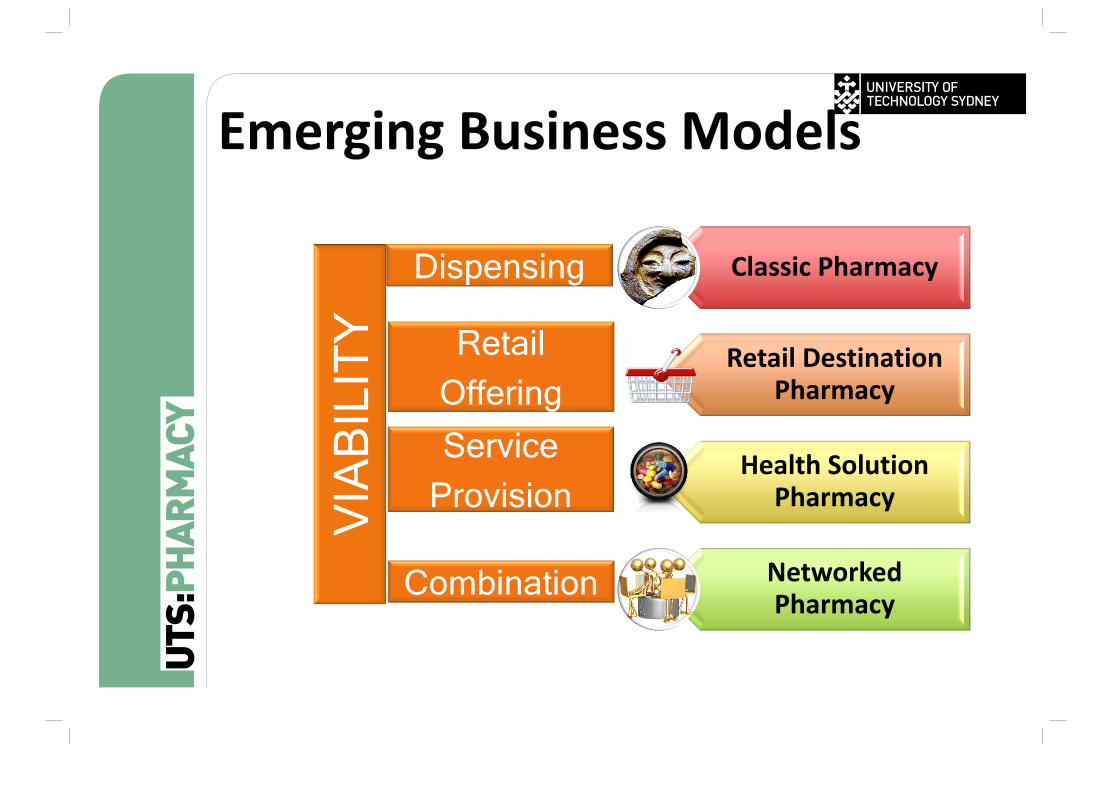
Classic Pharmacy
Retail Destination Pharmacy
Health Solution Pharmacy
NetworkedPharmacy
Dispensing
Retail Offering
Service Provision
Combination
VIA
BIL
ITY
Emerging Business Models
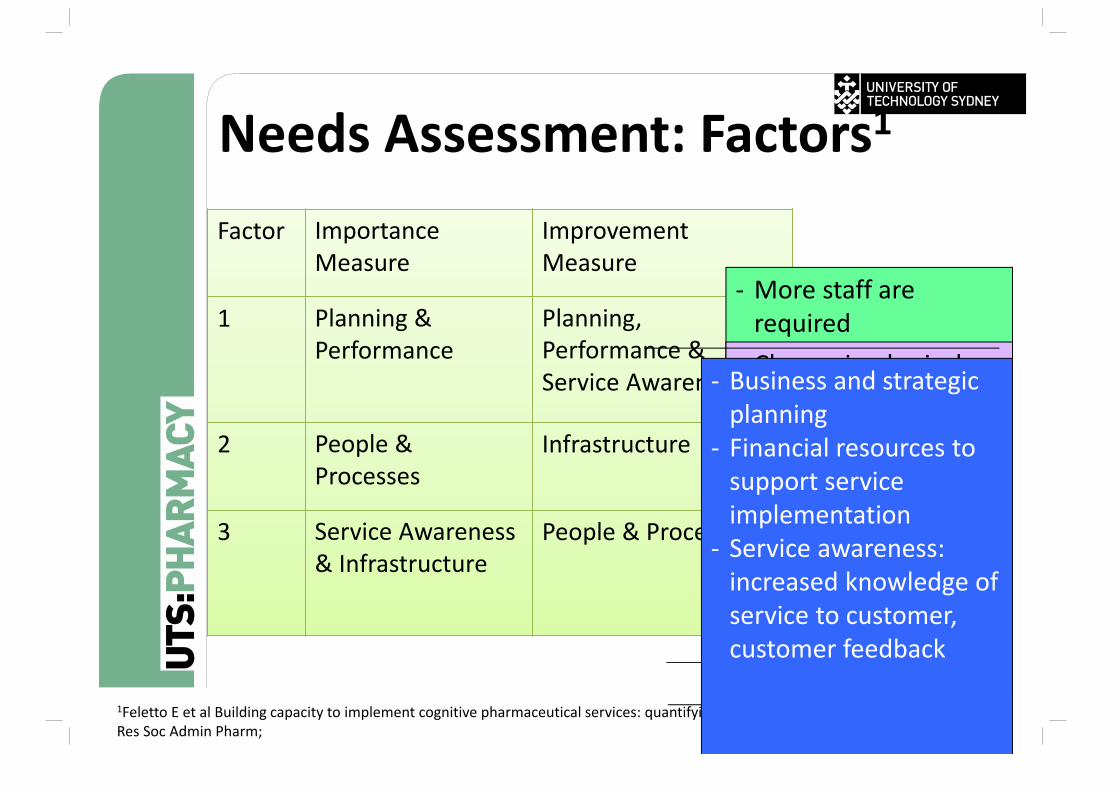
Needs Assessment: Factors1
Factor Importance Measure
Improvement Measure
1 Planning & Performance
Planning, Performance & Service Awareness
2 People & Processes
Infrastructure
3 Service Awareness & Infrastructure
People & Processes
‐ More staff are required
‐ Staff with specialized knowledge
‐ Define operational process to guide the provision of services
‐ Change in physical layout for service provision
‐ Aid in increasing the customer awareness of services available
1Feletto E et al Building capacity to implement cognitive pharmaceutical services: quantifying the needs of community pharmacies Res Soc Admin Pharm;
‐ Business and strategic planning
‐ Financial resources to support service implementation
‐ Service awareness: increased knowledge of service to customer, customer feedback
Remuneration to individuals
• Direct employee providing services• Professional Service Managers (industry, pharmacy groups and individual pharmacies)
• Consultant pharmacist• Specialisations based on Setting ( e.g. nursing homes, hospital, community)
Community Pharmacy EconomicDrivers
• PBS Reform • Accelerated Price Reductions and Disclosure• Generic substitution• Changing remuneration systems• Discount models• Medicare local reform (local purchasing)
• Wholesaler• Direct Distribution• Reduction on wholesalers trading terms
• Community Pharmacy Agreements• Shift from product based to service based
• Retail Trade trends
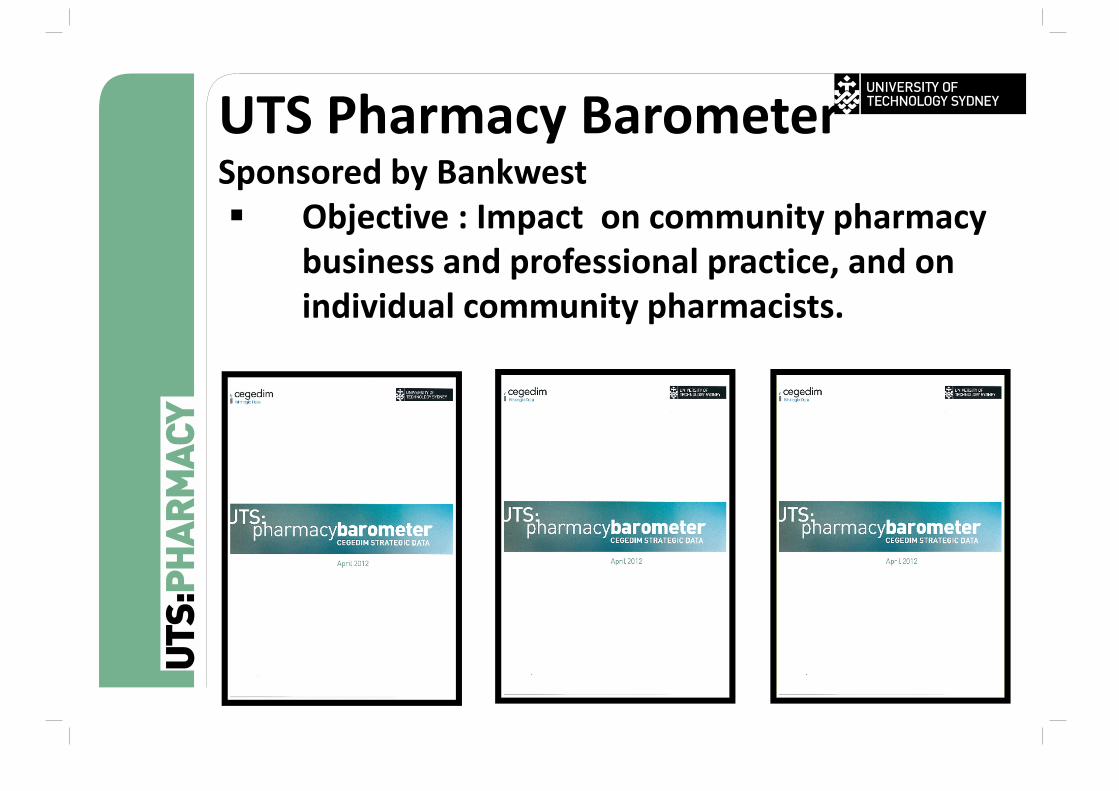
UTS Pharmacy BarometerSponsored by Bankwest Objective : Impact on community pharmacy
business and professional practice, and on individual community pharmacists.
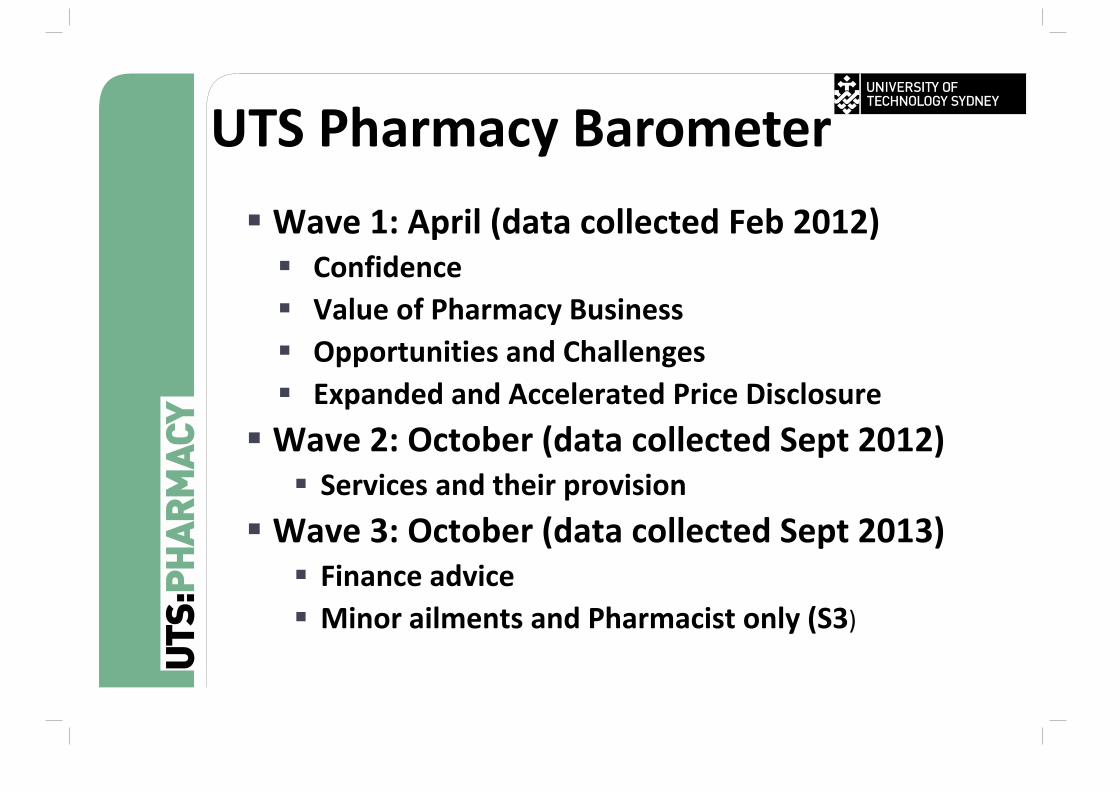
Wave 1: April (data collected Feb 2012) Confidence Value of Pharmacy Business Opportunities and Challenges Expanded and Accelerated Price Disclosure Wave 2: October (data collected Sept 2012) Services and their provision
Wave 3: October (data collected Sept 2013) Finance advice Minor ailments and Pharmacist only (S3)
UTS Pharmacy Barometer
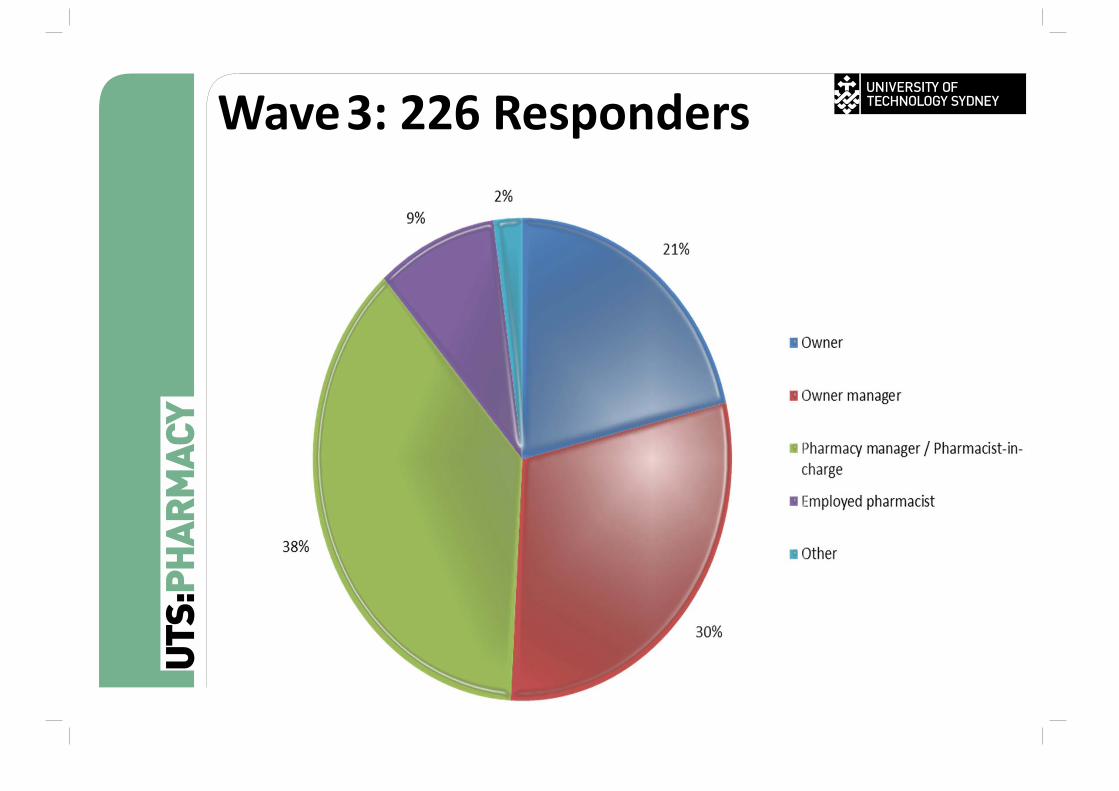
Wave3: 226 Responders
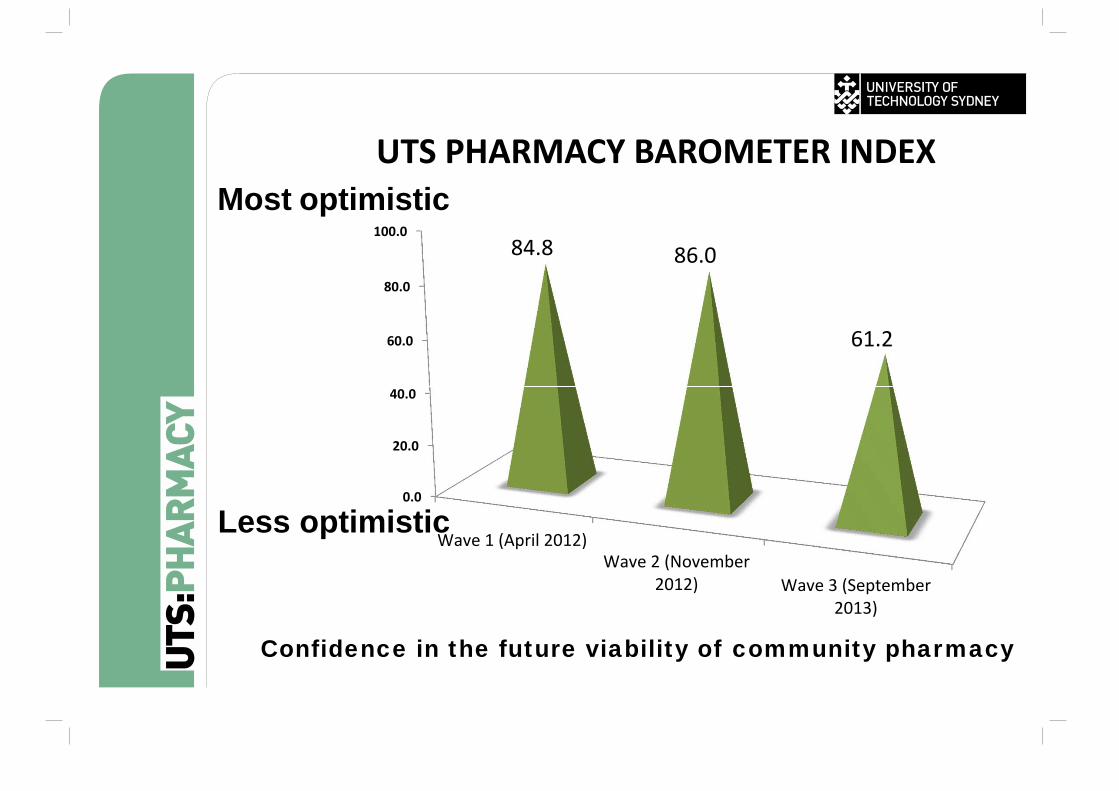
Confidence in the future viability of community pharmacy
0.0
20.0
40.0
60.0
80.0
100.0
Wave 1 (April 2012)Wave 2 (November
2012) Wave 3 (September2013)
84.8 86.0
61.2
UTS PHARMACY BAROMETER INDEXMost optimistic
Less optimistic
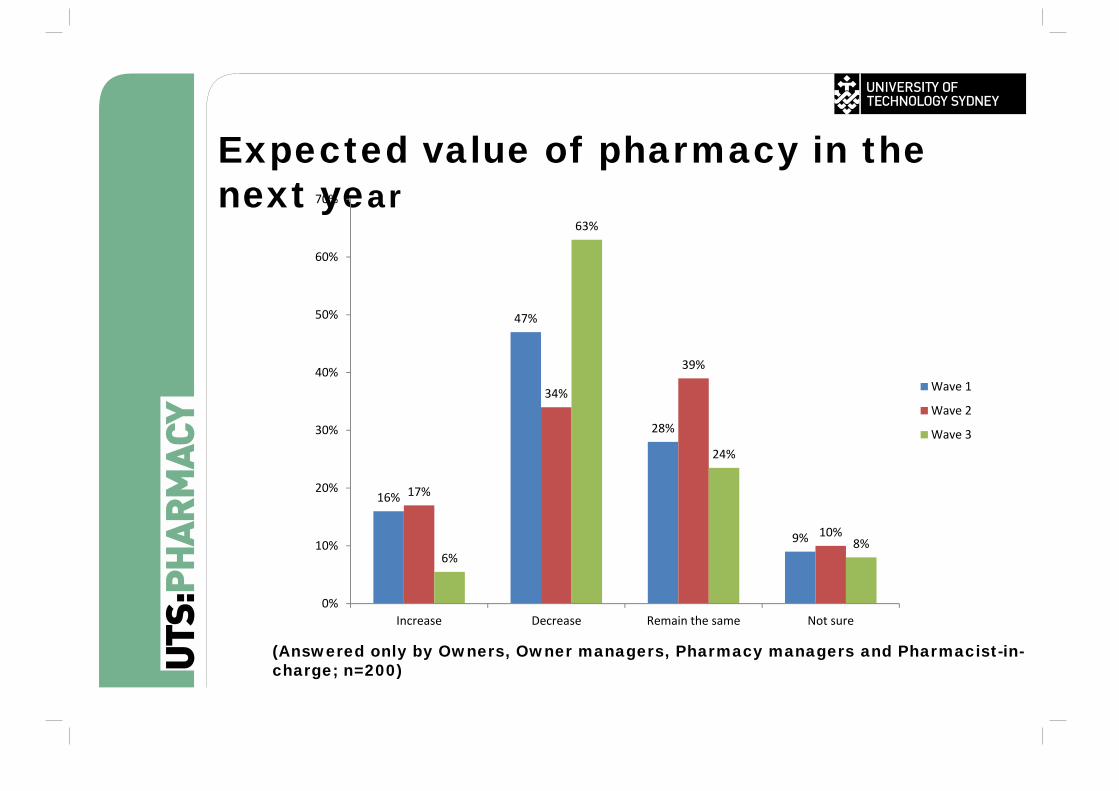
Expected value of pharmacy in the next year
16%
47%
28%
9%
17%
34%
39%
10%
6%
63%
24%
8%
0%
10%
20%
30%
40%
50%
60%
70%
Increase Decrease Remain the same Not sure
Wave 1
Wave 2
Wave 3
(Answered only by Owners, Owner managers, Pharmacy managers and Pharmacist-in-charge; n=200)
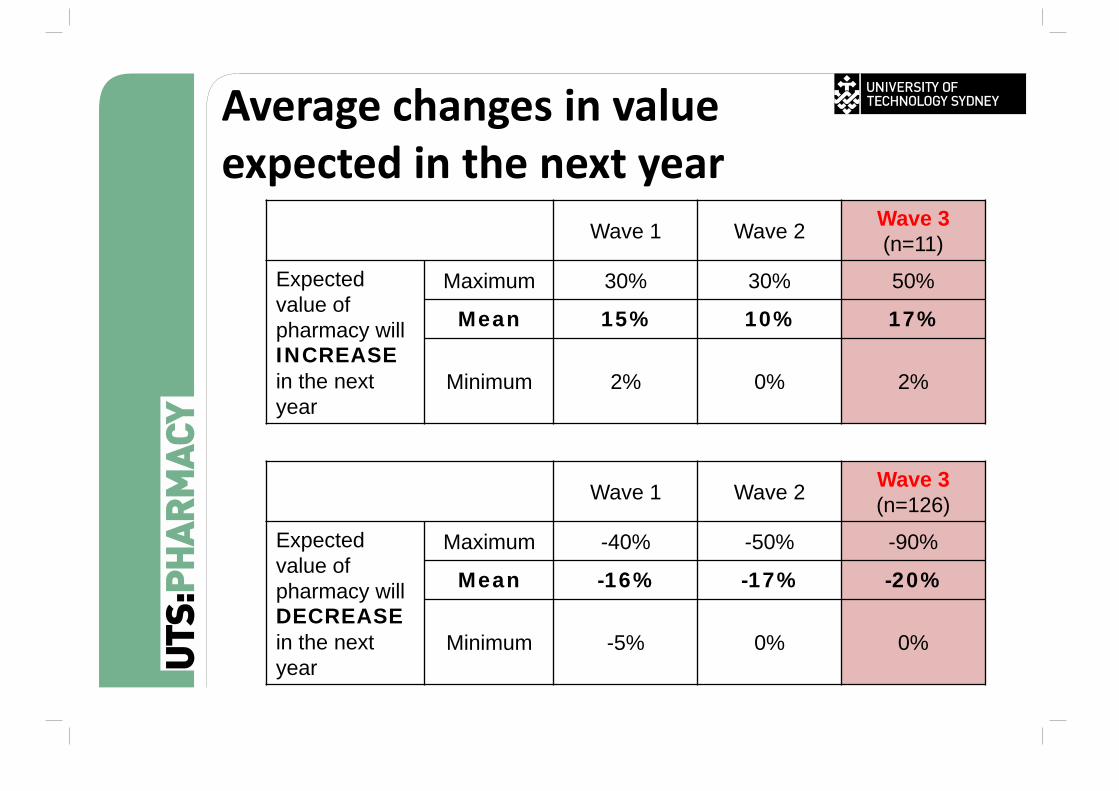
Average changes in valueexpected in the next year
Wave 1 Wave 2 Wave 3 (n=11)
Expected value of pharmacy will INCREASEin the next year
Maximum 30% 30% 50%
Mean 15% 10% 17%
Minimum 2% 0% 2%
Wave 1 Wave 2 Wave 3 (n=126)
Expected value of pharmacy will DECREASEin the next year
Maximum -40% -50% -90%
Mean -16% -17% -20%
Minimum -5% 0% 0%
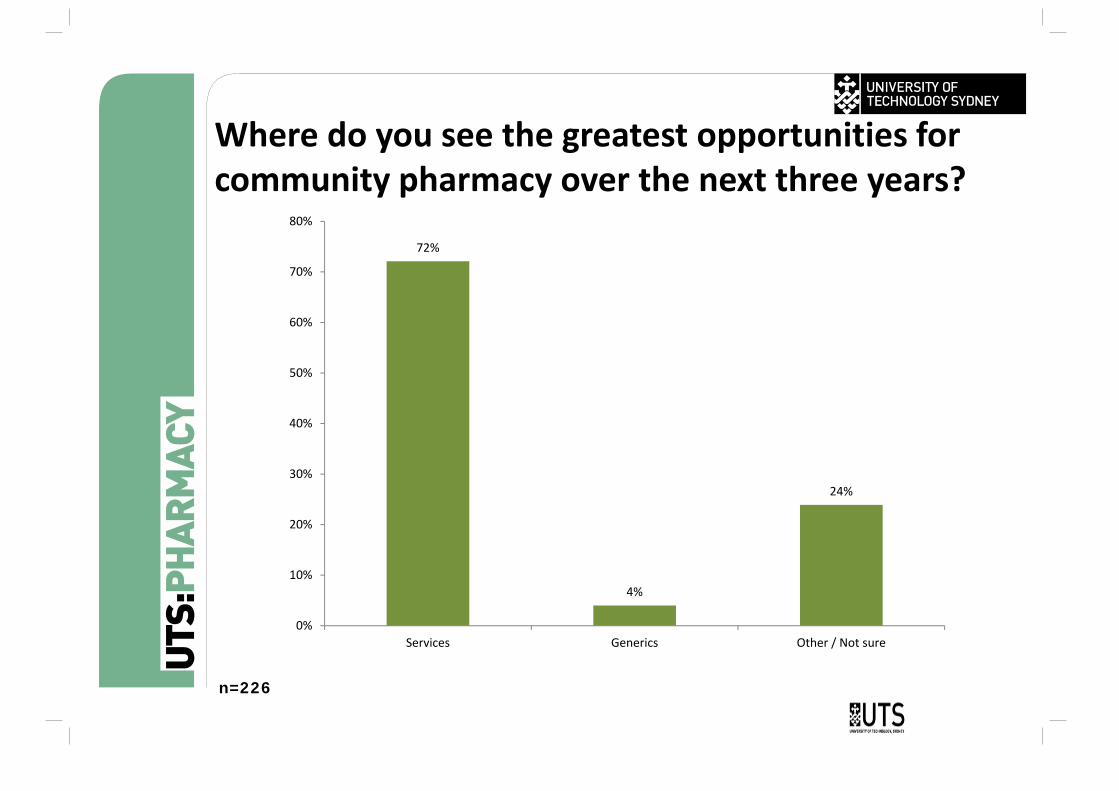
Where do you see the greatest opportunities for community pharmacy over the next three years?
n=226
72%
4%
24%
0%
10%
20%
30%
40%
50%
60%
70%
80%
Services Generics Other / Not sure
27
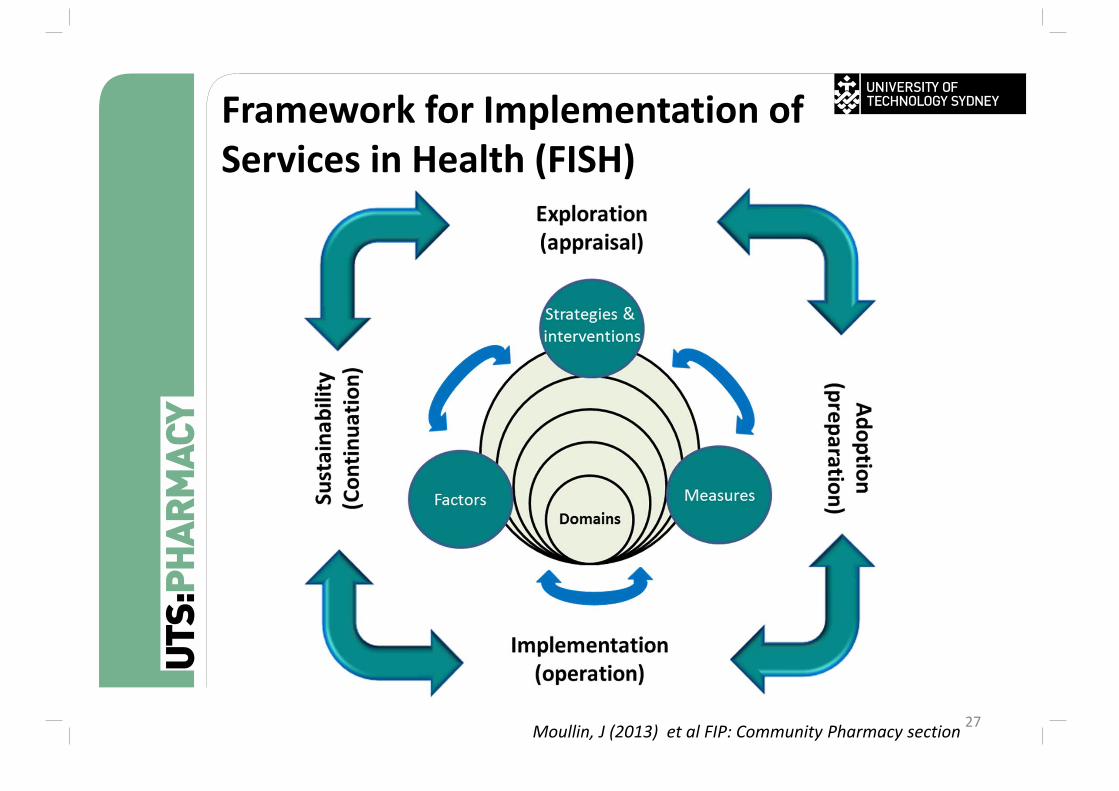
Framework for Implementation of Services in Health (FISH)
Moullin, J (2013) et al FIP: Community Pharmacy section
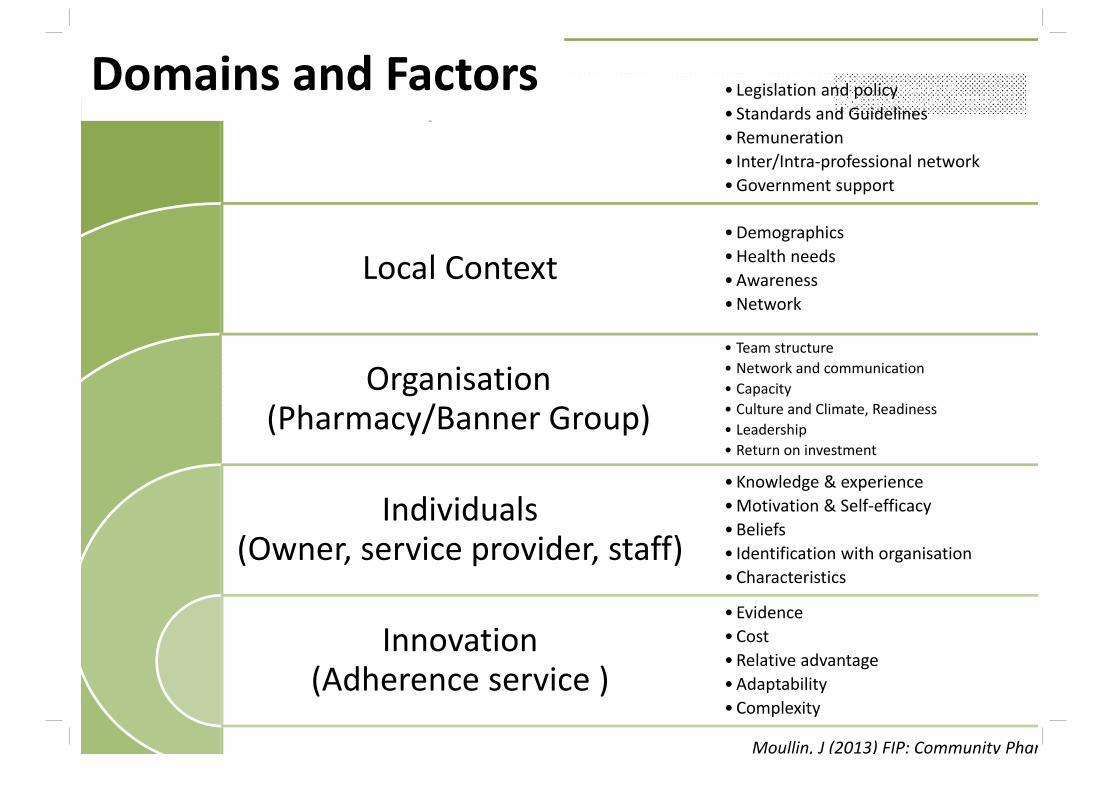
System
Local Context
Organisation (Pharmacy/Banner Group)
Individuals (Owner, service provider, staff)
Innovation (Adherence service )
• Legislation and policy• Standards and Guidelines•Remuneration• Inter/Intra‐professional network•Government support
•Demographics•Health needs•Awareness•Network
• Team structure• Network and communication• Capacity• Culture and Climate, Readiness• Leadership• Return on investment
• Knowledge & experience•Motivation & Self‐efficacy•Beliefs• Identification with organisation•Characteristics
• Evidence•Cost•Relative advantage•Adaptability• Complexity
Domains and Factors
Moullin, J (2013) FIP: Community Phar
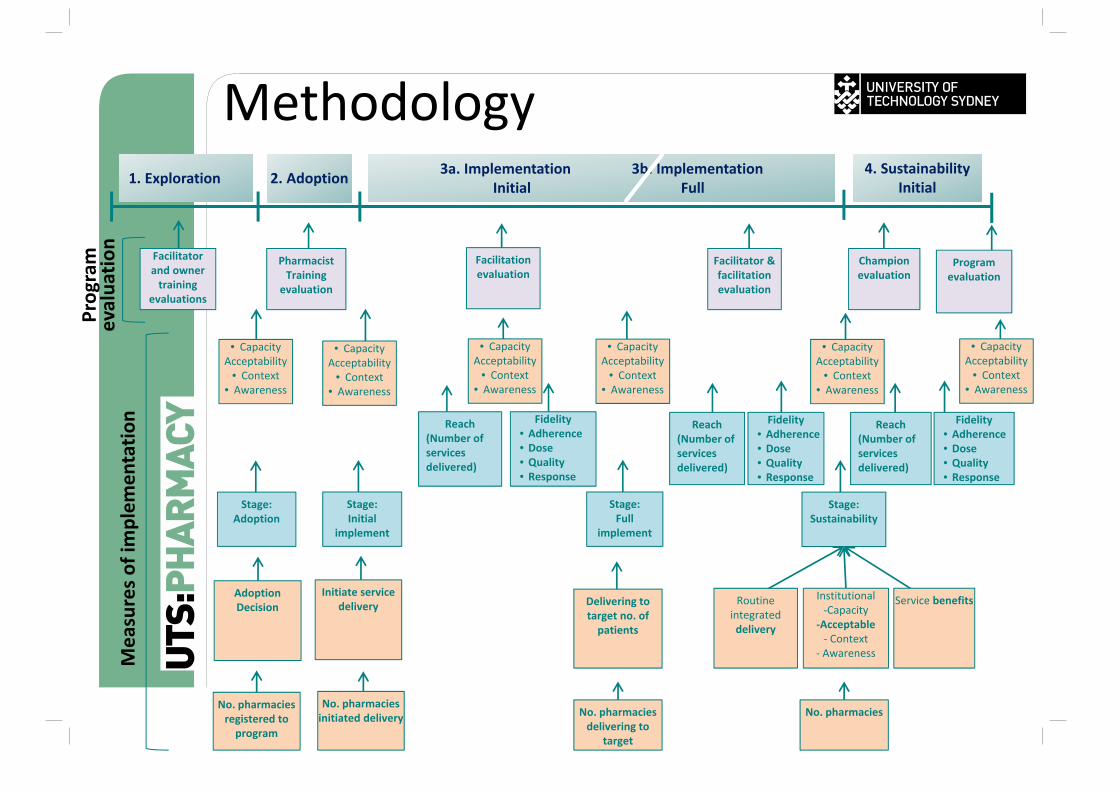
Methodology
Stage: Adoption
Stage: Initial
implement
Stage:Sustainability
Stage:Full
implement
Delivering to target no. of patients
Routine integrated delivery
Institutional‐Capacity
‐Acceptable‐ Context
‐ Awareness
Service benefitsInitiate service
deliveryAdoption Decision
No. pharmacies registered to program
No. pharmacies initiated delivery No. pharmacies
delivering to target
No. pharmacies
1. Exploration 2. Adoption 3a. Implementation 3b. ImplementationInitial Full
4. SustainabilityInitial
Reach(Number of services delivered)
Fidelity• Adherence• Dose• Quality• Response
Reach(Number of services delivered)
Fidelity• Adherence• Dose• Quality• Response
Reach(Number of services delivered)
Fidelity• Adherence• Dose• Quality• Response
Facilitator and owner training
evaluations
Pharmacist Training
evaluation
Facilitation evaluation
Champion evaluation
Program evaluation
Program
evalua
tion
Measures o
f implem
entatio
n
Facilitator & facilitation evaluation
• CapacityAcceptability
• Context• Awareness
• CapacityAcceptability
• Context• Awareness
• CapacityAcceptability
• Context• Awareness
• CapacityAcceptability
• Context• Awareness
• CapacityAcceptability
• Context• Awareness
• CapacityAcceptability
• Context• Awareness
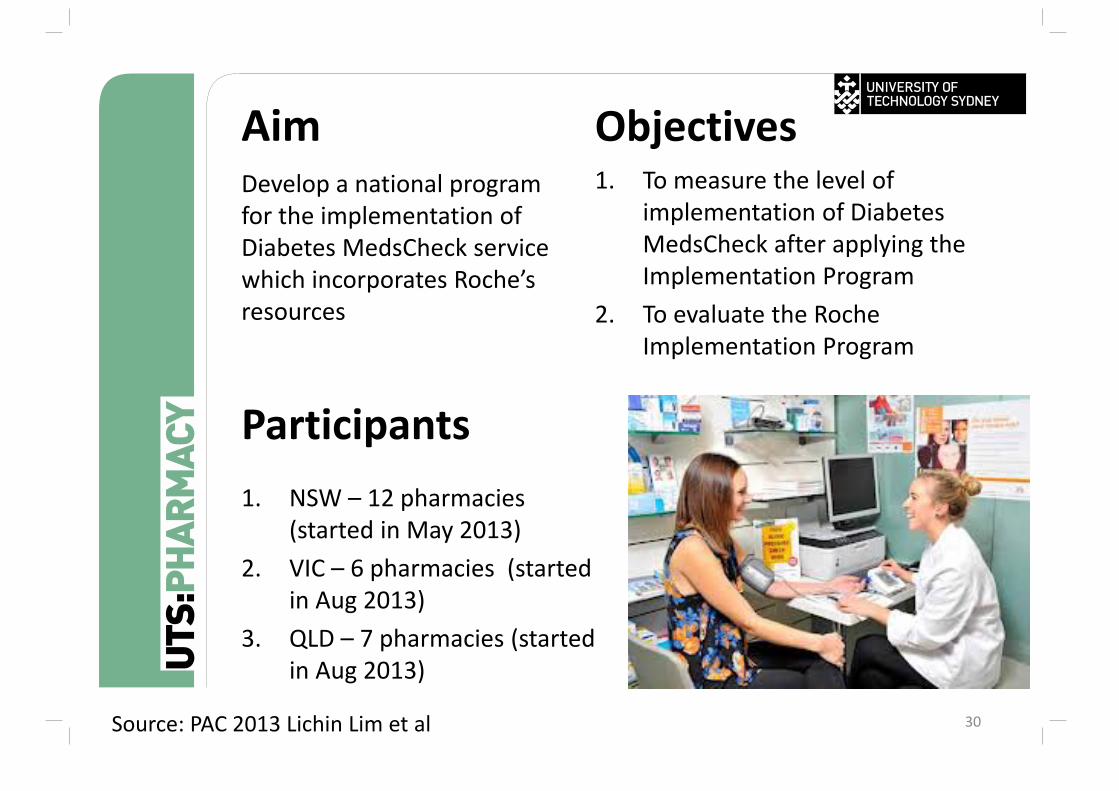
AimDevelop a national program for the implementation of Diabetes MedsCheck service which incorporates Roche’s resources
30
Objectives1. To measure the level of
implementation of Diabetes MedsCheck after applying the Implementation Program
2. To evaluate the Roche Implementation Program
Participants1. NSW – 12 pharmacies
(started in May 2013)2. VIC – 6 pharmacies (started
in Aug 2013)3. QLD – 7 pharmacies (started
in Aug 2013)
Source: PAC 2013 Lichin Lim et al
31
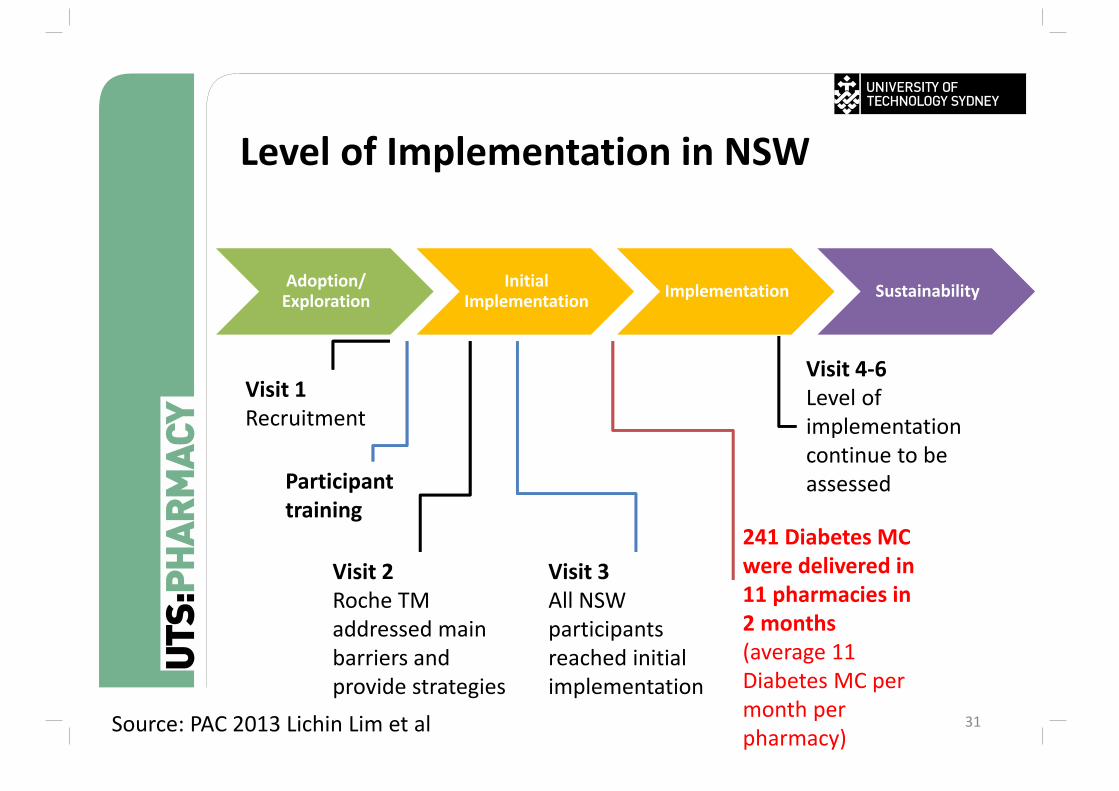
Adoption/ Exploration
Initial Implementation Implementation Sustainability
Level of Implementation in NSW
Visit 3All NSW participants reached initial implementation
Visit 4‐6 Level of implementation continue to be assessed
Visit 1Recruitment
Visit 2Roche TM addressed main barriers and provide strategies
Participant training
241 Diabetes MC were delivered in 11 pharmacies in 2 months (average 11 Diabetes MC per month per pharmacy)Source: PAC 2013 Lichin Lim et al
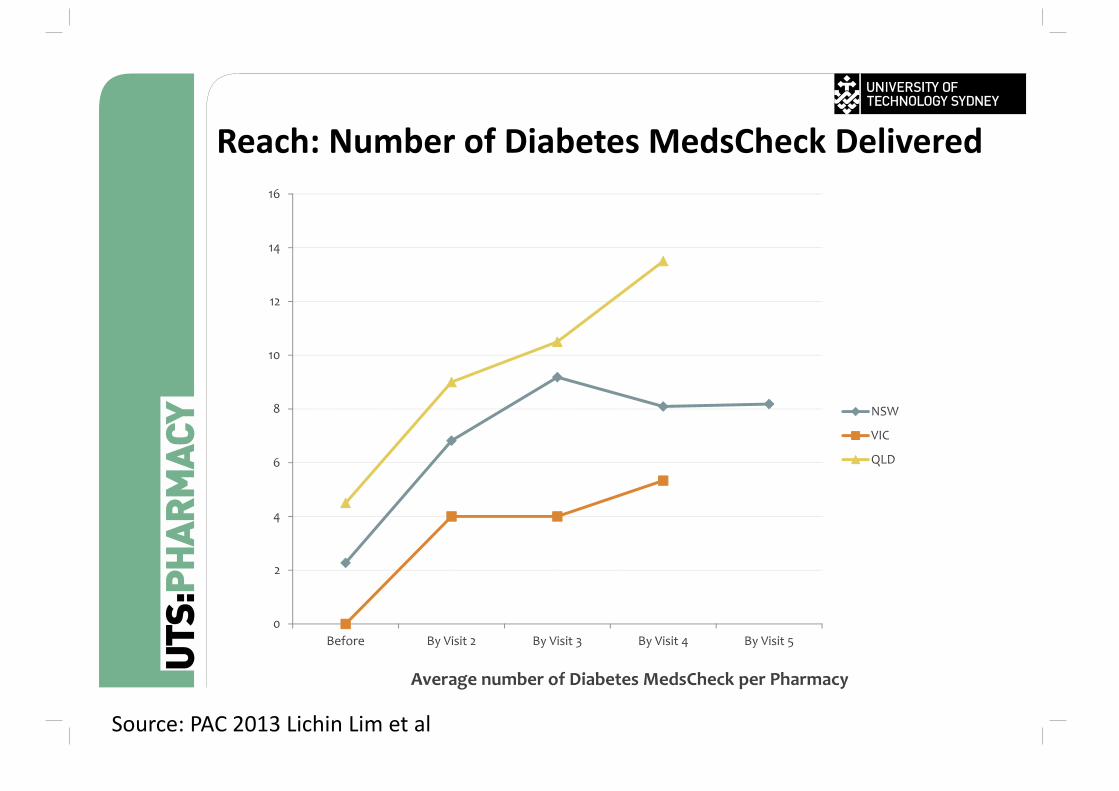
Reach: Number of Diabetes MedsCheck Delivered
0
2
4
6
8
10
12
14
16
Before By Visit 2 By Visit 3 By Visit 4 By Visit 5
Average number of Diabetes MedsCheck per Pharmacy
NSW
VIC
QLD
Source: PAC 2013 Lichin Lim et al
33
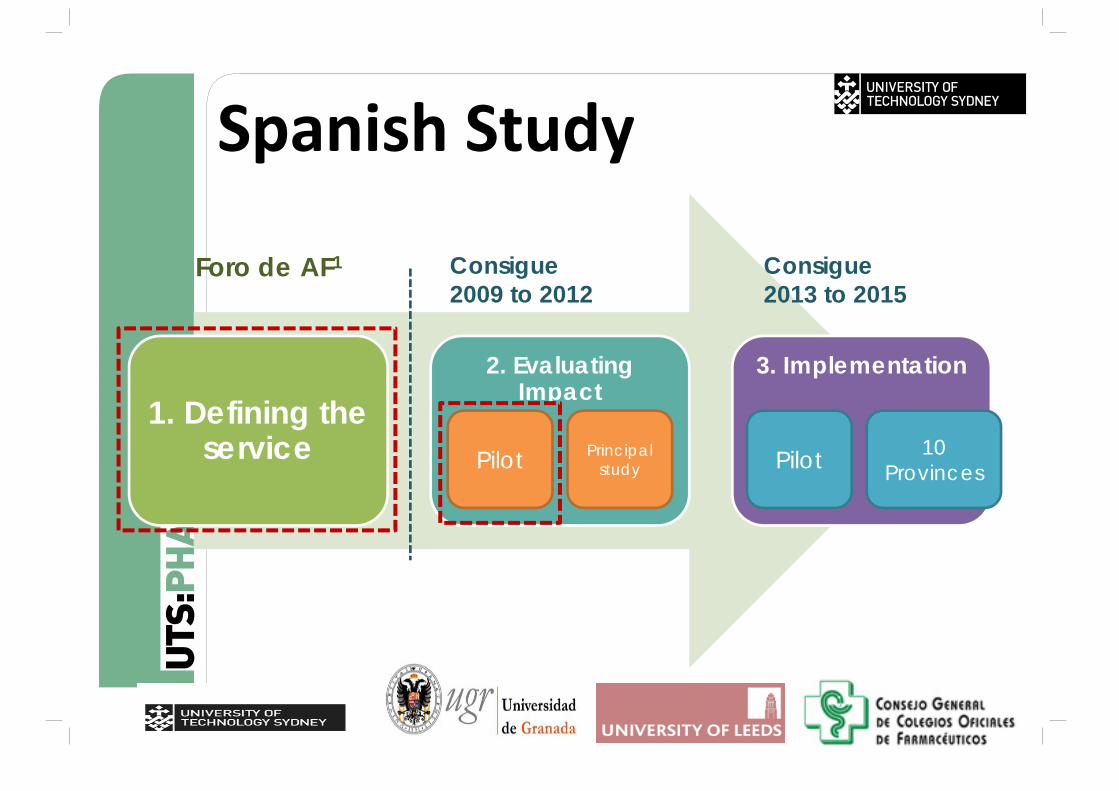
Spanish Study
1. Defining the service
2. Evaluating Impact
3. Implementation
Pilot Principal study Pilot 10
Provinces
Foro de AF1 Consigue2009 to 2012
Introducción
Consigue2013 to 2015
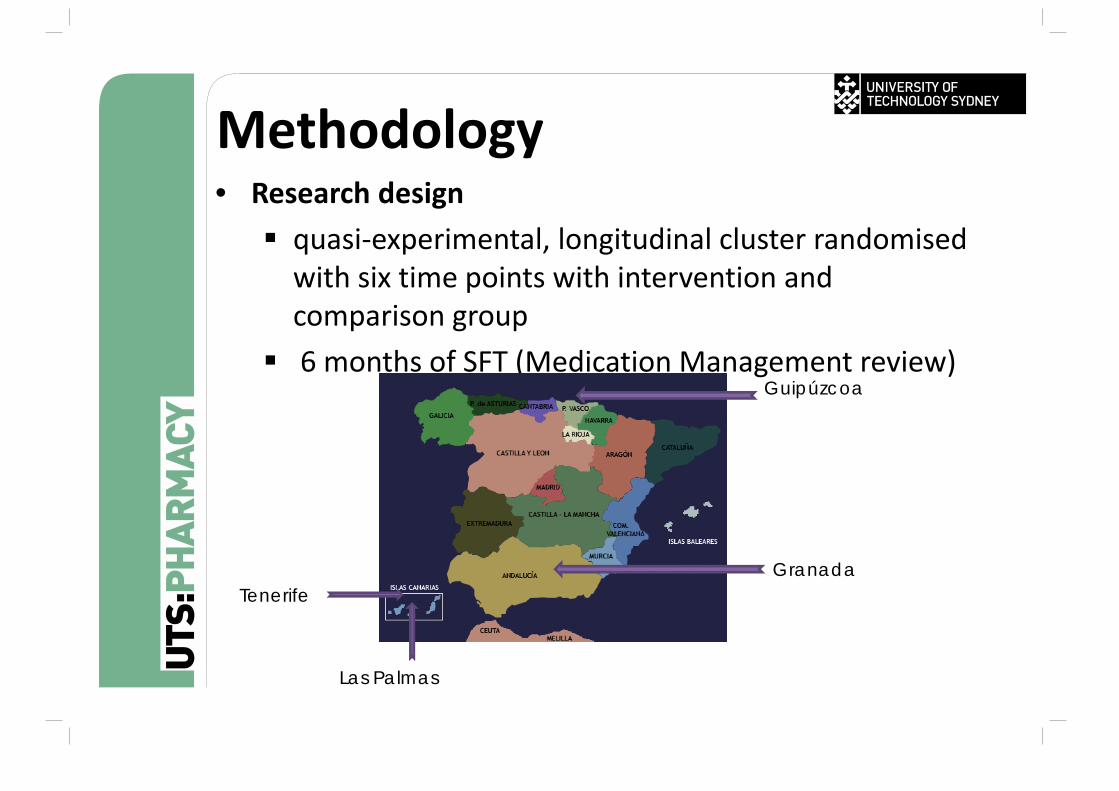
Methodology • Research design quasi‐experimental, longitudinal cluster randomised with six time points with intervention and comparison group
6 months of SFT (Medication Management review)
Granada
Las Palmas
Tenerife
Guipúzcoa
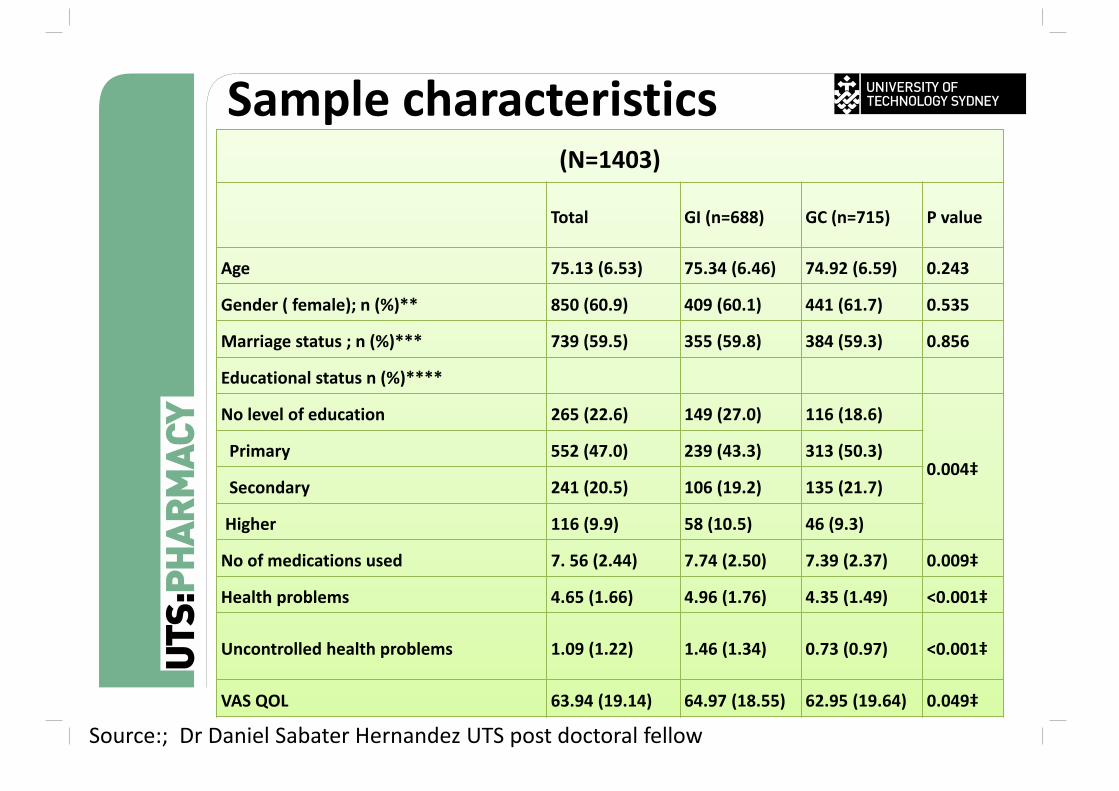
Sample characteristics(N=1403)
Total GI (n=688) GC (n=715) P value
Age 75.13 (6.53) 75.34 (6.46) 74.92 (6.59) 0.243
Gender ( female); n (%)** 850 (60.9) 409 (60.1) 441 (61.7) 0.535
Marriage status ; n (%)*** 739 (59.5) 355 (59.8) 384 (59.3) 0.856
Educational status n (%)****
No level of education 265 (22.6) 149 (27.0) 116 (18.6)
0.004‡Primary 552 (47.0) 239 (43.3) 313 (50.3)
Secondary 241 (20.5) 106 (19.2) 135 (21.7)
Higher 116 (9.9) 58 (10.5) 46 (9.3)
No of medications used 7. 56 (2.44) 7.74 (2.50) 7.39 (2.37) 0.009‡
Health problems 4.65 (1.66) 4.96 (1.76) 4.35 (1.49) <0.001‡
Uncontrolled health problems 1.09 (1.22) 1.46 (1.34) 0.73 (0.97) <0.001‡
VAS QOL 63.94 (19.14) 64.97 (18.55) 62.95 (19.64) 0.049‡
Source:; Dr Daniel Sabater Hernandez UTS post doctoral fellow
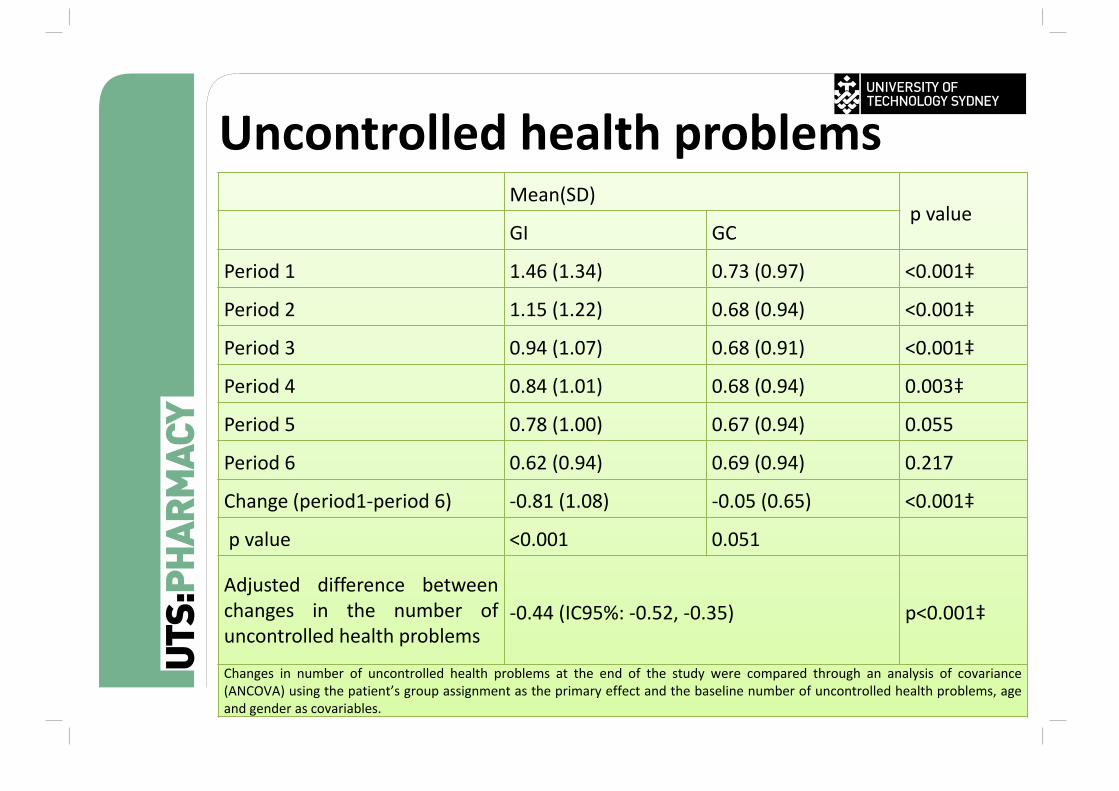
Uncontrolled health problemsMean(SD)
p valueGI GC
Period 1 1.46 (1.34) 0.73 (0.97) <0.001‡
Period 2 1.15 (1.22) 0.68 (0.94) <0.001‡
Period 3 0.94 (1.07) 0.68 (0.91) <0.001‡
Period 4 0.84 (1.01) 0.68 (0.94) 0.003‡
Period 5 0.78 (1.00) 0.67 (0.94) 0.055
Period 6 0.62 (0.94) 0.69 (0.94) 0.217
Change (period1‐period 6) ‐0.81 (1.08) ‐0.05 (0.65) <0.001‡
p value <0.001 0.051
Adjusted difference betweenchanges in the number ofuncontrolled health problems
‐0.44 (IC95%: ‐0.52, ‐0.35) p<0.001‡
Changes in number of uncontrolled health problems at the end of the study were compared through an analysis of covariance(ANCOVA) using the patient’s group assignment as the primary effect and the baseline number of uncontrolled health problems, ageand gender as covariables.
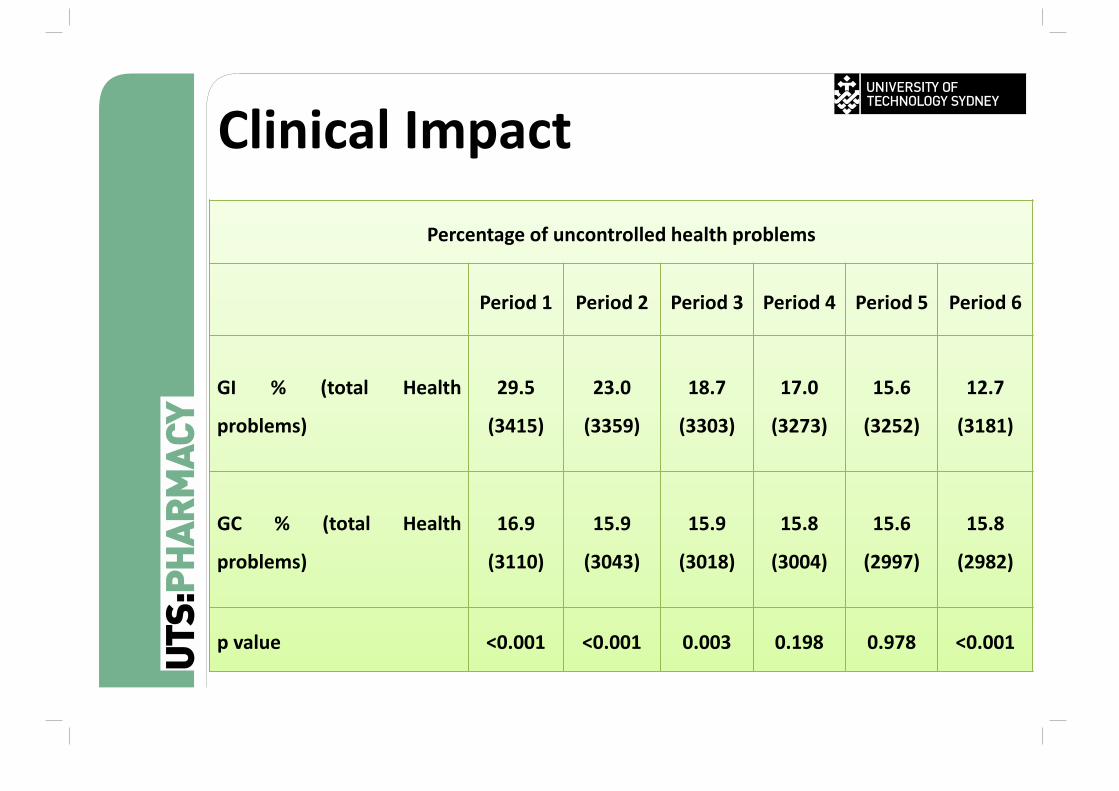
Clinical Impact
Percentage of uncontrolled health problems
Period 1 Period 2 Period 3 Period 4 Period 5 Period 6
GI % (total Health
problems)
29.5
(3415)
23.0
(3359)
18.7
(3303)
17.0
(3273)
15.6
(3252)
12.7
(3181)
GC % (total Health
problems)
16.9
(3110)
15.9
(3043)
15.9
(3018)
15.8
(3004)
15.6
(2997)
15.8
(2982)
p value <0.001 <0.001 0.003 0.198 0.978 <0.001
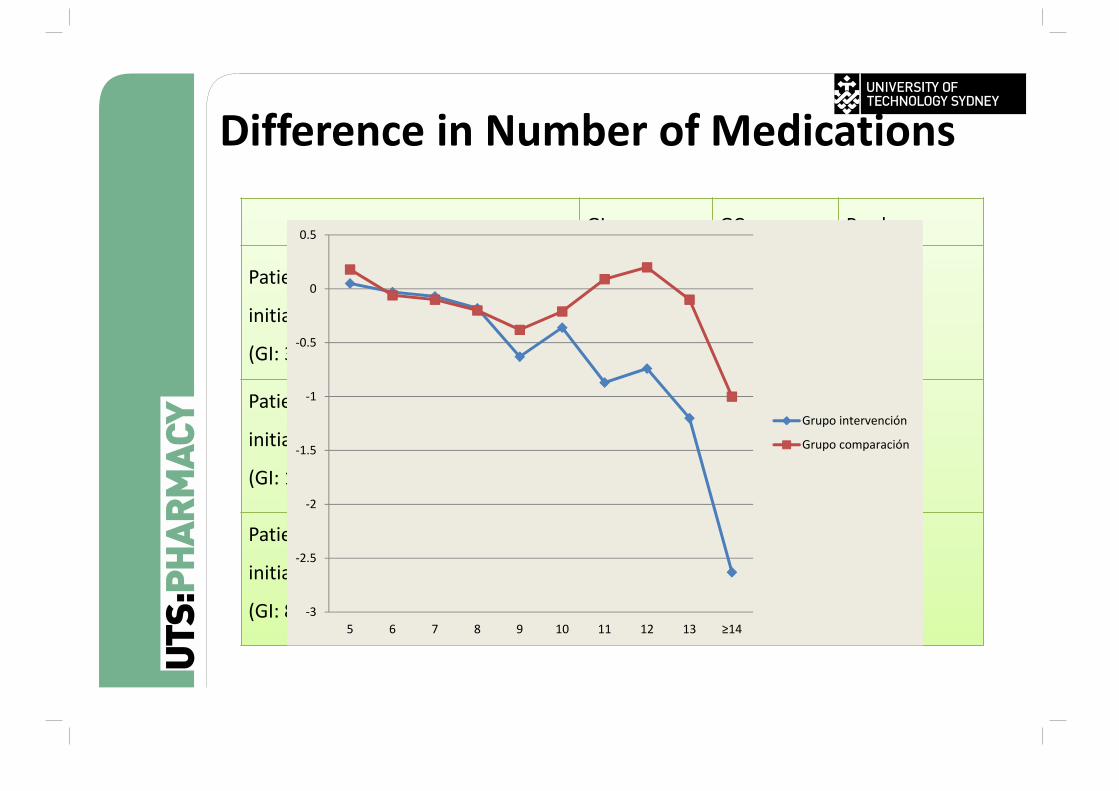
Difference in Number of Medications
GI GC P value
Patients using 5 to 7 medications
initially; mean (SD)
(GI: 369 vs. GC: 435)
‐0.02 (0.91) 0.01 (0.82) 0.649
Patients using 8 to 10 medications
initially; mean (SD)
(GI: 189 vs. GC: 189)‐0.36 (1.29) ‐0.25 (1.08) 0.378
Patients using 5 to 7 medications
initially; mean (SD)
(GI: 88 vs. GC: 63)‐1.20 (1.81) ‐0.19 (1.39) <0.001‡
‐3
‐2.5
‐2
‐1.5
‐1
‐0.5
0
0.5
5 6 7 8 9 10 11 12 13 ≥14
Grupo intervención
Grupo comparación
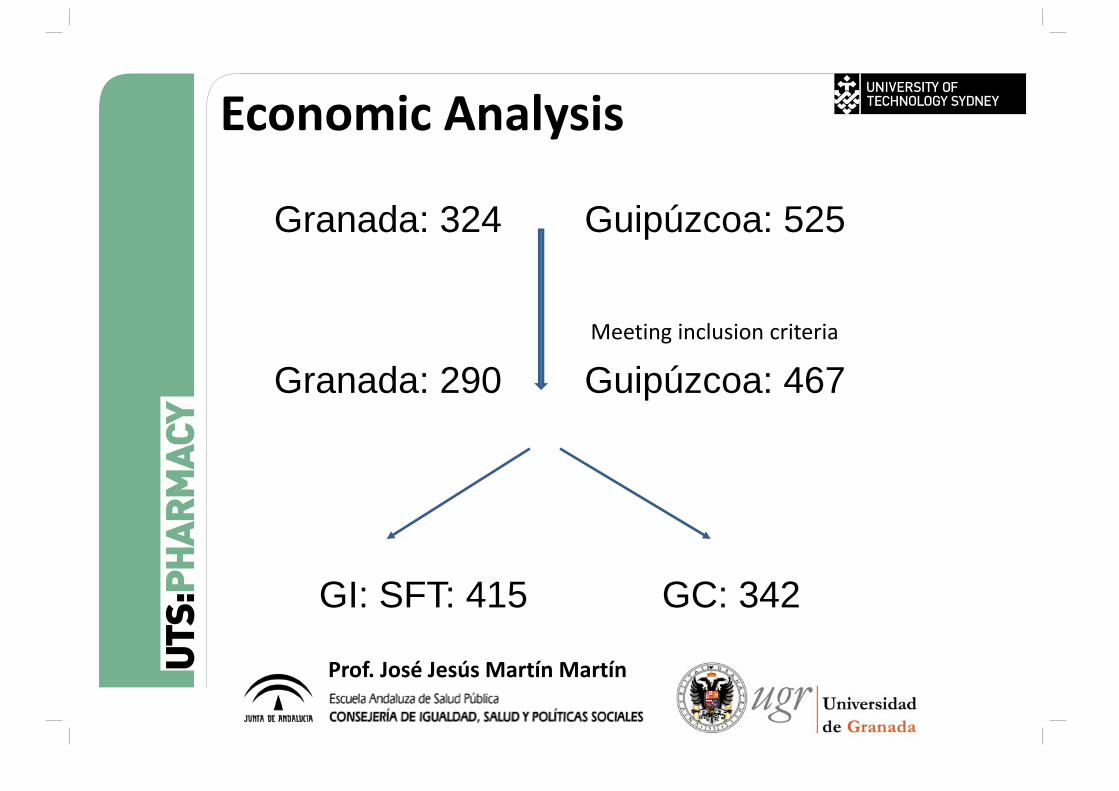
Granada: 324 Guipúzcoa: 525
Meeting inclusion criteria
Granada: 290 Guipúzcoa: 467
GI: SFT: 415 GC: 342
Economic Analysis
Prof. José Jesús Martín Martín
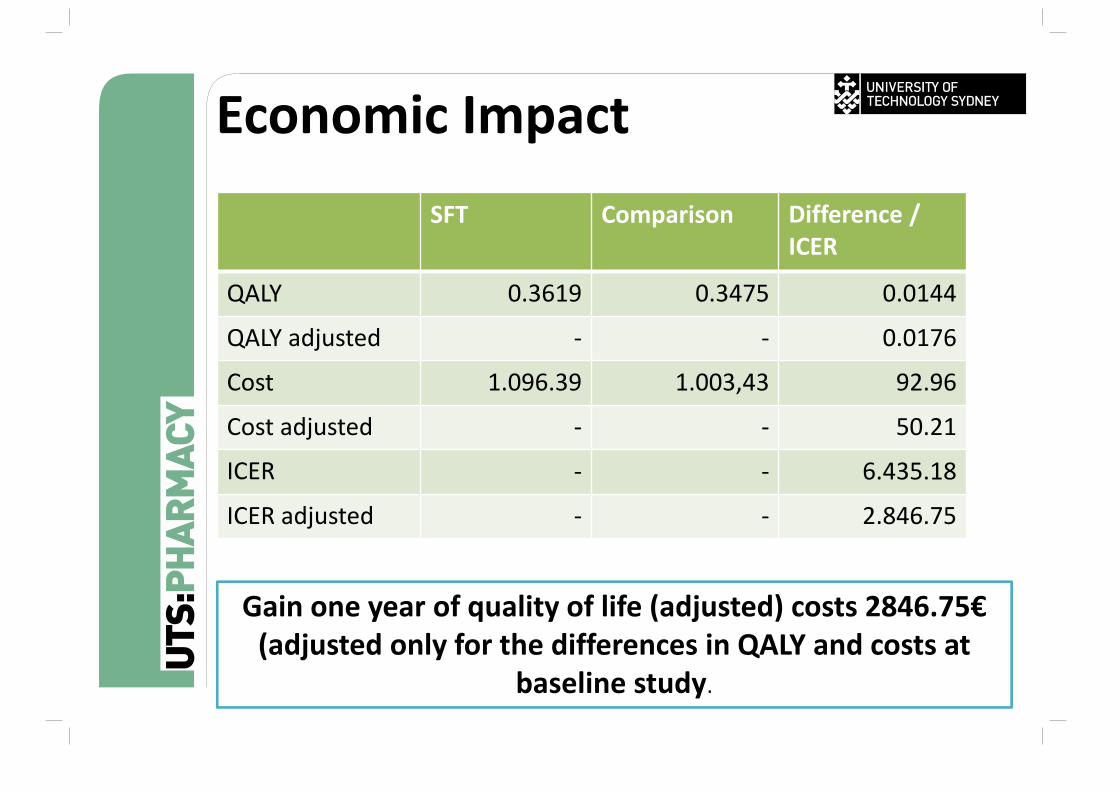
Economic Impact SFT Comparison Difference /
ICER
QALY 0.3619 0.3475 0.0144
QALY adjusted ‐ ‐ 0.0176
Cost 1.096.39 1.003,43 92.96
Cost adjusted ‐ ‐ 50.21
ICER ‐ ‐ 6.435.18
ICER adjusted ‐ ‐ 2.846.75
Gain one year of quality of life (adjusted) costs 2846.75€(adjusted only for the differences in QALY and costs at
baseline study.
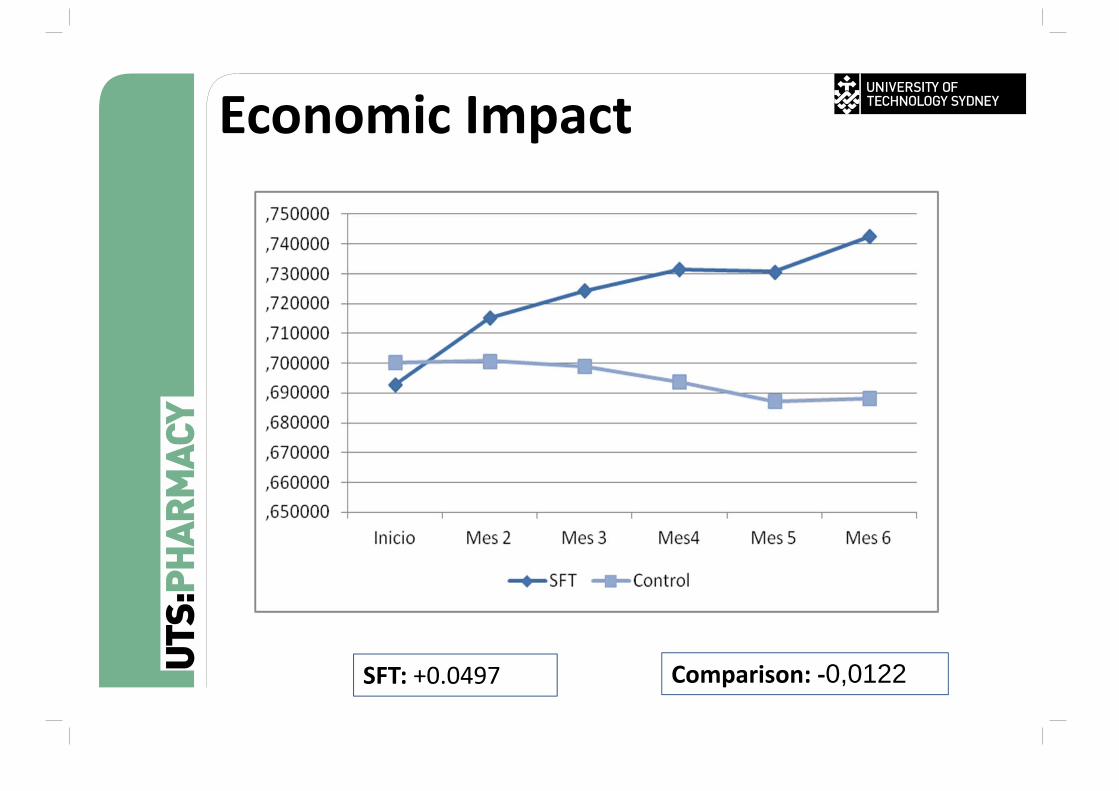
Comparison: ‐0,0122SFT: +0.0497
Economic Impact
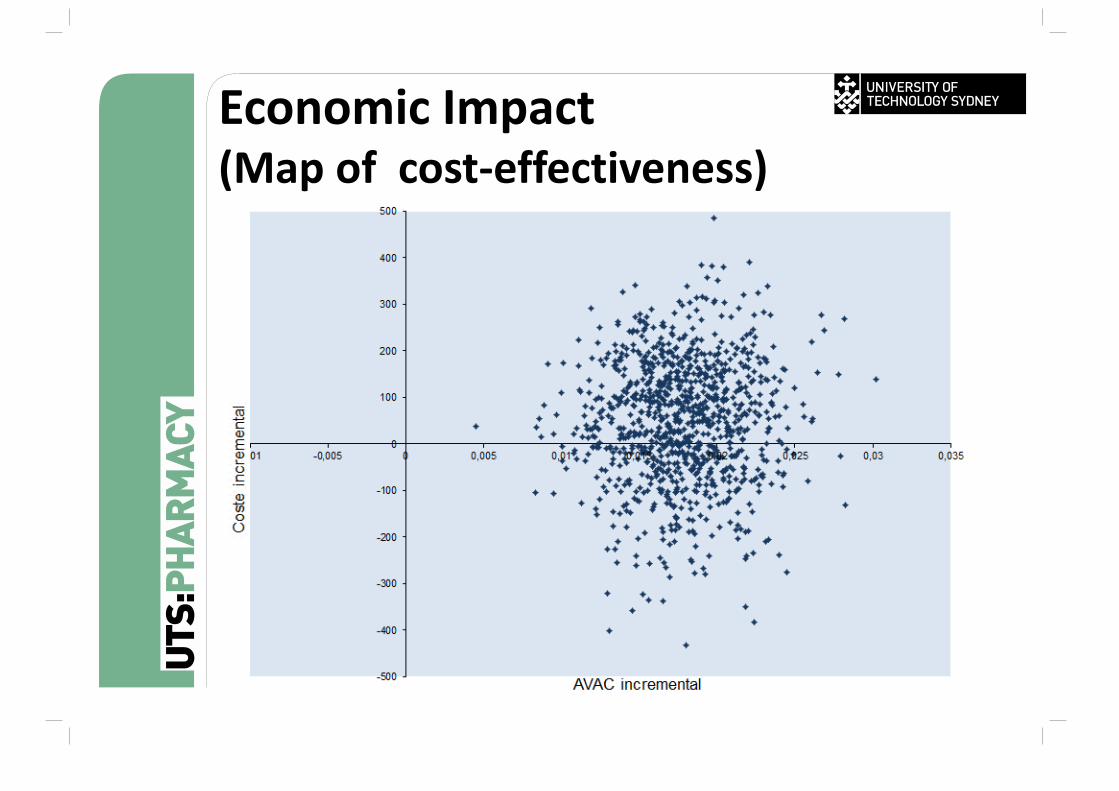
Economic Impact (Map of cost‐effectiveness)
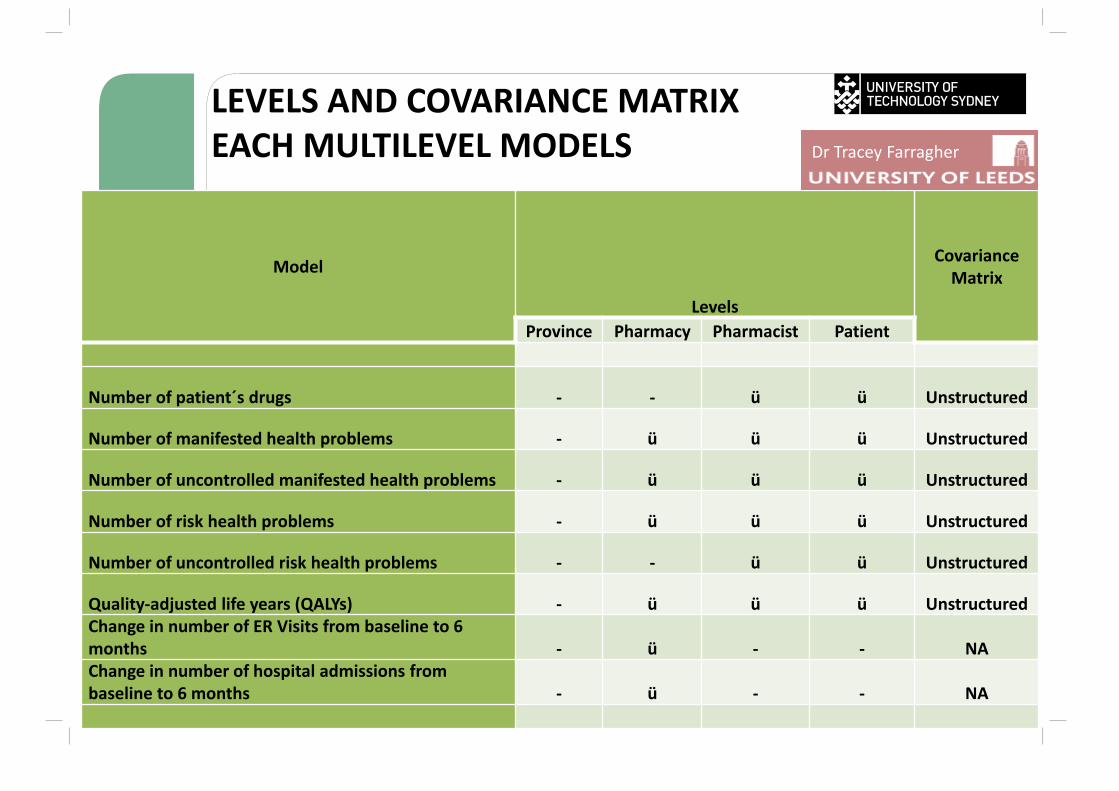
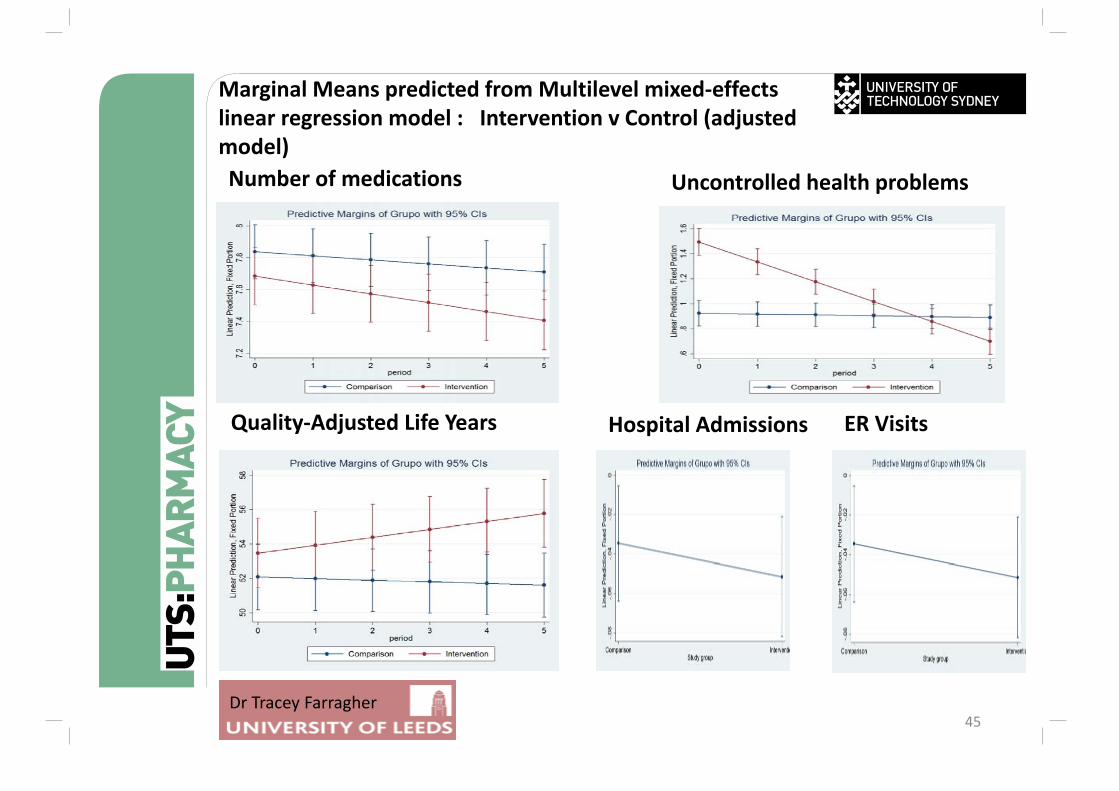
LEVELS AND COVARIANCE MATRIX EACH MULTILEVEL MODELS
Model
Levels
Covariance Matrix
Province Pharmacy Pharmacist Patient
Number of patient´s drugs ‐ ‐ ü ü Unstructured
Number of manifested health problems ‐ ü ü ü Unstructured
Number of uncontrolled manifested health problems ‐ ü ü ü Unstructured
Number of risk health problems ‐ ü ü ü Unstructured
Number of uncontrolled risk health problems ‐ ‐ ü ü Unstructured
Quality‐adjusted life years (QALYs) ‐ ü ü ü UnstructuredChange in number of ER Visits from baseline to 6 months ‐ ü ‐ ‐ NAChange in number of hospital admissions from baseline to 6 months ‐ ü ‐ ‐ NA
Dr Tracey Farragher
45
Number of medications
Marginal Means predicted from Multilevel mixed‐effects linear regression model : Intervention v Control (adjusted model)
Uncontrolled health problems
Quality‐Adjusted Life Years Hospital Admissions ER Visits
Dr Tracey Farragher
Conclusion1. Future very challenging for Community
Pharmacy2. Current business model highly questionable 3. Develop new markets in service provision4. Support for the Change ‐ Implementation
and Sustainability program
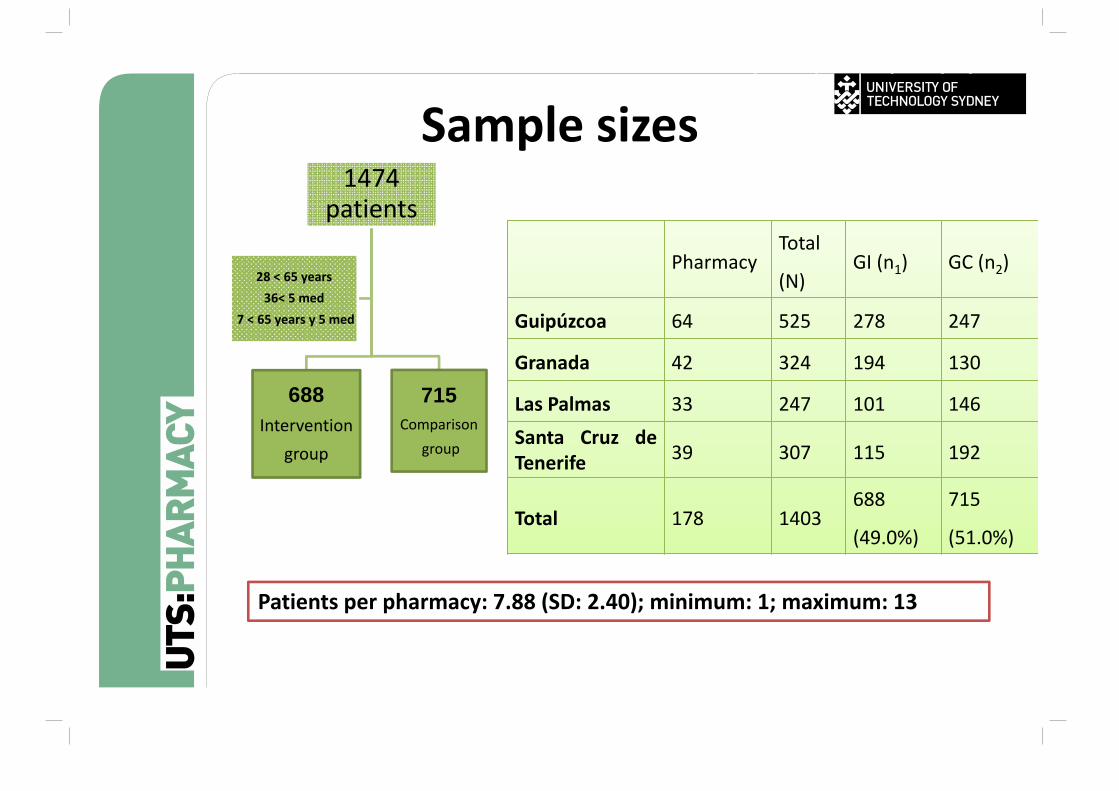
Sample sizes1474
patients
688Intervention
group
715Comparison
group
28 < 65 years36< 5 med
7 < 65 years y 5 med
PharmacyTotal
(N)GI (n1) GC (n2)
Guipúzcoa 64 525 278 247
Granada 42 324 194 130
Las Palmas 33 247 101 146Santa Cruz deTenerife 39 307 115 192
Total 178 1403688
(49.0%)
715
(51.0%)
Patients per pharmacy: 7.88 (SD: 2.40); minimum: 1; maximum: 13
conSIGUE Impacto (estudio principal)


