Download - Climate Change Effects on Water
Climate Change Effects on Water
John Campbell Research Ecologist
USDA Forest Service, Durham, NH
Climate Change & New England Forests Hubbard Brook Experimental Forest
November 18-19, 2015
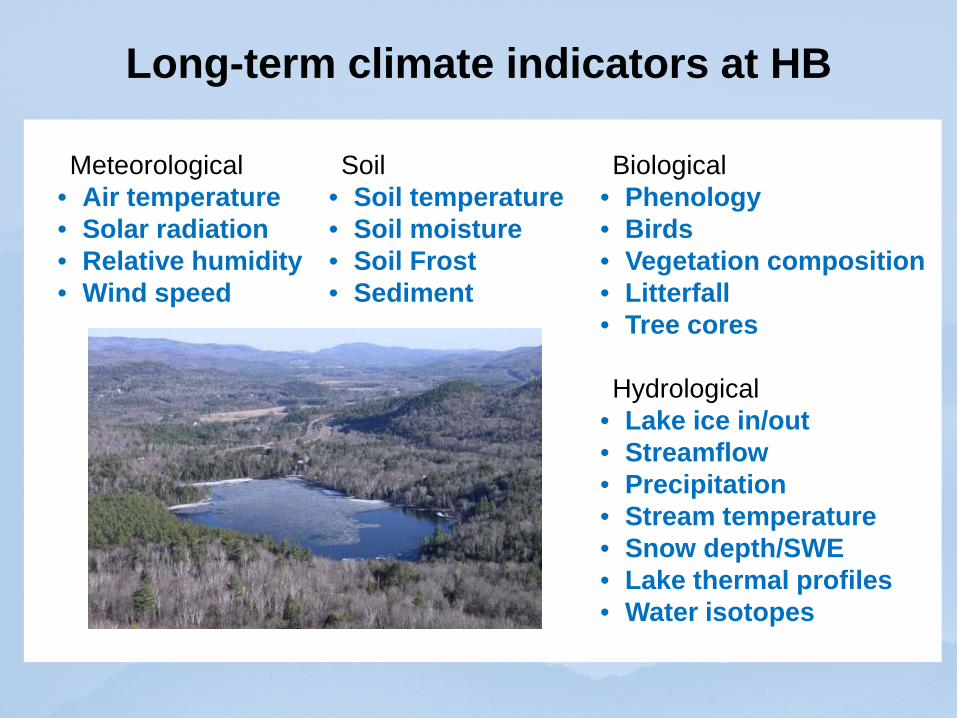
Long-term climate indicators at HB
Meteorological • Air temperature • Solar radiation • Relative humidity • Wind speed
Soil • Soil temperature • Soil moisture • Soil Frost • Sediment
Biological • Phenology • Birds • Vegetation composition • Litterfall • Tree cores Hydrological
• Lake ice in/out • Streamflow • Precipitation • Stream temperature • Snow depth/SWE • Lake thermal profiles • Water isotopes
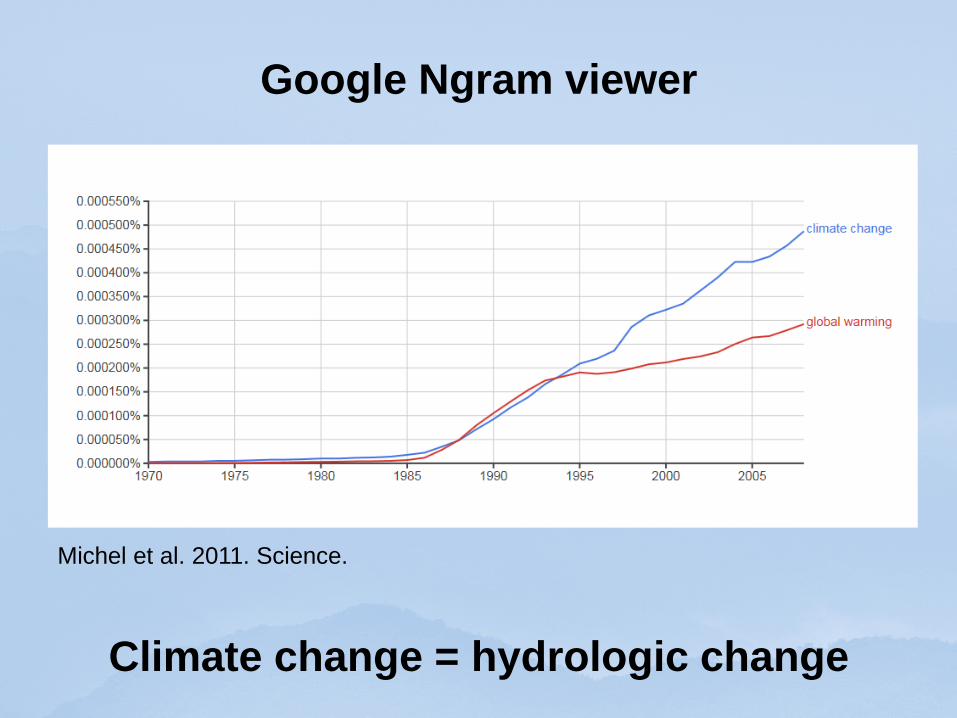
Climate change = hydrologic change
Google Ngram viewer
Michel et al. 2011. Science.
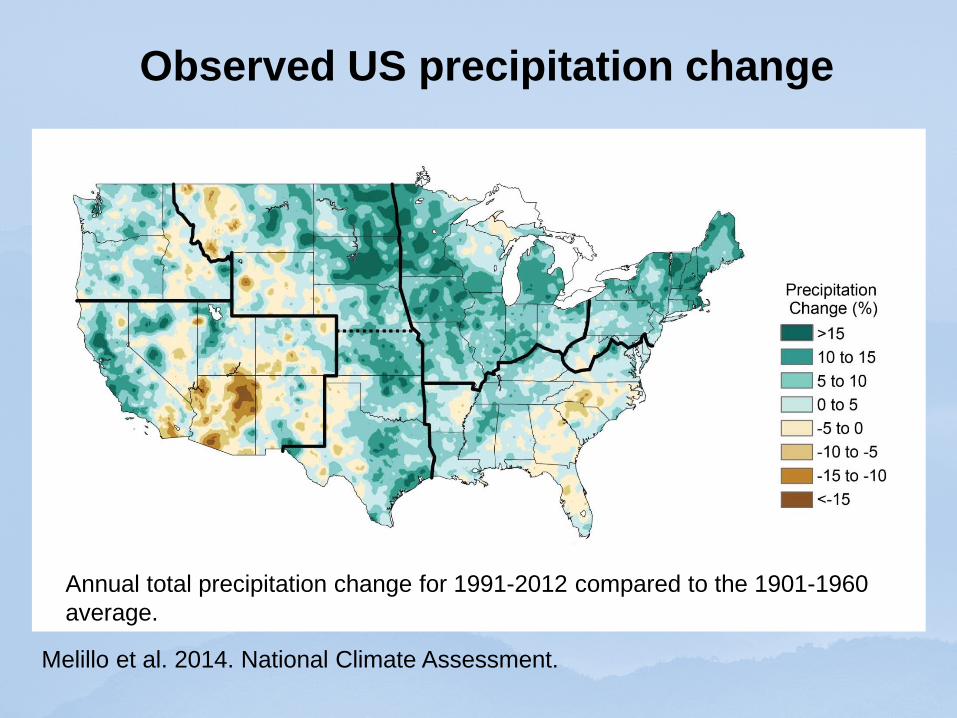
Observed US precipitation change
Annual total precipitation change for 1991-2012 compared to the 1901-1960 average.
Melillo et al. 2014. National Climate Assessment.
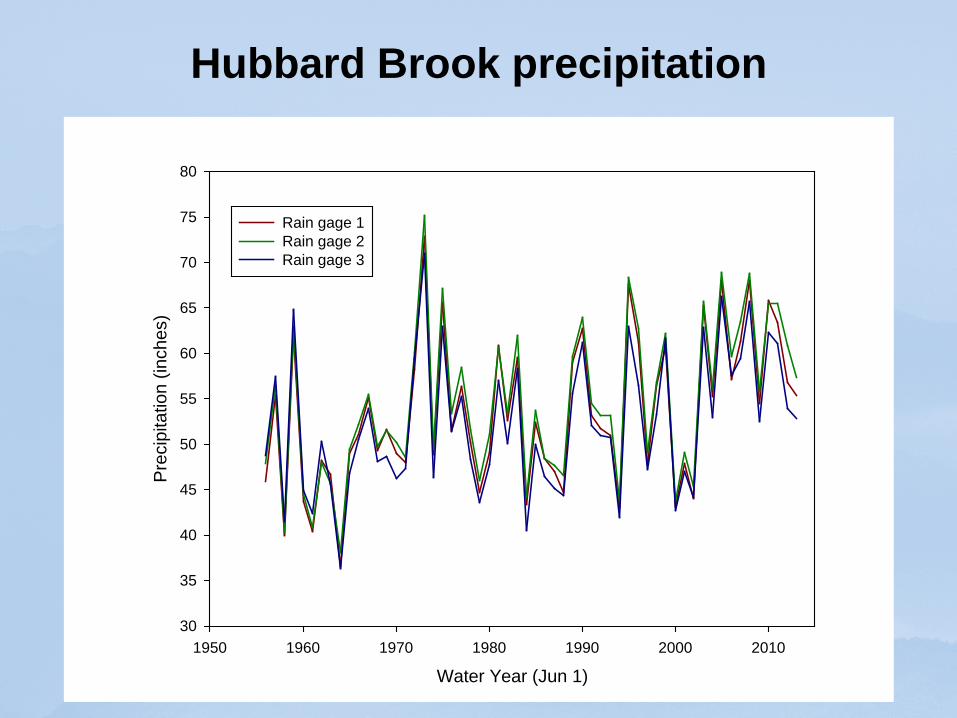
Hubbard Brook precipitation
Water Year (Jun 1)1950 1960 1970 1980 1990 2000 2010
Prec
ipita
tion
(inch
es)
30
35
40
45
50
55
60
65
70
75
80
Rain gage 1Rain gage 2Rain gage 3
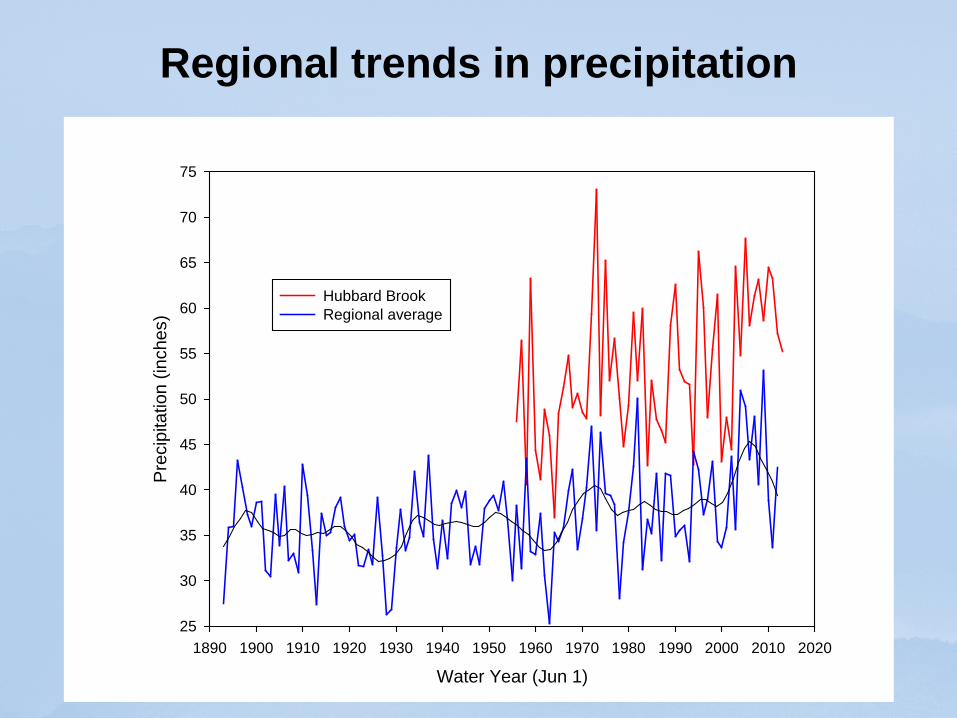
Regional trends in precipitation
Water Year (Jun 1)1890 1900 1910 1920 1930 1940 1950 1960 1970 1980 1990 2000 2010 2020
Prec
ipita
tion
(inch
es)
25
30
35
40
45
50
55
60
65
70
75
Hubbard BrookRegional average
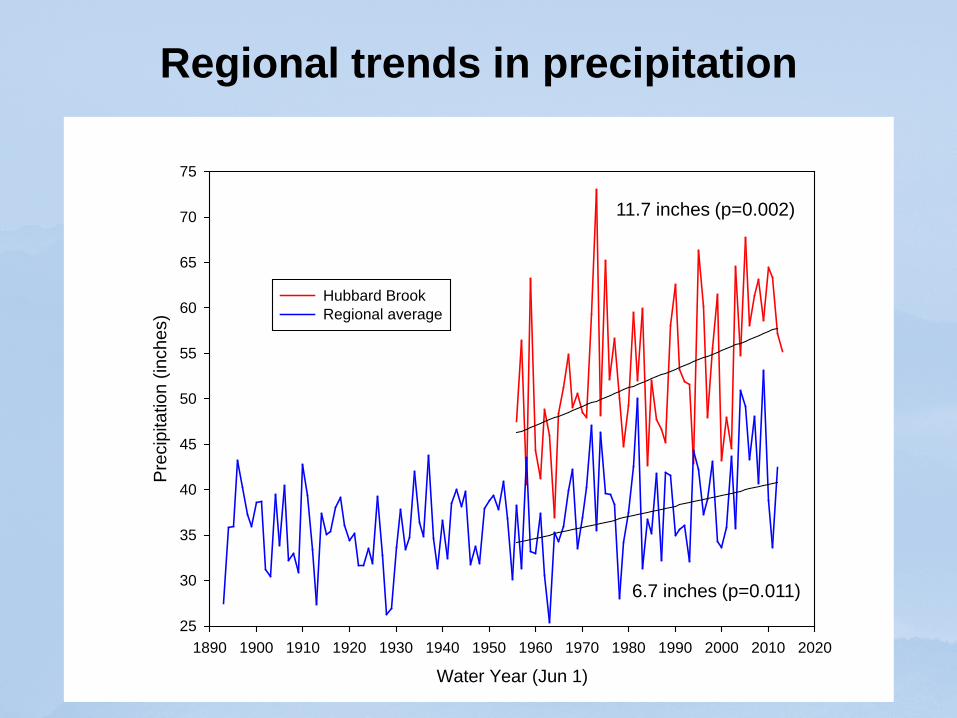
Regional trends in precipitation
Water Year (Jun 1)1890 1900 1910 1920 1930 1940 1950 1960 1970 1980 1990 2000 2010 2020
Prec
ipita
tion
(inch
es)
25
30
35
40
45
50
55
60
65
70
75
Hubbard BrookRegional average
6.7 inches (p=0.011)
11.7 inches (p=0.002)
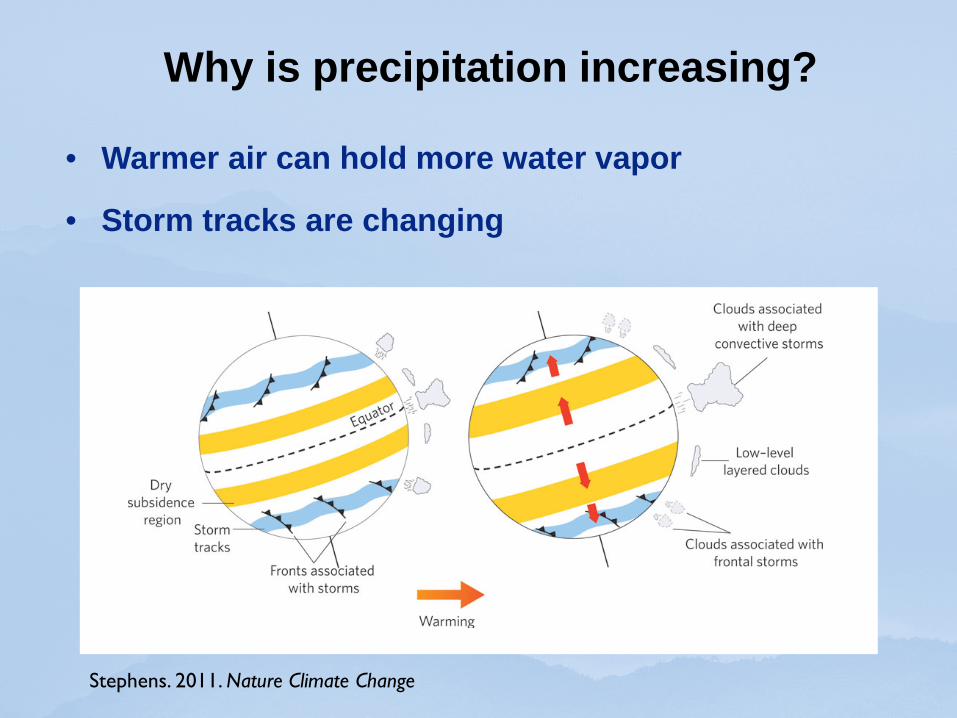
Why is precipitation increasing?
• Warmer air can hold more water vapor
• Storm tracks are changing
Stephens. 2011. Nature Climate Change
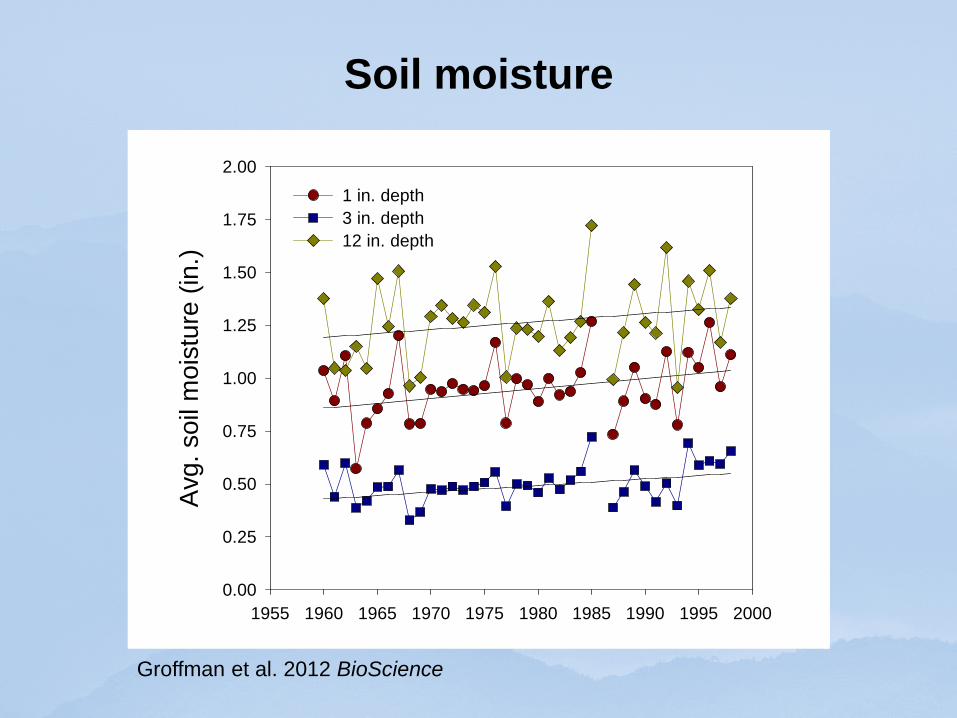
Soil moisture
Groffman et al. 2012 BioScience
1955 1960 1965 1970 1975 1980 1985 1990 1995 2000
Avg
. soi
l moi
stur
e (in
.)
0.00
0.25
0.50
0.75
1.00
1.25
1.50
1.75
2.001 in. depth3 in. depth12 in. depth
Max
. sno
w d
epth
(in)
0
10
20
30
40
50
60
1955 1965 1975 1985 1995 2005 2015
Snow
cov
er (d
ays)
40
60
80
100
120
140
160
180
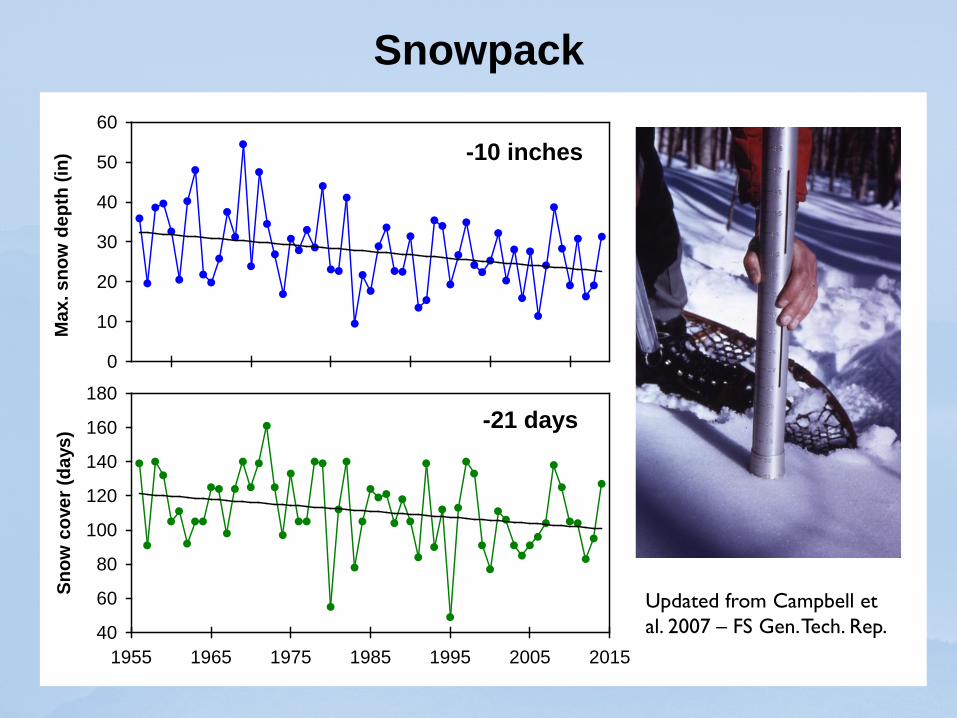
Updated from Campbell et al. 2007 – FS Gen. Tech. Rep.
Snowpack
-10 inches
-21 days
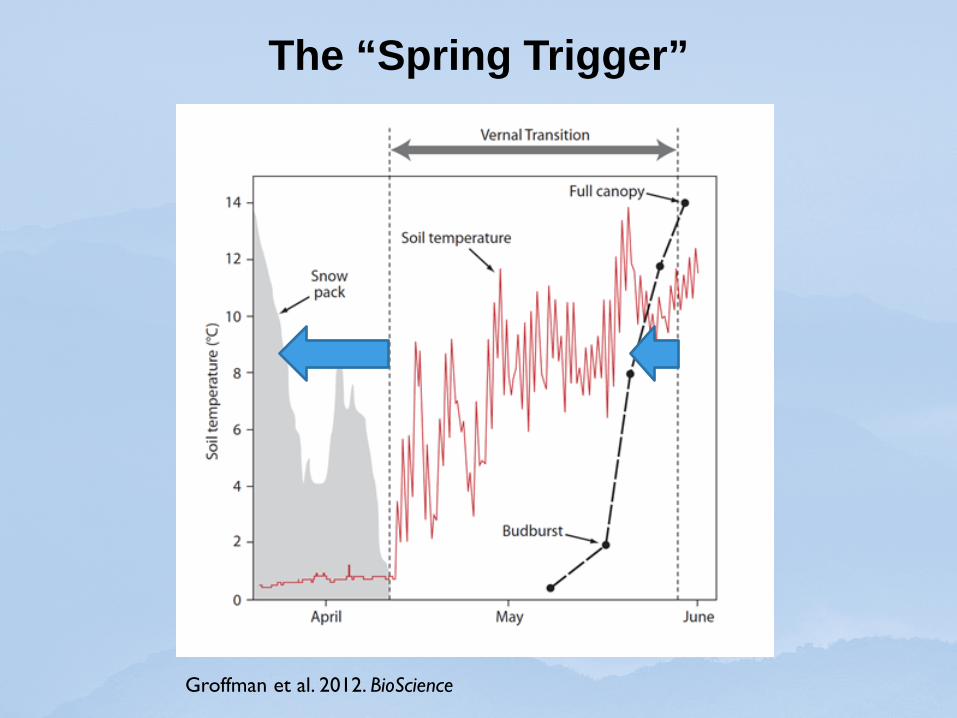
The “Spring Trigger”
Groffman et al. 2012. BioScience
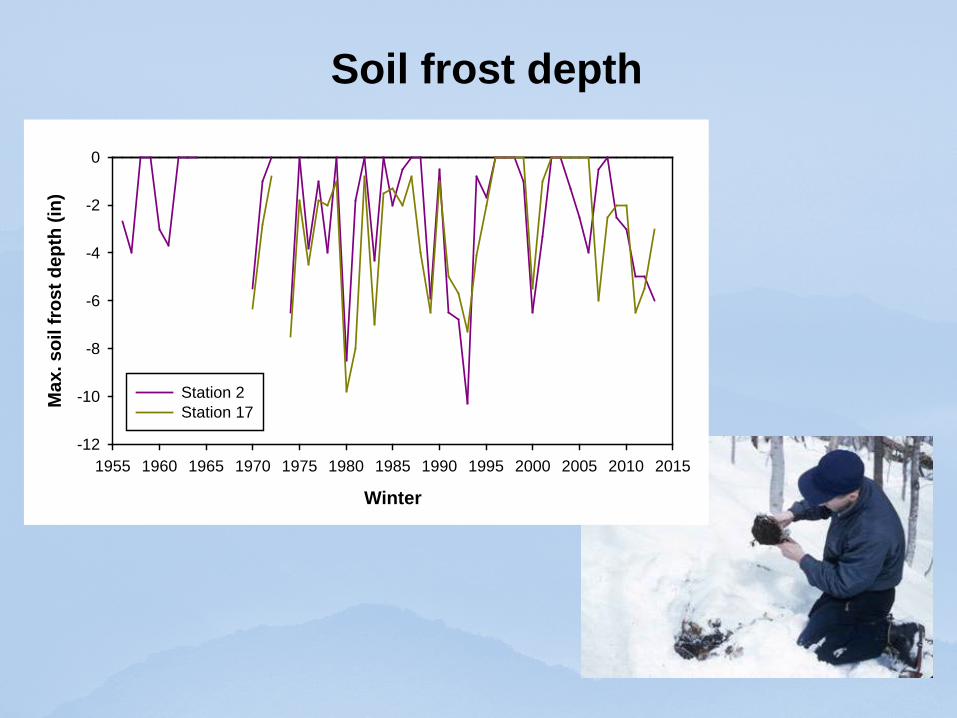
Soil frost depth
Winter
1955 1960 1965 1970 1975 1980 1985 1990 1995 2000 2005 2010 2015
Max
. soi
l fro
st d
epth
(in)
-12
-10
-8
-6
-4
-2
0
Station 2Station 17
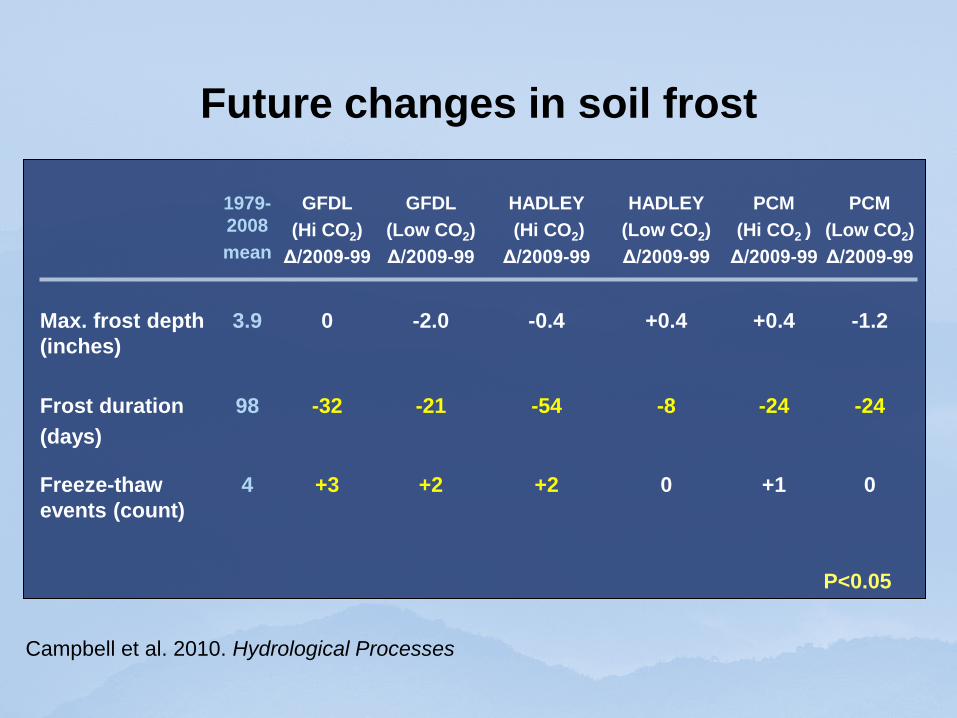
Future changes in soil frost
1979-2008 mean
GFDL (Hi CO2) Δ/2009-99
GFDL (Low CO2) Δ/2009-99
HADLEY (Hi CO2) Δ/2009-99
HADLEY (Low CO2) Δ/2009-99
PCM (Hi CO2 ) Δ/2009-99
PCM (Low CO2) Δ/2009-99
Max. frost depth (inches)
3.9 0 -2.0 -0.4
+0.4
+0.4
-1.2
Frost duration (days)
98 -32 -21 -54 -8 -24 -24
Freeze-thaw events (count)
4 +3 +2 +2 0 +1 0
Campbell et al. 2010. Hydrological Processes
P<0.05
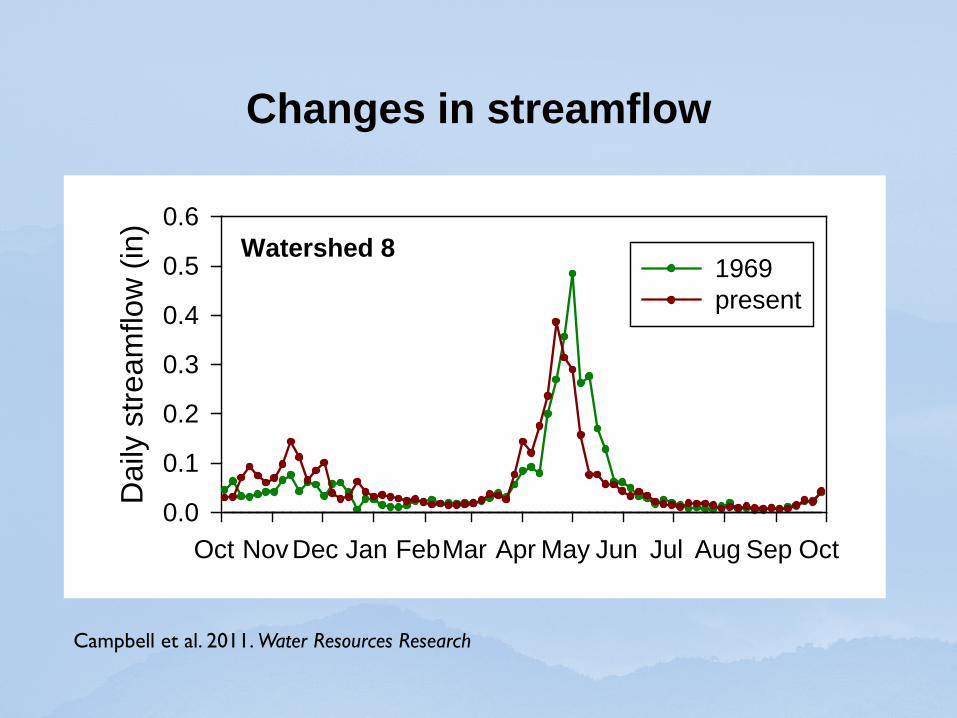
Changes in streamflow
Campbell et al. 2011. Water Resources Research
Oct Nov Dec Jan Feb Mar Apr May Jun Jul Aug Sep Oct
Dai
ly s
tream
flow
(in)
0.0
0.1
0.2
0.3
0.4
0.5
0.6
1969present
Watershed 8

Top 20 streamflow events
Jan Feb Mar Apr May Jun Jul Aug Sep Oct Nov Dec Jan
Stre
am d
isch
arge
(ft3
/sec
)
0
10
20
30
40
50
60
70
Rain-on-snow
Snowmelt
Convective rainfall
Frontal rainfall Hurricanes
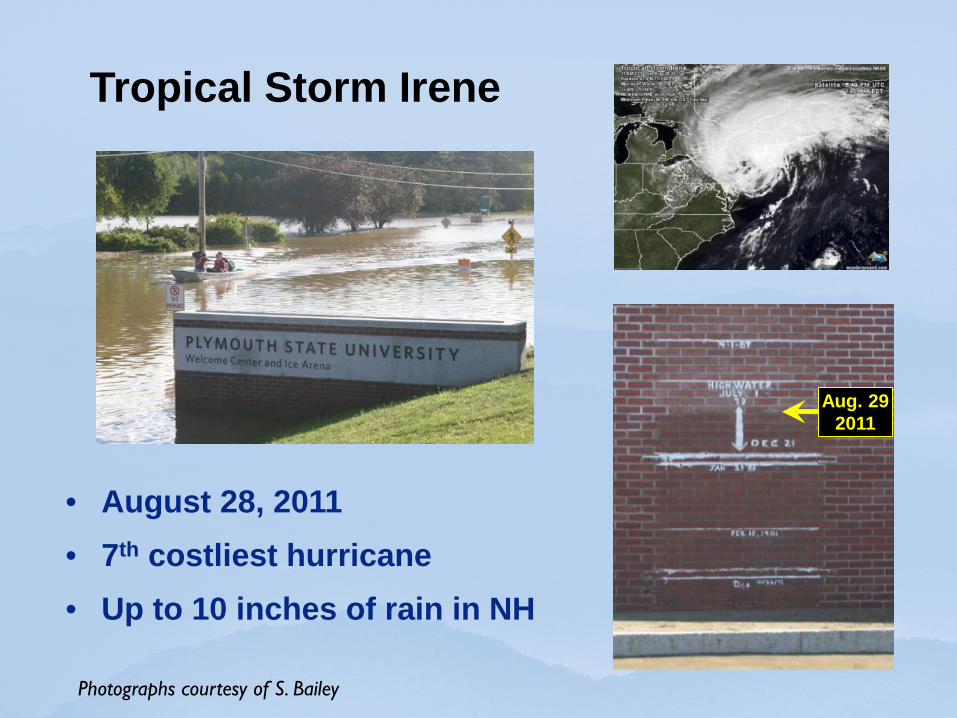
• August 28, 2011 • 7th costliest hurricane • Up to 10 inches of rain in NH
Tropical Storm Irene
Photographs courtesy of S. Bailey
Aug. 29 2011
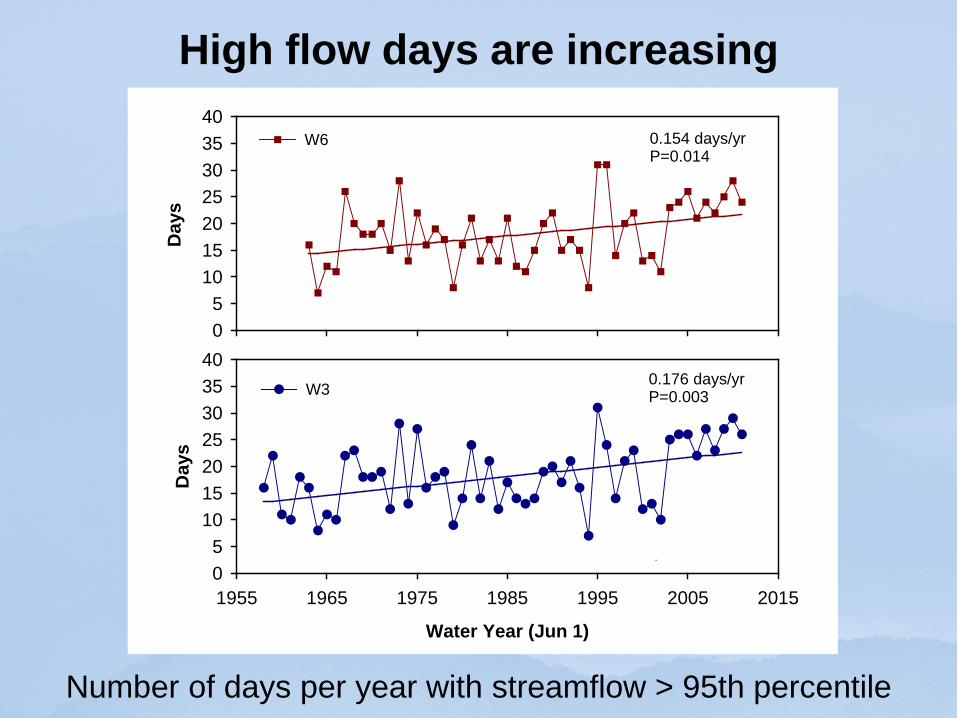
High flow days are increasing
High flow days are increasing also
Number of days per year with streamflow > 95th percentile
Day
s
05
10152025303540
W6
Water Year (Jun 1)
1955 1965 1975 1985 1995 2005 2015
Day
s
05
10152025303540
W3
0.154 days/yrP=0.014
0.176 days/yrP=0.003
95th pctl. = 0.026 mm
95th pctl. = 0.028 mm
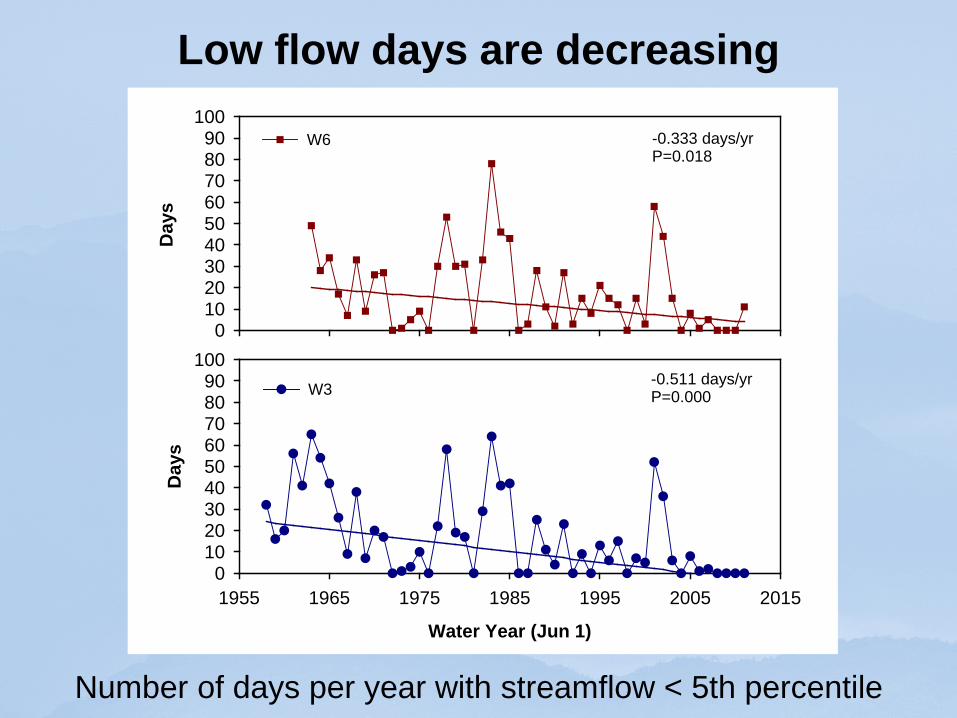
Number of days per year with streamflow < 5th percentile
Day
s
0102030405060708090
100W6
Water Year (Jun 1)
1955 1965 1975 1985 1995 2005 2015
Day
s
0102030405060708090
100W3
-0.333 days/yrP=0.018
-0.511 days/yrP=0.000
Low flow days are decreasing
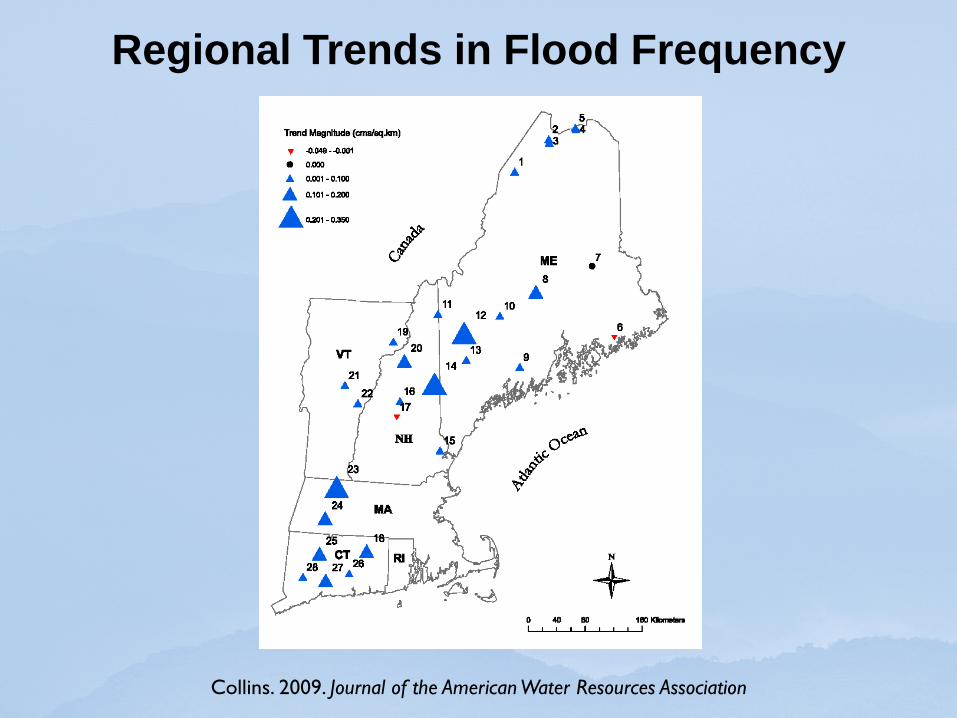
Regional Trends in Flood Frequency
Collins. 2009. Journal of the American Water Resources Association
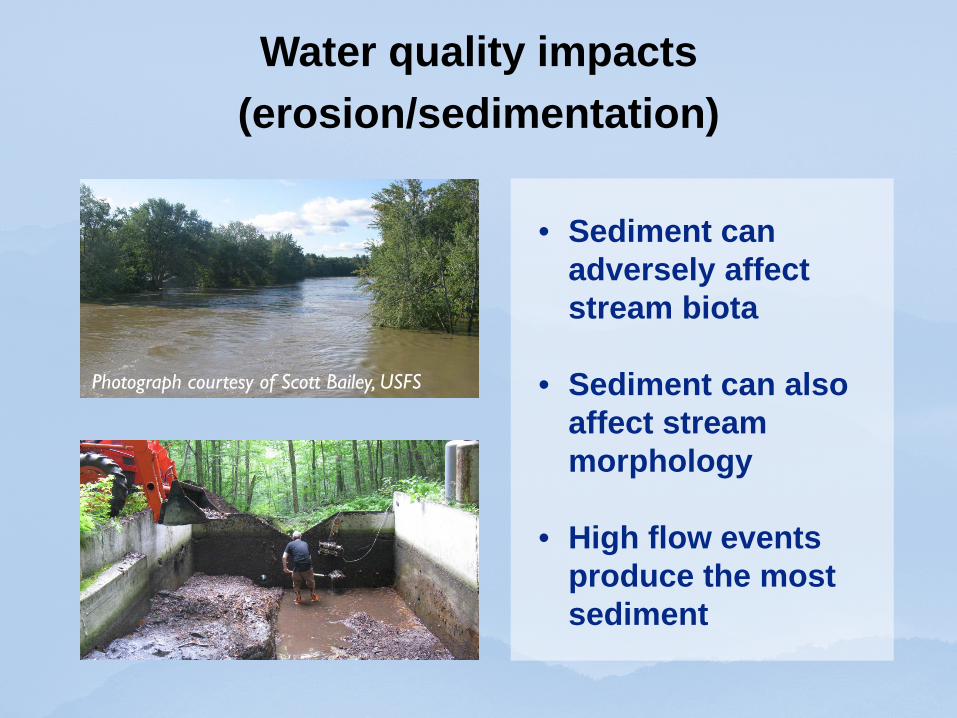
Photograph courtesy of Scott Bailey, USFS
• Sediment can adversely affect stream biota
• Sediment can also
affect stream morphology
• High flow events produce the most sediment
Water quality impacts (erosion/sedimentation)
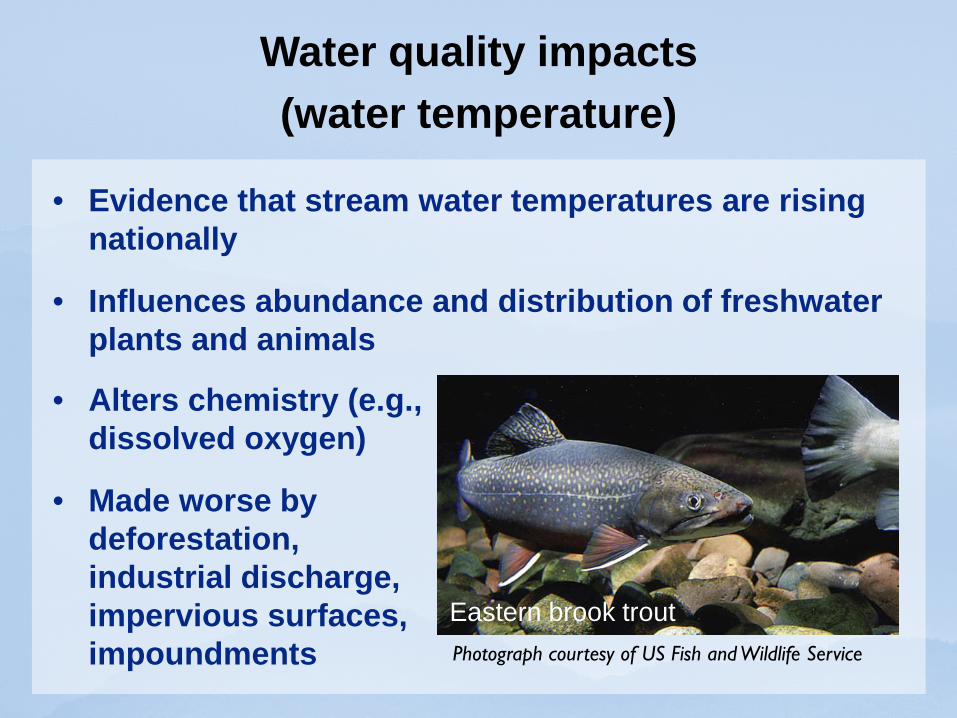
• Evidence that stream water temperatures are rising nationally
• Influences abundance and distribution of freshwater plants and animals
Photograph courtesy of US Fish and Wildlife Service
Eastern brook trout
• Alters chemistry (e.g., dissolved oxygen)
• Made worse by deforestation, industrial discharge, impervious surfaces, impoundments
Water quality impacts (water temperature)
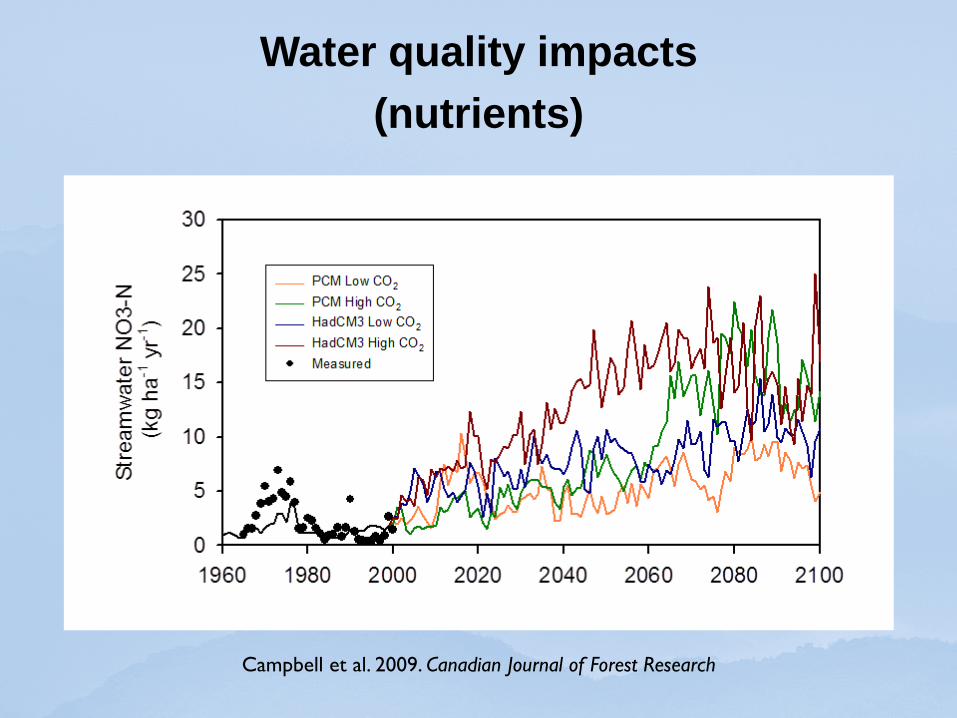
Water quality impacts (nutrients)
Campbell et al. 2009. Canadian Journal of Forest Research
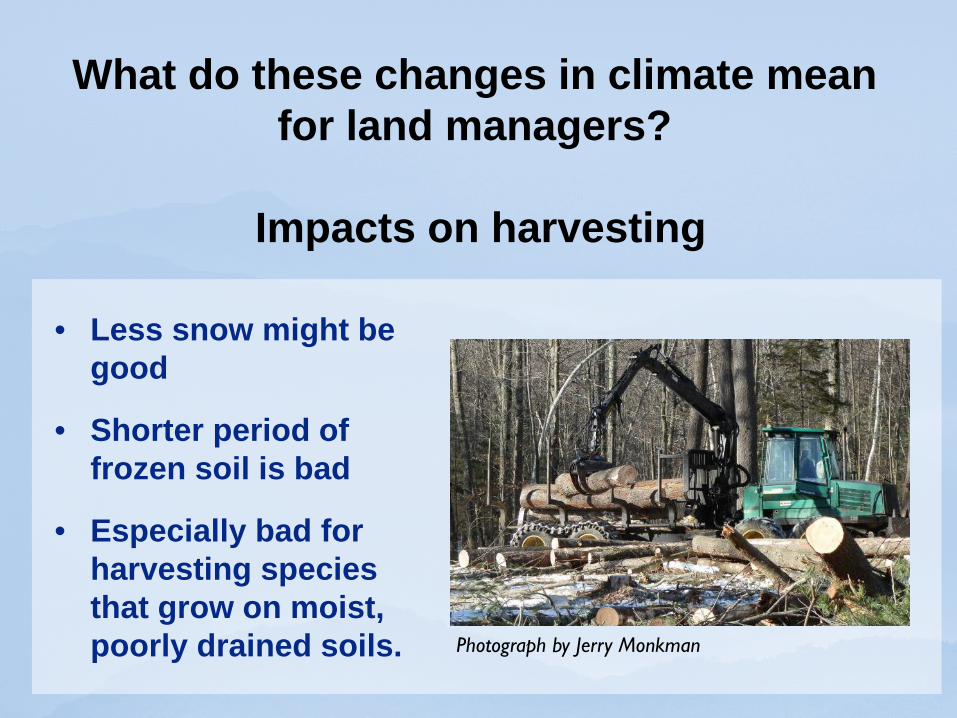
What do these changes in climate mean
for land managers?
Impacts on harvesting
Photograph by Jerry Monkman
• Less snow might be good
• Shorter period of frozen soil is bad
• Especially bad for harvesting species that grow on moist, poorly drained soils.
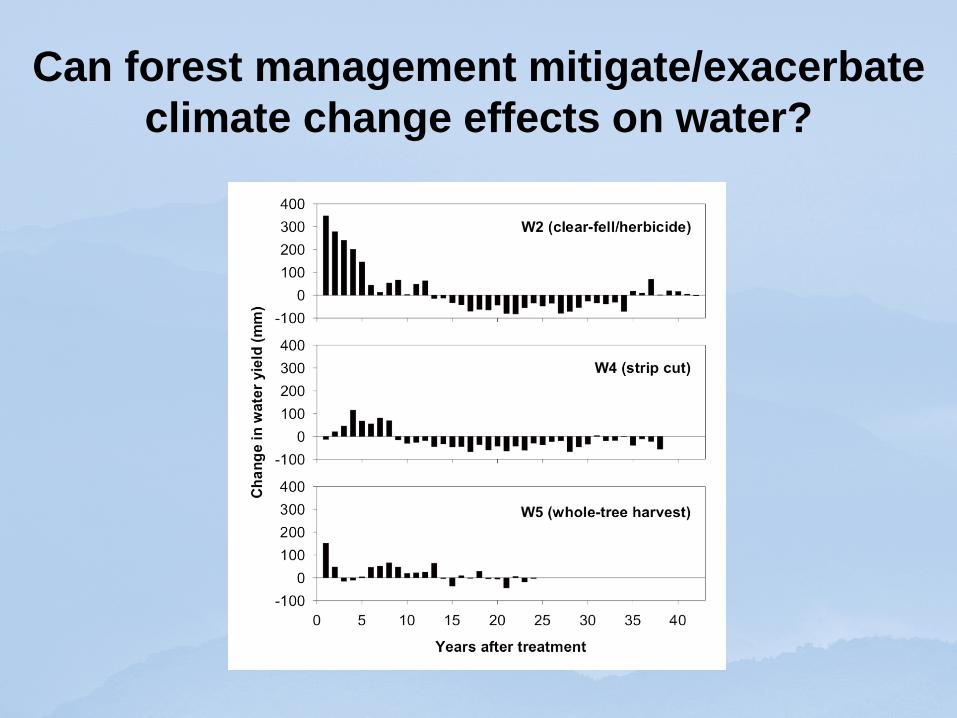
Can forest management mitigate/exacerbate
climate change effects on water?
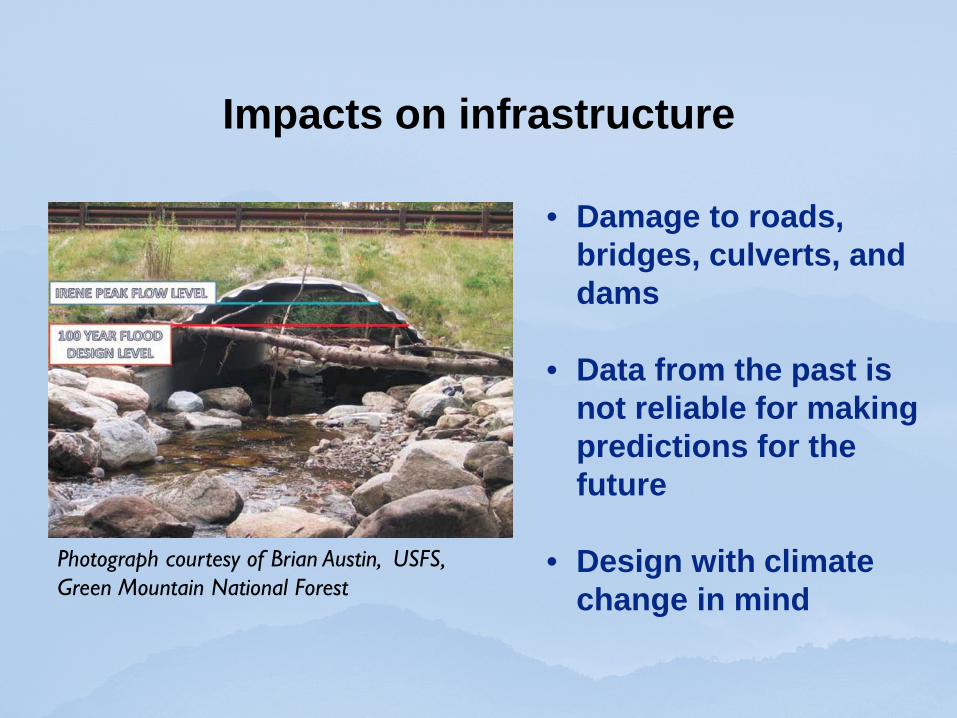
Impacts on infrastructure
Photograph courtesy of Brian Austin, USFS, Green Mountain National Forest
• Damage to roads, bridges, culverts, and dams
• Data from the past is
not reliable for making predictions for the future
• Design with climate
change in mind
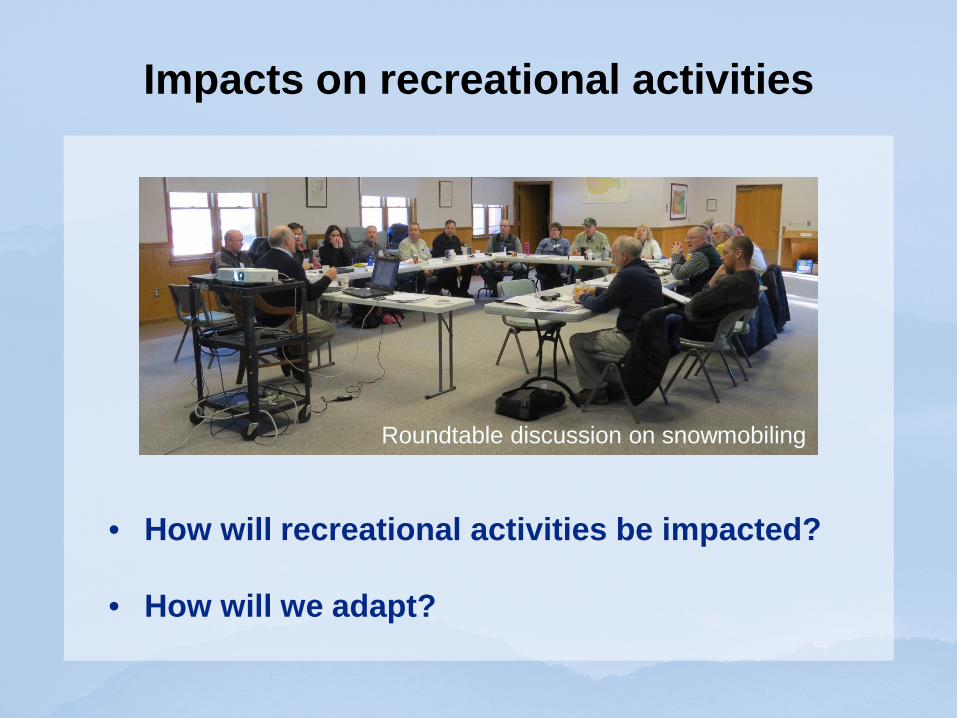
Impacts on recreational activities
Roundtable discussion on snowmobiling
• How will recreational activities be impacted?
• How will we adapt?
Thank you!
Photograph by Gordon Chibroski


