
Chemotherapeutic Drug Cytotoxicity Enhancement in Human Cells in Culture
by Seamus Coyle B.Sc. M.Med.Sc
A thesis submitted for the degree of Ph.D.
Dublin City University
The research work described in this thesis was carried outunder the supervision of
Professor Martin Clynes
National Cell & Tissue Culture Centre School of Biological Sciences
August 1996

I hereby certify that this material, which I now submit for the assessment on the programme of study leading to the award of Ph.D. is entirely my own work and has not been taken from tiie work of others save and to the extent that such work has been cited and acknowledged within the text of my work.
Signed: ID. No.: 9 2

TABLE OF CONTENTS
Abstract 1
Acknowledgements 2
Abbreviations 3
1.0 Introduction 6
1.1 Introduction 71.2 Chemotherapy 81.2.1 Anthracyclines 81.2.2 V inca Alkaloids 101.2.3 Epipodophyllotoxins 131.2.4 Antipyrimidines 141.3 The Cell Cycle 151.3.1 Gi phase 171.3.2 S phase 191.3.3 G2/M phase 201.3.4 Cyclin Dependent Kinase Inhibitors 231.4 Chemotherapy and the Cell Cycle 241.4.1 G2 arrest 241.4.2 G2 andp34cdc2 251.5 Apoptosis 281.5.1 Bcl-2 291.5.2 ICE / Apoptotic proteases 331.6 Apoptosis and Chemotherapy 351.7 Cell Cycle and Apoptosis 371.8 Necrosis 381.9 Multidrug Resistance 401.9.1 P-glycoprotein 411.9.2 Multidrug Resistance Related Protein 441.9.3 Transporter-related with Antigen Presentation 451.9.4 Lung Resistance-related Protein 461.10 Alternative Mechanisms of Resistance 471.10.1 Topoisomerase II 471.10.2 Glutathione S-transferases 491.10.3 Bcl-2 / p53 501.10.4 Metallothioneins 511.10.5 DNA repair mechanisms 521.11 MDR circumvention 531.11.1 Pharmacological circumvention 531.11.2 Genetic circumvention 5 6
Section Title Page

1.12 Non-MDR chemosensitisers 581.13 Aims of this thesis 60
2.0 Materials and Methods 61
2.1 Water 622.2 Glassware 622.3 Sterilisation 622.4 Medium preparation 622.5 Cell lines 632.5.1 Sub-culture of cell lines 642.5.2 Cell counting 652.5.3 Cell freezing 662.5.4 Cell thawing 662.5.5 Sterility checks 672.6 Mycoplasma detection 672.6.1 Indirect staining procedure 672.6.2 Direct Staining 682.7 Toxicity Assay 692.7.1 Toxicity assays 702.7.2 Acid phosphatase assay 702.7.3 Circumvention assays 712.7.4 Chemotherapeutic drug pulse assays 722.7.5 IC50 calculation 722.7.6 Combination Index calculation 732.8 Flow cytometry 752.9 Time lapse videomicroscopy 762.10 Western blotting 772.10.1 Sample preparation 772.10.2 Protein quantitation 782.10.3 Gel electrophoresis 782.10.4 Western blotting 792.10.5 ECL detection 802.10.6 Autoradiograph film processing 812.11 Immunoprécipitation 812.12 Protein kinase assay 822.13 Plasmid DNA Isolation 832.13.1 Preparation of competent cells for transformation 832.13.2 Transformation of E. Coli 832.13.3 Plasmid Miniprep 842.14 Transfection procedures 852.14.1 Electroporation 852.14.2 Calcium phosphate co-precipitation 862.15 fi-Galactosidase activity assay 872.15.1 Preparation of cell extract 872.15.2 Assay 872.16 Selection of transfectants 88

2.16.1 Isolation of clonal transfectants 882.17 RNA extraction 892.18 Reverse transcriptase reaction 912.19 Polymerase chain reaction 912.20 Electrophoresis of PCR products 92
3.0 Results 94
3.1 Chemotherapeutic drug combinations 953.2 MDR circumvention 1103.3 MDR 1 ribozyme transfection 1173.4 MDR1 gene transfection 1253.5 Test Compound Screening 1333.6 Drug/Pulse / Scheduling Assays 1433.7 DLKP pHaMDRl/A #2 Scheduling 1503.8 Cell cycle distribution 1543.9 Time-Lapse Videomicroscopy 1793.10 Cyclin E/CDK2 kinase activity 1863.11 Cyclin E/CDK2 protein analysis 190
4.0 Discussion 197
4.1 Chemotherapeutic drug combination 1984.2 Circumvention 2004.3 MDR1 ribozyme transfection 2034.4 MDR1 transfection 2064.5 Test compound screening 2084.6 Scheduling 2114.7 DLKP pHaMDRl/A #2 Scheduling 2134.8 Cell cycle distribution 2154.9 Cell death kinetics 2174.10 Cell cycle proteins 220
5.0 Conclusions 224
6.0 References 230

Abstract
Chemotherapeutic Drug Cytotoxicity Enhancement in Human Cells in Culture
Seamus Coyle
This thesis examined the effect of combinations of different drugs on toxicity to cancer cells in vitro. Combinations of a known anticancer agent with one of a series of coded non-toxic compounds known to be safe for human use were assayed. Significant enhancement of toxicity of adriamycin and vincristine but not 5- fluorouracil, was observed with three compounds from the series. Studies in a wide range of cellular models showed that this combination effect was not observed in cells overexpressing P-glycoprotein and that the mechanism involved was not inhibition of P-glycoprotein.
An assay was developed to analyse how synergy was affected when cells were exposed to the compounds at different times relative to chemotherapeutic drug pulse exposure. Activity of the active compounds was observed only during 24 hours subsequent to 2 hours drug exposure. Pre-treatment or treatment at later times was ineffective.
Flow cytometric analysis was used to determine the cell cycle distribution of these test compounds in DLKP-SQ, a human lung carcinoma clonal cell line. U-l (active in the combination assay) on its own was shown to induce a transient G /S arrest. There was no apparent effect on the cell cycle distribution using A-l (inactive) or N-l (active). A combination of adriamycin and U-l caused an increased delay in the G, phase and the S phase compared to adriamycin alone. Vincristine in combination with U-l displayed an increased G2/M arrest compared to vincristine treated cells alone. DLKP-SQ treated with 5-fluorouracil alone and in combination showed no effect on cell cycle distribution.
Time lapse videomicroscopic studies demonstrated that vincristine induced apoptosis within 24 hours and the rate of apoptosis increased in the combination. Cells underwent apoptosis 24 hours after treatment with adriamycin but surprisingly there was no significant difference in the rate of apoptosis between adriamycin alone and in combination.
To investigate if the combination effect was due to interference with proteins controlling cell cycle progress, the levels of cyclin E and CDK2 were determined using western blotting; Cyclin E/CDK2 kinase activity was also measured.
1

Abstract
Chemotherapeutic Drug Cytotoxicity Enhancement in Human Cells in Culture
Seamus Coyle
This thesis examined the effect of combinations of different drugs on toxicity to cancer cells in vitro. Combinations of a known anticancer agent with one of a series of coded non-toxic compounds known to be safe for human use were assayed. Significant enhancement of toxicity of adriamycin and vincristine but not 5- fluorouracil, was observed with three compounds from the series. Studies in a wide range of cellular models showed that this combination effect was not observed in cells overexpressing P-glycoprotein and that the mechanism involved was not inhibition of P-glycoprotein.
An assay was developed to analyse how synergy was affected when cells were exposed to the compounds at different times relative to chemotherapeutic drug pulse exposure. Activity of the active compounds was observed only during 24 hours subsequent to 2 hours drug exposure. Pre-treatment or treatment at later times was ineffective.
Flow cytometric analysis was used to determine the cell cycle distribution of these test compounds in DLKP-SQ, a human lung carcinoma clonal cell line. U-l (active in the combination assay) on its own was shown to induce a transient Gj/S arrest. There was no apparent effect on the cell cycle distribution using A-l (inactive) or N-l (active). A combination of adriamycin and U-l caused an increased delay in the Gj phase and the S phase compared to adriamycin alone. Vincristine in combination with U-l displayed an increased G2/M arrest compared to vincristine treated cells alone. DLKP-SQ treated with 5-fluorouracil alone and in combination showed no effect on cell cycle distribution.
Time lapse videomicroscopic studies demonstrated that vincristine induced apoptosis within 24 hours and the rate of apoptosis increased in the combination. Cells underwent apoptosis 24 hours after treatment with adriamycin but surprisingly there was no significant difference in the rate of apoptosis between adriamycin alone and in combination.
To investigate if the combination effect was due to interference with proteins controlling cell cycle progress, the levels of cyclin E and CDK2 were determined using western blotting; Cyclin E/CDK2 kinase activity was also measured.
1

Abbreviations
ABC ATP binding cassette
ActD Actinomycin D
Adr Adriaraycin
AMSA Amsacrine
ATCC American Tissue Culture Collection
ATP Adenosine tri-phosphate
bp Base pair
BSA Bovine serum albumin
BSO DL-Buthionine-[S ,R]-sulfoximine
CaCl2 Calcium chloride
CAK Cdc2-activating kinase
CaP04 Calcium phosphate
CDI Cyclin dependent kinase inhibitor
cDNA Complementary deoxyribonucleic acid
CDK Cyclin dependent kinase
CHO Chinese hampster ovary
CHX Cycloheximide
Cl Combination Index
CML Chronic myelocytic leukeamia
CsCl Cesium chloride
CTL Cytotoxic T-cell
CysA Cyclosporin A
Da Dalton
DEM Minimum essential medium eagle’s
DEPC Diethyl pyrocarbonate
DHFR Dihydrofolate reductase
DMEM Dulbeccos mimimum eagle’s medium
DMSO Dimethyl sulphoxide
DNA Deoxyribonucleic acid
3

DTT DL-Dithiothreitol
ECL Enhanced chemiluminescence
EDTA Ethylene glycol-bis(J3-aminoethylether)-N,N,N’,N’-tetraacetic acid
FCS Foetal calf serum
5-FU 5-Fluorouracil
GSH Glutathione
GST Glutathione-S-transferase
HC1 Hydrochloric acid
Hepes 4-(2-hydroxyethyl)-l-piperazine ethane sulphonic acid
HPLC High pressure liquid chromatography
IC-50 Drug concentration at 50% survival
ICE Interleukin- lfl-converting enzyme
IMS Industrial methylated spirits
Kcl Potassium chloride
LRP Lung resistance-related protein
MEX Methylxanthine
MDR Multidrug resistance
MHC Major histocompatibility complex
MgCl2 Magnesium chloride
raRNA Messenger ribonucleic acid
MRP Multidrug resistance related protein
MT Metallothionein
NaCl Sodium chloride
NADPH Nicotine adenine dinucleotide phosphate
NaHC02 Sodium bicarbonate
NaH2P04 Monosodium phosphate
Na2HP04 Disodium phosphate
NaOH Sodium hydroxide
NSCLC Non-small cell lung carcinoma
OD Optical Density
PBS Phosphate buffered saline
PCNA Proliferating cell nuclear antigen
4
PCR Polymerase chain reaction
PIPES Piperazine-N,N’-bis[2-ethanesulphonic acid
PMSF Phenylmethylsulphonyl fluoride
Rb Retinablastoma protein
RNA Ribonucleic acid
rRNA Ribosomal ribonucleic acid
rpm revolutions per minute
RT Reverse transcriptase
SCLC Small cell lung carcinoma
SDS Sodium dodedecyl sulphate
TAP Transporter-related with antigen presentation
TBS Tris buffered saline
TC Test compound
TEMED N,N,N’, N’ -Tetrameth y 1 -ethylened iamine
TGF-fi Transforming growth factor 6
Thr Threonine
Tris Tris(hydroxymethyl)aminomethane hydrochloride
Tyr Tyrosine
UV Ultraviolet
Vcr Vincristine
Ver Verapamil
VM-26 Tenopside
VP-16 Etoposide
5

Introduction

1.1 Introduction
The human body is a finely tuned organism. It has evolved defense mechanisms to the
environmental stresses (radiation, UV light, chemicals) which it is exposed to in everyday
life. Over 200 different types of cells act in synchrony so that the body can survive and
function properly.
When something goes wrong in any one cell, it may die off or the altered cell may remain
undetected by the body. In the latter case it might be allowed to survive until it evolved
into a neoplastic cell in which some of the controls on the cell's proliferation would be
abrogated.
The common human cancers are cancers that involve epithelial cells such as those lining
the gastrointestinal tract (GIT), the lungs, cells in the breast and the outer surface layers of
the body. Human skin is completely replaced every 6 weeks, 10,000 million epithelial
cells are shed and replaced in the colon every day and 300,000 million blood and
lymphatic cells are destroyed and replaced every 24 hours (Evans, 1993). These tissues
comprise of and their function is dependent on, normal proliferating cells. The emergence
of cancer is a consequence of the failure to control cell proliferation.
1.3 million new cases of cancer occur each year in Europe and there are 840,000 deaths.
There are 7500 deaths in Ireland which is higher than the European per capita average.
At present the only way of treating cancer is by surgery, radiotherapy or chemotherapy or
a combination of any of these.
7

1.2 Chemotherapy
The idea of using drugs to treat cancer has been in existence for over 500 years when
preparations of silver, zinc and mercury were used. The usefulness of drugs in the
treatment of cancer was first documented in 1865 when Lissamer gave potassium arsenite
to a patient with leukaemia and noticed a positive effect. However, successful systemic
cancer chemotherapy was not developed until 1942 when Gilman, Goodman, Lindskog
and Dougherty used nitrogen mustard in a patient with lymphosarcoma (Pratt et al.,
1994). Subsequently a number of chemotherapeutic drugs have been developed for clinical
use. These drugs are members of a number of specific drug classes, including the
anthracycline antibiotics, the Vinca alkaloids, epipodophyllotoxins, antimetabolites,
covalent inhibitors of DNA and non-covalent inhibitors of DNA.
Chemotherapy is most useful against tumours with a high proportion of dividing cells.
However, some normal tissues e.g. bone marrow and GIT, also have a high proportion of
dividing cells. The clinical effectiveness of a chemotherapeutic drug necessitates that doses
administered must allow enough cells in a patients normal tissues (bone marrow, GIT etc)
to survive and allow the patient to recover, while killing malignant tumour cells in vivo .
Tumours with a high growth fraction rate e.g. leukaemia and lymphoma, can generally be
effectively treated by chemotherapy. The more common malignant tumours, the solid
tumours including colorectal, lung and breast tumours usually have a low proportion of
dividing cells and are consequently less susceptible to treatment by chemotherapy alone.
1.2.1 Anthracyclines
The anthracyclines are antibiotics isolated from different Streptomvces species and include
adriamycin (also called doxorubicin), daunorubicin and epirubicin. Adriamycin which has
the most common clinical usage, is used for a variety of carcinomas including breast,
8

bladder, endometrium, lung, ovaries, stomach and thyroid; bone and soft tissue sarcomas;
paediatric solid tumours; lymphoid and myelogenous tumours.
It was first isolated in Italian soil samples from Streptomvces peucetium var caesius. It is
generally administered by intravenous infusion at a dose of 60mg/m2, repeated after 21
days. Clearance of the drug from the body follows a 2 phase pharmokinetic profile. The
first Vi life (a tlA) lasts approximately 10 minutes. The second Vi life (ft tl/i) lasts
approximately 30 hours. The longer B tVz represents the slow release of adriamycin from
tissue depots in the body because of the ability of adriamycin to intercalate with DNA and
perhaps elsewhere in cellular vesicles and membranes.
The metabolism of adriamycin is outlined in Figure 1.2.1. The major metabolic step is the
reduction of adriamycin to doxorubicinol by cytoplasmic NADPH-dependent aldoketo
reductases. Doxorubicinol, which is still an active cytotoxic agent, and doxorubicin are
split into less active aglycones and the free amino sugar by microsomal glycosides. These
aglycones are demethylated and conjugated to a sulphate or glucuronide ester, and
excreted principally in the bile (Pratt et al., 1994).
As with all chemotherapeutic drugs, doxorubicin has serious side effects. A carcinogen
and a mutagen, it also causes immunosuppression. The main limiting characteristic of
adriamycin is that it can cause a cardiotoxic reaction. This cardiotoxicity is also a feature
of other anthracycline drugs.
The primary mechanism of action of adriamycin is due to its ability to bind to DNA and
RNA. Intercalation by the aglycone moiety between adjacent DNA base pairs in the
double helix, results in the inhibition of replication, transcription, RNA and protein
synthesis, stabilisation of topoisomerase II-DNA complex, which causes protein-associated
DNA strand breaks, and free radical mediated cytotoxicity. Adriamycin and other
anthracyclines are also metal chelators with high stability constants for transition metal
ions such as iron. Ferric-adriamycin complexes have been shown to degrade deoxyribose
and cleave DNA (DeGraff et a l, 1994) . The cytotoxicity induced by adriamycin can
occur in the absence of significant DNA damage. When adriamycin is chemically altered
9

so that its ability to bind to DNA and RNA is decreased, there is a corresponding decrease
in cytotoxicity (Pratt et al., 1994). At high concentrations of adriamycin, synthesis of
DNA and RNA is inhibited although this is not critical for cytotoxicity (Pratt et al.,
1994).
Active oxygen species induced by adriamycin can cause single strand DNA breaks, lipid
peroxidation and disruption of cell membrane function and integrity (Skladanowski and
Konopa, 1993) although the overall effect on cytotoxicity is thought to be minor.
However, the active oxygen species play a major role in the ability of adriamycin to
induce cardiotoxicity (Pratt et al., 1994).
Adriamycin has been shown to be active throughout the cell cycle, however the effect is
greatest in exponential cells compared to plateau phase cells. Cells which have been
synchronised in the S or the G2 phase are more sensitive to cytotoxicity than cells in Gi
(Krishan and Frei, 1976). Low concentrations of adriamycin induce G2 arrest, higher
concentrations or exposure to drug for longer periods of time induce a Gt arrest and a
delay in S phase traverse (Barlogie et al., 1976).
1.2.2 Vinca Alkaloids
The Vinca alkaloids are extracted from the periwinkle plant Catharanthus rosea. The
periwinkle plants have been used in folk medicine for centuries and a claim that extracts
could cause hypoglycaemia led to the discovery of vincristine and vinblastine. The
relatively low toxicity of vincristine for normal marrow cells makes it unusual compared
to other chemotherapeutic agents. For this reason it is often included in combination
chemotherapy with other myelosuppressive agents. It is used to treat acute leukaemia
(adult and children), Hodgkin's lymphoma, aggressive non-Hodgkin's lymphoma, small
cell lung cancer, Wilm's tumour, neuroblastoma, rhabdomyosarcoma and Ewing's
sarcoma (Pratt et al., 1994).
10

Given as a bolus intravenous injection, vincristine leaves the body's circulation by
triexponential kinetics, having a and B Vi lives of 2-5 minutes and 50-150 minutes
respectively, the terminal lh life lasts approximately 85 hours. It is primarily eliminated by
a combination of hepatic metabolism and biliary excretion. Approximately 5-25 % of the
parent drug and metabolites can be recovered in urine. Although there is relatively little
toxicity to normal marrow cells, the dose-limiting toxicity of vincristine is predominantly
peripheral neuropathy.
Vincristine is an antimitotic agent and acts by disrupting the mitotic spindle and as a
consequence arrests cells in the mitotic phase. It binds to free tubulin dimers to form
paracrystalline aggregates; this interrupts microtubule polymerisation and causes the
dissolution of the microtubules (Pratt et a l, 1994). Some studies have shown that
inhibition of cell proliferation by vincristine appears to be due to spindle microtubule
perturbation rather than depolymerisation of the microtubules (Jordan et al., 1991; Jordan
et al., 1992). Several other cellular processes unrelated to microtubule perturbation which
are affected by the vinca alkaloids include RNA, DNA and lipid biosynthesis, cyclic
nucleotide and glutathione metabolism and calmodulin-dependent ATPase activity (Jordan
etal., 1991).
11

Figure 1.2.1 The major metabolic pathway for doxorubicin in humans (Pratt et al.,
1994).
Deoxy doxoru bici n aglycone (II)
reductase
aldo-keto reductase, a soluble enzyme (carbonyl réduction)
o ,° — k CHjO O OM / H,C\jV-rc
D o x o r u b ic in o l (III)
OHNH.
Deoxydoxorubicinol aglycone (IV)
(o-demethylatlon)
h o o OH
Demelhyldeoxydoxorubicmol aglycone (V) (glucutonidation)
Sulfate conjugate (VI) Glucoronide conjugate (VII)
12

1.2.3 Epipodophyllotoxms
These include etopside (VP-16) and tenopside (VM-26) which are semisynthetic derivatives of podophyllotoxin, a microtubule inhibitor found in extracts of the mandrake plant. Active against a number of cancers, VP-16 is used clinically in testicular and smallcell lung cancer.
VP-16 can be administered orally or intravenously. Metabolism follows a biphasic kinetics with a terminal Vi-life of 4-8 hours. Approximately 30-50% of the drug can be recovered in urine and approximately 20% has been recovered as metabolites including hydroxy acids and glucuronide and sulphate conjugates. A portion of the administered drug (20- 30%) is frequently unaccounted for, possibly due to tight binding to tissue proteins (Pratt etal., 1994).
Limitations in the use of VP-16 derive from its myelosuppressive actions, primarily leucopenia, other effects include nausea, diarrhoea mucositis and hypotension.
Initially VP-16 was thought to inhibit microtubule function but was subsequently shown to inhibit topoisomerase II. Topoisomerase II decatenates DNA. It binds to double stranded DNA making a transient double strand break. The enzyme is activated by sites on chromosomes where two double helices cross over each other. When the topoisomerase binds to such a crossing site, it; 1) breaks one double helix reversibly to create a DNA "gate"; 2) causes the second, nearby double helix to pass through this break; 3) reseals the break and dissociates from the DNA. In this way topoisomerase II efficiently separates two interlocked DNA circles (Alberts et al., 1994).
A schematic of drug induced topoisomerase II inhibition is given in Figure 1.2.3. Topoisomerase II-mediated cytotoxicity is achieved by drug stabilisation of the complex formed between cleaved DNA and the covalently bound enzyme (Liu, 1989). Stabilisation of the complex interferes with the cleavage / religation action of topoisomerase II resulting in double strand breaks.
13

1.2.4 Antipyrimidines
Antipyrimidines were developed during attempts to synthesise analogs that could inhibit uracil utilization by tumours. The rationale used was to substitute fluorine for the hydroxyl atom in the 5 position in the pyrimidine ring of uracil, since fluorine added to acetic acid (fluoroacetic acid) is a rat poison. From this, 5-fluorouracil was developed and this was the first antipyrimidine. 5-Fluorouracil is direct inhibitor of thymidylate synthase which is the key enzyme in thymidine nucleotide production. Because steady-state pools of thymidine nucleotides are small, DNA synthesis is inhibited until the drug is withdrawn and new thymidylate synthase can be made (Pratt et al., 1994). 5-Fluorouracil can also incorporate into RNA and DNA, inhibiting transcription, translation and the intracellular distribution of mRNA (Pratt et al., 1994). It is commonly used to treat common solid tumours including colorectal, breast, head and neck, gastric and pancreatic cancers. Other antipyrimidines have been developed including cytosine arabinoside, which is widely used in antileukaemic therapy.
Topoisomerase II
E G+
Slrand passing, rotation; break resealing
“t if c C -Transient cleavable
com plex
l i l tDouble stranded D N A
i
r
I * ’ V'-—- . , , \ i . . ]
Non-cleavablecom plex
Persistent cleavable complex
Protein disruption or dénaturation
Double strand break
Protein disruption or dénaturation
Figure 1.2.3: DNA damage induced by inhibition of topoisomerase n. Temporary double-strand breaks are
induced by topoisomerase II in the course of its normal catalytic cycle, by formation of a cleavable complex.
Disruption of this complex, which results in a permanent double-strand break, occurs infrequently in the
absence of drugs. Inhibitors of topoisomerase II cause the cleavable complex to persist, thereby increasing the
probability that the cleavable complex will be converted to an irreversible double strand break (Pratt et al. ,
1994).
14

1.3 The Cell Cycle
One o f the general findings of chemotherapy is that chemotherapeutic drugs work best on proliferating cells even if the mode of action of the drug is not cell cycle specific. A lot of attention has now focused on the role of the cell cycle.
The cell cycle is the process that a cell must undergo in order to replicate. It is composed of four different phases; G! (Gap 1) which is a growth phase; the S phase, during which DNA is replicated; G2 (Gap 2) where the cell pauses as it prepares to divide; mitosis (M) (see Figure 1.3.1).
Figure 1.3.1
The four phases of the cell cycle are controlled by the actions of specific serine/threonine kinases, the cdc-2 related proteins. The cdc-2 related proteins all need to bind a protein called a cyclin in order to become active, thus they are called cyclin-dependent-kinases (CDKs). A t present there are 8 CDKs and more than 10 cyclins known.
15

During various stages of the cell cycle different cyclins bind to different CDKs e.g., cyclin
A binds to CDK2 during the S phase and to CDK1 during G?. The cyclins can be broadly classed as being G^S cyclins or G2/M cyclins (see Table 1.3.1).
Table 1.3.1
G./S cvclins Go/M cvclinsCyclin A Cyclin ACyclin C Cyclin B1Cyclin D (1-3) Cyclin B2Cyclin E Cyclin H
A t present 8 different kinases have been identified that bind a cyclin. Several other structurally related proteins are known, and some o f these may be re-classified as CDKs if they are shown to bind a cyclin (Table 1.3.2).
16

Cydin dependent kinases and related proteins (Pines, 1993)
Table 1.3.2
Name Identity to cdc2
kinase domain (%)
Cydin bound
cdc2 (CDK1)
CDK2
CDK3
CDK4
CDK5
CDK6
10065
66
44
57
47
Cydin B (1-2)
Cydin A, D(l-3), E ?
Cydin D (1-3)
Cydin D (1-3)
Cydin D (1-3)
PICTAIRE (1-3)
PIT AIRE
p58GTA
p40Mo15 / CDK7
51-55
42
42
40 Cydin H
1.3.1 phase
After mitosis, most cells in the body enter a quiescent state called G0. Entry into the cell cycle can be stimulated by growth factors which regulate cell proliferation through a complex network of intracellular signalling cascades which ulitimately regulate gene transcription and the assembly and activation o f the cell cycle control system. As yet no direct evidence between the signalling pathways and the cell cycle proteins have been shown.
At a point called the restriction (R) during Gx, the cells become independent of serum and commit to initiating DNA replication (Pardee, 1989). The CDK complexes that have been most closely linked to regulating the R point are those regulated by the D-type cyclins. In different cell types the 3 D-type cyclins are differentially expressed (Lew et
17

al., 1991; Matsushime et al., 1991). The D-type cyclins can bind to a number of CDKs (CDK2, CDK4, CDK5 and CDK6) although they appear to predominantly act with CDK4 and CDK6. Although cyclin D and CDK4 levels are almost constant in cycling cells the cyclin D/CDK4 complex forms as the cells reach the R point and dissociate once the cells enter the S phase. Transcription of these cyclins is GF dependent e.g. CDK4 synthesis can be regulated by TGF-fl (Ewen et al., 1993), and because both D cyclins mRNAs and proteins turn over rapidly their levels quickly decrease when growth factors are withdrawn (Matsushime et al., 1991). This has led to the concept that the D-type cyclins act primarily as growth factor sensors integrating external cellular signals with cell cycle progression (Sherr, 1993).Only two substrates are known for the cyclin D/CDK4 complexes:(i) Retinoblastoma tumour suppressor protein Rb(ii) Components of the E2F family of transcription factors
Rb is a tumour suppressor gene which acts as a cell brake. Rb is underphosphorylated throughout Gx and phosphorylated at the G^S transition. Once phosphorylated, Rb leaves the nucleus, thus removing its suppressing activity. As the cell progresses through the cell cycle Rb is phosphorylated (at multiple sites) by different CDK complexes, until the M/Gj transition, where it becomes dephosphorylated and returns to the nucleus (Weinberg, 1995). The hypophosphorylated form of Rb is able to block cells in G! phase and it binds and potentially sequesters large numbers of proteins including the transcription factor E2F (Chellappan et al., 1991).
The D type cyclin/CDK complexes may phosphorylate and inactivate Rb in mid-G! phase and it has been suggested that cyclin-Dl and Rb form a negative feedback loop in late Gx phase because cells that lack Rb also have less cyclin D1 (Sherr, 1993). Thus hypophosphorylated Rb may stimulate Cyclin D1 transcription and subsequently cyclin D1 - CDK4/6 would inactivate Rb allowing cells to progress into S phase and concomitantly down-regulate cyclin D1 synthesis (Weinberg, 1995).
18

During Gb E2F is bound to Rb. At the restriction point, Rb phosphorylation by the cyclin/CDK complexes, causes a conformational change, which releases E2F and allows it to bind to DNA and activate transcription (Ludlow et al., 1990). E2F transcription factors are thought to regulate the early response genes such as c-myc and B-myb, and the synthesis o f cell cycle dependent proteins required for S phase e.g. DNA polymerase a, thymidine kinase, ribonucleotide reductase and dihydrofolate reductase. E2F is a heterodimer composed of an E2F family member and a DP family member. There are at present 5 E2F proteins and 3 DP proteins are known but the most detailed analysis have been performed with E2F-1 and DP-1 (LaThangue, 1994; Muller, 1995).
1.3.2 S phase
Once cells pass the R point they must pass into S phase. The transition from Gx into S is controlled by the cyclin E/CDK2 complex and this is essential for the cell to begin DNA replication. Cyclin E mRNA and protein levels and the activity o f the cyclin E/CDK2 complex all peak at the Gj/S transition, sharply decreasing as the cells progress through the mid and late S phase (Dulic et al., 1992). Thus the cyclin E/CDK2 complex has a role in the initiation of DNA replication (Knoblich et al., 1994). When cyclin E is overexpressed in cells, the cells progress through Gt and into the S phase at a faster rate . These cells also have a diminished requirement for growth factors, indicating that cyclin E may overlap with the D-type cyclins in integrating growth factor signal transduction into the cell cycle (Ohtsubo and Roberts, 1993). The activation of the cyclin E/CDK 2 complex also appears to be the point at which radiation damage in the Gt phase can delay the cell cycle (Dulic et al., 1994).
Cyclin E/CDK2 associates with E2F and pl07 (Lees et al., 1992). Cyclin E and pl07 bind to the E2F sub-unit E2F-4, while E2F-1, -2 or -3 may associate with Rb, DP-1 is common to both complexes (Lees et al., 1992). Very little is known about the substrates of cyclin E but it is thought to be a potential regulator o f Rb (Sherr, 1993) and to activate E2F and thus transcription of S phase genes.
19
Once cells enter the S phase cyclin E is rapidly degraded. It is replaced by cyclin A which also forms a complex with CDK2 and this is required for continued DNA replication. E2F-4/DP-1 and pl07, which bind to cyclin E at the G^S transition, then form a complex with cyclin A/CDK2 (Lees et al., 1992). Cyclin A/CDK2 is also thought to phosphorylate E2F-1 and therefore inhibit E2F-1/DP-1 DNA-binding activity (Krek et
al., 1994; Xu et al., 1994). Thus cyclin A/CDK2 might inactivate E2F and turn o ff Gj/S phase genes (Krek et al., 1994). The exact role of cyclin A/cdk2 in continued DNA replication is not known.
1.3 .3 . G2/M phase
The most widely studied CDK is the p34cdc2 kinase. p34cdc2's regulation has been extensively studied and is important because it controls the G2/M transition. This has immediate applications to chemotherapy since DNA-damaging chemotherapeutic drugs often cause a cell cycle arrest in G2 (Sorenson and Eastman, 1988; Tsao et al., 1992; Demarcq et al., 1994). p34cdc2 kinase is active during the G2 and M phase and binds the mitotic cyclins i.e. cyclin A, cyclin B1 or cyclin B2. Once activated p34cllc2 kinase catalyses the breakdown o f the nuclear envelope, the organisation of the mitotic spindle and the packaging of the chromatin (DNA) for mitosis. Because the actions of this kinase are so potent (i.e. dissociation of the nucleus) its regulation is tightly controlled (see Figure 1.3.2).
Activation of p34cdc2 is rapid and produces an all or nothing effect. Once cyclin B and cdc2 combine the complex is immediately phosphorylated on Thr-161, stabilising the complex. Phosphorylation on a homologous site appears to be required for activation of all CDKs. The kinase that phosphorylates this site is the cdc2-activating kinase (CAK). CAK is itself a CDK and is a complex between cyclin H and CDK7 and as such also needs to be phosphorylated at a similar site to become active (Fisher and Morgan, 1994). Phosphorylation at two sites overlapping the ATP-binding site (Tyr-15 and Thr-14), keeps
20

p34cdca in a catalytically inactive state (Solomon et al., 1990; Krek and Nigg, 1991). One o f these inhibitory kinases is weel which phosphorylates Tyr-15 (Parker and Piwnica- Worms, 1992) and can itself be inactivated by another protein kinase nim l and can also be phosphorylated. Other unknown kinases also act on p34cde2 (Parker et al., 1993).
Since tyrosine phosphorylation plays an important role in restraining p34c4<a activity, the regulation of tyrosine déphosphorylation becomes a crucial step in p34cdc2 activation. Cdc25C is a tyrosine phosphatase which specifically removes the inhibitory tyrosine phosphate on p34cdcZ that is generated by weel. Cdc25C itself appears to be regulated by several complex pathways.
21

ACTIVE cyclin B degradation
Cyclin B
Completion of DNA replication
T 1 4 Y 1 5
INACTIVE
Cyclin BCyclin B
Figure 1.3.2: Regulation of p34cdc2 activity during the cell cycle. Cyclin B association with p34cdc2 occurs during interphase, possibly regulated by Thr 161 phosphorylation of p34cdc2. Sufficient cyclin B can be accumulated early in the cell cycle for subsequent protein kinase activation. Phosphorylation of Thr 14 and Tyr 15 in the ATP-binding site of p34cdc2 prevents protein kinase activation for the remainder of interphase. Dephosphorylation o f Thr 14 and Tyrl5 by cdc25C brings about protein kinase activation, but this cannot usually occur unless DNA replication is completed (Norbury and Nurse,1992).
22

1.3.4 Cyclin Dependent Kinase Inhibitors
Cyclin dependent kinases inhibiters (CDIs) can bind and inhibit the function of CDKs and are an extra control mechanism by which CDKs can be regulated. Most CDIs inhibit the progression of the cell cycle, some respond to extracellular signals while others are involved in intrinsic steps of the cycle. CDIs (in vitro) act by binding to the cyclin, the kinase or to the cyclin-CDK complex and inhibiting the function of cyclin-CDK complexes while not covalently modifying either the cyclin or the CDK (Peter and Herskowitz, 1994).
A t present there are six mammalian CDIs identified, p l4 , p l5 , p l6, p21, p27 and p28. These CDIs can be roughly divided into two groups, one group which have a broad affinity for different cyclins (p21 and p27) and the other which have a more specific mechanism of action (p i5 and p i6) (see Table 1.3.4).
p21 and p27 can both bind to cyclins A, B, D (l-3) and E. p27 is produced in response to TGF-B and inhibits cyclin E/CDK2 kinase activity (Polyak et al., 1994). p21 is a protein whose gene expression can be induced by p53 (Dulic et al., 1994). p53 is necessary for a G, check-point control which senses DNA damage (fibroblasts lacking p53 do not respond to DNA damage induced by radiation). This w ill then lead to a transient arrest in G! since p21 inhibits the CDK complexes (Dulic et al., 1994). It is also possible that p21 inhibits proliferating cell nuclear antigen (PCNA; a small protein which binds to DNA polymerase 8 during DNA replication) (Fotedar et al., 1996). Recent work has shown that p21 can (in vitro) inhibit DNA replication directly. This means that p21 has a dual role in response to DNA damage, by inhibiting CDK complexes it prevents transition from Gj to S and may also directly block DNA replication by inhibiting PCNA (Chen et al., 1995; Fotedar etal., 1996).
23

Cell Cycle Phase Cvclin-CDK complex Inhibitors
p l5 p !6 p l8 p21p27
Table 1.3.4 Mai or Cvclin-CDK Cell Cycle Complexes
Gi Cyclin D - CDK4/6 + + 4- ++
Gj/S Cyclin E - CDK2 ++
S Cyclin A - CDK2 +
G2/M Cyclin B - cdc2 -I-
1.4 Chemotherapy and the Cell Cycle
1.4.1 G 2 arrest
The most common effect of DNA-damaging drugs is the accumulation of cells in the G2 phase. These drugs include cisplatin (Sorenson and Eastman, 1988; Demarcq et al.,
1994), campothecin (Tsao et al., 1992), VP-16 (Wood et a l, 1995), adriamycin (Barlogie et al., 1976), bleomycin, X-rays and nitrosurea compounds (Rao, 1980). Active DNA synthesis is required before a cell w ill arrest in G2 (Tsao et al., 1992).
24

Arrest in G2 is thought to allow time for the repair of DNA damage (Liicke-Huhle, 1982). This idea is supported by the increased radiosensitivity of yeast mutants which are unable to arrest in G2 (Liicke-Huhle, 1982).
It is proposed that there are two distinct check-point mechanisms in mammalian G2 (Downes et al., 1994); one sensitive to DNA damage and another which is sensitive to the catenation state of DNA (this includes the decatenatory activity of topoisomerase II) (Downes et al., 1994; Ishida et al., 1994). Downes et al showed that ICRF-193 (an epipodophyllotoxin analogue which selectively binds topoisomerase II but does not induce DNA strand breaks) blocks entry but not exit from mitosis. Compounds which are able to circumvent this G2 arrest e.g. caffeine, result in malformed condensed chromosomes (Downes et al., 1994). This also highlights the important role topoisomerase II has in mitosis.
1.4.2 G2 and p34cdc2
DNA damaging chemotherapeutic drugs often cause a cell cycle arrest in G2. Research investigating the role of the cell cycle and chemotherapeutic drugs has consistently shown that the activity of p34cdc2 kinase is inhibited (Lock and Ross, 1990; Lock and Ross, 1990; Steinmann et al., 1991; Lock, 1992; Lock and Keeling, 1993; O'Connor et al.,
1993; Demarcq et al., 1994). Since activation of p34cdc2 kinase results in the transition of cells from G2 into mitosis inactivation o f this kinase induces a G2 arrest.
Studies using chemotherapeutic drugs and radiation have shown that they can exert their effect in different ways on p34cdc2 kinase activity. CA46 (human lymphoma) cells treated with nitrogen mustard, showed that the cyclin A/cdk2 complex remained active while the activity o f cyclin B/cdc2 and cyclin A/cdc2 decreased (O'Connor et al., 1993). Cyclin B accumulation was altered in HeLa cells treated with campothecin (Tsao et al., 1992). Studies using ionising radiation on HeLa cells which induced G2 arrest showed a decrease in cyclin B levels while cyclin A levels increased. In control cells the levels of cyclin A
25

and cyclin B both increased (Muschel et a l, 1991; Muschel et al., 1993). This suggests that cells proceed through the S phase but are inhibited in G2.
Brief exposure of both CHO and HeLa cells to VP-16 inhibits mitotic progress. Cell cycle arrest in G2 showed a concomitant increase in cyclin B levels and accumulation of hyperphosphorylated p34cdc2. Inactivation o f p34cdc2 was due to the inhibition of déphosphorylation of a tyrosine residue (Lock and Ross, 1990; Lock and Ross, 1990) and a threonine residue, both in the active site (Lock, 1992).
p34cdc2 kinase is regulated by the complex interaction of a number of protein kinases and phosphatases. Since tyrosine phosphorylation plays an important role in restraining p34cdc2 activity, the regulation of tyrosine dephosphorylation becomes a crucial step in p34cdc2 activation. Cdc25C is a tyrosine phosphatase which specifically removes the inhibitory tyrosine phosphate on p34cdc2 that is generated by weel. When phosphorylated cdc25C becomes active and dephosphorylates p34cdc2 at the active site, thus activating it.
G2 arrested HeLa cells treated with campothecin have unaltered levels o f cdc25C (Tsao et
al., 1992). No activation of cdc25C was found in nitrogen mustard treated G2 arrested CA46 cells (O'Connor et al., 1994). This suggests that the G2 check-points preventing entry into mitosis in the presence of unreplicated or damaged DNA, suppress the initiation of the cdc2-cdc25C autocatalytic feedback loop, which normally brings about the rapid activation of cdc2. Therefore p34cdc2 inhibition is a result of the inactivation of some unknown factor early in its control.
In drug resistant cells drug-induced G2 arrest depends on the amount of chemotherapeutic drugs getting into the cell. In a CHO/VpmR-5 drug resistant cell line, VP-16 concentrations differing by a factor of 10 were needed to induce the equivalent inhibition of p34cdc2 kinase in the sensitive CHO parent. This is equivalent to the degree of resistance displayed by the VpmR-5 cell line (Lock and Ross, 1990). Thus for VP-16 treated cells, damage caused to the cells' DNA appears a prerequisite for the cellular
26

process resulting in the inhibition of p34cdc2 kinase activity and G2 arrest i.e. it is the DNA damage caused by chemotherapeutic drugs which causes inhibition of p34cdc2.
Despite the ability of chemotherapeutic agents to induce an arrest in G2, there are some compounds which have the ability to overcome this arrest. These include okadaic acid (which is a type 2A phosphatase inhibitor) (Symthe and Newport, 1992), 2-aminopurine (Bunch et al., 1994), 6-dimethyl-aminopurine (two protein kinase inhibitors) and the methylxanthines (MEX). The MEXs (which include caffeine and pentoxifylline) enhance the in vitro cytotoxicity of X-irradiation (Hain et al., 1994), UV light and alkylating agents (Byfield et al., 1981; Das et al., 1982).
Exposure to caffeine after a brief VP-16 exposure is known to release G2 arrest and increase mitotic death (Lock et al., 1994). Premature chromosome condensation, a feature of some G2 arrested cell lines when exposed to caffeine, needs cyclin B and p34cdc2 to be intact (Steinmann et al., 1991; Lock et al., 1994). Activation of p34cdc2 kinase activity is a common response to caffeine exposure (Symthe and Newport, 1992; Hain et al., 1993; O'Connor et al., 1993; Bunch et al., 1994; Lock et al., 1994). Pentoxifylline reverts the activity of cyclin A/cdc2 and cyclin B/cdc2 kinases to control levels in CA46 cells treated with nitrogen mustard (O'Connor et al., 1993). However, Bunch et al (1994) demonstrated that dephosphorylation of p34cdc2 kinase is not enough to induce mitosis in all systems .
Not all cell lines showed enhanced cytotoxicity when exposed to caffeine. Caffeine did not circumvent cell cycle blocks induced by replication inhibitors or UV radiation in SVM Indian muntjac DM87 cells. Similarly, G2 arrest induced by T-irradiation or VP-16 in HeLa was caffeine insensitive (Musk et al., 1988; Downes et al., 1994).
MEXs are also reported to reduce the cytotoxicity of DNA damaging anti-topoisomerase drugs (including doxorubicin, mitoxantrone, VP-16 and ellipticine). Intercalation between the drug and the MEX can lead to a decrease in the effective drug concentration available
27

(Traganos et al., 1991) (Traganos et al., 1993) while inhibition of RNA synthesis may also be a possible mechanism (Perez et al., 1994).
1.5 Apoptosis
Even though the mechanism of action of chemotherapeutic agents is known to the extent that some cellular targets have been identified, it is unknown how or why they are more toxic to cancer cells than normal cells. How these drugs cause a cell to die is at present a major focus of research worldwide.
Apoptosis is a mechanism of cell death whereby a cell actively dismantles itself. It is characterised by a detachment of the apoptotic cell from surrounding cells, a decrease in cell volume, membrane blebbing, condensation of the nucleus and endonucleolytic cleavage of DNA into nucleosomal-length fragments. Finally the cell content is packaged into numerous apoptotic bodies which can be phagocytosed by surrounding cells.
Under normal physiological conditions, the stimuli which induce apoptosis are diverse and vary from normal physiological signals, such as hormones that trigger selection of cells during differentiation, to the removal of cells that have sustained some form of damage. Cells can also be primed to undergo apoptosis by the removal of either some intracellular apoptosis inhibitory factor or the withdrawal o f important extracellular components such as serum or growth factors. Non-physiological conditions which induce apoptosis include radiation, hyperthermia, calcium influx, glucocorticoids and cytotoxic agents.
The regular and controlled nature of apoptosis implies that the process is under genetic control. Research into the nematode Caenorhabditis elegans has provided a detailed cascade of the genetic factors involved. Three genes (ced3, ced4, and ced9) are involved in the death o f the cell and two groups of genes (cedi, ced6, ced7 & ced8 and ced2, ced5
28

& cedlO) appear to be involved in parallel pathways implicated in the phagocytosis of apoptotic bodies. Another gene, nucl, which encodes for a nuclease, is involved in degrading the DNA of the apoptotic cell. Mutations in this gene still results in apoptosis but there is no degradation of DNA (Hall and Lane, 1994).
1.5.1 Bcl-2
The ced-9 gene is essential for development and protects cells from apoptosis. It exhibits partial homology to the mammalian proto-oncogene product bcl-2 (Hengartner and Horwitz, 1994) and expression of bcl-2 in C.eleeans blocks apoptosis (Vaux et al.,
1992).
The bcl-2 gene was first identified at the t(14:18) translocation in human follicular lymphoma and was subsequently shown to be expressed in all haematopoietic cell types having a renewing stem cell population (Korsmeyer, 1992). The gene is also expressed in other cell types that have an extended life span (Allsopp et al., 1993; Merry et al., 1994). The bcl-2 gene encodes a 26 kDa intracellular membrane associated protein which is localised to mitochondria, endoplasmic reticulum and nuclear membranes (Chen-Levy and Cleary, 1990; Nguyen et al., 1993).
Mice lacking bcl-2 complete embryonic development and appear normal during the first week after birth. Consequently, the mice begin to show growth retardation, and have small external ears and immature facial features. The mice die young. These mice show apoptosis in the embryonic kidney and hypoplastic renal development, which progresses to severe polycystic kidney disease. There is apoptotic involution of the thymus and spleen and an almost complete loss of lymphocytes (Veis etal., 1993).
Apart from its role in protecting against physiologic cell death, deregulation of bcl-2 in non-Hodgkin's lymphoma cells rendered the cells resistant to a range of drugs (including
29

dexamethasone, methotrexate and VP-16) commonly used to treat the disease (Miyashita and Reed, 1993). However, the gene is not protective in all situations i.e. Fas/FasL. Monoclonal antibodies raised against the Fas (APO-1) cell curface protein have cell killing activity, reviewed in (Nagata and Suda, 1995). Therefore there is a bcl-2 independent mechanism of apoptosis. Protection by bcl-2 against the potentially lethal effects of exogenous and endogenous factors (including radiation, various peptides, heat, and other gene products) provides a basis for categorising bcl-2-dependent and bcl-2 independent pathways to cell death (Reed, 1994).
Bcl-2 is the original member of an increasing multigene family. Members of the family are in two functional categories, those that inhibit and those that promote apoptosis. The inhibitors of apoptosis include bcl-2 (Vaux et al., 1992), Bcl-xL (Boise et al., 1993), Mcl-1 (Kozopas et al., 1993), Adenovirus E1B 19K Epstein-Barr virus BHRF1 and Ced- 9 (Hengartner and Horwitz, 1994). The promotors include Bax (Oltvai et al., 1993), Bak (Chittenden et al., 1995; Chittenden et al., 1995; Farrow et al., 1995), Nbk/Bikl (Boyd
e ta l., 1995), Bad (Yang et al., 1995) and Bcl-xs (Boise et al., 1993) (see Table 1.5.1).
Bcl-2 family members interact with each other forming both homo and heterodimers. Bax counters bcl-2 activity, accelerating apoptotic cell death but only after a death-inducing signal. When bcl-2 is excess, bcl-2 homodimers and heterodimers predominate and cells are protected from apoptosis. When bax is in excess, bax homodimers predominate and cells are susceptible to apoptosis (Oltvai et al., 1993; Oltvai and Korsmeyer, 1994). A number of biological systems indicate that, during development, cells vary in their inherent sensitivity or resistance to a given death stimulus. The ratio of bcl-2:bax represents one cell-autonomous rheostat that predetermines a cell's life or death response to an apoptotic stimulus.
Other interactions between Bcl-2 family members include Bcl-2 and Bak (Chittenden et
al., 1995; Chittenden et al., 1995), Bcl-xs (Boise et al., 1993) or Bad (Yang et al.,
1995); Bcl-xLand Bcl-xs (Boise et al., 1993); E1B 19K and Bak (Farrow et al., 1995),
30

Bax or Nbk/Bikl (Han and White, 1995); Bcl-xL and Bak (Farrow et al., 1995) (see Table 1.5.2).
Three conserved regions within Bcl-2-related proteins have been identified, bcl-1 homology 1 (BH1), homology 2 (BH2) (Yin et al., 1994) and homology 3 (BH3) (Chittenden et al., 1995; Chittenden et al., 1995). These conserved motifs control protein- protein interactions. Selected mutations within BH1 or BH2 of bcl-2 disrupt its heterodimerisation with bax, but not its homodimerisation, and destroy the ability o f bcl-2 to counter apoptosis (Yin et al., 1994), demonstrating that bcl-2 must heterodimerise with bax to function.
The difference between Bcl-xL and Bcl-xs is that Bcl-xL contains the BH1 and BH2 domains, which w ill inhibit apoptosis, while the short version, bcl-xs, lacks those motifs and favours death (Boise et al., 1993).
The ability of the bcl-2 family proteins to dimerise is not restricted to proteins within the family. Bcl-2 can dimerise with R-ras which accelerates apoptosis (Wang et al., 1995), while Bag-1 enhances the ability of bcl-2 to block apoptosis (Takayama et al., 1995) (see Table 1.5.3).
Another protein implicated in resistance to apoptosis is the bcr-abl oncoprotein. In chronic myelocytic leukeamia (CML) cells, translocation of the c-abl gene from chromosome 7 to chromosome 22 leads to the formation of a bcr-abl fusion protein. This results in the up- regulation of abl tyrosine kinase activity. Transfection of v-abl in HL-60 resulted in the acquisition of resistance to spontaneous and induced apoptosis (McGahon et al., 1994). CML cells isolated from newly diagnosed, untreated patients showed increased resistance to spontaneous or drug-induced apoptosis comared to normal granuolcytes. The CML cell line, K562, is more resistant to apoptosis compared to cell lines derived from other types o f leukaemias. Antisense strategies, which reduce the levels of fusion protein in K562 cells restored sensitivity to apoptosis (McGahon et al., 1994).
31

Table 1.5.1
Apoptotic protectors Apoptotic inducers
Bax
Bak
Nbk/Bikl
Bcl-xs
Bad
Bcl-2 family members
Table 1.5.2
Bcl-2 family interactions
Bcl-2 + Bax
Bcl-2 + Bak
Bcl-2 + Bcl-xs
Bcl-2 + Bad
Bcl-xL -I- Bcl-xs
E1B 19K + Bak E1B 19K + Bax E1B 19K + Nbk/Bikl
Bcl-xL + Bak
Bcl-2Bcl-xLMcl-1E1B 19KBHRF1Ced-9bcr-abl
32

Proteins which interact w ith Bcl-2 fam ily members
Apoptotic protectors Apoptotic inducers
Bcl-2 + Bag-1 Bcl-2 4- R-ras
Table 1.5.3
1.5.2 ICE / Apoptotic proteases
The ced-3 protein may act as a cysteine protease which may have an important role in the execution pathway of apoptosis in both C.elegans and mammalian cells, ced-3 has close homology with the human interleukin-1 B-converting enzyme (ICE). ICE is a cysteine protease with a novel specificity for aspartic acid. ICE is comprised of two sub-units (p20 and plO) both of which can be autocatalytically derived from an inactive 45 kDa proenzyme (Thornberry et al., 1992). Transient overproduction of ICE or CED-3 w ill cause Rat-1 fibroblast cells to die. This effect o f ICE can be countered by bcl-2 (Miura et
al., 1993).
There is another protease with specificity for aspartic acid, a serine protease called Granzyme B, also known as fragmentin 2. Granzyme B is stored within the cytolytic granules o f cytotoxic T cells (CTL), and it is transferred upon CTL attack to recognised target cells (Heusel et al., 1994).
Other ICE-like genes have been identified; NEDD-l/ICH-1 demonstrates only 29% identity and 52% similarity with ICE but the sequence QACRG, which contains the active
33

cysteine residue required for the proteolytic activity of ICE, is conserved. Overproduction of this protein w ill induce cell death that can be blocked by bcl-2 (Kumar et al., 1994; Wang et al., 1994). However, Wang et al (1994) also noted a truncated version of ICH-1 generated by alternative RNA splicing. This truncated version (ICH-1S) begins to diverge immediately following the QACRG active site and terminates shortly downstream. When overproduced, ICH-1S countered the death-inducing effect of the fu ll length ICH-1L protein. This system provides another example of positive/negative regulation of apoptosis encoded within the same gene or gene family.
Transcription factors such as myc, fos, jun and p53 are intimately associated with cellular proliferation and are also important in apoptosis. The transcription factor c-rel w ill induce apoptosis in bone marrow cells when expressed at high levels (Abbadie et al., 1993). c- fos is expressed immediately prior to apoptosis in many cells in vivo (Smeyne et al.,
1993). Deregulated c-myc expression is a potent inducer of apoptosis. Overexpression of c-myc during cell cycle arrest, e.g. following deprivation of growth factors or forcible arrest with cytostatic drugs induces apoptosis (Evan et al., 1994). Expression of the c- myc gene is rapidly induced upon addition of serum to quiescent cells, and its expression is followed by mitosis. However, overexpression of c-myc in quiescent rat-1 fibroblasts maintained without serum leads to apoptosis (Evan et al., 1992). This is most likely due to regulation of gene transcription by the myc-max heterodimer (Evan et al., 1992). Thus, the induction of c-myc in cells grown in the presence of appropriate growth factors or co-expression of other 'survival genes' such as bcl-2, causes cell proliferation. In the absence of these factors, c-myc expression causes cell death.
The complexity o f pathways which induce apoptosis and the variety of unique proteins in the ICE and bcl-2 families argues for the existence of different pathways each using one or more family members to regulate induction of apoptosis within a given tissue or for a particular differentiation program (Martin et al., 1995).
34

1.6 Apoptosis and Chemotherapy
Research into apoptosis from a cancer research perspective has focused on three main areas; oncogenesis i.e. the ability to acquire genes (e.g. bcl-2) which prevent apoptosis and therefore prolong the life of a cell; tumour homeostasis i.e. the growth of a tumour is now thought to be a balance between the rate of apoptosis and mitosis within the tumour mass (Staunton and Gaffney, 1995); and the mechanism of action of cytotoxic drugs.
The exact mechanisms by which chemotherapeutic agents are cytotoxic are unclear. Several chemotherapeutic agents commonly used in the treatment of both solid and haematologic malignancies have been shown to be able to induce apoptosis in a number of cell lines in vitro. These include cisplatin (Demarcq et a l, 1994), adriamycin (Ling et
al., 1993; Skladanowski and Konopa, 1993; Smith et al., 1994), DNA alkylating agents (O'Connor et al., 1991; Gorczyca et al., 1993; O'Connor et al., 1993), macromolecular synthesis inhibitors (Gorczyca et al., 1993) and other topoisomerase I and II inhibitors (Solary et al., 1994; Dubrez et al., 1995). The kinetics of cell death by each of these agents varies depending upon the cells under study.
As discussed previously, chemotherapeutic drugs cause DNA damage, this damage disrupts the cell cycle, induces cell cycle perturbations and initiates cell death. Arrest of the cell cycle in Gi or G2 in response to DNA damage is the result of activation of p53. p53 mediated arrest leads to either the repair of the damaged DNA and cell recovery or the induction of apoptosis. In p53 negative cells, apoptosis can still occur by a p53- independent mechanism (Lowe et al., 1993). p53 has also been shown to have a direct effect on apoptosis by downregulating bcl-2 expression and upregulating bax expression (Miyashita et al., 1994).
p53 induction in response to DNA damage activates the expression of a number of genes p21WAF1/cn>1, GADD45, mdm2, bax and cyclin G, the function of which has yet to be determined (Enoch and Norbury, 1995; Miyashita and Reed, 1995).
35

Induction of the p21 protein w ill lead to a transient arrest in and G2 since p21 inhibits the CDK complexes (Section 1.3.4). As an inhibitor of the CDKs, p21 contributes to Gj arrest by preventing the phosphorylation of Rb. Hypophosphorylated Rb binds to and inactivates the E2F family of transcription factors which control the expression of proteins important for entry into S-phase.
p53 acts as a specific transactivator of the GADD45 gene (Kastan et al., 1992; Zhan et
al., 1994) though other types of DNA damage induce GADD45 by p53-independent mechanisms (Kastan et al., 1992; Zhan et al., 1993). Overexpression of GADD45 inhibits colony formation in clonogenic assays (Zhan et a l, 1994), suggesting a role in cellular proliferation and/or cell survival. The mechanism of action of GADD45 is unknown although there is a physical association between gadd45 protein and PCNA ( (Smith et al., 1994). It is thought that gadd45 participates in the DNA repair process and that overexpression of gadd45 inhibits DNA synthesis (Smith et al., 1994).
The mdm2 oncoprotein is also transcriptionally activated by p53 following DNA damage (Perry et al., 1993; Chen et al., 1994; Price and Park, 1994) . mdm2 is a 54kDa nuclear phosphoprotein which forms complexes with both wild-type and mutant p53. This interaction inhibits wild-type p53-directed transcription of target genes (Oliner et al.,
1993; Chen et al., 1994). It has been suggested that the mdm2 may serve as an element of a feedback loop with p53 (Chen et al., 1994; Price and Park, 1994). p53 induces the expression of mdm2, which in turn binds to and inactivates p53. mdm2 may be involved in cellular recovery from the cell cycle arrest caused by p53 induction, allowing the cells to resume cycling after the DNA damage has been repaired (Kastan et al., 1995).
36

1.7 Cell Cycle and Apoptosis
The role of cell cycle proteins in apoptosis is unclear. It has been proposed that apoptosis may be a result of aberrant cell cycle control, i.e. apoptosis may be a consequence of conflicting growth regulatory signals which lead to an unsuccessful attempt at traversing the cell cycle (Freeman et al., 1994; Kastan et al., 1995).
Apoptosis has a number of features i.e. cell rounding, nuclear envelope breakdown and chromatin condensation, which are also characteristic of mitosis. This has led researchers to investigate the role of cyclin B/cdk2 and cyclin B/cdc2 during apoptosis.
In YAC lymphoma cells, cyclin B/cdc2 was found to be essential during serine protease induced apoptosis (Shi et al., 1994). Overexpression of Weel has been found to inhibit this effect (Chen et al., 1995). Cyclin B/cdc2 kinase activity was also found to be elevated in HL-60 cells treated with camptothecin or etopside (Shimizu et al., 1995). In A 1.1 hybridoma cells induced to undergo apoptosis when the T receptor is cross-linked with anti-CD3 antibodies, apoptosis was blocked with cyclin antisense oligonucleotides (Fotedar et al., 1995). However, no cdc2 kinase activity was found during apoptosis in FT-210 cells (Martin et al., 1995), an embryonic fibroblast cell line during chromatin condensation (Oberhammer et al., 1994), thymocytes, which die during G0 (Norbury et
al., 1994) and neurons (Freeman et al., 1994).
The role of cyclin A is less clear. Rat fibroblasts undergoing apoptosis increase cyclin A mRNA levels while cyclins B, C, D1 and E remain unaffected, and deregulated expression of cyclin-A was found to be sufficient to induce apoptosis in cells exposed to low serum (Hoang et al., 1994). HeLa cells arrested in S phase have increased cyclin A kinase activity when induced to undergo S phase apoptosis by caffeine, okadaic acid, staurosporine, di-methylaminepurine or TNF-a (Meikrnatz et al., 1994). HIV-1 Tat protein induced apoptosis in CD4 T-lymphocytes has elevated levels of CDK2 and cdc2 activity which can be inhibited by antisense oligonucleotides to cyclin A, B and E (Li et
al., 1995). However, there has been no increase in cyclin A levels in HL-60 cells (Dou et
37

al., 1995; Shimizu et al., 1995) and neurons (Freeman et al., 1994) undergoing apoptosis. HL-60 cells exposed to cytosine arabinoside increase cyclin E kinase activity (Dou etal., 1995).
Thus although CDK2/cdc2 activity is induced during apoptosis in some systems there is no evidence that it is necessary. Other studies have shown the involvement o f other cell cycle proteins. Cyclin D1 expression is selectively induced in post-mitotic neurons undergoing programmed cell death (Freeman et al., 1994; Kranenburg et al., 1996). Overexpression of p58 PITSLRE, a CDK-related kinase, was found to initiate apoptosis and the kinase activity of p58 was elevated during Fas induced apoptosis in human T cells (Lahti et al.,
1995).
Fotedar et al (1995) suggest that there are at least 2 apoptotic pathways in T cell death; one which is dependent on activation through surface receptors (e.g. anti-CD3) leading to cyclin B-dependent cell death during G2/M and a second (e.g. dexamethasone-induced pathway) which is independent of cell activation and cyclin B.
While there is a single apoptotic pathway and a single effector molecule in Caenorhabditis elegans. this is not the case in higher eukaryotic cells. The variety of unique proteins in the ICE and bcl-2 families argues for the existence o f different pathways each using one or more family members to regulate induction of apoptosis. Cdc2, as a member of a larger family of CDK effectors, participates in some of these apoptotic pathways, although it is unknown whether all pathways would necessarily involve a CDK effector (Martin et al.,
1995).
1.8 Necrosis
Necrosis is a passive mode of cell death, characterised by an increase in cell volume which ultimately leads to cell lysis. Necrosis is not genetically influenced, does not appear to
38

require expression of new mRNAs or proteins and would seem to be uncontrollable in terms of drug intervention (Dive and Hickman, 1991).
It is thought that necrosis is initiated by cellular damage that disrupts osmotic balance. Ions, especially Ca++, enter the cell passively and the cell swells with H20 because of ion influx. Increasing Ca++ can also inhibit some enzymatic pathways e.g. ATP production and stimulate others e.g. proteolysis. An early fall in ATP precedes a fatal disruption of the ionic gradients within the cell. The cell ruptures to spill out degradative lysosomal enzymes which mediate an inflammatory reaction in the immediate locality.
The choice to between dying actively by apoptosis or passively by necrosis, appears to depend on the severity o f the injury inflicted on the cell. Higher doses of cytotoxic drugs tend to cause necrosis rather than apoptosis, although this effect was not evident with VP- 16 (Marks and Fox, 1991).
HL-60 cells exposed to melphalan or chlorambucil, showed that the mode of cell death depended on the levels of intracellular reduced glutathione (GSH). Reducing the levels of GSH induced necrosis at concentrations that would normally induce apoptosis. The monocytic cell line, U937 and the chronic myelogenous leukaemia line, K562, have been found to be more resistant to melphalan or chlorambucil and were found to contain higher levels of GSH as compared to the HL-60 line (Fernandes and Cotter, 1994). This suggests that intracellular levels of GSH might preset the injury-levels the cell can sustain before it becomes too damaged to undergo apoptosis and dies by necrosis.
39

1.9 Multidrug Resistance
Successful systemic cancer chemotherapy was not developed until 1942 when Gilman, Goodman, Lindskog and Dougherty used nitrogen mustard in a patient with lymphosarcoma. However, the clinical course of this first patient treated is reflected in the use o f anticancer drugs today. He was administered nitrogen mustard for 10 days. Within that time there was a noticeable regression of the tumour. However, about 3V2 weeks after initiation of therapy the total white blood cell count decreased down to 200 cells/cubic millimeter. Subsequently, the bone marrow gradually recovered, but so did the tumour. A second, shorter course of treatment produced a transient improvement, and a third course had virtually no effect. Thus, the therapy-limiting effect of marrow toxicity and the development of drug resistance, both of which are still problems in cancer chemotherapy, were observed in the first patient.
Approximately 50% of patients with cancer can be cured by surgery and radiation therapy since their tumours have not spread. Of the remaining 50%, 10% are curable with systemic chemotherapy, including children with leukaemia and sarcomas and adults with testicular cancer and choriocarcinoma. However, the majority of metastatic cancers are not currently curable by chemotherapy or by any other kind of therapy. These cancers fall into two categories; cancers which are intrinsically resistant to chemotherapy (i.e. there is no significant response to chemotherapy); and those cancers which respond initially to chemotherapy but then acquire resistance during the course of therapy.
When a population resistant to an administered drug develops, this new population may also be resistant to a number of other chemotherapy drugs, even if they are structurally dissimilar and have different modes of action. This is called Multidrug Resistance (MDR).
40

1.9.1 P-glycoprotein
Currently the best understood mechanism of MDR is the resistance mediated by the MDR1 gene product, P-glycoprotein (P-170). P-glycoprotein is a 170 kDa glycoprotein, 1280 amino acids in length and consists of 12 transmembrane domains and two nucleotide binding sites (see figure 1.9.1). It acts as an energy-dependent transmembrane efflux pump that actively transports chemotherapeutic agents out of the cell. Several structurally and functionally unrelated agents, including anthracyclines (doxorubicin, daunorubicin), vinca alkaloids (vincristine, vinblastine), epipodophyllotoxins (VP-16, VM-26), taxanes (paclitaxel, docetaxel), and actinomycin D are substrates for P-glycoprotein.
There are two human MDR genes, MDR1 and MDR3 (Roninson et al., 1986; Van der Bliek et al., 1986). However only fu ll cDNA from the MDR1 gene can confer the MDR phenotype (Gros et al., 1986; Ueda et al., 1987). Although P-glycoprotein is believed to be a pump that actively effluxes drugs from resistant cells (Dano, 1973; Safa et al.,
1987), the actual mechanism for this activity is not understood.
P-glycoprotein is a member of the ATP binding cassette (ABC) superfamily of transport systems which includes over 30 proteins that share extensive sequence similarity and domain organisation (Hyde et al., 1990). There are marked similarities in sequence and apparent structure between P-glycoprotein and a number of prokaryotic transport proteins (Chen et al., 1986; Higgins, 1989); including HLYB, the ATP-binding haemolysin export protein in Escherichia coli (Felmelee et al., 1985; Blight and Holland, 1990); pfMDR, the MDR gene in Malaria parasites Plasmodium falciparum (Foote et al., 1989); CFTR, the product of the cystic fibrosis (Riordan et al., 1989; Hyde et a l, 1990).
P-glycoprotein expression has been detected in a number of normal tissues; liver, adrenal gland, pancreas, kidney colon and jejunum (Fojo et al., 1987). Localisation within these tissues appears to be extremely specific; apical surface of epithelial cells in liver, kidney, colon, and jejunum; biliary canalicular front of hepatocytes; on small biliary and pancreatic ductules; on the adrenal cortex (Thiebaut et a l, 1987; Sugawara et al., 1988)
41

human placenta (Sugawara et al., 1988) and is expressed in specialised endothelial cells in the brain and testis (Cordon-Cardo et al., 1990).
The localisation o f P-glycoprotein to specialised cells in human tissues indicates that it might be involved in transepithelial secretion of toxic substances or unknown cellular metabolites into the bile or the lumen of the GI tract. The fact that the MDR1 gene can be co-induced with the P450A1 gene probably supports this (Burt and Thorgeirsson, 1988).
Expression o f the MDR1 gene is in general, high in those tumours which derive from tissues that naturally express high levels of P-glycoprotein i.e. tumours derived from the colon, kidney, liver and pancreas. In poorly differentiated tumours of the kidney and colon the levels may often be lower because of the altered differentiation state of these tumours . Expression o f the MDR1 gene is sometimes high in leukaemias, lymphomas and some other tissues that do not normally express the MDR1 gene. Several tumour types have low levels o f the MDR1 gene and are known to be drug sensitive. These include Wilm 's tumour and cancer of the ovary and breast (see Table 1.9.1). However a number of tumours exhibit low levels of MDR1 expression but are resistant to chemotherapy, for example adenocarcinoma of the lung and non small cell lung cancer (Pastan and Gottesman, 1991).
42

Table 1.9.1
MDR expression in untreated Human Cancers
High Sometimes High Low
Colon Acute Leukaemias SCLCKidney Lymphomas NSCLCLiver NSCLC-NE Gastric
Adrenal CML OesophagealPancreas Neuroblastoma Ovary
Wilm'sHead and Neck
MyelomaBreast
Table 1.9.2
Cancers in which MDR1 expression has been found to increase after chemotherapy
Acute LeukaemiasBreastLymphomasMultiple MyelomaNeuroblastomaOvaryPheochromocytomaRhabdomyosarcomaSarcomas
43

1.9.2 Multidrug Resistance Related Protein
Despite the widespread occurence of drug resistance in human lung tumours, overexpression of P-glycoprotein is infrequent. This implies that alternative mechanisms of resistance exist (Cole et al., 1992).
Overexpression of the Multidrug Resistance Related Protein (MRP) is sufficient to confer multidrug resistance (Cole et al., 1992). MRP is a 1531-amino acid, 190-kDa glycoprotein, that is overexpressed in a number of non-P-glycoprotein MDR cell lines (Krishnamachary and Center, 1993; Zaman et al., 1993). MRP has been detected in a number of normal human tissues, including lung, stomach, colon, peripheral blood macrophages, thyroid, testis, nerve, bladder, adrenal, ovary, pancreas, gall-bladder, duodenum, heart, muscle, placenta, brain, kidney, liver and spleen (Cole et al., 1992; Zaman etal., 1993).
MRP has minor sequence homology to P-glycoprotein but it is most related to the ABC-transporter encoded by the pgpA gene of Leishmania tarentolae. This protein is involved in low level oxyanion (arsenite) resistance, rather than resistance to hydrophobic drugs (Zamanetal., 1993).
MRP functions as an ATP dependent export pump for endogenous as well as exogenous glutathione, glucuronidated and sulfated conjugates (Jedlitschky et al., 1996).
MRP-transfected cell lines demonstrated a 5-15 fold more resistant profile to adriamycin, daunorubicin, epirubicin, vincristine and VP-16, <3 fold resistance to taxol, vinblastine and colchicine and no cross resistance was observed to 9-alkyl anthracyclines, mitoxantrone or cisplatin. There was also cross resistance to some heavy metal anions including arsenite, arsenate, and trivalent and pentavalent antimonials but not to cadmium chloride. Thus, the MDR phenotype conferred by MRP is similar but not identical to that conferred by P-glycoprotein (Cole et al., 1994).
MRP is predominantly located in the endoplasmic reticulum of resistant cells but lower levels are also contained in the plasma membrane (Krishnamachary and Center,1993).
44

Because the cellular accumulation of chemotherapeutic drugs appears unchanged in MRP overexpressing cell lines it is thought that MRP may participate directly in the active transport of drugs into subcellular organelles or influence drug distribution indirectly (Cole et al., 1992; Krishnamachary and Center, 1993)
Immunohistochemical examination of 61 human cell lines demonstrated that some of the most sensitive cell lines had a relatively high expression of MRP suggesting that resistance may not be a simple function of the level of MRP (Izquierdo et al., 1996).
1.9.3 Transporter-related with Antigen Presentation
Another member o f the ABC-transporter superfamily which has been found to be overexpressed in a number of MDR cell lines of different histogenic origin is the Transporter-related with Antigen Presentation (TAP) (Izquierdo, 1996). TAP is a heterodimer formed by the TAPI and TAP2 gene products and a plays a role in MHC class I restricted antigen presentation by mediating peptide translocation over the endoplasmic reticulum membrane (Neefjes et al., 1993).
Transfection o f the TAP genes into mutant lymphoblastoid cells lacking TAP genes, showed a 2-3 fold increase in resistance to VP-16, vincristine and adriamycin. High concentrations o f VP-16 or vincristine were able to inhibit the TAP-mediated transport of a model peptide into the endoplasmic reticulum (Izquierdo, 1996).
1.9.4 Lung Resistance-related Protein
Lung resistance-related protein (LRP) was first identified as a 110 kDa vesicular protein overexpressed in a non-P-glycoprotein MDR lung cell line (Scheper et al., 1993). LRP expression was seen in bronchus, digestive tract, renal proximal tubules, keratinocytes, macrophages, and the adrenal cortex, varying levels were observed in other organs. Expression of LRP in normal tissues parallels that of other drug-resistance related proteins
45

such as P-glycoprotein and MRP (Izquierdo et al., 1996). The LRP gene was found to be located on chromosome 16pll.2, 27 cM, proximal to the MRP gene (16pl3.1) (Izquierdo, 1996). When it was cloned and sequenced it was found to be the major component of vaults (Scheffer etal., 1995).
Vaults were first identified by negative staining and transmission EM in 1986, as contaminant particles o f clathrin-coated vesicle preparations derived from rat liver (Kedersha and Rome, 1986). Vaults were subsequently isolated from various species including a lower eukaryote Dictvostelium discoideum. amphibians, avians, and mammals and are highly conserved among different species supporting the notion that their function is essential to eukaryotic cells (Kedersha et al., 1990).
As found with LRP in normal human tissues, the expression of vaults in other species is most abundant in epithelial cells (i.e. rat intestine) and macrophages (rat alveolar macrophages) (Kedersha et al., 1990). In rats, vaults are ribonucleoprotein particles composed of a major vault protein of 104kDa (accounting for >70% of the mass and is equivalent to LRP), three minor proteins of 210, 192 and 54kDa and a small RNA molecule. These are assembled in a barrel-like structure o f approx. 57 x 32 nm with a molecular mass of about 13MDa, which is 3 times the size of a ribosome. The vault particle has 2-fold symmetry, and each half can be opened into a flower-like structure which contains eight petals surrounding a central ring (Kedersha et al., 1991). These dynamic structural variations are likely to play a role in vault function. Most vaults are present in the cytoplasm and most cells contain thousands of vaults although there precise function is unknown (Chugani et al., 1993).
Vaults structure and localisation support a transport function for this particle which could involve a variety o f substances. It is thought that vaults may play a role in drug resistance by regulating the nucleocytoplasmic transport of drugs.
Low levels o f LRP positivity were seen in testicular cancer, neuroblastoma and acute myeloid leukaemia, intermediate levels in ovarian cancer and high levels in colon, renal and pancreatic carcinomas (Izquierdo et al., 1996). MRP and LRP were found to be widely expressed in a panel o f 61 human cancer cell lines as opposed to the low frequency of expression of P-glycoprotein. LRP was also found to be a superior marker of in vitro
drug resistance compared to P-glycoprotein and MRP (Izquierdo et al., 1996). Positivity
46

of LRP in primary ovarian cancer was significantly associated with a worse response to chemotherapy, a shorter progression-free interval and shorter overall survival (Izquierdo etal., 1995).
1.10 Alternative Mechanisms o f Resistance
The above mechanisms do not account for all the types of resistance observed.
1.10.1 Topoisomerase II
Alterations in topoisomerase II can lead to resistance to anthracyclines and the epipodophyllotoxins (De Isabella et al., 1990) but not to the vinca alkaloids. Changes in topoisomerase-II can occur via a number o f mechanisms;
i) Quantitative changes
A number of cell lines selected for resistance to VP-16 have decreased topoisomerase-II content (Ferguson et al., 1988; Liu et al., 1989; Heenan, 1994). A decrease in cellular content of topoisomerase-II in many instances contributes to MDR. This results in a decreased number of drug-induced topoisomerase-II DNA strands breaks and thus confers resistance to topoisomerase-II drugs. The decrease in topoisomerase-II content can be caused by gene inactivation e.g. gene rearrangement and/or hypermethylation (Tan et a l,
1989), leading diminished transcription, or possibly post-translational events (Deffie et
al., 1992).
47

Hi Decreased drug-induced DNA cleavage
In a CHO cell line selected for resistance to VM-26, the cellular amounts and catalytic activity of topoisomerase-II were equal in resistant and wild-type cells. The topoisomerase-II cleaved DNA normally but was insensitive to drug inhibition of religation (Glisson et al., 1986; Sullivan et al., 1989). Subsequendy the normal allele of topoisomerase-II was found to be lost and a point mutation was found (Chan et al.,
1993). Further mutations in the gene which confer decreased cleavage and religation activity due to alterations in ATP binding has been described (Danks et al., 1989).
iii) Differential expression of topoisomerase-II isoforms
In various resistant cell lines there can be alterations in isoform expression compared to the parent cell line. For example, an m-AMSA-resistant P388 cell line, in which the content of the pl70 topoisomerase-II isoform was reduced, whereas there was no difference in expression of the p i80 isoform (Drake et al., 1987).
iv) Altered subcellular distribution of topoisomerase-II
In a VM-26-resistant CCRF-CEM cell line less topoisomerase-II was detected in the nuclear matrix, whereas the amount o f total nuclear topoisomerase-II was equal in resistant and sensitive cells. The catalytic activity of topoisomerase-II in nuclear matrix preparations were reduced 6-7 fold in the resistant cell lines. It is thought that a mutation in the enzyme may impair its incorporation into the nuclear matrix (Fernandes et al., 1990).
v l Changes in extrinsic factors modulating topoisomerase-II activity
Cytosolic proteins may modulate the activity of topoisomerase-II. A VP-16-resistant human melanoma cell line, where drug uptake was unchanged and the catalytic activity and drug-induced DNA strand breaks mediated by isolated topoisomerase-II were similar
48

from resistant and sensitive cells had decreased drug-induced cleavage in whole cells although it was unchanged in isolated nuclei (Campain et al., 1993).
The formation of an m-AMSA-induced topoisomerase-II-DNA complex in isolated nuclei was reduced compared to whole cells from the murine mastocytoma cell line K21 (Darkin and Ralph, 1989). When protein from cytoplasmic extracts was added, complex formation was increased to the same level as in whole cells. This protein was tentatively identified as a type of casein kinase (Darkin-Rattray and Ralph, 1991). Thus, the resistance of quiescent cells to topoisomerase-II-active drugs may be explained by decreased activation of topoisomerase-II.
v il Phosphorylation of Topoisomerase-II
Stimulation o f topoisomerase-II activity has been shown by phosphorylation in vivo
(Ackerman et al., 1988). Casein kinase II (Ackerman et al., 1985), protein kinase C (Rottmann et al., 1987) and a cAMP-independent protein kinase (Sander et al., 1984) have been shown to phosphorylate topoisomerase-II in vitro. Changes in phosphorylation o f topoisomerase-II caused by mutations in protein kinases or phosphorylation sites on topoisomerase-II could result in drug resistance. Although this has yet to be proven, it has been shown that phosphorylation of topoisomerase-II decreases its sensitivity to drug- induced DNA cleavage, while increasing the overall catalytic activity (DeVore et al.,
1992).
1.10.2 Glutathione S-transferases
Many active chemotherapeutic agents are electrophiles and are subject to conjugation with molecules such as glutathione and glucuronic acid to facilitate transport, metabolism and ultimately excretion. In almost all animal models of carcinogenesis there is overexpression
49

of conjugation enzymes, amongst which the glutathione S-transferases (GSTs) have been most extensively studied. Many human cancers show overexpression of GSTs, although a significant proportion of liver and breast carcinomas may show no expression at all, despite being resistant to drugs metabolised by these enzymes (Harrison, 1995).
GSTs are a family of multifunctional enzymes which play an important role in the detoxification of cytotoxic compounds and mediate the conjugation of cytotoxic drugs and carcinogens with reduced glutathione. GSTs are a widely distributed family of enzymes, expressed in most normal tissues. In general, the enzymes are rather low in catalytic activity but present in high abundance, accounting for approximately 6% of liver cytosolic protein. Overexpression of GSTs (GST-71 is the most commonly elevated isoenzyme) is commonly associated with increased P-glycoprotein expression in leukaemias (Gekeler et
al., 1992) leading to the hypothesis that GSTs may serve the drug efflux pump with its substrate, thereby increasing the efficiency of drug exclusion from the cell. However, clear evidence for a direct metabolic role of GSTs in tumour cell resistance is still lacking.
1.10.3 BcI-2 / p53
Alterations in levels of proteins involved in the apoptotic pathway may prevent drug- induced cell death. The tumour suppressor gene p53 acts as a sensor in cells detecting DNA strand breakage and preventing a cell from proliferating whilst bearing damaged or mutated DNA (Kastan et al., 1991). In some systems p53 causes cell cycle arrest at the Gr S interface, but in other situations p53 commits a cell to die by apoptosis (Clarke et
al., 1993). Thus, in mouse thymocytes, absence of p53 confers resistance to the topoisomerase II inhibitor VP-16, even though this drug can k ill lymphoid cells in and out of the cell cycle (Dive and Wyllie, ).
Overexpression of bcl-2 oncogene in lymphoma cell lines (Miyashita and Reed, 1993), murine FL5.12 (Walton et al., 1993) and neuroblastoma cells (Dole et al., 1994) confers drug resistance and is of proven clinical significance.
50

Increased levels of bcl-2 and decreased levels of bax may elevate drug resistance and thereby cause a broad spectrum of drug resistance (R. NicAmhlaoibh, personal communication).
Elevations o f the bcl-2 : bax ratio do not prevent drug-induced apoptosis but rather shifts the dose response curve so that an increased concentration of drug is required to achieve an equivalent tumour cell kill.
Overexpression of bcl-xs in MCF-7 cells induces sensitisation to apoptosis induced by low concentrations of VP-16 and Taxol (Sumantran et al., 1995). Overexpression of bcl-xL inhibited both cisplatin and cyclophosphamide induced cell death in the shep-1 cell line (Dole et al., 1995) and decreased the cytotoxicity of bleomycin, cisplatin, VP-16 and vincristine in FL5.12 murine cells. Overexpression of bcl-xL did not prevent cells from undergoing cell cycle arrest in response to these drugs rather it prevented the treated cells from undergoing apoptosis (Minn et al., 1995).
1.10.4 Metallothioneins
Metallothioneins (MT) are intracellular proteins of low molecular weight (6-7 kDa) that are characterised by a high content o f cysteine and the ability to bind heavy metals. Most tissues have a basel level of MT although their physiological function is not well understood. MT have been demonstrated in a variety of malignancies including colorectal, testicular germ cell, ovarian and lung tumours. The synthesis of MT by tumour cells has been proposed as a possible mechanism for the intracellular inactivation of metal- containing chemotherapeutic agents such as cisplatin. Cells transfected with MT were found to be resistant to cisplatin, chlorobucil, melphalan and doxorubicin. Cells of various origins selected for cisplatin resistance often, but not always show an increased MT
51

expression. In human NSCLC a significant relationship was found between MT expression and doxorubicin resistance in vitro (Mattern and Volm, 1995).
1.10.5 DNA repair mechanisms
The DNA repair protein, 06-alkylguanine DNA alkyltransferase is a major contributor to the resistance to nitrosurea, triazine class of alkylating agents (Gerson and Wilson 1995). DNA repair is a vast subject, directly involving up to 200 different genes (Harrison,1995) reviewed in Friedburg (Friedberg, 1985). In general, two fundamental reactions are involved in cellular responses to DNA damage; (i) repair of the damage and (ii) tolerance of the damage. Different DNA repair mechanisms are shown in Table 1.10.1.
Table 1.10.1
Mechanisms o f drug repair, modulations of which may be important in altering tumour sensitivity to drugs
Mechanism Function Drugs affected
Mismatch repair
Excision repair
Recombination
Other
Removal of mismatched bases
Removal of drug/DNA adducts
Double-strand break repair
Dealkylation and deamination
cisp latin
Alkylating agents
Bleomycin, irradiation
Nitrosoureas
52

The reality of MDR is not as simple as just explained and may involve more than one mechanism coexpressed in the same cell. Resistant cells in situ are usually not more than 5 to 10 fold resistant compared to in vitro models whereby resistance may increase 100- or 1000-fold (Simon and Schindler, 1994).
1.11 M DR circumvention:
The best understood mechanism of MDR is the resistance mediated by P-glycoprotein. Should this protein be inhibited then there is a restoration of cytotoxic drug accumulation in MDR cells. This is the present rational for the circumvention of MDR and two approaches are being taken; pharmacological intervention and genetic antisense technology.
1.11.1 Pharmacological circumvention
A number o f compounds have been identified which inhibit the efflux of chemotherapeutic drugs by P-glycoprotein and reverse cellular resistance in eperimental systems. These chemosensitisers may block cytotoxic drug efflux by acting as competive or noncompetive inhibitors, perhaps by binding to similar drug substrate binding sites, or to other chemosensitiser binding sites that cause allosteric changes resulting in inhibition of cytotoxic drug binding (Ford, 1995). The majority of chemosensitisers described to date may be grouped into six broad categories, based on their primary pharmacologic activity; calcium channel blockers; calmodulin antagonists; steroids and hormonal analogues; cyclosporines; dipyridamole; miscellaneous other compounds (see Table 1.11.1).
53

Table 1.11.1 Selected pharmacologic agents with ability to reverse multidrug resistance (Ford, 1995)
Calcium channel blockers Verapamil Nifedipine Niguldipine Bepridil PAK-200 Roll-2933
Calmodulin Antagonists Trifluoperazine Prochlorperazine Fluphenazine Tram'-Flupenthixol
Vinca Alkaloid Analogs Vindoline Thaliblasdne
Steroidal AgentsProgesterone Tamoxifen Toremifene Megestrol acetate 17ß-Estradiol glucuronide
Immunosuppressive Drugs Cyclosporin A SDZ PSC 833 SDZ 280-446 FK506 Rapamycin
AntibioticsCefoperazoneCeftriaxoneErythromycin
Miscellaneous Compounds Dipyridamol BIBW22 Quinidine Chloroquine Terfenadine Reserpine Amiodarone Methodone S 9788 GF 120918 Tolyphorphin
A number of these compounds demonstrate circumvention ability in vitro but are too toxic for use in vivo. Verapamil, cyclosporin A and quinine have been used in early clinical trials, but the results have been disappointing so far.
Verapamil inhibits the P-glycoprotein-associated, energy-dependent drug efflux and is a potent and effective antagonist o f resistance to a number o f drugs in most MDR cell lines in vitro. Verapamil inhibits the binding of many chemotherapeutic drugs as well as other chemosensitisers to P-glycoprotein suggesting that the mechanism o f action of verapamil is through blocking the binding of drugs to P-glycoprotein (Ford, 1995). Spoelstra et al demonstrated that verapamil was actively transported by P-glycoprotein
54

and that verapamil and daunorubicin were non-competing substrates for P-glycoprotein. Therefore the effectiveness of verapamil as a MDR antagonist may be compromised because it may be extruded by P-glycoprotein (Spoelstra et al., 1994). The use of verapamil in humans is limited by its cardiovascular effects at plasma concentrations in the 2 to 6/xM range, which are needed for the antagonism of MDR in vitro.
Therefore more potent and less toxic chemosensitising agents other than verapamil have been investigated e.g. Roll-2933, which is ten fold more potent than verapamil with plasma levels in vivo o f less than 2fj.M effective in vitro (Ford, 1995).
Cyclosporin A, a hydrophobic cyclic peptide of 11 amino acids that is widely used in human organ transplantation, has been found to reverse resistance in MDR cells but not sensitive cells. Interestingly, cyclosporin A apparently does not inhibit the function of MRP in combination with doxorubicin, vincristine or mitoxantrone (van der Graaf et al.,
1994). Cyclosporin A has been found to act as a P-glycoprotein substrate and antagonise P-glycoprotein at least in part through competitive inhibition of cytotoxic drugs efflux (Ford, 1995). However because of the profound pharmacologic effects of cyclosporin A in
vivo (Erlichman et al., 1993), there has been an interest in developing the anti-MDR activity of other, less immunosuppressive or nephrotoxic cyclosporine analogues e.g. PSC 833 and PSC 280-446.
Attempts at chemomodulation of P-glycoprotein has been investigated using various P- glycoprotein antagonists. A lack of specificity (calcium antagonists) or toxic effects (cyclosporin A) however, result in a limited clinical application of these chemomodulators. Therefore a more specific modulation of MDR is necessary for an improved reduction in drug resistance.
55

1.11.2 Genetic circumvention
The results of circumvention compounds in clinical trials have been disappointing due to non-specific or toxic effects of the circumvention agent. Other alternatives such as molecular approaches may improve attempts at the reversal of MDR. A more specific interference with P-glycoprotein expression achieved by modern antisense technology may be more promising approach..
Ribozymes are RNA molecules which have catalytic activity. They were first discovered when the large ribosomal RNA (rRNA) precursor of Tetrahymena thermophila could selfsplice the intron and as the RNA component of the E.coli RNase P, an RNA-protein which could cleave the leader segment from precursor transfer RNA molecules. Subsequently the hammerhead ribozyme and hairpin ribozyme were discovered in viroids (helper viruses found in plants) and the hepatitis delta virus ribozyme was found in the hepatitis delta virus. These latter ribozymes cleave RNA which is synthesised in a rolling circle into individual RNA transcripts. Further research demonstrated that these RNA molecules with self-splicing activity could be manipulated to target specific RNA molecules. Once paired to a target site, the manipulated ribozymes can cleave single stranded RNA and thus functionally destroy the RNA target and several substrate molecules can be turned over by one molecule of catalytic RNA. The high specificity of ribozymes in RNA cleavage reactions has provided a new method in controlling gene expression artificially and this makes ribozymes potentially useful therapeutic agents.
The hammerhead ribozyme is the smallest of the ribozymes. Figure 1.11.2.1 shows the hammerhead ribozyme bound to a substrate. The non-based paired nucleotides of stem II make up the catalytic core. The substrate and the ribozyme hybridise to form stem I and stem III, orienting the -UH- nucleotides of the substrate over the catalytic core. The GUC nucleotide triplet is thought to yield the highest rate of cleavage compared to other cleavage triplet sequences. The hammerhead ribozyme has been the best characterised ribozyme with respect to optimised target sequence, conserved nucleotides sequences within the catalytic core, and the kinetic parameters. The target RNA cleavage sites have
56

the least constraints with respect to sequence and therefore are the most abundant sites compared to the other ribozyme types (Sullivan, 1994).
3’
N
N
Stem I NN
N
N A
A
A
A G
A G G C C
A C C G G
G A G
G A
U
Stem I
Figure 1.11.2.1 Structure of the hammerhead ribozyme.
The hammerhead ribozyme is in bold. Stem I and stem ID are the binding arms and stem n is a part of the
catalytic core. The H represents the cleaveage site of the the substrate RNA and may be an adenine, cytosine
or uridine (Sullivan, 1994).
A hammerhead ribozyme which cleaves the 3’-end of the GUC sequence in codon 880 of mdrl RNA was transfected into the pancreatic carcinoma cell line EPP85-181RDB , which is 1,600 fold-more resistant to daunorubicin than the parental cell line. Ribozyme decreased the level of mdrl mRNA expression, inhibited the formation of P-glycoprotein and reduced the cell’s resistance to daunorubicin. Cell clones that showed ribozyme
5’
N
N
N
N
N
N
U
H
Substrate cleavage site
N N N N N N N N N
N N N N N N N N N
CU
3’
5’
57

expression were only 5.3-fold more resistant than the parental cell line (Holm et al.,
1994). This ribozyme was also effective in two adriamycin resistant human lung carcinoma cell lines DLKP-A and SK-MES-l/Adr (Daly et a l, 1996).
Other researchers with different ribozymes have successfully reduced P-glycoprotein expression in the human colon adenocarcinoma cell line LoVo, a mouse sarcoma cell line S-180, a human oral epidermoid carcinoma cell line KB (Bertram et al., 1995) and a human plueral mesothelioma cell line (Kiehntopf et al., 1994). Interestingly, the expression of the c-fos ribozyme in A2780S human ovarian carcinoma cells, not only decreased the expression of c-fos but also the expression of the mdrl gene, c-jun and mutant p53. Reversal o f the MDR phenotype by an anti-MDR ribozyme occured one- fourth as rapidly as that induced by the anti-fos ribozyme (Scanlon et al., 1994).
1.12 Non-M DR chemosensitisers
There are a number of other non-chemotherapeutic drugs which enhance chemotherapeutic cytotoxicity by mechanisms other than reversal of drug resistance (reviewed in Stewart and Evans, 1989). These include buthionine sulfoximine (BSO) and other glutathionine depletors, the nitroimidazoles and the methylxanthines.
Glutathione helps to protect cells both by reacting with cytotoxic electrophile drug derivatives and by reacting with drug generated reactive oxygen compounds such as peroxides (Pratt et al., 1994). High glutathione levels were found to be associated with decreased DNA cross-link formation by some chemotherapy drugs. This reduction in DNA cross-link formation was probably due to intracellular drug inactivation by the glutathione rather than an increased rate of DNA repair (Stewart and Evans, 1989). BSO is structural analogue o f y-glutamylcysteine, which reduces cellular glutathione levels, by irreversibly inhibiting y-glutamylcysteine synthetase, the first enzyme involved in de novo
glutathione synthesis (Pratt et al., 1994). BSO also inhibits glutahtione transferase activity, and inhibits the uptake of cystine, a precursor of glutathione (Stewart and Evans,
58

1989). While BSO decreased glutathione concentrations in most normal tissues, the degree o f glutathione reduction in these normal tissues has not been as great as in tumour tissues. Chemotherapy toxicity to normal tissues (including bone marrow) was generally not augmented at BSO doses that enhanced chemotherapy efficacy against tumours (Lee et
al., 1987; Stewart and Evans, 1989; Siemann and Beyers, 1993).
The nitroimidazoles also potentiate the effect o f numerous chemotherapeutic drugs against hypoxic tumour cells. Although their mechanism of action is not well understood they are thought to act by decreasing tumour cell thiols, increasing DNA damage (in part from inhibition of repair processes) and possibly alterating tumour vasculature (Stewart and Evans, 1989).
The methylxanthines, which include caffeine and pentoxifylline, have also been found to potentiate the cytotoxic effect of chemotherapeutic drugs (Das et al., 1982; Hain et al.,
1993; Hain et al., 1994). The actual mechansim of action of methylxanthines is unclear although they are thought to act by interfering with the repair of DNA, preventing G2 arrest and prematurely inducung mitosis (Fingert et al., 1986; Schlegel and Pardee, 1986; Lock et al., 1994) or inhibiting the induction of, or indirectly inhibiting with postreplication repair mechanisms (Schiano et al., 1991). Methylxanthines are also reported to reduce the cytotoxicity of DNA damaging anti-topoisomerase drugs (including adriamycin, mitoxantrone, VP-16 and ellipticine). Intercalation between the drug and methylxanthine can lead to a decrease in the effective drug concentration available (Traganos et al., 1991; Traganos et al., 1993), while inhibition of RNA synthesis may also be a possible mechanism (Perez et al., 1994).
59

1.13 Aims of this thesis
The aims of this thesis were to examine the effect of combinations of different drugs on toxicity to sensitive and multidrug resistant cancer cells in vitro. Combinations of existing anticancer agents were analysed. Combinations o f anticancer drugs and a variety of chemosensitivity drugs used at nontoxic levels were then studied. Cellular models transfected with the MDR1 gene and an anti-MDRl ribozyme were also developed. Combinations o f a known anticancer agent with one of a series of coded non-toxic compounds known to be safe for human use were examined in a number of cell lines. The effects o f adding these compounds at different times after chemotherapeutic drug treatment were investigated. The rate and timing of apoptosis, progress through the cell cycle and levels of cell cycle-related proteins then were examined.
60

Materials and Methods

2.1 WATER
Ultrapure water was used in the preparation of all media and solutions. This water was purified by a reverse osmosis system (Millipore M illi-RO 10 Plus, Elgastat UHP) to a standard o f 12 - 18 MQ/cm resistance.
2.2 GLASSWARE
Solutions pertaining to cell culture and maintenance were prepared and stored in sterile glass bottles. Bottles (and lids) and all other glassware used for any cell-related work were prepared as follows:- all glassware and lids were soaked in a 2% (v/v) solution of RBS-25 (AGB Scientific) for at least 1 hour, after which they were scrubbed and rinsed several times in tap water. They were then washed by machine using Neodisher detergent which is an organic, phosphate-based acid detergent, rinsed twice with distilled water, once with ultrapure water and sterilised by autoclaving.
2.3 STERILISATION
Water, glassware and all thermostable solutions were sterilised by autoclaving at 120°C for 20 min. under pressure of lbar. Thermolabile solutions were filtered through a0.22(im sterile filter (Millipore, millex-gv). Low protein-binding filters were used for all protein-containing solutions.
2.4 MEDIA PREPARATION
The basal media used during routine cell culture were prepared according to the formulations shown in Table 2.4.1. 10X media were added to sterile ultrapure water, buffered with HEPES and NaHC03 and adjusted to a pH o f 7.45 - 7.55 using sterile 1.5M
62

NaOH and 1.5M HC1. The media were then filtered through sterile 0.22|im bell filters (Gelman; G.1423S) and stored in 500ml sterile bottles at 4°C. Sterility checks were carried out on each 500ml bottle of medium as described in Section 2.5.5.
The basal media were stored at 4°C up to their expiry dates as specified on each individual 10X medium container. Prior to use, 100ml aliquots of basal media were supplemented with 2mM L-glutamine (Gibco; 043-05030) and 5% foetal calf serum (Sigma; F7524, Batch #13H 3389) and this was used as routine culture medium. This was stored for up to 2 weeks at 4°C, after which time, fresh culture medium was prepared.
Table 2.4.1 Preparation of basal media
DM EM
(Gibco 042-02501M)
Hams F12
(Gibco 042-01430M)
MEM
(Gibco 074-01700N)
10X Medium 500ml Powder 500ml
Ultrapure H20 4300ml 4700ml 4300ml
1M HEPES*
i Sigma H9136
100ml 100ml 100ml
7.5% NaHCOj
BDH 30151
45ml 45ml 45ml
* HEPES = N-(2-Hydroxyethyl)piperazine-N'-(2-ethanesulfonic acid)
2 .5 CELL LINES
A ll cell culture work was carried out in a class II down-flow re-circulating laminar flow cabinet (Nuaire Biological Cabinet) and any work which involved toxic compounds was carried out in a cytoguard (Gelman). Strict aseptic techniques were adhered to at all times. The laminar flow cabinet was swabbed with 70% industrial methylated spirits (IMS) before and after use, as were all items used in the cabinet. Each cell line was assigned
63

specific media and waste bottles and only one cell line was worked with at a time in the cabinet which was allowed to clear for 15min between different cell lines. The cabinet itself was cleaned each week with industrial detergents (Virkon; Antec. International, TEGO; TH.Goldschmidt Ltd.), as were the incubators.
The cell lines used during the course of this study, their sources and their basal media requirements are listed in Table 2.5.1. Basal medium was supplemented with 5-10% serum and 2mM L-glutamine. Lines were maintained in 25cm2 flasks (Costar; 3050) or 75cm2 flasks (Costar; 3075) at 37°C and fed every two to three days.
2.5 .1 Subculture of Adherent Lines
During routine subculturing or harvesting of adherent lines, cells were removed from their flasks by enzymatic detachment.
1. Waste medium was removed from the flasks and rinsed with a pre-warmed (37°C) trypsin/EDTA (TV) solution (0.25% trypsin (Gibco; 043-05090), 0.01% EDTA (Sigma; EDS) solution in PBS A (Oxoid; BR14a)). The purpose of this was to sequester naturally occurring trypsin inhibitor which would be present in any residual serum.
2. Fresh TV was then placed on the cells (2ml/25cm2 flask or 4ml/75cm2 flask) and the flasks incubated at 37°C until the cells were seen to have detached (5 - 10 min).
3. The trypsin was deactivated by addition of a equal volume of growth medium (i.e.
containing 5% serum).4. The entire solution was transferred to a 30ml sterile universal tube (Sterilin; 128a)
and centrifuged at 1,000 r.p.m. for 5 min.5. The resulting cell pellet was resuspended in pre-warmed (37°C) fresh growth
medium, counted (Section 2.5.2) and used to re-seed a flask at the required cell density or to set up an assay.
64

Table 2.5.1 Cell lines used during the course of this study
Cell line Basal medium Cell type Source
DLKP
(and all its
derivatives)
ATCC1 Human lung squamous carcinoma Dr. Grant
NCTCC
SK-MES-1
(and all its
derivatives
MEM Human lung squamous carcinoma ATCC
\ATCC consists of a 1:1 mixture of DMEM and Hams F12.
2MEM medium was supplemented with 1 % (v/v) MEM Non-essential amino acids (NEAA) (Gibco;
043-01140) and ImM sodium pyruvate for all lines
3ATCC = American Type Culture Collection
2.5.2 Cell Counting
Cell counting and viability determinations were carried out using a trypan blue (Gibco;525) dye exclusion technique.
1. An aliquot of trypan blue was added to a sample from a single cell suspension in a ratio o f 1:5.
2. After 3 min. incubation at room temperature, a sample of this mixture was applied to the chamber o f a haemocytometer over which a glass coverslip had been placed.
3. Cells in the 16 squares of the four outer corner grids of the chamber were counted microscopically, an average per corner grid was calculated with the dilution factor being taken into account and final cell numbers were multiplied by 104 to determine the number of cells per ml (volume occupied by sample in chamber is0.1cm x 0.1cm x 0.01cm i.e. 0.0001cm3 therefore cell number x 104 is equivalent to cells per ml).
65

4. Non-viable cells were those which stained blue while viable cells excluded the
trypan blue dye and remained unstained.
2.5.3 Cell Freezing
To allow long term storage of cell stocks, cells were frozen and cryo-preserved in liquid
nitrogen at temperatures below -180°C. Once frozen properly, such stocks should last
indefinitely.
1. Cells to be frozen were harvested in the log phase of growth (i.e. actively growing
and approximately 50-70% confluent) and counted as described in Sections
2.5.2.
2. Pelleted cells were re-suspended in serum and an equal volume of a DMSO/serum
(1:9, v/v). This solution was slowly added dropwise to the cell suspension to give
a final concentration of at least 5xl06 cells/ml.
3. 1.5ml aliquots of this suspension was placed in cryovials (Greiner; 122 278) which
were then quickly placed in the vapour phase of liquid nitrogen containers
(approximately -80°C).
4 After 2.5 - 3.5 hours, the cryovials were lowered down into the liquid nitrogen
where they were stored until required.
2.5.4 Cell Thawing
1. Immediately prior to the removal of a cryovial from the liquid nitrogen stores for
thawing, a sterile universal tube containing growth medium was prepared for the
rapid transfer and dilution of thawed cells to reduce their exposure time to the
DMSO freezing solution which is toxic at room temperature.
2. The suspension was centrifuged at 1,000 r.p.m. for 5 min., the DMSO-containing
supernatant removed and the pellet re-suspended in fresh growth medium.
66

3. A viability count was carried out (Section 2.5.2) to determine the efficacy of the
freezing/ thawing procedures
4. Thawed cells were placed into tissue culture flasks with the appropriate volume of
medium (10ml/25cm2 flask and 15ml/75cm2 flask) and allowed to attach
overnight.
5. After 24 hours, the cells were re-fed with fresh medium to remove any residual
traces of DMSO.
2.5.5 Sterility Checks
Sterility checks were routinely carried out on all media, supplements and trypsin used for
cell culture. Samples of basal media were inoculated into Columbia (Oxoid; CM331)
blood agar plates, Sabauraud (Oxoid; CM217) dextrose and Thioglycollate (Oxoid;
CM173) broths which should between them detect most contaminants including bacteria,
fungus and yeast. Growth media (i.e. supplemented with serum and L-glutamine) were
sterility checked at least 2 days prior to use by incubating samples at 37°C which were
subsequently examined for turbidity and other indications of contamination.
2.6 MYCOPLASMA ANALYSIS
Mycoplasma examinations were carried out routinely (at least every 3 months) on all cell
lines used in this study. These analyses were performed by Mary Heenan and William
Nugent.
2.6.1 Indirect Staining Procedure
In this procedure, Mycoplasma-negative NRK cells (a normal rat kidney fibroblast line)
were used as indicator cells. As such, these cells were incubated with supernatant from test
cell lines and then examined for Mycoplasma contamination. NRK cells were used for this
67

procedure because cell integrity is well maintained during fixation. A fluorescent Hoechst
stain was utilised which binds specifically to DNA and so will stain the nucleus of the cell
in addition to any Mycoplasma DNA present. A Mycoplasma infection would thus be seen
as small fluorescent bodies in the cytoplasm of the NRK cells and sometimes outside the
cells.
1. NRK cells were seeded onto sterile coverslips in sterile Petri dishes at a cell
density of 2xl03 cells per ml and allowed to attach over night at 37°C in a 5 %
C 02, humidified incubator.
2. 1ml of cell-free (cleared by centrifugation at 1,000 r.p.m. for 5 min) supernatant
from each test cell line was then inoculated onto a NRK Petri dish and incubated as
before until the cells reached 20-50% confluency (4 -5 days).
3. After this time, the waste medium was removed from the Petri dishes, the
coverslips washed twice with sterile PBS A, once with a cold PBS/Carnoys
(50/50) solution and fixed with 2ml of Carnoys solution (acetic acid: methanol-1:3)
for 10 min.
4. The fixative was then removed and after air drying, the coverslips were washed
twice in deionised water and stained with 2ml of Hoechst 33258 stain (BDH)
(50ng/ml) for 10 min.
From this point on, work proceeded in the dark to limit quenching of the fluorescent stain.
5. The coverslips were rinsed three times in PBS.
6. They were then mounted in 50% (v/v) glycerol in 0.05M citric acid and 0 .1M
disodium phosphate and examined using a fluorescent microscope with a UV
filter.
2 .6 .2 Direct Staining
The direct stain for Mycoplasma involved a culture method where test samples were
inoculated onto an enriched Mycoplasma culture broth (Oxoid; CM403) - supplemented
with 16% serum. 0.002% DNA (BDH; 42026), 2(Xg/ml fungizone (Gibco; 042 05920),

2xl03 units penicillin (Sigma; Pen-3) and 10ml of a 25 % (w/v) yeast extract solution - to
optimise growth of any contaminants and incubated at 37°C for 48 hours. Sample of this
broth were then streaked onto plates of Mycoplasma agar base (Oxoid; CM401) which had
also been supplemented as above and the plates were incubated for 3 weeks at 37°C in a
C02 environment. The plates were viewed microscopically at least every 7 days and the
appearance of small, “fried egg” -shaped colonies would be indicative of a mycoplasma
infection.
2.7 Toxicity assay
Due to the nature of the compounds tested in the assays, precautions were taken to limit
the risks involved in their handling and disposal. All work involving toxic compounds was
carried out in a Gelman “Cytoguard” laminar air flow cabinet (CG Series). All
chemotherapeutic drugs were stored and disposed of as described in table 2.7.1.
Table 2.7.1
Cytotoxic DrugAdriamycin
Carboplatinum
SupplierFarmitalia
Bristol Myers
Pharmaceuticals
InactivationHyperchlorite inactivation
followed by autoclaving
Incineration
StorageStock at 4°C
Store at room
temperature
5-Fluorouracil
Vincristine
VP-16
Farmitalia
David Bull
Laboratories Ltd
Bristol Myers
Pharmaceuticals
NaOH inactivation followed
by autoclaving
Autoclave
Incineration
Store at room
temperature
Store at 4°C
Store at room
temperature
All drugs were stored in the dark
69

2.7.1 Toxicity assay
Before setting up any assay, a cell line was pretreated so that it would be in the
exponential phase of growth. Two days prior to the assay, the cells were subcultured into
75cm2 flasks at a density of 2 x 10⁵ cells/flask. The cell were allowed to attach overnight
and the next day were fed with fresh medium.
1. Cells were harvested from a flask in the exponential phase of growth.
2. A cell suspension of lxlO4 cells/ml was made up in growth medium and 100(0.1
added into 96-well plates (Costar; 3599) and allowed to attach overnight at 37°C,
5% C02.
3. Drug dilutions (including a control with no drug) were prepared at 2X their final
concentration in growth medium and lOOjil added to each well in replicas of eight,
giving final a concentration of IX drug.
4. The plates were incubated for 6 days at 37°C and 5 % C02 or until the control
wells reached 80% confluency.
5. Cell survival was determined by acid phosphatase assay (Section 2.7.2).
6. The concentration of drug which causes 50% cell kill (the IC50 value) was
calculated using the Chou and Talalay computer package (Section 2.7.5).
2.7.2 Acid Phosphatase Assay
1. After incubation for 6 days or until 80% confluency was reached in the control
wells the plates were removed from the incubator and the medium discarded.
2. The wells were washed twice with PBS (100|J.l) and the PBS discarded. 100|il of
phosphatase substrate (lOmM p-nitrophenolphosphate (Sigma; 104-0), 0.1M
sodium acetate (Sigma; S8625), 0.1% triton X-100 (BDH; 30632) pH 5.5) was
added to each well.
3. Plates were then wrapped in aluminium foil and left in the dark at 37°C for 2
hours.
4. The enzyme reaction was stopped by the addition of 50|il of 1.0M NaOH.
70

5. The plate was read in a dual beam plate reader at 405nm (reference wavelength
620nm).
2.7.3 Circumvention assays
1. Cells were harvested from a flask in the exponential phase of growth.
2. A cell suspension of lxlO4 cells/ml was made up in growth medium and lOOjxl
added into 96-well plates (Costar; 3599) and allowed to attach overnight at 37°C
and 5 % C02.
3. Drug dilutions (including a control with no drug) were prepared at 4X their final
concentration in growth medium and 50|xl added to each appropriate well, giving a
final concentration of IX drug.
All circumvention agents (DL-buthionine-[S,R]-sulphoximine (Sigma; B2640), cyclosporin
A (Sandoz; Sandimmune), verapamil (Sigma; V4629) and the test compounds) were
dissolved in media. A 2mg/ml stock solution of the test compounds U-l or N-l, was
prepared by dissolving 20mg in 250¡x\ of DMSO, the volume made up to 10 mis with
media and the resulting solution filter sterilised using a 0.22/xm filter.
In assays where more than 2 drug were used in combination, 8X drug dilutions were
prepared and 25|J,1 added to the appropriate wells. The final volume in each well was
always 200|il.
4. The plates were incubated for 6 days at 37°C and 5 % C02 or until the control
wells reached 80% confluency.
5. Cell survival was determined by the acid phosphatase assay (Section 2.7.2).
6. The combination index (Cl value), which quantifies the synergistic, additive or
antagonistic effect of a combination of drugs, was calculated using the Chou and
Talalay computer package.
71

2.7.4 Chemotherapeutic drug pulse assays
1. Cells were harvested from a flask in the exponential phase of growth.
2. A cell suspension of lxlO4 cells/ml was made up in growth medium and lOOpl
added into 96-well plates (Costar; 3599) and allowed to attach overnight at 37°C
and 5 % C02.
3. Drug dilutions (including a control with no drug) were prepared at 2X their final
concentration in growth medium and 100|il added to each well in replicas of eight,
giving a final concentration of IX drug for 2 hours.
4. Drug was removed from the wells by inverting and tapping the plates over an open
vessel which had been swabbed with IMS. The wells were then washed twice with
preheated sterile PBS, ensuring to remove as much PBS as possible after the final
rinse.
5. Circumvention agent was prepared at IX final concentration and added
immediately after drug exposure, 24 hours, 48 hours or 72 hours after drug
exposure as appropriate. Each time the circumvention agent was removed the cells
were washed once with preheated sterile PBS.
6. The plates were incubated for a total of 6 days at 37°C and 5 % C02 or until the
control wells reached 80% confluency.
7. Cell survival was determined by acid phosphatase assay (Section 2.7.2).
2.7.5 IC50 calculation
The multiple drug effect analysis of Chou and was used to calculate the IC50 value of
drugs on their own and the effects of combinations of drugs (Chou and Talalay, 1983;
Chou and Talalay, 1984). This involved plotting of dose-effect curves for a drug or
combination of drugs, at different concentrations using the median-effect equation
[Equation 1].
72

fa /fu = ( D /D m f [Equation 1]
Where:
fa represents the fraction of cells affected by D.
fu represents the fraction of cells unaffected by D (i.e. fa = 1 -fu).
D represents the dose of drug used.
Dm is the dose required for 50% inhibition of cell growth and is the IC50 value.
m is the coefficient of the sigmoidicity of the dose-effect curve; m = 1, m < 1 and m >
1 indicate hyperbolic, sigmoidal and negative sigmoidal dose-effect curves respectively for
the inhibitory drug.
The above equation can be rearranged to give:
D = Dm lfal(l-fa)]1/m [Equation 2]
The values of Dm and m can be calculated by the median-effect plot of* = log (D) versus
y = log (fa/(l-fa)). In the median-effect plot, m is the slope and log (Dm) is the x-
intercept. The conformity of the data to the median-effect principle was checked by the
linear correlation coefficient (r) of the median effect plot. Values of drug concentrations
and their corresponding percentage inhibition (expressed as a fraction) were entered for
computer analysis by the computer package, Dose effect analysis with microcomputers
(Chou and Chou, 1987).
2.7.6 Combination Index calculation
The Combination Index value was calculated for a combination of two drugs using
Equation 3:
Where,
Cl = (D)i / (Dx)i + (D)2 / (Dx)2 [Equation 3]
73

(D)t is the concentration of drug 1 used in a combination with drug 2, (D)2, that causes
x% inhibition.
(D)2 is the concentration of drug 2 used in a combination with drug 1, (D)1; that causes
x% inhibition.
(Dx)j is the concentration of drug 1 alone that causes x% inhibition.
(Djc)2 is the concentration of drug 2 alone that causes x% inhibition.
Synergy is indicated by a Cl value < 1 , an additive effect is indicated by a Cl value equal
to 1 and antagonism is indicated by a Cl value > 1. Analysis was carried out using Dose
effect analysis with microcomputers (Chou and Chou, 1987).
Two examples are given below:
Example 1:(a) drug 1 inhibits cell growth by 50% at 5/xg/ml (Dx)[
(b) drug 2 inhibits cell growth by 50% at 1/xg/ml (Djc)2
(c) a combination of the two drugs at 5^g/ml in a e.g. 4:1 ratio (i.e. 4 /xg/ml drug 1 (D)j
and 1/xg/ml drug 2 (D)^ inhibits cell growth by 50%.
Cl = (D \ / (Dx), + (D)2 / {Dx)2
Then,
Cl = 4/5 + 1/1
0.8 + 1
1.8= Antagonistic
Example 2:
(a) drug 1 inhibits cell growth by 50% at 5/xg/ml (Dx)L
(b) drug 2 inhibits cell growth by 50% at 1/xg/ml (D;t)2
(c) a combination of the two drugs at 1/xg/ml in a e.g. 4:1 ratio (i.e. 0.8 /xg/ml drug 1
(D)( and 0.2/xg/ml drug 2 (D)2) inhibits cell growth by 50%.
74

Cl = 0.8/5 + 0.2/1
0.16 + .2
0.36
= Synergistic
2.8 Flow cytometry
1. Cells were seeded at 5 x 10⁴cells/25cm2 flask four days before experiments.
2. Drug dilutions (including a control with no drug) were prepared at 2X their final
concentration in growth medium and added to each flask giving a final
concentration of IX drug for 2 hours.
3. Drug was removed from the flasks by pouring the drug into a sterile bottle. The
flasks were then washed twice with preheated sterile PBS, removing as much
PBS as possible after the final rinse.
4. Circumvention agent was prepared at IX final concentration and added
immediately after drug exposure.
5. Samples were collected for flow cytometry at various time points; media from the
flasks were poured into labelled universals, the flasks were trypsinised into single
cell suspensions and the trypsinised cells added to the labelled universals (this
ensured that any floating cells were collected), pelleted and resuspended in 70%
ethanol 30% PBS and kept at 4°C. The samples could be stored for up to 1 month.
6. On the day samples were analysed, cells were harvested and resuspended in PBS
with 100(Xg/ml RNase (DNase free) (Boeringher Mannheim; 1 119 915) and
40(ig/ml propidium iodide (Sigma; P4170).
7. Samples were analysed on a Becton Dickenson (FACScan) using an argon-ion
laser tuned to 488nm measuring forward and orthogonal light scatter and red
fluorescence. Cell cycle analysis was performed on the Lysis program.
C l = (D)y / (Dx)i + (D)2 / (Dx)2
Then,
75

2.9 Time-lapse videomicroscopy
Time-lapse videomicroscopy was carried out on a Nikon Diaphot inverted microscope
(Micron Optical, Bray, Ireland) equipped with phase-contrast optics, linked to a
Mitsubishi CCD-100 colour video camera. Images were recorded in S-VHS onto a
Mitsubishi HS-S5600 video recorder with time lapse capabilities. Recording speed was set
at 3.22 sec/field (480 hour mode), which at normal playback speed resulted in an
acceleration factor of 160.
The temperature of the culture vessel was controlled by a Linkam CO 102 warm stage
controller. This controller was adjusted to keep the culture medium inside the vessel at
37°C, as measured using a TB3301 probe. All time-lapse video equipment was obtained
from Laboratory Instruments (Ashbourne, Ireland).
Cells were seeded at 5 x 10⁶cells/25cm2 flask four days before experiments. Recording
was started after cells were exposed to chemotherapeutic drug for two hours and washed
twice with PBS.
Cell death was classified as apoptotic on the basis of morphological events starting with
rounding up of adherent cells, subsequent cell shrinkage and/or breakup into apoptotic
bodies. These cell death events were scored at the time when rounding up first occurred.
Cell division was classified as mitotic on the basis of morphological events starting with
rounding up of adherent cells, subsequent cytokinesis and readherance of daughter cells to
the surface. Mitotic events were scored at the time when rounding up first occurred.
Typically 100 cells in the microscope field were followed.
76

2.10 Western blot analysis
2.10.1 Sample preparation
1. Cells were seeded at 5 x 10⁶cells/25cm2 flask two days before experiments.
2. Drug dilutions (including a control with no drug) were prepared at 2X their final
concentration in growth medium and added to each flask giving a final
concentration of IX drug for 2 hours.
3. Drug was removed from the flasks by pouring the drug into a sterile bottle. The
flasks were then washed twice with preheated sterile PBS, removing as much PBS
as possible after the final rinse.
4. Circumvention agent was prepared at IX final concentration and added
immediately after drug exposure.
5. Samples were collected at various time points i.e. the media from the flasks were
poured into labelled universals, the flasks were trypsinised into single cell
suspensions and the trypsinised cells added to the labelled universals (this ensured
that any floating cells were collected), pelleted and stored at -80°C.
6. Cells were lysed by sonication (7 pulses at 50% power) in SDS-
radioimmunoprecipitation assay (RIPA) buffer (50mM Tris (pH 7.5), 150mM
NaCl, 1 % nonidet P-40 (Sigma; N6507), 0.1% sodium dodecyl sulphate (SDS)
(Riedel-de Hain; 62862), 1% sodium deoxycholate (Sigma; D5670)) containing
protease inhibitors (ImM sodium orthovanadate (Sigma; S6508), ImM DTT
(Sigma; D5545), ImM phenylmethylsulphonyl fluoride (PMSF) (Sigma; P7626),
25(ig/ml leupeptin (Sigma; L2884), 25|Xg/ml aprotinin (Sigma; A1153), ImM
benzamidine (Sigma; B6506), lOmg/ml trypsin inhibitor (Sigma; T9003)).
7. Samples were centrifuged at 4,000rpm for 10 minutes.
8. The supernatant was collected and centrifuged for 1 hour at 13,000rpm.
9. Samples were collected, aliquoted and stored at -80°C.
77

2.10.2 Protein Quantitation
The protein levels were determined using the Bio-Rad protein assay kit (Bio-Rad; 500-
0006).
1. Standard concentrations of bovine serum albumin (BSA) (Sigma; A9543) were
prepared fresh.
2. 20(0.1 of protein standard or unknown protein sample was added to an Eppendorf.
3. 1ml of diluted (1:5) dye reagent was added and the mixture vortexed.
4. The OD570 was measured against a reagent blank after 5 mins to 1 hour.
5. The concentration of the protein samples was determined from the plot of the
OD595 of the BSA standards.
2.10.3 Gel electrophoresis
Proteins for western blot analysis were separated by SDS-polyacrylamide gel
electrophoresis (SDS-PAGE). Resolving and stacking gels were prepared as outlined in
Table 2.17.1 and poured into clean 10cm x 8cm gel cassettes which consisted of 1 glass
and 1 aluminium plate, separated by 0.75cm plastic spacers. The resolving gel was poured
first and allowed to set. The stacking gel was then poured and a comb was placed into the
stacking gel in order to create wells for sample loading. Once set, the gels could be used
immediately or wrapped in aluminium foil and stored at 4°C for 24 hours.
Table 2.10.1 Preparation of electrophoresis gels
Resolving gel (15%) Stacking gel
Acrylamide stock* 10ml 0.8ml
Distilled HzO 5.7ml 3.6ml
1.875M-Tris/HCl, pH 8.8 4ml
1.25M-Tris/HCL, pH 6.8 - 0.5ml
10% SDS
(Sigma; L4509) 150jxl 50|il
10% Ammonium persulphate
78

(Sigma; A1433)
TEMED
(Sigma; T8133) 9jxl 6)xl
5 0 p l 17JÜ
Acrylamide stock = 29.lg acrylamide (Sigma; A8887) and 0.9g NN'-methylene bis-acrylamide
(Sigma; N7256) made up to 100ml with distilled water.
Before samples were loaded onto the stacking gels, 10[ig of protein was diluted in 5X
loading buffer (2.5ml 1.25M-Tris/HCl, l.Og SDS, 2.5ml mercaptoethanol (Sigma;
M6250), 5.8ml glycerol and 0.1% bromophenol blue (Sigma; B8026) made up to 10ml
with distilled water). The samples were then loaded including 5|xl of molecular weight
protein markers (Sigma; P1677). The gels were run at 250V, 45mA for approximately 1.5
hours. When the bromophenol blue dye front was seen to have reached the end of the
gels, electrophoresis was stopped.
2.10.4 Western blotting
1. Following electrophoresis, the acrylamide gels were equilibrated in transfer buffer
(25mM Tris, 192mM glycine (Sigma; G7126) pH 8.3 - 8.5 unadjusted) for 20
mins.
2. Protein in gels were transferred onto Hybond ECL nitrocellulose membranes
(Amersham; RPN 2020D) by semi-dry electroblotting; Four sheets of Whatman
3mm filter paper were soaked in transfer buffer and placed on the cathode plate of
the semi-dry blotting apparatus. Excess air was removed from between the filters
by moving a glass pipette over the filter paper. Nitrocellulose, cut to the same size
of the gel, was soaked in transfer buffer and placed over the filter paper, making
sure there were no air bubbles.The acrylamide gel was placed over the
nitrocellulose and four more sheets of presoaked filter paper were placed on top of
the gel. Excess air was again removed by rolling the pipette over the filter paper.
The proteins were transferred from the gel to the nitrocellulose at a current of
34mA at 15V for 30 mins.
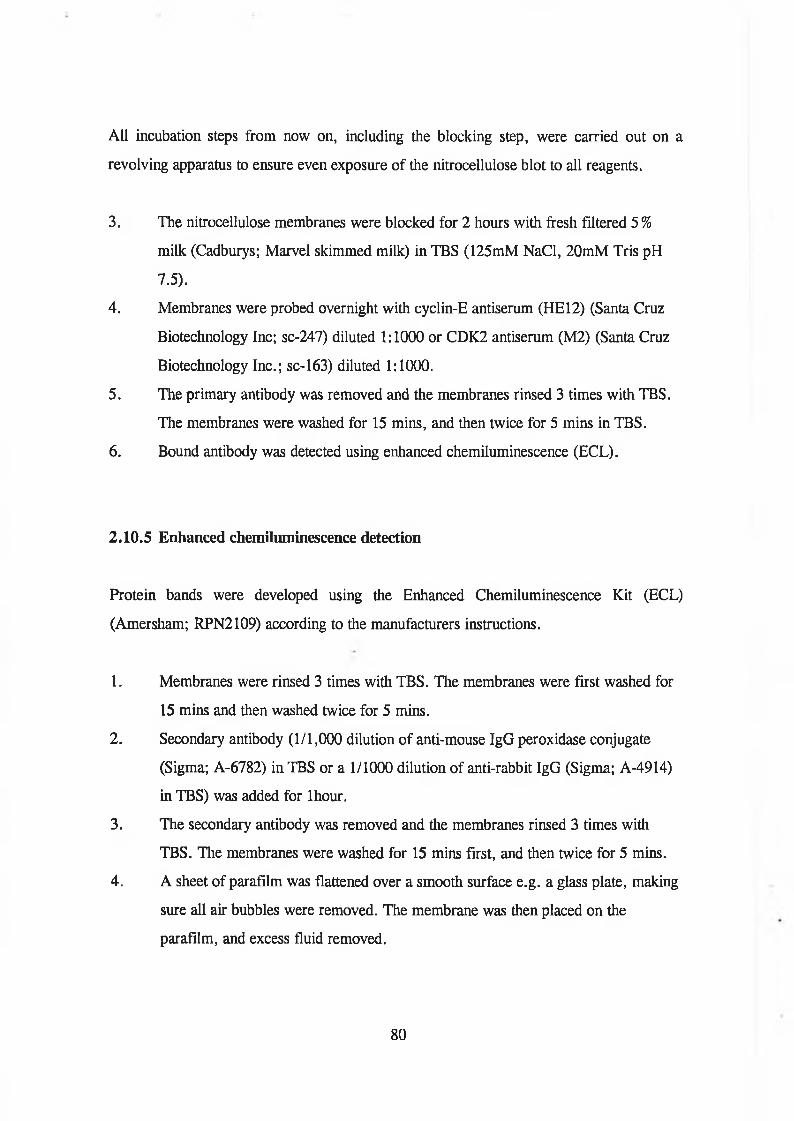
All incubation steps from now on, including the blocking step, were carried out on a
revolving apparatus to ensure even exposure of the nitrocellulose blot to all reagents.
3. The nitrocellulose membranes were blocked for 2 hours with fresh filtered 5 %
milk (Cadburys; Marvel skimmed milk) in TBS (125mM NaCl, 20mM Tris pH
7.5).
4. Membranes were probed overnight with cyclin-E antiserum (HE12) (Santa Cruz
Biotechnology Inc; sc-247) diluted 1:1000 or CDK2 antiserum (M2) (Santa Cruz
Biotechnology Inc.; sc-163) diluted 1:1000.
5. The primary antibody was removed and the membranes rinsed 3 times with TBS.
The membranes were washed for 15 mins, and then twice for 5 mins in TBS.
6. Bound antibody was detected using enhanced chemiluminescence (ECL).
2.10.5 Enhanced chemiluminescence detection
Protein bands were developed using the Enhanced Chemiluminescence Kit (ECL)
(Amersham; RPN2109) according to the manufacturers instructions.
1. Membranes were rinsed 3 times with TBS. The membranes were first washed for
15 mins and then washed twice for 5 mins.
2. Secondary antibody (1/1,000 dilution of anti-mouse IgG peroxidase conjugate
(Sigma; A-6782) in TBS or a 1/1000 dilution of anti-rabbit IgG (Sigma; A-4914)
in TBS) was added for lhour.
3. The secondary antibody was removed and the membranes rinsed 3 times with
TBS. The membranes were washed for 15 mins first, and then twice for 5 mins.
4. A sheet of parafilm was flattened over a smooth surface e.g. a glass plate, making
sure all air bubbles were removed. The membrane was then placed on the
parafilm, and excess fluid removed.
80

5. 1.5ml of ECL detection reagent 1 and 1.5 ml of reagent 2 were mixed and covered
over the membrane. Charges on the parafilm ensured the fluid stayed on the
membrane.
6. The reagent was removed after one minute and the membrane wrapped in cling
film.
7. The membrane was then exposed to autoradiographic film (Kodak; X-OMAT S) in
an autoradiographic cassette for various times, depending on the signal.
9. The autoradiographic film was then developed.
2.10.6 Autoradiograph film processing
1. The exposed film was developed for 5mins in developer (Kodak; LX24), 1;6.5
dilution in water.
2. The film was briefly immersed in water and transferred to a Fixer solution
(Kodak; FX-40) a 1:5 dilution in water, for 5mins.
3. The film was transferred to water for 5 mins and then air-dried.
2.11 Immunoprécipitation
Samples for all immunoprécipitation experiments were prepared as for western blotting
(Section 2.10.1)
1. 100|Xg of total protein were centrifuged at 3000rpm at 4°C for 15 minutes.
2. The supernatant was transferred to another Eppendorf with ljxg of normal mouse
IgG (Sigma; 1-5381) and 20|xl of agarose conjugate (Santa Cruz Biotechnology
Inc.; sc-2001).
3. This was then centrifuged at l,500rpm at 4°C for 5 minutes.
81

4. The supernatant was transferred to another Eppendorf with 10|il of mouse anti-
cyclin E (H E(lll)) (Santa Cruz Biotechnology Inc.; sc-248) for 1 hour at 4°C.
5. The solution was then incubated overnight at 4°C with 20|il of agarose conjugate.
6. The agarose beads were collected by centrifugation at 2,500rpm for 5 mins at 4°C.
7. The resulting pellet was washed 4 times with RIPA buffer.
8. After the final wash the supernatant was discarded and the pellet was resuspended
in 50|Xl kinase buffer for kinase assays (see protein kinase assay, Section 2.12).
2.12 Protein kinase assay
1. 100/ig of protein was immunoprecipitated and resuspended in 50/xl kinase buffer
(20mM Tris pH 7.5, lOmM MgCl2 and ImM DTT) see Section 2.11.
2. The agarose beads were collected by centrifugation at 2,500rpm for 5 mins at 4°C.
3. The resulting pellet was washed 2 times with kinase buffer.
4. The pellet was resuspended in 50/d of 100/xg/ml histone HI (Boehringer
Mannheim; 223 549), 5/xM adenosine-5'-triphosphate (ATP) (Boehringer
Mannheim; 127 523) and 0 .1/xCi/ml [32-P] ATP in kinase buffer for 30 mins at
30°C.
5. The reaction was stopped by adding 5X loading buffer and boiled for 4 mins.
20/xl of the reaction mixture was run on a 15 % SDS gel for 1 hour at 200mA and
1000V.
6. The gel was placed on three sheets of blotting paper and dried on a gel dryer
(GS200, Savent, USA) for 3 hours at 70°C.
7. The sheet of blotting paper with the dried gel was placed in an autoradiographic
cassette with autoradiography film and left at -80°C.
8. After 1 -3 days the film was developed as in Section 2.10.6.
9. The levels of kinase activity was quantified by using a densitometer (Bio-Rad GS-
670, imaging densitometer).
82

2.13 Plasmid DNA Isolation
2.13.1 Preparation of competent cells for transformation
1, 20ml of sterile LB-broth (10(ig/ml tryptone (Oxoid; L42), 5|ig/ml yeast extract
(Oxoid; L21), 10[ig/ml NaCl) was inoculated with JM 109 Escherichia coli in a
50ml universal and grown overnight at 37°C in a shaking incubator at 250rpm.
2.4mls of this overnight culture was inoculated in 400ml sterile LB-broth in a
sterile 21 baffled flask and placed at 37°C at 250rpm until the absorbance at 590nm
was exactly 0.375.
3. This culture was then aliquoted into pre-chilled 50ml universals and left on ice for
5-10 mins.
4. The cells were then centrifuged at 3000rpm at 4°C for 7 mins.
5. The supernatant was removed and the pellet resuspended in 10 mis of ice-cold
sterile CaCl2 (60mM CaCl2 (Sigma; C7902), 15% glycerol, lOmM PIPES (Sigma;
P9291) pH 7.0).
6. Cells were centrifuged again for 5 mins at 2500rpm at 4°C.
7. The resulting pellet was resuspended in 2mls of ice-cold CaCl2 and left on ice for
12-24 hours.
8. The suspension was then aliquoted into -80°C pre-chilled sterile Eppendorfs and
stored at -80°C.
2.13.2 Transformation of Escherichia coli
1. lOng of plasmid DNA to be transformed was placed in a sterile Eppendorf.
2 . 100|xl of competent cells were taken directly from the freezer, thawed and added
to the DNA.
3. The mixture was left on ice for 30 mins.
83

4. 1ml of LB-broth was added to this suspension, mixed gently by inversion and
incubated at 37°C and 250rpm for 1 hour.
5. The cells were then pelleted for 1 - 2 mins at 13,000rpm and resuspended in 200[il
LB-broth.
6. 200|il of this culture was spread on LB Agar plates (LB-broth and 25|ig/ml agar
(Sigma; A5054)) containing 100(ig/ml ampicillin (Sigma; A9393) (ampicillin
resistance was encoded for on the transformed plasmid).
7. The plates were incubated at 37°C overnight.
8. The resulting colonies were checked for the plasmid using a plasmid Miniprep.
2.13.3 Plasmid Miniprep
1. One colony (from a transformed plate) was removed and added to 10 ml of LB-
broth containing ampicillin and incubated overnight at 37°C and 250 rpm.
2. 1.5mls of the overnight culture was placed in a sterile Eppendorf and the cells
pelleted at 12,000rpm for 30 secs at 4°C.
3. The supernatant was removed and the pellet resuspended in 300(il STET (8 %
glucose (Riedel-de Hain; 16325), 5% triton X-100, 50mM Tris-HCl, 50mM
EDTA).
4. 25(il of fresh lOmg/ml lysozyme (Sigma; L7001) solution was added to the cell
suspension. This was then vortexed and boiled for 45 secs. The suspension was
pelleted at 13,000rpm for 15 mins.
5. Approximately 210(11 of the supernatant was removed.
6. 230|il of isopropanol (Riedel-de Hain; 33539) was mixed with the pellet and left
for 10 mins at 4°C.
7. This was centrifuged at 13,000rpm for 5 mins.
8. The pellet was washed twice with 70% ethanol and then resuspended in 25(0.1 of
TE (lOmM Tris-HCl, ImM EDTA, pH 8.0) .
84

9. l|il boiled RNase (lOmg/ml) was added and left at 37°C for 15mins to remove
RNA.
2.14 Transfection procedures
2.14.1 Electroporation
1. Cells were pretreated so that they were in the exponential phase of growth.
2. They were trypsinised at 4°C, spun down and resuspended in half the original
volume using ice cold PBS (sterile and without Mg or Ca).
3. A cell count was performed and the cells were centrifuged at lOOOrpm for 5mins
resuspended at 1 x 10⁶ cells/600|xl in PBS at 0°C.
4. 600(0,1 of the cell suspension was transferred to 200|il of TE in an electroporation
cuvette (Bio-Rad; 165-2088) at 0°C.
5. 10|ig of plasmid was added. The plasmid/cell suspension was mixed by holding
the cuvette on the two “window sides” and flicking the bottom of the cuvette and
then left for 5 minutes.
6. The dried cuvettes were placed in the holder of the electroporation apparatus at
room temperature and one pulse delivered at the desired setting;
Cell line Settings
DLKP 600V 25 (iF °oQ
SK-MES-l/Adr 250V 25|xF °oQ
7. The electroporated cells were returned to ice for 10 minutes and then diluted 20-
fold in non-selective medium. The cuvette was rinsed with the same medium to
get all the transfected cells.
8. (i) The cells were plated out in 10cm diameter sterile petri dishes at 37°C and
5% C 02.
85

(ii) The cells were plated out in 96-well plates at a density of 100 cells per well
and incubated at 37°C and 5 % C02.
2.14.2 Calcium phosphate co-precipitation
1. Cells were pretreated so that they were in the exponential phase of growth.
2. Cells were set up at 5 x 10⁵ cells per 10cm petri dish and incubated at 37°C and
5 % C02 overnight.
3. 10|Xg of pCHl 10 plasmid was added to 410(i.l of sterile H20 and left overnight at
4°C.
4. The following day the plasmid was incubated at 37°C for 1 hour.
5. 60(xl of 2M CaCl2 was added dropwise into the plasmid using continuous
vortexing.
6. This was immediately added dropwise to 480(xl of 2X hepes buffer saline (HBS)
(280mM NaCl, 50mM hepes, 1.5mM Na^PC^, pH 7.12) with continuous
vortexing and left for 30mins at room temperature.
7. The plasmid-CaP04 mixture was added dropwise to a petri dish of cells which had
been set up the previous day. The plates were gently shaken to ensure even mixing
and left for 4 hours at 37°C and 5 % C 02.
8. After 4 hours the media was removed and 5mls of 10% glycerol was added for 3
mins (this is critical).
9. The glycerol was then removed and the cells washed twice with 5mls of serum-
free media.
10. lOmls of fresh growth media was then added and the cells incubated at 37°C.
86

2.15 Assay for B-Galactosidase activity
This assay was used to optimise the transfection protocol for various cell lines. pCHllO,
which encodes for B-galactosidase, was used as a marker plasmid. Its activity was detected
as follows;
2.15.1 Preparation of cell extract
1. 24 hours after cells were transfected, they were rinsed twice with lOmls PBS.
2. 1ml of TEN (40mM Tris, ImM EDTA, 150mM NaCl) was added and the cells
were harvested using a cell scraper.
3. The harvested cells were centrifuged at 13,000rpm for 5mins.
4. The supernatant was removed with a pipette.
5. The pellet was resuspended in 60|il of 0.25M Tris-HCl pH 7.8. This cell
suspension was left at -80°C for 5mins and then at 37°C for 5mins.
6. This freeze/thaw cycle was repeated 3 times.
7. The lysate was centrifuged at 13,000rpm for 5 mins and then the supernatant was
transfered to a separate Eppendorf.
2.15.2 Assay
1. 100(0,1 of fresh 15mg/ml chlorophenol red fl-D-galactopyranoside (CPRG)
(Boehringer Mannheim; 884 308) was added to 400jxl of buffer A (lOOmM
NaH2P 0 4 adjusted to pH 7.2 with NaOH, lOmM KC1, ImM MgCl2, lOmM 15-
mercaptoethanol added just before use) in an Eppendorf.
2. 50(il of cell extract was then added (one tube was left as a control) and left for 2
hours in a water bath at 37°C.
3. If there was no difference in colour between the control and the samples with the
extract then the samples were incubated overnight (8 -1 6 hours) at 37°C.
87

4. After a colour change the samples were diluted with 1. lmls (2 volumes) of buffer
A without B-mercaptoethanol.
5. The absorbance was read at 574nm using the control sample as a blank. The
higher the absorbance value, the higher the fl-galactosidase activity. The activity of
fi-galactosidase correlates to the efficiency of transfection of pCHllO into the cells.
2.16 Selection of Transfectants
Cells transfected with pHaMDRl/A (a kind gift from M. Gottesman, National Institutes of
Health, Bethesda) were allowed to grow for 3 days in nonselective media and selected
with 50(ig/ml Adriamycin. MDR1 ribozyme (received as a gift from Dr.Kevin Scanlon,
City of Hope Medical Centre, Los Angeles) transfected cells were allowed to grow for 24
hours in nonselective medium and selected with 400|ig/ml geneticin (Sigma, G418).
Untransfected cells were treated in the same way as a control.
2.16.1 Isolation of clonal transfectants
1. 5 days after transfection, each well was examined microscopically and those wells
identified as containing a single colony were marked. The remaining wells
contained no cells, had more than one colony or contained cells lying close to each
other but it was not clear if they were clones or not. All such wells were
disregarded.
2. The marked wells were fed every 6 - 7 days until they became confluent.
3. The cells were then removed from their wells by trypsinisation. This involved
removing the waste medium from each well and adding 50|il trypsin.
4. The plates were then incubated at 37°C for approximately 5 min. After this time,
cells which had not completely detached from the well surface were resuspended
with a micropipette.
88

5. Each clonal population was then transferred to an individual well in a 24-well plate
(Greiner; 662160) without centrifugation. Each well contained 1ml of growth
medium which was sufficient to inactivate the trypsin.
6. When these wells were confluent (after 6 - 7 days), the clones were transferred
into 6-well plates (Costar; 3516) in a similar manner to that of the previous
transfer.
7. When these wells became confluent, the cells were transferred to 25cm2 flasks and
then to 75cm2 flasks.
8. Frozen stocks were then prepared (Section 2.5.3).
2.17 RNA Extraction
The labile nature of RNA required that strict procedures were followed in the course of
work involving RNA. This procedures included the wearing of gloves at all times that
RNA-containing vessels were being used, the baking of all glassware and foil used to
make up solutions and weigh compounds and most solutions and plastics were treated with
0.1.% diethyl pyrocarbonate (DEPC) which is a strong inhibitor of RNases.
RNA was then extracted from cells as follows:-
1. Cells were grown in 175cm2 flasks to approximately 80% confluency.
2. Waste medium was removed and the cells washed twice with DEPC-PBS
3. The cells were lysed in 25ml of 4M-guanidinium thiocyanate (GnSCn) solution
(50g guanidinium thiocyanate (Sigma; G6639), 0.5g N-lauroyl sarcosine (Sigma;
L5125) and 5ml of lM-sodium citrate (RDH; 32320), pH 7.0 - brought up to
100ml with DEPC-water, filtered through a 0.45|im filter and supplemented with
700|Xl/ml P-mercaptoethanol and 330(il/ 100ml antifoam A (Sigma; A5758) prior
to use).
4. 5.5ml of a 5.7M-cesium chloride solution (95.8g CsCl (Sigma; C3032) and 2.5ml
of lM-sodium citrate, pH 7.0 in 100ml water, filtered through a 0.22(im filter,
treated with 0.1 % DEPC and autoclaved) was placed into polyallomer
89

ultracentrifuge tubes and the cell lysates were then layered onto tiiese CsCl
cushions.
5. The lysates were centrifuged at 26,000 r.p.m. for 21 - 24 hours at 15°C in a
swinging bucket centrifuge.
6. The tubes were then brought into a laminar flow cabinet and the supernatant
removed from the tubes using a pasteur pipette, leaving approximately 1ml of
CsCl in the bottom of the tube, below which lay the RNA pellet.
7. The tube was inverted and the bottom of the tube was cut away using a heated
scalpel blade.
8. The pellet was rinsed with 95 % ethanol and resuspended in 200|il DEPC-water.
The solution was transferred to an Eppendorf and the bottom of the tube was
rinsed with a further 200|il water which was added to the Eppendorf.
9. 40|xl of 3M-sodium acetate was added to the RNA solution to give a final
concentration of 0.3M-sodium acetate, and 2 volumes of ice-cold absolute ethanol
were also added.
10. The Eppendorfs were stored at -80°C overnight and the RNA was then pelleted at
4°C at maximum speed in a microfuge.
11. The resulting pellet was washed with 70% ethanol, the supernatant removed and
the pellet resuspended in 20(4,1 DEPC-water.
RNA concentration was calculated by determining its OD at 260nm and using the
following formula:-
O D 260nm x Dilution factor x 40 = ¿ig/jd RNA
The purity of the RNA extraction was calculated by determining its OD at 260nm and
280nm. An A260 : A280 ratio of 2 is indicative of pure RNA and only those samples with
ratios between 1.8 and 2.1 were used.
90

2.18 Reverse transcriptase reaction
Reverse transcriptase (RT) reactions were carried out in laminar flow cabinets using
micropipettes which were specifically allocated to this work.
cDNA was formed using the following procedure:-
l|il oligo (dT)12'18 primers (ljig/(il) (Promega; C l 101)
l\il total RNA (l(ig/(xl)
3(il water
were mixed in an Eppendorf, heated to 70°C for 10 min and then chilled on ice. To this,
the following were added:-
4|ol of a 5x buffer (250mM-Tris/HCl pH 8.3, 375mM-KCl and 15mM-MgCl2)
2JJ.1 DTT (lOOmM) (Gibco; 510-8025 SA)
l(il RNasin (40U/[il) (Promega; N2511)
1(0.1 dNTPs (lOmM of each dNTP)
6(0,1 water
1(0.1 Moloney murine leukemia virus-reverse transcriptase (MMLV-RT) (40,000u/(ol)
(Gibco; 510-8025 SA).
The solutions were mixed and the RT reaction was carried out by incubating the
Eppendorfs at 37°C for 1 hour. The MMLV-RT enzyme was then inactivated by heating
to 95 °C for 2 min. The cDNA was stored at -20°C until required for use in PCR reactions
as outlined in Section 2.18.
2.19 Polymerase chain reaction
A standardised polymerase chain reaction (PCR) procedure was followed in this study.
The Eppendorf tubes used (Eppendorf; 0030 121 023) and the sterile water were DEPC-
treated. All reagents had been aliquoted and were stored at -20°C and all reactions were
carried out in a laminar flow cabinet.
91

Each PCR tube contained the following:-
24.5(0.1 water
5|Ol lOx buffer* (lOOmM-Tris/HCl, pH 9.0, 50mM-KCl, 1 % Triton X-100)
3|Ol 25mM-MgCl2*
8(0,1 dNTPs (1.25mM each of dATP, dCTP, dGTP and gTTP) (Promega; U1240)
1(0,1 each of first and second strand target primers (250ng/(ol)
l|ol each of first and second strand endogenous control primer (250ng/(o,l)
0.5(ol of 5U/|0,1 Taq DNA polymerase enzyme*
5(0,1 DNA or cDNA
*(Promega; N1862)
A drop of autoclaved mineral oil was placed in each reaction tube to prevent evaporation
and the DNA was amplified by PCR (Techne; PHC-3) as follows:-
95 °C for 1.5 min - to denature double-stranded DNA
30 cycles: 95°C for 1.5 min. - denature
55 °C for 1 min - anneal
72°C for 3 min. - extend
72°C for 7 min. - extend
The reaction tubes were then stored at 4°C until analysed by gel electrophoresis as
described in Section 2.19.
2.20 Electrophoresis of PCR products
1. A 3% agarose gel (NuSieve;GTG) was prepared in TBE buffer (5.4g Tris, 2.75g
boric acid, 2ml 0.5M-EDTA pH 8.0 in 500ml water) and melted in a microwave
oven.
2. After allowing to cool, 0.003 % of a lOmg/ml ethidium bromide solution was
added to the gel which was then poured into an electrophoresis apparatus
92

(BioRad). Combs were placed in the gel to form wells and the gel was allowed to
set.
3. 10/d loading buffer (50% glycerol, lmg/ml xylene cyanol, lmg/ml bromophenol
blue, ImM EDTA) was added to each 50^1 PCR sample and 10 - 20|xl was run on
the gel at 80mV for approximately 1 hour.
4. When the dye front was seen to have migrated the required distance, the gel was
removed from the apparatus and examined on a transilluminator.
93

3.0 RESULT
94

3.1 Chemotherapeutic drug combinations
The use of multiple drugs in combination is standard in treating a patient with cancer.
Clinical studies have shown that drug combinations generally produce higher response
rates in treated populations than those produced by single agents alone. However, it is
possible that some drug combinations may be antagonistic. This series of experiments
investigated the use of common chemotherapeutic drugs in combination at three different
ratios. Assays were performed as described in Section 2.7 and the combination index (Cl)
values were calculated as described in Section 2.7.6. These values indicate if a drug
combination in synergistic, additive or antagonistic.
Three different ratios of adriamycin and carboplatin were used in combination in DLKP
(Table 3.1.1). The results show that the ratios of adriamycin to carboplatin at 1:10 and
1:100 were antagonistic with the lowest Cl value being 3. The ratio of adriamycin to
carboplatin at 1:40 displayed some additive effects and a synergistic effect at high
concentrations of the combination.
Combinations of adriamycin and carboplatin were assayed in DLKP-A (Table 3.1.2). The
combination of adriamycin and carboplatin in a 1:40 ratio was additive although some
concentrations did show synergy. The combination at ratios of 1:10 and 1:100 were
antagonistic.
A combination of vincristine and carboplatin at ratios of 1:10, 1:40 and 1:100 were
assayed in DLKP-A (Table 3.1.3). The combination at a ratio of 1:10 and 1:100 were
antagonistic. The combination at a 1:40 ratio did show slight synergy at 5 and 7.5 /xg/ml
and an additive effects at higher concentrations.
A combination of adriamycin and vincristine at a ratios of 1:4 was assayed in DLKP
(Table 3.1.4). Vincristine and adriamycin were antagonistic initially but then showed some
95

synergism at higher concentrations. Vincristine and adriamycin were assayed at ratios of
1:1, 4:1 and 1:4 in DLKP-A (Table 3.1.5). At each combination the Cl values were
antagonistic at lower concentrations but then showed some synergy at higher
concentrations.
Vincristine and VP-16 were assayed at 1:1, 1:5 and 5:1 combination in DLKP (Table
3.1.6). The combinations were antagonistic initially but were synergistic at higher
concentrations of the combinations. However, the percentage growth at the higher
concentrations was very low (< 10%).
At ratios of 1:1, 1:5 and 5:1, vincristine and VP-16 were assayed in combination in
DLKP-A (Table 3.1.7). This combination in DLKP-A did show synergy in each
combination at all concentrations used.
The above results demonstrated that a combination of carboplatin and
adriamycin/vincristine was additive in DLKP-A. The combinations of adriamycin plus
vincristine were antagonistic in DLKP and DLKP-A. Vincristine plus VP-16 were
antagonistic in DLKP but did show synergism in DLKP-A.
96

Table 3.1.1: Combination Index (Cl) values for carboplatin and adriamycin at different
ratios in combination in DLKP. Survival was calculated as percentage growth relative to
that measured in a drug-free control and is the mean of eight replicates. The values also
include the standard deviations. The Combination Index (Cl) was calculated as outlined as
in Section 2.7.6. Cl value <1 represents synergistic toxicity, Cl value =1 represents
additive toxicity and Cl value > 1 antagonistic toxicity.
Combination 1 (adriamycin 1: carboplatin 10).
Concentration (ng/ml) % Growth Cl values
Control 100±6 -
2.5 100±7 13
5 98 ±10 3
10 100±4 5
15 95 ±9 4.5
20 95 ± 9 6
50 91 ± 9 9
100 64 ±8 3
Combination 2 (adriamycin 1 : carboplatin 40)
Concentration (ng/ml) % Growth Cl value
Control 100±10 -
0.05 102 ± 7 >100
0.1 75 ±13 1.5
0.25 69 ±15 3
0.5 37±8 1.6
0.75 20±3 1
1 13 ±2 .81
2.5 7± 2 1.13
5 7±1 2.7
97

Combination 3 (adriamycin 1: carboplatin 100).
Concentration (ng/ml) % Growth Cl values
Control 100±4 -
0.05 100 ±8 -
0.1 104 ±12 >100
0.25 93 ±7 14
0.5 89±4 21
0.75 80±4 13.8
1 73±3 12
2.5 34±2 4.8
5 18±1 4.5
98

Table 3.1.2: Combination Index (Cl) values for carboplatin and adriamycin in at
different ratios in DLKP-A. Survival was calculated as percentage growth relative to that
measured in a drug-free control and is the mean of eight replicates. The values also
include the standard deviations. The Combination Index (Cl) was calculated as outlined as
in Section 2.7.6. Cl value <1 represents synergistic toxicity, Cl value =1 represents
additive toxicity and Cl value > 1 antagonistic toxicity.
Combination 1 (adriamycin 1: carboplatin 10)
Concentration (¿ig/ml) % Growth Cl values
Control 100±5 -
0.5 103±6 >100
0.75 103 ±8 >100
1 97±4 4.3
2.5 96±8 9
5 59±8 1.5
7.5 40±8 1.2
10 34±7 1.3
Combination 2 (adriamycin 1: carboplatin 40).
Concentration (¿ig/inl) % Growth Cl values
Control 100±7 -
0.75 102 ±3 >100
1 99±8 16
2.5 90±6 3.5
5 47±6 0.92
7.5 36±3 0.94
10 30±3 1.01
15 30±4 1.56
99

Combination3 (adriamycin 1: carboplatin 100).
Concentration (¿ig/ml) % Growth Cl values
Control 100±11 -
0.5 99±4 5
0.75 104 ±6 >100
1 100±10 77
2.5 98±5 16
5 66±3 1.78
7.5 48±3 1.42
10 41±2 1.47
15 40±3 2.8
100

Table 3.1.3: Combination Index (Cl) values for Carboplatin and Vincristine in
DLKP-A. Survival was calculated as percentage growth relative to that measured in a
drug-free control and is the mean of eight replicates. The values also include the standard
deviations. The Combination Index (Cl) was calculated as outlined as in Section 2.7.6. Cl
value < 1 represents synergistic toxicity, Cl value =1 represents additive toxicity and Cl
value > 1 antagonistic toxicity.
Combination 1 (vincristine 1: carboplatin 10)
Concentration (fig/m\) % Growth Cl values
Control 100 ±7 -
0.5 85 ±7 88
0.75 89±7 -
1 86±3 10
2.5 66±8 26
5 44±4 4.7
7.5 25 ±5 4
10 17±4 4.6
Combination 2 (vincristine 1: carboplatin 40)
Concentration (jig/ml) % Growth Cl values
Control 100±7 -
0.75 102 ±3 >100
1 99±8 16
2.5 90±6 3.5
5 47±6 0.92
7.5 36±3 0.94
10 30±3 1.01
15 30±4 1.56
101

Combinations (vincristine 1: carboplatin 100)
Concentration (jtg/ml) % Growth Cl values
Control 100±11 -
0.75 102±7 -
1 106±12 >100
2.5 88±9 5.6
5 56±8 3
7.5 37±7 2.5
10 26±4 2.3
15 17 ± 2 2.2
102

Table 3.1.4: Combination Index (Cl) values for adriamycin and vincristine at a ratio of
1:4 in DLKP. Survival was calculated as percentage growth relative to that measured in a
drug-free control and is the mean of eight replicates. The values also include the standard
deviations. The Combination Index (Cl) was calculated as outlined as in Section 2.7.6. Cl
value < 1 represents synergistic toxicity, Cl value = 1 represents additive toxicity and Cl
value > 1 antagonistic toxicity.
Concentration (n/ml) % Growth Cl values
Control 100± 5 -
10 94 ±5 2.79
20 57±4 1.31
40 13±1 0.75
80 5 0.53
150 3 0.76
300 3 1.08
103
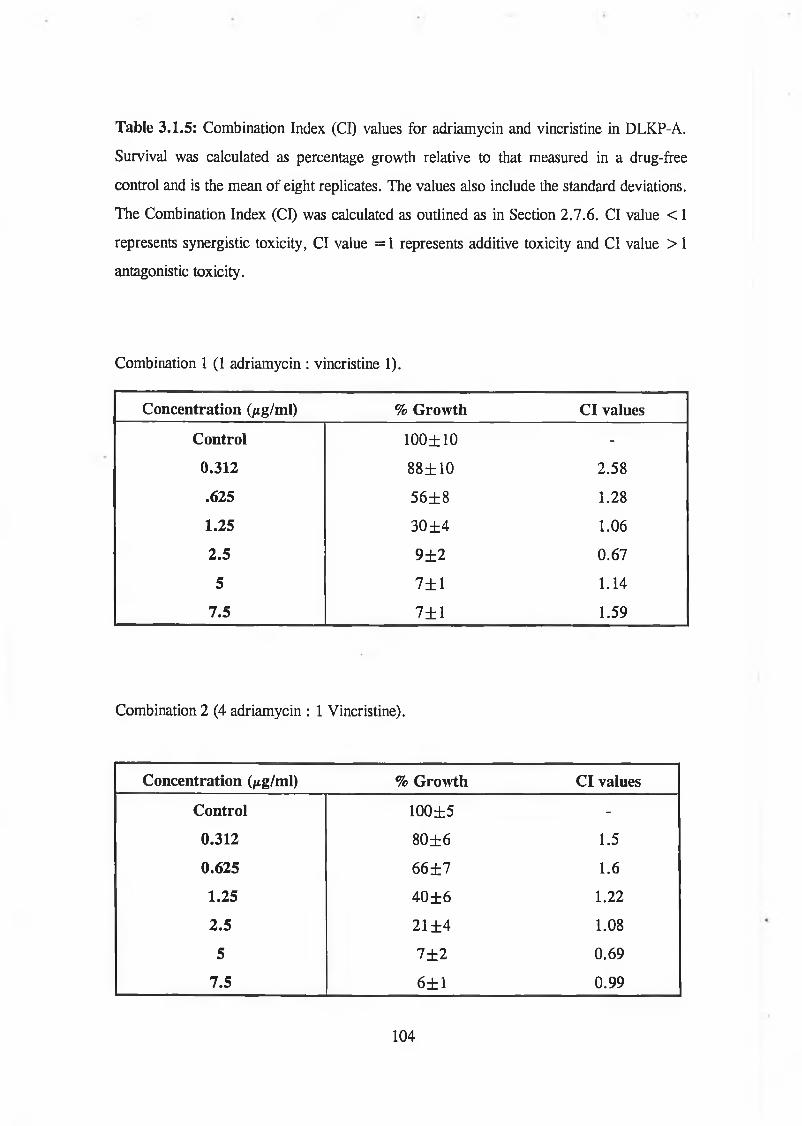
Table 3.1.5: Combination Index (Cl) values for adriamycin and vincristine in DLKP-A.
Survival was calculated as percentage growth relative to that measured in a drug-free
control and is the mean of eight replicates. The values also include the standard deviations.
The Combination Index (Cl) was calculated as outlined as in Section 2.7.6. Cl value < 1
represents synergistic toxicity, Cl value =1 represents additive toxicity and Cl value > 1
antagonistic toxicity.
Combination 1 (1 adriamycin : vincristine 1).
Concentration (jig/ml) % Growth Cl values
Control 100±10 -
0.312 88±10 2.58
.625 56±8 1.28
1.25 30±4 1.06
2.5 9 ± 2 0.67
5 7± 1 1.14
7.5 7±1 1.59
Combination 2 (4 adriamycin : 1 Vincristine).
Concentration (/¿g/ml) % Growth Cl values
Control 100±5 -
0.312 80±6 1.5
0.625 66 ± 7 1.6
1.25 40±6 1.22
2.5 21 ±4 1.08
5 7 ± 2 0.69
7.5 6±1 0.99
104
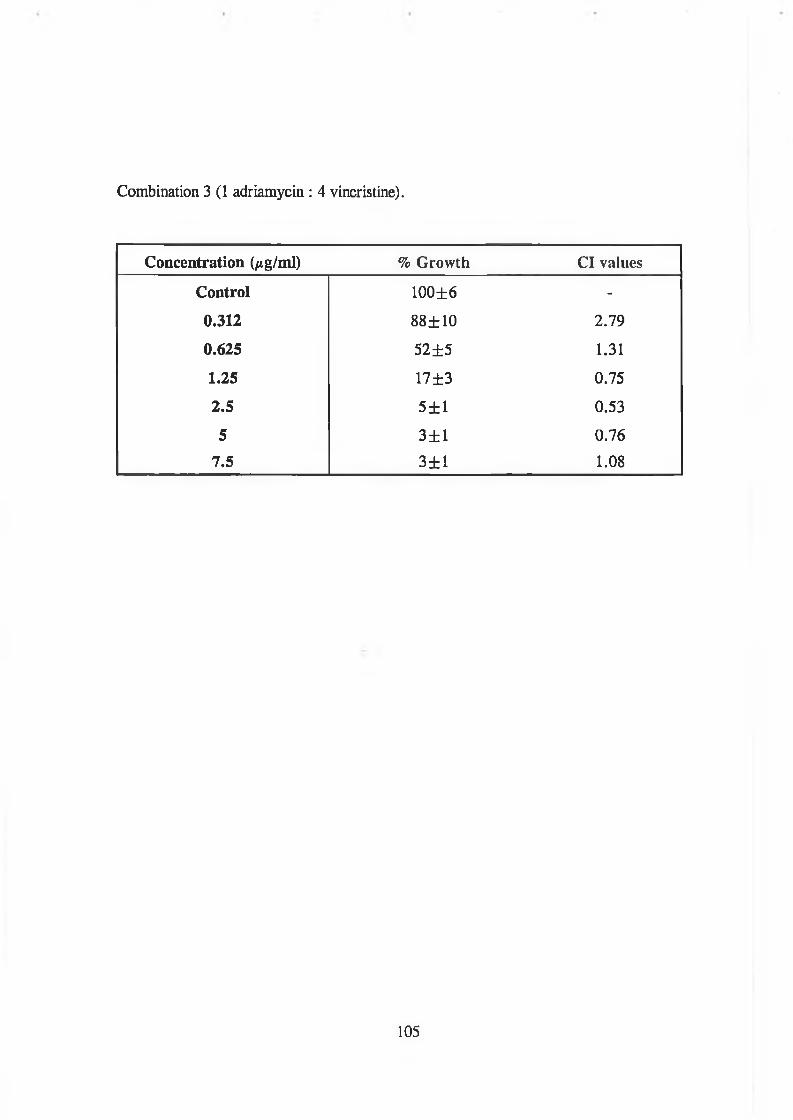
Combination 3 (1 adriamycin : 4 vincristine).
Concentration (/tg/ml) % Growth Cl values
Control 100±6 -
0.312 88±10 2.79
0.625 52±5 1.31
1.25 17±3 0.75
2.5 5±1 0.53
5 3±1 0.76
7.5 3±1 1.08
105

Table 3.1.7: Combination Index (Cl) values for vincristine and VP-16 in DLKP-A.
Survival was calculated as percentage growth relative to that measured in a drug-free
control and is the mean of eight replicates. The values also include the standard deviations.
The Combination Index (Cl) was calculated as outlined as in Section 2.7.6. Cl value < 1
represents synergistic toxicity, Cl value = 1 represents additive toxicity and Cl value > 1
antagonistic toxicity.
Combination 1 (vincristine 1: VP-16 1)
Concentration (mg/ml) % Growth Cl values
Control 100 ±8 -
0.05 97±8 0.2
0.125 97 ± 4 0.48
0.25 95 ± 8 0.79
0.5 68±11 0.535
1.25 8±2 0.31
2.5 6±1 0.55
3.75 8±2 0.95
5 9 ± 2 1.3
Combination 2 (vincristine 1: VP-16 5)
Concentration (/xg/ml) % Growth Cl values
Control 100±9 -
0.05 94±7 -
0.125 95 ± 9 0.22
0.25 95 ±14 0.45
0.5 92±9 0.72
1.25 19±4 0.48
2.5 7±1 0.56
3.75 7±1 0.88
5 7±1 1.13
106

Combination 3 (vincristine 5 : VP -16 1)
Concentration (¿ig/ml) % Growth Cl values
Control 100±6 -
0.05 95 ± 9 -
0.125 96±6 0.63
0.25 91 ± 8 0.82
0.5 25 ±10 0.26
1.25 13 ±2 0.41
2.5 6±1 0.53
3.75 7± 1 0.91
5 7± 1 1.2
107

Table 3.1.6: Combination Index (Cl) values for vincristine and VP-16 in DLKP. Survival
was calculated as percentage growth relative to that measured in a drug-free control and is
the mean of eight replicates. The values also include the standard deviations. The
Combination Index (Cl) was calculated as outlined as in Section 2.7.6. Cl value < 1
represents synergistic toxicity, Cl value = 1 represents additive toxicity and Cl value > 1
antagonistic toxicity.
Combination 1 (vincristine 1: VP-16 1)
Concentration (ng/ml) % Growth Cl values
Control 100±4 -
0.5 56±7 8.38
1.25 12 zh 1 0.53
2.5 5 0.21
5 4 0.32
12.5 3 0.41
25 2 0.38
37.5 2 0.41
50 2 0.60
Combination 2 (vincristine 1 : VP-16 5)
Concentration (ng/ml) % Growth Cl values
Control 100 ±6 -
0.5 83±6 26.7
1.25 80±5 44.8
2.5 55 ±5 12.6
5 15±2 1.08
12.5 5 0.32
25 3 0.35
37.5 3 0.36
50 3 0.47
108
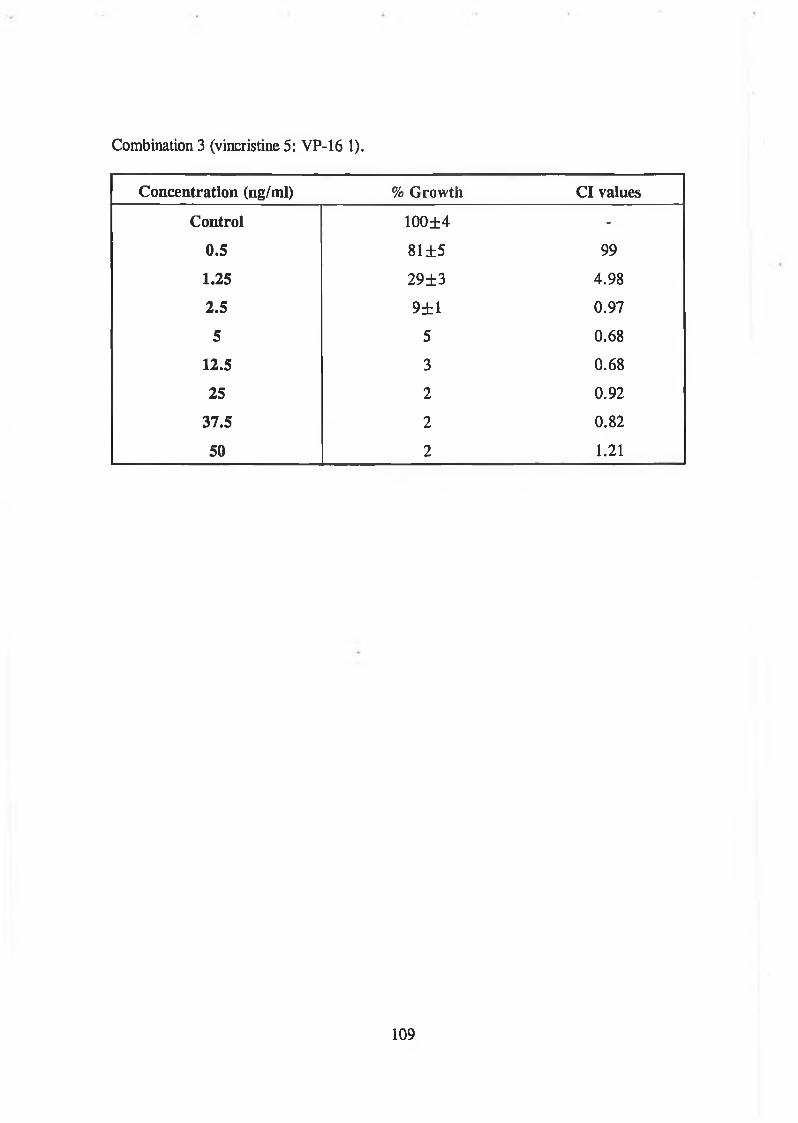
Combination 3 (vincristine 5: VP-16 1).
Concentration (ng/ml) % Growth Cl values
Control 100±4 -
0.5 81 ±5 99
1.25 29±3 4.98
2.5 9±1 0.97
5 5 0.68
12.5 3 0.68
25 2 0.92
37.5 2 0.82
50 2 1.21
109

3.2 MDR circumvention
A number of compounds have been identified which inhibit the efflux of chemotherapeutic
drugs by P-glycoprotein and reverse cellular resistance in experimental systems including
verapamil, a calcium antagonist.
However, there are a number of non-chemotherapeutic drugs which enhance
chemotherapeutic cytotoxicity by mechanisms other than the reversal of drug resistance.
One of these drugs, buthionine sulfoximine (BSO), reduces cellular glutathione levels, by
irreversibly inhibiting y-glutamylcysteine synthetase, the first enzyme involved in de novo
glutathione synthesis. Glutathione helps to protect cells both by reacting with cytotoxic
drug derivatives and by reacting with drug generated reactive oxygen compounds.
This series of experiments was performed to investigate the efficacy of BSO plus a P-
glycoprotein inhibitor (verapamil) in combination with adriamycin in DLKP and DLKP-A
cell lines. DLKP is a human lung carcinoma cell line which is sensitive to
chemotherapeutic drugs and DLKP-A is a MDR derivative of DLKP which overexpresses
P-glycoprotein. Each experiment was performed twice as described in Section 2.7.3 and
the combination Index (Cl) value calculated as outlined in Section 2.7.6.
The cytotoxicity of BSO in combination with adriamycin in DLKP is given in Table 3.2.1
and the Combination Index (Cl) values are given in Table 3.2.2. These results show that
at higher concentrations of BSO, the Cl value was approximately 1. This implies that
there was an additive cytotoxic effect. A synergistic cytotoxic effect (i.e. Cl value < 1)
was observed at lOng/ml adriamycin when ljug/ml of BSO was used.
The cytotoxicity of BSO in combination with adriamycin in DLKP-A is given in Table
3.2.3 and the Combination Index (Cl) values are given in Table 3.2.4. These results show
that at the lowest concentration of BSO (1/xg/ml), the Cl values were less than 1. Thus
110

there was a synergistic toxic effect with all the concentrations adriamycin used. At higher
concentrations of BSO, the Cl values were in general antagonistic.
Verapamil in combination with adriamycin showed little enhanced cytotoxic effect in
DLKP (Table 3.2.5), at the lower concentrations of BSO (0.125/xg/ml and 0.25/tg/ml),
there was synergism in toxicity (Table 3.2.6). However, BSO plus verapamil in
combination with adriamycin did not significantly enhance the toxicity of adriamycin alone
compared to BSO alone with adriamycin (Table 3.2.7).
Verapamil did show enhanced cytotoxicity in combination with adriamycin in DLKP-A
(Table 3.2.8). However, BSO did not significantly affect adriamycin toxicity (Table
3.2.9). The combination of BSO plus verapamil in combination was synergistic with
adriamycin (Table 3.2.10), however it is not clear if this effect is to verapamil alone or the
combination of BSO and verapamil. A more detailed experiment using a number of
combinations of BSO and verapamil with adriamycin was then performed in DLKP-A
(Table 3.2.11). This showed that the combination of BSO plus verapamil with adriamycin
did seem to be synergistic. For example, when one concentration of verapamil was used
and the concentration of BSO was increased then the toxicity of adriamycin was enhanced.
Conversely, when one concentration of BSO was used and the concentration of verapamil
was increased then the toxicity of adriamycin was also enhanced
111

Table 3.2.1: Effect o f BSO on adriamycin toxicity to DLKP. Survival was calculated aspercentage growth relative to that measured in a drug-free control and is the mean o f eightreplicates. The values also include the standard deviations.
Control 5ng/ml
Adriamycin
lOng/ml 15ng/ml 20ng/ml
BSO Oftg/ml 100 57±5 29±3 24 ±4 15 ±2
BSO 0.25jig/ml 44 ±7 20±3 16±3 14±2
BSO 0.5/tg/inl 77±8 44±5 20±2 17±1 14±1
BSO 1/ig/ml 26±4 15 ±2 14±2 12±2
Table 3.2.2: Effect of BSO on adriamycin toxicity to DLKP. The Combination Index
(Cl) was calculated as oudined in Section 2.7.6. Cl value < 1 represents synergistic
toxicity, Cl value »1 represents additive toxicity and Cl value > 1 antagonistic toxicity.
Adriamycin
5ng/ml lOng/ml 15ng/ml 20ng/ml
BSO ljig/ml 1.09 0.789 0.928 1.06
BSO 2.5/ig/ml 1.49 0.971 1.14 1.26
BSO 5/tg/ml 1.16 1.02 1.23 1.33
112

Table 3.2.3: Effect o f BSO on adriamycin toxicity to DLKP-A. Survival was calculatedas percentage growth relative to that measured in a drug-free control and is the mean o feight replicates. The values also include the standard.
0/ig/ml 0.5/tg/ml
Adriamycin
1/tg/rnl 2/tg/ml 3/ig/ml
BSO 0/tg/ml 100±7 71 ±11 48± 15 18±4 12±3
BSO 1/ig/ml - 45 ±10 29±8 11 ±3 6±1
BSO 2.5/ig/ml 56±13 82±6 55 ±5 26±3 15 ±2
BSO 5/tg/ml 34±13 66±9 39±6 16±4 8±1
Table 3.2.4: Effect of BSO on adriamycin toxicity to DLKP-A. The Combination Index
(Cl) was calculated as outlined as in Section 2.7.6. Cl value < 1 represents synergistic
toxicity, Cl value »1 represents additive toxicity and Cl value > 1 antagonistic toxicity.
Adriamycin
0.5/tg/ml 1/ig/ml 2/tg/ml 3/ig/ml
BSO 1/ig/ml 0.975 0.868 0.691 0.688
BSO 2.5/ig/ml 16 4 1.76 1.5
BSO 5/ig/ml 8.8 3 1.3 0.95
113

Table 3.2.5: Effect o f verapamil (Ver) on 15ng/ml adriamycin toxicity to DLKP.Survival was calculated as percentage growth relative to that measured in a drug-freecontrol and is the mean o f eight replicates. The values also include the standard deviations.
Control AdriamycinVer 0/ig/ml 100±4 36±3
Ver 0.125/ig/ml 104 ±5 34±2Ver 0.25ftg/ml 100 ±6 27 ±2Ver 0.5/tg/ml 114 ±8 28±3
Table 3.2.6: Effect of BSO on 15ng/ml adriamycin toxicity to DLKP. Survival was calculated as percentage growth relative to that measured in a drug-free control and is the mean of eight replicates. The values also include the standard deviations.
Control AdriamycinBSO 0/ig/ml 100 ±6 30±3
BSO 0.125/tg/ml 97 ±5 12 ± 1BSO 0.25pg/ml 98±5 18±2BSO 0.5fig/ml 100 ±5 20±5
Table 3.2.7: Effect of BSO plus verapamil (Ver) on 15ng/ml adriamycin toxicity to DLKP. Survival was calculated as percentage growth relative to that measured in a drug- free control and is the mean of eight replicates. The values also include the standard deviations.
0Verl + BSOl
0Ver2 + BS02
Control Adrl Adr2100 ±2 90±5 100
94 ±24
30±2 20±1 36 ±9 13±2
7±18±17±17±1
Where:
Verl = 0.5 g/ml BSOl = 0.5/Ag/ml Adrl = 15ng/mlVer2 = 0.25/xg/ml BS02 = 0.25/ig/ml Adr2 = 30ng/ml
114

Table 3.2.8: Effect o f verapamil (Ver) on 2.5/xg/ml adriamycin toxicity to DLKP-A.Survival was calculated as percentage growth relative to that measured in a drug-freecontrol and is the mean o f eight replicates. The values also include the standard deviations.
Control Adriamycin
Ver 0^g/ml 100 ±5 75±6Ver 0.125/xg/ml 100 ±8 26±2Ver 0.25/tg/ml 98±6 44±4Ver 0.5/xg/ml 101+7 62±4
Table 3.2.9: Effect of BSO on 2.5/xg/ml adriamycin toxicity to DLKP-A. Survival was calculated as percentage growth relative to that measured in a drug-free control and is the mean of eight replicates. The values also include the standard deviations.
Control Adriamycin
BSO 0/tg/ml 100 ±6 69±5BSO 0.125Aig/ml 100±6 63 ±4BSO 0.25/tg/ml 96±5 59±6BSO 0.5/tg/ml 97±5 56±5
Table 3.2.10: Effect of BSO plus verapamil (Ver) on adriamycin toxicity to DLKP-A. Survival was calculated as percentage growth relative to that measured in a drug-free control and is the mean of eight replicates. The values also include the standard deviations.
0
Verl + BSOl
0
Ver2 + BS02
Control Adrl Adr2
100 ±5 99±5
100±10
91±8
67 ±5 20±1
56±5 26±4
32±4 8±1 21±4 12 ±2
Where:
Verl = 0.5/ig/ml BSOl = 0.5/tg/ml Adrl = 2.5/ig/mlVei2 = 0.25/xg/ml BS02 = 0.25/ig/ml Adr2 - 5/tg/ml
115

Table 3.2.11: Effect of BSO plus verapamil (Ver) on adriamycin toxicity to DLKP-A. Survivalwas calculated as percentage growth relative to that measured in a drug-free control and is themean of eight replicates. The values also include the standard deviations.
Control Adrl Adr2 Adr3
0 100±20 84±3 51+5 22±3
BSOl + Verl 100±7 80+6 42+5 14±2
0 100+14 88±20 59+5 27±3
BSOl + Ver2 101+23 75±6 37+5 17+1
0 100±12 90±6 58±4 28±3
BSOl + Ver3 99±12 63±6 31±3 17+1
0 100±7 90±5 51±4 21±2
BS02 + Verl 98+8 73±6 40+3 15±1
0 100+8 88±5 56±2 27±3
BS02 + Ver2 95±7 75+6 44±2 21±1
0 100±4 9G±6 52±6 26±4
BS02 + Ver3 98±8 44±7 22±5 14±2
0 100±9 86+6 52+5 23+4
BS03 + Verl 101+9 75±6 43+4 16±2
0 100+5 80±4 46±3 20±3
BS03 + Ver2 96±11 66±6 36±12 14+2
0 100±8 90±7 58±5 28±4
BS03 + Ver3 99±7 63 ±6 31±4 17±3
Where:Verl = 0.125ptg/ml Vei2 = 0.25/xg/ml Ver3 = 0.5/ig/ml
BSOlBS02BS03
= 0.125/xg/ml = 0.25/ig/ml = 0.5/tg/ml
116
Adrl = 1.25/xg/inl Adr2 = 2.5/xg/ml Adr3 = 5/tg/ml

3.3 MDR1 ribozyme transfection
Currently the best understood mechanism of MDR is the resistance mediated by the
MDR1 gene product, P-glycoprotein (P-170) (see Section 1.9 and 1.10).
Attempts at chemomodulation of P-glycoprotein have been investigated using various P-
glycoprotein antagonists. The results of circumvention compounds in clinical trials have
been disappointing due to the non-specific effects (calcium antagonists) or toxic effects
(cyclosporin A) of the circumvention agent. Therefore a more specific modulation of
MDR is necessary for an improved reduction in drug resistance. At present, one
alternative is to use antisense techniques to interfere with P-glycoprotein expression.
To test the efficacy of antisense in vitro, an anti-MDRl hammerhead ribozyme was
transfected into the adriamycin resistant human lung carcinoma cell line SK-MES-l/Adr.
SK-MES-l/Adr is a derivative of the chemotherapeutic drug sensitive cell line SK-MES-1
(see Table 2.5.1), which was exposed to increasing concentrations of adriamycin. Its
mechanism of drug resistance is primarily thought to be due to P-glycoprotein
overexpression.
Before transfection of SK-MES-l/Adr with the MDR1 ribozyme, SK-MES-l/Adr was
electroporated with the pCHllO fl-galactosidase reporter plasmid at various voltages in
order to optimise transfection efficiency (see Section 2.14.4). fl-Galactosidase activity was
assayed 24 hours after electroporation (see Section 2.15) and the results are given in Table
3.3.1 These show that increasing the voltage of electroporation beyond 250V decreased
electroporation efficiency into SK-MES-l/Adr, as shown by highest OD570 value. Thus,
the optimum voltage to electroporate SK-MES-l/Adr was determined to be 250V.
Three clones were isolated when SK-MES-l/Adr was electroporated with the anti-MDRl
ribozyme plasmid (see Section 2.14.4). These clones were selected in 96-well plates by
continuous exposure to 200/tg/ml geneticin in ATCC media (see Section 2.16).
117

Toxicity assays (see Section 2.7) were performed on each clone to adriamycin, vincristine
and VP-16 and compared to SK-MES-1 and SK-MES-l/Adr (Figures 3.3.1 - 3.3.3).
These graphs demonstrate that each clone displays a decreased resistance to adriamycin,
vincristine and VP-16 compared to the resistant parent cell line, SK-MES-l/Adr. Clone
#2 shows the least amount of chemosensitisation for each drug tested compared to clone
#3 and clone #4. Clone #3 and clone #4 show a similar profile.
The IC50 values for adriamycin, vincristine and VP-16 of SK-MES-1, SK-MES-l/Adr
and each ribozyme clone are given in Table 3.3.2. These values were calculated as
described in Section 2.7.5. These values confirm Figures 3.3.1 - 3.3.3 and show that the
IC50 values of the ribozyme clones were less than the resistant parent SK-MES-l/Adr.
The levels of resistance towards adriamycin, vincristine and VP-16 of SK-MES-l/Adr and
each ribozyme clone was calculated from the IC50 values and are compared in Table
3.3.3. These fold resistance values show that the ribozyme transfectant clones had an
approximately 50% decrease in resistance to adriamycin. Their resistance to vincristine
and VP-16 varied with clone #2 demonstrating the least amount of chemosensitivity while
clone #4 displayed the most.
RT-PCR analysis of RNA isolated from SK-MES-1, SK-MES-l/Adr and each ribozyme
clone as described in Section 2.16 - 2.18, was performed (Figure 3.3.4). No MDR1
mRNA expression was detected in SK-MES-1. An increased expression of MDR1 mRNA
was detected in SK-MES-l/Adr but the three MDR1 ribozyme transfectants expressed less
than the resistant parent. Of the ribozyme transfectants, clone #4 expressed the least
amount of MDR1 mRNA while clone #2 expressed the greatest amount MDR1 mRNA.
This experiment demonstrates the use of an anti-MDRl ribozyme in a MDR cell line.
Three clones were selected when SK-MES-l/Adr was transfected with the ribozyme
plasmid. These clones were assayed for their resistance to adriamycin, vincristine and VP-
16. All the clones displayed increased chemosensitivity to each drug with clone #4 being
the most sensitive. RT-PCR analysis demonstrated that MDR1 mRNA expression was
118

decreased in the clones compared to the resistant parent SK-MES-l/Adr although there
was no clone isolated in which MDR1 expression was completely abrogated. No MDR1
mRNA expression was observed in the sensitive parent SK-MES-1.
Table 3.3.1: Effect of various voltages on the electroporation efficiency of pCHllO, a
B-galactosidase reporter plasmid, into SK-MES-l/Adr. The O.D. at 570nm represents fl-
galactosidase activity (Section 2.14).
Voltage (V) O.D. @ 570nm
0 0
250 0.031
500 0.002
750 0.007
1000 0.002
1250 0.002
119

Figure 3.3.1: Adriamycin toxicity profiles o f SK-MES-l/Adr and the three MDR1ribozyme clones. The error bars represent the standard deviation on the mean o f eightreplicates.
Adriamycin concentration (ng/ml)
\
120

Figure 3.3.2: Vincristine toxicity profiles o f SK-MES-l/Adr and the three MDR1ribozyme clones. The error bars represent the standard deviation on the mean o f eightreplicates.
Vincristine concentration (ng/ml)
121

Figure 3.3.3: VP-16 toxicity profile o f SK-MES-l/Adr and the three MDR1 ribozymeclones. The error bars represent the standard deviation on the mean o f eight replicates.
122

Table 3.3.2: The IC50 values of adriamycin, vincristine and VP-16 in SK-MES-1, SK-
MES-l/Adr and three MDR1 ribozyme transfectant clones. IC50 values were calculated as
described in Section 2.7.5. The values also include the standard deviations.
Adriamycin (ng/ml) Vincristine (ng/ml) VP-16 (ng/ml)
SK-MES-1 24±16 2±1 333± 117
SK-MES-l/Adr 274 ±109 220 ±28 2273 ±631
Clone #2 120 ±73 130±80 1624 ±897
Clone #3 108±71 150±91 1284 ±1054
Clone M 117±36 91 ±27 1215 ±781
Table 3.3.3: Fold increase in resistance towards adriamycin, vincristine and VP-16 of
SK-MES-1, SK-MES-l/Adr and three MDR1 ribozyme transfectant clones compared to
SK-MES-1. The fold resistance was determined by dividing the average IC50 value for the
cell line of interest by the corresponding average IC50 value for SK-MES-1. The values
also include the standard deviations.
Adriamycin Vincristine VP-16
SK-MES-1 1±0.7 1±0.5 1±0.4
SK-MES-l/Adr 11.5 ±4.5 104.5±13.4 6.8±1.9
Clone #2 5±3 61.9±38.2 4.9±2.7
Clone #3 4.5±3 71.3±43.4 3.9±3.3
Clone M 4.9±1.5 43.3± 13 3.7±2.4
123

Figure 3.3.4: Gel electrophoresis of the products of RT-PCR analysis of the
MDR1 mRNA levels in SK-MES-l/Adr and the three MDR1 ribo2yme clones. Two lanes
were run per sample.
b.p. 1 2 3 4 5
1 SK-MES-1
2 SK-MES-l/Adr MDR1 ribozyme #2
3 SK-MES-l/Adr MDR1 ribozyme #3
4 SK-MES-l/Adr MDR1 ribozyme #4
5 SK-MES-l/Adr
603^
310 ► 194»
ii-actin
MDR1
124

3.4 MDR1 gene transfection
MDR is a multifactorial phenomen with a number of resistance mechanisms co-expressed
within a cell (see Section 1.9 and Section 1.10). DLKP-A is a MDR cell line derived from
DLKP by sequential exposure to increasing concentrations of adriamycin. Nine clones
were isolated from DLKP-A, each with different levels of resistance and a combination of
resistance mechanisms (Heenan, 1994). However no clone solely expressed P-
glycoprotein. Therefore DLKP was electroporated with the pHaMDRl/A plasmid, which
encodes the full cDNA for the human MDR1 gene (Pastan et al., 1988), to develop a low
level resistance DLKP clone whose only mechanism of resistance was the expression of P-
glycoprotein. These clones could then be investigated to determine their relative resistance
profiles to different chemotherapeutic drugs and determine if they correlate with each
other. They could also be compared to the resistance profiles to the resistant clones
derived from DLKP-A.
Before transfection of DLKP with the MDR1 gene, DLKP was electroporated with the
pCHllO 8-galactosidase reporter plasmid at various voltages in order to optimise
transfection efficiency (see Section 2.14.4). fl-Galactosidase activity was assayed 24 hours
after electroporation (see Section 2.15) and the results are given in Table 3.4.1. These
show that increasing the voltage of electroporation up to 800V increased electroporation
efficiency into DLKP, as shown by highest O D ^ value. Thus, the optimum voltage to
electroporate DLKP was determined to be 800V. Increasing the voltage further caused
increased cell death and a decrease in transfection efficiency (results not shown).
Two clones were isolated when DLKP was transfected with the pHaMDRl/A plasmid (see
Section 2.14.4). These clones were selected in 96-well plates by continuous exposure to
50ng/ml adriamycin in ATCC media (see Section 2.16). The adriamycin concentration
represents approximately 3 times the IC50 value for DLKP, thus control cells did not
survive when exposed to this concentration and clones selected were resistant to
adriamycin. The concentration of adriamycin in the selection medium was not increased to
a higher concentration because a relatively low resistant clone was preferred.
125

Toxicity assays (see Section 2.7) were performed on each clone to adriamycin, vincristine
and VP-16 (Figures 3.4.1 - 3.4.3). These graphs demonstrate that each clone had an
increased resistance to adriamycin, vincristine and VP-16 compared to the sensitive parent
cell line, DLKP. Clone #1 demonstrated an increased resistance to adriamycin and
vincristine compared to clone #2. In contrast clone #2 showed a greater resistance to VP-
16. The IC50 values for adriamycin, vincristine and VP-16 of each clone are given in
Table 3.4.2. These values were calculated as outlined in Section 2.7.5. The IC50 values
determined for the clones are compared to the IC50 values of DLKP and DLKP-A as
calculated by Dr. M. Heenan (Heenan, 1994). The values show that the MDR1
transfectants were more resistant to each chemotherapeutic drug tested compared to DLKP
but were not as resistant as DLKP-A. The fold increase in resistance towards adriamycin,
vincristine and VP-16 of DLKP-A and the MDR1 transfectants was calculated from the
IC50 values (Table 3.4.3). These fold resistance values showed that clone #1 was over 2
fold as resistant as clone ti2 to adriamycin and 1.5 fold more resistant to vincristine but
that clone ti2 was 1.7 fold more resistant to VP-16 than clone til.
RT-PCR analysis of RNA isolated from DLKP, the two MDR1 transfectants and DLKP-
A as described in Section 2.16 - 2.18, was performed (Figure 3.4.44). No MDR1
expression was detected in DLKP. An increased expression of MDR1 mRNA was
detected in DLKP-A and the two MDR1 transfectants and the expression of MDR1 in
DLKP-A was much greater than the two transfectant clones.
These results show that DLKP was successfully transfected with the MDR1 gene with two
transfectant clones isolated. Toxicity assays were performed on each clone to determine
their resistance profiles to adriamycin, vincristine and VP-16. These showed that the
clones were more resistant to these chemotherapeutic drugs compared to the sensitive
parent cell line DLKP. The toxicity data also demonstrated that clone til was more
resistant to adriamycin and vincristine than clone ti2 but that clone #2 was more resistant
to VP-16 than clone til. Thus even though these clones were derived from the same parent
cell line and were transfected with the same plasmid, they displayed different resistance
126

profiles to the chemotherapeutic drugs tested. RT-PCR analysis confirmed increased
expression of MDR1 mRNA in each clone.
Table 3.4.1: Effect of various voltages on the electroporation efficiency of pCHllO, a
B-galactosidase reporter plasmid, into DLKP. The O.D. at 570nm represents fi-
galactosidase activity (Section 2.15).
Voltage (V) O.D. @
570nm
0 0
200 0.017
400 0.046
600 0.055
800 0.077
127

Figure 3.4.1: Adriamycin toxicity profiles o f DLKP pHaM DR l/A #\ and #2. The errorbars represent the standard deviation on the mean o f eight replicates.
Adriamycin ( M g / m l )
128

Figure 3.4.2: Vincristine toxicity profiles o f DLKP pHaM DR l/A ttl and #2. The errorbars represent the standard deviation on the mean o f eight replicates.
Vincristine (ng/ml)
129

Figure 3.4.3: VP-16 toxicity profile o f DLKP pHaM DR l/A #1 and #2. The error barsrepresent the standard deviation on the mean o f eight replicates.
0 2 4 6 e 10VP-16 (Mg/ml)
130

Table 3.4.2: The IC50 values of adriamycin, vincristine and VP-16 in DLKP
pHaMDRl/A #1 and #2. IC50 values were calculated as outlined in Section 2.7.5. The
IC50 values for DLKP and DLKP-A were calculated by Dr. M. Heenan (Heenan, 1994).
The values also include the standard deviations.
DLKP DLKP-A DLKP
pHaMDRl/A
#1
DLKP
pHaMDRl/A
#2
Adriamycin 14±8ng/ml 3660±1720ng/ml 520±212ng/ml 215±7ng/ml
Vincristine l.l±0.3ng/m l 1680±790ng/ml 51±21ng/ml 33±15ng/ml
VP-16 86±40ng/ml 5230± 690ng/ml 690+0ng/ml 1170±47ng/ml
Table 3.4.3: Fold increase in resistance towards adriamycin, vincristine and VP-16 of
DLKP-A and the MDR1 transfectants. The fold resistance was determined by dividing the
average IC50 value for the cell line of interest by the corresponding average IC50 value
for DLKP. The IC50 values of DLKP and DLKP-A were calculated by Dr. M. Heenan
(Heenan, 1994). The values also include the standard deviations.
DLKP-A DLKP
pHaMDRl/A #1
DLKP
pHaMDRl/A #2
Adriamycin 254 ± 119 37 ± 14.7 15 ± 0.5
Vincristine 1500 ± 705 45.5 ± 18.8 29.5 ± 13.1
VP-16 61 ± 8 8 ± 0 13.6 ± 0.5
131

Figure 3.4.4: Gel electrophoresis of the products of RT-PCR analysis of the MDR1
mRNA levels in DLKP, DLKP-A and the two MDR1 transfectant clones. Two lanes were
run per sample.
603► 310 ► 194^
B-actin
MDR1
1 DLKP
2 DLKP pHaMDRl/A #\
3 DLKP pHaMDRl/A #2
4 DLKP-A
132
3.5 Test Compound Screening
There are a number of non-chemotherapeutic drugs which enhance chemotherapeutic
cytotoxicity by mechanisms other than the reversal of drug resistance (reviewed in
Stewart and Evans, 1989). These include buthionine sulfoximine (BSO) and other
glutathione depletors, the nitroimidazoles and the methylxanthines. However none of these
are in common clinical use. Thus, the need to test new non-chemotherapeutic drugs which
enhances the cytotoxicity of chemotherapeutic drugs is needed more than ever. This series
of experiments investigated possible cytotoxic synergy between adriamycin, a commonly
used chemotherapeutic drug, and five selected non-chemotherapeutic test compounds. Two
concentrations of adriamycin and three non-toxic concentrations of test compound were
used in combination, and assays was performed as described in Section 2.7.3.. Seven cell
lines were tested; DLKP (Table 3.5.1); DLKP pHaMDRl/A #2 (Table 3.5.2); DLKP-A-
2B (Table 3.5.3); DLKP-A-2B IC7 (Table 3.5.4); SK-MES-1 (Table 3.5.5); SK-MES-
1/Adr (Table 3.5.6); SK-MES-l/Adr mdrl ribozyme #4 (Table 3.5.7).
The effect of two concentrations of adriamycin (lOnM and 20 nM) was assayed in
combination with five test compounds in DLKP, a chemotherapy drug sensitive human
lung carcinoma cell line (Table 3.5.1). The test compounds N-l, 0-1 and U-l at non
toxic concentrations, each enhanced the cytotoxicity of adriamycin at lOnM and 20nM
concentrations. The largest effect was observed at the highest concentration of test
compound used. None of the concentrations of the test compounds A-l or U-2 enhanced
the cytotoxicity of adriamycin.
The five test compounds were also assayed in combination with adriamycin in DLKP
pHaMDRl/A #2, a MDR1 transfectant of DLKP which is resistant to adriamycin (see
Section 3.4). At the three concentrations of test compounds tested, none of the test
compounds demonstrated any enhanced toxicity of adriamycin (Table 3.5.2).
133

From the results of testing DLKP and DLKP pHaMDRl/A #2, three test compounds were
further assayed in five other cell lines. These were N-l and U-l, both of which enhanced
the toxicity of adriamycin in DLKP and A-l which did not enhance adriamycin toxicity
and was therefore used as a negative control.
DLKP-A-2B is a low level resistant clone derived from the MDR cell line DLKP-A
(Heenan, 1994). DLKP-A-2B was tested to observe the effect of the test compounds in a
cell line which expresses a number of MDR mechanisms including overexpression of P-
glycoprotein. None of the test compounds assayed enhanced the toxicity of adriamycin
(Table 3.3.3).
In order to further investigate the effect of the test compounds in MDR cell lines, DLKP-
A-2B IC7 was also assayed. DLKP-A-2B IC7 is a MDR1 ribozyme transfectant of DLKP-
A-2B, in which the expression of P-glycoprotein mRNA is inhibited (McBride, 1995).
The test compounds N-l and U-l at non-toxic concentrations, each enhanced the
cytotoxicity of adriamycin at 40nM and 80nM concentrations (Table 3.5.4). The largest
effect was observed at the highest concentration of test compound used. None of the
concentrations of the test compound A-l significantly enhanced the cytotoxicity of
adriamycin.
The test compounds N-l and U-l enhanced the toxicity of adriamycin at 5nM and lOnM
in SK-MES-1, a chemotherapeutic drug sensitive cell line (Table 3.5.5). A-l did not
enhance the toxicity of adriamycin.
SK-MES-l/Adr is a MDR derivative of SK-MES-1, which was exposed to increasing
concentrations of adriamycin. When this cell line was assayed with the test compounds in
combination with adriamycin (Table 3.5.6), no enhancement of toxicity was observed.
134

A MDR1 ribozyme transfectant of SK-MES-l/Adr was then assayed with the test
compounds. SK-MES-l/Adr MDR1 ribozyme clone M was the most sensitive clone
obtained after transfection of SK-MES-l/Adr with a MDR1 ribozyme, although P-
glycoprotein mRNA expression was not completely inhibited (see Section 3.3). No
enhancement of toxicity was observed when this cell line was assayed with the test
compounds in combination with adriamycin (Table 3.5.7).
The above results demonstrated that the test compounds N -l, 0-1 and U-l were shown to
be synergistic at non-toxic levels in combination with adriamycin in DLKP but not DLKP
pHaMDRl/A #2, whereas A-l and U-2 exhibited no synergy. N-l and U-l exhibited
synergy in DLKP-A-2B IC7 and SK-MES-1 but not in DLKP-A-2B, SK-MES-l/Adr and
SK-MES-l/Adr mdrl ribozyme #4. A-l had no synergistic effect in any cell line assayed.
135

Table 3.5.1: Adriamycin in combination w ith the test compounds in DLKP. Survival wascalculated as percentage growth relative to that measured in a drug-free control and is themean o f eight replicates. The values also include the standard deviations.
[1] [2] [3] Adr
(lOnM)
Adr +
[1]
Adr +
[2]
Adr +
[3]
A-l 102 ±9 102 ±9 104+8 97 ±5 90±4 94 ±7 98±7
N -l 98±11 92±11 95±11 90±9 61 ±5 67±5 80±6
0-1 98±9 98±8 98±8 84 ±10 64± 11 63 ±13 56± 11
U-l 104 ±6 104 ±6 106±6 79±5 40±4 50±4 62±6
U-2 102 ±6 99±5 99±6 75 ±5 91 ±7 88 ±8 82±6
[1] [2] [3] Adr
(20nM)
Adr +
[1]
Adr +
[2]
Adr +
[3]
A-l 96±7 100±6 106±5 35 ±3 26±3 28±2 33±5
N-l 97± 11 98±9 96±9 62 ±4 15 ±1 16±1 20±2
0-1 99±5 101 ±5 106 ±7 82 ±3 51±6 60±6 59±7
U-l 110±5 107±8 110±8 40±3 12±1 15 ±2 22 ±2
U-2 103 ±10 100±8 99±8 67 ±7 71 ±8 64±9 58± 10
Test compound concentrations
[A-l] 1 = 140/xM
[A-l] 2 = 70/tM
[A-l] 3 = 35/iM
[U-l] 1 = 17/iM
[U-l] 2 = 8.5/xM
[U-l] 3 = 4.25/iM
[N-l] 1 = 8/xM
[N-l] 2 = 4j*M
[N-l] 3 = 2/iM
[U-2] 1 = 5/xM
[U-2] 2 = 2.5/*M
[U-2] 3 = 1.25/tM
[0-1] 1 = 240/xM
[0-1] 2 = 120/iM
[0-1] 3 = 60/tM
136

Table 3.5.2: Adriamycin in combination with the test compounds in DLKP pHaMDRl/A
#2. Survival was calculated as percentage growth relative to that measured in a drug-free
control and is the mean of eight replicates. The values also include the standard deviations.
[1] [2] [3] Adr
(180nM)
Adr +
[1]
Adr +
[2]
Adr +
[3]
A-l 89±7 98±6 100±8 72 ±5 68±5 71±7 68±5
N-l 72±4 87±4 95±8 93 ±5 72±4 87 ±4 95 ±8
0-1 96 ±4 97 ± 7 96±5 72±8 70±8 67±6 62 ±7
U-l 98±11 102±6 100±8 72 ±5 69±5 67±3 68±6
U-2 98±6 101±6 101±6 64±5 63 ± 6 60±5 50±6
[1] [2] [3] Adr
(360nM)
Adr +
[1]
Adr +
[2]
Adr +
[3]
A-l 94 ±7 97 ±5 98±7 41±4 48±6 44±5 40±4
N-l 79±5 94±5 101 ±8 69±8 47±5 58±5 65 ±5
0-1 97±5 99 ±5 102 ±5 47±3 48±5 44±4 36±5
U-l 105 ±9 96±4 100±8 37±3 39±4 37±5 37±3
U-2 97±3 91 ± 6 98±6 46±3 43 ±4 41±4 38±4
Test compound concentrations[A-l] 1 = 140/xM [A-l] 2 = 7(VM [A-l] 3 = 35/xM
[U-l] 1 = 17/iM [U-l] 2 = 8.5/iM [U-l] 3 = 4.25piM
[N-l] 1 = 8/xM [N-l] 2 = 4/iM [N-l] 3 = 2/iM
[U-2] 1 = 5/xM [U-2] 2 = 2.5/iM [U-2] 3 = 1.25/iM
[0-1] 1 = 240/iM [0-1] 2 = 120/iM [0-1] 3 = 60/aM
137

Table 3.5.3: Adriamycin in combination with the test compounds in DLKP-A-2B.
Survival was calculated as percentage growth relative to that measured in a drug-free
control and is the mean of eight replicates. The values also include the standard deviations.
[1] [2] [3] Adr
(lOOnM)
Adr +
[1]
Adr +
[2]
Adr +
[3]
A-l 98±9 101±14 99± 11 96±9 104±10 102±7 95 ±7
N -l 150±15 120±12 99±10 96±8 116±9 101 ±8 88±8
U -l 120±19 93 ±12 92± 13 57±9 66±12 53±9 54± 11
[1] [2] [3] Adr
(200nM)
Adr +
[1]
Adr +
[2]
Adr +
[3]
A-l 88± 12 112±13 110± 15 47 ±5 58±7 66± 11 97±9
N -l 130± 13 130± 11 99±10 84±8 108±5 91 ±7 85±8
U -l 120 ±20 95 ±20 91 ± 14 50±12 60±10 56±12 48±5
Test compound concentrations
[A-l] 1 = UOfiM
[A-l] 2 = IQfM
[A-l] 3 = 35fM
[N-l] 1 = SfiM
[N-l] 2 = 4/*M
[N-l] 3 = 2ixM
[U-l] 1 = 17/xM
[U-l] 2 = 8.5/xM
[U-l] 3 = 4.25/tM
138

Table 3.5.4: Adriamycin in combination with the test compounds in DLKP-A-2B IC7.
Survival was calculated as percentage growth relative to that measured in a drug-free
control and is the mean of eight replicates. The values also include the standard deviations.
[1] [2] [3] Adr
(40nM)
Adr +
[1]
Adr +
[2]
Adr +
[3]
A-l 90±7 99 ±7 125 ±6 76±4 58±4 63 ±5 93±6
N-l 72 ±4 104±7 102 ±6 81 ±7 18±1 26±2 32±2
U-l 105 ±6 107 ±7 103 ±6 79 ±5 25 ±2 33 ±4 53 ±4
[1] [2] [3] Adr
(80nM)
Adr + Adr +
[1] [2]
Adr +
[3]
A-l 88±11 92±9 83 ±10 26 ±5 19±3 20±4 13±2
N-l 107 ±5 107 ±5 106±3 34±3 16±2 25 ±2 15 ±2
U-l 102 ±5 99±5 99±7 32 ±4 15±1 15±1 17±1
Test compound concentrations
[A-l] 1 = 140/xM [N-l] 1 = 8juM [U-l] 1 = 17/xM
[A-l] 2 = 10fM [N-l] 2 = 4/xM [U-l] 2 = 8.5/xM
[A-l] 3 = 35/xM [N-l] 3 = 2mM [U-l] 3 = 4.25/xM
139

Table 3.5.5: Adriamycin in combination with the test compounds in SK-MES-1. Survival
was calculated as percentage growth relative to that measured in a drug-free control and is
the mean of eight replicates. The values also include the standard deviations.
[1] [2] [3] Adr
(5nM)
Adr +
[1]
Adr +
[2]
Adr +
[3]
A -l 74 ±5 88±4 98 ±5 100±5 73 ±4 85 ±5 94±6
N-l 94±4 99±7 100±8 103 ±6 87±4 92±5 98±6
U -l 98±5 100±5 100±7 102±5 89±6 100±5 94±6
[1] [2] [3] Adr
(lOnM)
Adr +
[1]
Adr +
[2]
Adr +
[3]
A -l 73 ±3 86±5 93 ±5 93 ±6 69±3 82±5 87±5
N -l 91 ±6 95 ±4 94 ±4 91 ±8 69±3 70 ±4 89±4
U -l 98±8 101 ± 4 101±6 93 ± 7 61 ±4 80±5 88±6
Test compound concentrations
[A-l] 1 = 140/iM [N-l] 1 = 8/xM [U-l] 1 = 17/xM
[A-l] 2 = 70/xM [N-l] 2 = 4/tM [U-l] 2 = 8.5/tM
[A-l] 3 = 35/xM [N-l] 3 = 2/xM [U-l] 3 = 4.25/xM
140

Table 3.5.6: Adriamycin in combination with the test compounds in SK-MES-l/Adr.
Survival was calculated as percentage growth relative to that measured in a drug-free
control and is the mean of eight replicates. The values also include the standard deviations.
[1] [2] [3] Adr
(200nM)
Adr +
[1]
Adr +
[2]
Adr +
[3]
A-l 74±6 88±8 95 ± 7 97±7 77±5 92±8 98±9
N-l 80±13 101 ±12 103 ±10 104± 13 82±8 103± 10 97± 13
U-l 102±14 104±10 103 ±10 97±8 94±8 96±8 99± 13
[1] [2] [3] Adr
(400nM)
Adr +
[1]
Adr +
[2]
Adr +
[3]
A-l 71±7 85 ±6 92±7 93 ±7 85 ± 9 101 ±6 109±7
N-l 73±8 94±10 98± 11 90±11 65 ±7 87 ±10 85± 11
U-l 92±9 95 ±10 99±10 89± 12 86± 10 89± 10 85 ±15
Test compound concentrations
[A-l] 1 = UQ/M
[A-l] 2 = lOpM
[A-l] 3 = 35fxM
[N-l] 1 = 8/xM
[N-l] 2 = 4 /jlM
[N-l] 3 = 2/xM
[U-l] 1 = 17/xM
[U-l] 2 = 8.5/nM
[U-l] 3 = 4.25/tM
141

Table 3.5.7: Adriamycin in combination with the test compounds in SK-MES-l/Adr
mdrl ribozyme #4. Survival was calculated as percentage growth relative to that measured
in a drug-free control and is the mean of eight replicates. The values also include the
standard deviations.
[1] [2] [3] Adr
(20nM)
Adr +
[1]
Adr +
[2]
Adr +
[3]
A-l 77 ±7 81±8 91±8 87±8 67±6 77±6 85 ±7
N-l 82 ±9 86±9 95 ±6 97 ±7 82±8 85 ±5 90±13
U-l 97±8 99±9 100±6 96±8 86±8 88±7 90±9
[1] [2] [3] Adr
(40nM)
Adr +
[1]
Adr +
[2]
Adr +
[3]
A-l 77±4 85 ±6 97±7 98 ±12 74±6 82±6 93±9
N-l 84 ± 7 87±9 96 ±7 94 ±7 79±7 83 ±6 88±8
U-l 94±14 96±5 100±10 93 ±7 87±7 87±5 87±6
Test compound concentrations
[A-l] 1 = 140/xM
[A-l] 2 = 70/iM
[A-l] 3 = 35piM
[N-l] 1 = 8/xM
[N-l] 2 = 4mM
[N-l] 3 = 2/tM
[U-l] 1 = llfxM
[U-l] 2 = 8.5/iM
[U-l] 3 = 4.25/iM
142

3.6 Drug Pulse / Scheduling Assays
There are a number of non-chemotherapeutic drugs which enhance chemotherapeutic
cytotoxicity by mechanisms other than the reversal of drug resistance. However none of
these are in common clinical use. Thus, the need to test new non-chemotherapeutic drugs
which enhances the cytotoxicity of chemotherapeutic drugs is needed more than ever.
The results of the previous section (Section 3.5) described the effect of combining five test
compounds with adriamycin. Three of these compounds were found to enhance the
toxicity of adriamycin in three of seven cell lines assayed. However, due to the nature of
the assay, which is an excellent assay for screening test compounds, no information could
be derived about the mechanism of action of the active test compounds. To investigate the
synergistic toxic effect of N-l, 0-1 and U -l, an assay was developed to analyse how
synergism was affected when cells were exposed to the test compounds at different times
relative to adriamycin exposure (see Section 2.7.4). Briefly, cells were set up in 96-well
plates and the following day, pulse treated with a chemotherapeutic drug for 2 hours, the
drug was then removed and the cells washed twice in PBS, they were then exposed to a
test compound for various time periods.
Initial experiments in DLKP demonstrated that there was a synergistic effect when DLKP
was exposed to N-l or U-l during the first 24 hour time period after adriamycin exposure
(Table 3.6.1). No synergism was observed when DLKP was exposed to the test
compounds from 24 to 48 hours, 48 to 72 hours or from 72 to 96 hours.
Following on from these experiments a number of other test compounds were also
assayed. These assays were performed on DLKP-SQ, which is a clone derived form
DLKP (McBride, 1995). DLKP-SQ was used because it was a clonal population and
therefore could also be used for subsequent flow cytometric analysis. The results of these
assays are given in Table 3.6.2. N-l, 0-1 and U-l exhibited a synergistic effect during the
first 24 hour period after a 2 hour pulse exposure to 1/xM adriamycin. The test compounds
143

A -l, 1-1 and U-2 had no effect. BSO showed an additive toxic effect with adriamycin but
verapamil and cyclosporin A had no significant effect when added over this period.
Previous experiments demonstrated that the test compounds N-l, 0-1 and U-l were
synergistic with adriamycin. These test compounds were also assayed using vincristine
(Table 3.6.3) and 5-fluorouracil (Table 3.6.4). The test compounds showed a strong
synergism in combination with vincristine, with an increase of 50% in cytotoxicity when
N-l was used. BSO was also used in combination with vincristine and there seems to be
an enhancement of toxicity but this effect may be due to the additive toxicity of BSO.
Combinations of the test compounds with 5-fluorouracil did not exert any synergistic
cytotoxic effect.
In order to determine if pre-treatment of DLKP-SQ with the test compounds enhanced
toxicity. Cells were pre-treated for 24 hours before pulse exposure to adriamycin.
However, there was no enhanced cytotoxic effect with any test compound studied (Table
3.6.5).
Because treatment with N-l, 0-1 or U-l only worked during the first 24 hours after
adriamycin treatment, the time period for exposure to a test compound was decreased to
10 hours. Using this time period N-l exposure was assayed during adriamycin exposure
and for the 10 hour periods after different adriamycin concentration pulse exposures
(Table 3.6.6). The assay demonstrated that the greatest effect was observed during the first
10 hour period after adriamycin exposure (Table 3.6.6). No synergistic effect was
observed when N-l was added during adriamycin exposure.
Since the active test compounds exerted their synergistic effect during the first 24 hours
after drug removal, cycloheximide (a protein synthesis inhibitor) and actinomycin D (an
inhibitor of transcription and translation) were used to try and block the synergistic effect.
Using a relatively non-toxic level of cycloheximide (75 % cell survival) did not prevent the
toxic effect of U-l (Table 3.6.7). Actinomycin D in combination with U-l after
adriamycin exposure did not prevent the toxic effect of U-l (Table 3.6.8).
144

The above results demonstrate that the active test compounds, N-l, 0-1 and U-l exert
their synergistic cytotoxic effect during the first 24 hours post-treatment with adriamycin
or vincristine but not 5-fluorouracil. Pretreatment with the test compounds for 24 hours
has no enhanced toxic effect. Co-treatment of U-l with cycloheximide or actinomycin D did not prevent the synergistic effect of U-l.
Table 3.6.1: Effect of exposing DLKP cells to 1/xM adriamycin for 2 hours and then treating with
a test compound (TC) for 24 hour periods from when adriamycin was removed. Survival was
calculated as percentage growth relative to that measured in a drug-free control and is the mean of
eight replicates. The values also include the standard deviations.
Control TC
0-24hr
Adr
(1 iM)
Adr+TC
0-24hr
Adr +TC 24-48hr
Adr +TC 48-72hr
Adr+TC72-96hr
N -l28/xM
100±8 91 ±14 51±6 33 ±4 53 ±8 53 ±7 53 ±4
U -l140/xM
100±11 90±9 55 ±7 36 ±7 59 ±16 58 ±16 55 ±10
145

Table 3.6.2: DLKP-SQ pulse treated with 1/xM adriamycin for 2 hours and then treating
with a test compound (TC) from when 1/xM adriamycin was removed for 24 hours and
from 24 to 48 hours after drug removal. Survival was calculated as percentage growth
relative to that measured in a drug-free control and is the mean of eight replicates. The
values also include the standard deviations.
Control TC
0-24hrs
TC
24-48hr
Adr (1/iM) Adr +TC 0-24hr
Adr +TC 24-48hr
A - l 200/iM 100 ± 15 80 ±12 72 ±10 45 ±6 45 ±6 44±5
BSO 900/xM 100±6 57 ±5 73 ±7 47 ±5 18 ±5 33 ±6
CysA0.2/ig/ml
100±10 90±8 81 ±9 52 ±6 45 ±7 47 ±5
1-1 60/xM 100± 17 91 ±15 92±14 52 ±9 62 ±10 53 ±7
N -l 28/iM 100± 19 106 ±21 93 ±17 46 ±7 29 ±4 40±5
0-1 130/iM 100±12 109±16 107±7 56 ±9 37 ±7 54± 14
U-l 140/tM 100±13 88 ±12 81 ±8 46±3 30±2 45 ±3
U-2 1/xM 100±16 105 ±11 77 ±9 44±5 39±6 41 ±7
Yer 1/xM 100±12 113 ±9 115 ±9 53 ±8 46±6 48 ±5
146

Table 3.6.3: Effect of exposing cells to 60nM Vincristine for 2 hours and then treating
with various compounds (TC) from when vincristine was removed, for 24 hours and from
24 to 48 hours after vincristine removal. Survival was calculated as percentage growth
relative to that measured in a drug-free control and is the mean of eight replicates. The
values also include the standard deviations.
Control TC
0-24hrs
TC
24-48hr
Vcr
(60nM)
Vcr+TC
0-24hr
Vcr+TC
24-48hr
BSO 900/xM 100±6 80±5 91 ± 5 53±5 19±2 39±6
N-l 28/iM 100±8 105 ± 7 107 ± 8 67 ± 5 19±2 66±6
0-1 130/xM 100±8 102±7 104± 13 68± 12 30±5 77 ±10
U-l 140/xM 100±11 101 ±13 98± 11 53 ± 7 17±3 48±8
Table 3.6.4: Effect of exposing cells to 190/xM 5-Fluorouracil for 2 hours and then
treating with a compound (TC) from when 5-Fluorouracil was removed, for 24 hours and
from 24 to 48 hours after 5-fluorouracil removal. Survival was calculated as percentage
growth relative to that measured in a drug-free control and is the mean of eight replicates.
The values also include the standard deviations.
Control TC
0-24hrs
TC
24-48hr
5-FU
(190/tM)
FU+TC
0-24hr
FU+TC
24-48hr
A-l 200(M 100±12 101 ± 14 91 ± 15 109± 13 100±15 87 ±12
N-l 28/xM 100 ±20 104±17 91 ±21 99±21 91 ±12 98± 16
U-l 140/iM 100±14 93 ± 9 76± 11 107±8 88±10 69±10
147

Table 3.6.5: Effect of pre-treating DLKP-SQ before pulse treating with l^M adriamycin (Adr)
for 2 hours. DLKP-SQ was exposed to a test compound for various time periods including 24
hours before drug exposure (-24 to 0), 24 hours before and after adriamycin treatment (-24 to 24)
and for 24 hours after adriamycin treatment (0 to 24). All concentrations of test compounds used
were less than 10% toxic. Survival was calculated as percentage growth relative to that measured
in a drug-free control and is the mean of eight replicates. The values also include the standard
deviations.
Adr (-24 to 0) (-24 to 24) (0 to 24)
U-l 140/*M 71 ± 6 68±8 33 ± 4 35 ± 4
N-l 2&tM 75 ± 7 75 ± 9 41±4 38±6
A-l 200/tM 86±8 78±7 74±12 93 ±14
Table 3.6.6: Effect of treating DLKP-SQ with N-l during adriamycin exposure and for shorter
time periods (10 hours) after 2 hours exposure to four concentrations of adriamycin. The table
shows the effect of 28/xM N-l alone, adriamycin at various concentrations alone and adriamycin at
the various concentrations in combination with N-l during adriamycin exposure, for 10 hours after
adriamycin exposure (0 - 10) and from 10 hours to 20 hours (10 - 20)Survival was calculated as
percentage growth relative to that measured in a drug-free control and is the mean of eight
replicates. The values also include the standard deviations.
[Adr] N-l Adr During Adr
exposure
0 -1 0 1 0 -2 0
0.25/xM 90±12 88± 10 87±8 96±14 102± 13
0.5/iM 76± 11 74±10 63±8 65 ± 9
1/xM 94 ±13 30±6 34±5 22 ± 4 29 ± 4
2/xM 15 ± 3 13±3 6±2 6±1
148

Table 3.6.7: Effect of 50ng/ml cycloheximide (CHX) in combination with 140/xM U-l
after 2 hours 1/xM adriamycin exposure. Survival was calculated as percentage growth
relative to that measured in a drug-free control and is the mean of eight replicates. The
values also include the standard deviations.
Control 1/iM Adr
Control 100±22 56±10
U -l (0 - 24) 81 ± 14 35 ±5
CHX (0 - 24) 75 ± 6 53±13
U -l + CHX (0-24) 62 ±10 33 ±5
Table 3.6.8: Effect of 0.5ng/ml Actinomycin D (ActD) in combination with 140 /¿M U-
1 after 2 hours l^M adriamycin exposure. Survival was calculated as percentage growth
relative to that measured in a drug-free control and is the mean of eight replicates. The
values also include the standard deviations.
Control 1/tM Adr
Control 100±11 54±6
U -l (0 - 24) 79±5 32±4
ActD (0 - 24) 72±6 44±3
U-l + ActD (0-24) 56±4 26±3
149

3.7 DLKP pHaMDRl/A #2 Scheduling
Exposure of DLKP-SQ to a cytotoxic concentration of adriamycin, followed by treatment
with a non-toxic concentration of an active test compound, results in an enhancement of
adriamycin’s toxicity. However, no effect of the test compounds was observed in any P-
glycoprotein expressing cell line using the standard circumvention assay. Using the
modified assay (see Section 2.7.4) i.e. pulse treatment with adriamycin, the effect of 6 test
compounds was assayed on DLKP pHaMDRl/A #2.
DLKP pHaMDRl/A ft2 was pulse treated with adriamycin and exposed to 6 test
compounds for 24 hour periods (Table 3.7.1). When non-toxic levels of test compound
were used after adriamycin exposure there was no enhanced toxicity compared to
adriamycin alone . No synergistic effect with adriamycin was observed with any of the six
test compounds assayed e.g. U-l exposure did not enhance the toxicity of 1/xM
adriamycin compared to IpM adriamycin exposure alone. A-l, 1-1, 0-1 and U-2 did
show some increased toxicity in combination with adriamycin but this was probably due to
the additive toxicity of the verapamil and the test compounds.
Because the test compounds had displayed no synergy with adriamycin in P-glycoprotein
positive cells, verapamil was used in combination with the test compounds. Verapamil
inhibits P-glycoprotein associated, energy-dependent drug-efflux in MDR cells, apparently
by blocking the binding of drugs to P-glycoprotein (Ford, 1995). Using the test
compounds and verapamil in combination with adriamycin, there was no restoration of the
synergistic effect of the test compounds observed in DLKP (Table 3.7.2).
The above experiment was repeated using cyclosporin A instead of verapamil, in
combination with U -l (Table 3.7.3). Cyclosporin A is an immunosuppressive peptide
which antagonises MDR through the inhibition of P-glycoprotein. At the lower
concentration of adriamycin (0.25/zM and 0.5/xM) there was no enhanced toxicity with
cyclosporin A or with cyclosporin A plus U-l in combination. At 1/xM and 2/xM
150

adriamycin concentrations, cyclosporin A enhanced the toxicity of adriamycin. However,
U-l or U-l plus cyclosporin did not enhance adriamycin toxicity.
These results show that the synergistic toxic effect observed between U-l and adriamycin
in DLKP was not restored in a DLKP pHaMDRl/A #2 when inhibitors of P-glycoprotein
was used.
Table 3.7.1: DLKP pHaMDRl/A #2 pulse treated with 1/xM adriamycin for 2 hours and
treated with a test compound (TC) for 24 hour periods after adriamycin exposure. The
table shows the drug-free control, test compound controls for 0-24 hours and 24-48 hours
exposure, adriamycin alone and adriamycin in combination with a test compound for 0-24
hours and 24-48 hours. Survival was calculated as percentage growth relative to that
measured in a drug-free control and is the mean of eight replicates. The values also
include the standard deviations.
TC Control TC
0-24hrs
TC
24-48hr
Adr
(1/tM)
Adr+TC
0-24hr
Adr+TC
24-48hr
A-l 200/xM 100±15 62 ±16 83 ±15 48±5 33±6 46±8
1-1 60/xM 100±16 70±9 103± 11 48±7 43±6 48±8
N-l 28/xM 100±28 130±25 87 ±21 35 ±4 51±5 30±4
0-1 130/tM 100±11 88± 17 82 ±7 37±4 30±5 28±2
U-l 140/iM 100 ±30 102±14 82 ±23 34±3 41 ±6 31 ±4
U-2 I f M 100±12 58±9 75±11 42±6 22±3 36±4
151

Table 3.7.2: Effect of combining test compounds with verapamil after 2 hours 1/xM
adriamycin (Adr) exposure pulse exposure in DLKP pHaMDRl/A #2. The table shows
the drug-free control, the test compound (TC) alone for 24 hours, verapamil (Ver) for 24
hours, adriamycin alone, adriamycin in combination with verapamil and adriamycin in
combination with verapamil plus a test compound for 24 hours. Survival was calculated as
percentage growth relative to that measured in a drug-free control and is the mean of eight
replicates. The values also include the standard deviations.
Control TC
0-24hr
Ver 0-24
1/iM
1/tM Adr Adr+ Ver Adr+Ver
+TC
A-l
200/tM
100±15 62 ±16 67±13 48±5 32±6 39±4
l - l
60/tM
100±16 70±9 74 ±21 48±7 39±6 42 ±5
N -l 28/iM 100±28 130±25 112±9 35 ±4 43 ±6 47 ±5
0-1
130/iM
100±11 88±17 69±8 37±4 22 ±4 21 ±3
U -l
140/*M
100±30 102± 19 99± 18 34±3 36±5 38±7
U-2
IfiM
100±12 58±9 75 ±11 42±6 30 ±4 27 ±2
152
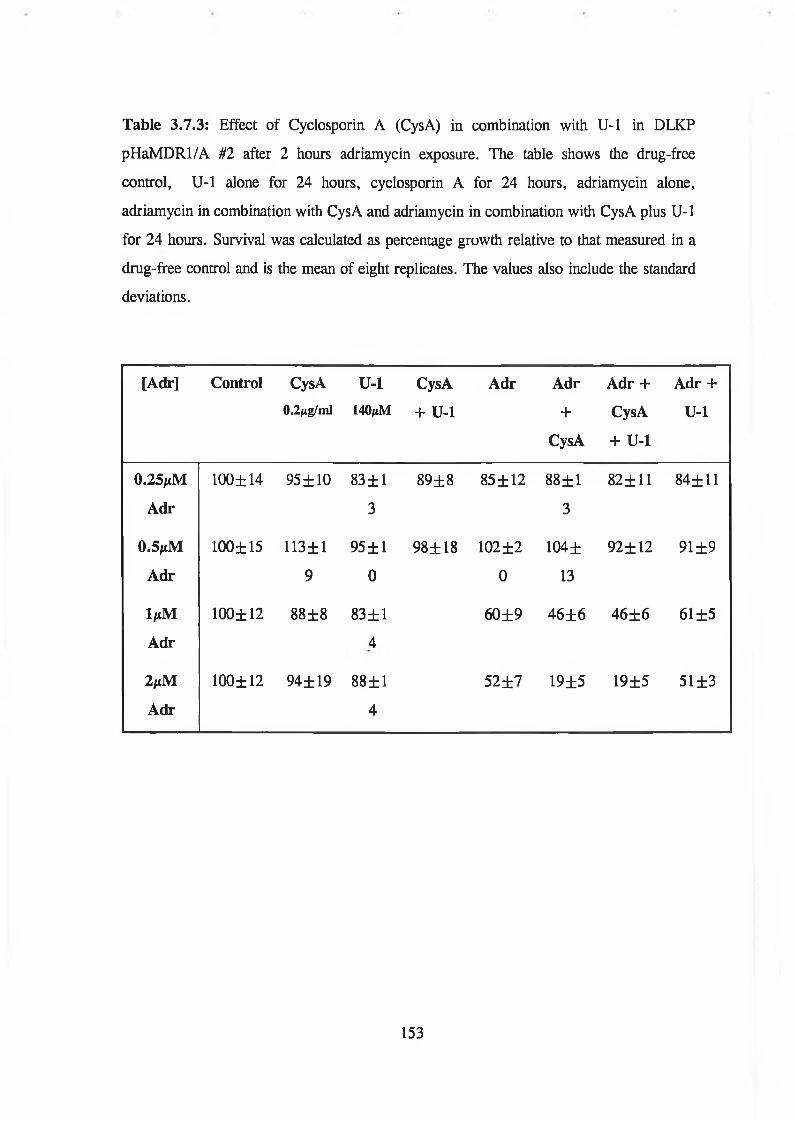
Table 3.7.3: Effect of Cyclosporin A (CysA) in combination with U-l in DLKP
pHaMDRl/A til after 2 hours adriamycin exposure. The table shows the drug-free
control, U-l alone for 24 hours, cyclosporin A for 24 hours, adriamycin alone,
adriamycin in combination with CysA and adriamycin in combination with CysA plus U-l
for 24 hours. Survival was calculated as percentage growth relative to that measured in a
drug-free control and is the mean of eight replicates. The values also include the standard
deviations.
[Adr] Control CysA0.2/ig/ml
U-l140jiM
CysA
+ U-l
Adr Adr
+
CysA
Adr +
CysA
+ U-l
Adr +
U-l
0.25 jiM
Adr
100±14 95 ±10 83 ± 1
3
89±8 85 ±12 88±1
3
82± 11 84±11
0.5/tM
Adr
100±15 113± 1
9
95 ±1
0
98± 18 102 ±2
0
104±
13
92±12 91 ±9
l p M
Adr
100±12 88±8 83±1
4
60±9 46±6 46±6 61 ±5
2/tM
Adr
100±12 94± 19 88±1
4
52±7 19±5 19±5 51 ±3
153

3.8 Cell cycle distribution
The results from Section 3.6 demonstrated that the test compounds, N-l, 0-1 and U-l
exert their synergistic cytotoxic effect during the first 24 hours post-treatment with
adriamycin or vincristine but not 5-fluorouracil. These experiments were performed using
a 7 day cell growth assay. In order to investigate the role of these test compounds on
DLKP-SQ, flow cytometric analysis was used to determine the cell cycle distribution of
treated samples. A flow cytometer measures the amount of fluorescence from an
individual cell. Therefore, propidium iodide (which intercalates with DNA) stained cells,
the amount of DNA fluorescence is measured and this can be used to determine the
position of a cell in the cell cycle.
Flow cytometric analysis was used to determine the cell cycle distribution in DLKP-SQ
pulse treated adriamycin, vincristine or 5-fluorouracil for 2 hours and to a test compound
(A-l, N-l or U-l) for 24 hours. Samples pulsed with a chemotherapeutic drug, followed
by exposure to a test compound using conditions described in Section 2.8 were analysed to
determine any effect on the cell cycle.
The effect of the test compounds N -l, U-l and A -l, on the cell cycle distribution of
DLKP-SQ is given in Figures 3.8.1 - 3.8.3. At 0 hours, test compound was added.
140/xM U-l treated cells showed an accumulation in the Gi peak at 10 and 13 hours with
corresponding decrease in the G2/M peak, by 16 hours the cell cycle distribution
resembled the normal cell cycle distribution of the control untreated sample at 0 hours
(Figure 3.8.1). This accumulation in the Gt peak suggests a delay or an arrest in Gi
transition into the S phase. DLKP-SQ exposed to 30/xM N-l also seemed to show an
accumulation in the GL peak at 12 and 14 hours but by 16 hours resembled a normal cell
cycle distribution (Figure 3.8.2). A-l exposure did not appear to affect the cell cycle
distribution (Figure 3.8.3).
U -l in combination with 1/xM adriamycin displayed an increased accumulation in G^
early S phase at 4 and 8 hours (Figure 3.8.4 (a)). By 12 and 15 hours there was a delayed
154

S peak evident compared to adriamycin alone (Figure 3.8.4 (b)), by 24 hours, U-l treated
samples were accumulated in the late S and G2/M phase. N-l in combination with ljuM
adriamycin exhibited a delayed S phase peak at 12, 14 and 16 hours (Figure 3.8.5 (a))
compared to adriamycin alone (Figure 3.8.5 (b)). By 19 hours, N-l treated samples were
accumulated in the late S and G2/M phase compared to the G2/M peak in adriamycin
alone. There seemed to be no difference in cell cycle distribution patterns of A-l plus
adriamycin and adriamycin alone (Figure 3.8.6 (a) and 3.8.6 (b)) with no evident
increased delay in the S phase.
The cell cycle distribution profiles of DLKP-SQ treated with 50ng/ml vincristine in
combination with U-l are given in Figure 3.8.7 (a). From 10 to 24 hours there was a
gradual decrease in the Gt peak an increase in the G2/M peak. In the vincristine alone
treated sample there was an increase in the Gt peak after G2/M arrest at 18 hours with
a large Gx peak at 24 hours (Figure 3.8.7 (b)). Vincristine and N -l in combination
(Figure 3.8.8 (a)), displayed a similar profile to vincristine plus U -l. By 12 hours
there was no Gt peak and an accumulation of cells in the G2/M peak, there was no Gi
peak by 24 hours compared to vincristine alone which showed an increase in G! by 16
hours (Figure 3.8.8 (b)). Vincristine plus A-l (Figure 3.8.9) displayed little
difference between vincristine alone (Figure 3.8.7 (b)).
DLKP-SQ treated with 190/xM 5-fluorouracil alone or in combination with 140/xM U-l
displayed no difference between the cell cycle distribution over time (Figure 3.8.10 and
Figure 3.8.11).
Because of the increased Gj/S phase arrest and an increased S phase transition in DLKP-
SQ treated with adriamycin plus N-l or U -l, increasing concentrations of adriamycin
alone were analysed. DLKP-SQ treated with 0.5/xM adriamycin for 2 hours showed a
decrease in the Gi peak and an accumulation in the S phase at 12 hours (Figure 3.8.12), at
14 hours the Gj peak further decreased and there was a peak at the late S phase. By 19
and 24 hours there was an accumulation in G2/M. 1/*M adriamycin treated samples
showed a decrease in the Gj peak and a peak in the early S phase at 12 hours (Figure
155

3.8.13). From 14 to 19 hours the S phase peak progresses through the S phase until at
24 hours the cells accumulate at G2/M. 2/xM adriamycin treated samples displayed a
decrease in the Gt peak and an accumulation in a peak at the early S phase by 12
hours (Figure 3.8.14). Over time the G! peak further decreased and the S phase peak
further progressed through the S phase. By 24 hours this peak had reached the late S
phase.
Increasing concentrations of vincristine were analysed to investigate if increasing
concentrations increased G2/M arrest as found when 50ng/ml plus U-l or N-l were
used in combination. 25ng/ml vincristine for 2 hours caused a decrease in the Gt peak
and an accumulation in G2/M by 12 hours (Figure 3.8.15). The Gi peak gradually
increased and the G2 peak decreased at 14 ,16 and 19 hours. There seemed to be a
normal cell cycle distribution by 24 hours. DLKP-SQ exposed to 50ng/ml (60nM)
vincristine decreased the Gi peak at 12 and 14 hours and cells accumulated in the
G2/M phase (Figure 3.8.16). The Gt peak began to increase and the G2/M peak
decrease at 19 and 24 hours. lOOng/ml vincristine treated cells were delayed longer in
the G2/M phase with cells accumulated in G2/M from 12 hours until 19 hours, and
there was a slight increase in the Gi peak at 24 hours (Figure 3.8.17).
These results showed that using an active test compound (U-l or N-l) after
adriamycin treatment caused an increased Gj/S phase arrest and a delayed S phase
transition compared to adriamycin alone. Increasing concentrations of adriamycin also
exhibited this effect. Vincristine in combination with U-l or N -l showed an increased
G2/M arrest compared to vincristine alone. This G2/M arrest was further delayed when
increasing concentrations of vincristine was used. DLKP-SQ treated with 190/xM 5-
fluorouracil alone or in combination with 140/iM U-l displayed no difference between the
cell cycle distribution over time.
156

U 3 :2 0 /5 /0 4 4 \F L 2 - A \F L l - A r e a
V 3 :2 0 /5 /0 3 9 \F L 2 - A s F L l- A r e a
V3: 2 0 /5 /0 4 0 \F L £ - A \F L 1- A r e a
T = 13 h r s
0 2 0 0 4 0 0 6 0 0 3 0 0 1000
V3:£ 0 /3 /0 4 1 \F L 2 - A \F L 1 - A r e a
U 3 :2 0 /5 /0 4 2 '-F L 2 -A v F L 1 - A r e a
0 3 : 2 0 /5 /0 4 3 N F L 2 -A N F L 1- A r e a
Figure 3.8.1: Cell cycle distribution of DLKP-SQ treated with 140/iM U-l for 24 hours. The graphs
represent the DNA fluorescence as measured by flow cytometry of 10, 000 individual cells taken at different
time points. The x-axis represents relative DNA fluorescence and the y-axis represents cell number. The left-
hand peak is the G: peak and represents diploid cells. The peak on the right-hand is the G2/M peak and
represents tetraploid cells before cytokinesis of mitosis. Cells between the two peaks are in the S phase, i.e.
cells which are replicating their DNA and thus have an increasing amount of DNA fluoresence.
157

U3:8/12/029'*FL2-A\FLl-Area U3:8/12/026SFL2-ANFL1-Area
Si<uU3: 9 / 1 2 /0 2 4 ''.F L 2 -A v F L 1- A r e a
T = 12 h r s
V3: 8 / 1 2 /0 2 7 \F L £ -A \F L 1- A re a
U3 l 8 / 1 2/023N FL 2-A X FL 1-A re a
600 309 1000
Figure 3.8.2: Cell cycle distribution of DLKP-SQ treated witli 30/tM N-l for 24 hours. The graphs
represent the DNA fluorescence as measured by flow cytometry of 10, 000 individual cells taken at different
time points. The x-axis represents relative DNA fluorescence and the y-axis represents cell number. The left-
hand peak is the Gt peak and represents diploid cells. The peak on the right-hand is the G2/M peak and
represents tetraploid cells before cytokinesis of mitosis. Cells between the two peaks are in the S phase, i.e.
cells which are replicating their DNA and thus have an increasing amount of DNA fluoresence.
158

V3: l/l£/003sFL£-A'-FLl-A re a
A-lT = 0 h r s
U3: l / l £ / 0 4 8 ’'- .F L £ -A \F L l-A rea
0 S08 4 0 0 600 8 00 1000
U3i 1 / '1 2 /0 4 5 \F L 2 -A \F L 1 -A re a
U 3 i1 /1 2 /0 4 6 \F L 2 -A \F L 1 -A re a U 3 :1✓12/050V FL 2-A V FL 1- A r e a
Figure 3.8.3: Cell cycle distribution of DLKP-SQ treated with 200/tM A-l for 24 hours. The graphs
represent the DNA fluorescence as measured by flow cytometry of 10, 000 individual cells taken at different
time points. The x-axis represents relative DNA fluorescence and the y-axis represents cell number. The left-
hand peak is the G! peak and represents diploid cells. The peak on the right-hand is the G2/M peak and
represents tetraploid cells before cytokinesis of mitosis. Cells between the two peaks are in the S phase, i.e.
cells which are replicating tfieir DNA and thus have an increasing amount of DNA fluoresence.
159

M5; SEAMti-seie+sFLS-ftNFLS-Arei
0. 2 0 0 4 0 0 600 8 0 0 1000
U3 i SEAMUSG1 e% FL £-f^FL S-A r-ea
wT = 4 h r s
I860U3iSE.HRJSS16\FL£-A>FL£-Hrea
S ioj«3.1 £EAt,tLt5022'vFL2-H ''FL2-H r-ea
T = 12 h rs .
8013 1000^ 3 i SEftK U S033\FL£-ft'-.FL£-A rea
T = £4 h r s
1000 S 0 3 1000
Figure 3.8.4 (a): Cell cycle distribution of DLKP-SQ treated 1/xM adriamycin for 2 hours plus 140^M U-l
for 24 hours. The graphs represent the DNA fluorescence as measured by flow cytometry of 10, 000
individual cells taken at different time points. The x-axis represents relative DNA fluorescence and the y-axis
represents cell number. The left-hand peak is the Gt peak and represents diploid cells. The peak on the right-
hand is the G2/M peak and represents tetraploid cells before cytokinesis of mitosis. Cells between the two
peaks are in the S phase, i.e. cells which are replicating their DNA and thus have an increasing amount of
DNA fluoresence.
T = 15 h rs .
160

■SI'S(VI
U 3 : S E « 1 U S 0 0 4 \ F L 2 - A \ F L 2 - A r e a
luM A d r ia m y c in
T = 0 h r s
U3: SEANUSBS 1 NFL2-flNFL2-Area
,a Vin m tm0 200 4 0 0 6 0 0 3 0 0
— U1000
Y 3:SEA M U S008vFL£-A sFL£-A rea U3: SEA M US027'FLH-AvFL2-Area
S-iOJ
T = 4 h r s T = 15 h r s
<s-
..................y , .............................
2 0 0 4 0 0 6 0 0 3 0 0 1000
V3! SEAMUS015 \F L 2 -A N F L 2 -A rea
2 0 0 4 0 0 6 0 0 300 1000
U3: SEAMUS032V.FU 2-A N FL2-A rea
Figure 3.8.4 (b): Cell cycle distribution of DLKP-SQ treated with l^M adriamycin for 2 hours. The graphs
represent the DNA fluorescence as measured by flow cytometry of 10, 000 individual cells taken at different
time points. The x-axis represents relative DNA fluorescence and the y-axis represents cell number. The left-
hand peak is the Gt peak and represents diploid cells. The peak on the right-hand is the G2/M peak and
represents tetraploid cells before cytokinesis of mitosis. Cells between the two peaks are in the S phase, i.e.
cells which are replicating their DNA and thus have an increasing amount of DNA fluoresence.
161

U3:8/12/013\FL2-A\FL1-Area 'J3:8/12/021 vFL£-AnFL 1 -Area
luf1 A dr + N - l
T = 0 h r s
2 0 0 4 0 0 6 0 0 3 0 0 1000
U3: 8 / 1 2 / 0 1 9 nFL2-A \F I_1—A re a
T = 12 h r s
T = 16 h r s
OTcu
2 0 0 4 0 0 6 0 0 300 1000
0 3 : 8 / 1 2 /0 2 2 \F L 2 -A s F L 1-A re a
T = 18 h r s
* 'I*’*2 0 0 4 0 0 6 0 0 300 1000
U3: 8 / 1 2 /0 2 3 \F L 2 - A \F L 1-A re a
1000
Figure 3.8.5 (a): Cell cycle distribution of DLKP-SQ treated 1/iM adriamycin for 2 hours plus 30/iM N-l
for 24 hours. The graphs represent the DNA fluorescence as measured by flow cytometry of 10, 000
individual cells taken at different time points. The x-axis represents relative DNA fluorescence and die y-axis
represents cell number. The left-hand peak is the G, peak and represents diploid cells. The peak on the right-
hand is the G2/M peak and represents tetraploid cells before cytokinesis of mitosis, fluoresence. Cells between
the two peaks are in the S phase, i.e. cells which are replicating their DNA and thus have an increasing
amount of DNA fluoresence.
162

(J3:8/12/013\FL2-AnFL1-Area V3:8/12/016NFL2-ANFL1-Area
§1oj
cu
<J3: 0 / 1 2 / 0 1 4 v F L 2-A \F L 1 - A r * a
T = 12 h r s
200 4 0 0 6 0 0 8 0 0 1000
U3: 8 / 1 2 / 0 1 5NFL2-A vFL1- A r e a
T = 14 hrs
2 0 0 4 0 0 ¿ 0 0 8 0 0 1000
U3s e /1 2 /0 1 7 v F L 2 -A ^ F L l-A re a
£ 0 0 4 0 0 6 0 0 800 1000
U3: 8 / 1 2 / 0 1 3\FL 2-A N FL 1-A re a
Figure 3.8.5 (b): Cell cycle distribution of DLKP-SQ treated with 1/*M adriamycin for 2 hours. The graphs
represent the DNA fluorescence as measured by flow cytometry of 10, 000 individual cells taken at different
time points. The x-axis represents relative DNA fluorescence and the y-axis represents cell number. The left-
hand peak is the Gt peak and represents diploid cells. The peak on the right-hand is the G2/M peak and
represents tetraploid cells before cytokinesis of mitosis. Cells between the two peaks are in the S phase, i.e.
cells which are replicating their DNA and thus have an increasing amount of DNA fluoresence.
163

ai
©w
luM A dr + A -l
U3:31JUL002\FL2-A\FL2-Area
U 3 :3 1 JU L 0 1 9 \F L 2 -A \F L 2 -A re a
T = 12 h r s
2 0 0 4 0 0 600 300 1000
U3s 3 1 JU L 0 2 8 \F L 2 -A \F L 2 -A re a
T = 15 hrs
S)-'ruV3:31JUL036\FL2-ASFL2-Area
T = 18 h r s
U3 :3 1 JU L 048vF L 2-A -.F L 2-A rea
1000
Figure 3.8.6 (a): Cell cycle distribution of DLKP-SQ treated 1/tM adriamycin for 2 hours plus 200/iM A-l
for 24 hours. The graphs represent the DNA fluorescence as measured by flow cytometry of 10, 000
individual cells taken at different time points. The x-axis represents relative DNA fluorescence and the y-axis
represents cell number. The left-hand peak is the Gj peak and represents diploid cells. The peak on the right-
hand is the G2/M peak and represents tetraploid cells before cytokinesis of mitosis. Cells between the two
peaks are in the S phase, i.e. cells which are replicating their DNA and thus have an increasing amount of
DNA fluoresence.
164

U3:31 JUL002'*FL2-A\FL2-fnrea U3:31JUL032\FL2-A\FL2-Area
T = 18 h r s
-1- T2 0 0 400 ¿0 0 800 1000
U 3 :3 1 JU L040N FL2-A vFL2-A rea
T = 24 h r s
2 0 0 4 8 0 6 0 0 8 0 0 1000
U 3 :3 1 JU L 0 2 3 \F L 2 -A \F L 2 -A re a
T = 15 hrs
400 600 800 1000
4 0 0 600 3 0 0 1000
Figure 3.8.6 (b): Cell cycle distribution of DLKP-SQ treated with 1/xM adriamycin for 2 hours. The graphs
represent the DNA fluorescence as measured by flow cytometry of 10, 000 individual cells taken at different
time points. The x-axis represents relative DNA fluorescence and the y-axis represents cell number. The left-
hand peak is the Gi peak and represents diploid cells. The peak on the right-hand is the G2/M peak and
represents tetraploid cells before cytokinesis of mitosis. Cells between the two peaks are in the S phase, i.e.
cells which are replicating their DNA and thus have an increasing amount of DNA fluoresence.
165

SiV3:l/l£'00£sFL£-frsFLl-Area
U c r + U -l
U3:1/12/013NFL£-A\FL1-Areao _10
T = 16 h r s
U3( 1 /1 £ /0 1 0 \F L 2 - A \F L 1 - A r e a
T = 10 h r s
U 3 : l /1 2 / 0 t 4 \F L £ - A \F L l - A r e a
U 3 :1 /1 2 /0 1 5 \F L 2 - A \F L 1 - A r e a
3 0 0 1000
V 3 :1 / 1 2 /8 1 6 ''F L £ -A \F L 1 - A r e a
M 3:1 / 1 E / 0 1 1nFL2 -A ^ F L 1- A r e a
T = 1£ h r s
V3: l / l £ /0 1 2 's F L 2 - A \F L l - A r e a
F igure3.8.7 (a): Cell cycle distribution of DLKP-SQ treated with 50ng/ml vincristine for 2 hours plus
140/iM U -l for 24 hours. The graphs represent the DNA fluorescence as measured by flow cytometry of 10,
000 individual cells taken at different time points. The x-axis represents relative DNA fluorescence and the y-
axis represents cell number. The left-hand peak is die Gj peak and represents diploid cells. The peak on the
right-hand is the G2/M peak and represents tetraploid cells before cytokinesis of mitosis. Cells between the
two peaks are in the S phase, i.e. cells which are replicating their DNA and thus have an increasing amount of
DNA fluoresence.
24 h r s
166

U3i I s t £-',S 8 £ > F L E -A 'F L i-H t" e-a
At3ni‘t tier T = 0 hrs
0 £ 0 0 4 0 0 6 0 0 S 0 0 10 0 0
No T i t l e
rU3.1 i/i2/004i'FL2-AvFti-Area
T = IE hrs
0 £ 0 0 4 0 0 6 0 0 3 9 0 10 0 0
t>3i_ 1/' !_£>' 805 \ F t__£- h\ FL1
IJ! [s'iE''&36‘1'FL.cL— K\FL.t”Hrta
16 h r :
I ‘ I I • M I I I "|0 203 403 633 833 1383USf Isi^sQQt \FL.2— hvFLl—Ar^s
283 433 633 333 1333
Figure 3.8.7 (b): Cell cycle distribution of DLKP-SQ treated with 50ng/ml vincristine for 2 hours. The
graphs represent the DNA fluorescence as measured by flow cytometry of 10, 000 individual cells taken at
different time points. The x-axis represents relative DNA fluorescence and the y-axis represents cell number.
The left-hand peak is the Gi peak and represents diploid cells. The peak on the right-hand is the G2/M peak
and represents tetraploid cells before cytokinesis of mitosis. Cells between the two peaks are in the S phase,
i.e. cells which are replicating dieir DNA and thus have an increasing amount of DNA fluoresence.
1 67

U3:8/12/002\FL2-A\FL1-Area U3:8/1£/010\FL£-ANFL1-Area
U 3 :0 / 1 2 /0 0 8 \F L 2 -A \F L 1 -A re a V3s 8 / 1 2 / 0 1 lx F L 2 -A \F L l-A re a
V3: 8 / 1 2 /0 0 9 \F L 2 -A \F L 1 - A re a U 3 :8 /1 2 /0 1 2 \F L 2 -A \F L 1 - A re a
Figure 3.8.8 (a): Cell cycle distribution of DLKP-SQ treated with 50ng/ml vincristine for 2 hours plus
30/tM N-l for 24 hours. The graphs represent the DNA fluorescence as measured by flow cytometry of 10,
000 individual cells taken at different time points. The x-axis represents relative DNA fluorescence and the y-
axis represents cell number. The left-hand peak is the Gi peak and represents diploid cells. The peak on the
right-hand is die G2/M peak and represents tetraploid cells before cytokinesis of mitosis. Cells between the
two peaks are in the S phase, i.e. cells which are replicating their DNA and thus have an increasing amount of
DNA fluoresence.
168

U3:8/1£/00£\FL2-A vFL1-Area U3:8/12/005\FL£-A\FL1-Area
V3: 8 / 1 2 /0 0 3 S F L 2 -A \F L 1 -A rea
<uU3: 8 / 1 £ /0 0 4 v-FL£-A'~FL 1 - A r e a
T = 14 h r s
I It,« 11 »1 lUlit£ 0 0 400
2 0 0 4 0 0 6 0 0 300 1000
U 3 :8 / 1 £ /0 0 7 \F L £ - A \F L 1- A r e a
6 0 0 300 1000
Figure 3.8.8 (b): Cell cycle distribution of DLKP-SQ treated with 50ng/ml vincristine for 2 hours. The
graphs represent the DNA fluorescence as measured by flow cytometry of 10, 000 individual cells taken at
different time points. The x-axis represents relative DNA fluorescence and the y-axis represents cell number.
The left-hand peak is the Gi peak and represents diploid cells. The peak on the right-hand is the G2/M peak
and represents tetraploid cells before cytokinesis of mitosis. Cells between the two peaks are in the S phase,
i.e. cells which are replicating their DNA and thus have an increasing amount of DNA fluoresence.
169

V3: l/12/00£'-FL2-A'-FLl-Area
T = 10 h r s
0 2 0 0 4 0 0 6 0 0 8 0 0 1000
Y 3 :1 /1 2 /0 2 5 N F L 2 -A \F L 1 -A re a
T = 12 h r s
-r -r
s-200 4 0 0 6 0 0 3 0 0 1000
U 3 i1 /1 2 /0 2 6 \F L 2 - A \F L 1 - A r e a
T = 14 h r s
6 0 0 8 0 0 1000
U3:1/12/027\FL2-A\FL1-Area
T = 16 h r s
.0 2 0 0 4 0 0 6 0 0 8 0 0 1000
V 3 : l /1 2 /0 2 8 \F L 2 - A v F L l - A r e a
U3i 1 / 1 2 /0 3 0 nFL2 -A v'FL 1 - A r e a
Figure 3.8.9: Cell cycle distribution of DLKP-SQ treated with 50ng/ml vincristine for 2 hours plus
200/xM A-l for 24 hours. The graphs represent the DNA fluorescence as measured by flow cytometry of 10,
000 individual cells taken at different time points. The x-axis represents relative DNA fluorescence and the y-
axis represents cell number. The left-hand peak is the Gt peak and represents diploid cells. The peak on the
right-hand is the G2/M peak and represents tetraploid cells before cytokinesis of mitosis. Cells between the
two peaks are in the S phase, i.e. cells which are replicating their DNA and thus have an increasing amount of
DNA fluoresence.
170

U 3 :2 0 / '5 /0 0 2 \F L 2 - A \F L l- A r e a
5 - F l u o r o u r c i l
T = 0 h r s
QD<MV3 s2 0 /5 /0 0 3 N F L 2 -A N F L 1- A r e a
T = 1 0 h r s
,L A . [M0 2 0 0 4 0 0 6 0 0 300
U 3: 2 0 /5 /0 0 4 \F L 2 - A \F L 1- A r e a
1000
U3:20/-5/005-vFL2-A\FL 1 -Area
16 h r s
iMPW*
2 0 0 4 0 0 6 0 0 300 1000
U 3 :2 0 /5 /0 0 7 v F L 2 -A \F L l-A re a
T = 2 4 h r s
§1tu
Figure 3.8.10: Cell cycle distribution of DLKP-SQ treated with 190/xM 5-fluorouracil for 2 hours. The
graphs represent the DNA fluorescence as measured by flow cytometry of 10, 000 individual cells taken at
different time points. The x-axis represents relative DNA fluorescence and the y-axis represents cell number.
The left-hand peak is the G! peak and represents diploid cells. The peak on the right-hand is the G2/M peak
and represents tetraploid cells before cytokinesis of mitosis. Cells between the two peaks are in the S phase,
i.e. cells which are replicating their DNA and thus have an increasing amount of DNA fluoresence.
2 0 0 4 0 0 6 0 0 300 1000
U3: 2 0 /5 /0 0 6 \F L 2 - A \F L 1- A re a
T = 19 h r s
1000
171

U3: 20/5/007'sFL2-A\FL 1 -Area
V3: S0/5 /008N F L 2-A N F L 1- A r e a
U3: £ 0 /5 /0 0 9 '* F L 2 -A \F L 1 - A r e a
U3s 20/5/010\FL2-A\FL1-Area
T = 16 h r s
n)iKi«Mi | i ii m ,2 0 0 400 6 0 0 300 1000
(J3: 2 0 / 5 / 0 1 1 SFL2-AVFL1 - A r e a
2 0 0 403
•J3: 2 0 / 5 / 0 1 2N FL2-A \FL 1 - A re a
1000
Figure 3.8.11: Cell cycle distribution of DLKP-SQ treated with 190/iM 5-fluorouracil for 2 hours plus
140/iM U-l for 24 hours. The graphs represent the DNA fluorescence as measured by flow cytometry of 10,
000 individual cells taken at different time points. The x-axis represents relative DNA fluorescence and the y-
axis represents cell number. The left-hand peak is the Gi peak and represents diploid cells. The peak on the
right-hand is the G2/M peak and represents tetraploid cells before cytokinesis of mitosis. Cells between the
two peaks are in the S phase, i.e. cells which are replicating their DNA and thus have an increasing amount of
DNA fluoresence.
172

U3:27/11/0£0\FL2-A\FL1-Area
V 3 :2 7 / 1 1 / 0 1 5^F L £-A nFL1- A r e a
T = 12 h r s
ynni
§1OJ
<s-
2 0 0 4 0 0 6 0 0 3 0 0 1000
M 3 :2 7 /1 1 / 0 16NFL2-ANFL1- A r e a
T = 14 h r s
0 2 0 0 4 0 0 6 0 0 3 0 0 1000Iff
CO
U3:27/11/017\FL2-A\FL1-Area
T = 16 h r s
2 0 0 400 600 300 1000
<J3:2 7 /1 1 / 0 18N FL2-A \FL 1 -A re a
U3s 2 7 / 1 1 /019N FL 2-A N FL 1-A rea
Figure 3.8.12: Cell cycle distribution of DLKP-SQ treated with 0.5/xM adriamycin for 2 hours. The
graphs represent the DNA fluorescence as measured by flow cytometry of 10, 000 individual cells taken at
different time points. The x-axis represents relative DNA fluorescence and the y-axis represents cell number.
The left-hand peak is the Gi peak and represents diploid cells. The peak on the right-hand is the G2/M peak
and represents tetraploid cells before cytokinesis of mitosis. Cells between the two peaks are in the S phase,
i.e. cells which are replicating their DNA and thus have an increasing amount of DNA fluoresence.
173

03:27/11/002NFL2-A\FL2-Area 03:£7/11/005\FL£-A\FL1-Area
........ ..
0 3 : £ 7 /1 1 / 0 0 3 S.FL£-A^FL 1 - A r e a
12 h r s
0 3 : £ 7 /1 1 /006'vFL£-A '-.FL 1 -A re a
T = 19 h r s
O-iow
£ 0 0 4 0 0 6 0 0 3 0 0 1000
0 3 : £ 7 / 1 1 /0 0 4 s F L £ -A \F L 1- A r e a
T = 14 h r s
£ 0 0 4 0 0 6 0 0 3 0 0 1000
0 3 : £ 7 /1 1 /007N FL 2-A N FL 1-A re a
2 0 0 4 0 0 6 0 0 3 0 0 1000
Figure 3.8.13: Cell cycle distribution of DLKP-SQ treated with 1/tM adriamycin for 2 hours. The graphs
represent the DNA fluorescence as measured by flow cytometry of 10, 000 individual cells taken at different
time points. The x-axis represents relative DNA fluorescence and the y-axis represents cell number. The left-
hand peak is the peak and represents diploid cells. The peak on the right-hand is die G2/M peak and
represents tetraploid cells before cytokinesis of mitosis. Cells between the two peaks are in the S phase, i.e.
cells which are replicating their DNA and thus have an increasing amount of DNA fluoresence.
174
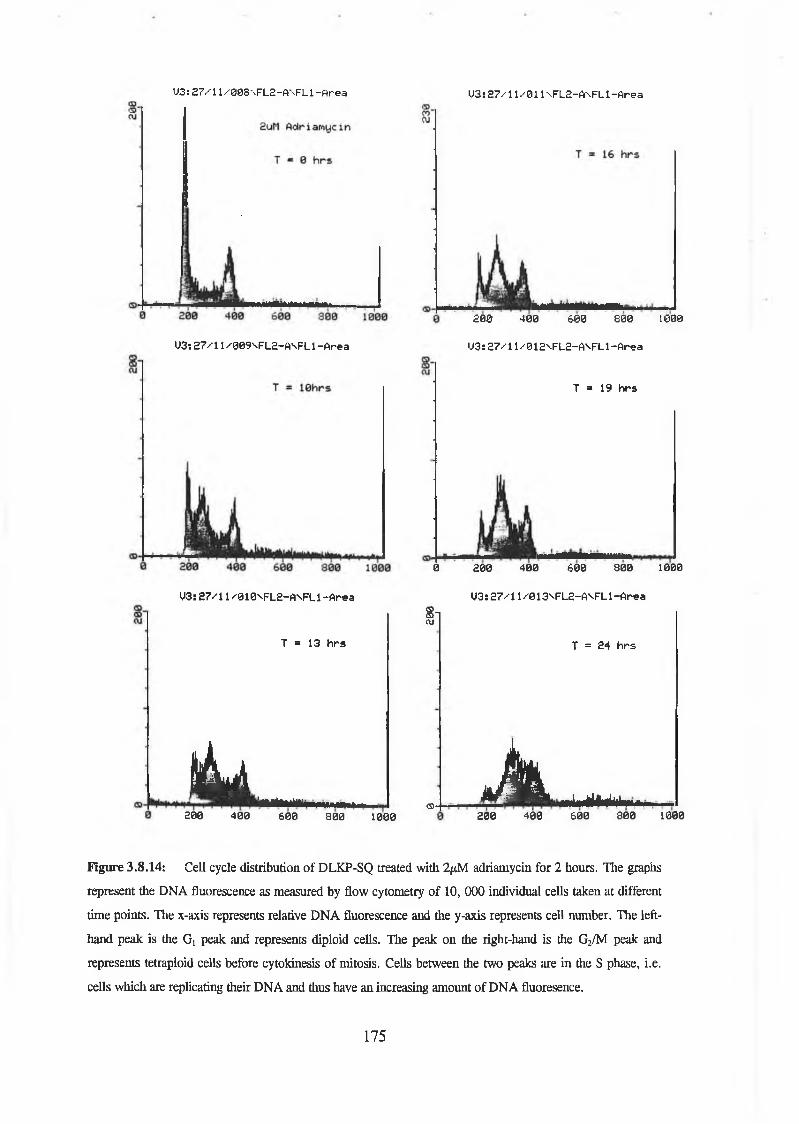
U3:27/11/008\FL2-A\FL1-Area U3:27/11/011\FL2-A\FL1-Area
0 3 : 2 7 /1 1 /0 0 9 \F L 2 - A \F L 1- A r e a
03: 2 7 / 1 1 / 8 10NFL2-A SFL1 - A re a
2 0 0 4 0 0 6 0 0 8 0 0 1600
03: 2 7 / 1 1 / 0 1 2VFL2-A SFL1- A r e a
T = 19 h r s
0 2 0 0 4 0 0 ¿ 0 0 3 0 0 1000
0 3 s 2 7 /1 1 / 0 13V FL2-A \FL 1 - A r e a
8-1CUT = 13 h rs T = 24 h rs
ik jj.................<5>- A ..................
200 400 6 0 0 800 1000 200 400 600 8 0 0 1000
Figure 3.8.14: Cell cycle distribution of DLKP-SQ treated with 2/xM adriamycin for 2 hours. The graphs
represent the DNA fluorescence as measured by flow cytometry of 10, 000 individual cells taken at different
time points. The x-axis represents relative DNA fluorescence and the y-axis represents cell number. The left-
hand peak is die Gi peak and represents diploid cells. The peak on the right-hand is the G2/M peak and
represents tetraploid cells before cytokinesis of mitosis. Cells between the two peaks are in die S phase, i.e.
cells which are replicating their DNA and thus have an increasing amount of DNA fluoresence.
175

Q-
U 3 s £ 7 / l l /0 1 4 \F L 2 - A \F L l - A r e a
| 2 5 n g /m l O i n c r i s t i n e
T = 0 h r s
03:27/11/023\FL2-A\FL1-Area
1 I I 1 M I M M |200 4 0 0 6 0 0 3 0 0 1000
0 3 : £ 7 /1 1 / 0 2 1 VF L 2 -A \F L 1- A r e a
2 0 0 4 0 0 ¿ 0 0 8 0 0 1000
0 3 : 2 7 /1 1 /0 2 £ \F L £ -A s F L 1 - A re a
0 3 : 2 7 /1 1 /0 2 4 \F L 2 -A V F L 1-A re a
0 3 : £ 7 /1 1 /0 £ 5 V>FL£-A''FL 1 -A re a
Figure 3.8.15: Cell cycle distribution of DLKP-SQ treated with. 25ng/ml vincristine for 2 hours. The
graphs represent the DNA fluorescence as measured by flow cytometry of 10, 000 individual cells taken at
different time points. The x-axis represents relative DNA fluorescence and the y-axis represents cell number.
The left-hand peak is the Gi peak and represents diploid cells. The peak on the right-hand is the G2/M peak
and represents tetraploid cells before cytokinesis of mitosis. Cells between the two peaks are in the S phase,
i.e. cells which are replicating their DNA and thus have an increasing amount of DNA fluoresence.
176

*5)Ol5 0 n g /m l U i n c r i s t i n e
T = 8 h r s
U3:£7/11/026\FL2-AnFL1-Area U3: £7/11/0£9NFL2-A\FL1 -Area
3 0 0 1000
(J3: £ 7 /1 1 /0 2 7 '-F L 2 -A \F L 1 - A r e a
T = 12 h r s
200 4 0 0 6 0 0 8 0 0 1000
U3! £ 7 / 1 1 /0 2 8 \F L 2 - A \F L 1- A r e a
U3: £ 7 /1 1 / 0 3 0 S'FL2-A ^FL 1 - A r e a
U3 s 2 7 / 1 1 /0 3 1 \F L £ -A \F L 1- A r e a
Figure 3.8.16: Cell cycle distribution of DLKP-SQ treated with 50ng/ml vincristine for 2 hours. The
graphs represent the DNA fluorescence as measured by flow cytometry of 10, 000 individual cells taken at
different time points. The x-axis represents relative DNA fluorescence and the y-axis represents cell number.
The left-hand peak is the Gx peak and represents diploid cells. The peak on the right-hand is the G2/M peak
and represents tetraploid cells before cytokinesis of mitosis. Cells between the two peaks are in the S phase,
i.e. cells which are replicating their DNA and thus have an increasing amount of DNA fluoresence.
177
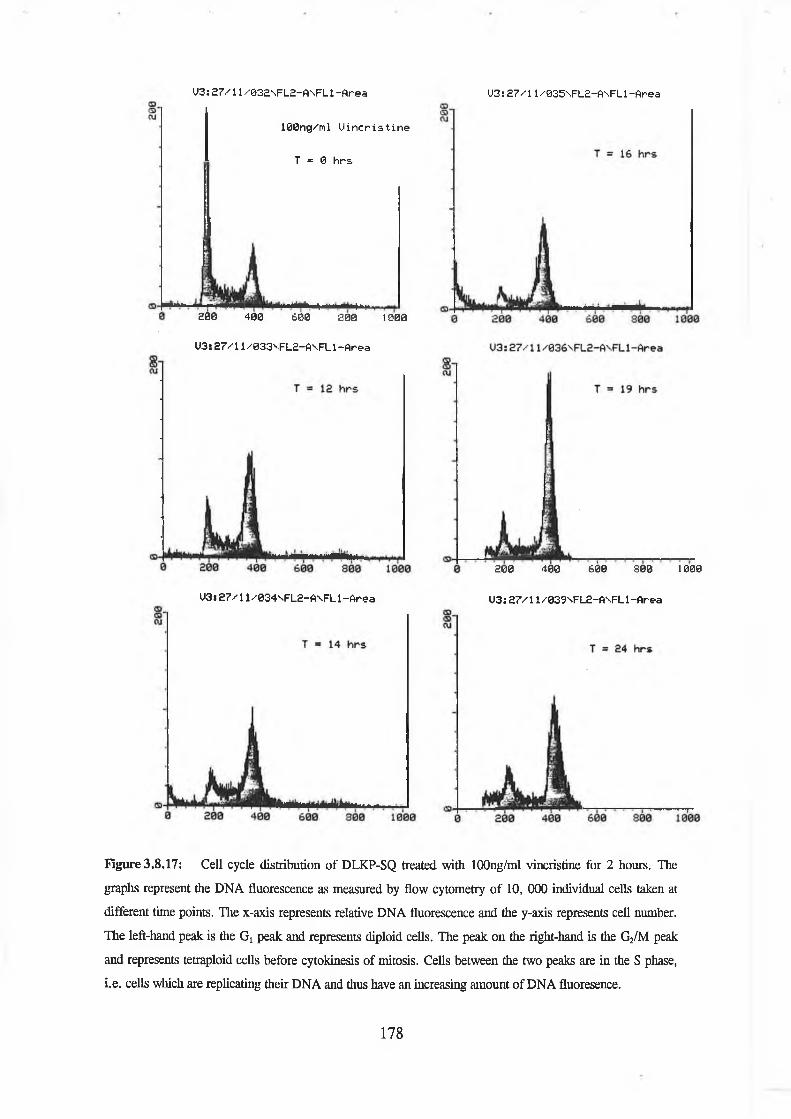
1 0 0 n g /m l U i n c r i s t i n e
T = 0 h r s
03:27/11/032NFL2-A\FL1-Area 03:27/11/035NFL2-ANFL1-Area
-i l i2 8 0 4 0 0 6 0 0 3 0 0 1000
0 3 : 2 7 /1 1 /033V FL 2-A V FL 1- A r e a
0 3 s 2 7 /1 1 /0 3 4 s F L £ -A \F L 1- A r e a
2 0 0 400 600 3 0 0 1000
0 3 : 2 7 / 1 1/039N FL 2-A N FL 1-A rea
Figure 3.8.17: Cell cycle distribution of DLKP-SQ treated with lOOng/ml vincristine for 2 hours. The
graphs represent the DNA fluorescence as measured by flow cytometry of 10, 000 individual cells taken at
different time points. The x-axis represents relative DNA fluorescence and the y-axis represents cell number.
The left-hand peak is the Gi peak and represents diploid cells. The peak on the right-hand is the G2/M peak
and represents tetraploid cells before cytokinesis of mitosis. Cells between the two peaks are in the S phase,
i.e. cells which are replicating their DNA and thus have an increasing amount of DNA fluoresence.
178

3.9 Time-Lapse Videomicroscopy
The results from Section 3.6 demonstrated that the test compounds, N -l, 0-1 and U-l
exert their synergistic cytotoxic effect during the first 24 hours post-treatment with
adriamycin or vincristine but not 5-fluorouracil. Flow cytometric analysis (Section 3.8)
showed that there was a difference in cell cycle distribution during the first 24 hours after
pulse exposure between adriamycin and adriamycin plus U-l or N-l and between
vincristine and vincristine plus U-l or N-l. Therefore, while there was an increased
cytotoxicity in cells were exposed to N-l, 0-1 or U-l after adriamycin or vincristine
exposure, and there was a difference in cell cycle distribution, there was no indication as
to when the cells undergo cell death.
Time-lapse videomicroscopy permits the observation of the events which happen to cells
following drug treatment. With this technique it was possible to follow in real time events
such as cell rounding for mitosis and apoptosis. Mitosis was characterised by the rounding
up of adherent cells followed by cytokinesis and reattachment of daughter cells to the
surface of the flask. Cell death was classified as apoptotic on the basis of morphological
events starting with rounding up of adherent cells, subsequent cell shrinkage and/or break
up into apoptotic bodies.
Using time-lapse videomicroscopy the kinetics of mitosis and apoptosis was followed in
DLKP-SQ treated with U-l alone for 24 hours, 2 hours pulse exposure to increasing
concentrations of adriamycin, adriamycin and U-l in combination, vincristine and
vincristine plus U-l in combination. Experiments were performed in 25cm2 flasks and
recording was started after cells were exposed to chemotherapeutic drug for two hours and
washed twice with PBS (see Section 2.9).
179

Figure 3.9 .1 : DLKP-SQ exposed to 140/iM U -l for 24 hours and compared to the mitotic
events in a drug-free control. Cell death was classified as apoptotic on the basis of morphological
events starting with rounding up of adherent cells, subsequent cell shrinkage and/or break-up into
apoptotic bodies. Cell death and mitosis were scored at the time when rounding up o f the cells first
occurred. Typically 100 cells in the microscope field were followed.
Treatment of DLKP-SQ with 140/xM U-l for 24 hours initially decreased the rate of
mitosis (Figure 3.9.3). After 3 hours the rate increased to a rate similar to the drug free
control. There was a low level of apoptosis during the first 6 hours of exposure.
180

Figure 3.9.2: Adriamycin alone and in combination with U -l. Cell death was classified as
apoptotic on the basis of morphological events starting with rounding up of adherent cells,
subsequent cell shrinkage and/or break-up into apoptotic bodies. Cell death and mitosis were
scored at the time when rounding up of the cells first occurred. Typically 100 cells in the
microscope field were followed.
Time (Hours)
The apoptotic rate in l^M treated adriamycin was low during the first 24 hours, the rate
subsequently increased after 24 until 96 hours (Figure 3.9.2). The rate of apoptosis in
1/xM treated samples exposed to 140/xM U-l for 24 hours followed a similar pattern to
IpM adriamycin alone i.e. the apoptotic rate was low during the first 24 hours and the rate
increased after 24 until 96 hours. No mitotic events was observed in l^M adriamycin or
1/xM adriamycin plus 140/xM U-l treated samples.
181

Figure 3.9.3: Rate of apoptosis and mitosis in vincristine treated and vincristine plus U-l treated
DLKP-SQ. Cell death was classified as apoptotic on the basis of morphological events starting
with rounding up of adherent cells, subsequent cell shrinkage and/or break-up into apoptotic
bodies. Cell death and mitosis were scored at the time when rounding up of the cells first
occurred. Typically 100 cells in the microscope field were followed.
120 r-Vcr + u-1Apoptosis
-Vcr + U-1
24
Time (Hours)
The rate of mitosis in 60nM vincristine treated DLKP-SQ cells was low up to 12 hours
after exposure, the rate increased from 12 to 24 hours and then slowed from 24 to 48
hours (Figure 3.9.3). The rate of apoptosis steadily increased during the first 24 hours
after exposure. After 24 hours there were no apoptotic events. In contrast to 60nM
vincristine treated cells alone, subsequent exposure to 140^M U-l resulted in an abolition
of mitosis, with some mitosis occurring 36 hours after vincristine was removed. The rate
of apoptosis increased dramatically during the first 12 hours of U-l exposure, this rate
decreased from 12 to 36 hours. No apoptosis was observed after 36 hours. U-l alone
induced a low level of apoptosis (Figure 3.9.1).
182
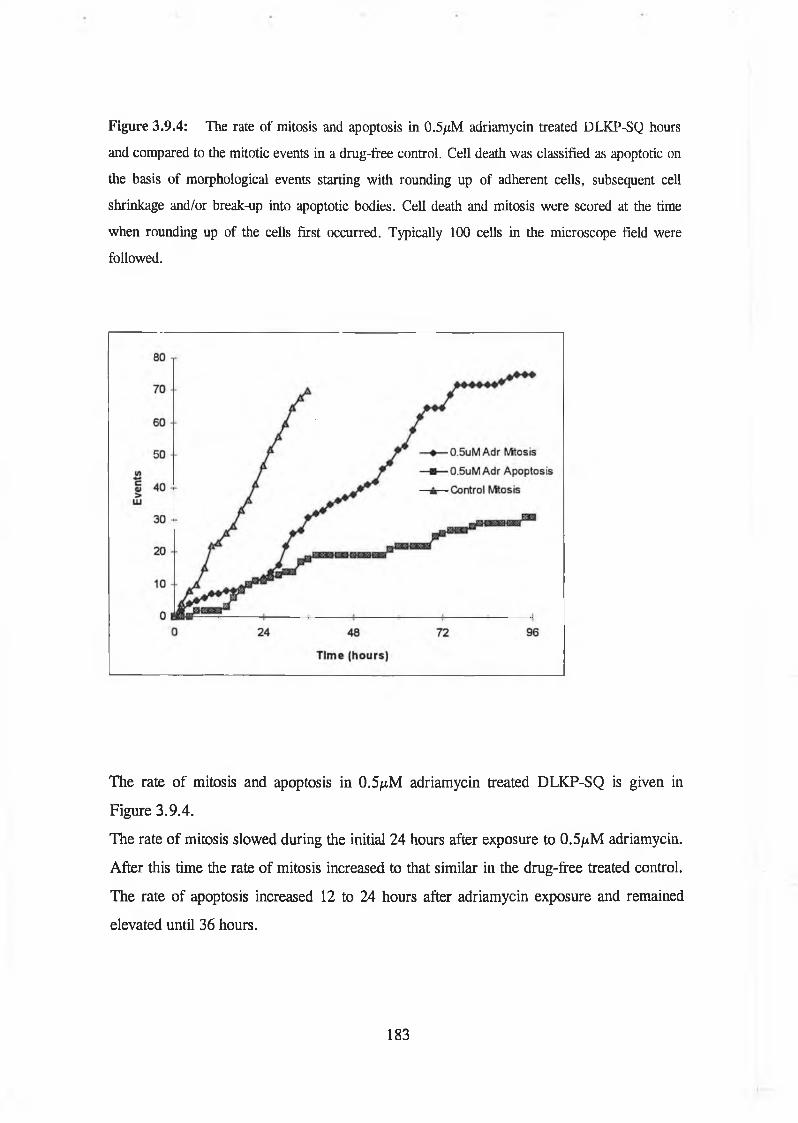
Figure 3.9.4: The rate of mitosis and apoptosis in 0.5/xM adriamycin treated DLKP-SQ hours
and compared to the mitotic events in a drug-free control. Cell death was classified as apoptotic on
the basis of morphological events starting with rounding up of adherent cells, subsequent cell
shrinkage and/or break-up into apoptotic bodies. Cell death and mitosis were scored at the time
when rounding up of the cells first occurred. Typically 100 cells in the microscope field were
followed.
The rate of mitosis and apoptosis in 0.5^M adriamycin treated DLKP-SQ is given in
Figure 3.9.4.
The rate of mitosis slowed during the initial 24 hours after exposure to 0.5piM adriamycin.
After this time the rate of mitosis increased to that similar in the drug-free treated control.
The rate of apoptosis increased 12 to 24 hours after adriamycin exposure and remained
elevated until 36 hours.
183

Figure 3.9.5: Kinetics of cell death in DLKP-SQ treated with increasing concentrations of
adriamycin. Cell death was classified as apoptotic on the basis of morphological events starting
with rounding up of adherent cells, subsequent cell shrinkage and/or break-up into apoptotic
bodies. Cell death and mitosis were scored at the time when rounding up of the cells first
occurred. Typically 100 cells in the microscope field were followed.
Kinetics of cell death in DLKP-SQ treated with increasing concentrations of adriamycin is
given in Figure 3.9.5. In the 0.5/nM adriamycin treated sample, the rate of apoptosis
increased sharply 12 to 24 hours after adriamycin exposure and remained high until 36
hours. The apoptotic rate in lptM treated adriamycin was similar to the rate for 0.5/xM
adriamycin during the first 24 hours. After this time the rate increased dramatically until
60 hours. 2/xM adriamycin treatment resulted in apoptosis from 18 to 48 hours after
exposure, after this time, the rate of apoptosis increased further. No mitotic events were
observed in 1/xM or 2fiM adriamycin treated samples.
184

These results demonstrated that exposure of DLKP-SQ cells to increasing concentrations
of adriamycin induced apoptosis predominantly 24 hours after drug removal. Mitosis was
abolished with increasing concentrations. 140/xM U-l delayed mitosis for 12 hours and
induced a low level of apoptosis during exposure. 1/xM Adriamycin and U-l in
combination displayed no difference in the rate of apoptosis induced compared to
adriamycin alone. This was surprising since the combination of adriamycin and U-l
demonstrated increased cytotoxicity to the cells. A 2 hour exposure to 60nM vincristine
delayed mitosis for 12 hours; the rate increased from 12 to 24 hours and then slowed from
24 to 48 hours. The rate of apoptosis increased during the first 24 hours after exposure.
60nM vincristine treatment and subsequent exposure to 140/nM U-l resulted in an
increased rate of apoptosis during the first 12 hours of U-l exposure, which decreased
from 12 to 36 hours, there were mitotic events until 12 hours after U-l removal.
185

3.10 Cyclin E/CDK2 kinase activity
The adriamycin pulse exposure assays demonstrated that the enhanced cytotoxicity of
adriamycin by N -l, 0-1 and U-l occurred during the first 24 hours after adriamycin
removal (Section 3.7). Flow cytometric analysis (Section 3.8) also showed that by 24
hours the cells were arrested in the G2/M phase. Previous to this arrest however was an
increased delay in G,/S and in the S phase transition.
To understand the effect of adriamycin and adriamycin plus U-l in combination on the
increased Gi/S delay, cyclin E/CDK2 complex kinase activity was studied. The transition
from Gl into S is controlled by die cyclin E/CDK2 complex and this is essential for the
cell to begin DNA replication (see Section 1.3.1). The levels of cyclin E are regulated so
that it is only transcribed during late G, and early S phase. Very little is known about the
substrates of cyclin E but it is thought to activate E2F and thus transcription of S phase
genes. Once cells enter the S phase cyclin E is rapidly degraded. Therefore by
investigating the activity of the cyclin E/CDK2 complex it would be possible to examine
the role that adriamycin plus U-l in combination has on the increased GL arrest and
delayed S phase transition as observed by flow cytometric analysis.
The kinase activity of the cyclin E/CDK2 complex was assayed as described in Section
2.12. Briefly, cells were set up in 25cm flasks 4 days before the experiment, they were
then exposed to adriamycin or drug free media for two hours, washed twice with PBS,
and drug-free media or U-l added as appropriate. Samples were taken at various time
points by trypsinising the cells and resuspending the resultant pellet in RIPA lysis buffer
and stored at -80°C. The protein was quantified and 100/xg of protein was
immunoprecipated with cyclin E (Section 2.10), the immunoprecipitated cyclin E was
resuspended in kinase buffer, and 32P-labelled ATP and histone HI (substrate) was added.
The reaction mixture was left at 30°C for 30 minutes and stopped by adding loading
buffer. Aliquots were run on a 15 % acrylamide gel, the gel was dried and then exposed to
autoradiographic film. Autoradiographs obtained during kinase assays were scanned using
186

a densitometer and all bands were compared to the control (treated with drug-free media
for 2 hours) at 0 hours, which was arbitrarily taken as 1.
The cyclin E/CDK2 kinase activity of U-l treated samples (see Figure 3.10.1)
demonstrated that the activity increased steadily up to 19 hours and then decreased.
Adriamycin treated samples (Figure 3.10.2) show a decrease at 0 hours, i.e. immediately
following drug removal. The level of activity in this sample had increased at 10 hours but
then decreased. Adriamycin plus U-l (Figure 3.10.3) demonstrated an increase at 10
hours which then decreased steadily. A graph of the scanned autoradiographs is given in
Table 3.10.1.
187

Table 3.10.1: Plot of the cyclin E/CDK2 kinase activity in U -l, adriamycin (Adr) and
adriamycin plus U-l treated samples. Autoradiographs were scanned using a densitometer
and all bands were compared to the drug free treated control at 0 hours, which was
arbitrarily taken as 1.
188

Figure 3.10.1: Cyclin E/CDK2 kinase activity in U-l treated samples. Activity was
measured as described in Section 2.11.
Time (hours) Control (0) 10 13 16 19 24
Figure 3.10.2: Cyclin E/CDK2 kinase activity in adriamycin treated samples. Activity was
measured as described in Section 2.11.
Time (hours) 0 10 13 16 19 24
Figure 3.10.3: Cyclin E/CDK2 kinase activity in adriamycin plus U-l treated samples.
Activity was measured as described in Section 2.11.
Time (hours) 0 10 13 16 19 24
189

3.11 Cyclin E/CDK2 protein analysis
Cyclin E/CDK2 kinase activity results (Section 3.10) demonstrated that there was an effect
on the activity in adriamycin alone versus the adriamycin plus U-l treated samples.
Therefore by investigating the levels of cyclin E and CDK2, it would be possible to
examine the compare the proteins to the cyclin E/CDK2 complex kinae activity and
investigate the role of these proteins an increased Gi arrest and delayed S phase transition.
Cyclin E and cyclin dependent kinase 2 (CDK2) protein levels were analysed using
western blotting. Experiments were performed as described in Section 2.10. Briefly, cells
were set up in 25cm flasks 4 days before the experiment, they were then exposed to
adriamycin or drug free media for two hours, washed twice with PBS and drug-free media
or U-l added as appropriate. Samples were taken at various time points by trypsinising the
cells and resuspending the resultant pellet in RIPA lysis buffer and stored at -80°C.
Protein quantification was performed on the samples and lOug of loaded on a 15%
acrylamide gel. The proteins were transferred onto a nitro-cellulose membrane and equal
sample loading was confirmed by staining the membrane. They were then incubated
overnight with anti-cyclin E or anti-CDK2 antibodies. The membranes were then
developed using an enchanced chemiluminesence kit.
The levels of CDK2 in the drug-free control samples seemed to increased steadily from 0
hours to 16 hours, the level decreased at 19 hours and increased again at 24 hours (Figure
3.11.1). CDK2 levels in U-l alone treated samples increased steadily until 13 hours but
then decreased slowly at 16, 19 and 24 hours (Figure 3.11.2). Adriamycin treated
samples showed an increase in levels until 10 hours, the levels decreased at 13 and 16
hours but increased again at 19 and 24 hours (Figure 3.11.3). Adriamycin plus U-l in
combination treated samples were similar to adriamycin alone (Figure 3.11.4). The
samples showed an increase in levels until 13 hours, the levels decreased at 16 hours but
increased again at 19 and 24 hours.
190

At least 3 forms of endogenous cyclin E protein have been detected in rat and human
fibroblasts (Ohtsubo and Roberts, 1993) and HeLa cells (Dulic et al., 1992). A 50kDa
form is maximally expressed during late Gj and early S phase of the cell cycle while a 40
kDa is thought to result from proteolytic degradation of over-expressed cyclin E. The
higher molecular weight form (55kDa) has been observed in G2 and early to mid-Gt.
The levels of cyclin E in drug-free control samples displayed an increase in levels of the
higher molecular weight cyclin E at 10 hours with a large > 67kDa band was gone by 13
hours. A band at >49kDa increased at 10 hours and remained elevated at 13 and 16
hours. A > 37.5kDa band was observed at 0 hours. This band disappeared at 10 hours and
the levels increased at 13 and 16 hours (Figure 3.11.5).
In U-l samples, levels of the higher molecular weight cyclin E increased from 10 -13
hours, decreased by 16 hours and there was an increase in the 37.5kDa band from 16
hours (Figure3.11.6).
In the adriamycin treated samples the level of the higher molecular weight cyclin E
(67kDa) increased at 10 hours, decreased slightly at 13 hours and then disappeared until
24 hours. The lower molecular weight (=37.5kDa) band disappeared at 10 hours but then
reappeared at 13 hours. The level of the band increased at 16 and 19 hours and decreased
at 24 hours (Figure 3.11.7). The =49kDa band increased from 0 hours to 13 hours and
then decreased sharply. The levels increased again at 19 and 24 hours.
Cyclin E levels in adriamycin plus U-l samples were similar to adriamycin alone but at
13 hours the high molecular weight band appears stronger while the <37.5kDa band has
decreased compared to adriamycin (Figure 3.11.8). The level of the higher molecular
weight cyclin E (67kDa) increased at 10 to 13 hours then disappeared until 24 hours. The
lower molecular weight (=37.5kDa) band remained at a low level until 16 and 19 hours
and decreased at 24 hours. The =49kDa band increased from 0 hours to 13 hours and
decreased sharply after 13 hours and increased again at 19 and 24 hours.
191
The above results show that the levels of CDK2 varied over a 24 hour period in untreated
DLKP-SQ cells and cells treated with U-l, adriamycin and the adriamycin/U-1
combination. There seems to be no correlation between CDK2 levels and the cell cycle
distribution. Cyclin E protein levels seem to indicate that an increased amount of the
higher molecular weight form represents cells in Gi/Gj arrest, the form around 49 kDa
seems to represent active cyclin E, while the lower molecular weight form (37.5 kDa)
represents cells in late S and G2/M.
192

Figure 3.11.1: CDK2 protein levels in control, drug-free treated samples. Western
blotting was performed as described in Section 2.10.
Time (hours) Control (0) 10 13 16 19 24
Figure 3.11.2: CDK2 protein levels in 140/xM U-l treated samples. Western blotting was
performed as described in Section 2.10.
Time (hours) Control (0) 10 13 16 19 24
193

Figure 3.11.3: CDK2 protein levels in IfiM adriamycin treated samples. Western blotting
was performed as described in Section 2.10.
Time (hours) Control (0) 0 10 13 16 19 24
Figure 3.11.4: CDK2 protein levels in lpcM adriamycin plus 140^M treated samples.
Western blotting was performed as described in Section 2.10.
Time (hours) Control (0) 0 10 13 16 19 24
194

Figure 3.11.5: Cyclin E protein levels in control, drug-free treated samples.
Western blotting was performed as described in Section 2.10.
Time (hours) Control (0) 10 13 16 19 24
6 7 -
4 9 -
3 7 .5 -
Flgure 3.11.6: Cyclin E protein levels in 140/nM U-l treated samples. Western blotting
was performed as described in Section 2.10.
Time (hours) Control (0) 10 13 16 19 24
6 7 -
4 9 -
3 7 .5 -
195

Figure 3.11.7: Cyclin E protein levels in 1/ M adriamycin treated samples. Western
blotting was performed as described in Section 2.10.
Time (hours) Control (0) 0 10 13 16 19 24
6 7 -
4 9 -
3 7 .5 -
Flgure 3.11.8: Cyclin E protein levels in 1/xM adriamycin plus 140jiM treated samples.
Western blotting was performed as described in Section 2.10.
Time (hours)
6 7 -
4 9 -
37.5-
196

Discussion

The effect of combinations of different drugs on toxicity to cancer cells in vitro was
examined in this thesis. Combinations of existing anticancer agents were first
analysed. Combinations with the glutathione depleting agent, BSO, with and without
verapamil were then studied. Cellular models transfected with the MDR1 gene and an
anti-MDRl ribozyme were also developed. The main part of the thesis concerned
combinations of a known anticancer agent with one of a series of coded non-toxic
compounds known to be safe for human use. These were examined in a number of
cell lines and their mechanism of action further explored.
4.1 Chemotherapeutic drug combination
The use of multiple drugs in combination is a standard treatment for cancer patients (Patel
and Rideout, 1992). Clinical studies have shown that drug combinations generally produce
higher response rates than those produced by single agents alone. Agents active for a
certain tumour type are first identified and the use of these active drugs in combination
then depends on the predicted toxicity of the drug. This is to prevent overlapping of
toxicity e.g. the relatively low toxicity of vincristine for normal marrow means it is often
included in combination chemotherapy with other myelosuppressive agents (Pratt et al.,
1994). However, it is likely that for a given patient, some of the drugs in a combination
are not effective and may be antagonistic to the effective agents.
This series of experiments was performed to investigate the efficacy of combining two
common chemotherapeutic drugs at three different ratios and to investigate if the
combination was synergistic, additive or antagonistic in DLKP and DLKP-A. DLKP is a
human lung carcinoma cell line which is sensitive to chemotherapeutic drugs and DLKP-A
is a MDR derivative of DLKP which overexpresses P-glycoprotein (Redmond, 1991;
Cleary, 1995).
198

Adriamycin and carboplatin used in combination in DLKP (Table 3.1.1) were antagonistic at respective ratios of 1:10 and 1:100. The ratio of adriamycin to carboplatin at 1:40 displayed some additive effects at high concentrations of the combination. Combinations of adriamycin and carboplatin in DLKP-A (Table 3.1.2) were similar to combinations in DLKP. The combination in a 1:40 ratio in DLKP-A was additive although some concentrations did show synergy, while the combination at ratios of 1:10 and 1:100 were antagonistic. Carboplatin is not an P-glycoprotein substrate and this may explain the slight synergistic effect in DLKP-A.
Vincristine and carboplatin was assayed in DLKP-A (Table 3.1.3). The combination at ratios of 1:10 and 1:100 were antagonistic but the combination at the 1:40 ratio did show slight synergy at some concentrations, with an additive effect observed at the higher concentrations. These results are similar to those observed with the combination of adriamycin and carboplatin in DLKP-A. Other researchers have shown that carboplatin and etopside can be effective in breast cancer (Crown et al., 1993).
Adriamycin and vincristine in DLKP (Table 3.1.4) were antagonistic initially but then showed some synergy at higher concentrations. However, at higher concentrations the percentage survival was very low (<20%). At ratios of 1:1, 4:1 and 1:4 in DLKP-A (Table 3.1.5), adriamycin and vincristine were antagonistic at the lower concentrations used but then showed some synergism at higher concentrations. Once again, at the higher concentrations the percentage survival was very low (<20%).
Vincristine and VP-16 were assayed at 1:1, 1:5 and 5:1 combinations in DLKP (Table3.1.6). The combinations were antagonistic initially but were synergistic at higher concentrations of the combinations which had a very low percentage survival (< 10%). Vincristine and VP-16 in combination in DLKP-A (Table 3.1.7) did show synergism in each combination at all concentrations used.
199

The above results demonstrated that a combination of carboplatin and adriamycin or vincristine was additive in DLKP-A but antagonistic in DLKP. The combinations of adriamycin plus vincristine were antagonistic to both cell lines. Vincristine plus VP-16 was antagonistic in DLKP but did show synergism in DLKP-A. This result was unexpected since vincristine and VP-16 are both P-glycoprotein substrates. However, VP- 16 is a topoisomerase II inhibitor and vincristine is an inhibitor of the mitotic spindle (see Section 1.2), therefore, synergy may result from each drug targeting different cellular processes. Further work should be undertaken to confirm the synergy found.
Clinical studies have shown that drug combinations generally produce higher response rates in treated populations than those produced by single agents. Therefore, while the above results show an additive effect between carboplatin and adriamycin or vincristine in DLKP-A, the combination in vivo could have a limited applicability in cancers where chemotherapy efficacy is low e.g. colorectal cancer and non-small cell lung cancer. Therefore other approaches to improve chemotherapy must be undertaken.
4.2 Circumvention
The majority of metastatic cancers are not curable currently by chemotherapy or by any other form of therapy. This is because a population within a tumour displays resistance to a number of chemotherapy drugs, even if they are structurally dissimilar and have different mechanisms of action. This is called Multidrug Resistance (MDR). MDR may be intrinsic or induced in the tumour population and a variety of mechanisms have been described to account for this phenomenon (see Section 1.9 and 1.10). Currently the best characterised mechanism of MDR is the resistance mediated by the MDR1 gene product (P-glycoprotein) a 170 kDa glycoprotein which acts as an energy-dependent transmembrane efflux pump that actively transports chemotherapeutic agents out of the cell. Inhibition of this pump can lead to a restoration of the level of cytotoxic drug accumulation in MDR cells observed in sensitive cells.
200

A number of compounds have been identified which inhibit the efflux of chemotherapeutic drugs by P-glycoprotein and reverse cellular resistance in experimental systems, e.g. verapamil, a calcium antagonist, and cyclosporin A, an immunosuppressive drug.
However, there are a number of non-chemotherapeutic drugs which enhance chemotherapeutic cytotoxicity by mechanisms other than the inhibition of efflux pumps. One of these drugs, buthionine sulfoximine (BSO), reduces cellular glutathione levels by irreversibly inhibiting y-glutamylcysteine synthetase, the first enzyme involved in de novo glutathione synthesis. Glutathione helps to protect cells both by conjugating with cytotoxic electrophile drug derivatives and by binding with drug generated reactive oxygen compounds such as peroxides (Pratt et al., 1994). High glutathione levels were found to be associated with decreased DNA cross-link formation by some chemotherapy drugs. This reduction in DNA cross-link formation was probably due to intracellular drug inactivation by glutathione rather than an increased rate of DNA repair (Stewart and Evans, 1989). BSO also inhibits glutathione transferase activity, and inhibits the uptake of cysteine, a precursor of glutathione (Stewart and Evans, 1989). While BSO decreased glutathione concentrations in most normal tissues, the degree of glutathione reduction in these normal tissues has not been as great as in tumour tissues. Chemotherapeutic toxicity to normal tissues (including bone marrow) was generally not augmented at BSO doses that enhanced chemotherapy efficacy against tumours (Lee et al., 1987; Stewart and Evans, 1989; Siemann and Beyers, 1993).
This series of experiments was performed to investigate the efficacy of BSO plus a P- glycoprotein inhibitor (verapamil) in combination with adriamycin in DLKP and DLKP-A cell lines.
The effect of BSO on the cytotoxicity of adriamycin in DLKP is given in Table 3.2.1 and the Combination Index (Cl) values (see Section 2.7.6) are given in Table 3.2.2. These results show that at higher concentrations of BSO, the Cl value was approximately 1.
201

This implies that there was an additive cytotoxic effect. A synergistic cytotoxic effect (i.e. Cl value < 1) was observed at lOng/ml adriamycin when 1/xg/ml of BSO was used.
Verapamil in combination with adriamycin showed little enhanced cytotoxic effect in DLKP (Table 3.2.5). At the lower concentrations of BSO (0.125 g/ml and 0.25/xg/ml), there was synergism in toxicity (Table 3.2.6). However, BSO plus verapamil in combination with adriamycin did not enhance the toxicity of adriamycin compared to BSO with adriamycin (Table 3.2.7).
The effect of BSO on the cytotoxicity of adriamycin in DLKP-A is given in Table 3.2.3 and the Combination Index (Cl) values are given in Table 3.2.4. These results show that at the lowest concentration of BSO, l g/ml, the Cl values were less than 1, i.e. there was a synergistc toxic effect with all the concentrations of adriamycin used. At higher concentrations of BSO, the Cl values were > 1 thereby indicating an antagonistic combination.
Verapamil did show enhanced cytotoxicity in combination with adriamycin in DLKP-A (Table 3.3.8). This was expected because P-glycoprotein, which is inhibited by verapamil, is overexpressed in DLKP-A (Redmond, 1991; Cleary, 1995). However, BSO did not significantly affect adriamycin toxicity (Table 3.3.9). The combination of BSO plus verapamil was synergistic with adriamycin (Table 3.2.11); however, it was not clear if this effect was due to verapamil alone or the combination of BSO and verapamil. Therefore a more detailed experiment using a number of combinations of BSO and verapamil with adriamycin was performed (Table 3.2.11). This showed that the combination of BSO plus verapamil with adriamycin was synergistic. For example, when the 0.5mg/ml concentration of verapamil was used and the concentration of BSO was increased, the toxicity of adriamycin was enhanced from 63% to 43% cell survival. Conversely, when the 0.125mg/ml concentration of BSO was used and the concentration of verapamil was increased, the toxicity of adriamycin was also enhanced e.g. from 80% to 63% cell survival. This is in agreement with other researchers, who showed that BSO
202

plus verapamil in combination with daunorubicin, in myeloid leukaemic cells, further induced internucleosomal DNA fragmentation (Quilletmary et al., 1996).
The above results demonstrate the effectiveness of BSO to enhance the toxicity of adriamycin in drug sensitive and drug resistant human lung carcinoma cell lines. BSO in combination with verapamil demonstrated an enhanced cytotoxicity and it would be interesting to repeat the experiment in DLKP-A using cyclosporin A instead of verapamil, in combination with BSO and adriamycin. While BSO may have a future role in enhancing chemotherapy in a resistant population, the results of other circumvention compounds in clinical trials have been disappointing due to non-specific effects (verapamil) or toxic effects (cyclosporin A) of the circumvention agent (Ford, 1995). Therefore, other alternatives need to be explored.
4.3 MDR1 ribozyme transfection
Currently the best understood mechanism of MDR is the resistance mediated by the MDR1 gene product, P-glycoprotein (see Section 4.2). Attempts at chemomodulation of P-glycoprotein have been investigated using various P-glycoprotein antagonists. The results of circumvention compounds in clinical trials have been disappointing due to nonspecific effects (calcium antagonists) or toxic effects (cyclosporin A) of the circumvention agent (Ford, 1995). Therefore, a more specific modulation of MDR is necessary for an improved reduction in drug resistance. One alternative is to use antisense techniques such as ribozymes.
Ribozymes are RNA molecules which have catalytic activity. The hammerhead ribozyme is the smallest of the ribozymes and the target RNA cleavage sites have the least constraints with respect to sequence. Therefore, the hammerhead ribozyme has the most abundant target sites compared to other ribozyme types (Sullivan, 1994). To test the efficacy of antisense in vitro, a hammerhead ribozyme which cleaves the 3’-end of the
203

GUC sequence in codon 880 of mdrl RNA was transfected into the adriamycin resistant human lung carcinoma cell line SK-MES-l/Adr (see Figure 4.3.1). SK-MES-l/Adr is a derivative of the chemotherapeutic drug sensitive cell line SK-MES-1, and was selected by exposure to increasing concentrations of adriamycin. Its mechanism of drug resistance is primarily thought to be due to P-glycoprotein overexpression (Redmond, 1991; Cleary, 1995).
Three clones were isolated when SK-MES-1/Adr was electroporated with the anti-MDRl ribozyme plasmid. The clones were selected in 96-well plates by continuous exposure to 200/xg/ml geneticin in ATCC media. These clones were assayed for their resistance to three chemotherapeutic drugs (adriamycin, vincristine and VP-16) and compared to the sensitive parent SK-MES-1 and the resistant parent SK-MES-l/Adr (Figures 3.3.1 - 3.3.3). These graphs demonstrate that each clone displays a decreased resistance to adriamycin, vincristine and VP-16 compared to the resistant parent cell line, SK-MES- l/Adr. Clone #:2 is the most resistant of the three clones. Clone #3 and clone #4 showed a similar resistance profile.
RT-PCR analysis of RNA isolated from SK-MES-1, SK-MES-l/Adr and each ribozyme clone was performed (Figure 3.2.4). No MDR1 mRNA expression was detected in SK- MES-1. A decreased expression of MDR1 mRNA was detected in the three MDR1 ribozyme transfectants compared to the resistant parent. Of the ribozyme transfectants, clone #4 expressed the least amount of MDR1 mRNA while clone #2 expressed the greatest amount MDR1 mRNA. Therefore, clone #4, which showed the least amount of MDR1 mRNA expression, was also the clone most sensitive to adriamycin, vincristine and VP-16 as predicted.
204

3’ 5’
Uuu uA
C A A
C A
A
A
A G
G G G A C
U C C U G
G A G
G A
U
Figure 4.3.1 Structure of the anti-MDRl hammerhead ribozyme.
The hammerhead ribozyme is in bold. The £ represents the cleavage site of the mdrl mRNA (Holm et al. ,
1994). .
Fold resistance values found (Table 3.3.3) show that the ribozyme transfectant clones displayed a reduction of approximately 50% in resistance to adriamycin. Their resistance to vincristine and VP-16 varied, with clone #2, 60 and 4.9 fold resistant to vincristine and VP-16, clone #4 40 and 3.7 fold resistant respectively.
AA
AAu
(2629)
Substrate cleavage site
2650) 3’
UGG ACA AGC AC
ACC UGU UCG UG
C 5’
U
205

Further studies on these cell populations should include western blot analysis of the ribozyme transfectants compared to SK-MES-1 and SK-MES-l/Adr to establish the levels of P-glycoprotein being expressed. To further confirm that the chemosensitivity conferred on the transfectants was due to the ribozyme plasmid, PCR should be performed to establish that the plasmid is present in the cell lines and RT-PCR to confirm that the ribozyme is being expressed.
The use of ribozymes to control the expression of P-glycoprotein is a new technology and the experiments performed highlight some of the drawbacks of the technique. Transfection of the anti-MDRl ribozyme does work as has been shown previously by other workers (Holm et al., 1994; Kiehntopf et al., 1994; Bertram et al., 1995; Daly et al., 1996). However, all of the clones isolated still expressed some MDR1 mRNA. Perhaps with the introduction of a site specific plasmid vector or the use of a retroviral vector this limitation may be overcome. This approach would allow the introduction of the ribozyme into a specific area of the genome where it would not be detrimental to the cell and where it could be under the control of a strong promoter. Although the ribozyme did not completely abrogate MDR1 expression, the use of ribozymes is a significant step forward since it bypasses the need for the repeated use of antisense oligonucleotides. In the future ribozyme technologies may surpass the use of pharmacological circumvention agents.
4.4 MDR1 transfection
MDR is generally a multifactorial phenomenon with a number of resistance mechanisms usually co-expressed within a cell. DLKP-A is an MDR cell line derived from DLKP by sequential exposure to increasing concentrations of adriamycin. Nine clones were isolated from DLKP-A, each with different levels of resistance and combinations of resistance mechanisms (Heenan, 1994). However, no clone expressed P-glycoprotein as the sole mechanism of resistance. Therefore, DLKP was electroporated with the pHaMDRl/A plasmid, which encodes the full cDNA for the human MDR1 gene (Pastan et al., 1988),
206

to develop a low level resistant DLKP clone whose only mechanism of resistance would be the expression of P-glycoprotein. These clones would then be a realistic model of the in vivo situation and could be used for subsequent studies aimed at enhancing the effect of chemotherapy.
Two clones were isolated when DLKP was transfected with the pHaMDRl/A plasmid and selected by continuous exposure to 50ng/ml adriamycin in ATCC media. This adriamycin concentration represents approximately 3 times the IC50 value for DLKP. Control cells did not survive when exposed to this concentration and the clones selected were resistant to adriamycin.
Toxicity assays were performed on each clone using adriamycin, vincristine and VP-16 (Figures 3.4.1 - 3.4.3). These graphs demonstrate that each clone had an increased resistance to adriamycin, vincristine and VP-16 compared to the sensitive parent cell line, DLKP. Clone #\ demonstrated an increased resistance to adriamycin and vincristine compared to clone #2. In contrast, clone #2 showed a greater resistance to VP-16 than clone #1. The IC50 values for adriamycin, vincristine and VP-16 of each clone are given in Table 3.4.2 and are compared to DLKP and DLKP-A. The values show that the MDR1 transfectants were more resistant to each chemotherapeutic drug tested compared to DLKP but were not as resistant as DLKP-A . The fold resistance values (Table 3.4.3) showed that the clone #1 and clone #2 were 37 and 15 fold more resistant to adriamycin compared to DLKP but 8 fold and 13.6 fold more resistant to VP-16 respectively.
RT-PCR analysis of RNA isolated from DLKP, the two MDR1 transfectants and DLKP- A was performed (Figure 3.2.4). As expected no MDR1 expression was detected in DLKP. An increased expression of MDR1 mRNA was detected in DLKP-A and the two MDR1 transfectants with the expression of MDR1 in DLKP-A being much greater than in the two transfectant clones. Time did not permit western blot analysis of the MDR1 transfectants compared to DLKP and DLKP-A to establish the levels of P-glycoprotein being expressed. To further confirm that the resistance conferred to the transfectants was
207

due to the pHaMDRl/A plasmid, PCR should be performed to establish that the plasmid is present in the cell lines.
The toxicity data also demonstrated that clone #\ was more resistant to adriamycin and vincristine than clone #2 but that clone #2 was more resistant to VP-16 than clone # 1. Thus, even though these clones were derived from the same parent cell line and were transfected with the same plasmid, they displayed different resistance profiles to the chemotherapeutic drugs tested. This may be due to plasmid insertion at different locations of the genome. Alternatively, DLKP has previously been shown to be polyclonal and to be composed of three cell distinguishable populations (McBride, 1995). Therefore, the difference in resistance profiles of the two MDR1 transfectants may be due to the transfection of two different clones within DLKP, although there was little difference between each clone and chemotherapeutic drug sensitivity (McBride, 1995). Examining the morphology of each transfectant and comparing them to the known morphology of the subclones of DLKP may verify this theory. Transfection of the different clones of DLKP with pHaMDRl/A would establish if MDR1 expression within different clones displays a different resistance profile to chemotherapeutic drugs.
4.5 Test compound screening
There are a number of non-chemotherapeutic drugs which enhance chemotherapeutic cytotoxicity by mechanisms other than the reversal of drug resistance (reviewed in Stewart and Evans, 1989). These include buthionine sulfoximine (BSO) and other glutathione depletors, the nitroimidazoles and the methylxanthines. However, none of these are in common clinical use. Thus, the need to test new non-chemotherapeutic drugs which enhance the cytotoxicity of chemotherapeutic drugs is essential. This series of experiments investigated possible cytotoxic synergy between an anticancer agent with one of a series of coded non-toxic test compounds known to be safe for human use (A-l, N -l, 0-1, U-l and U-2).
208

Seven cell lines were tested to investigate the presence of any synergistic toxic effect between adriamycin and the five test compounds in drug sensitive and drug resistant cell lines. These cell lines were resistant variants derived from 2 parental cell lines, DLKP and SK-MES-1 both lung carcinoma cell lines. DLKP-SQ is a clone of DLKP a human lung carcinoma cell line, which is sensitive to chemotherapeutic drugs (McBride, 1995); DLKP pHaMDRl/A #2 is a clone of DLKP which was transfected with the MDR1 gene and has been found to overexpress MDR1 mRNA (see Section 3.4); DLKP-A-2B is a low level resistant clone derived from the MDR cell line DLKP-A (Heenan, 1994), and expresses a number of MDR mechanisms including overexpression of P-glycoprotein; DLKP-A-2B IC7 is a MDR1 ribozyme transfectant of DLKP-A-2B, in which the expression of P-glycoprotein mRNA is inhibited (McBride, 1995). SK-MES-1 is also a human lung carcinoma cell line, which is sensitive to chemotherapeutic drugs, but whose resistance to adriamycin is approximately 3 fold that of DLKP; SK-MES-l/Adr is an MDR derivative of SK-MES-1, which was exposed to increasing concentrations of adriamycin; SK-MES-l/Adr MDR1 ribozyme clone #4 was the most sensitive clone obtained after transfection of SK-MES-l/Adr with a MDR1 ribozyme, although P- glycoprotein mRNA expression was not completely inhibited (see Section 3.2).
The results demonstrated that the test compounds N-l, 0-1 and U -l, at non-toxic concentrations, were found to enhance the toxicity of adriamycin in three cell lines; DLKP (Table 3.5.1), DLKP-A-2B IC7 (Table 3.5.4) and SK-MES-1 (Table 3.5.5). No test compound demonstrated any enhanced toxic effect in DLKP-A-2B (Table 3.5.3), DLKP pHaMDRl/A#2 (Table 3.5.2), SK-MES-l/Adr (Table 3.5.6) and SK-MES-l/Adr mdrl ribozyme #4 (Table 3.5.7). A brief summary of these results is given in Table 4.5.1.
Therefore, the cell lines which were found to be sensitive to the synergistic effect of the test compounds were drug sensitive, DLKP and SK-MES-1 or a low level resistant variant which does not express MDR1 (DLKP-A-2B IC7). All cell lines found to be unresponsive to the test compounds were multidrug resistant P-glycoprotein overexpressing cell lines.
209

These results show that the enhanced toxicity of adriamycin by N-l, 0-1 and U-l occurred in those cell lines where there was no P-glycoprotein expression i.e. DLKP, SK- MES-1 and DLKP-A-2B IC7. It is interesting that DLKP-A-2B IC7 continues to exhibit a low level of resistance, this may in part be due to decreased levels of topoisomerase II which is found in DLKP-A-2B (Heenan, 1994). DLKP which was sensitive to the above effect was rendered insensitive when transfected with the MDR1 gene. All of the cell lines tested in which the test compounds had no effect all over-expressed P-glycoprotein. This suggests that adriamycin may not be present in the cell in sufficient quantity or the test compounds may also be P-glycoprotein substrates. However N-l has been shown to accumulate in P-glycoprotein positive cells within minutes of being added to media (C.Elliot, personal communication). Thus, while the test compounds may not be P- glycoprotein substrates, P-glycoprotein does affect their ability to enhance the cytotoxicity of adriamycin presumably by decreasing its intracellular concentration. This effect may not be related to the test compounds but the effect could be due to efflux of adriamycin from the cells.
Table 4.5.1: Summary of the effect on cell lines screened for synergy between the test compounds and
adriamycin.
Cell Line Synergy Comment
DLKP-SQ Yes Sensitive
DLKP pHaMDRl/A No MDR1 transfectant
DLKP-A-2B No Low level resistant
DLKP-A-2B IC7 Yes MDR1 ribozyme transfectant
SK-MES-1 Yes Sensitive
SK-MES-1/Adr No Resistant
SK-MES-1/Adr ribo #4 No MDR1 ribozyme transfectant
210

4 .6 Scheduling
The results of Section 3.5 described the effect of combining five test compounds with adriamycin. Three of these compounds were found to enhance the toxicity of adriamycin in three of seven cell lines assayed. The standard circumvention assay used allowed the screening of test compounds in combination with adriamycin. However it did not provide an insight into the mechanism of the synergistic action. An assay was developed to analyse how synergy was affected when cells were exposed to the test compounds at different times relative to adriamycin exposure. Cells were pulse treated with adriamycin for 2 hours which resulted in approximately 50% cell survival. When the adriamycin was washed off, the cells were exposed to high non-toxic levels of a test compound for short periods of time (24 hours).
Using these assays, non-toxic levels of N-l, 0-1 and U-l were shown to enhance adriamycin toxicity in DLKP (Table 3.6.1) and DLKP-SQ (a sub-clone of DLKP). A -l, I-1 and U-2 as expected had no effect (Table 3.6.2). During the first 24 hours after adriamycin exposure, DLKP-SQ cells were sensitive to the effect of N -l, 0-1 and U-l but not during any other 24 hour time period following the initial 24 hours. Pretreatment for 24 hours had no effect (Table 3.6.5). Treating cells with adriamycin and a test compound together did not enhance the cytotoxic effect of adriamycin possibly due to the short duration of co-exposure (Table 3.6.6). While a synergistic toxic response might have been expected with this combination, the test compound exposure with adriamycin was only for2 hours compared to the other assays which did display synergy, where exposure was for 24 hours. Exposure to N-l for shorter periods (10 hours) was assayed after pulse exposure with different concentrations of adriamycin (Table 3.6.6). The toxic effect of N-l was evident during the initial two 10 hour periods after adriamycin exposure. However, while there was a consistent trend, the results from these experiments were just outside the error values. The clonogenic assay, which determines the number of colonies formed after drug exposure, could be used instead of the growth assay used in this thesis. This assay may be more sensitive and thus could indicate shorter time periods when exposure to a test compound may be important.
211

Since the active test compounds exerted their synergistic effect during the first 24 hours following drug removal, cycloheximide and actinomycin D were used to try and block the synergistic effect. Cycloheximide, a protein synthesis inhibitor, was used in combination with U-l after adriamycin exposure (Table 3.6.7). A relatively non-toxic level of cycloheximide was used (75% cell survival). However at this concentration of cycloheximide, there was no inhibition of the enhanced toxic effect of U-l. This would suggest that the synergistic effect of U-l is independent of protein synthesis. Actinomycin D, an inhibitor of transcription and translation, was also used at non-toxic concentrations in combination with U-l after adriamycin exposure (Table 3.6.8). Actinomycin D did not inhibit the toxic effect of U-l. This would suggest that the synergistic effect of U-l is also independent of transcription and translation. To prove conclusively that protein synthesis, transcription and translation do not prevent the effect of U-l, studies to confirm that the level of cycloheximide used does inhibit protein synthesis and that the level of actinomycin D does inhibit transcription and translation in DLKP-SQ would need to be performed in these cell lines.
Two active (N-l and U-l) and one inactive (A-l) test compounds were further studied in combination with two other commonly used chemotherapeutic drugs:- vincristine and 5- fluorouracil. 0-1 and U-l continued to cause an increase in observed toxicity during the first 24 hours after vincristine exposure (Table 3.6.3). It is interesting that there was a greater cytotoxic effect observed with vincristine in combination with the active test compounds as compared to adriamycin. No enhanced cytotoxic effect was observed with vincristine plus A -l in combination. No test compound showed any effect with 5- fluorouracil (Table 3.6.4).
These results show that 0-1 and U-l at non-toxic levels enhance the toxicity of adriamycin and vincristine but not 5-fluorouracil. Interestingly, adriamycin and vincristine are both P- glycoprotein substrates while 5-fluorouracil is not. This seems to correlate with the results from Section 3.5, which show that cell lines expressing P-glycoprotein do not exhibit enhanced toxicity to adriamycin using any of the test compounds. However it raises the
212

question as to why the test compounds do not work with 5-fluorouracil. One possibility is that chemotherapeutic drugs may induce different apoptotic pathways within a sensitive cell. Further studies screening other chemotherapeutic drugs and other cell lines expressing alternative resistance mechanisms, for example P-glycoprotein related proteins like MRP and LRP, would also be relevant.
One of the advantages of the assay developed is that pulse exposure of the cells in vitro mimics the treatment of a patient in vivo. The high concentration (lpiM adriamycin) and short time exposure (2 hours) is an approximate imitation of the initial adriamycin concentration in the body (Piscitelli et al., 1993). Thus, the test compounds could be used concurrently with chemotherapeutic drug treatment in vivo and for an extended period after the chemotherapeutic agent has been metabolised. This is unlike other circumvention agents such as verapamil or cyclosporin A which must be present during chemotherapeutic drug exposure in order to exert their effect.
Further studies could be performed to investigate the effect of synchronising cells in specific phases of the cell cycle, pulse treated with a chemotherapeutic drug, followed by exposure to an active test compound, would there be an increase or decrease in sensitivity? In these experiments the cell cycle progression could be followed using flow cytometry and apoptotic events could be examined by time-lapse videomicroscopy.
4.7 DLKP pHaMDRl/A #2 Scheduling
The results from Section 3.6 demonstrate that the active test compounds, N -l, 0-1 and U- 1 exert their synergistic cytotoxic effect during the first 24 hours post-treatment with adriamycin. Previous results also demonstrated that the test compounds N-l, 0-1 and U-l were shown to have no synergistic effect in combination with adriamycin in DLKP pHaMDRl/A #2 or any other P-glycoprotein over-expressing cell line using the standard circumvention assay. Therefore, DLKP pHaMDRl/A #2 was assayed using the modified
213

assay, i.e. pulse treating with adriamycin and then exposing to a high concentration of a test compound for 24 hour periods.
DLKP pHaMDRl/A #2 was pulse treated with adriamycin and exposed to 6 test compounds for 24 hour periods (Table 3.7.1). No synergistic effect with adriamycin was observed with any of the six test compounds assayed.
Because the test compounds had displayed no synergy with adriamycin in the P- glycoprotein positive cells inhibitors of P-glycoprotein were used to try and restore the synergistic effect of the test compounds. Verapamil inhibits P-glycoprotein associated energy-dependent drug-efflux in MDR cells, apparently by blocking the binding of drugs to P-glycoprotein (Ford, 1995). Using the test compounds and verapamil in combination with adriamycin, there was no restoration of the synergistic effect induced by the test compounds as observed in DLKP (Table 3.7.2). These experiments were repeated using cyclosporin A instead of verapamil. Cyclosporin A is an immunosuppressive peptide which has been found to act as an MDR substrate and antagonise MDR at least in part through inhibition of P-glycoprotein-mediated efflux of cytotoxic drugs (Ford, 1995). Again the synergistic effect observed between the test compounds and adriamycin was not restored.
Even in the presence of P-glycoprotein inhibitors, there was no restoration in chemosensitivity caused by the test compounds. During the assay, various cytotoxic levels of adriamycin were used. Therefore, even though there was cytotoxic injury to the MDR cells, exposure to the test compounds, which are apparently P-glycoprotein-mediated transport independent substrates (C.Elliot, personal communication), did not enhance cytotoxicity even when P-glycoprotein inhibitors were used in combination. One possibility is that chemotherapeutic drugs may induce different types of cytotoxic damage in sensitive versus resistant cells. This could be investigated by analysing the toxic effect of a chemotherapeutic drug on cell lines with different drug sensitivities. Therefore, treatments which induce 75% or 50% cell survival could be compared between the cell lines to ascertain a difference in cell cycle distribution by flow cytometry. Alternatively
214

chemotherapeutic drugs may induce different apoptotic pathways in sensitive and drug resistant cell lines.
4.8 Cell cycle distribution
The results from Section 3.6 demonstrated that the test compounds, N -l, 0-1 and U-l exert their synergistic cytotoxic effect during the first 24 hours post-treatment with adriamycin or vincristine but not 5-fluorouracil. In order to further investigate the role of these test compounds on DLKP-SQ, flow cytometric analysis was used to determine the cell cycle distribution of treated samples. Using a flow cytometer the amount of DNA fluorescence from propidium iodide stained cells (which intercalates with DNA), can be measured and this can be used to determine the position of a cell in the cell cycle.
Flow cytometric analysis was used to determine the cell cycle distribution in DLKP-SQ pulse treated with adriamycin, vincristine or 5-fluorouracil for 2 hours alone and in combination with a test compound (A-l, N-l or U-l) for 24 hours.
U-l on its own was shown to induce a Gs/S arrest for up to 10 hours (Figure 3.8.1). There was no apparent effect on the cell cycle distribution using A -l or N-l (Figure 3.8.2 and Figure 3.5.3).
The active test compounds (U-l or N-l) in combination with adriamycin displayed an increased G^S arrest with a delayed S peak evident at 13 to 19 hours compared to adriamycin alone (Figure 3.8.4 and Figure 3.8.5). Thus the addition of an active test compound causes an increased delay in the Gi phase and the S phase compared to adriamycin alone. This delay was not observed with A -l (inactive) and adriamycin treatment (Figure 3.8.6). Because of the increased G^S phase arrest and an increased S phase transition in DLKP-SQ treated with adriamycin plus N-l or U-l, increasing concentrations of adriamycin alone were analysed. These results show that there was an increased G^S phase arrest, a delay in S and a G2/M arrest approximately 24 hours after
215

drug removal, when increasing drug concentrations were used to pulse treat cells (Figure 3.8.12 - 3.8.14). It is known that low concentrations of adriamycin induce G2 arrest, and that higher concentrations or exposure to drug for longer periods of time induces a G, arrest and a delay in S phase traverse (Barlogie et at, 1976).
U-l or N-l in combination with vincristine (Figure 3.8.7 (a) and 3.8.8 (a) respectively), showed an increased G2/M arrest compared to vincristine treated cells alone (Figure 3.8.7 (b) and 3.8.8 (b)). In each combination, there was a large increase in the Gj peak at 24 hours in vincristine treated cells compared to the large G2/M peak when U-l or N-l were combined in combination with vincristine. This G2/M arrest was expected since vincristine is a mitotic inhibitor. This means (in vincristine treated cells) that by 24 hours the G2/M arrest was overcome, while in the N-l/U-1 plus vincristine combination there was still a G2/M arrest. Therefore, the addition of an active compound after vincristine exposure causes an increased delay in G2/M. Vincristine and A-l in combination did show a slight cell cycle delay in G^S at 12 - 15 hours but this was not as striking as in U-l or N-l treated cells (Figure 3.8.9). Increasing concentrations of vincristine were analysed to investigate if increasing concentrations increased G2/M arrest as found when 50ng/ml plus U-l or N-l were used in combination (Figure 3.8.15 - 3.8.17). Increasing concentrations of vincristine showed a decrease in the G[ peak and an increased G2/M peak representing an increased G2/M arrest as compared to untreated cells.
DLKP-SQ treated with 5-fluorouracil alone and in combination with U-l showed no effect on the cell cycle distribution (Figure 3.8.10 and Figure 3.8.11). These results were expected since there was no synergy between any test compound and 5-fluorouracil when previously assayed (Table 3.6.4).
These results seem to suggest that the effect of U-l and N-l in combination with a chemotherapeutic drug (adriamycin and vincristine but not 5-fluorouracil), may mimic higher chemotherapeutic drug combinations. For example, the cell cycle distribution of ljiM adriamycin and U-l in combination seems similar to 2/j.M adriamycin alone (Figure3.8.4 (a) and Figure 3.8.14) and 50ng/ml vincristine and U-l in combination (Figure
216

3.8.7(a)) seems similar to lOOng/ml vincristine alone (Figure 3.8.17). This effect may be the result of increased cytotoxic action due to the higher concentration causing a greater cytotoxic insult to the cell and thus the increased G^S delay, S phase traverse and G2/M delay. It is interesting to note that cells which have been synchronised in the S or the G2 phase are more sensitive to adriamycin cytotoxicity than cells in Gt (Krishan and Frei, 1976). These above results show that the active test compounds have an effect on the cell cycle which is different from the pulsed chemotherapeutic drug alone and this effect may mimic increased concentrations of the chemotherapeutic drug alone. HPLC analysis of cells treated with drug could be used to determine the intracellular levels of a chemotherapeutic drug and the test compound. This would demonstrate if there was an increased accumulation of chemotherapeutic drug in samples treated with chemotherapy and an active test compound.
4.9 Cell death kinetics
The test compounds, N -l, 0-1 and U-l exert their synergistic cytotoxic effect during the first 24 hours post-treatment with adriamycin or vincristine. Flow cytometric analysis (Section 3.8) showed that there was a difference in cell cycle distribution during the first 24 hours after pulse exposure between adriamycin and adriamycin plus U-l or N-l and between vincristine and vincristine plus U-l or N -l. Therefore, while there was an increased cytotoxicity in cells which were exposed to N -l, 0-1 or U-l after adriamycin or vincristine exposure, and there was a difference in cell cycle distribution, there was no indication as to why or when the cells undergo cell death.
Time-lapse videomicroscopy permits the continuous observation of cells following drug treatment. With this technique it was possible to follow, in real time events such as cell rounding for mitosis or apoptosis. Mitosis was characterised by the rounding up of adherent cells followed by cytokinesis and reattachment of daughter cells to the surface of the flask. Cell death was classified as apoptotic on the basis of morphological events
217

starting with rounding up of adherent cells, subsequent cell shrinkage and/or break-up of the cell into apoptotic bodies.
Using time-lapse videomicroscopy the kinetics of mitosis and apoptosis was followed in DLKP-SQ treated with U-l alone for 24 hours, 2 hours pulse exposure to increasing concentrations of adriamycin, adriamycin and U-l in combination, 2 hours pulse exposure to vincristine, and vincristine plus U-l in combination.
The results show that exposure of DLKP-SQ to 140/xM U-l has no detrimental effect on the cells, although initially there was a low level of apoptosis and a temporary inhibition of mitosis compared to the drug free control (Figure 3.9.3). Apoptosis was induced 24 hours after 1/xM adriamycin removal, however, when U-l was used in combination with adriamycin there was no difference in the rate at which apoptosis was induced compared to adriamycin alone (Figure 3.9.2). In the adriamycin plus U-l treated sample, apoptosis was also induced after 24 hours and the rate of apoptosis was similar to adriamycin alone. Mitosis was abolished in both samples. This result was unexpected since it was thought that apoptosis may have been induced sooner when U-l was used because of the observed synergy, although a similar rate of apoptosis in both samples may be related to the effect of adriamycin on the cell cycle. In contrast, vincristine exposure induced a different response (Figure 3.9.3). 60nM vincristine exposure inhibited mitosis for 12 hours but induced apoptosis continuously for the first 24 hours following exposure which then stopped. Vincristine followed by U-l exposure inhibited mitosis completely and induced a high level of apoptosis for approximately the first 12 to 18 hours after vincristine removal.
Therefore the above results show that different chemotherapeutic drugs induce apoptosis at different times. This seems to suggest that different chemotherapeutic drugs induce different apoptotic pathways.
Further analysis of a range of adriamycin concentrations was performed to investigate if varying the concentrations induced different rates of apoptosis. 2 hour exposure to 0.5/xM adriamycin, delayed mitosis for 24 hours and induced a low rate of apoptosis from 12
218

hours (Figure 3.9.4). 1/zM and 2/xM adriamycin concentrations inhibit mitosis completely and induce apoptosis 24 to 48 hours after exposure. It is interesting that with the l M adriamycin concentration, apoposis was induced 24 hours after exposure and continued until 72 hours, while 2/xM adriamycin induced apoptosis after 48 hours which continued until the experiment finished i.e. 96 hours. Therefore, there is a possibility that higher concentrations of adriamycin “shock” or cause so much damage to the cell that it delays the induction of apoptosis.
It is interesting to correlate these microscopical results with the flow cytometric data. A two hour 1/xM adriamycin exposure induced apoptosis 24 hours after it was removed. By this time, most of the cells would be arrested in the G2/M phase. In contrast, vincristine treated cells arrest almost immediately in the G2/M phase. Further work could be undertaken to try and determine at what stage of the cell cycle DLKP-SQ cells undergo apoptosis. These results might also explain why the active test compounds enhance the toxicity of vincristine to a greater extent than adriamycin and why there seemed to be no difference in the rate of apoptosis in adriamycin only as compared to adriamycin plus U-l treated samples. However it seems that the active test compounds do not need to be present in order for apoptosis to occur. Apoptosis occurs 24 hours after the removal of adriamycin, while it has already been shown that exposure to an active test compound is necessary during the first 24 hours subsequent to adriamycin exposure to enhance the toxicity of adriamycin. This suggests that the active test compounds may enhance apoptosis at an early stage in the apoptotic pathway. This could be further investigated by determining the levels of proteins involved in early stages of apoptosis e.g. members of the bcl-2 family.
It has previously been shown in human B-cell lymphoma cells that an inhibition of DNA fragmentation (one of the early stages of apoptosis) occurs at high concentrations of adriamycin and this was closely linked to the inhibition of S phase traverse (Smith et al., 1994). The authors concluded that the presence of drug or DNA damage is not sufficient to induce DNA fragmentation but that the unregulated commitment to S phase traverse is
219

an important factor in the activation of apoptosis. Since increasing concentrations of adriamycin disrupt the S phase in DLKP-SQ, deregulation of the S phase traverse could be a factor in the activation of apoptosis.
The adriamycin pulse exposure assays (Section 4.7) demonstrated that the enhanced cytotoxicity of N-l, 0-1 and U-l occurred during the first 24 hours after adriamycin removal. Flow cytometric analysis (Section 4.8) displayed an increased delay in the Gi phase and in the S phase transition until there was a G2/M arrest approximately 24 hours after adriamycin removal. Time-lapse videomicroscopy demonstrated that apoptosis was induced 24 hours after 1/*M adriamycin removal. In the adriamycin plus U-l treated sample, apoptosis was also induced after 24 hours but the rate of apoptosis was similar to adriamycin alone (Figure 3.9.2). However it is thought that the unregulated commitment to S phase traverse in response to adriamycin is an important factor for the activation of apoptosis (Smith et al., 1994). Since increasing concentrations of adriamycin disrupt the S phase in DLKP-SQ, deregulation of the S phase traverse and the proteins that control the transition from Gt into the S phase may have an important role in the activation of apoptosis.
4.10 Cell cycle proteins
To understand the effect of adriamycin and adriamycin plus U-l in combination on the increased Gi/S delay, the kinase activity of the cyclin E/CDK2 complex (Section 3.10) and the levels of cyclin E and CDK2 were studied (Section 3.11). The transition from Gj into S is controlled by the cyclin E/CDK2 complex and this is essential for the cell to begin DNA replication (see Section 1.3.1). Therefore, the cyclin E/CDK2 complex must be activated to overcome Gt arrest. The level of cyclin E is regulated so that it is only transcribed during late Gi and early S phase. Very little is known about the substrates of the cyclin E/CDK2 complex but it is thought to activate E2F and thus transcription of S phase genes. Once cells enter the S phase cyclin E is rapidly degraded. Therefore, by
220

investigating the role of cyclin E and CDK2 it would be possible to see if alterations in their levels are responsible for the G1 arrest and delayed S phase transition caused by adriamycin and adriamycin plus U-l in combination as observed by flow cytometric analysis.
At least 3 forms of endogenous cyclin E protein have been detected in rat and human fibroblasts (Ohtsubo and Roberts, 1993) and HeLa cells (Dulic et al., 1992). A 50kDa form is maximally expressed during late and early S phase while a 40 kDa form is thought to result from proteolytic degradation of overexpressed cyclin E or from translation initiation at an internal methionine residue (Ohtsubo and Roberts, 1993). A higher molecular weight form (55kDa) has been observed in G2 and early to mid-Gj when kinase activity is low but from late-G! the 50 kDa form is expressed.
The cyclin E/CDK2 kinase activity of U-l treated samples demonstrated that the activity increased steadily up to 19 hours and then decreased at 24 hours. Adriamycin treated samples show a decrease in activity at 0 hours, which was when drug was removed after two hours drug exposure, compared to a control sample treated with drug free media for 2 hours. The activity increased slightly at 10 hours but then decreased gradually until 24 hours. When adriamycin and U-l were combined there was an increase in activity at 10 hours which then decreased steadily until 24 hours (see Table 3.10.1). The kinase activity of cells treated with adriamycin plus U-l was elevated compared to adriamycin alone. Activity treated with adriamycin may have peaked at an earlier time and then decreased, while activity in cells treated with adriamycin plus U-l peaked at 10 hours. This could correlate to the observed delay in the cell cycle studies where the adriamycin plus U-l samples enter the S phase later than adriamycin samples alone.
The levels of CDK2 varied over a 24 hr period in untreated DLKP-SQ cells and cells treated with U -l, adriamycin and the adriamycin plus U-l combination (Figure 3.11.1 - 3.11.4). The levels increased initially, then decreased and subsequently increased again in each case. However, there seems to be no correlation between CDK2 levels and the cell cycle distribution (Figure 3.8.2, 3.8.4 and 3.8.7).
221

Untreated control samples showed an increase in levels of a higher molecular weight cyclin E (67kDa) at 10 hours; a 49 kDa band was evident from 10 to 16 hours which decreased with time until 24 hours (Figure 3.11.5). In U-l treated samples, levels of
another high molecular weight cyclin E (=49kDa) increased from 10-13 hours, but had
then decreased by 16 hours. There was also an increase in a 37.5 kDa band from 16 hours onwards (Figure 3.11.6). The level of the higher molecular weight (67kDa) cyclin E in adriamycin treated cells increased at 10-13 hours. A lower molecular weight band (37.5kDa) increased at 16 and 19 hours but decreased by 24 hours (Figure 3.11.7). Cyclin E levels in adriamycin and U-l treated samples were similar to adriamycin treatment alone but at 13 hours the high molecular weight band (67kDa) appears stronger while the 37.5 kDa band has decreased compared to adriamycin (Figure 3.11.8).
Thus, the western blots of cyclin E in Figures 3.11.5 - 3.11.8 seem to indicate that an increased amount of the higher molecular weight form (67kDa) represents cells in Gj or Gj arrest; the form around 49 kDa seems to represent active cyclin E, while the lower molecular weight form (37.5 kDa) represents cells in late S and G2/M. This would seem to correlate with the flow cytometry results and entry from Gt into S. These results would also seem to indicate that the Gj/S delay is released when the higher molecular weight form of cyclin E decreases.
Levels of cyclin E were not elevated in U-l treated samples compared to the control, while the kinase activity of the cyclin E/CDK2 did increase over time. However these results do not show the cyclinE/CDK2 kinase activity levels of control samples for each time point. Thus it is assumed that the activity of the control samples are approximately the same as or higher than U-l treated samples. In contrast, the levels of cyclin E in adriamycin and adriamycin plus U-l treated samples increased significantly compared to the control and U-l samples. When cyclin E is overexpressed in cells, the cells progress through Gi and into the S phase at a faster rate (Ohtsubo and Roberts, 1993). Thus, overexpression of cyclin E above would be expected to decrease the length of time a cell remained in GL. Even though there were elevated levels of cyclin E there was no corresponding increase in kinase activity, in fact the kinase activity decreased. Therefore
222
the increase in protein levels but decrease in kinase activity suggests that cyclin E/CDK2 activity was inhibited. It has been previously shown that the activation of the cyclin E/CDK 2 complex appears to be the point at which radiation damage in the Gj phase can delay the cell cycle (Dulic et al., 1994). Therefore inhibition of cyclin E/CDK2 would lead to an arrest in G1 and a delay in the S phase transition.
Due to the increased rate of apoptosis during the initial 24 hours after vincristine treatment in U-l treated samples, work investigating the role of cyclin E and CDK2 proteins in vincristine treated cells would be very interesting. Although cyclin E is one protein that controls the G^S transition (see Section 1.3.1), Gi arrest may also be due to the inhibition of Rb, cyclin D1-CDK4/6 and/or due to the induction of p21, p27, pl6 and other CKIs which inhibit cyclin-CDK complexes. Some of these proteins may be involved in the Gt/S delay induced by adriamycin and they would be interesting proteins to investigate.
223

5.0 Conclusions
224

This thesis examined the effect of combinations of different drugs on toxicity to cancer cells in vitro. The effects of combining existing anticancer agents were analysed first. A combination of carboplatin and adriamycin or vincristine was found to be additive in DLKP-A but antagonistic in DLKP. The combinations of adriamycin plus vincristine were antagonistic in both cell lines. Vincristine plus VP-16 was antagonistic in DLKP but did show synergism in DLKP-A. This synergy may result from each drug targeting different cellular processes.
Combinations with the glutathione depleting agent, BSO, with and without verapamil were also studied in DLKP and DLKP-A. The effect of BSO on the cytotoxicity of adriamycin in DLKP-A showed a synergistic toxic effect at the lowest concentration of BSO. At higher concentrations of BSO, the Cl values were, in general, antagonistic. BSO plus verapamil in combination with adriamycin did not enhance the toxicity of adriamycin compared to a combination of BSO and adriamycin only, in DLKP. The combination of BSO plus verapamil in combination was synergistic with adriamycin in DLKP-A.
Different cellular models were also developed by transfection of the mdr-1 cDNA into sensitive cells, and by transfection of an anti-mdr-1 ribozyme into a P-glycoprotein over-expressing cell line.
The main part of the thesis concerned combinations of a known anticancer agent (adriamycin, vincristine and 5-fluorouracil) with one of a series of coded non-toxic compounds known to be safe for human use. Seven cell lines were tested. These cell lines were resistant variants derived from 2 parental human lung carcinoma cell lines, DLKP and SK-MES-1. These assays demonstrated that three of the test compounds N-l,0-1 and U -l, at non-toxic concentrations were found to enhance the toxicity of adriamycin in three cell lines; DLKP, DLKP-A-2B IC7 and SK-MES-1. No test compound demonstrated any enhanced toxic effect in DLKP-A-2B, DLKP pHaMDRl/A#2, SK- MES-l/Adr and SK-MES-l/Adr mdrl ribozyme #4. Therefore the cell lines which were found to be sensitive to the synergistic effect of the test compounds were all drug sensitive (DLKP and SK-MES-1) or a low level resistant variant which does not express MDR1
225

(DLKP-A-2B IC7). All cell lines found to be insensitive to the test compounds were multidrug resistant P-glycoprotein overexpressing cell lines. Thus the mechanism of the test compounds involved was not inhibition of the P-glycoprotein drug efflux pump. Further studies, to characterise the effect of the test compounds should be performed in cell lines with different mechanisms of resistance. DLKP-A-2B IC7 has a low level of resistance possibly due to decreased levels of topoisomerase II (Heenan, 1994). Therefore the test compounds may be active in cell lines with mechanisms of resistance other than P-glycoprotein. It would be interesting to undertake similar investigations in cell lines overexpressing other drug efflux pumps including MRP and LRP. One derivative of DLKP developed by pulse exposure to adriamycin displays a five fold resistance to adriamycin compared to the sensitive parent (R. NicAmhlaoibh, personal communication). This cell line is a better in vitro model of drug resistance as it develops in vivo and examining effects of the test compounds on this cell line would be interesting.
Significant enhancement of toxicity with vincristine but not 5-fluorouracil, was observed with the three active test compounds. Interestingly, adriamycin and vincristine are both P-glycoprotein substrates while 5-fluorouracil is not. This seems to correlate with the results which show that cell lines expressing P-glycoprotein do not exhibit enhanced toxicity to adriamycin using any of the test compounds.
The standard circumvention assay used allowed the screening of test compounds in combination with adriamycin but did not provide an insight into the mechanism of the synergistic action. An assay was developed to analyse how synergy was affected when cells were exposed to the test compounds at different times relative to adriamycin exposure. Cells were pulse treated with adriamycin for 2 hours, adriamycin removed and the cells exposed to high levels of a test compound for short periods of time. Activity of the active test compounds was observed only during the 24 hours subsequent to drug exposure. Pre-treatment or treatment at later times was ineffective. When exposure for shorter periods (10 hours) was assayed the enhanced toxic effect of N- 1 was evident during each 10 hour period for the initial 20 hours following adriamycin
226

exposure. However, while there was a consistent trend, the results were just outside the error values. To improve on these results, the clonogenic assay could be used instead of the growth assay used in this thesis. This assay may be more sensitive and thus could be used to quantify shorter time periods when exposure to a test compound may be important.
Since the active test compounds exerted their synergistic effect during the first 24 hours after drug removal, cycloheximide, a protein synthesis inhibitor, and actinomycin D, an inhibitor of transcription and translation, were used to try and block the synergistic effect. However, there was no inhibition of the enhanced toxic effect when they were used, separately, in combination with an active test compound after adriamycin exposure.
Further studies could be performed to investigate the effect of synchronising cells in specific phases of the cell cycle. If cells were synchronised in, for example, mitosis and pulse treated with a chemotherapeutic drug, followed by exposure to an active test compound, would there be an increase or decrease in sensitivity? In these experiments the cell cycle progression could be followed using flow cytometry and apoptotic events could be examined by time-lapse videomicroscopy.
In order to further investigate the role of these test compounds, flow cytometric analysis was used to determine the cell cycle distribution in DLKP-SQ, a human lung carcinoma clonal cell line, pulse treated with adriamycin, vincristine or 5-fluorouracil for 2 hours alone or with subsequent exposure to the test compounds for 24 hours. U-l (active in the combination assay) on its own was shown to induce a transient G^S arrest but there was no apparent effect on the cell cycle distribution using A -l (inactive) or N-l (active). U-l or N-l in combination with adriamycin caused an increased delay in the Gj phase and the S phase compared to adriamycin alone. This delay was not observed with adriamycin plus A -l treatment. U-l or N-l in combination with vincristine, showed an increased G2/M arrest compared to vincristine treated cells alone. This G2/M arrest was expected since vincristine is a mitotic inhibitor. Vincristine plus A -l in combination did show a slight cell cycle delay in Gt/S at 12 - 15 hours but this was not as striking as in U-l or N-l treated
227

cells. DLKP-SQ treated with 5-fluorouracil alone and in combination with U-l showed no effect on the cell cycle distribution.
These pulse treatment experiments were repeated using increasing concentrations of adriamycin or vincristine. These results showed that there was an increased Gi/S phase arrest, a delay in S and a G2/M arrest, with increasing concentrations of adriamycin. Increasing concentrations of vincristine showed a decrease in the Gj peak and an increased G2/M peak representing an increased G2/M arrest as compared to untreated cells. These results suggest that the effect of U-l and N-l in combination with a chemotherapeutic drug (adriamycin and vincristine but not 5-fluorouracil), may mimic higher chemotherapeutic drug combinations. HPLC analysis of cells treated with drug could be used to assay the levels of a chemotherapeutic drug and the test compound. This would demonstrate if there was an increased accumulation of chemotherapeutic drug in samples treated with chemotherapic drug plus an active test compound as compared to chemotherapeutic treatment alone.
Time lapse videomicroscopic studies of the above combinations were also undertaken, and the rates of apoptosis and mitosis measured. Apoptosis occurred within 24 hours with vincristine and the rate of apoptosis was higher in the combination. Cells underwent apoptosis 24 hours after treatment with adriamycin but there was no significant difference between the apoptotic rate of the cells treated with adriamycin alone compared to the combination. This was surprising given the observed enhancement of toxicity in the 7 day toxicity assay.
Further investigations could be performed to try to determine at what stage of the cell cycle DLKP-SQ undergo apoptosis. These experiments would attempt to explain the observation that the active test compounds enhanced the toxicity of vincristine to a greater extent than adriamycin, and why there seemed to be no difference in the rate of apoptosis in adriamycin alone and adriamycin plus U-l treated samples. An observation that could be further investigated is the fact that apoptosis begins 24 hours following adriamycin exposure, however the test compounds only enhance adriamycin toxicity during the initial
228

24 hours after adriamycin is removed. A possible explanation is that the active test compounds may enhance apoptosis at an early stage in the apoptotic pathway. This could be investigated by determining the expression of proteins involved in early stages of apoptosis e.g. members of the bcl-2 family.
To study if the combination effect was due to interference with proteins controlling cell cycle progress, cyclin E/CDK2 kinase activity was assayed and the levels of cyclin E and CDK2 were determined using western blotting. The levels of cyclin E were not elevated in U-l treated samples as compared to the control, while the kinase activity of the cyclin E/CDK2 did increase over time. In contrast, the levels of cyclin E in adriamycin alone and adriamycin plus U-l treated samples increased significantly compared to the control and U-l samples but the kinase activity of adriamycin and adriamycin plus U-l decreased. This increase in protein levels but decrease in kinase activity suggests that cyclin E/CDK2 activity was inhibited. Inhibition of cyclin E/CDK2 activity would lead to an arrest in G1 and a delay in the S phase transition. Future work investigating the role of cyclin E and CDK2 proteins in vincristine treated cells would be very interesting. Although cyclin E is one protein that controls the Gj/S transition (see Section 1.3.1), Gt arrest may also be due to the inhibition of Rb, cyclin D1-CDK4/6 and/or by the induction of p21, p27, pl6 and other CKIs which inhibit cyclin-CDK complexes. Some of these proteins may be involved in the Gl/S delay induced by adriamycin and would be interesting proteins to investigate.
229

References

Abbadie, C., Kabrun, N., Bouali, F., Smardova, J., Stehlin, D. and Vandenbunder, B.(1993) High levels of c-rel expression are associated with programmed cell death in the developing avian embryo and in bone marrow cell in vitro. Cell 75 899-912.
Ackerman, P., Glover, C. V. and Osheroff, N. (1985) Phosphorylation of DNA topoisomerase II by casein kinase II: modulation of eukaryotic topoisomerase II activity in vitro. PNAS 82 3164-3168.
Ackerman, P., Glover, C. V. and Osheroff, N. (1988) Phosphorylation of DNA topoisomerase II in vivo and total homogenates of Drosophila Kc cells. The role of casein kinase II. J. Biol. Chem. 263 12653-12660.
Alberts, B., Bray, D., Lewis, J., Raff, M., Roberts, K. and Watson, J. D. (1994) Molecular Biology of the Cell, Garland Publishing Inc.
Allsopp, T. E., Wyatt, S., Paterson, H. F. and Davies, A. M. (1993) The protooncogene bcl-2 can selectively rescue neurotrophic factor-dependent neurons from apoptosis. Cell 73 295-307.
Asiedu, C., Biggs, J., Lilly, M. and Kraft, A. S. (1995) Inhibition of leukemic cell growth by the protein kinase C activator bryostatin 1 correlates with the dephosphorylation of cyclin-dependent kinase 2. Can. Res. 55 3716-3720.
Barlogie, B., Drewinko, B., Johnston, D. A. and Freireich, E. J. (1976) The effect of adriamycin on the cell cycle traverse of a human lymphoid cell line. Can. Res. 36 1975- 1979.
Barr, P. J. and Tomei, L. D. (1994) Apoptosis and its role in human disease. Bio/technology J_2 487-493.
Bernhard, E. J., Maity, A., Muschel, R. J. and McKenna, W. G. (1994) Increased expression of cyclin B 1 mRNA coincides with diminished G2-phase arrest in irradiated HeLa cells treated with staurosporine or caffeine. Radiat. Res. 140 393-400.
Bertram, J., Palfner, K., Killian, M., Brysch, W., Schlingensiepen, K. H., Hiddemann, W. and Kneda, M. (1995) Reversal of multiple drug resistance in vitro by phosphorothioate oligonucleotides and ribozymes. Anti-Canc. D. 6 124-134.
231

Bertrand, R., Kerrigan, D., Sarang, M. and Pommier, Y. (1991) Cell death induced by topoisomerase inhibitors: role of calcium in mammalian cells. Bioch. Pharm. 42(1) 77- 85.
Bisset, D., McLaughlin, K., Kelland, L. R. and Brown, R. (1993) Cisplatin-DNA damage recognition proteins in human tumour extracts. Br. J. Cane. 67 742-748.
Blight, M. A. and Holland, I. B. (1990) Structure and function of hemolysin B, P- glycoprotein and other members of a novel family of membrane translocators. Molecular Microbiol. 4 873-880.
Boise, L. H., Gonzalez-Garcia, M., Postema, C. E., Ding, L., Lindsten, T., Turka, L. A., Mao, X., Nunez, G. and Thompson, C. (1993) Bcl-x, a bcl-2-related gene that functions as a dominant regulator of apoptotic death. Cell 74 597-608.
Boyd, J. M., Gallo, G. J., Elangovan, B., Houghton, A. B., Malstrom, S., Avery, B. J., Ebb, R. G., Subramanian, T., Chittenden, T., Lutz, R. J. and Chinnadurai, G. (1995) Bipl, a novel death-inducing protein shares a distinct sequence motif with Bcl-2 family proteins and interacts with viral and cellular survival-promoting proteins. Oncogene 11(9) 1921-1928.
Bunch, R. T., Creswell, D. and Eastman, A. (1994) The effect of caffeine on G2/M transition in CHO/UV41 cells. Proceedings of the American Association for Cancer Research 35 26.
Burt, R. K. and Thorgeirsson, S. S. (1988) Coinduction of MDR1 multidrug resistance and cytochrome P450 in rat liver by xenobiotics. J. Nat. Cane. 80 1383-1386.
Byfield, J. E., Murnane, J., Ward, J. F., Calabro-Jones, P., Lynch, M. and Kulhanian, F. (1981) Mice, men, mustards and methylated xanthines: the potential role of caffeine and related drugs in the sensitization of human tumours by alkylating agents. Br. J. Cane. 43 669-683.
Campain, J. A., Padmanabhan, R., Hwang, J., Gottesman, M. M. and Pastan, I. (1993) Characterisation of an unusual mutant of human melanoma cells resistant to anticancer drugs that inhibit topoisomerase II. J. Cell Physiol. 155 414-425.
Canman, C. E., Wolff, A. C., Chen, C. Y., Fomace, A. J. J. and Kastan, M. B. (1994) The p53-dependent Gi cell cycle checkpoint pathway and ataxia-telangiectasia. Can. Res. 54 5054-5058.
232

Chan, V. T. W., Ng, S., Eder, J. P. and Schnipper, L. E. (1993) Molecular cloning and identification of a point mutation in the topoisomerase II cDNA from an etopside- resistant Chinese hampster ovary cell line. J. Biol. Chem. 268 2160-2165.
Chellappan, S. P., Hiebert, S., Mudryj, M., Horowitz, J. M. and Nevins, J. R. (1991) Independent binding of the retinablastoma protein and p i07 to the transcription factor E2F. Cell 65 1053-1061.
Chen, C. J., Clark, D., Ueda, K., Pastan, I., Gottesman, M. M. and Roninson, I. B.(1986) Internal duplication and homology with bacterial transport proteins in the MDR1 (P-glycoprotein) gene from MDR cells. Cell 47 381-389.
Chen, C. Y., Oliner, J. D., Zhan, Q., Fornace, A. J. J., Vogelstein, B. and Kastan, M. B.(1994) Interactions between p53 and MDM2 in a mammalian cell cycle checkpoint pathway. PNAS 91 2684-2688.
Chen, G., Shi, L. F., Litchfield, D. W. and Greenburg, A. H. (1995) Rescue from granzyme B-induced apoptosis by weel kinase. J. Exp. Med. 181(6) 2295-2300.
Chen, J., Jackson, P. K., Kirschner, M. W. and Dutta, A. (1995) Separate domains of p21 involved in the inhibition of Cdk kinases and PCNA. Nature 374 386-388,
Chen, X., Bargotti, J. and Prives, C. (1995) p53,through p21 (WAF1/CIP1), induces cyclin D1 synthesis. Can. Res. 55 4257-4263.
Chen, Y. Q., Cipriano, S. C., Sarkar, F. H., Ware, J. L. and Arenkiel, J. M. (1995) p53- independent induction of p21 (WAF1) pathway is preserved during tumor progression. Int. J. Oncol. 7 889-893.
Chen-Levy, X. and Cleary, M. L. (1990) Membrane topology of the bcl-2 proto- oncogenic protein demonstrated in vitro. J. Biol. Chem. 265 4929-4933.
Cheng, X., Pantelias, G. E., Okayasu, R., Cheong, N. and Iliakis, G. (1993) Mitosis- promoting factor activity of inducer mitotic cells may affect radiation yield of interphase chromosome breaks in the premature chromosome condensation assay. Can. Res. 53 5592-5596.
233

Chittenden, T., Flemmington, C., Houghton, A. B., Chinnadurai, G. and Lutz, R. J.(1995) A conserved domain in bak, distinct from BH1 and BH2, mediates cell death and protein binding functions. EMBO J. 14(22) 5589-5596.
Chittenden, T., Harrington, E. A., O'Connor, R., Flemington, C., Lutz, R. J., Evan, G.I. and Guild, B. C. (1995) Induction of apoptosis by the bcl-2 homologue Bak. Nature 374 733-736.
Chou, J. and Chou, T. C. (1987) Dose-effect analysis with microcomputers. Cambridge, England, Biosoft.
Chou, T. C. and Talalay, P. (1983) Analysis of combined drug effects: a new look at a very old problem. Trends Phar. 4 450-454.
Chou, T. C. and Talalay, P. (1984) Quantitiative analysis of dose-effect relationships: the combined effects of multiple drugs or enzyme inhibitors. Adv. Enzyme 22 27-55.
Chugani, D. C., Rome, L. H. and Kedersha, N. L. (1993) Evidence that vault ribonucleoprotein particles localise to the nuclear pore complex. J. Cell Sci. 106 23-29.
Clarke, A. R., Purdie, C. A., Harrison, D. J., Morris, R. G., Bird, C. C., Hooper, M. L. and Wyllie, A. H. (1993) Thymocyte apoptosis induced by p53-dependent and independent pathways. Nature 362 849-852.
Cleary, I. (1995) Drug accumulation studies in multiple drug resistant human cell lines. PhD Dublin City University.
Cole, S. P. C., Bhardwaj, G., Gerlach, J. H., Mackie, J. E., Grant, C. E., Almquist, K. C., Stewart, A. J., Kurz, E. U., Duncan, A. M. V. and Deeley, R. G. (1992) Overexpression of a transporter gene in a multidrug-resistant human lung cancer cell line. Science 258 1650-1653.
Cole, S. P. C., Sparks, K. E., Fraser, K., Loe, D. W., Grant, C. E., Wilson, G. M. and Deeley, R. G. (1994) Pharmacological characterisation of multidrug resistant MRP- transfected human tumor cells. Can. Res. 54 5902-5910.
Connolly, D. T., Knight, M. B., Harakas, N. K., Wittwer, A. J. and Feder, J. (1986) Determination of the number of endothelial cells in culture using an acid phosphatase assay. Analyt. Bioc. 152 136-140.
234

Corcoran, G. B., Fix, L., Jones, D. P., Treinen Moslen, M., Nicotera, P., Oberhammer,F. A. and Buttyan, R. (1994) Apoptosis: Molecular control point in toxicity. Tax. Appl. Ph. 128 169-181.
Cordon-Cardo, C., O'Brien, J. P., Boccia, J., Casals, D., Bertino, J. R. and Melamed, M. R. (1990) Expression of the multidrug resistance gene product (P-glycoprotein) in human normal and tumor tissues. J. Hist. Cyto. 38 1277-1287.
Cross, S. M., Sanchez, C. A., Morgan, C. A., Schimke, M. K., Ramel, S., Idzerda, R. L., Raskind, W. H. and Reid, B. J. (1995) A p53-dependent mouse spindle checkpoint. Science 267 1353-1356.
Crown, J., Hakes, T., Reichman, B., Lebwohl, D., Gilewski, T., Surbone, A., Currie, V., Yao, T. J., Hudis, C., Seidman, A. and Norton, L. (1993) Phase II trial of carboplatin and etopside in metastatic breast cancer. Cancer 71.(4) 1254-1257.
D'Arpa, P., Beardmore, C. and Liu, L. F. (1990) Involvement of nucleic acid synthesis in cell killing mechanisms of topoisomerase poisons. Can. Res. 50 6919-6924.
Daly, C., Coyle, S., McBride, S., O'Driscoll, L., Daly, N., Scanlon, K. and Clynes, M.(1996) mdr\ Ribozyme mediated reversal of the multi-drug resistant phenotype in human lung cell lines Cytotechnology 19(3) 199-205.
Danks, M. K., Schmidt, C. A., Deneka, D. A. and Beck, W. T. (1989) Increased ATP requirement for activity of and complex formation by DNA topoisomerase II from human leukemic CCRF-CEM cells selected for resistance to tenopside. Cancer Commun. 1 101-109.
Dano, K. (1973) Active outward transport of daunomycin in resistant Ehrlich ascites tumor cells Biochim. Biophys. Acta 323 466-483.
Darkin, S. J. and Ralph, R. K. (1989) A protein factor that enhances amsacrine- mediated formation of topoisomerase II-DNA complexes in murine mastocytoma cell nuclei. Biochim. Biophys. Acta 1007 295-300.
Darkin-Rattray, S. J. and Ralph, R. K. (1991) Evidence that a protein kinase enhances amsacrine mediated formation of topoisomerase II-DNA complexes in murine mastocytoma cell nuclei. Biochim. Biophys. Acta 1088 285-291.
235

Das, S. K., Lau, C. C. and Pardee, A. B. (1982) Abolition by cycloheximide of caffeine- enhanced lethality of alkylating agents in hampster cells. Can. Res. 42 4499-4504.
Datta, R., Hass, R., Gunji, H., Weichselbaum, R. and Kufe, D. (1992) Down-regulation of cell cycle control genes by ionizing radiation. Cell Growth 3 637-644.
De Isabella, P., Capranico, G., Binaschi, M., Tinelli, S. and Zunnio, F. (1990) Evidence of DNA-topoisomerasell-dependent mechanisms of multidrug resistance in P388 leukemia cells. Mol. Pharmacol. 37 11-16.
De Tinguy-Moreaud, E., Pourquier, P., Montaudon, D. and Robert, J. (1994) Relationships between DNA damage and growth inhibition induced by topoisomerase II- interfering drugs in doxorubicin-sensitive and -resistant rat glioblastoma cells. AnticancerRes. 14 99-104.
Deffie, A. M., McPherson, J. P., Gupta, R. S., Hedley, D. W. and Goldenberg, G. J.(1992) Multifactorial resistance to antineoplastic agents in drug-resistant P388 murine leukemia, Chinese hampster ovary and human HeLa cells, with emphasis on the role of DNA topoisomerase II. Biochem. Cell Biol. 70 354-364.
DeGraff, W., Hahn, S. M., Mitchell, J. B. and Krishna, M. C. (1994) Free radical modes of cytotoxicity of adriamycin and streptonigrin. Bioch. Pharm. 48(7) 1427-1435.
Del Bino, G., Skierski, J. S. and Darzynkiewicz, Z. (1991) The concentration- dependent diversity of effects of DNA topoisomerase I and II inhibitors on the cell cycle of HL-60 cells. Exp. Cell Re. 195 485-491.
Demarcq, C., Bunch, R. T., Creswell, D. and Eastman, A. (1994) The role of cell cycle progression in cisplatin-induced apoptosis in Chinese hampster ovary cells. Cell Growth 5 983-993.
DeVore, R. F., Corbett, A. H. and Osheroff, N. (1992) Phosphorylation of topoisomerase II by casein kinase II and protein kinase C: Effects on enzyme mediated DNA cleavage/religation and sensitivity to the antineoplastic drugs etopside and 4'-(9- acridinylamino)methane-sulfon-m-anisidide. Can. Res. 52 2156-2161.
DeWitt, D. and Smith, W. L. (1995) Yes, but do they still get headaches? Cell 63 345-348.
236

Dive, C. and Hickman, J. A. (1991) Drug-target interactions: only the first step in the commitent to programmed cell death? Br. J. Cane. 64 192-196.
Dive, C. and Wyllie, A. H. Apoptosis and cancer chemotherapy. Oxford, Blackwell Scientific. 21-56,
Dole, M. G., Jasty, R., Cooper, M. J., Thompson, C. B., Nunez, G. and Castle, V. P.(1995) Bcl-xL is expressed in neuroblastoma cells and modulates chemotherapy-induced apoptosis. Can. Res. 55 2576-2582.
Dole, M. G., Nunez, G., Merchant, A. K., Maybaum, J., Rode, C. K., Bloch, C. A. and Castle, V. A. (1994) Bcl-2 inhibits chemotherapy-induced apoptosis in neuroblastoma. Can. Res. 54 3253-3259.
Donaldson, K. L., Goolsby, G., Kiener, P. A. and Wahl, A. F. (1994) Activation of p34cdc2 coincident with taxol-induced apoptosis. Cell Growth 5 1041-1050.
Donaldson, K. L., Goolsby, G. L. and Wahl, A. F. (1994) Cytotoxicity of the anticancer agents cisplatin and taxol during cell proliferation and the cell cycle. Int. J. Cancer 57 847-855.
Dou, Q. P., An, B. and Yu, C. (1995) Activation of cyclin E-dependent kinase by DNA-damage signals during apoptosis. Biochemical and Biophysical Research Communications 214(3) 771-780,
Downes, C. S., Clarke, D. J., Mullinger, A. M., Gimmenez-Ablan, J. F., Creighton, A. M. and Johnson, R. T. (1994) A topoisomerase II-dependent G2 cycle checkpoint in mammalian cells. Nature 372 467-470.
Drake, F. H., Zimmerman, J. P., McCabe, F. L., Bartus, H. F., Per, S. R., Sullivan, D. M., Ross, W. E., Mattern, M. R., Johnson, R. K., Crooke, S. T. and Mirabelli, C. K. (1987) Purification of topoisomerase II from amsacrine-resistant P388 leukemia cells. J. Biol. Chem. 262 16739-16747.
Dubrez, L., Goldwasser, F., Genne, P., Pommier, Y. and Solary, E. (1995) The role of cell cycle regulation and apoptosis triggering in determining the senstivity of leukemic cells to topoisomerase I and II inhibitors. Leukemia 9 1013-1024.
237

Dulic, V., Kaufmann, W. K., Wilson, S. J., Tisty, T. D., Lees, E., Harper, W. J., Elledge, S. J. and Reed, S. I. (1994) p53-dependent inhibition of cyclin-dependent kinase activities in human fibroblasts during radiation-induced Gi arrest. Cell 76 1013-1023.
Dulic, V., Lees, E. and Reed, S. I. (1992) Association of human cyclin E with a periodic Gi-S phase protein kinase. Science 257 1958-1961.
Eblen, S. T., Fautsch, M. P., Burnette, R. J., Snyder, M. and Leof, E. B. (1995) Dissociation of p34cdc2 complex formation from phosphorylation and histone HI kinase activity. Can. Res. 55 1994-2000.
Enoch, T. and Norbury, C. (1995) Cellular responses to DNA damage: cell-cycle checkpoints, apoptosis and the roles of p53 and ATM. TIBS 20 426-430.
Erlichman, C., Moore, M., Thiessen, J. J., Kerr, I. G., Walker, S., Goodman, P., Bjarnason, G., DeAngelis, C. and Bunting, P. (1993) Phase I pharmacokinetic study of cyclosporin A combined with doxorubicin. Can. Res. 53 4837-4842.
Evan, G., Harrington, E., Fanidi, A., Land, H., Amati, B. and Bennett, M. (1994) Integrated control of cell proliferation and cell death by the c-myc oncogene. Phil. Trans. R. Soc. Lond. B. Biol. Sci. 345 269-275.
Evan, G., Wyllie, A. H., Gilbert, C. S., Littlewood, T. D., Land, H., Brooks, M., Waters, C. M., Penn, L. Z. and Hancock, D. C. (1992) Induction of apoptosis in fibroblasts by c-myc protein. Cell 69 119-128.
Evans, H. J. (1993) Molecular genetics aspects of human cancers: The 1993 Frank Rose lecture. Br. J. Cane. 68 1051-1060.
Ewen, M. E., Sluss, H. K., Whitehouse, L. L. and Livingston, D. M. (1993) TGF-13 inhibition of Cdk4 synthesis is linked to cell cycle arrest. Cell 74 1009-1020.
Fan, S., El-Deiry, W. S., Bae, I., Freeman, J., Jondle, D., Bhatia, K., Fornace, A. J. J., Magrath, I., Kohn, K. W. and O'Connor, P. M. (1994) p53 gene mutations are associated with decreased sensitivity of human lymphoma cells to DNA damaging agents. Can. Res. 54 5824-5830.
238

Farrow, S. N., White, J. H. M., Martinou, I., Raven, T., Pun, K.-T., Grinham, C. J., Martinou, J.-C. and Brown, R. (1995) Cloning of a bcl-2 homologue by interaction with adenovirus E1B 19K. Nature 374 731-733.
Felmelee, T., Pellett, S. and Welch, R. A. (1985) Nucleotide sequence of an Escherichia coli chromosomal hemolysin. J. Bacteriol. 163 94-105.
Ferguson, P. J., Fisher, M. H., Stephenson, J., Li, D., Zhou, B. and Cheng, Y. (1988) Combined modalities of resistance in etopside-resistant human KB cells. Can. Res. 48 5956-5964.
Fernandes, D. J., Danks, M. K. and Beck, W. T. (1990) Decreased nuclear matrix DNA topoisomerase II in human leukemia cells resistant to VM-26 and m-AMSA. Biochem. 29 4235-4241.
Fernandes, R. S. and Cotter, T. G. (1994) Apoptosis or necrosis - Intracellular levels of glutathione influence mode of cell death. Bioch. Pharm. 48(4) 675-681.
Fingert, H. J., Chang, J. D. and Pardee, A. B. (1986) Cytotoxic, cell cycle, and chromosomal effects of methylxanthines in human tumor cells treated with alkylating agents. Can. Res. 46 2463-2467.
Fisher, R. P. and Morgan, D. O. (1994) A novel cyclin associates with M015/CDK7 to form the CDK activating kinase. Cell 78 713-724.
Fojo, A. T., Ueda, K., Salmon, D. J., Poplack, D. G., Gottessman, M. M. and Pastan, I. (1987) Expression of a multidrug resistance gene in human tumors and tissues. Proceedings of the American Association for Cancer Research 84 265-259.
Foote, S. T., Thompson, J. K., Cowman, A. F. and Kemp, D. J. (1989) Amplification of the multidrug resistance gene in some chloroquine resistant isolates of P.falciparum. Cell 57 921-930.
Ford, J. M. (1995) Modulators of multidrug resistance. Oncology and Hematology 9(2) 337-361.
Fotedar, R., Fitzgerald, P., Rousselle, T., Cannella, D., Doree, M., Messier, H. and Fotedar, A. (1996) p21 contains independent binding sites for cyclin and cdk2: Both sites are required to inhibit cdk2 kinase activity. Oncogene 12 2155-2164.
239
Fotedar, R., Flatt, J., Gupta, S., Margolis, R. L. and Fitzgerald, P. (1994) Molecular & Cell Biology L5 932-,
Fotedar, R., Flatt, J., Gupta, S., Margolis, R. L., Fitzgerald, P., Messier, H. and Fotedar, A. (1995) Activation-induced T-cell death is cell cycle dependent and regulated by cyclin B Mol. Cell Biol. 15(2) 932-942.
Freeman, R. S., Estus, S. and Johnson Jr., E. M. (1994) Analysis of cell cycle-related gene expression in postmitotic neurons: Selective induction of cyclin D1 during programmed cell death. Neuron 12 343-355.
Friedberg, E. C. (1985) DNA Repair New York, Freeman.
Gekeler, V., Frese, G. and Noller, A. (1992) Mdrl/P-glycoprotein, topoisomerase, and glutathione-S-transferase-71 gene expression in primary and relapsed state adult and childhood leukaemia. Br. J. Cane. 66 507-517.
Gewirtz, D. A. (1993) DNA damage, gene expression, growth arrest and cell death. Oncol. Res. 5(10/11) 397-408.
Girinsky, T., Koumenis, C., Graeber, T. G., Peehl, D. M. and Giaccia, A. J. (1995) Attenuated response of p53 and p21 in primary cultures of human prostatic epithelial cells exposed to DNA-damaging agents. Can. Res. 55 3726-3731.
Glisson, B. R., Gupta, R., Smallwood-Kentro, S. and Ross, W. (1986) Characterization of acquired epipodophyllotoxin resistance in Chinese hampster ovary cell line: Loss of drug-stimulated DNA cleavage activity. Can. Res. 46 1934-1938.
Gorbsky, G. J. (1994) Cell cycle progression and chromosome segregation in mammalian cells cultured in the presence of the topoisomerase inhibitors ICRF-187 [(+)- l,2-bis(3,5-dioxopiperazinyl-l-yl)propane; ADR-529] and ICRF-159 (Razoxane). Can. Res. 54 1042-1048.
Gorczyca, W., Gong, J., Ardelt, B., Traganos, F. and Darzynkiewicz, Z. (1993) The cell cycle related differences in susceptibility of HL-60 cells to apoptosis induced by various antitumor agents. Can. Res. 53 3186-3192.
240

Gros, P., Neriah, Y. B., Croop, J. M. and Housman, D. E. (1986) Isolation and expression of a complementary DNA that confers multidrug resistance. Nature 323 728- 731.
Hain, J., Crompton, N. E. A., Burkart, W. and Jaussi, R. (1993) Caffeine release of radiation induced S and G2 phase arrest in V79 hampster cells: Increase of histone messenger RNA levels and p34cdc2 activation. Can. Res. 53 1507-1510.
Hain, J., Jaussi, R. and Wurgler, F. E. (1994) Effects of ionizing radiation and caffeine treatment on cyclin dependent kinase complexes in V79 hampster cells. Cell Signal 6(5) 539-550.
Hall, P. A. and Lane, D. P. (1994) Genetics of growth arrest and cell death: Key determinants of tissue homeostasis. Eur. J. Cane. 30A(13) 2001-2012.
Han, J., Sabbatini, P., Perez, D., Rao, L., Modha, D. and White, E. (1996) The E1B 19K protein blocks apoptosis by interacting with and inhibiting the p53-inducible and death-promoting Bax protein. Genes & Development 10(4) 461-477.
Han, J. and White, E. (1995) Induction of apoptosis by the E1B 19K binding protein, Nbk. In preparation .
Hannon, G. J., Demetrick, D. and Beach, D. (1993) Isolation of Rb-related pl30 through its interaction with CDK2 and cyclins. Genes & Development 7 2378-2391.
Harrison, D. J. (1995) Molecular mechanisms of drug resistance in tumours J. Pathology 175 7-12.
Heenan, M. (1994) Clonal variation in multidrug resistant human cell populations PhD Dublin City University.
Hengartner, M. O. and Horwitz, H. R. (1994) C.eleeans cell survival gene ced-9 encodes a functional homolog of the mammalian proto-oncogene bcl-2. Cell 76 665-676.
Hermeking, H., Funk, J. O., Reichert, M., Ellwart, J. W. and Eick, D. (1995) Abrogation of p53-induced cell cycle arrest by c-myc: evidence for an inhibitor of p21,WAFl. Oncogene J_1 1409-1415.
241

Heusel, J. W., Wesselschmidt, R. L., Shresta, S., Russell, J. H. and Ley, T. J. (1994) Cytotoxic lymphocytes require granzyme B for the rapid induction of DNA fragmentation and apoptosis in allogeneic target cells. Cell 70 977-987.
Higgins, C. (1989) Export import family expands. Nature 340 342-346.
Hoang, A. T., Cohen, K. J., Barrett, J. F., Bergstrom, D. A. and Dang, C. V. (1994) Participation of cyclin A in Myc-induced apoptosis. PNAS 91 6875-6879.
Holm, P. S., Scanlon, K. J. and Dietal, M. (1994) Reversion of multidrug resistance in the P-glycoprotein-positive human pancreatic cell line (EPP85-181RDB) by introduction of a hammerhead ribozyme. Br. J. Cane. 70 239-243.
Hsiang, Y. H. (1989) Arrest of replication forks by drug-stabilised topoisomerase I- DNA cleavable complexes as a mechanism of cell killing by campothecin. Can. Res. 49 5077-5082.
Hyde, S. C., Emsley, P., Hartshorn, M. J., Mimmach, M. M., Gileadi, U., Pearce, S. R., Gallagher, M. P., Gill, D. R., Hubbard, R. E. and Higgins, C. F. (1990) Structural model of ATP-binding proteins associated with cycstic fibrosis, multidrug resistance and bacterial transport. Nature 346 362-365.
Ishida, R., Sato, M., Narita, T., Utsumi, K. R., Nishimoto, T., Morita, T., Nagata, H. and Andoh, T. (1994) Inhibition of DNA topoisomerase II by ICRF-193 induces polyploidization by uncoupling chromosome dynamics from other cell cycle events. ./. Cell Biol. 126(6) 1341-1351. "
Izquierdo, M. A. (1996) Non-Pgp related multidrug resistance PhD. Vrije Universiteit.
Izquierdo, M. A., Scheffer, G. L., Flens, M. J., Giaccone, G., Broxterman, H. J., Meijer, C. J. L. M., van der Valk, P. and Scheper, R. J. (1996) Broad distribution of the multidrug resistance related vault protein LRP in normal human tissues and tumors. American Journal of Pathology In Press.
Izquierdo, M. A., Shoemaker, R. H., Flens, M. J., Scheffer, G. L., Wu, L., Prather, T. R. and Scheper, R. J. (1996) Overlapping phenotypes of multidrug resistance among panels of human cancer-cells lines. Int. J. Cancer 65 1-8.
242

Izquierdo, M. A., van der Zee, A. G. J., Vermorken, J. B., van der Valk, P., Belien, J. A. M., Giaccone, G., Scheffer, G. L., Flens, M. J., Pinedo, H. M., Kenemans, P., Meijer, C. J. L. M., de Vries, E. G. E. and Scheper, R. J. (1995) Drug resistance-associated marker LRP for prediction of response to chemotherapy and prognoses in advanced ovarian carcinoma. J. Nat. Cane. 87 1230-1237.
Jedlitschky, G., Leier, I., Buchholz, U., Barnouin, K., Kurz, G. and Keppler, D. (1996) Transport of glutathione, glucuronate, and sulfate conjugates by the MRP gene-encoded conjugate export pump. Can. Res. 56 988-994.
Jordan, M. A., Thrower, D. and Wilson, L. (1992) Effects of vinblastine, podophyllotoxin and nocodazole on mitotic spindles. J. Cell Sci. 102 401-416.
Jordan, M. A., Thrower, D. and Wilson, S. (1991) Mechanism of inhibition of cell proliferation by vinca alkaloids. Can. Res. 512212-2222.
Kalwinsky, D. K., Look, A. T., Ducore, J. and Fridland, A. (1983) Effects of the epipodophyllotoxin VP-16-213 on cell cycle traverse, DNA synthesis, DNA strand size in cultures of human leukemic lymphoblasts. Can. Res. 43 1592-1597.
Kastan, M. B., Canman, C. E. and Leonard, C. J. (1995) p53, cell cycle control and apoptosis: Implications for cancer. Cane. Metast. 14 3-15.
Kastan, M. B., Onyekwere, O., Sidransky, D., Vogelstein, B. and Craig, R. W. (1991) Participation of p53 protein in the cellular response to DNA damage. Can. Res. 51 6304- 6311.
Kastan, M. B., Zhan, Q., El-Deiry, W. S., Carrier, F., Jacks, T., Walsh, W. V., Plunkett, B. S., Vogelstein, B. and Fornace, A. J. (1992) A mammalian cell cycle checkpoint pathway utilising p53 and GADD45 is defective in ataxia-telangiectasia. Cell 71587-597.
Kedersha, N. L., Heuser, J. E., Chugani, D. C. and Rome, L. H. (1991) Vaults III. Vault ribonucleoprotein particles open into flower-like structures with octagonal symmetry. J. Cell Biol. 112 225-235.
Kedersha, N. L., Miquel, M.-C., Bittner, D. and Rome, L. H. (1990) Vaults II. Ribonucleoprotein structures are highly conserved among higher and lower eukaryotes. J. Cell Biol. 110 895.
243

Kedersha, N. L. and Rome, L. H. (1986) Isolation and characterisation of a novel ribonucleoprotein particle: large structures contain a single species of small RNA.,/. Cell Biol. 103 699-709.
Kiehntopf, M., Brach, M. A., Licht, T., Petschauer, S., Karawajew, L., Kirschning, C. and Herrman, F. (1994) Ribozyme-mediated cleavage of the MDR-1 transcript restores chemo sensitivity in previously resistant cancer cells. EMBO J. 13.(19) 4645-4652.
King, R. W., Jackson, P. K. and Kirschner, M. W. (1994) Mitosis in transition Cell 79 563-571.
Knoblich, J, A., Sauer, K., Jones, L., Richardson, H., Saint, R. and Lehner, C. F. (1994) Cyclin E controls S phase progression and its down-regulation during Drosophila embryogenesis is required for the arrest of cell proliferation. Cell TL 107-120.
Korsmeyer, S. J. (1992) Bcl-2 initiates a new category of oncogenes: regulators of cell death. Blood 80 879-886.
Kozopas, K. M., Yang, T., Buchan, H., Zhou, P. and Craig, R. W. (1993) MCL1, a gene expressed in programmed myeloid cell differentiation, has sequence similiarity to BCL-2. PNAS 90 3516-3520.
Kranenburg, O., van der Eb, A. and Zantema, A. (1996) Cyclin D1 is an essential mediator of apoptotic neuronal cell death. EMBO J. 15(1) 46-54.
Krek, W., Ewen, M. E., Shirodkar, S., Arany, S., Kaelin, W. G. and Livingstone, D. M. (1994) Negative regulation of the growth-promoting transcription factor E2F-1 by a stably bound cyclin A-dependent protein kinase. Cell 78 161-172.
Krek, W. and Nigg, E. A. (1991) Differential phosphorylation of vertebrate p34cdc2 kinase at the Gi/S and G2/M transitions of the cell cycle: identification of major phosphorylation sites. EMBO J. 10 305-316.
Krishan, A. and Frei, E. (1976) Effect of adriamycin on the cell cycle traverse and kinetics of cultured human lymphocytes. Can. Res. 36 143-150.
Krishnamachary, N. and Center, M. S. (1993) The MRP gene associated with a non- P-glycoprotein multidrug resistance encodes a 190-kDa membrane bound glycoprotein. Can. Res. 53 3658-3661.
244

Kumar, S., Kinoshita, M., Noda, M., Copeland, N. G. and Jenkins, N. A. (1994) Induction of apoptosis by the mouse Nedd2 gene, which encodes a protein similar to the product of the Caenorhabditis elegans cell death gene ced-3 and the mammalian IL-1B- converting enzyme. Genes & Development 8 1613-1626.
Kung, A. L., Zetterburg, A., Sherwood, S. W. and Schimke, R. T. (1990) Cytotoxic effects of the cell cycle phase specific agents: Result of cell cycle perturbation. Can. Res. 50 7307-7317,
La Thangue, N. (1994) DP and E2F proteins: components of a heterodimeric transcription factor implicated in cell cycle control. Curr. Op. Cel. 6 443-450.
Lahti, J. M., Xiang, J., Heath, L. S., Campana, D. and Kidd, V. J. (1995) PITSLRE protein kinase activity is assaoiated with apoptosis. Mol. Cell Biol. 15(1) 1-11.
Lee, F. Y. F., Allalunis-Turner, M. J. and Siemann, D. W. (1987) Depletion of tumour versus normal glutathione by buthionine sulfoximine. Br. J. Cane. 56 33-38.
Lees, E., Faha, B., Dulie, V., Reed, S. I. and Harlow, E. (1992) Cyclin E/cdk2 and cyclin A/cdk2 kinases associate with p i07 and E2F in a temporally distinct manner. Genes & Development 6 1874-1885.
Lew, D. J., Dulic, V. and Reed, S. I. (1991) Isolation of three novel human cyclins by rescue of Gi cyclin (Cln) function in yeast. Cell 66 1197-1206.
Li, C. J., Friedman, D. J., Wang, C., Metelev, V. and Pardee, A. B. (1995) Induction of apoptosis in uninfected lymphocytes by HIV-1 tat protein. Science 268 429-431.
Lin, E. Y., Orlofsky, A., Berger, M.-S. and Prystowsky, M. B. (1993) Characterisation of A l, a novel hemopoietic-specific early response gene with sequence similarity to bcl-2. J. Immunol. 151 1979-1988.
Lin, Y. and Benchimol, S. (1995) Cytokines inhibit p53-mediated apoptosis but not p53-mediated Gi arrest. Mol. Cell Biol. 15(11) 6045-6054.
Ling, Y. H., Priebe, W. and Perez-Soler, R. (1993) Apoptosis induced by anthracycline antibiotics inP388 parent and multidrug-resistant cells. Can. Res. 53 1845-1852.
245
Liu, L. F. (1989) DNA topoisomerase poisons as antitumour drugs. Arrnu. Rev. Biochem. 58 351-375.
Liu, S. Y., Hwang, B. D., Haruna, M., Imakura, Y., Lee, K. H. and Cheng, Y. C. (1989) Podophyllotoxin analogs: effects on DNA topoisomerase II, tubulinpolymerization, human tumor KB cells, and their VP-16-resistant variants. Mol. Pharmacol. 36 78-82.
Lock, R. B. (1992) Inhibition of p34cdc2 kinase activation, p34cdc2 tyrosine dephosphorylation, and mitotic progression in Chinese hampster ovary cells exposed to etopside Can. Res. 52 1817-1822.
Lock, R. B., Galperina, O. V., Feldhoff, R. C. and Rhodes, L. J. (1994) Concentration- dependent differences in the mechanisms by which caffeine potentiates etopside cytotoxicity in HeLa cells Can. Res. 54 4933-4939.
Lock, R. B. and Keeling, P. K. (1993) Responses of HeLa and Chinese hampster ovary p34cdc2/cyclin-B kinase in relation to cell cycle perturbations induced by etopside Int. J. Oncol. 3 33-42.
Lock, R. B. and Ross, W. E. (1990) Inhibition of p34cdc2 kinase activity by etopside or irradiation as a mechanism of G2 arrest in Chinese hampster ovary cells. Can. Res. 50 3761-3766.
Lock, R. B. and Ross, W. E. (1990) Possible role for p34cdc2 kinase in etopside- induced cell death of Chinese hampster ovary cells Can. Res. 50 3767-3771.
Lotem, J. and Sachs, L. (1993) Regulation of bcl-2, c-myc, and p53 of susceptibility to induction of apoptosis by heat shock and cancer chemotherapy compounds in differentiation-competent and -defective myeloid leukemic cells. Cell Growth 4 41-47.
Lowe, S. W., Schmitt, E. M., Smith, S. W., Osborne, B. A. and Jacks, T. (1993) p53 is required for radiation-induced apoptosis in mouse thymocytes. Nature 362 847-849.
Lucke-Huhle, C. (1982) a-Irradiation-induced G2 delay: a period of cell recovery. Radiat. Res. 89 298-308.
246

Ludlow, J. W., Shon, J., Pipas, J. M., Livingston, D. M. and DeCaprio, J. A. (1990) The retinablastoma susceptibility gene product undergoes cell cycle dependent dephosphorylation and binding to and release from SV40 large T. Cell 60 387-396.
Maity, A., McKenna, W. G. and Muschel, R. J. (1995) Evidence for post-translational regulation of cyclin B1 mRNA in the cell cycle following irradiation in HeLa cells. EMBOJ. 14(3) 603-609.
Marks, D. I. and Fox, R. M. (1991) DNA damage, poly(ADP-ribosyl)ation and apoptotic cell death as a potential common pathway of cytotoxic drug action. Bioch. Pharm. 42 1859-1867.
Martin, A. and Clynes, M. (1991) Acid phosphatase: Endpoint for in vitro toxicity assays. In vitro Cell. Dev. Biol. 27A 183-184.
Martin, S. J., McGahon, A. J., Nishioka, W. K., La Face, D., Guo, X., Th'ng, J., Bradbury, E. M. and Green, D. G. (1995) p34cdc2 and apoptosis. Science 269 106-107.
Matsushime, H., Roussel, M. F., Ashmun, R. A. and Sherr, C. J. (1991) Colony- stimulating factor 1 regulates novel cyclins during the Gi phase of the cell cycle. Cell 65 701-713.
Mattern, J. and Volm, M. (1995) Resistance mechanisms in human lung cancer. Invas. Metas. 15 81-94.
McBride, S. (1995) Characterisation of clonal variants in a human lung carcinoma cell line: investigations into control of cell growth and differentiation. PhD Dublin City University.
McGahon, A., Bissonnette, R., Schmitt, M., Cotter, K. M., Green, D. R. and Cotter, T.G. (1994) BCR-ABL maintains resistance of chronic myelogenous leukemia cells to apoptotic cell death. Blood 83.1179-1187.
Mcllwrath, A. J., Vasey, P. A., Ross, G. M. and Brown, R. (1994) Cell cycle arrests and radio sensitivity of human tumor cell lines: Dependence on wild-type p53 for radiosensitivity. Can. Res. 54 3718-3722.
247

McKenna, W. G., Iliakis, G., Weiss, M. C., Bernhard, E. J. and Muschel, R. J. (1991) Increased G2 delay in radiation-resistant cells obtained by transformation of primary rat embryo cells with the oncogenes H-ras and v-myc. Radiat. Res. 125 283-287.
Meikrnatz, W., Gisselbrecht, S., Tam, S. and Schlegel (1994) Activation of cyclin A- dependent kinases during apoptosis. PNAS 9J_ 3754-3758.
Merry, D. E., Veis, D. J., Hickey, W. F. and Korsmeyer, S. J. (1994) Bcl-2 protein expression is widespread in the developing nervous system and retained in the adult PNS. Development 120 301-311.
Minn, A. J., Rudin, C. M., Boise, L. H. and Thompson, C. B. (1995) Expression of Bcl-xLcan confer a multidrug resistance phenotype. Blood 86(5) 1903-1910.
Miura, M., Zhu, H., Roteilo, R., Hartwieg, E. A. and Yuan, J. (1993) Induction of apoptosis in fibroblasts by IL-lß-converting enzyme, a mammalian homolog of theC.eleeans cell death gene ced 3. Cell 75 653-660.
Miyashita, T., Krajewski, S., Krajewska, M., Wang, H. G., Lin, H. K., Liebermann, D. A., Hoffman, B. and Reed, J. C. (1994) Tumor suppressor p53 is a regulator of bcl-2 and bax gene expression in vitro and in vivo. Oncogene 9 1709-1805.
Miyashita, T. and Reed, J. C. (1993) Bcl-2 oncoprotein blocks chemotherapy-induced apoptosis in a human leukemia cell line. Blood 8J_ 151-157.
Miyashita, T. and Reed, J. C. (1995) Tumor suppressor p53 is a direct transcriptional activator of the human bax gene. Cell 80 293-299.
Muller, R. (1995) Transcriptional regulation during the mammalian cell cycle. Trends Gen. H(5) 173-178.
Muschel, R. J., Zhang, H. B., Iliakis, G. and McKenna, W. G. (1991) Cyclin B expression in HeLa cells during the G2 block induced by ionizing radiation. Can. Res. 51 5113-5117.
Muschel, R. J., Zhang, H. B. and McKenna, W. B. (1993) Differential effect of ionizing radiation on the expression of cyclin A and cyclin B in HeLa cells. Can. Res. 53 1128- 1135.
248
Musk, S. R., Downes, C. S. and Johnson, R. T. (1988) Caffeine induces uncoordinated expression of cell cycle functions after ultraviolet irradiation. Accelerated cycle transit, sister chromatid exchanges, and premature chromosome condensation in a transformed Indian muntjac cell line. J. Cell Sci. 90 591-599.
Nagata, S. and Suda, T. (1995) Fas and Fas ligand: lpr and gld mutations. Immunology Today 16(1) 39-42.
Neefjes, J. J., Momburg, F. and Hammerling, G. J. (1993) Selective and ATP- dependent translocation of peptides by the MHC-encoded transporter. Science 261 769- 771.
Nguyen, M., Millar, D. G., Yong, V. W., Korsmeyer, S. J. and Shore, G. C. (1993) Targeting of bcl-2 to the mitochondrial outer membrane by a COOH-terminal signal anchor sequence. J. Biol. Chem. 268 25265-25268.
Norbury, C., MacFarlane, M., Fearnhead, H. and Cohen, G. M. (1994) Cdc2 activation is not required for thymocyte apoptosis. Biochemical and Biophysical Research Communications 202(3) 1400-1406.
Norbury, C. and Nurse, P. (1992) Animal cell cycles and their control. Annu. Rev. Biochem. 61 441-470.
O'Connor, P. M., Ferris, D. K., Hoffmann, I., Jackman, J., Draetta, G. and Kohn, K. W. (1994) Role of the cdc25C phosphatase in G2 arrest induced by nitrogen mustard. PNAS 91 9480-9484.
O'Connor, P. M., Ferris, D. K., Pagano, M., Draetta, G., Pines, J., Hunter, T., Longo,D. L. and Kohn, K. W. (1993) G2 delay induced by nitrogen mustard in human cells affects cyclin A/cdk2 and cyclin Bl/cdc2-kinase complexes differently. J. Biol. Chem. 268(11) 8298-8308.
O'Connor, P. M., Ferris, D. K., White, G. A., Pines, J., Hunter, T., Longo, D. L. and Kohn, K. W. (1992) Relationships between cdc2 kinase, DNA cross-linking, and cell cycle perturbations induced by nitrogen mustard. Cell Growth 3 43-52.
O'Connor, P. M., Jackman, J., Jondle, D., Bhatia, K., Magrath, I. and Kohn, K. W.(1993) Role of the p53 tumor suppressor gene in cell cycle arrest and radiosensitivity of burkitt's lymphoma cell lines. Can. Res. 53 4776-4780.
249

O'Connor, P. M., Wassermann, K., Sarang, M., Magrath, I., Bohr, V. A. and Kohn, K. W. (1991) Relationship between DNA cross-links, cell cycle, and apoptosis in burkitt's lymphoma cell lines differing in sensitivity to nitrogen mustard. Can. Res. 5J. 6550-6557.
Oberhammer, F. A., Hochegger, K., Froschl, G., Tiefenbacher, R. and Pavelka, M.(1994) Chromatin condensation during apoptosis is accomanied by degradation of lamin A + B, without enhanced activation of cdc2 kinase. J. Cell Biol. 126(4) 827-837.
Ohtsubo, M. and Roberts, J. M. (1993) Cyclin-dependent regulation of Gi in mammalian fibroblasts. Science 259 1908-1912.
Oliner, J. D., Pietenpol, J. A., Thiagalingam, S., Gyuris, J., Kinzler, K. W. and Vogelstein, B. (1993) Oncoprotein mdm2 conceals the activation domain of the tumor suppressor p53. Nature 362 857-860.
Oltvai, Z. N. and Korsmeyer, S. J. (1994) Checkpoints of dueling dimers foil death wishes. Cell 79 189-192.
Oltvai, Z. N., Milliman, C. L. and Korsmeyer, S. J. (1993) Bcl-2 heterodimerises in vivo with a conserved homolog, Bax, that accelerates programmed cell death. Cell 74 609-619.
Pardee, A. B. (1989) Gi events and regulation of cell proliferation. Science 246 603- 608.
Parker, L. L. and Piwnica-Worms, H. (1992) Inactivation of p34cdc2-cyclin B complex by the human Weel tyrosine kinase. Science 257 1955-1957.
Parker, L. L., Walter, S. A., Young, P. G. and Piwnica-Worms, H. (1993) Phosphorylation and inactivation of the mitotic inhibitor Weel by the niml/cdrl kinase. Nature 363 736-738.
Pastan, I. and Gottesman, M. M. (1991) Multidrug resistance. Ann. Rev. Med. 42 277-286.
Pastan, I., Gottesman, M. M., Ueda, K., Lovelace, E., Rutherford, A. V. and Willingham, M. C. (1988) A retrovirus carrying an MDR1 cDNA confers multidrug resistance and polarized expression of P-glycoprotein in MDCK cells. Proceedings of the American Association for Cancer Research 85 4486-4490.
250

Patel, J. and Rideout, D. (1992) Synergism and antagonism in cancer chemotherapy. Cane. J. 5(5) 254-266.
Perez, C., Pelayo, F., Vilaboa, N. E. and Aller, P. (1994) Caffeine attenuates the action of amsacrine and etopside in U-937 cells by mechanisms which involve inhibition of RNA synthesis. Int. J. Cancer 57 889-893.
Perry, M. E., Piette, J., Zawadzki, J. A., Harvey, D. and Levine, A. J. (1993) The mdm- 2 gene is induced in response to UV light in a p53-dependent manner. PNAS 90 11623- 11627.
Peter, M. and Herskowitz, I. (1994) Joining the complex: cyclin-dependent kinase inhibitory proteins and the cell cycle. Cell 79 181-184.
Pines, J. (1993) Cyclins and cyclin-dependent kinases: take your partners. TIBS 18 195- 197.
Piscitelli, S. C., Rodvold, K. A., Rushing, D. A. and Tewksbury, D. A. (1993) Pharmokinetics and pharmacodynamics of doxorubicin in patients with small cell lung cancer. Clin. Pharm. 53(5) 555-561.
Polyak, K., Kato, J. Y., Solomon, M. J., Sherr, C. J., Massague, J., Roberts, J. M. and Koff, A. (1994) p27Kipl, a cyclin-Cdk inhibitor, links transforming growth factor-B and contact inhibition to cell cycle arrest. Genes & Development 8 9-22.
Pratt, W. B., Ruddon, R. W., Ensminger, W. D. and Maybaum, J. (1994) The Anticancer Drugs Oxford, Oxford University Press.
Price, B. and Park, S. J. (1994) DNA damage increases the levels of MDM2 messenger RNA in wtp53 human cells. Can. Res. 54 896-899.
Quilletmary, A., Mansat, V., Duchayne, E., Come, M. G., Allouche, M., Bailly, J. D., Bordier, C. and Laurent, G. (1996) Daunorubicin-induced internucleosomal DNA fragmentation in acute myeloid cell lines. Leukemia 10(3) 417-425.
Rao, P. N. (1980) The molecular basis of drug-induced G2 arrest in mammmalian cells. Molec. Cell Biochem. 29 47-57.
251

Redmond, A. (1991) Multiple drug resistance in human tumor cells. PhD Dublin City University.
Reed, J. C. (1994) Bcl-2 and the regulation of programmed cell death. J. Cell Biol. 1241- 6 .
Riordan, J. R., Rommens, J. M., Kerem, B. S., Alon, N., Rozmahel, R., Grzelczak, J. and Zielenski, J. (1989) Identification of the cycstic fibrosis gene: cloning and characterisation of complementary DNA. Science 245 1066-1073.
Roninson, I. B., Chin, J. E., Choi, K., Gros, P., Housman, D. E., Fojo, A., Gottesman, M. M. and Pastan, I. (1986) Isolation of human MDR sequences amplified in multidrug resistant KB carcinoma cells. Proceedings of the American Association for Cancer Research 83 4538-4542.
Rottmann, M., Schroder, H. C., Gramzow, M., Renneisen, K., Kurelec, B., Dorn, A., Friese, U. and Muller, W. E. (1987) Specific phosphorylation of proteins in pore complex laminas from the sponge Geodia cvdonium by the homologue aggregation factor and phorbol ester. Role of protein kinase C in the phosphorylation of DNA topoisomerase II. EMBO J. 6 3939-3944.
Rowley, R., Hudson, J. and Young, P. G. (1992) The weel protein kinase is required for radiation-induced mitotic delay. Nature 356 353-355.
Russell, K. J., Wiens, L. W., Demers, G. W., Galloway, D. A., Pion, S. E. and Groudine, M. (1995) Abrogation of the G2 checkpoint results in differential radiosensitization of Gi checkpoint-deficient and Gi checkpoint-competent cells. Can. Res. 55 1639-1642.
Russo, P., Cimoli, G., Valenti, M., De Sessa, F., Parodi, S. and Pommier, Y. (1994) Induction of DNA double-strand breaks by 8-methoxycaffeine: cell cycle dependence and comparison with topoisomerase II inhibitors. Carcinogene. 15.(11) 2491-2496.
Safa, A. R., Glover, C. J., Sewell, J. L., Meyers, M. B., Biedler, J. K. and Felsted, R. L.(1987) Identification of the multidrug resistance related membrane glycoprotein as an acceptor for calcium channel blockers. J. Biol. Chem. 262 7884-7888.
Sander, M., Nolan, J. M. and Hsieh, T. S. (1984) A protein kinase activity tightly associated with Drosophila type II DNA topoisomerase PNAS 81(22) 6938-6942.
252

Scanlon, K. J., Ishida, H. and Kashani-Sabet, M. (1994) Ribozyme-mediated reversal of the multidrug-resistant phenotype. Proceedings of the American Association for Cancer Research 91 11123-11127.
Scheffer, G. L., Wijngaard, P. L. J., Flens, M. A., Izquierdo, M. A., Slovak, M. L., Pinedo, H. M., Meijer, C. J. L. M., Clevers, H. C. and Scheper, R. J. (1995) The drug resistance-related protein LRP is the human major vault protein. Nature Med. \ 578-582.
Scheper, R. J., Broxterman, H. J., Scheffer, G. L., Kaaijk, P., Dalton, W. S., van Heijningen, T. H. M., van Kalken, C. K., Slovak, M. L., de Vries, E. G. E., van der Valk, P., Meijer, C. J. L. M. and Pinedo, H. M. (1993) Overexpression of a Mr 110,000 vesicular protein in non-P-glycoprotein-mediated multidrug resistance Can. Res. 53 1475-1479.
Schiano, M. A., Sevin, B. U., Perras, J., Ramos, R., Wolloch, E. H. and Averette, H. E. (1991) In vitro enhancement of cis-platinum antitumor activity by caffeine and pentoxifylline in a human ovarian cell line Gynecol. Oncol. 43 37-45.
Schlegel, R. and Pardee, A. B. (1986) Caffeine-induced uncoupling of mitosis from the completion of DNA replication in mammalian cells. Science 232 1264-1266.
Serrano, M., Hannon, G. J. and Beach, D. (1993) A new regulatory motif in cell-cycle control causing specific inhibition of cyclin D/CDK4. Nature 366 704-707.
Sherr, C. J. (1993) Mammalian Gj cyclins. Cell 73 1059-1065.
Shi, L., Nishioka, W. K., Th'ng, J., Morton Bradbury, E., Litchfield, D. W. and Greenberg, A. H. (1994) Premature p34cdc2 activation required for apoptosis. Science 263 1143-1145.
Shimizu, T,, O'Connor, P. M., Kohn, K. W. and Pommier, Y. (1995) Unscheduled activation of cyclin Bl/cdc2 kinase in human promyelocytic leukemia cell line HL60 cells undergoing apoptosis induced by DNA damage. Can. Res. 55 228-231.
Siemann, D. W. and Beyers, K. L. (1993) In vivo therapeutic potential of combination thiol depletion and alkylating chemotherapy. Br. J. Cane. 68 1071-1079.
Simon, S. M. and Schindler, M. (1994) Cell biological mechanisms of multidrug resistance in tumors. PNAS 9.13497-3504.
253

Skladanowski, A. and Konopa, J. (1993) Adriamycin and Daunomycin induce programmed cell death (apoptosis) in tumour cells. Bioch. Pharm. 46(3) 375-382.
Smeets, M. F. M. A., Mooren, E. H. M., Abdel-Wahab, A. H. A., Bartelink, H. and Begg, A. C. (1994) Differential repair of radiation-induced DNA damage in cells of human squamous cell carcinoma and the effect of caffeine and cysteamine on induction and repair of DNA double-strand breaks. Radiat. Res. 140 153-160,
Smeyne, R. J., Vendrell, M., Hayward, M., Baker, S. J., Miao, G. G., Schilling, K., Robertson, L. M., Curran, T. and Morgan, J. I. (1993) Continuous c-fos expression precedes programmed cell death in vivo. Nature 363 166-169.
Smith, M. L., Chen, I., Bae, I., Chen, C., Gilmer, T., Kastan, M. B., O'Connor, P. M. and Fornace, A. J. (1994) Physical and functional interaction of the p53-regulated protein Gadd45 with proliferating cell nuclear antigen. Science 266 1376-1380.
Smith, P. J., Rackstraw, C. and Cotter, F. (1994) DNA fragmentation as a consequence of cell cycle traverse in doxorubicin- and idarubicin-treated human lymphoma cells. Ann. Hematol. 69 S7-S11.
Smith, P. J., Soues, S., Gottlieb, T., Falk, S. J., Watson, J. V., Osborne, R. J. and Bleenan, N. M. (1994) Etopside-induced cell cycle delay and arrest-dependent modulation of DNA topoisomerase II in small-cell lung cancer cells. Br. J. Cane. 70 914- 921.
Solary, E., Bertrand, R. and Pommier, Y. (1994) Apoptosis induced by DNA topoisomerase I and II inhibitors in human leukemic HL-60 cells. Leukemia & Lymphoma 15 21-32.
Solomon, M., Glotzer, M., Lee, T. H., Phillipe, M. and Kirschner, M. (1990) Cyclin activation of p34cdc2. Cell 63 1013-1024.
Sorenson, C. M. and Eastman, A. (1988) Mechanism of cis- diamminedichloroplatinum(II)-induced cytotoxicity: Role of G2 arrest and DNA doublestrand breaks. Can. Res. 48 4484-4488.
Sorger, P. K. and Murray, A. W. (1992) S-phase feedback control in budding yeast independent of tyrosine phosphorylation of p34cdc28. Nature 355 365-368.
254

Spoelstra, E. C., Westerhoff, H. V., Pinedo, H. M., Dekker, H. and Lankelma, J.(1994) The multidrug-resistance-reverser verapamil interferes with cellular P- glycoprotein-mediated pumping of daunorubicin as a non-competing substrate. Eur. J. Biochem. 221 363-373.
Staunton, M. J. and Gaffney, E. F. (1995) Tumor type is a determinant of susceptibility to apoptosis. A.J.C.P. 103(3) 300-307.
Steinmann, K. E., Belinsky, G. S., Lee, D. and Schlegel, R. (1991) Chemically induced premature mitosis: Differential response in rodent and human cells and the relationship to cyclin B systhesis and p34cdc2/cyclin B complex formation. PNAS 88 6843-6847.
Stewart, D. J. and Evans, W. K. (1989) Non-chemotherapeutic agents that potentiate chemotherapy efficacy. Cancer Treatment Reviews 16 1-40.
Stoilov, L. M., Mullenders, L. H. F. and Natarajan, A. T. (1994) Caffeine potentiates or protects against radiation-induced DNA and chromosomal damage in human lymphocytes depending on temperature and concentration. Mut. Res. 311 169-174.
Sugawara, I., Kataoka, I., Morishita, Y., Hamada, H., Tsuruo, T., Itoyama, S. and Mori, S. (1988) Tissue distribution of P-glycoprotein encoded by the multidrug resistant gene as revealed by a monoclonal antibody, MRK16. Can. Res. 48 4611-4614.
Sugawara, I., Nakahama, M., Hamada, H., Tsuruo, T. and Mori, S. (1988) Apparent stronger expression in the human adrenal cortex than in the human adrenal medulla of Mr 170,000-180,000 P-glycoprotein. Can. Res. 32 4611-4614.
Sullivan, D. M., Rowe, T. C., Latham, M. D. and Ross, W. E. (1989) Purification and characterization of an altered topoisomerase II from a drug-resistant Chinese hampster ovary cell line. Biochem. 28 5680-5687.
Sullivan, S. M. (1994) Development of ribozymes for gene therapy. J. Inves. Der. 103 85S-89S.
Sumantran, V. N., Ealovega, M. W., Nunez, G., Clarke, M. F. and Wicha, M. S. (1995) Overexpression of bcl-xs sensitizes MCF-7 cells to chemotherapy-induced apoptosis. Can. Res. 55 2507-2510.
255

Symthe, C. and Newport, J. W. (1992) Coupling of mitosis to the completion of S phase in Xenopus occurs via the modulation of the tyrosine kinase that phosphorylates p34cdc2. Cell 68 787-797.
Takayama, S., Sato, T., Krajewski, S., Kochel, K., Irie, S., Millan, J. A. and Reed, J. C.(1995) Cloning and functional analysis of Bag-1: a novel Bcl-2-binding protein with anticell death activity. Cell 80 279-284.
Tam, S. W. and Schlegel, R. (1992) Staurosporine overrides checkpoints for mitotic onset in BHK cells. Cell Growth 3 811-817.
Tan, K. B., Mattern, M. R., Eng, W. K., McCabe, F. L. and Johnson, R. K. (1989) Nonproductive rearrangement of DNA topoisomerase I nad II genes. J. Nat. Cane. 81 1732-1735.
Thiebaut, F., Tsuruo, T., Hamada, H., Gottesman, M. M., Pastan, I. and Willingham, M. C. (1987) Cellular localisation of the multidrug resistant gene product P-glycoprotein in normal tissues. Proceedings of the American Association for Cancer Research 84 7735-7738.
Thornberry, N. A., Bull, H. G., Calaycay, J. R., Chaoman, K. T., Howard, A. D., Kostura, M. J., Miller, D. K., Molineaux, S. M., Weidner, J. R., Aunins, J., Elliston, K. O., Ayala, J. M., Casano, F. J., Chin, J., Ding, G. J.-F., Egger, L. A., Gaffney, E. P., Lumoco, G., Palyha, O. C., Raju, S. M., Rolando, A. M., Salley, J. P., Yamin, T.-T., Lee, T. D., Shively, J. E., MacCross, J. E., Mumford, R. A., Schmidt, J. A. and Tocci, M. J. (1992) A novel heterodimeric cysteine protease is required for interleukin-113 processing in monocytes. Nature 356 768-774.
Traganos, F., Kapuscinski, J. and Darnzynkiewicz, Z. (1991) Caffeine modulates the effects of DNA-intercalating drugs in vitro: A flow cytometric and spectrophotometric analysis of caffeine interaction with novantrone, doxorubicin, ellipticine, and the doxorubicin analogue AD 198. Can. Res. 51 3682-3689.
Traganos, F., Kapuscinski, J., Gong, J., Ardelt, B., Darzynkiewicz, R. J. and Darzynkiewicz, Z. (1993) Caffeine prevents apoptosis and the cell cycle effects induced by camptothecin or topotecan in HL-60 cells. Can. Res. 53 4613-4618.
Tsao, Y. P., D'Arpa, P. and Liu, L. F. (1992) The involvement of active DNA synthesis in campothecin-induced G2 arrest: Altered regulation of p34cdc2/cyclin B. Can. Res. 52 1823-1829.
256

Tsujii, M. and DuBois, R. N. (1995) Alterations in cellular adhesion and apoptosis in epithelial cells overexpressing prostaglandin endoperoxide synthase 2. Cell 83 493-501.
Ueda, K., Cardarelli, C., Gottesman, M. M. and Pastan, I. (1987) The multidrug resistance (MDR1) gene: cDNA cloning and transcription initiation. J. Biol. Chem. 262 505-508.
Van der Bliek, A. M., Van der Velds-Koerts, T., Ling, V. and Borst, P. (1986) Overexpression and amplification of five genes in a multidrug resistant Chinese hampster ovary cell line. Mol. Cell Biol. 6 1671-1678.
van der Graaf, W. T. A., de Vries, E. G. E., Timmer-Bosscha, H., Meersma, G. J., Mesander, G., Vellenga, E. and Mulder, N. H. (1994) Effects of amiodarone, cyclosporin A and PSC 833 on the cytotoxicity of mitoxantrone, doxorubicin and vincristine in non-P-glycoprotein human small cell lung cancer cell lines. Can. Res. 54 5368-5373.
Vaux, D. L., Weissman, I. L. and Kim, S. K. (1992) Prevention of programmed cell death in Caenorhabditis elegans by human bcl-2. Science 258 1955-1957.
Veis, D. J., Sorenson, C. M., Shutter, J. R. and Korsmeyer, S. J. (1993) Bcl-2-deficient mice demonstrate fulminant lymphoid apoptosis, polycystic kidneys, and hypopigmented hair. Cell 75 229-240.
Walton, M. L., Whysong, D., O'Connor, P. M., Hockenbury, D., Korsmeyer, S. J. and Kohn, K. W. (1993) Constitutive expression of human bcl-2 modulates nitrogen mustard and campothecin induced apoptosis. Can. Res. 53 1853-1861.
Wang, H.-G., Milan, J. A., Cox, A. D., Der, C. J., Rapp, U. R., Beck, T., Zha, H. and Reed, J. C. (1995) R-ras promates apoptosis caused by growth factor deprivation via a Bcl-2 suppressible mechanism. J. Cell Biol. 129 1103-1114.
Wang, L., Miura, M., Bergeron, L., Zhu, H. and Yuan, J. (1994) Ich-1, an ICE/ced-3- related gene, encodes both positive and negative regulators of programmed cell death. Cell 78 129-150.
Weinberg, R. A. (1995) The retinablastoma protein and cell cycle control Cell 81 323- 330.
257

Whitacre, C. M., Hashimoto, H., Tsai, M. L., Chatterjee, S., Berger, S. J. and Berger, N. A. (1995) Involvement of NAD-poly(ADP-ribose) metabolism in p53 regulation and its consequences. Can. Res. 55 3697-3701.
Williams, G. T. and Smith, C. A. (1993) Molecular regulation of apoptosis: genetic controls on cell death. Cell 74 777-779.
Wood, A. C., Elvin, P. and Hickman, J. A. (1995) Induction of apoptosis by anti-cancer drugs with disparate modes of action: kinetics of cell death and changws in c-myc expression. Br. J. Cane. 7J_ 937-941.
Xu, M., Sheppard, K. A., Peng, C. Y., Yee, A. S. and Piwnica-Worms, H. (1994) Cyclin A/CDK2 binds directly to E2F-1 and inhibits the DNA-binding activity of E2F- 1/DP-l by phosphorylation. Mol. Cell Biol. 14 8420-8431.
Yamaizumi, M. and Sugano, T. (1994) U.V.-induced nuclear accumulation of p53 is evoked through DNA damage of actively transcribed genes independentof the cell cycle. Oncogene 9 2775-2784.
Yang, E., Zha, J., Jockel, J., Boise, L, H., Thompson, C. B. and Korsmeyer, S. J.(1995) Bad, a heterodimeric partner for Bcl-xL and Bcl-2, displaces Bax and promote cell death. Cell 80 285-291.
Yin, X.-M., Oltvai, Z. N. and Korsmeyer, S. J. (1994) BH1 and BH2 domains of Bcl-2 are required for inhibition of apoptosis and heterodimerisation with Bax. Nature 369 321-323.
Zaman, G. J. R., Versantvoort, C. H. M., Smit, J. J. M., Eijdems, W. H. M., de Haas, M., Smith, A. J., Broxterman, H. J., Mulder, N. H., de Vries, E. G. E., Baas, F. and Borst, P. (1993) Analysis of the expression of MRP, the gene for a new putative transmembrane drug transporter, in human multidrug resistant lung cancer cell lines. Can. Res. 53 1747-1750.
Zhan, Q., Bae, I., Kastan, M. B. and Fornace, A. J. (1994) The p53-dependent gamma- Ray response of GADD45. Can. Res. 54 2755-2760.
Zhan, Q., Carrier, F. and Fornace, A. J. (1993) Induction of cellular p53 activity by DNA-damaging agents and growth arrest. Mol. Cell Biol. 13 4242-4250.
258

Zhan, Q., El-Deiry, W., Bae, I., Alamo, I., Kastan, M. B., Vogelstein, B. and Fornace, A. J. J. (1995) Similarity of the DNA-damage responsiveness and growth-suppresssive properties of WAF1/CIP1 and GADD45. Int. J. Oncol. 6 1-9.
Zhan, Q., Lord, K. A., Alamo, I., Hollander, M, C., Carrier, F., Ron, D., Kohn, K. W., Hoffman, B., Liebermann, D. A. and Fornace, A. J. (1994) The gadd and MyD genes define a novel set of mammalian genes encoding acidic proteins that synergistically suppress cell growth. Mol. Cell Biol. 14 2361-2371.
259


