Characterization of synthetic polymers by MALDI-MS
Giorgio Montaudo a,*, Filippo Samperi b, Maurizio S. Montaudo b
a Chemistry Department, University of Catania, Viale A. Doria 6, 95125 Catania, Italyb Institute of Chemistry and Technology of Polymers, CNR, Viale A. Doria 6, 95125 Catania, Italy
Received 23 June 2005; received in revised form 30 September 2005; accepted 20 December 2005
Abstract
In recent years, matrix assisted laser desorption/ionization time-of-flight (MALDI-TOF) mass spectroscopy has become a
routine analytical tool for the structural analysis of polymers, complementing NMR and other traditional techniques, a noteworthy
change with respect to the past, when mass spectrometry (MS) was seldom used. In this review, we discuss salient aspects of
MALDI. First, we devote a section to fundamentals and practice in MALDI of polymers (such as the laser, ion source, ion optics,
reflectron, detector, ionization efficiency) as well as to some basic concepts of sample preparation (such as the MALDI matrix and
cationization agents). Then, we focus on measurable quantities of polymers: average molar masses, the chemical formula and the
structure of the monomer (actually of the repeat unit), the masses of the chain end groups, etc. In-depth coverage is given of
coupling MALDI with liquid chromatography (LC), since often LC offers valuable help in exploring macromolecules. The final
section is devoted to recent applications, with a detailed discussion of MALDI of addition polymers, condensation polymers,
polymers with heteroatoms in the chain, copolymers and partially degraded polymers.
q 2006 Elsevier Ltd. All rights reserved.
Keywords: MALDI; Polymers; Copolymers; Polymer degradation; LC-MALDI
Contents
1. Introduction . . . . . . . . . . . . . . . . . . . . . . . . . . . . . . . . . . . . . . . . . . . . . . . . . . . . . . . . . . . . . . . . . . . . . 278
2. Fundamentals and practice . . . . . . . . . . . . . . . . . . . . . . . . . . . . . . . . . . . . . . . . . . . . . . . . . . . . . . . . . . . 279
2.1. Ion extraction . . . . . . . . . . . . . . . . . . . . . . . . . . . . . . . . . . . . . . . . . . . . . . . . . . . . . . . . . . . . . . . . . . . . 279
2.2. Detector . . . . . . . . . . . . . . . . . . . . . . . . . . . . . . . . . . . . . . . . . . . . . . . . . . . . . . . . . . . . . . . . . . . . . . . . 279
2.3. Calibration . . . . . . . . . . . . . . . . . . . . . . . . . . . . . . . . . . . . . . . . . . . . . . . . . . . . . . . . . . . . . . . . . . . . . . 280
2.4. Resolution . . . . . . . . . . . . . . . . . . . . . . . . . . . . . . . . . . . . . . . . . . . . . . . . . . . . . . . . . . . . . . . . . . . . . . 280
2.5. MALDI matrices . . . . . . . . . . . . . . . . . . . . . . . . . . . . . . . . . . . . . . . . . . . . . . . . . . . . . . . . . . . . . . . . . 282
2.6. Developments in sample preparation . . . . . . . . . . . . . . . . . . . . . . . . . . . . . . . . . . . . . . . . . . . . . . . . . . . 283
2.7. Sample preparation for low molar mass compounds . . . . . . . . . . . . . . . . . . . . . . . . . . . . . . . . . . . . . . . . 286
2.8. Doping agents . . . . . . . . . . . . . . . . . . . . . . . . . . . . . . . . . . . . . . . . . . . . . . . . . . . . . . . . . . . . . . . . . . . 287
2.9. Ionization efficiency . . . . . . . . . . . . . . . . . . . . . . . . . . . . . . . . . . . . . . . . . . . . . . . . . . . . . . . . . . . . . . . 287
2.10. Measurement of molar mass . . . . . . . . . . . . . . . . . . . . . . . . . . . . . . . . . . . . . . . . . . . . . . . . . . . . . . . . . 290
2.11. Coupling MALDI with devices that separate macromolecules by size . . . . . . . . . . . . . . . . . . . . . . . . . . . 294
2.12. Coupling MALDI with devices that separate macromolecules by functionality or by composition . . . . . . 298
Prog. Polym. Sci. 31 (2006) 277–357
www.elsevier.com/locate/ppolysci
0079-6700/$ - see front matter q 2006 Elsevier Ltd. All rights reserved.
doi:10.1016/j.progpolymsci.2005.12.001
* Corresponding author. Tel.: C39 95339926.
E-mail address: [email protected] (G. Montaudo).
G. Montaudo et al. / Prog. Polym. Sci. 31 (2006) 277–357278
2.13. Structure determination . . . . . . . . . . . . . . . . . . . . . . . . . . . . . . . . . . . . . . . . . . . . . . . . . . . . . . . . . . . . . 300
2.14. End group determination . . . . . . . . . . . . . . . . . . . . . . . . . . . . . . . . . . . . . . . . . . . . . . . . . . . . . . . . . . . . 303
2.15. Tandem mass spectrometry for structure determination . . . . . . . . . . . . . . . . . . . . . . . . . . . . . . . . . . . . . . 304
2.16. Copolymer characterization . . . . . . . . . . . . . . . . . . . . . . . . . . . . . . . . . . . . . . . . . . . . . . . . . . . . . . . . . . 308
2.17. Bivariate distribution . . . . . . . . . . . . . . . . . . . . . . . . . . . . . . . . . . . . . . . . . . . . . . . . . . . . . . . . . . . . . . 309
3. Recent applications . . . . . . . . . . . . . . . . . . . . . . . . . . . . . . . . . . . . . . . . . . . . . . . . . . . . . . . . . . . . . . . . 309
3.1. Polystyrene . . . . . . . . . . . . . . . . . . . . . . . . . . . . . . . . . . . . . . . . . . . . . . . . . . . . . . . . . . . . . . . . . . . . . 309
3.2. Polymethylmethacrylates and acrylic polymers . . . . . . . . . . . . . . . . . . . . . . . . . . . . . . . . . . . . . . . . . . . . 311
3.3. Other polymers with an all-carbon main chain . . . . . . . . . . . . . . . . . . . . . . . . . . . . . . . . . . . . . . . . . . . . 315
3.4. Polymers with heteroatoms in the main chain . . . . . . . . . . . . . . . . . . . . . . . . . . . . . . . . . . . . . . . . . . . . . 315
3.5. Polysiloxanes, poly(silsesquioxane)s and polysilanes . . . . . . . . . . . . . . . . . . . . . . . . . . . . . . . . . . . . . . . 315
3.6. Polyethers . . . . . . . . . . . . . . . . . . . . . . . . . . . . . . . . . . . . . . . . . . . . . . . . . . . . . . . . . . . . . . . . . . . . . . 315
3.7. Polyesters . . . . . . . . . . . . . . . . . . . . . . . . . . . . . . . . . . . . . . . . . . . . . . . . . . . . . . . . . . . . . . . . . . . . . . . 316
3.8. Polycarbonates . . . . . . . . . . . . . . . . . . . . . . . . . . . . . . . . . . . . . . . . . . . . . . . . . . . . . . . . . . . . . . . . . . . 317
3.9. Polyamides and polyimides . . . . . . . . . . . . . . . . . . . . . . . . . . . . . . . . . . . . . . . . . . . . . . . . . . . . . . . . . . 317
3.10. Polymers with phenyl and other cycles in the main chain . . . . . . . . . . . . . . . . . . . . . . . . . . . . . . . . . . . . 319
3.11. Copolymer studies . . . . . . . . . . . . . . . . . . . . . . . . . . . . . . . . . . . . . . . . . . . . . . . . . . . . . . . . . . . . . . . . 320
3.12. Polymer degradation studies . . . . . . . . . . . . . . . . . . . . . . . . . . . . . . . . . . . . . . . . . . . . . . . . . . . . . . . . . 327
Appendix A. Size exclusion chromatography . . . . . . . . . . . . . . . . . . . . . . . . . . . . . . . . . . . . . . . . . . . . . . . . . . . . . . . 341
Appendix B. Copolymer composition from MS . . . . . . . . . . . . . . . . . . . . . . . . . . . . . . . . . . . . . . . . . . . . . . . . . . . . . 342
References . . . . . . . . . . . . . . . . . . . . . . . . . . . . . . . . . . . . . . . . . . . . . . . . . . . . . . . . . . . . . . . . . . . . . . 344
1. Introduction
Polymers display a variety of structures, including
linear, cyclic, and branched chains, copolymers with
various architectures, dendrimers, and star polymers
with different number of arms. The structural charac-
terization of a polymer sample usually involves:
evaluation of the average molar mass (MM) and of
the molar mass distribution (MMD); determination of
the repeat units structure; copolymers sequence
analysis; end group identification; detection and
identification of impurities and additives. Modern
mass spectrometry (MS) offers the opportunity to
explore the finest structural details in polymers [1–10].
Matrix assisted laser desorption/ionization time-of-
flight (MALDI-TOF) has dramatically increased the
mass range of MS; it provides mass-resolved spectra up
to 50–70 kDa and above, allowing the detection of
quite large molecules (106 Da), even in complex
mixtures, at the femtomole level [3]. Peaks in the
spectra originate from ions of intact polymer chains,
and, therefore, allow structural identification of single
oligomers. The last few years have witnessed out-
standing progress in the application of MALDI to open
problems concerning the characterization of polymers.
Initially, MALDI-TOF instruments had poor spec-
tral resolution (M/DM about 500): i.e. mass-resolved
spectra usually did not go beyond 10,000 Da. This
caused structural identification problems, even in the
lowest mass range. Therefore, MALDI-TOF spectral
data on polymers that appeared in earlier papers (up to
about 1998) may need updating. MS yields information
on the masses of individual oligomers, a remarkable
difference with respect to NMR, which is an averaging
method. Therefore, besides providing unequivocal
information on the chemical structure of polymeric
materials, MALDI allows the identification of chain
end groups, including species present in minor amounts
in a polymer sample. End group identification is so
crucial in polymer analysis that its importance cannot
be overemphasized; in fact, it has been one of the most
popular applications of MALDI to polymers. The
determination of the end group structure of intact
polymer samples often has interesting side effects,
namely, the identification of procedures used in the
synthesis of research and industrial polymers, and the
capture of information on the structure of capping
agents and additives. Applications of the MALDI
technique to the characterization of synthetic polymers
have been summarized [3,4]. However, this field has
recently experienced considerable progress, and it is
our purpose to illustrate advances in the fundamental
and practical aspects of the MALDI-MS technique
related to polymer analysis.
Among other topics, our attention is focused on
recent advances in: MALDI sample preparation,
achieving high mass resolution, detailed structure
identification in polymers and copolymers, accuracy
of molar mass determination, functional and end group
identification, copolymer sequence analysis, in situ
G. Montaudo et al. / Prog. Polym. Sci. 31 (2006) 277–357 279
detection of photo and thermal oxidation products of
polymers, monitoring polymerization reactions, and
coupling MALDI with liquid chromatography. We
discuss MALDI literature concerning selected classes
of polymers, and our bibliography includes about 400
references selected from papers that appeared in 2000–
2005.
MALDI applications are classified on the basis of
the polymer backbone: polymers of styrene and its
derivatives [11–63], acrylic and methacrylic polymers
[64–102], other all-carbon polymers [103–127], poly-
mers with heteroatoms in the chain: namely polysilox-
anes, poly(silsesquioxane)s and polysilanes [128–148],
polyethers [149–205], polyesters [206–250], polycar-
bonates [251–261] polyamides and polyimides
[262–283], polymers with an aromatic ring in the
backbone [284–311], and copolymers [312–365].
Studies of partially degraded polymers are discussed
separately [366–393].
2. Fundamentals and practice
2.1. Ion extraction
MALDI makes use of short pulses of laser light to
induce the formation of intact gaseous ions. Analyte
molecules are not directly exposed to laser light, but are
homogeneously embedded in a large excess of ‘matrix’,
which consists of small organic molecules. The matrix
molecules strongly absorb the laser light to allow for
very efficient energy transfer to the analyte (in our case,
the polymer). The high energy density obtained in the
solid or liquid matrices (even at moderate laser
irradiance) induces instantaneous vaporization of a
microvolume (called a ‘plume’), and a mixture of
ionized matrix and analyte molecules is released into
the vacuum of the ion-source. The laser pulse must not
be too long, otherwise analyte molecules do not all
desorb at the same time. On the other hand, there is no
advantage in using ultrashort pulses (fractions of
picoseconds) and there are many disadvantages (for
instance, a laser which generates ultrashort pulses is
expensive and bulky). The nitrogen laser, operating at a
wavelength of 337 nm, has a very compact design, it is
pulsed and its shots last about 3 ns, which is perfect for
the scope of MALDI.
In commonly used instruments (those equipped with
a time-of-flight tube), the laser pulse is followed by a
time delay, lasting 300–800 ns, before the application
of an extraction voltage, which brings the ions out of
the ion source. After this time delay, the packet of ions
generated in the process is accelerated by an electric
potential, ranging from 15 up to 35 kV. Homemade
instruments may use lower voltages, but they require
careful tuning. For instance, the first MALDI instru-
ment (used by Hillenkamp and coworkers in Munster
for their pioneering experiments [1]) had only 3 kV.
Depending on their mass-to-charge ratio m/z, the
ions have different velocities when they leave the
acceleration zone and enter a field-free flight tube
(drift-tube) 1 or 2 m long. After a time-of-flight of the
order of 100 ms, the ions impact onto an ion detector,
often formed by two microchannel plates connected in
series. The detector produces a signal (proportional to
the number of ions arriving at the detector), which is
processed by an ADC converter (using a clock with a
time base of 2 ns or better). The ADC is connected with
a computer, in which the resulting MALDI spectrum
can be stored and processed (e.g. for smoothing, etc.).
2.2. Detector
The detector amplifies the signal by a factor of about
107; and therefore, it is a very-high-gain amplifier. This
gain cannot be achieved without the presence of a
‘pool’ of secondary electrons and, when the amplifier’s
task is too demanding, the ‘pool’ may become empty.
This annoying effect is called detector saturation. The
presence of low molar mass compounds in the
polymeric sample can cause detector saturation and,
in turn, the amplification of the signals due to low and
high molar mass ions becomes uneven, the latter being
much reduced. This effect is particularly evident in
samples difficult to desorb at moderate laser power. The
user has various possibilities in order to avoid (or at
least to reduce) the negative consequences of detector
saturation [4,5].
First, MALDI mass spectrometers are equipped with
an electrostatic device, the deflector, which acts as a
cut-off, since it pulses away low molar mass
compounds and does not allow them to reach the
detector. The efficacy of this device is high and thus the
use of a deflector is very popular. However, it has a
drawback: namely, the on–off switching needs a small
(but not infinitesimal) time, and thus, the trajectories of
ions possessing masses close to the cut-off are not
straight and can appear in the spectrum as artifacts. The
second possibility is to leave the detector off initially
and to turn it on when high-mass ions start hitting the
detector. In this way, the pool of secondary electrons is
fully available for high-mass ions. However, the two
procedures described above ‘neglect’ low molar mass
compounds, assuming that they are unimportant, and
this assumption is not necessarily true. As an
G. Montaudo et al. / Prog. Polym. Sci. 31 (2006) 277–357280
alternative, one can replace microchannel plates with
another type of detector (for instance a hybrid detector,
in which the signal coming from the first microchannel
plate is processed by another detector, which is also a
high dynamic-range amplifier). In this way, low molar
mass compounds are not neglected.
2.3. Calibration
The MALDI-TOF mass spectrum is then obtained
by recording the detector signal as a function of time.
According to Eq. (1), the square of the flight time is
proportional to the m/z ratio
m=z Z 2Vt2LK2 (1)
where m is the mass of the ion, z is the number of
charges, V is the accelerating voltage, t is the ion flight
time, L is the length of the flight tube. In principle, since
V and L are known, the m/z ratio can be calculated
solely from Eq. (1). In practice, exact values for the
mass scale are obtained using another (empirical)
formula
m=z Z at2 Cb (2)
because of uncertainty in the determination of flight
time due to a short delay in ion formation after the laser
pulse. Hence, the true starting time of the ion is not
identical with the time of the laser pulse (which
provides the starting signal for the measurement of
flight time).
The constants a and b in Eq. (2) are estimated from
the measured flight times of two ions with known
masses. Usually, a preliminary calibration spectrum
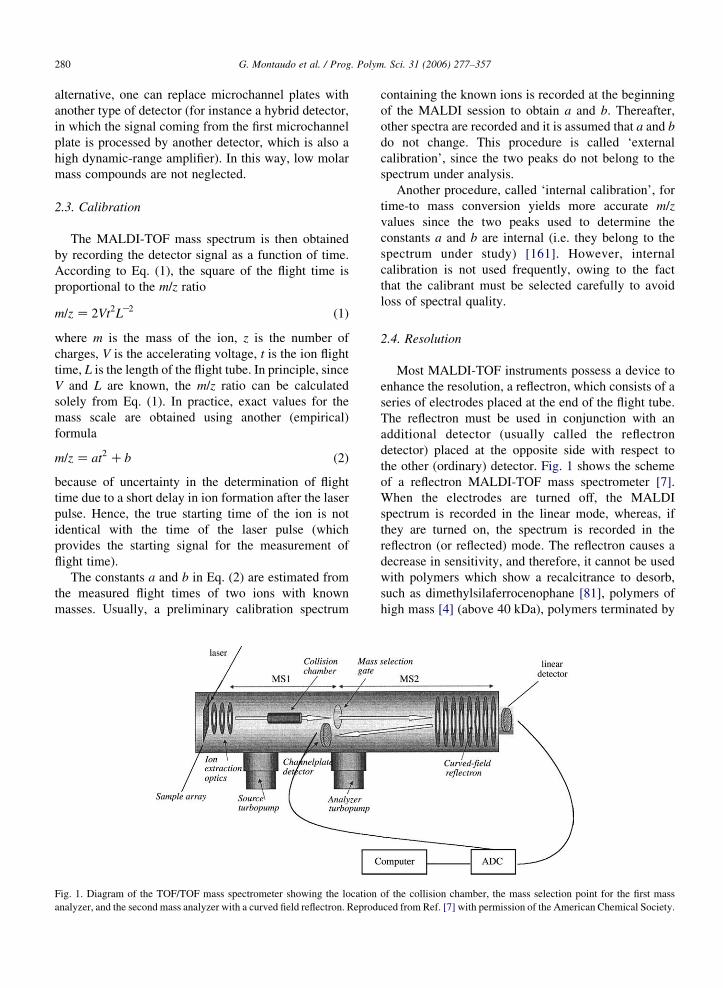
Fig. 1. Diagram of the TOF/TOF mass spectrometer showing the location
analyzer, and the second mass analyzer with a curved field reflectron. Reprod
containing the known ions is recorded at the beginning
of the MALDI session to obtain a and b. Thereafter,
other spectra are recorded and it is assumed that a and b
do not change. This procedure is called ‘external
calibration’, since the two peaks do not belong to the
spectrum under analysis.
Another procedure, called ‘internal calibration’, for
time-to mass conversion yields more accurate m/z
values since the two peaks used to determine the
constants a and b are internal (i.e. they belong to the
spectrum under study) [161]. However, internal
calibration is not used frequently, owing to the fact
that the calibrant must be selected carefully to avoid
loss of spectral quality.
2.4. Resolution
Most MALDI-TOF instruments possess a device to
enhance the resolution, a reflectron, which consists of a
series of electrodes placed at the end of the flight tube.
The reflectron must be used in conjunction with an
additional detector (usually called the reflectron
detector) placed at the opposite side with respect to
the other (ordinary) detector. Fig. 1 shows the scheme
of a reflectron MALDI-TOF mass spectrometer [7].
When the electrodes are turned off, the MALDI
spectrum is recorded in the linear mode, whereas, if
they are turned on, the spectrum is recorded in the
reflectron (or reflected) mode. The reflectron causes a
decrease in sensitivity, and therefore, it cannot be used
with polymers which show a recalcitrance to desorb,
such as dimethylsilaferrocenophane [81], polymers of
high mass [4] (above 40 kDa), polymers terminated by
of the collision chamber, the mass selection point for the first mass
uced from Ref. [7] with permission of the American Chemical Society.
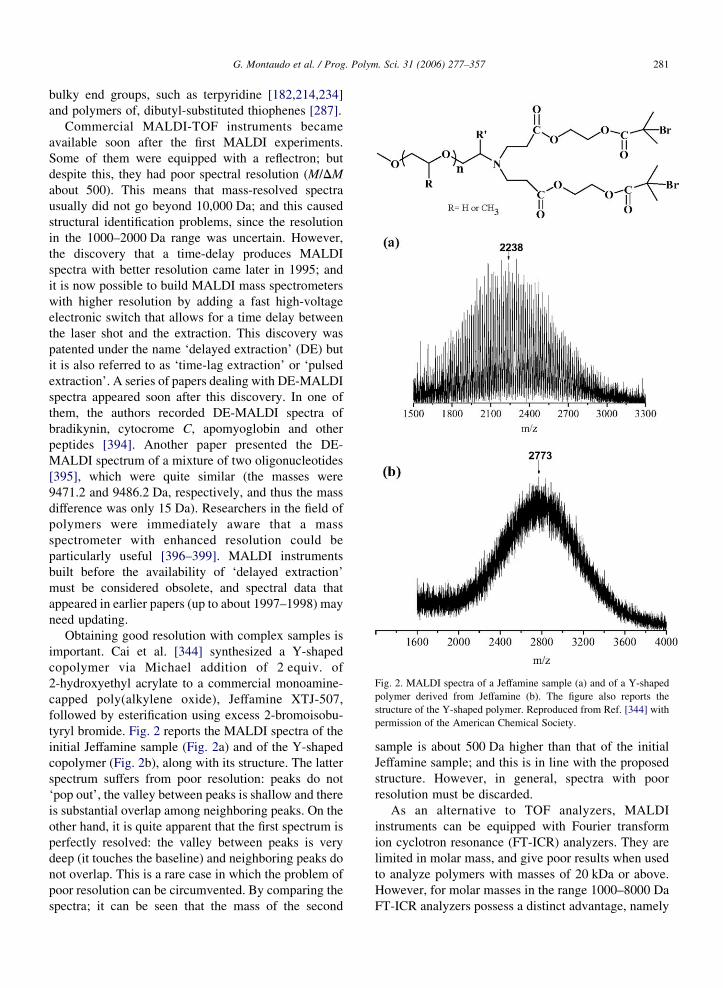
Fig. 2. MALDI spectra of a Jeffamine sample (a) and of a Y-shaped
polymer derived from Jeffamine (b). The figure also reports the
structure of the Y-shaped polymer. Reproduced from Ref. [344] with
permission of the American Chemical Society.
G. Montaudo et al. / Prog. Polym. Sci. 31 (2006) 277–357 281
bulky end groups, such as terpyridine [182,214,234]
and polymers of, dibutyl-substituted thiophenes [287].
Commercial MALDI-TOF instruments became
available soon after the first MALDI experiments.
Some of them were equipped with a reflectron; but
despite this, they had poor spectral resolution (M/DM
about 500). This means that mass-resolved spectra
usually did not go beyond 10,000 Da; and this caused
structural identification problems, since the resolution
in the 1000–2000 Da range was uncertain. However,
the discovery that a time-delay produces MALDI
spectra with better resolution came later in 1995; and
it is now possible to build MALDI mass spectrometers
with higher resolution by adding a fast high-voltage
electronic switch that allows for a time delay between
the laser shot and the extraction. This discovery was
patented under the name ‘delayed extraction’ (DE) but
it is also referred to as ‘time-lag extraction’ or ‘pulsed
extraction’. A series of papers dealing with DE-MALDI
spectra appeared soon after this discovery. In one of
them, the authors recorded DE-MALDI spectra of
bradikynin, cytocrome C, apomyoglobin and other
peptides [394]. Another paper presented the DE-
MALDI spectrum of a mixture of two oligonucleotides
[395], which were quite similar (the masses were
9471.2 and 9486.2 Da, respectively, and thus the mass
difference was only 15 Da). Researchers in the field of
polymers were immediately aware that a mass
spectrometer with enhanced resolution could be
particularly useful [396–399]. MALDI instruments
built before the availability of ‘delayed extraction’
must be considered obsolete, and spectral data that
appeared in earlier papers (up to about 1997–1998) may
need updating.
Obtaining good resolution with complex samples is
important. Cai et al. [344] synthesized a Y-shaped
copolymer via Michael addition of 2 equiv. of
2-hydroxyethyl acrylate to a commercial monoamine-
capped poly(alkylene oxide), Jeffamine XTJ-507,
followed by esterification using excess 2-bromoisobu-
tyryl bromide. Fig. 2 reports the MALDI spectra of the
initial Jeffamine sample (Fig. 2a) and of the Y-shaped
copolymer (Fig. 2b), along with its structure. The latter
spectrum suffers from poor resolution: peaks do not
‘pop out’, the valley between peaks is shallow and there
is substantial overlap among neighboring peaks. On the
other hand, it is quite apparent that the first spectrum is
perfectly resolved: the valley between peaks is very
deep (it touches the baseline) and neighboring peaks do
not overlap. This is a rare case in which the problem of
poor resolution can be circumvented. By comparing the
spectra; it can be seen that the mass of the second
sample is about 500 Da higher than that of the initial
Jeffamine sample; and this is in line with the proposed
structure. However, in general, spectra with poor
resolution must be discarded.
As an alternative to TOF analyzers, MALDI
instruments can be equipped with Fourier transform
ion cyclotron resonance (FT-ICR) analyzers. They are
limited in molar mass, and give poor results when used
to analyze polymers with masses of 20 kDa or above.
However, for molar masses in the range 1000–8000 Da
FT-ICR analyzers possess a distinct advantage, namely
G. Montaudo et al. / Prog. Polym. Sci. 31 (2006) 277–357282
the resolution is astounding (one part in 30,000 and
above). There are cases in which such resolution is
needed. Mize et al. [213] recorded the MALDI spectra
of two homopolyesters and two copolyesters, using a
MALDI instrument equipped with FT-ICR. In one of
the samples, two components, denoted E1n and E2n
were present, E1n having a mass only 2 Da higher than
E2n. Clearly, the isotopic patterns of the two were
partially superposed. For example, E2n(0), the E2n
chains with no 13C carbons, were (almost) isobaric with
E1n(2), the E1n chains with two 13C carbons. As a
result of the superposition, one of the two components
(the second one) was hidden, and its presence was
difficult to detect. However, E2n(0) and E1n(2) do not
have exactly the same mass and the FT-ICR MALDI
instrument was able to spot the very small difference in
mass (only about 10 ppm at mass 1800) and two distinct
MS peaks appeared in the spectrum, revealing the
presence of the second species.
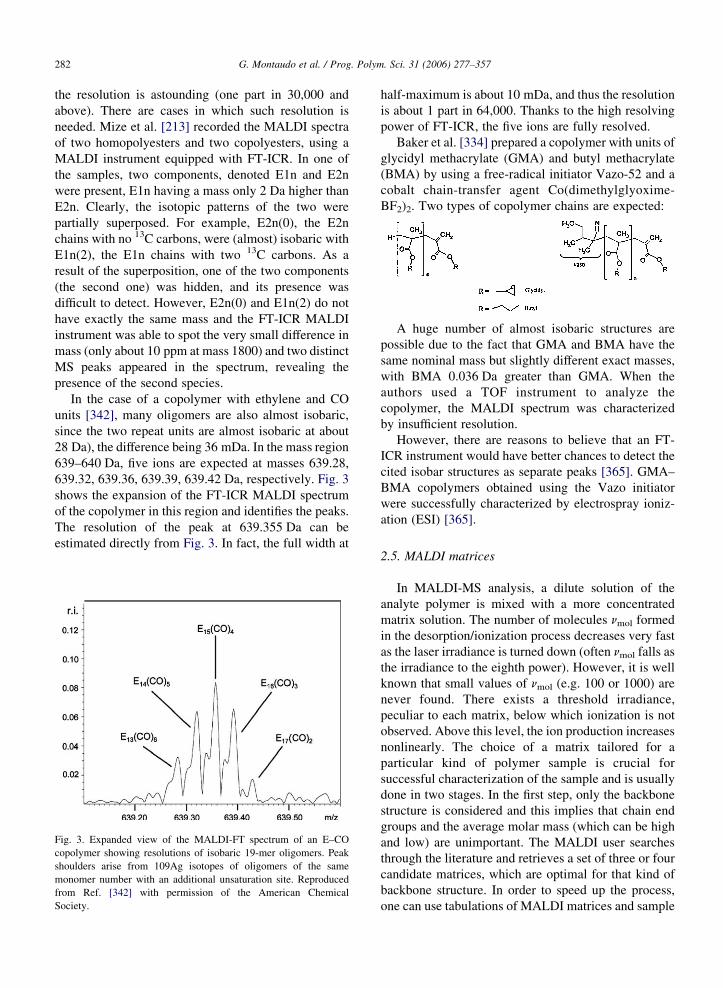
In the case of a copolymer with ethylene and CO
units [342], many oligomers are also almost isobaric,
since the two repeat units are almost isobaric at about
28 Da), the difference being 36 mDa. In the mass region
639–640 Da, five ions are expected at masses 639.28,
639.32, 639.36, 639.39, 639.42 Da, respectively. Fig. 3
shows the expansion of the FT-ICR MALDI spectrum
of the copolymer in this region and identifies the peaks.
The resolution of the peak at 639.355 Da can be
estimated directly from Fig. 3. In fact, the full width at
Fig. 3. Expanded view of the MALDI-FT spectrum of an E–CO
copolymer showing resolutions of isobaric 19-mer oligomers. Peak
shoulders arise from 109Ag isotopes of oligomers of the same
monomer number with an additional unsaturation site. Reproduced
from Ref. [342] with permission of the American Chemical
Society.
half-maximum is about 10 mDa, and thus the resolution
is about 1 part in 64,000. Thanks to the high resolving
power of FT-ICR, the five ions are fully resolved.
Baker et al. [334] prepared a copolymer with units of
glycidyl methacrylate (GMA) and butyl methacrylate
(BMA) by using a free-radical initiator Vazo-52 and a
cobalt chain-transfer agent Co(dimethylglyoxime-
BF2)2. Two types of copolymer chains are expected:
A huge number of almost isobaric structures are
possible due to the fact that GMA and BMA have the
same nominal mass but slightly different exact masses,
with BMA 0.036 Da greater than GMA. When the
authors used a TOF instrument to analyze the
copolymer, the MALDI spectrum was characterized
by insufficient resolution.
However, there are reasons to believe that an FT-
ICR instrument would have better chances to detect the
cited isobar structures as separate peaks [365]. GMA–
BMA copolymers obtained using the Vazo initiator
were successfully characterized by electrospray ioniz-
ation (ESI) [365].
2.5. MALDI matrices
In MALDI-MS analysis, a dilute solution of the
analyte polymer is mixed with a more concentrated
matrix solution. The number of molecules nmol formed
in the desorption/ionization process decreases very fast
as the laser irradiance is turned down (often nmol falls as
the irradiance to the eighth power). However, it is well
known that small values of nmol (e.g. 100 or 1000) are
never found. There exists a threshold irradiance,
peculiar to each matrix, below which ionization is not
observed. Above this level, the ion production increases
nonlinearly. The choice of a matrix tailored for a
particular kind of polymer sample is crucial for
successful characterization of the sample and is usually
done in two stages. In the first step, only the backbone
structure is considered and this implies that chain end
groups and the average molar mass (which can be high
and low) are unimportant. The MALDI user searches
through the literature and retrieves a set of three or four
candidate matrices, which are optimal for that kind of
backbone structure. In order to speed up the process,
one can use tabulations of MALDI matrices and sample
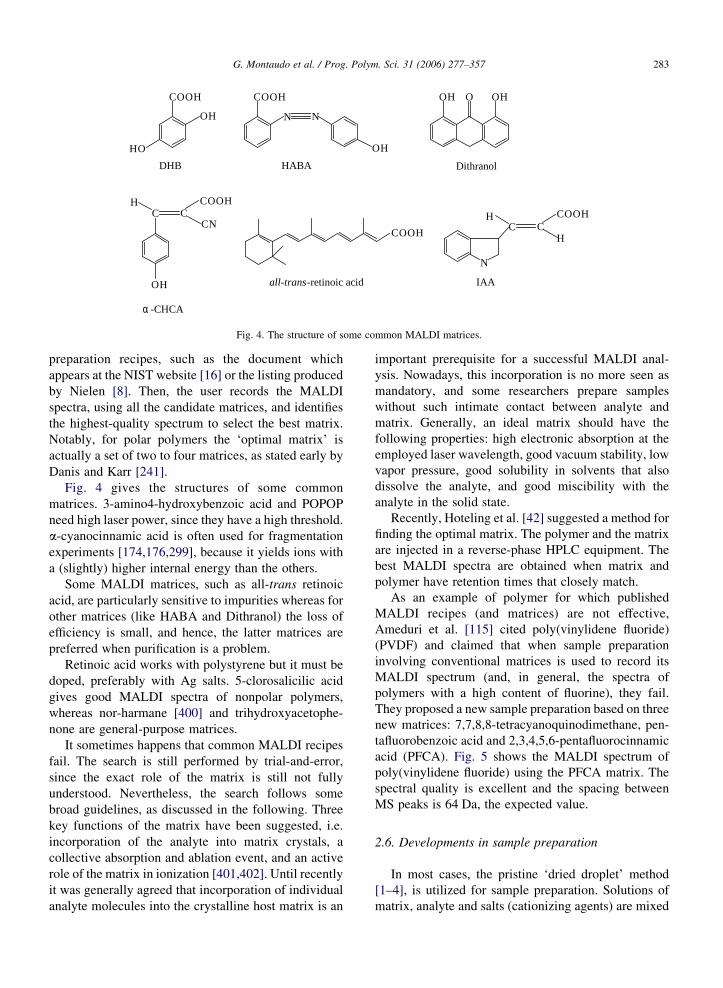
C CCOOH
CN
H
OH
N
COOH
N
OH
OH OHO
COOH
N
C CCOOH
H
H
OH
HO
COOH
DHB HABA Dithranol
α -CHCA
all-trans-retinoic acid IAA
Fig. 4. The structure of some common MALDI matrices.
G. Montaudo et al. / Prog. Polym. Sci. 31 (2006) 277–357 283
preparation recipes, such as the document which
appears at the NIST website [16] or the listing produced
by Nielen [8]. Then, the user records the MALDI
spectra, using all the candidate matrices, and identifies
the highest-quality spectrum to select the best matrix.
Notably, for polar polymers the ‘optimal matrix’ is
actually a set of two to four matrices, as stated early by
Danis and Karr [241].
Fig. 4 gives the structures of some common
matrices. 3-amino4-hydroxybenzoic acid and POPOP
need high laser power, since they have a high threshold.
a-cyanocinnamic acid is often used for fragmentation
experiments [174,176,299], because it yields ions with
a (slightly) higher internal energy than the others.
Some MALDI matrices, such as all-trans retinoic
acid, are particularly sensitive to impurities whereas for
other matrices (like HABA and Dithranol) the loss of
efficiency is small, and hence, the latter matrices are
preferred when purification is a problem.
Retinoic acid works with polystyrene but it must be
doped, preferably with Ag salts. 5-clorosalicilic acid
gives good MALDI spectra of nonpolar polymers,
whereas nor-harmane [400] and trihydroxyacetophe-
none are general-purpose matrices.
It sometimes happens that common MALDI recipes
fail. The search is still performed by trial-and-error,
since the exact role of the matrix is still not fully
understood. Nevertheless, the search follows some
broad guidelines, as discussed in the following. Three
key functions of the matrix have been suggested, i.e.
incorporation of the analyte into matrix crystals, a
collective absorption and ablation event, and an active
role of the matrix in ionization [401,402]. Until recently
it was generally agreed that incorporation of individual
analyte molecules into the crystalline host matrix is an
important prerequisite for a successful MALDI anal-
ysis. Nowadays, this incorporation is no more seen as
mandatory, and some researchers prepare samples
without such intimate contact between analyte and
matrix. Generally, an ideal matrix should have the
following properties: high electronic absorption at the
employed laser wavelength, good vacuum stability, low
vapor pressure, good solubility in solvents that also
dissolve the analyte, and good miscibility with the
analyte in the solid state.
Recently, Hoteling et al. [42] suggested a method for
finding the optimal matrix. The polymer and the matrix
are injected in a reverse-phase HPLC equipment. The
best MALDI spectra are obtained when matrix and
polymer have retention times that closely match.
As an example of polymer for which published
MALDI recipes (and matrices) are not effective,
Ameduri et al. [115] cited poly(vinylidene fluoride)
(PVDF) and claimed that when sample preparation
involving conventional matrices is used to record its
MALDI spectrum (and, in general, the spectra of
polymers with a high content of fluorine), they fail.
They proposed a new sample preparation based on three
new matrices: 7,7,8,8-tetracyanoquinodimethane, pen-
tafluorobenzoic acid and 2,3,4,5,6-pentafluorocinnamic
acid (PFCA). Fig. 5 shows the MALDI spectrum of
poly(vinylidene fluoride) using the PFCA matrix. The
spectral quality is excellent and the spacing between
MS peaks is 64 Da, the expected value.
2.6. Developments in sample preparation
In most cases, the pristine ‘dried droplet’ method
[1–4], is utilized for sample preparation. Solutions of
matrix, analyte and salts (cationizing agents) are mixed
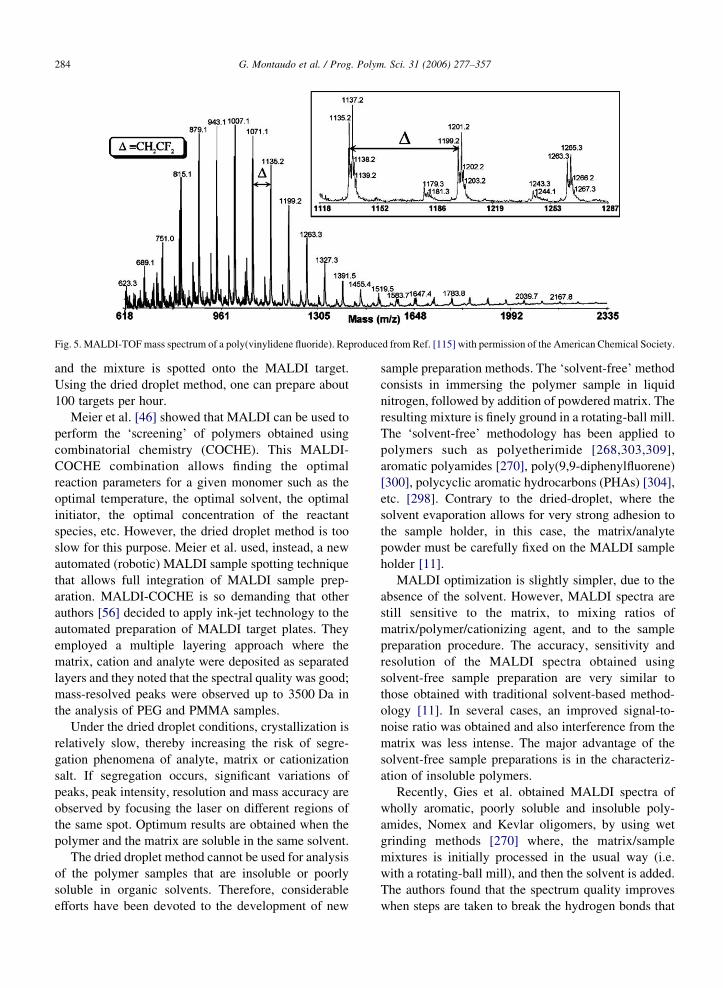
Fig. 5. MALDI-TOFmass spectrum of a poly(vinylidene fluoride). Reproduced from Ref. [115] with permission of the American Chemical Society.
G. Montaudo et al. / Prog. Polym. Sci. 31 (2006) 277–357284
and the mixture is spotted onto the MALDI target.
Using the dried droplet method, one can prepare about
100 targets per hour.
Meier et al. [46] showed that MALDI can be used to
perform the ‘screening’ of polymers obtained using
combinatorial chemistry (COCHE). This MALDI-
COCHE combination allows finding the optimal
reaction parameters for a given monomer such as the
optimal temperature, the optimal solvent, the optimal
initiator, the optimal concentration of the reactant
species, etc. However, the dried droplet method is too
slow for this purpose. Meier et al. used, instead, a new
automated (robotic) MALDI sample spotting technique
that allows full integration of MALDI sample prep-
aration. MALDI-COCHE is so demanding that other
authors [56] decided to apply ink-jet technology to the
automated preparation of MALDI target plates. They
employed a multiple layering approach where the
matrix, cation and analyte were deposited as separated
layers and they noted that the spectral quality was good;
mass-resolved peaks were observed up to 3500 Da in
the analysis of PEG and PMMA samples.
Under the dried droplet conditions, crystallization is
relatively slow, thereby increasing the risk of segre-
gation phenomena of analyte, matrix or cationization
salt. If segregation occurs, significant variations of
peaks, peak intensity, resolution and mass accuracy are
observed by focusing the laser on different regions of
the same spot. Optimum results are obtained when the
polymer and the matrix are soluble in the same solvent.
The dried droplet method cannot be used for analysis
of the polymer samples that are insoluble or poorly
soluble in organic solvents. Therefore, considerable
efforts have been devoted to the development of new
sample preparation methods. The ‘solvent-free’ method
consists in immersing the polymer sample in liquid
nitrogen, followed by addition of powdered matrix. The
resulting mixture is finely ground in a rotating-ball mill.
The ‘solvent-free’ methodology has been applied to
polymers such as polyetherimide [268,303,309],
aromatic polyamides [270], poly(9,9-diphenylfluorene)
[300], polycyclic aromatic hydrocarbons (PHAs) [304],
etc. [298]. Contrary to the dried-droplet, where the
solvent evaporation allows for very strong adhesion to
the sample holder, in this case, the matrix/analyte
powder must be carefully fixed on the MALDI sample
holder [11].
MALDI optimization is slightly simpler, due to the
absence of the solvent. However, MALDI spectra are
still sensitive to the matrix, to mixing ratios of
matrix/polymer/cationizing agent, and to the sample
preparation procedure. The accuracy, sensitivity and
resolution of the MALDI spectra obtained using
solvent-free sample preparation are very similar to
those obtained with traditional solvent-based method-
ology [11]. In several cases, an improved signal-to-
noise ratio was obtained and also interference from the
matrix was less intense. The major advantage of the
solvent-free sample preparations is in the characteriz-
ation of insoluble polymers.
Recently, Gies et al. obtained MALDI spectra of
wholly aromatic, poorly soluble and insoluble poly-
amides, Nomex and Kevlar oligomers, by using wet
grinding methods [270] where, the matrix/sample
mixtures is initially processed in the usual way (i.e.
with a rotating-ball mill), and then the solvent is added.
The authors found that the spectrum quality improves
when steps are taken to break the hydrogen bonds that
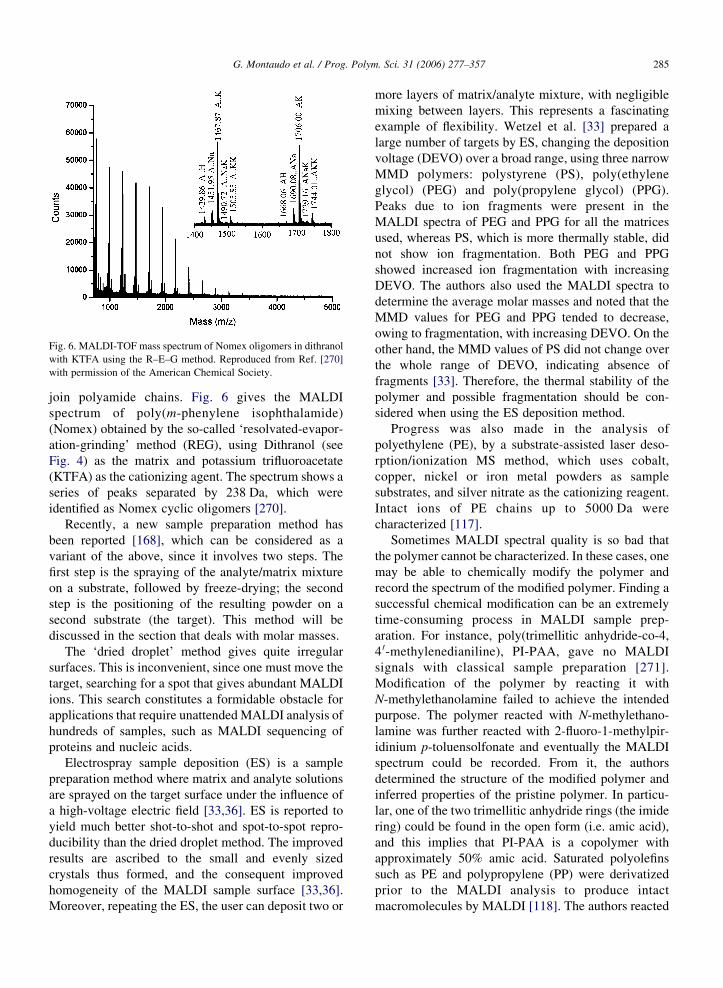
Fig. 6. MALDI-TOF mass spectrum of Nomex oligomers in dithranol
with KTFA using the R–E–G method. Reproduced from Ref. [270]
with permission of the American Chemical Society.
G. Montaudo et al. / Prog. Polym. Sci. 31 (2006) 277–357 285
join polyamide chains. Fig. 6 gives the MALDI
spectrum of poly(m-phenylene isophthalamide)
(Nomex) obtained by the so-called ‘resolvated-evapor-
ation-grinding’ method (REG), using Dithranol (see
Fig. 4) as the matrix and potassium trifluoroacetate
(KTFA) as the cationizing agent. The spectrum shows a
series of peaks separated by 238 Da, which were
identified as Nomex cyclic oligomers [270].
Recently, a new sample preparation method has
been reported [168], which can be considered as a
variant of the above, since it involves two steps. The
first step is the spraying of the analyte/matrix mixture
on a substrate, followed by freeze-drying; the second
step is the positioning of the resulting powder on a
second substrate (the target). This method will be
discussed in the section that deals with molar masses.
The ‘dried droplet’ method gives quite irregular
surfaces. This is inconvenient, since one must move the
target, searching for a spot that gives abundant MALDI
ions. This search constitutes a formidable obstacle for
applications that require unattendedMALDI analysis of
hundreds of samples, such as MALDI sequencing of
proteins and nucleic acids.
Electrospray sample deposition (ES) is a sample
preparation method where matrix and analyte solutions
are sprayed on the target surface under the influence of
a high-voltage electric field [33,36]. ES is reported to
yield much better shot-to-shot and spot-to-spot repro-
ducibility than the dried droplet method. The improved
results are ascribed to the small and evenly sized
crystals thus formed, and the consequent improved
homogeneity of the MALDI sample surface [33,36].
Moreover, repeating the ES, the user can deposit two or
more layers of matrix/analyte mixture, with negligible
mixing between layers. This represents a fascinating
example of flexibility. Wetzel et al. [33] prepared a
large number of targets by ES, changing the deposition
voltage (DEVO) over a broad range, using three narrow
MMD polymers: polystyrene (PS), poly(ethylene
glycol) (PEG) and poly(propylene glycol) (PPG).
Peaks due to ion fragments were present in the
MALDI spectra of PEG and PPG for all the matrices
used, whereas PS, which is more thermally stable, did
not show ion fragmentation. Both PEG and PPG
showed increased ion fragmentation with increasing
DEVO. The authors also used the MALDI spectra to
determine the average molar masses and noted that the
MMD values for PEG and PPG tended to decrease,
owing to fragmentation, with increasing DEVO. On the
other hand, the MMD values of PS did not change over
the whole range of DEVO, indicating absence of
fragments [33]. Therefore, the thermal stability of the
polymer and possible fragmentation should be con-
sidered when using the ES deposition method.
Progress was also made in the analysis of
polyethylene (PE), by a substrate-assisted laser deso-
rption/ionization MS method, which uses cobalt,
copper, nickel or iron metal powders as sample
substrates, and silver nitrate as the cationizing reagent.
Intact ions of PE chains up to 5000 Da were
characterized [117].
Sometimes MALDI spectral quality is so bad that
the polymer cannot be characterized. In these cases, one
may be able to chemically modify the polymer and
record the spectrum of the modified polymer. Finding a
successful chemical modification can be an extremely
time-consuming process in MALDI sample prep-
aration. For instance, poly(trimellitic anhydride-co-4,
4 0-methylenedianiline), PI-PAA, gave no MALDI
signals with classical sample preparation [271].
Modification of the polymer by reacting it with
N-methylethanolamine failed to achieve the intended
purpose. The polymer reacted with N-methylethano-
lamine was further reacted with 2-fluoro-1-methylpir-
idinium p-toluensolfonate and eventually the MALDI
spectrum could be recorded. From it, the authors
determined the structure of the modified polymer and
inferred properties of the pristine polymer. In particu-
lar, one of the two trimellitic anhydride rings (the imide
ring) could be found in the open form (i.e. amic acid),
and this implies that PI-PAA is a copolymer with
approximately 50% amic acid. Saturated polyolefins
such as PE and polypropylene (PP) were derivatized
prior to the MALDI analysis to produce intact
macromolecules by MALDI [118]. The authors reacted
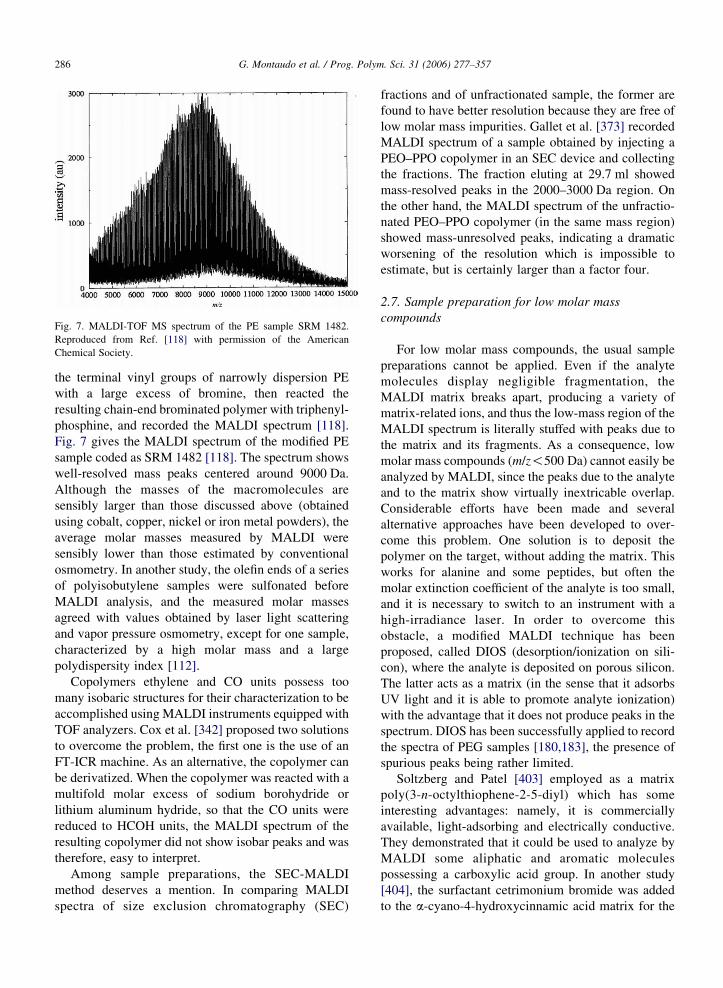
Fig. 7. MALDI-TOF MS spectrum of the PE sample SRM 1482.
Reproduced from Ref. [118] with permission of the American
Chemical Society.
G. Montaudo et al. / Prog. Polym. Sci. 31 (2006) 277–357286
the terminal vinyl groups of narrowly dispersion PE
with a large excess of bromine, then reacted the
resulting chain-end brominated polymer with triphenyl-
phosphine, and recorded the MALDI spectrum [118].
Fig. 7 gives the MALDI spectrum of the modified PE
sample coded as SRM 1482 [118]. The spectrum shows
well-resolved mass peaks centered around 9000 Da.
Although the masses of the macromolecules are
sensibly larger than those discussed above (obtained
using cobalt, copper, nickel or iron metal powders), the
average molar masses measured by MALDI were
sensibly lower than those estimated by conventional
osmometry. In another study, the olefin ends of a series
of polyisobutylene samples were sulfonated before
MALDI analysis, and the measured molar masses
agreed with values obtained by laser light scattering
and vapor pressure osmometry, except for one sample,
characterized by a high molar mass and a large
polydispersity index [112].
Copolymers ethylene and CO units possess too
many isobaric structures for their characterization to be
accomplished using MALDI instruments equipped with
TOF analyzers. Cox et al. [342] proposed two solutions
to overcome the problem, the first one is the use of an
FT-ICR machine. As an alternative, the copolymer can
be derivatized. When the copolymer was reacted with a
multifold molar excess of sodium borohydride or
lithium aluminum hydride, so that the CO units were
reduced to HCOH units, the MALDI spectrum of the
resulting copolymer did not show isobar peaks and was
therefore, easy to interpret.
Among sample preparations, the SEC-MALDI
method deserves a mention. In comparing MALDI
spectra of size exclusion chromatography (SEC)
fractions and of unfractionated sample, the former are
found to have better resolution because they are free of
low molar mass impurities. Gallet et al. [373] recorded
MALDI spectrum of a sample obtained by injecting a
PEO–PPO copolymer in an SEC device and collecting
the fractions. The fraction eluting at 29.7 ml showed
mass-resolved peaks in the 2000–3000 Da region. On
the other hand, the MALDI spectrum of the unfractio-
nated PEO–PPO copolymer (in the same mass region)
showed mass-unresolved peaks, indicating a dramatic
worsening of the resolution which is impossible to
estimate, but is certainly larger than a factor four.
2.7. Sample preparation for low molar mass
compounds
For low molar mass compounds, the usual sample
preparations cannot be applied. Even if the analyte
molecules display negligible fragmentation, the
MALDI matrix breaks apart, producing a variety of
matrix-related ions, and thus the low-mass region of the
MALDI spectrum is literally stuffed with peaks due to
the matrix and its fragments. As a consequence, low
molar mass compounds (m/z!500 Da) cannot easily be
analyzed by MALDI, since the peaks due to the analyte
and to the matrix show virtually inextricable overlap.
Considerable efforts have been made and several
alternative approaches have been developed to over-
come this problem. One solution is to deposit the
polymer on the target, without adding the matrix. This
works for alanine and some peptides, but often the
molar extinction coefficient of the analyte is too small,
and it is necessary to switch to an instrument with a
high-irradiance laser. In order to overcome this
obstacle, a modified MALDI technique has been
proposed, called DIOS (desorption/ionization on sili-
con), where the analyte is deposited on porous silicon.
The latter acts as a matrix (in the sense that it adsorbs
UV light and it is able to promote analyte ionization)
with the advantage that it does not produce peaks in the
spectrum. DIOS has been successfully applied to record
the spectra of PEG samples [180,183], the presence of
spurious peaks being rather limited.
Soltzberg and Patel [403] employed as a matrix
poly(3-n-octylthiophene-2-5-diyl) which has some
interesting advantages: namely, it is commercially
available, light-adsorbing and electrically conductive.
They demonstrated that it could be used to analyze by
MALDI some aliphatic and aromatic molecules
possessing a carboxylic acid group. In another study
[404], the surfactant cetrimonium bromide was added
to the a-cyano-4-hydroxycinnamic acid matrix for the
G. Montaudo et al. / Prog. Polym. Sci. 31 (2006) 277–357 287
successful analysis of a variety of low-mass molecules
by MALDI. Low-mass components of polyesters such
as poly(neopentylglycol adipate) were determined by
MALDI analysis using a 10,15,20-tetrakis(pentafluor-
ophenyl)porphyrin (F20TPP) matrix, which does not
give matrix-related ions below m/zZ822 [242].
2.8. Doping agents
The ionization of synthetic polymers often occurs by
metal clustering (cationization) rather than protonation.
Since many polymers have relatively high cation
affinities, they do not necessarily require a high cation
concentration and thus cations present as impurities in
matrix, reagents, solvents, glassware, etc. may suffice.
However, Bahr et al. [1] put forward the following
objection: if one relies on ‘adventious’ cationization,
the yield of cationized species may turn out to be low
or, more simply, the cationization can prove to be less
than homogeneous. In order to avoid such drawbacks,
they added an alkaline salt solution (LiCl, NaCl, KCl)
to the matrix–analyte mixture (for polystyrene analysis,
silver trifluoroacetate was added instead). Their
objection has a sound foundation, and thus the addition
of dopants is now routine in MALDI.
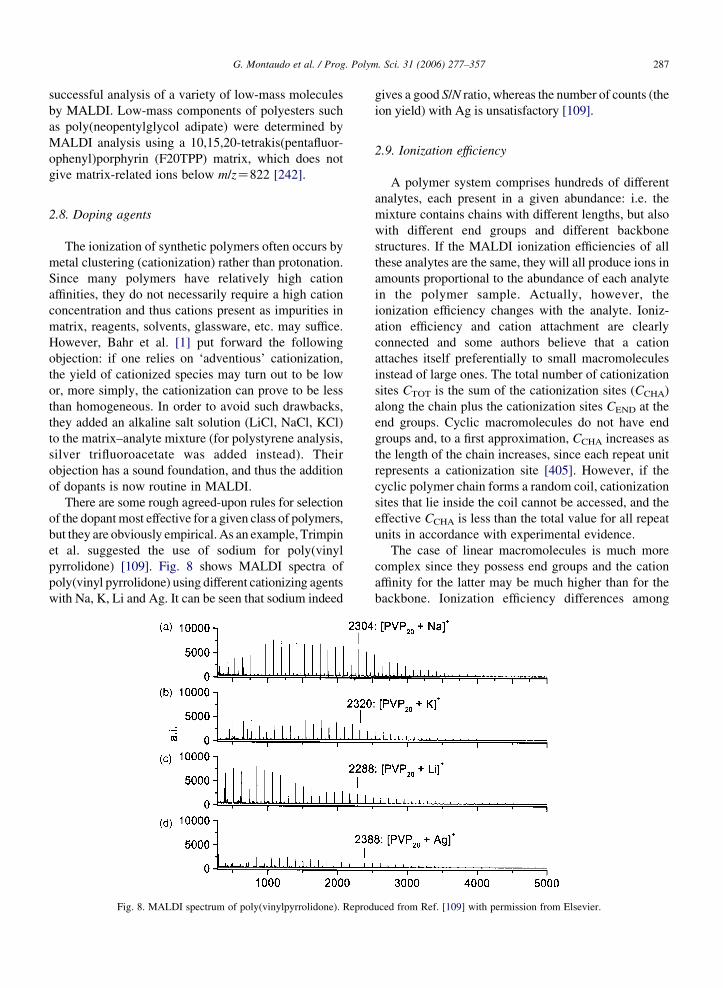
There are some rough agreed-upon rules for selection
of the dopantmost effective for a given class of polymers,
but they are obviously empirical. As an example, Trimpin
et al. suggested the use of sodium for poly(vinyl
pyrrolidone) [109]. Fig. 8 shows MALDI spectra of
poly(vinyl pyrrolidone) using different cationizing agents
with Na, K, Li and Ag. It can be seen that sodium indeed
Fig. 8. MALDI spectrum of poly(vinylpyrrolidone). Reprod
gives a good S/N ratio, whereas the number of counts (the
ion yield) with Ag is unsatisfactory [109].
2.9. Ionization efficiency
A polymer system comprises hundreds of different
analytes, each present in a given abundance: i.e. the
mixture contains chains with different lengths, but also
with different end groups and different backbone
structures. If the MALDI ionization efficiencies of all
these analytes are the same, they will all produce ions in
amounts proportional to the abundance of each analyte
in the polymer sample. Actually, however, the
ionization efficiency changes with the analyte. Ioniz-
ation efficiency and cation attachment are clearly
connected and some authors believe that a cation
attaches itself preferentially to small macromolecules
instead of large ones. The total number of cationization
sites CTOT is the sum of the cationization sites (CCHA)
along the chain plus the cationization sites CEND at the
end groups. Cyclic macromolecules do not have end
groups and, to a first approximation, CCHA increases as
the length of the chain increases, since each repeat unit
represents a cationization site [405]. However, if the
cyclic polymer chain forms a random coil, cationization
sites that lie inside the coil cannot be accessed, and the
effective CCHA is less than the total value for all repeat
units in accordance with experimental evidence.
The case of linear macromolecules is much more
complex since they possess end groups and the cation
affinity for the latter may be much higher than for the
backbone. Ionization efficiency differences among
uced from Ref. [109] with permission from Elsevier.
G. Montaudo et al. / Prog. Polym. Sci. 31 (2006) 277–357288
chains with different lengths are often called ‘mass
discrimination’ [3]. These differences can be estimated
by simply measuring the changes in ionization
efficiency when a low molar mass and a high molar
mass sample are analyzed simultaneously. Mass
discrimination implies that the MALDI response is
not linear with respect to molar mass.
The simplest (and most used) method to study
ionization efficiency is to create a polymer mixture of
known composition and to measure the relative
amounts of ions. In describing these experiments, we
shall differentiate between polymer mixtures with the
same backbone and mixtures with different backbones.
The second kind of mixture is more demanding. A
mixture of two polymers having different end groups
but the same backbone can be produced by mixing
chains of the type G1-AAAAAAA-G2 with chains of
the type G3-AAAAAAA-G4, where G1, G2, G3, G4
are end groups and A is the repeat unit. By recording
the MALDI spectrum of the mixture and measuring
MALDI peak intensities, we can estimate apparent the
relative abundance of the chains. We discuss some
cases of this type. Cox et al. [34] considered a series of
PS samples terminated with hydroxyl, hydrogen,
tertiary amine, and quaternary amine groups. They
observed that the ionization efficiency of PS oligomers
was affected exclusively by the chemical groups at the
PS chain-ends. The PS samples terminated with a
quaternary amine exhibit 10-fold greater ionization
efficiency than the other PS samples studied. The
authors analyzed nine MALDI spectra of 1:1 blends of
these end-functionalized PS samples, finding that the
relative ionization efficiencies of the polymer com-
ponents varies dramatically with the laser power, and
that spectra recorded at the threshold of the laser power
give the most accurate representation of the blend
composition. However, at this usual instrumental
condition, owing to the large difference in ionization
efficiency between the quaternary amine terminated PS
(PSQ) samples and that for all the other functionalities,
accurate quantization of the other component in
mixtures with the PSQ samples is difficult. They also
measured the relative intensity ratio in the MALDI
spectra of the different end terminated PS blends as a
function of the different blend composition, and found a
linear trend for each blend. On the base of these data,
assuming that the ionization efficiency of the PSQ
samples is 100% and comparing mixtures with a
common component, the authors calculated the
ionization efficiency relative to the PSQ of all PS
polymers investigated. They found that the samples
terminated with OH and H end groups have similar
ionization efficiencies, with the tertiary amine slightly
higher, depending on the average molar masses.
Chen et al. [149] considered a mixture of PEGs with
the following structures:
The MALDI spectral quality was good, since the
masses were very low. They plotted the actual
composition versus the composition measured using
MALDI peak intensities. The points lie on a straight
line, with a slope of 45.58, which does not differ much
from 458, which indicates identical ionization efficien-
cies. Okuno et al. [179] analyzed mixtures of linear and
branched polypropyleneglycol (PPG). They noted that
composition (weight percent of branched chains)
measured by MALDI was slightly different from the
actual composition. They noted that the difference
depended on sample preparation and, in particular, on
the concentration of the polymeric solution, and that it
tended to fade away as more concentrated solutions
were used.
Despite the fact that there are some cases in which
MALDI is only semi-quantitative, many studies have
appeared which assume that the ionization efficiency in
mixtures with the same backbone is uniform.
Maziarz et al. [138] considered a mixture of a,u-bis-(t-butylamine-fumaryl-oxy-butyl) poly(dimethyl silox-
ane) (BAF-PDMS) and another polysiloxane (IMPU-
PDMS). The structure of the latter is quite complex,
with two PDMS chains connected by a bridge (for
brevity, we indicate only its empirical formula:
C40H70N2O10Si2 [C2H6OSi]n [C2H6OSi]x).
The MALDI spectrum is a little crowded, since the
mass of IMPU-PDMS is approximately 12 Da greater
than the mass of the corresponding BAF-PDMS.
Taking the ratios of peak intensities (and applying
some corrections), the authors were able to estimate the
abundance ratio, i.e. BAF/IMPUZ67/33. Campbell
et al. [13] analyzed a polystyrene sample, a mixture of
three different types of chains denoted TDB0, TDB1
TDB2. Here, TDB stands for terminal double bonds,
and chains TDB2 are terminated at both ends with a
styrene molecule (and thus two double bonds), whereas
chains TDB0 are terminated by two hydrogens. Using
MALDI peak intensities, the authors were able to
estimate the ratio of abundances TDB0/TDB1/TDB2Z5/90/5. This result yields information about the
polymerization process since it clearly indicates that
TDB0 and TDB2 chains are side-reaction products.
G. Montaudo et al. / Prog. Polym. Sci. 31 (2006) 277–357 289
Libiszowski et al. [257] recorded the MALDI
spectrum of PDX, a polymer obtained by cationic
ring-opening of 1,4-dioxan2one, and noted the simul-
taneous presence of peaks due to cyclic and linear PDX
chains. From the MALDI peak intensities and they
constructed a bar graph of the abundance of cyclic
chains ACIC versus that of linear chains, ALIN. Summing
all the bars in the bar graph, they were able to estimate
the relative (total) abundances, which gave ACIC/
ALINZ59/41. This implies that the reaction produced
large amounts of cycles.
Luftmann et al. [159] reacted a commercial PPO
sample with p-nitrobenzoyl chloride and obtained a
diester- and monoester-terminated PPO chains. They
recorded the MALDI spectrum and, using peak
intensities, found that the diester/monoester mole
ratio was 875/125. It is interesting to note that the
NMR spectrum was useless for this purpose. As the
authors state, it yielded diester/monoesterZ100/0;
but this failure is due to the circumstances that the
monoester and diester signals tend to overlap and
that the integration has an error margin of about
10%.
Ring–chain equilibration reactions are character-
ized by a critical concentration B 0, and when the
concentration is above B 0, they yield a mixture of
cyclic and linear macromolecules. Keki et al. [209]
obtained poly(lactic acid) by ring–chain equilibration.
They measured the MALDI spectral intensities due
to cyclic and linear chains and assumed them to have
the same ionization efficiency. From the ratio of
intensities, they were able to estimate B 0 and found
that it varied from 100 to 1000 l/mol, depending on
the temperature.
Recording the MALDI spectrum of a mixture of two
polymers having different backbones, one finds that
MALDI peak intensities reflect in a distorted manner
the abundances of the chains and the composition of the
blend. In some cases, the distortion is small and thus
MALDI is semiquantitative. In the following, we
discuss some examples. Scamporrino et al. [406]
showed that two instrumental parameters could affect
peak intensities, thus falsifying the composition of the
blend. The two parameters are the delay time (DETIM)
and the voltage of a wire electrode (VOWIEL)
measured in percent of grid voltage (the wire electrode
acts on ion trajectories, attracting the ions). The authors
studied an equimolar mixture of PEG and PMMA,
recorded the MALDI spectrum of the mixture and
found, on changing DETIM and VOWIEL, that the
apparent blend composition changed from 100/0 to 50/
50 to 0/100.
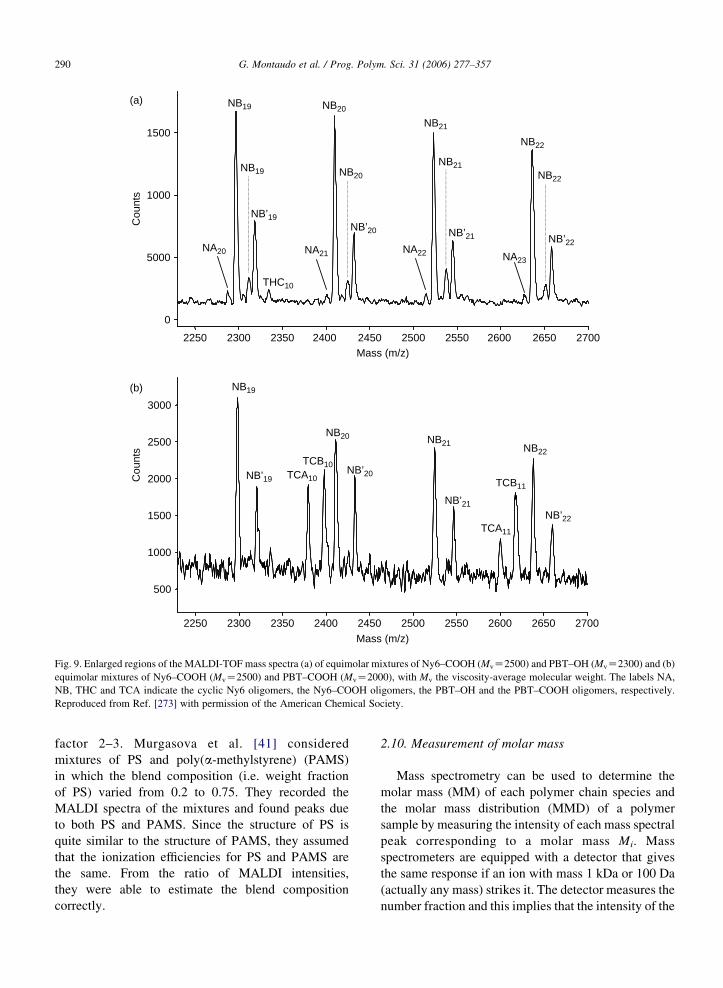
Alicata et al. [273,274] considered a blend of
Nylon 6 (Ny6) and poly(butylene terephthalate)
(PBT) oligomers and noticed that their ionization
efficiencies varied greatly, depending on the end
groups. Fig. 9a shows the MALDI spectrum of the
Ny6/PBT mixture. It can be seen that the peaks due
to the Nylon 6 polymers terminated with carboxyl
groups (Ph–Ny6–COOH) predominate over those for
the PBT sample terminated with hydroxyl end groups
(HO–PBT–OH) although the polymers used have
similar molar mass distributions and were present as
an equimolar blend. Similar behavior was observed in
the analysis of an equimolar mixture of Ny6
terminated with amino groups (Ny6–NH2) and
PBT–OH. However, MALDI spectra of blends of
Ny6–COOH and PBT polymers terminated with
carboxyl groups (PBT–COOH) show peaks of
comparable intensity due to both polymers, as can
be observed in Fig. 9b. When an equimolar mixture
of PBT–OH and PBT–COOH was analyzed, MALDI
spectra showed intense peaks due to PBT–COOH
oligomers at lower mass, whereas above 2000 Da
peaks due to PBT–OH became more intense, as the
intensities of peaks due to the two PBT polymers
tended to equalize. Since the number of end groups in
both polymers decreased at higher mass, this result
indicates the preponderant effect of the end groups on
the ionization efficiency of oligomers.
Yan et al. [141] recorded the MALDI spectrum of a
mixture of PMMA and PDMS and found that PMMA
peaks were absent, even when the mole fraction of
PMMA exceeded the mole fraction of PDMS by a
factor of four. The authors proposed an explanation
based on the fact that the PMMA had a high molar mass
and high polydispersity index (MnZ33,000 and MwZ100,000). However, a simple calculation shows that
such a sample should be characterized by a very large
amount of low-molar mass oligomers and thus strong
PMMA MALDI peaks were to be expected. Possible
explanations are that the ionization efficiencies of
PMMA and PDMS are very different or that the
instrumental parameters DETIM and VOWIEL had
values that favor the PDMS ions and suppress the
PMMA ions.
Chapman et al. [210] reported the MALDI
spectrum of an almost equimolar mixture of poly-
(butylene glutarate) (PBuGu) and poly(butylene
adipate) (PBA). Peaks due to PBA dominate the
spectrum, and this clearly indicates that PBA is
preferentially ionized. Measuring peak intensities and
summing them, we found PBuGu/PBAZ30/70, which
indicates a difference in ionization efficiency of a
0
5000
1000
1500C
ount
s
2250 2300 2350 2400 2450 2500 2550 2600 2650 2700Mass (m/z)
NB19 NB20
NB21
NB22
NB’19NB’20 NB’21 NB’22
NA20 NA22 NA23
THC10
NB19 NB20
NB21NB22
NA21
(a)
NB20 NB21 NB22
NB’20
NB’21
NB’22
TCB10TCA10 TCB11
TCA11
500
1000
1500
2000
2500
3000
Cou
nts
2250 2300 2350 2400 2450 2500 2550 2600 2650 2700
Mass (m/z)
NB19
NB’19
(b)
Fig. 9. Enlarged regions of the MALDI-TOF mass spectra (a) of equimolar mixtures of Ny6–COOH (MvZ2500) and PBT–OH (MvZ2300) and (b)
equimolar mixtures of Ny6–COOH (MvZ2500) and PBT–COOH (MvZ2000), with Mv the viscosity-average molecular weight. The labels NA,
NB, THC and TCA indicate the cyclic Ny6 oligomers, the Ny6–COOH oligomers, the PBT–OH and the PBT–COOH oligomers, respectively.
Reproduced from Ref. [273] with permission of the American Chemical Society.
G. Montaudo et al. / Prog. Polym. Sci. 31 (2006) 277–357290
factor 2–3. Murgasova et al. [41] considered
mixtures of PS and poly(a-methylstyrene) (PAMS)
in which the blend composition (i.e. weight fraction
of PS) varied from 0.2 to 0.75. They recorded the
MALDI spectra of the mixtures and found peaks due
to both PS and PAMS. Since the structure of PS is
quite similar to the structure of PAMS, they assumed
that the ionization efficiencies for PS and PAMS are
the same. From the ratio of MALDI intensities,
they were able to estimate the blend composition
correctly.
2.10. Measurement of molar mass
Mass spectrometry can be used to determine the
molar mass (MM) of each polymer chain species and
the molar mass distribution (MMD) of a polymer
sample by measuring the intensity of each mass spectral
peak corresponding to a molar mass Mi. Mass
spectrometers are equipped with a detector that gives
the same response if an ion with mass 1 kDa or 100 Da
(actually any mass) strikes it. The detector measures the
number fraction and this implies that the intensity of the
G. Montaudo et al. / Prog. Polym. Sci. 31 (2006) 277–357 291
ith peak is proportional to Ni, the number of chains with
mass Mi. The number average and weight average
molar masses defined by
Mn ZX
MiNi=X
Ni ZX
Wi=X
MiWi
n oK1
(3)
and
Mw ZX
M2i Ni=
XMiNi Z
XMiWi=
XWi (4)
are readily obtained.
Wallace et al. [50] developed an operator-indepen-
dent approach to mass spectral peak identification and
integration, which is claimed to increase the accuracy
of the summations and thus the accuracy of the Mn and
Mw values obtained. The method is straightforward and
the calculations can be performed independently of
whether the spectrum is mass-resolved. The definitions
given by Eqs. (3) and (4) are quite old, certainly older
than MALDI, and they may be used with other types of
mass spectrometers such as FAB (fast atom bombard-
ment), PD (plasma desorption), or LD (laser deso-
rption). For instance, in 1986, Brown et al. [407]
recorded the LD spectrum of a polymer sample with
masses well beyond 5 kDa and extracted the average
molar mass values (Mn and Mw) embedded in the mass
spectrum.
In order to obtain the MMD of the polymer, mass
spectral data must be processed using a suitable
transformation algorithm, and the quantities Ni (i.e.
the fraction of the chains with mass mi) are transformed
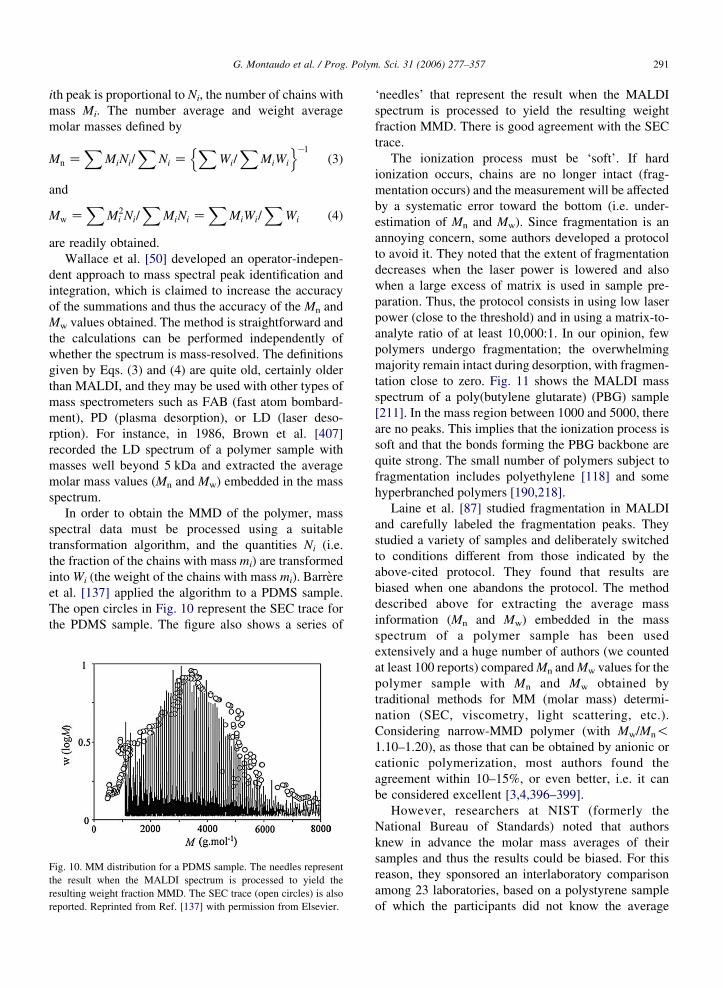
into Wi (the weight of the chains with mass mi). Barrere
et al. [137] applied the algorithm to a PDMS sample.
The open circles in Fig. 10 represent the SEC trace for
the PDMS sample. The figure also shows a series of
Fig. 10. MM distribution for a PDMS sample. The needles represent
the result when the MALDI spectrum is processed to yield the
resulting weight fraction MMD. The SEC trace (open circles) is also
reported. Reprinted from Ref. [137] with permission from Elsevier.
‘needles’ that represent the result when the MALDI
spectrum is processed to yield the resulting weight
fraction MMD. There is good agreement with the SEC
trace.
The ionization process must be ‘soft’. If hard
ionization occurs, chains are no longer intact (frag-
mentation occurs) and the measurement will be affected
by a systematic error toward the bottom (i.e. under-
estimation of Mn and Mw). Since fragmentation is an
annoying concern, some authors developed a protocol
to avoid it. They noted that the extent of fragmentation
decreases when the laser power is lowered and also
when a large excess of matrix is used in sample pre-
paration. Thus, the protocol consists in using low laser
power (close to the threshold) and in using a matrix-to-
analyte ratio of at least 10,000:1. In our opinion, few
polymers undergo fragmentation; the overwhelming
majority remain intact during desorption, with fragmen-
tation close to zero. Fig. 11 shows the MALDI mass
spectrum of a poly(butylene glutarate) (PBG) sample
[211]. In the mass region between 1000 and 5000, there
are no peaks. This implies that the ionization process is
soft and that the bonds forming the PBG backbone are
quite strong. The small number of polymers subject to
fragmentation includes polyethylene [118] and some
hyperbranched polymers [190,218].
Laine et al. [87] studied fragmentation in MALDI
and carefully labeled the fragmentation peaks. They
studied a variety of samples and deliberately switched
to conditions different from those indicated by the
above-cited protocol. They found that results are
biased when one abandons the protocol. The method
described above for extracting the average mass
information (Mn and Mw) embedded in the mass
spectrum of a polymer sample has been used
extensively and a huge number of authors (we counted
at least 100 reports) compared Mn and Mw values for the
polymer sample with Mn and Mw obtained by
traditional methods for MM (molar mass) determi-
nation (SEC, viscometry, light scattering, etc.).
Considering narrow-MMD polymer (with Mw/Mn!1.10–1.20), as those that can be obtained by anionic or
cationic polymerization, most authors found the
agreement within 10–15%, or even better, i.e. it can
be considered excellent [3,4,396–399].
However, researchers at NIST (formerly the
National Bureau of Standards) noted that authors
knew in advance the molar mass averages of their
samples and thus the results could be biased. For this
reason, they sponsored an interlaboratory comparison
among 23 laboratories, based on a polystyrene sample
of which the participants did not know the average
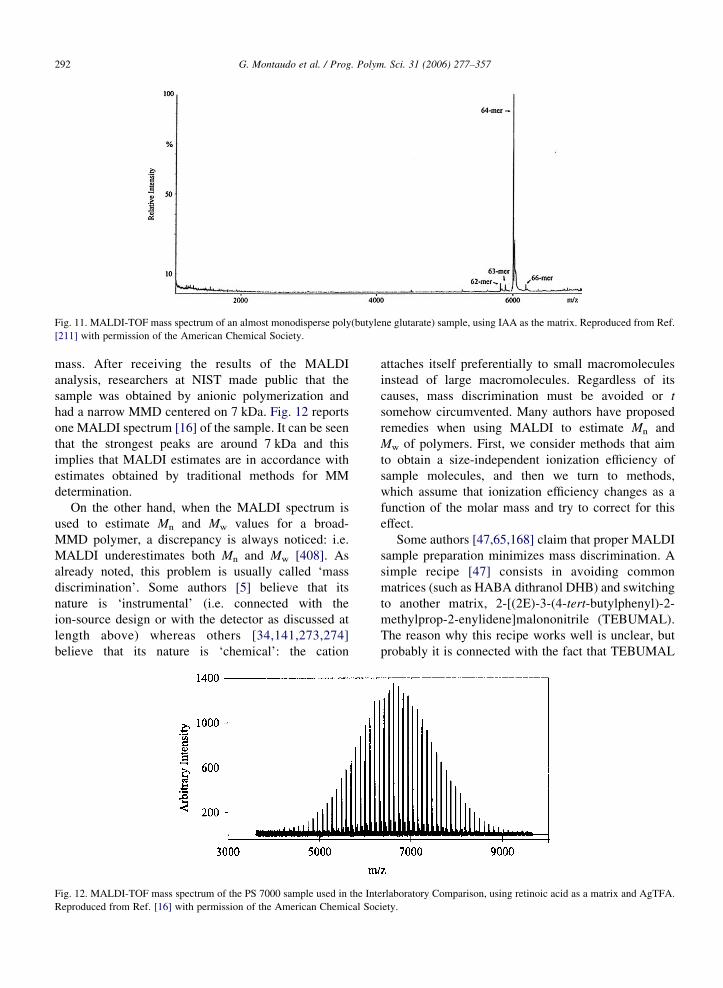
Fig. 11. MALDI-TOF mass spectrum of an almost monodisperse poly(butylene glutarate) sample, using IAA as the matrix. Reproduced from Ref.
[211] with permission of the American Chemical Society.
G. Montaudo et al. / Prog. Polym. Sci. 31 (2006) 277–357292
mass. After receiving the results of the MALDI
analysis, researchers at NIST made public that the
sample was obtained by anionic polymerization and
had a narrow MMD centered on 7 kDa. Fig. 12 reports
one MALDI spectrum [16] of the sample. It can be seen
that the strongest peaks are around 7 kDa and this
implies that MALDI estimates are in accordance with
estimates obtained by traditional methods for MM
determination.
On the other hand, when the MALDI spectrum is
used to estimate Mn and Mw values for a broad-
MMD polymer, a discrepancy is always noticed: i.e.
MALDI underestimates both Mn and Mw [408]. As
already noted, this problem is usually called ‘mass
discrimination’. Some authors [5] believe that its
nature is ‘instrumental’ (i.e. connected with the
ion-source design or with the detector as discussed at
length above) whereas others [34,141,273,274]
believe that its nature is ‘chemical’: the cation
Fig. 12. MALDI-TOF mass spectrum of the PS 7000 sample used in the Int
Reproduced from Ref. [16] with permission of the American Chemical Soc
attaches itself preferentially to small macromolecules
instead of large macromolecules. Regardless of its
causes, mass discrimination must be avoided or t
somehow circumvented. Many authors have proposed
remedies when using MALDI to estimate Mn and
Mw of polymers. First, we consider methods that aim
to obtain a size-independent ionization efficiency of
sample molecules, and then we turn to methods,
which assume that ionization efficiency changes as a
function of the molar mass and try to correct for this
effect.
Some authors [47,65,168] claim that proper MALDI
sample preparation minimizes mass discrimination. A
simple recipe [47] consists in avoiding common
matrices (such as HABA dithranol DHB) and switching
to another matrix, 2-[(2E)-3-(4-tert-butylphenyl)-2-
methylprop-2-enylidene]malononitrile (TEBUMAL).
The reason why this recipe works well is unclear, but
probably it is connected with the fact that TEBUMAL
erlaboratory Comparison, using retinoic acid as a matrix and AgTFA.
iety.
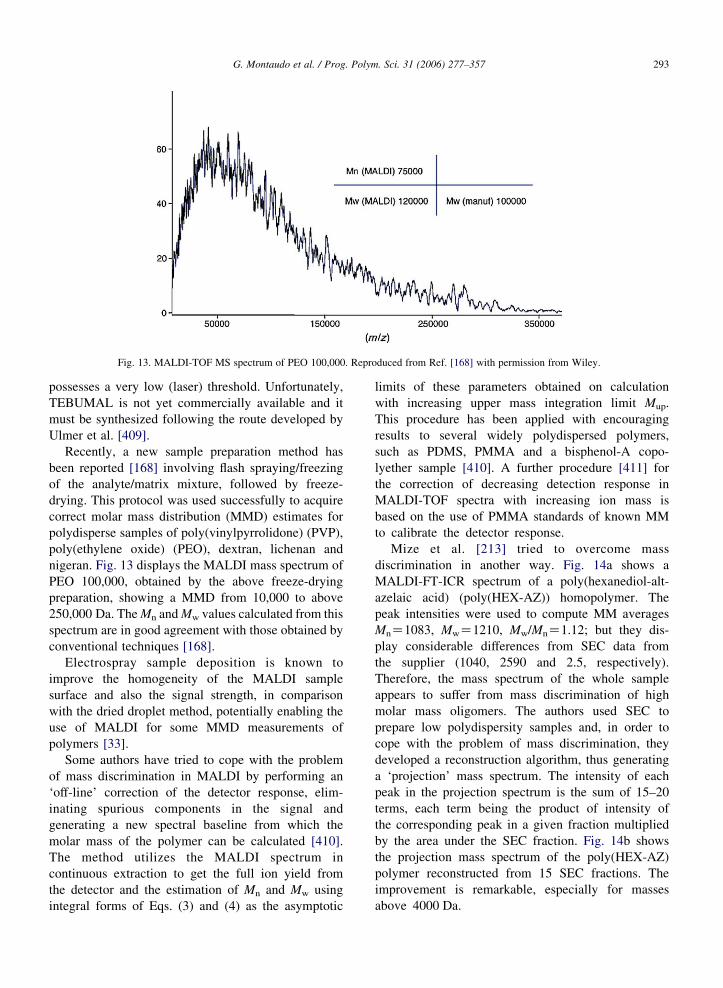
Fig. 13. MALDI-TOF MS spectrum of PEO 100,000. Reproduced from Ref. [168] with permission from Wiley.
G. Montaudo et al. / Prog. Polym. Sci. 31 (2006) 277–357 293
possesses a very low (laser) threshold. Unfortunately,
TEBUMAL is not yet commercially available and it
must be synthesized following the route developed by
Ulmer et al. [409].
Recently, a new sample preparation method has
been reported [168] involving flash spraying/freezing
of the analyte/matrix mixture, followed by freeze-
drying. This protocol was used successfully to acquire
correct molar mass distribution (MMD) estimates for
polydisperse samples of poly(vinylpyrrolidone) (PVP),
poly(ethylene oxide) (PEO), dextran, lichenan and
nigeran. Fig. 13 displays the MALDI mass spectrum of
PEO 100,000, obtained by the above freeze-drying
preparation, showing a MMD from 10,000 to above
250,000 Da. The Mn and Mw values calculated from this
spectrum are in good agreement with those obtained by
conventional techniques [168].
Electrospray sample deposition is known to
improve the homogeneity of the MALDI sample
surface and also the signal strength, in comparison
with the dried droplet method, potentially enabling the
use of MALDI for some MMD measurements of
polymers [33].
Some authors have tried to cope with the problem
of mass discrimination in MALDI by performing an
‘off-line’ correction of the detector response, elim-
inating spurious components in the signal and
generating a new spectral baseline from which the
molar mass of the polymer can be calculated [410].
The method utilizes the MALDI spectrum in
continuous extraction to get the full ion yield from
the detector and the estimation of Mn and Mw using
integral forms of Eqs. (3) and (4) as the asymptotic
limits of these parameters obtained on calculation
with increasing upper mass integration limit Mup.
This procedure has been applied with encouraging
results to several widely polydispersed polymers,
such as PDMS, PMMA and a bisphenol-A copo-
lyether sample [410]. A further procedure [411] for
the correction of decreasing detection response in
MALDI-TOF spectra with increasing ion mass is
based on the use of PMMA standards of known MM
to calibrate the detector response.
Mize et al. [213] tried to overcome mass
discrimination in another way. Fig. 14a shows a
MALDI-FT-ICR spectrum of a poly(hexanediol-alt-
azelaic acid) (poly(HEX-AZ)) homopolymer. The
peak intensities were used to compute MM averages
MnZ1083, MwZ1210, Mw/MnZ1.12; but they dis-
play considerable differences from SEC data from
the supplier (1040, 2590 and 2.5, respectively).
Therefore, the mass spectrum of the whole sample
appears to suffer from mass discrimination of high
molar mass oligomers. The authors used SEC to
prepare low polydispersity samples and, in order to
cope with the problem of mass discrimination, they
developed a reconstruction algorithm, thus generating
a ‘projection’ mass spectrum. The intensity of each
peak in the projection spectrum is the sum of 15–20
terms, each term being the product of intensity of
the corresponding peak in a given fraction multiplied
by the area under the SEC fraction. Fig. 14b shows
the projection mass spectrum of the poly(HEX-AZ)
polymer reconstructed from 15 SEC fractions. The
improvement is remarkable, especially for masses
above 4000 Da.
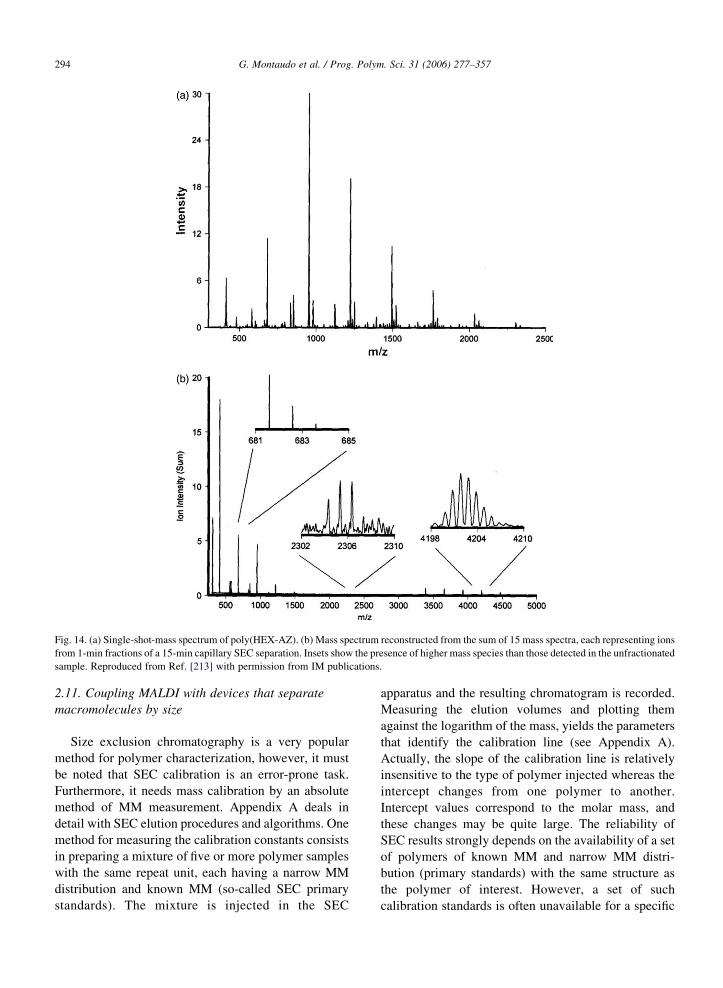
Fig. 14. (a) Single-shot-mass spectrum of poly(HEX-AZ). (b) Mass spectrum reconstructed from the sum of 15 mass spectra, each representing ions
from 1-min fractions of a 15-min capillary SEC separation. Insets show the presence of higher mass species than those detected in the unfractionated
sample. Reproduced from Ref. [213] with permission from IM publications.
G. Montaudo et al. / Prog. Polym. Sci. 31 (2006) 277–357294
2.11. Coupling MALDI with devices that separate
macromolecules by size
Size exclusion chromatography is a very popular
method for polymer characterization, however, it must
be noted that SEC calibration is an error-prone task.
Furthermore, it needs mass calibration by an absolute
method of MM measurement. Appendix A deals in
detail with SEC elution procedures and algorithms. One
method for measuring the calibration constants consists
in preparing a mixture of five or more polymer samples
with the same repeat unit, each having a narrow MM
distribution and known MM (so-called SEC primary
standards). The mixture is injected in the SEC
apparatus and the resulting chromatogram is recorded.
Measuring the elution volumes and plotting them
against the logarithm of the mass, yields the parameters
that identify the calibration line (see Appendix A).
Actually, the slope of the calibration line is relatively
insensitive to the type of polymer injected whereas the
intercept changes from one polymer to another.
Intercept values correspond to the molar mass, and
these changes may be quite large. The reliability of
SEC results strongly depends on the availability of a set
of polymers of known MM and narrow MM distri-
bution (primary standards) with the same structure as
the polymer of interest. However, a set of such
calibration standards is often unavailable for a specific
0 10 20 30 40Ve (ml)
m/z
m/z m/z
m/z
Arb
itrar
y U
nits
310000
190000 49000
2400
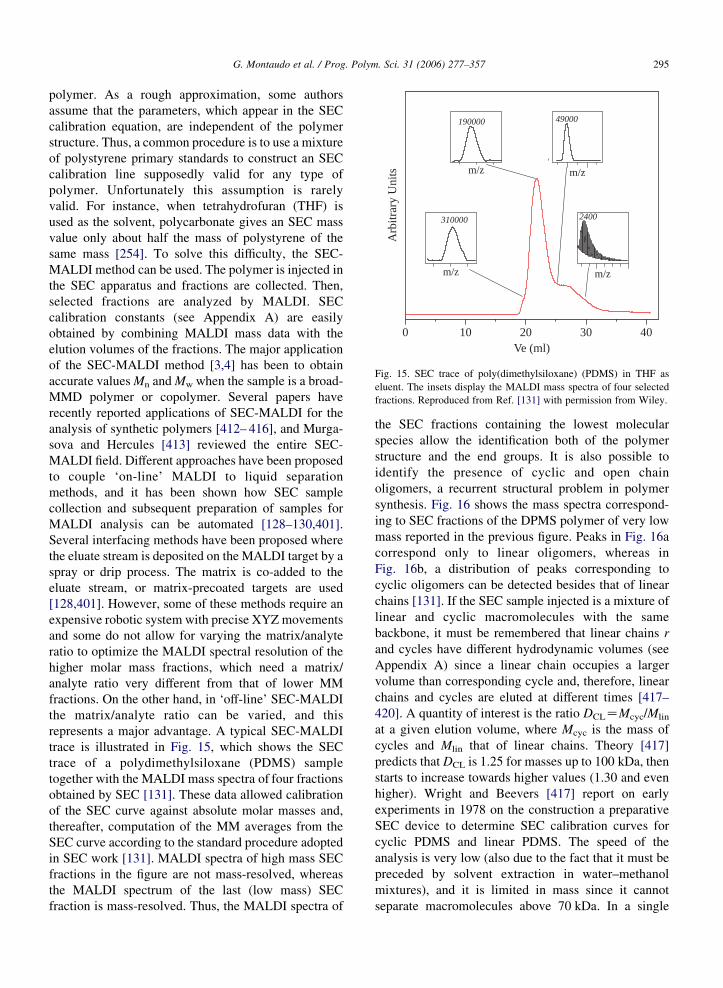
Fig. 15. SEC trace of poly(dimethylsiloxane) (PDMS) in THF as
eluent. The insets display the MALDI mass spectra of four selected
fractions. Reproduced from Ref. [131] with permission from Wiley.
G. Montaudo et al. / Prog. Polym. Sci. 31 (2006) 277–357 295
polymer. As a rough approximation, some authors
assume that the parameters, which appear in the SEC
calibration equation, are independent of the polymer
structure. Thus, a common procedure is to use a mixture
of polystyrene primary standards to construct an SEC
calibration line supposedly valid for any type of
polymer. Unfortunately this assumption is rarely
valid. For instance, when tetrahydrofuran (THF) is
used as the solvent, polycarbonate gives an SEC mass
value only about half the mass of polystyrene of the
same mass [254]. To solve this difficulty, the SEC-
MALDI method can be used. The polymer is injected in
the SEC apparatus and fractions are collected. Then,
selected fractions are analyzed by MALDI. SEC
calibration constants (see Appendix A) are easily
obtained by combining MALDI mass data with the
elution volumes of the fractions. The major application
of the SEC-MALDI method [3,4] has been to obtain
accurate values Mn and Mw when the sample is a broad-
MMD polymer or copolymer. Several papers have
recently reported applications of SEC-MALDI for the
analysis of synthetic polymers [412– 416], and Murga-
sova and Hercules [413] reviewed the entire SEC-
MALDI field. Different approaches have been proposed
to couple ‘on-line’ MALDI to liquid separation
methods, and it has been shown how SEC sample
collection and subsequent preparation of samples for
MALDI analysis can be automated [128–130,401].
Several interfacing methods have been proposed where
the eluate stream is deposited on the MALDI target by a
spray or drip process. The matrix is co-added to the
eluate stream, or matrix-precoated targets are used
[128,401]. However, some of these methods require an
expensive robotic system with precise XYZmovements
and some do not allow for varying the matrix/analyte
ratio to optimize the MALDI spectral resolution of the
higher molar mass fractions, which need a matrix/
analyte ratio very different from that of lower MM
fractions. On the other hand, in ‘off-line’ SEC-MALDI
the matrix/analyte ratio can be varied, and this
represents a major advantage. A typical SEC-MALDI
trace is illustrated in Fig. 15, which shows the SEC
trace of a polydimethylsiloxane (PDMS) sample
together with the MALDI mass spectra of four fractions
obtained by SEC [131]. These data allowed calibration
of the SEC curve against absolute molar masses and,
thereafter, computation of the MM averages from the
SEC curve according to the standard procedure adopted
in SEC work [131]. MALDI spectra of high mass SEC
fractions in the figure are not mass-resolved, whereas
the MALDI spectrum of the last (low mass) SEC
fraction is mass-resolved. Thus, the MALDI spectra of
the SEC fractions containing the lowest molecular
species allow the identification both of the polymer
structure and the end groups. It is also possible to
identify the presence of cyclic and open chain
oligomers, a recurrent structural problem in polymer
synthesis. Fig. 16 shows the mass spectra correspond-
ing to SEC fractions of the DPMS polymer of very low
mass reported in the previous figure. Peaks in Fig. 16a
correspond only to linear oligomers, whereas in
Fig. 16b, a distribution of peaks corresponding to
cyclic oligomers can be detected besides that of linear
chains [131]. If the SEC sample injected is a mixture of
linear and cyclic macromolecules with the same
backbone, it must be remembered that linear chains r
and cycles have different hydrodynamic volumes (see
Appendix A) since a linear chain occupies a larger
volume than corresponding cycle and, therefore, linear
chains and cycles are eluted at different times [417–
420]. A quantity of interest is the ratio DCLZMcyc/Mlin
at a given elution volume, where Mcyc is the mass of
cycles and Mlin that of linear chains. Theory [417]
predicts that DCL is 1.25 for masses up to 100 kDa, then
starts to increase towards higher values (1.30 and even
higher). Wright and Beevers [417] report on early
experiments in 1978 on the construction a preparative
SEC device to determine SEC calibration curves for
cyclic PDMS and linear PDMS. The speed of the
analysis is very low (also due to the fact that it must be
preceded by solvent extraction in water–methanol
mixtures), and it is limited in mass since it cannot
separate macromolecules above 70 kDa. In a single
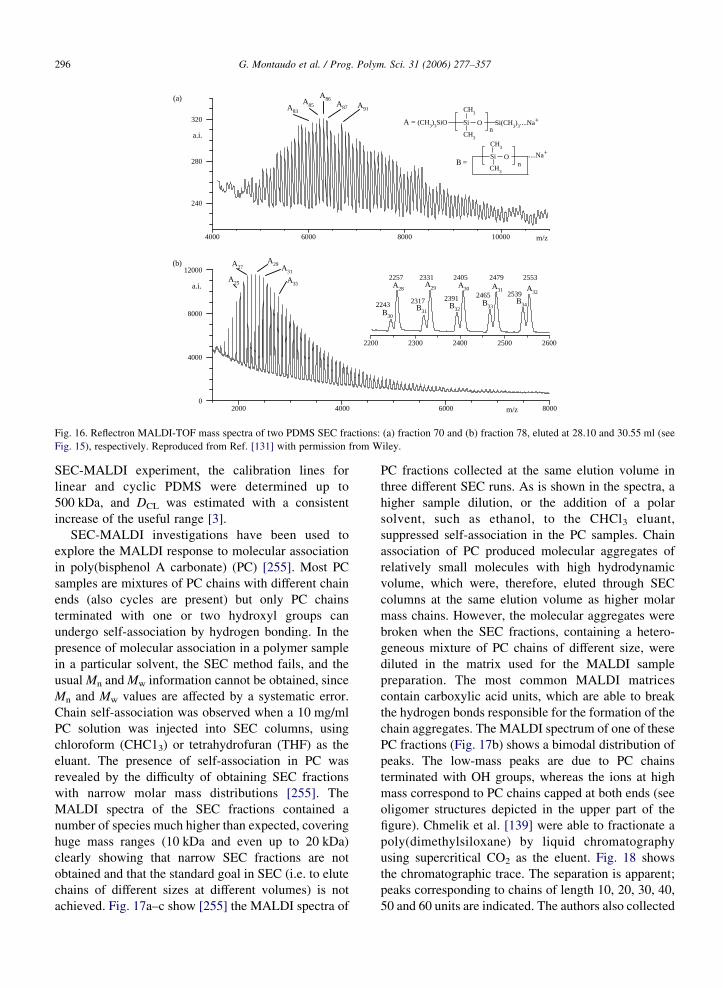
0
4000
8000
12000
240
280
320
2000 4000 6000 8000
2200 2300 2400 2500 2600
4000 6000 8000 10000
2243 2317 2391 2465 2539
2257 2331 2405 2479 2553
B30
B31B32
B33B34
A30A28A29 A31 A32
A27A29
A31
A25 A35
A86A87
A85A83A91
OSi
CH3
CH3
....Na+
n
OSi
CH3
CH3
Si(CH3)3....Na+
nA = (CH
3)3SiO
B =
m/z
m/z
a.i.
a.i.
(a)
(b)
Fig. 16. Reflectron MALDI-TOF mass spectra of two PDMS SEC fractions: (a) fraction 70 and (b) fraction 78, eluted at 28.10 and 30.55 ml (see
Fig. 15), respectively. Reproduced from Ref. [131] with permission from Wiley.
G. Montaudo et al. / Prog. Polym. Sci. 31 (2006) 277–357296
SEC-MALDI experiment, the calibration lines for
linear and cyclic PDMS were determined up to
500 kDa, and DCL was estimated with a consistent
increase of the useful range [3].
SEC-MALDI investigations have been used to
explore the MALDI response to molecular association
in poly(bisphenol A carbonate) (PC) [255]. Most PC
samples are mixtures of PC chains with different chain
ends (also cycles are present) but only PC chains
terminated with one or two hydroxyl groups can
undergo self-association by hydrogen bonding. In the
presence of molecular association in a polymer sample
in a particular solvent, the SEC method fails, and the
usual Mn and Mw information cannot be obtained, since
Mn and Mw values are affected by a systematic error.
Chain self-association was observed when a 10 mg/ml
PC solution was injected into SEC columns, using
chloroform (CHC13) or tetrahydrofuran (THF) as the
eluant. The presence of self-association in PC was
revealed by the difficulty of obtaining SEC fractions
with narrow molar mass distributions [255]. The
MALDI spectra of the SEC fractions contained a
number of species much higher than expected, covering
huge mass ranges (10 kDa and even up to 20 kDa)
clearly showing that narrow SEC fractions are not
obtained and that the standard goal in SEC (i.e. to elute
chains of different sizes at different volumes) is not
achieved. Fig. 17a–c show [255] the MALDI spectra of
PC fractions collected at the same elution volume in
three different SEC runs. As is shown in the spectra, a
higher sample dilution, or the addition of a polar
solvent, such as ethanol, to the CHCl3 eluant,
suppressed self-association in the PC samples. Chain
association of PC produced molecular aggregates of
relatively small molecules with high hydrodynamic
volume, which were, therefore, eluted through SEC
columns at the same elution volume as higher molar
mass chains. However, the molecular aggregates were
broken when the SEC fractions, containing a hetero-
geneous mixture of PC chains of different size, were
diluted in the matrix used for the MALDI sample
preparation. The most common MALDI matrices
contain carboxylic acid units, which are able to break
the hydrogen bonds responsible for the formation of the
chain aggregates. The MALDI spectrum of one of these
PC fractions (Fig. 17b) shows a bimodal distribution of
peaks. The low-mass peaks are due to PC chains
terminated with OH groups, whereas the ions at high
mass correspond to PC chains capped at both ends (see
oligomer structures depicted in the upper part of the
figure). Chmelik et al. [139] were able to fractionate a
poly(dimethylsiloxane) by liquid chromatography
using supercritical CO2 as the eluent. Fig. 18 shows
the chromatographic trace. The separation is apparent;
peaks corresponding to chains of length 10, 20, 30, 40,
50 and 60 units are indicated. The authors also collected
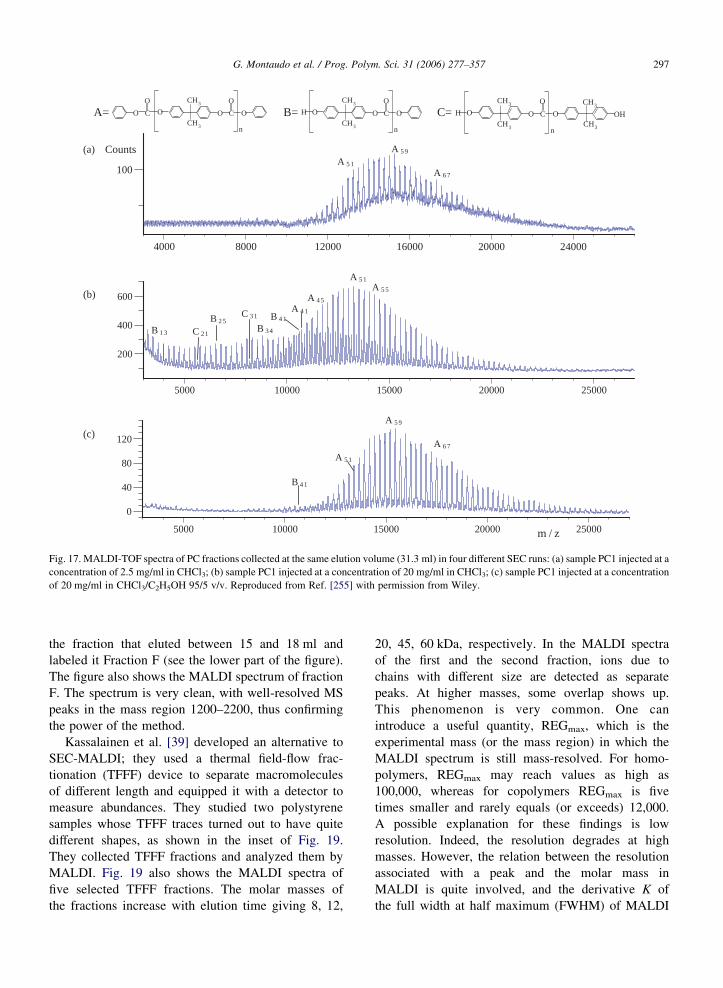
CH3
CH3 O
OO COO
n
O
CA= B=CH3
CH3 O
OO COH
nCH3
CH3 O
OO COH
CH3
CH3
OH
n
C=
100
4000 8000 12000 16000 20000 24000
A 5 1
A 5 9
A 6 7
Counts(a)
200
400
600
5000 10000 15000 20000 25000
A 5 1A 5 5
A 4 5
A 4 1B 4 1
B 3 4
B 2 5C 31
C 21B 1 3
(b)
0
40
80
120
5000 10000 15000 20000 25000m / z
A 5 1
A 5 9
A 6 7
B 4 1
(c)
Fig. 17. MALDI-TOF spectra of PC fractions collected at the same elution volume (31.3 ml) in four different SEC runs: (a) sample PC1 injected at a
concentration of 2.5 mg/ml in CHCl3; (b) sample PC1 injected at a concentration of 20 mg/ml in CHCl3; (c) sample PC1 injected at a concentration
of 20 mg/ml in CHCl3/C2H5OH 95/5 v/v. Reproduced from Ref. [255] with permission from Wiley.
G. Montaudo et al. / Prog. Polym. Sci. 31 (2006) 277–357 297
the fraction that eluted between 15 and 18 ml and
labeled it Fraction F (see the lower part of the figure).
The figure also shows the MALDI spectrum of fraction
F. The spectrum is very clean, with well-resolved MS
peaks in the mass region 1200–2200, thus confirming
the power of the method.
Kassalainen et al. [39] developed an alternative to
SEC-MALDI; they used a thermal field-flow frac-
tionation (TFFF) device to separate macromolecules
of different length and equipped it with a detector to
measure abundances. They studied two polystyrene
samples whose TFFF traces turned out to have quite
different shapes, as shown in the inset of Fig. 19.
They collected TFFF fractions and analyzed them by
MALDI. Fig. 19 also shows the MALDI spectra of
five selected TFFF fractions. The molar masses of
the fractions increase with elution time giving 8, 12,
20, 45, 60 kDa, respectively. In the MALDI spectra
of the first and the second fraction, ions due to
chains with different size are detected as separate
peaks. At higher masses, some overlap shows up.
This phenomenon is very common. One can
introduce a useful quantity, REGmax, which is the
experimental mass (or the mass region) in which the
MALDI spectrum is still mass-resolved. For homo-
polymers, REGmax may reach values as high as
100,000, whereas for copolymers REGmax is five
times smaller and rarely equals (or exceeds) 12,000.
A possible explanation for these findings is low
resolution. Indeed, the resolution degrades at high
masses. However, the relation between the resolution
associated with a peak and the molar mass in
MALDI is quite involved, and the derivative K of
the full width at half maximum (FWHM) of MALDI
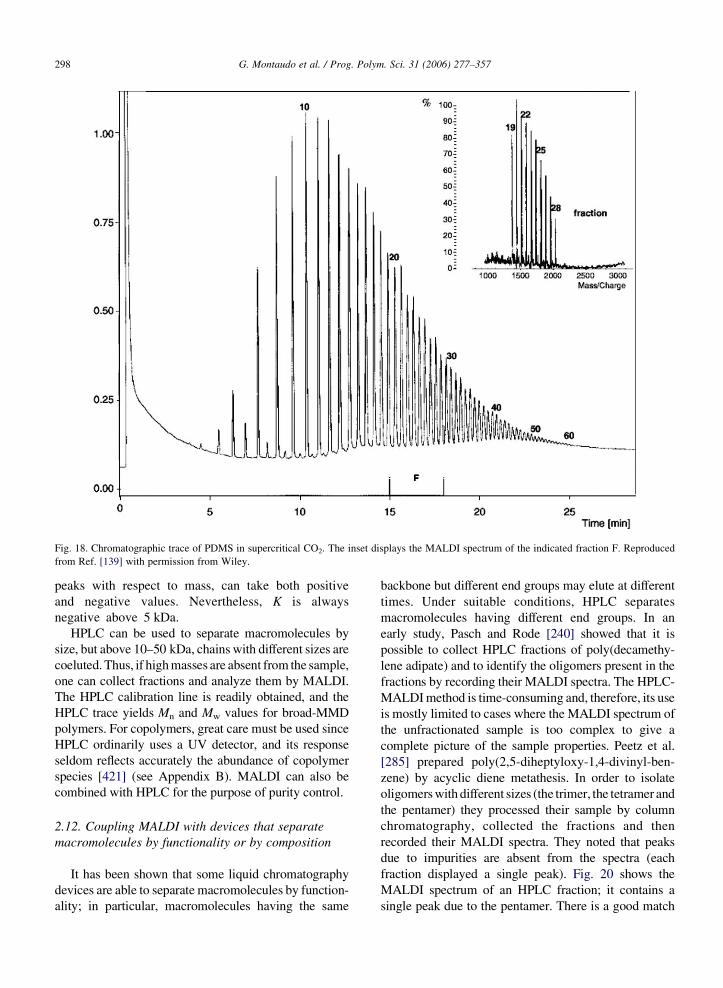
Fig. 18. Chromatographic trace of PDMS in supercritical CO2. The inset displays the MALDI spectrum of the indicated fraction F. Reproduced
from Ref. [139] with permission from Wiley.
G. Montaudo et al. / Prog. Polym. Sci. 31 (2006) 277–357298
peaks with respect to mass, can take both positive
and negative values. Nevertheless, K is always
negative above 5 kDa.
HPLC can be used to separate macromolecules by
size, but above 10–50 kDa, chains with different sizes are
coeluted. Thus, if highmasses are absent from the sample,
one can collect fractions and analyze them by MALDI.
The HPLC calibration line is readily obtained, and the
HPLC trace yields Mn and Mw values for broad-MMD
polymers. For copolymers, great care must be used since
HPLC ordinarily uses a UV detector, and its response
seldom reflects accurately the abundance of copolymer
species [421] (see Appendix B). MALDI can also be
combined with HPLC for the purpose of purity control.
2.12. Coupling MALDI with devices that separate
macromolecules by functionality or by composition
It has been shown that some liquid chromatography
devices are able to separate macromolecules by function-
ality; in particular, macromolecules having the same
backbone but different end groups may elute at different
times. Under suitable conditions, HPLC separates
macromolecules having different end groups. In an
early study, Pasch and Rode [240] showed that it is
possible to collect HPLC fractions of poly(decamethy-
lene adipate) and to identify the oligomers present in the
fractions by recording their MALDI spectra. The HPLC-
MALDImethod is time-consuming and, therefore, its use
is mostly limited to cases where the MALDI spectrum of
the unfractionated sample is too complex to give a
complete picture of the sample properties. Peetz et al.
[285] prepared poly(2,5-diheptyloxy-1,4-divinyl-ben-
zene) by acyclic diene metathesis. In order to isolate
oligomerswith different sizes (the trimer, the tetramer and
the pentamer) they processed their sample by column
chromatography, collected the fractions and then
recorded their MALDI spectra. They noted that peaks
due to impurities are absent from the spectra (each
fraction displayed a single peak). Fig. 20 shows the
MALDI spectrum of an HPLC fraction; it contains a
single peak due to the pentamer. There is a good match
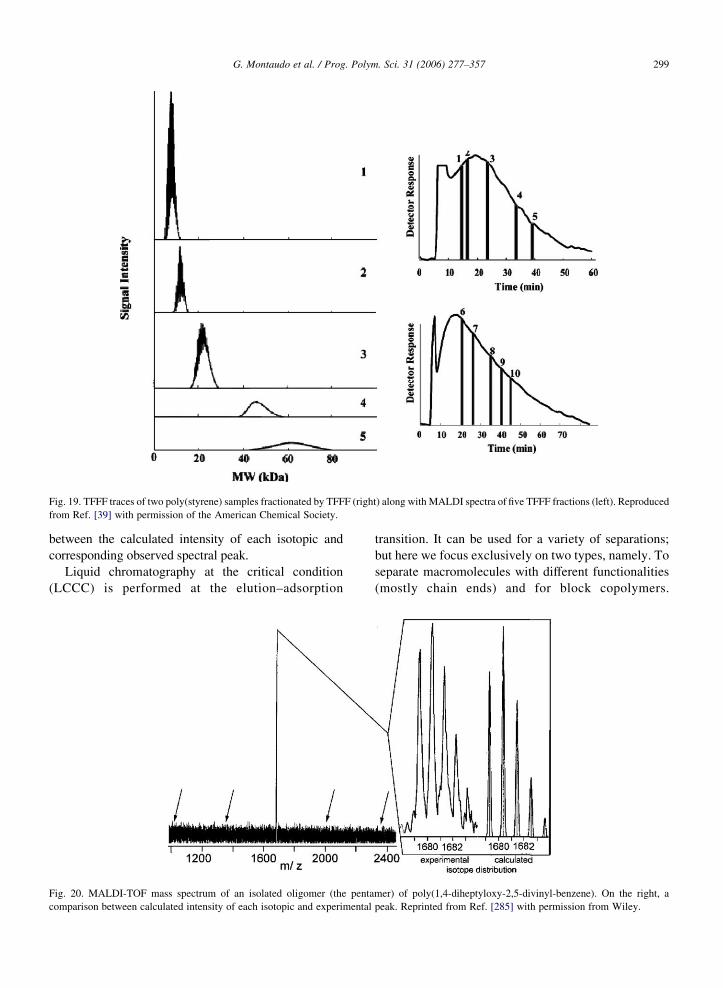
Fig. 19. TFFF traces of two poly(styrene) samples fractionated by TFFF (right) along with MALDI spectra of five TFFF fractions (left). Reproduced
from Ref. [39] with permission of the American Chemical Society.
G. Montaudo et al. / Prog. Polym. Sci. 31 (2006) 277–357 299
between the calculated intensity of each isotopic and
corresponding observed spectral peak.
Liquid chromatography at the critical condition
(LCCC) is performed at the elution–adsorption
Fig. 20. MALDI-TOF mass spectrum of an isolated oligomer (the penta
comparison between calculated intensity of each isotopic and experimental
transition. It can be used for a variety of separations;
but here we focus exclusively on two types, namely. To
separate macromolecules with different functionalities
(mostly chain ends) and for block copolymers.
mer) of poly(1,4-diheptyloxy-2,5-divinyl-benzene). On the right, a
peak. Reprinted from Ref. [285] with permission from Wiley.
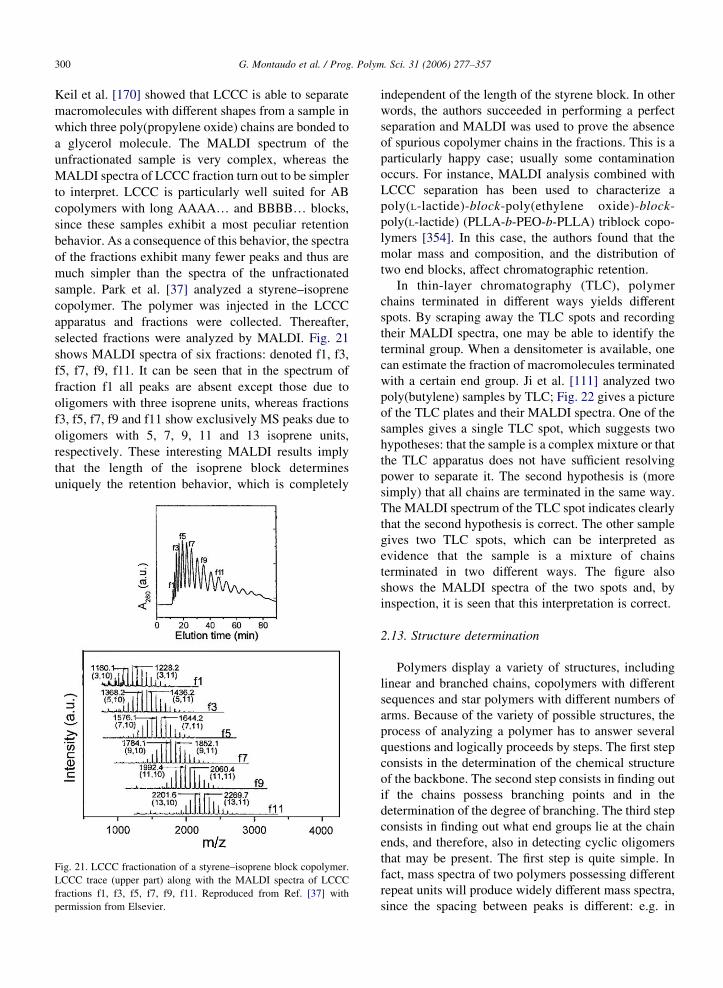
G. Montaudo et al. / Prog. Polym. Sci. 31 (2006) 277–357300
Keil et al. [170] showed that LCCC is able to separate
macromolecules with different shapes from a sample in
which three poly(propylene oxide) chains are bonded to
a glycerol molecule. The MALDI spectrum of the
unfractionated sample is very complex, whereas the
MALDI spectra of LCCC fraction turn out to be simpler
to interpret. LCCC is particularly well suited for AB
copolymers with long AAAA. and BBBB. blocks,
since these samples exhibit a most peculiar retention
behavior. As a consequence of this behavior, the spectra
of the fractions exhibit many fewer peaks and thus are
much simpler than the spectra of the unfractionated
sample. Park et al. [37] analyzed a styrene–isoprene
copolymer. The polymer was injected in the LCCC
apparatus and fractions were collected. Thereafter,
selected fractions were analyzed by MALDI. Fig. 21
shows MALDI spectra of six fractions: denoted f1, f3,
f5, f7, f9, f11. It can be seen that in the spectrum of
fraction f1 all peaks are absent except those due to
oligomers with three isoprene units, whereas fractions
f3, f5, f7, f9 and f11 show exclusively MS peaks due to
oligomers with 5, 7, 9, 11 and 13 isoprene units,
respectively. These interesting MALDI results imply
that the length of the isoprene block determines
uniquely the retention behavior, which is completely
Fig. 21. LCCC fractionation of a styrene–isoprene block copolymer.
LCCC trace (upper part) along with the MALDI spectra of LCCC
fractions f1, f3, f5, f7, f9, f11. Reproduced from Ref. [37] with
permission from Elsevier.
independent of the length of the styrene block. In other
words, the authors succeeded in performing a perfect
separation and MALDI was used to prove the absence
of spurious copolymer chains in the fractions. This is a
particularly happy case; usually some contamination
occurs. For instance, MALDI analysis combined with
LCCC separation has been used to characterize a
poly(L-lactide)-block-poly(ethylene oxide)-block-
poly(L-lactide) (PLLA-b-PEO-b-PLLA) triblock copo-
lymers [354]. In this case, the authors found that the
molar mass and composition, and the distribution of
two end blocks, affect chromatographic retention.
In thin-layer chromatography (TLC), polymer
chains terminated in different ways yields different
spots. By scraping away the TLC spots and recording
their MALDI spectra, one may be able to identify the
terminal group. When a densitometer is available, one
can estimate the fraction of macromolecules terminated
with a certain end group. Ji et al. [111] analyzed two
poly(butylene) samples by TLC; Fig. 22 gives a picture
of the TLC plates and their MALDI spectra. One of the
samples gives a single TLC spot, which suggests two
hypotheses: that the sample is a complex mixture or that
the TLC apparatus does not have sufficient resolving
power to separate it. The second hypothesis is (more
simply) that all chains are terminated in the same way.
The MALDI spectrum of the TLC spot indicates clearly
that the second hypothesis is correct. The other sample
gives two TLC spots, which can be interpreted as
evidence that the sample is a mixture of chains
terminated in two different ways. The figure also
shows the MALDI spectra of the two spots and, by
inspection, it is seen that this interpretation is correct.
2.13. Structure determination
Polymers display a variety of structures, including
linear and branched chains, copolymers with different
sequences and star polymers with different numbers of
arms. Because of the variety of possible structures, the
process of analyzing a polymer has to answer several
questions and logically proceeds by steps. The first step
consists in the determination of the chemical structure
of the backbone. The second step consists in finding out
if the chains possess branching points and in the
determination of the degree of branching. The third step
consists in finding out what end groups lie at the chain
ends, and therefore, also in detecting cyclic oligomers
that may be present. The first step is quite simple. In
fact, mass spectra of two polymers possessing different
repeat units will produce widely different mass spectra,
since the spacing between peaks is different: e.g. in
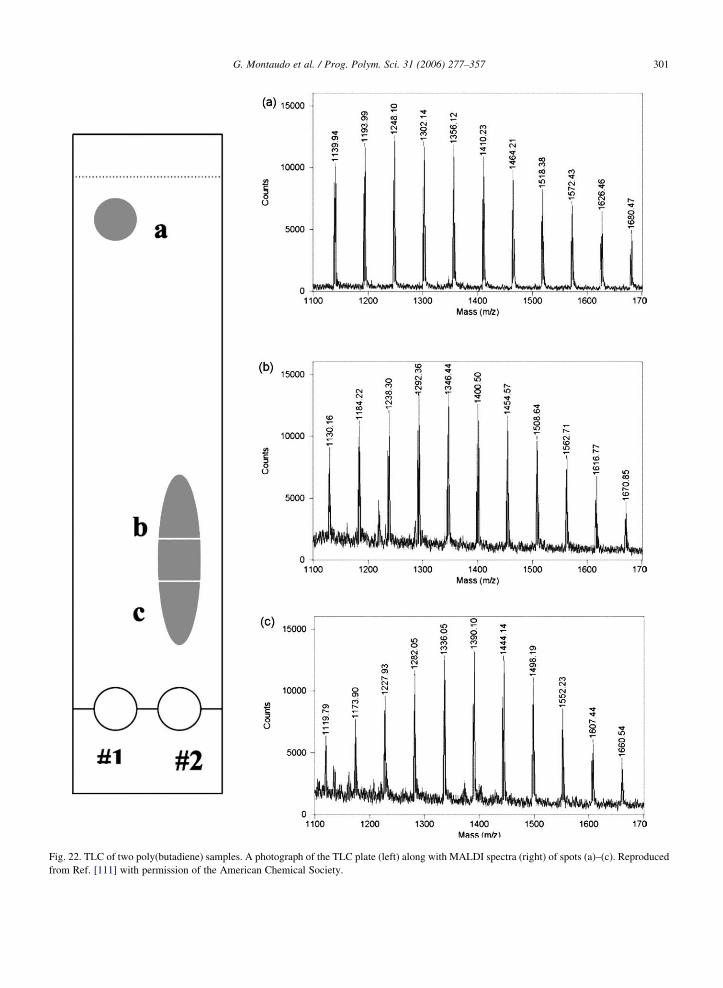
Fig. 22. TLC of two poly(butadiene) samples. A photograph of the TLC plate (left) along with MALDI spectra (right) of spots (a)–(c). Reproduced
from Ref. [111] with permission of the American Chemical Society.
G. Montaudo et al. / Prog. Polym. Sci. 31 (2006) 277–357 301
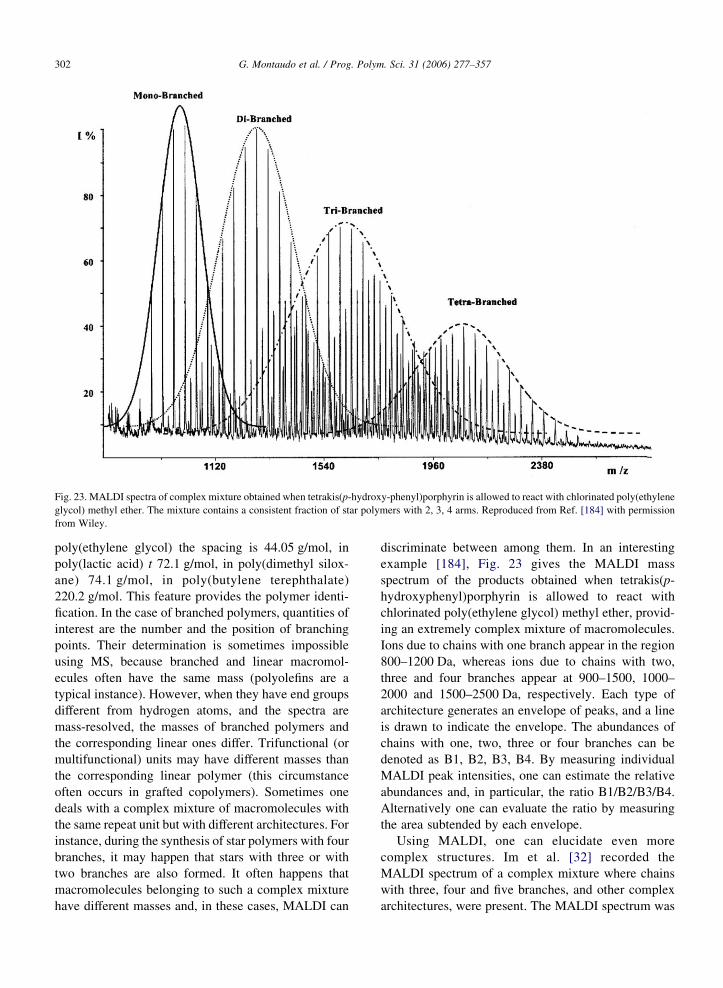
Fig. 23. MALDI spectra of complex mixture obtained when tetrakis(p-hydroxy-phenyl)porphyrin is allowed to react with chlorinated poly(ethylene
glycol) methyl ether. The mixture contains a consistent fraction of star polymers with 2, 3, 4 arms. Reproduced from Ref. [184] with permission
from Wiley.
G. Montaudo et al. / Prog. Polym. Sci. 31 (2006) 277–357302
poly(ethylene glycol) the spacing is 44.05 g/mol, in
poly(lactic acid) t 72.1 g/mol, in poly(dimethyl silox-
ane) 74.1 g/mol, in poly(butylene terephthalate)
220.2 g/mol. This feature provides the polymer identi-
fication. In the case of branched polymers, quantities of
interest are the number and the position of branching
points. Their determination is sometimes impossible
using MS, because branched and linear macromol-
ecules often have the same mass (polyolefins are a
typical instance). However, when they have end groups
different from hydrogen atoms, and the spectra are
mass-resolved, the masses of branched polymers and
the corresponding linear ones differ. Trifunctional (or
multifunctional) units may have different masses than
the corresponding linear polymer (this circumstance
often occurs in grafted copolymers). Sometimes one
deals with a complex mixture of macromolecules with
the same repeat unit but with different architectures. For
instance, during the synthesis of star polymers with four
branches, it may happen that stars with three or with
two branches are also formed. It often happens that
macromolecules belonging to such a complex mixture
have different masses and, in these cases, MALDI can
discriminate between among them. In an interesting
example [184], Fig. 23 gives the MALDI mass
spectrum of the products obtained when tetrakis(p-
hydroxyphenyl)porphyrin is allowed to react with
chlorinated poly(ethylene glycol) methyl ether, provid-
ing an extremely complex mixture of macromolecules.
Ions due to chains with one branch appear in the region
800–1200 Da, whereas ions due to chains with two,
three and four branches appear at 900–1500, 1000–
2000 and 1500–2500 Da, respectively. Each type of
architecture generates an envelope of peaks, and a line
is drawn to indicate the envelope. The abundances of
chains with one, two, three or four branches can be
denoted as B1, B2, B3, B4. By measuring individual
MALDI peak intensities, one can estimate the relative
abundances and, in particular, the ratio B1/B2/B3/B4.
Alternatively one can evaluate the ratio by measuring
the area subtended by each envelope.
Using MALDI, one can elucidate even more
complex structures. Im et al. [32] recorded the
MALDI spectrum of a complex mixture where chains
with three, four and five branches, and other complex
architectures, were present. The MALDI spectrum was
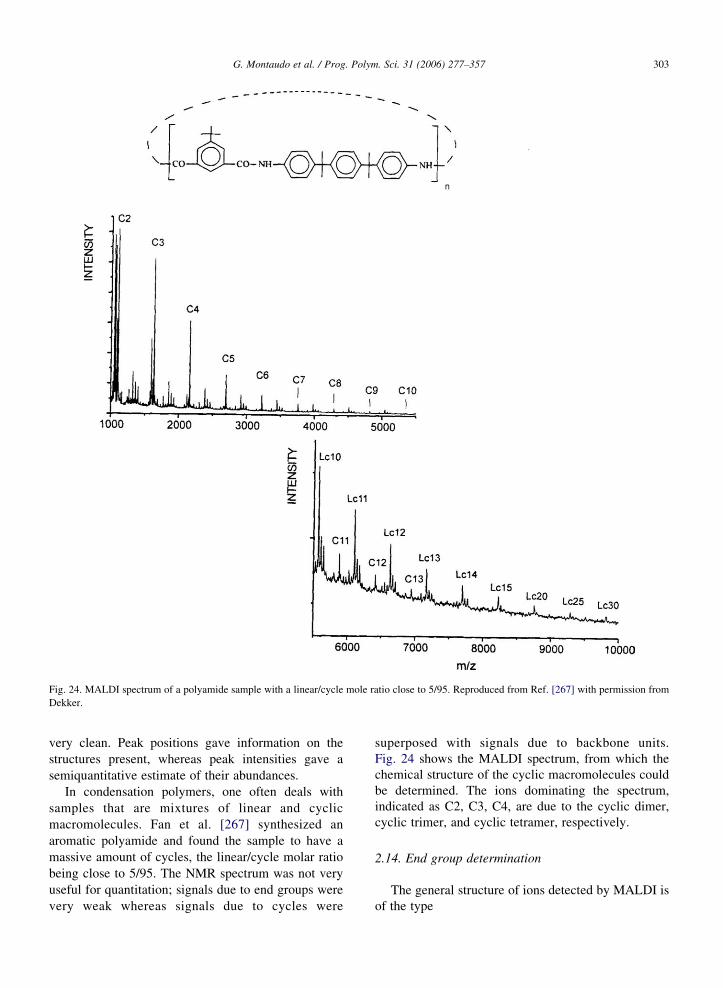
Fig. 24. MALDI spectrum of a polyamide sample with a linear/cycle mole ratio close to 5/95. Reproduced from Ref. [267] with permission from
Dekker.
G. Montaudo et al. / Prog. Polym. Sci. 31 (2006) 277–357 303
very clean. Peak positions gave information on the
structures present, whereas peak intensities gave a
semiquantitative estimate of their abundances.
In condensation polymers, one often deals with
samples that are mixtures of linear and cyclic
macromolecules. Fan et al. [267] synthesized an
aromatic polyamide and found the sample to have a
massive amount of cycles, the linear/cycle molar ratio
being close to 5/95. The NMR spectrum was not very
useful for quantitation; signals due to end groups were
very weak whereas signals due to cycles were
superposed with signals due to backbone units.
Fig. 24 shows the MALDI spectrum, from which the
chemical structure of the cyclic macromolecules could
be determined. The ions dominating the spectrum,
indicated as C2, C3, C4, are due to the cyclic dimer,
cyclic trimer, and cyclic tetramer, respectively.
2.14. End group determination
The general structure of ions detected by MALDI is
of the type
G. Montaudo et al. / Prog. Polym. Sci. 31 (2006) 277–357304
G1–AAAAAAA–G2/CC
where G1 and G2 are end groups, CC is a proton or a
cation and A is the repeat unit.
End group determination by MS is done as follows.
One considers the mass number of one of the MS peaks,
subtracts themass of C, and then repeatedly subtracts the
mass of the repeat unit, until one obtains the sum of the
masses of G1CG2. A linear best fit can also be used to
find G1CG2. As a simple example, we recall the
MALDI spectrum of the polystyrene sample with molar
mass around 7 kDa used for the NIST-sponsored
interlaboratory comparison [16]. The individual peaks
are due to molecular ions (MC), and the repeat unit is
C8H8, with a mass of 104.15 Da. If one subtracts an
integral number of monomer units from the observed
molecular ion, a ‘residual’ mass of 58 Da is obtained
(e.g. 6307K60!104.15Z58). This represents the sum
of the end group masses. A mass of 58 Da is consistent
with a butyl group at one end of the chain and a hydrogen
on the other:H–(St)n–C4H9. In this instance, the polymer
was prepared anionically using tert-butyl lithium [16].
One should note that the lowest residual mass (in this
case 58 Da) is not necessarily the correct sum of the end
group masses. In principle, the sum of the end group
masses might 162, 266, 370 Da, etc. (i.e. 104!nC58,
with nZ1, 2,.). One may need additional information
to elucidate the correct end groups: for example, other
spectroscopic or chromatographic data and/or knowl-
edge of the synthetic procedure that was used.
2.15. Tandem mass spectrometry for structure
determination
For structural studies, one may use a mass spec-
trometer equipped for tandem MS (see Fig. 1). Some
ions, once generated, break apart quickly. This can occur
by ‘in source fragmentation’ (INSF) inside the ion
source or by ‘post-source decay’ (PSD) in the field-free
region. In MALDI-TOF instruments equipped with a
reflectron, utilization of PSD is appealing, since it can
give information on the structure of ions. The method of
analyzing PSD fragments bears distinct similarities to
classical tandem MS (MS/MS) on double-sector
instruments [422]. In the latter, one of the sectors is
used to produce a narrow-mass spectral window (a beam
of ions of approximately the samemass, ‘parent-ions’ or
‘precursor-ions’), whereas the other sector is used to
separate and analyze the fragment ions, ‘daughter-ions’,
produced in the collision chamber. The PSD method
consists of three steps: (1) selecting a parent-ion by the
ion-selector, (2) changing the voltages of the reflectron
electrodes, (3) recording the resulting spectrum, called
the ‘PSD-MALDI spectrum of the parent-ion’ at the
specified mass. The ion-selector (see Fig. 1) is an
ultrafast electronic switch capable of pulsing away all
the ions except those in a narrow temporal window
(a couple of nanoseconds) corresponding to a mass
window of 4 Da or less.
Since MALDI is a soft-ionization method, the
number of intact oligomer ions that break apart
spontaneously is small, and it is necessary to increase
it to improve the quality of the PSD-MALDI spectrum:
i.e. increase the signal-to-noise ratio. For this purpose,
MALDI-TOF instruments accommodate a collision
chamber (see Fig. 1), in which the MALDI ions suffer
hundreds of collisions with molecules of an inert
collision gas (usually argon). The effect of the collision
chamber is to increase the number of ions that break
apart. In this way, one obtains collision-induced-
dissociation (CID), and the resulting spectrum is
referred to as a CID-MALDI spectrum [423]. In recent
years, there have appeared tandem time-of-flight (TOF/
TOF) instruments, which are especially important for
the analysis of high mass, singly charged ions
[422–424].
Hoteling and Owens [174], using PEG1000 as a
model analyte, studied the effect of various instru-
mental parameters operating on the resolution and mass
accuracy in MALDI-TOF PSD and CID analysis of
polymers. In another study, Hoteling et al. [176]
investigated the effect of the collision gas (He, Ar,
air) and collision gas partial pressure, on the MALDI-
TOF CID MS/MS spectra of PEG1000.
Fournier et al. used PSD-MALDI to study
fragmentation pathways of three nylon oligomers
desorbed under MALDI conditions [272]. They
found that the end groups and the length of the
methylene units influenced the fragmentation of the
different nylons and the relative abundance of the
product ions. They observed competitive dehydration
and deamination reactions, depending on the nature of
the terminal groups and the repeat units. In all cases,
the PSD spectra were very similar to the CID spectra
recorded under low-energy conditions, indicating that
the selected precursor ions had similar average internal
energies. Fig. 25a shows the PSD spectrum of the
parent ion with m/zZ599 corresponding to the
protonated Ny6 tetramer dicarboxy terminated (Ny6–
COOH), while Fig. 25b reports the MALDI-CID
spectrum of the protonated Ny6–COOH trimer
oligomer (m/zZ486). Peaks present in both spectra
can be interpreted with the scheme in Fig. 25. The
parent ion (at mass 599) eliminates a water molecule,
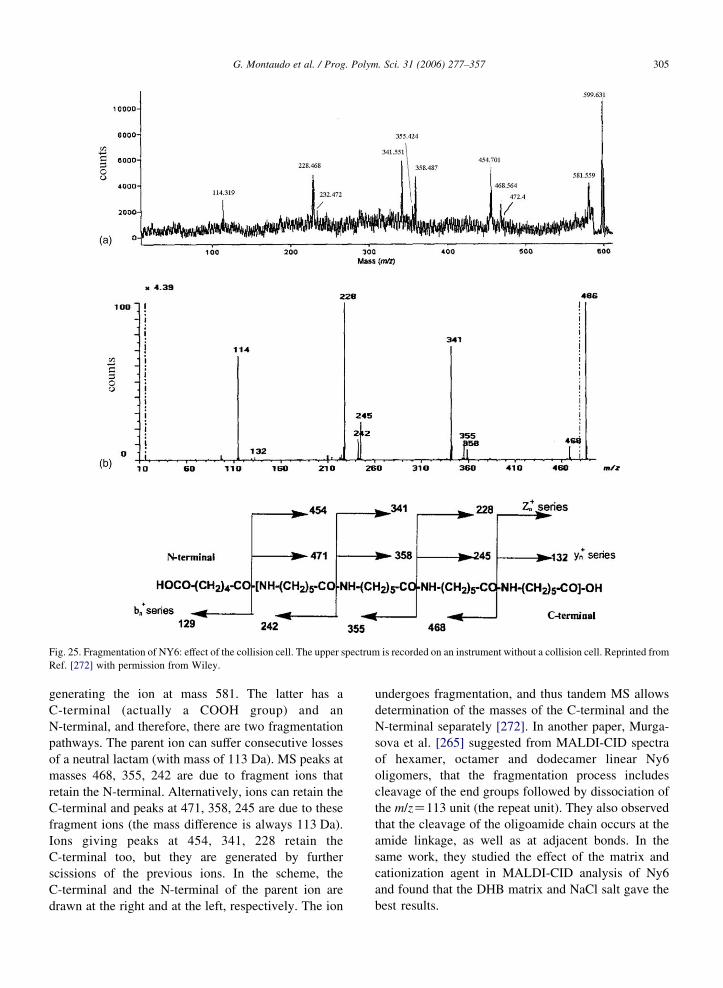
Fig. 25. Fragmentation of NY6: effect of the collision cell. The upper spectrum is recorded on an instrument without a collision cell. Reprinted from
Ref. [272] with permission from Wiley.
G. Montaudo et al. / Prog. Polym. Sci. 31 (2006) 277–357 305
generating the ion at mass 581. The latter has a
C-terminal (actually a COOH group) and an
N-terminal, and therefore, there are two fragmentation
pathways. The parent ion can suffer consecutive losses
of a neutral lactam (with mass of 113 Da). MS peaks at
masses 468, 355, 242 are due to fragment ions that
retain the N-terminal. Alternatively, ions can retain the
C-terminal and peaks at 471, 358, 245 are due to these
fragment ions (the mass difference is always 113 Da).
Ions giving peaks at 454, 341, 228 retain the
C-terminal too, but they are generated by further
scissions of the previous ions. In the scheme, the
C-terminal and the N-terminal of the parent ion are
drawn at the right and at the left, respectively. The ion
undergoes fragmentation, and thus tandem MS allows
determination of the masses of the C-terminal and the
N-terminal separately [272]. In another paper, Murga-
sova et al. [265] suggested from MALDI-CID spectra
of hexamer, octamer and dodecamer linear Ny6
oligomers, that the fragmentation process includes
cleavage of the end groups followed by dissociation of
the m/zZ113 unit (the repeat unit). They also observed
that the cleavage of the oligoamide chain occurs at the
amide linkage, as well as at adjacent bonds. In the
same work, they studied the effect of the matrix and
cationization agent in MALDI-CID analysis of Ny6
and found that the DHB matrix and NaCl salt gave the
best results.
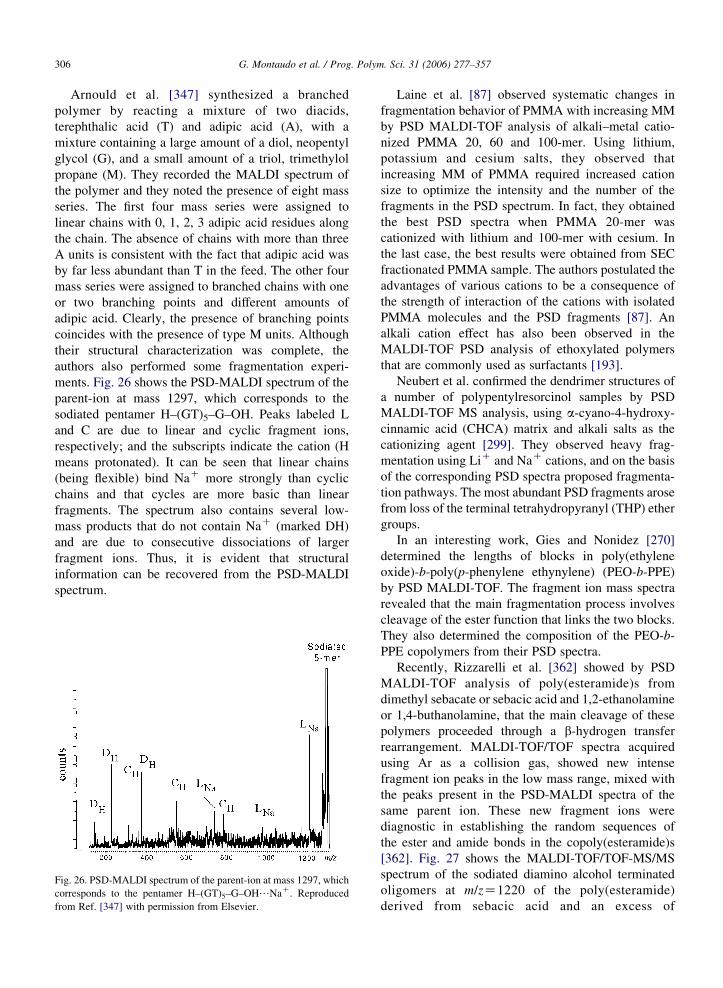
G. Montaudo et al. / Prog. Polym. Sci. 31 (2006) 277–357306
Arnould et al. [347] synthesized a branched
polymer by reacting a mixture of two diacids,
terephthalic acid (T) and adipic acid (A), with a
mixture containing a large amount of a diol, neopentyl
glycol (G), and a small amount of a triol, trimethylol
propane (M). They recorded the MALDI spectrum of
the polymer and they noted the presence of eight mass
series. The first four mass series were assigned to
linear chains with 0, 1, 2, 3 adipic acid residues along
the chain. The absence of chains with more than three
A units is consistent with the fact that adipic acid was
by far less abundant than T in the feed. The other four
mass series were assigned to branched chains with one
or two branching points and different amounts of
adipic acid. Clearly, the presence of branching points
coincides with the presence of type M units. Although
their structural characterization was complete, the
authors also performed some fragmentation experi-
ments. Fig. 26 shows the PSD-MALDI spectrum of the
parent-ion at mass 1297, which corresponds to the
sodiated pentamer H–(GT)5–G–OH. Peaks labeled L
and C are due to linear and cyclic fragment ions,
respectively; and the subscripts indicate the cation (H
means protonated). It can be seen that linear chains
(being flexible) bind NaC more strongly than cyclic
chains and that cycles are more basic than linear
fragments. The spectrum also contains several low-
mass products that do not contain NaC (marked DH)
and are due to consecutive dissociations of larger
fragment ions. Thus, it is evident that structural
information can be recovered from the PSD-MALDI
spectrum.
Fig. 26. PSD-MALDI spectrum of the parent-ion at mass 1297, which
corresponds to the pentamer H–(GT)5–G–OH/NaC. Reproduced
from Ref. [347] with permission from Elsevier.
Laine et al. [87] observed systematic changes in
fragmentation behavior of PMMA with increasing MM
by PSD MALDI-TOF analysis of alkali–metal catio-
nized PMMA 20, 60 and 100-mer. Using lithium,
potassium and cesium salts, they observed that
increasing MM of PMMA required increased cation
size to optimize the intensity and the number of the
fragments in the PSD spectrum. In fact, they obtained
the best PSD spectra when PMMA 20-mer was
cationized with lithium and 100-mer with cesium. In
the last case, the best results were obtained from SEC
fractionated PMMA sample. The authors postulated the
advantages of various cations to be a consequence of
the strength of interaction of the cations with isolated
PMMA molecules and the PSD fragments [87]. An
alkali cation effect has also been observed in the
MALDI-TOF PSD analysis of ethoxylated polymers
that are commonly used as surfactants [193].
Neubert et al. confirmed the dendrimer structures of
a number of polypentylresorcinol samples by PSD
MALDI-TOF MS analysis, using a-cyano-4-hydroxy-cinnamic acid (CHCA) matrix and alkali salts as the
cationizing agent [299]. They observed heavy frag-
mentation using LiC and NaC cations, and on the basis
of the corresponding PSD spectra proposed fragmenta-
tion pathways. The most abundant PSD fragments arose
from loss of the terminal tetrahydropyranyl (THP) ether
groups.
In an interesting work, Gies and Nonidez [270]
determined the lengths of blocks in poly(ethylene
oxide)-b-poly(p-phenylene ethynylene) (PEO-b-PPE)
by PSD MALDI-TOF. The fragment ion mass spectra
revealed that the main fragmentation process involves
cleavage of the ester function that links the two blocks.
They also determined the composition of the PEO-b-
PPE copolymers from their PSD spectra.
Recently, Rizzarelli et al. [362] showed by PSD
MALDI-TOF analysis of poly(esteramide)s from
dimethyl sebacate or sebacic acid and 1,2-ethanolamine
or 1,4-buthanolamine, that the main cleavage of these
polymers proceeded through a b-hydrogen transfer
rearrangement. MALDI-TOF/TOF spectra acquired
using Ar as a collision gas, showed new intense
fragment ion peaks in the low mass range, mixed with
the peaks present in the PSD-MALDI spectra of the
same parent ion. These new fragment ions were
diagnostic in establishing the random sequences of
the ester and amide bonds in the copoly(esteramide)s
[362]. Fig. 27 shows the MALDI-TOF/TOF-MS/MS
spectrum of the sodiated diamino alcohol terminated
oligomers at m/zZ1220 of the poly(esteramide)
derived from sebacic acid and an excess of
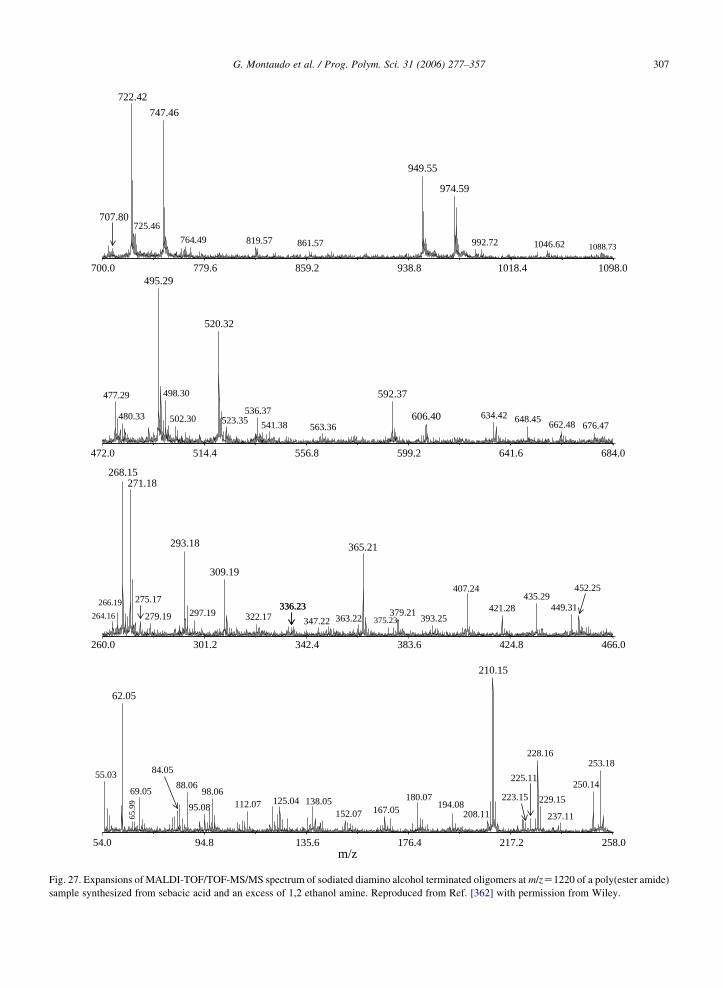
700.0 779.6 859.2 938.8 1018.4 1098.0
722.42
747.46
949.55
974.59
725.46707.80
764.49 819.57 992.72 1046.62861.57 1088.73
472.0 514.4 556.8 599.2 641.6 684.0
495.29
520.32
498.30 592.37477.29
536.37 634.42480.33 606.40523.35502.30 648.45541.38 662.48 676.47563.36
260.0 301.2 342.4 383.6 424.8 466.0
268.15
293.18 365.21
309.19
271.18
407.24435.29
449.31421.28379.21297.19
275.17
279.19 322.17 363.22 393.25375.23347.22
54.0 94.8 135.6 176.4 217.2 258.0m/z
210.15
62.05
228.16253.18
55.03250.1488.06
69.05 98.06180.07
84.05
125.04 229.15138.05112.07 194.0895.08 167.05
225.11
208.11152.07 237.11
223.15
336.23336.23264.16
266.19
452.25
65.9
9
Fig. 27. Expansions of MALDI-TOF/TOF-MS/MS spectrum of sodiated diamino alcohol terminated oligomers at m/zZ1220 of a poly(ester amide)
sample synthesized from sebacic acid and an excess of 1,2 ethanol amine. Reproduced from Ref. [362] with permission from Wiley.
G. Montaudo et al. / Prog. Polym. Sci. 31 (2006) 277–357 307
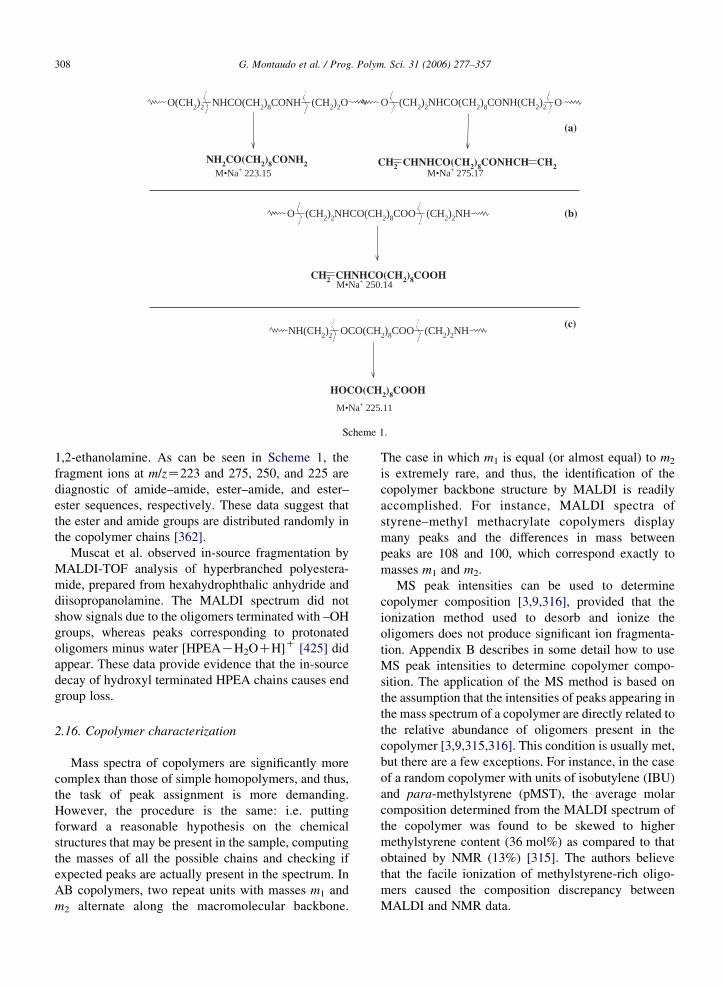
NH2CO(CH2)8CONH2
O(CH2)2 NHCO(CH2)8CONH (CH2)2O O (CH2)2NHCO(CH2)8CONH(CH2)2 O
CH2 CHNHCO(CH2)8CONHCH CH2
O (CH2)2NHCO(CH2)8COO (CH2)2NH
CH2 CHNHCO(CH2)8COOH
NH(CH2)2 OCO(CH2)8COO (CH2)2NH
HOCO(CH2)8COOH
(a)
(b)
(c)
M•Na+ 223.15 M•Na+ 275.17
M•Na+ 250.14
M•Na+ 225.11
Scheme 1.
G. Montaudo et al. / Prog. Polym. Sci. 31 (2006) 277–357308
1,2-ethanolamine. As can be seen in Scheme 1, the
fragment ions at m/zZ223 and 275, 250, and 225 are
diagnostic of amide–amide, ester–amide, and ester–
ester sequences, respectively. These data suggest that
the ester and amide groups are distributed randomly in
the copolymer chains [362].
Muscat et al. observed in-source fragmentation by
MALDI-TOF analysis of hyperbranched polyestera-
mide, prepared from hexahydrophthalic anhydride and
diisopropanolamine. The MALDI spectrum did not
show signals due to the oligomers terminated with –OH
groups, whereas peaks corresponding to protonated
oligomers minus water [HPEAKH2OCH]C [425] did
appear. These data provide evidence that the in-source
decay of hydroxyl terminated HPEA chains causes end
group loss.
2.16. Copolymer characterization
Mass spectra of copolymers are significantly more
complex than those of simple homopolymers, and thus,
the task of peak assignment is more demanding.
However, the procedure is the same: i.e. putting
forward a reasonable hypothesis on the chemical
structures that may be present in the sample, computing
the masses of all the possible chains and checking if
expected peaks are actually present in the spectrum. In
AB copolymers, two repeat units with masses m1 and
m2 alternate along the macromolecular backbone.
The case in which m1 is equal (or almost equal) to m2
is extremely rare, and thus, the identification of the
copolymer backbone structure by MALDI is readily
accomplished. For instance, MALDI spectra of
styrene–methyl methacrylate copolymers display
many peaks and the differences in mass between
peaks are 108 and 100, which correspond exactly to
masses m1 and m2.
MS peak intensities can be used to determine
copolymer composition [3,9,316], provided that the
ionization method used to desorb and ionize the
oligomers does not produce significant ion fragmenta-
tion. Appendix B describes in some detail how to use
MS peak intensities to determine copolymer compo-
sition. The application of the MS method is based on
the assumption that the intensities of peaks appearing in
the mass spectrum of a copolymer are directly related to
the relative abundance of oligomers present in the
copolymer [3,9,315,316]. This condition is usually met,
but there are a few exceptions. For instance, in the case
of a random copolymer with units of isobutylene (IBU)
and para-methylstyrene (pMST), the average molar
composition determined from the MALDI spectrum of
the copolymer was found to be skewed to higher
methylstyrene content (36 mol%) as compared to that
obtained by NMR (13%) [315]. The authors believe
that the facile ionization of methylstyrene-rich oligo-
mers caused the composition discrepancy between
MALDI and NMR data.
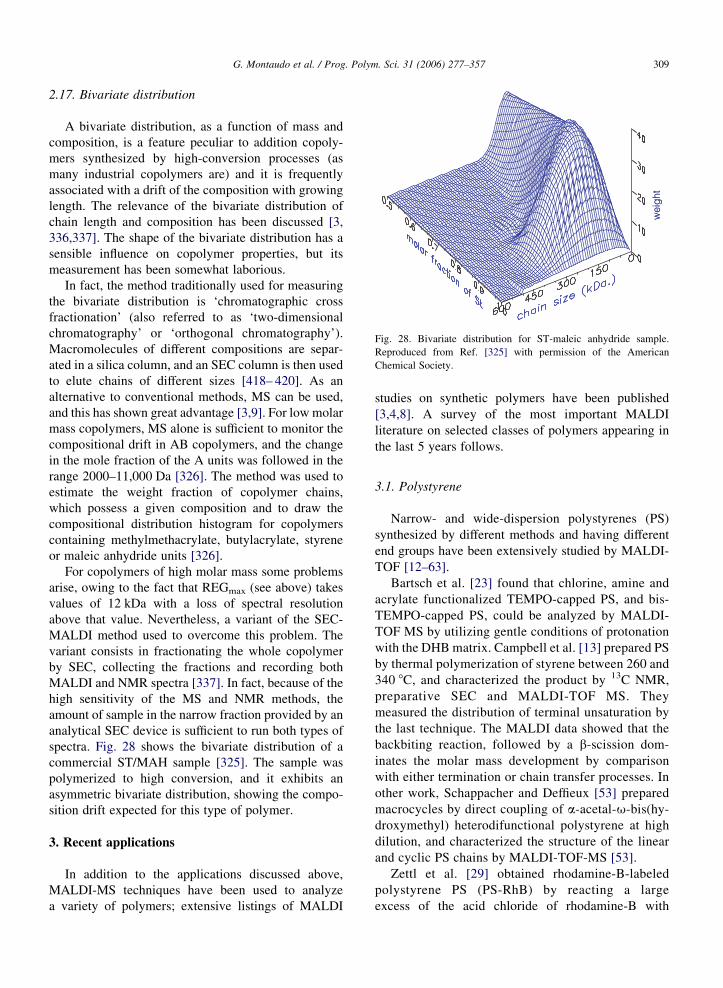
Fig. 28. Bivariate distribution for ST-maleic anhydride sample.
Reproduced from Ref. [325] with permission of the American
Chemical Society.
G. Montaudo et al. / Prog. Polym. Sci. 31 (2006) 277–357 309
2.17. Bivariate distribution
A bivariate distribution, as a function of mass and
composition, is a feature peculiar to addition copoly-
mers synthesized by high-conversion processes (as
many industrial copolymers are) and it is frequently
associated with a drift of the composition with growing
length. The relevance of the bivariate distribution of
chain length and composition has been discussed [3,
336,337]. The shape of the bivariate distribution has a
sensible influence on copolymer properties, but its
measurement has been somewhat laborious.
In fact, the method traditionally used for measuring
the bivariate distribution is ‘chromatographic cross
fractionation’ (also referred to as ‘two-dimensional
chromatography’ or ‘orthogonal chromatography’).
Macromolecules of different compositions are separ-
ated in a silica column, and an SEC column is then used
to elute chains of different sizes [418– 420]. As an
alternative to conventional methods, MS can be used,
and this has shown great advantage [3,9]. For low molar
mass copolymers, MS alone is sufficient to monitor the
compositional drift in AB copolymers, and the change
in the mole fraction of the A units was followed in the
range 2000–11,000 Da [326]. The method was used to
estimate the weight fraction of copolymer chains,
which possess a given composition and to draw the
compositional distribution histogram for copolymers
containing methylmethacrylate, butylacrylate, styrene
or maleic anhydride units [326].
For copolymers of high molar mass some problems
arise, owing to the fact that REGmax (see above) takes
values of 12 kDa with a loss of spectral resolution
above that value. Nevertheless, a variant of the SEC-
MALDI method used to overcome this problem. The
variant consists in fractionating the whole copolymer
by SEC, collecting the fractions and recording both
MALDI and NMR spectra [337]. In fact, because of the
high sensitivity of the MS and NMR methods, the
amount of sample in the narrow fraction provided by an
analytical SEC device is sufficient to run both types of
spectra. Fig. 28 shows the bivariate distribution of a
commercial ST/MAH sample [325]. The sample was
polymerized to high conversion, and it exhibits an
asymmetric bivariate distribution, showing the compo-
sition drift expected for this type of polymer.
3. Recent applications
In addition to the applications discussed above,
MALDI-MS techniques have been used to analyze
a variety of polymers; extensive listings of MALDI
studies on synthetic polymers have been published
[3,4,8]. A survey of the most important MALDI
literature on selected classes of polymers appearing in
the last 5 years follows.
3.1. Polystyrene
Narrow- and wide-dispersion polystyrenes (PS)
synthesized by different methods and having different
end groups have been extensively studied by MALDI-
TOF [12–63].
Bartsch et al. [23] found that chlorine, amine and
acrylate functionalized TEMPO-capped PS, and bis-
TEMPO-capped PS, could be analyzed by MALDI-
TOF MS by utilizing gentle conditions of protonation
with the DHB matrix. Campbell et al. [13] prepared PS
by thermal polymerization of styrene between 260 and
340 8C, and characterized the product by 13C NMR,
preparative SEC and MALDI-TOF MS. They
measured the distribution of terminal unsaturation by
the last technique. The MALDI data showed that the
backbiting reaction, followed by a b-scission dom-
inates the molar mass development by comparison
with either termination or chain transfer processes. In
other work, Schappacher and Deffieux [53] prepared
macrocycles by direct coupling of a-acetal-u-bis(hy-droxymethyl) heterodifunctional polystyrene at high
dilution, and characterized the structure of the linear
and cyclic PS chains by MALDI-TOF-MS [53].
Zettl et al. [29] obtained rhodamine-B-labeled
polystyrene PS (PS-RhB) by reacting a large
excess of the acid chloride of rhodamine-B with
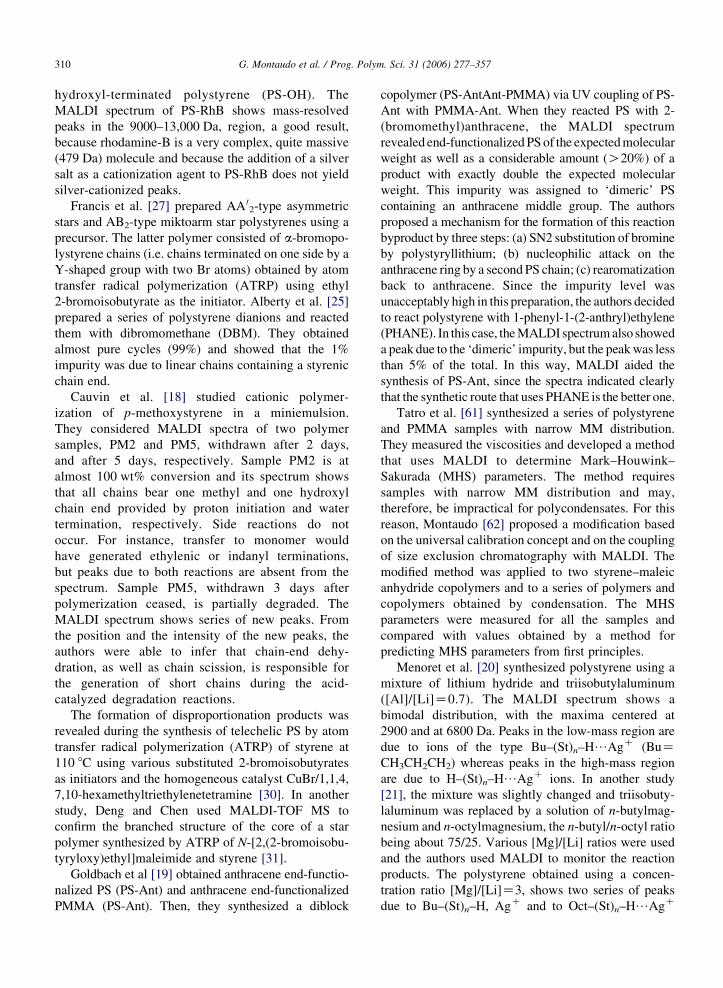
G. Montaudo et al. / Prog. Polym. Sci. 31 (2006) 277–357310
hydroxyl-terminated polystyrene (PS-OH). The
MALDI spectrum of PS-RhB shows mass-resolved
peaks in the 9000–13,000 Da, region, a good result,
because rhodamine-B is a very complex, quite massive
(479 Da) molecule and because the addition of a silver
salt as a cationization agent to PS-RhB does not yield
silver-cationized peaks.
Francis et al. [27] prepared AA 02-type asymmetric
stars and AB2-type miktoarm star polystyrenes using a
precursor. The latter polymer consisted of a-bromopo-
lystyrene chains (i.e. chains terminated on one side by a
Y-shaped group with two Br atoms) obtained by atom
transfer radical polymerization (ATRP) using ethyl
2-bromoisobutyrate as the initiator. Alberty et al. [25]
prepared a series of polystyrene dianions and reacted
them with dibromomethane (DBM). They obtained
almost pure cycles (99%) and showed that the 1%
impurity was due to linear chains containing a styrenic
chain end.
Cauvin et al. [18] studied cationic polymer-
ization of p-methoxystyrene in a miniemulsion.
They considered MALDI spectra of two polymer
samples, PM2 and PM5, withdrawn after 2 days,
and after 5 days, respectively. Sample PM2 is at
almost 100 wt% conversion and its spectrum shows
that all chains bear one methyl and one hydroxyl
chain end provided by proton initiation and water
termination, respectively. Side reactions do not
occur. For instance, transfer to monomer would
have generated ethylenic or indanyl terminations,
but peaks due to both reactions are absent from the
spectrum. Sample PM5, withdrawn 3 days after
polymerization ceased, is partially degraded. The
MALDI spectrum shows series of new peaks. From
the position and the intensity of the new peaks, the
authors were able to infer that chain-end dehy-
dration, as well as chain scission, is responsible for
the generation of short chains during the acid-
catalyzed degradation reactions.
The formation of disproportionation products was
revealed during the synthesis of telechelic PS by atom
transfer radical polymerization (ATRP) of styrene at
110 8C using various substituted 2-bromoisobutyrates
as initiators and the homogeneous catalyst CuBr/1,1,4,
7,10-hexamethyltriethylenetetramine [30]. In another
study, Deng and Chen used MALDI-TOF MS to
confirm the branched structure of the core of a star
polymer synthesized by ATRP of N-[2,(2-bromoisobu-
tyryloxy)ethyl]maleimide and styrene [31].
Goldbach et al [19] obtained anthracene end-functio-
nalized PS (PS-Ant) and anthracene end-functionalized
PMMA (PS-Ant). Then, they synthesized a diblock
copolymer (PS-AntAnt-PMMA) via UV coupling of PS-
Ant with PMMA-Ant. When they reacted PS with 2-
(bromomethyl)anthracene, the MALDI spectrum
revealed end-functionalizedPSof the expectedmolecular
weight as well as a considerable amount (O20%) of a
product with exactly double the expected molecular
weight. This impurity was assigned to ‘dimeric’ PS
containing an anthracene middle group. The authors
proposed a mechanism for the formation of this reaction
byproduct by three steps: (a) SN2 substitution of bromine
by polystyryllithium; (b) nucleophilic attack on the
anthracene ring by a second PS chain; (c) rearomatization
back to anthracene. Since the impurity level was
unacceptably high in this preparation, the authors decided
to react polystyrene with 1-phenyl-1-(2-anthryl)ethylene
(PHANE). In this case, theMALDI spectrumalso showed
a peak due to the ‘dimeric’ impurity, but the peakwas less
than 5% of the total. In this way, MALDI aided the
synthesis of PS-Ant, since the spectra indicated clearly
that the synthetic route that uses PHANE is the better one.
Tatro et al. [61] synthesized a series of polystyrene
and PMMA samples with narrow MM distribution.
They measured the viscosities and developed a method
that uses MALDI to determine Mark–Houwink–
Sakurada (MHS) parameters. The method requires
samples with narrow MM distribution and may,
therefore, be impractical for polycondensates. For this
reason, Montaudo [62] proposed a modification based
on the universal calibration concept and on the coupling
of size exclusion chromatography with MALDI. The
modified method was applied to two styrene–maleic
anhydride copolymers and to a series of polymers and
copolymers obtained by condensation. The MHS
parameters were measured for all the samples and
compared with values obtained by a method for
predicting MHS parameters from first principles.
Menoret et al. [20] synthesized polystyrene using a
mixture of lithium hydride and triisobutylaluminum
([Al]/[Li]Z0.7). The MALDI spectrum shows a
bimodal distribution, with the maxima centered at
2900 and at 6800 Da. Peaks in the low-mass region are
due to ions of the type Bu–(St)n–H/AgC (BuZCH3CH2CH2) whereas peaks in the high-mass region
are due to H–(St)n–H/AgC ions. In another study
[21], the mixture was slightly changed and triisobuty-
laluminum was replaced by a solution of n-butylmag-
nesium and n-octylmagnesium, the n-butyl/n-octyl ratio
being about 75/25. Various [Mg]/[Li] ratios were used
and the authors used MALDI to monitor the reaction
products. The polystyrene obtained using a concen-
tration ratio [Mg]/[Li]Z3, shows two series of peaks
due to Bu–(St)n–H, AgC and to Oct–(St)n–H/AgC
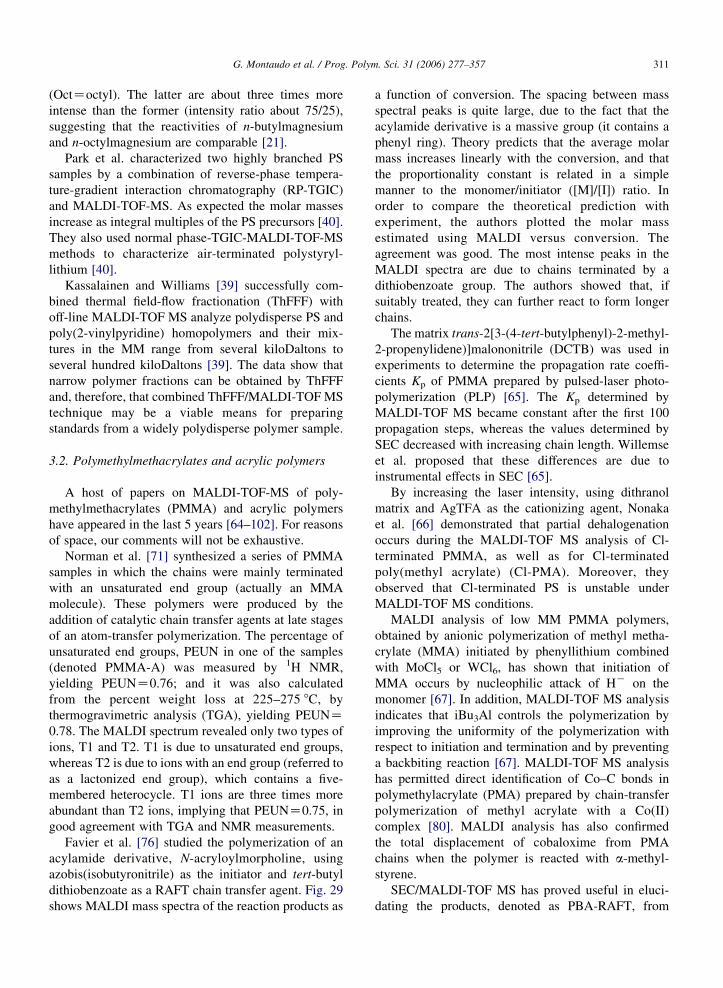
G. Montaudo et al. / Prog. Polym. Sci. 31 (2006) 277–357 311
(OctZoctyl). The latter are about three times more
intense than the former (intensity ratio about 75/25),
suggesting that the reactivities of n-butylmagnesium
and n-octylmagnesium are comparable [21].
Park et al. characterized two highly branched PS
samples by a combination of reverse-phase tempera-
ture-gradient interaction chromatography (RP-TGIC)
and MALDI-TOF-MS. As expected the molar masses
increase as integral multiples of the PS precursors [40].
They also used normal phase-TGIC-MALDI-TOF-MS
methods to characterize air-terminated polystyryl-
lithium [40].
Kassalainen and Williams [39] successfully com-
bined thermal field-flow fractionation (ThFFF) with
off-line MALDI-TOF MS analyze polydisperse PS and
poly(2-vinylpyridine) homopolymers and their mix-
tures in the MM range from several kiloDaltons to
several hundred kiloDaltons [39]. The data show that
narrow polymer fractions can be obtained by ThFFF
and, therefore, that combined ThFFF/MALDI-TOF MS
technique may be a viable means for preparing
standards from a widely polydisperse polymer sample.
3.2. Polymethylmethacrylates and acrylic polymers
A host of papers on MALDI-TOF-MS of poly-
methylmethacrylates (PMMA) and acrylic polymers
have appeared in the last 5 years [64–102]. For reasons
of space, our comments will not be exhaustive.
Norman et al. [71] synthesized a series of PMMA
samples in which the chains were mainly terminated
with an unsaturated end group (actually an MMA
molecule). These polymers were produced by the
addition of catalytic chain transfer agents at late stages
of an atom-transfer polymerization. The percentage of
unsaturated end groups, PEUN in one of the samples
(denoted PMMA-A) was measured by 1H NMR,
yielding PEUNZ0.76; and it was also calculated
from the percent weight loss at 225–275 8C, by
thermogravimetric analysis (TGA), yielding PEUNZ0.78. The MALDI spectrum revealed only two types of
ions, T1 and T2. T1 is due to unsaturated end groups,
whereas T2 is due to ions with an end group (referred to
as a lactonized end group), which contains a five-
membered heterocycle. T1 ions are three times more
abundant than T2 ions, implying that PEUNZ0.75, in
good agreement with TGA and NMR measurements.
Favier et al. [76] studied the polymerization of an
acylamide derivative, N-acryloylmorpholine, using
azobis(isobutyronitrile) as the initiator and tert-butyl
dithiobenzoate as a RAFT chain transfer agent. Fig. 29
shows MALDI mass spectra of the reaction products as
a function of conversion. The spacing between mass
spectral peaks is quite large, due to the fact that the
acylamide derivative is a massive group (it contains a
phenyl ring). Theory predicts that the average molar
mass increases linearly with the conversion, and that
the proportionality constant is related in a simple
manner to the monomer/initiator ([M]/[I]) ratio. In
order to compare the theoretical prediction with
experiment, the authors plotted the molar mass
estimated using MALDI versus conversion. The
agreement was good. The most intense peaks in the
MALDI spectra are due to chains terminated by a
dithiobenzoate group. The authors showed that, if
suitably treated, they can further react to form longer
chains.
The matrix trans-2[3-(4-tert-butylphenyl)-2-methyl-
2-propenylidene)]malononitrile (DCTB) was used in
experiments to determine the propagation rate coeffi-
cients Kp of PMMA prepared by pulsed-laser photo-
polymerization (PLP) [65]. The Kp determined by
MALDI-TOF MS became constant after the first 100
propagation steps, whereas the values determined by
SEC decreased with increasing chain length. Willemse
et al. proposed that these differences are due to
instrumental effects in SEC [65].
By increasing the laser intensity, using dithranol
matrix and AgTFA as the cationizing agent, Nonaka
et al. [66] demonstrated that partial dehalogenation
occurs during the MALDI-TOF MS analysis of Cl-
terminated PMMA, as well as for Cl-terminated
poly(methyl acrylate) (Cl-PMA). Moreover, they
observed that Cl-terminated PS is unstable under
MALDI-TOF MS conditions.
MALDI analysis of low MM PMMA polymers,
obtained by anionic polymerization of methyl metha-
crylate (MMA) initiated by phenyllithium combined
with MoCl5 or WCl6, has shown that initiation of
MMA occurs by nucleophilic attack of HK on the
monomer [67]. In addition, MALDI-TOF MS analysis
indicates that iBu3Al controls the polymerization by
improving the uniformity of the polymerization with
respect to initiation and termination and by preventing
a backbiting reaction [67]. MALDI-TOF MS analysis
has permitted direct identification of Co–C bonds in
polymethylacrylate (PMA) prepared by chain-transfer
polymerization of methyl acrylate with a Co(II)
complex [80]. MALDI analysis has also confirmed
the total displacement of cobaloxime from PMA
chains when the polymer is reacted with a-methyl-
styrene.
SEC/MALDI-TOF MS has proved useful in eluci-
dating the products, denoted as PBA-RAFT, from
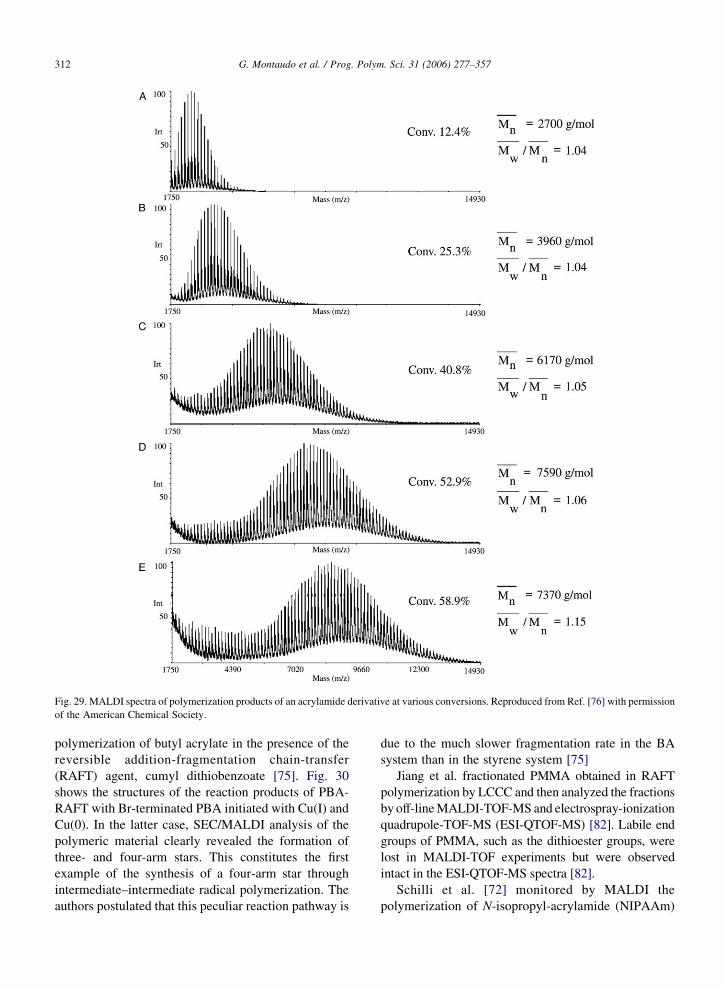
Fig. 29. MALDI spectra of polymerization products of an acrylamide derivative at various conversions. Reproduced from Ref. [76] with permission
of the American Chemical Society.
G. Montaudo et al. / Prog. Polym. Sci. 31 (2006) 277–357312
polymerization of butyl acrylate in the presence of the
reversible addition-fragmentation chain-transfer
(RAFT) agent, cumyl dithiobenzoate [75]. Fig. 30
shows the structures of the reaction products of PBA-
RAFT with Br-terminated PBA initiated with Cu(I) and
Cu(0). In the latter case, SEC/MALDI analysis of the
polymeric material clearly revealed the formation of
three- and four-arm stars. This constitutes the first
example of the synthesis of a four-arm star through
intermediate–intermediate radical polymerization. The
authors postulated that this peculiar reaction pathway is
due to the much slower fragmentation rate in the BA
system than in the styrene system [75]
Jiang et al. fractionated PMMA obtained in RAFT
polymerization by LCCC and then analyzed the fractions
by off-lineMALDI-TOF-MS and electrospray-ionization
quadrupole-TOF-MS (ESI-QTOF-MS) [82]. Labile end
groups of PMMA, such as the dithioester groups, were
lost in MALDI-TOF experiments but were observed
intact in the ESI-QTOF-MS spectra [82].
Schilli et al. [72] monitored by MALDI the
polymerization of N-isopropyl-acrylamide (NIPAAm)
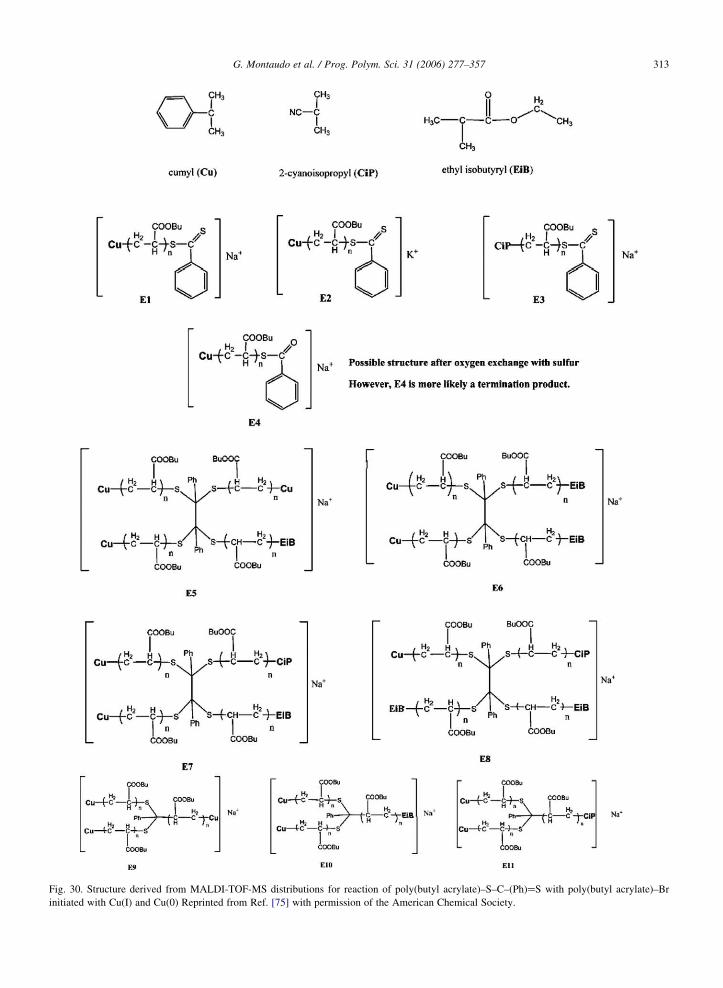
Fig. 30. Structure derived from MALDI-TOF-MS distributions for reaction of poly(butyl acrylate)–S–C–(Ph)aS with poly(butyl acrylate)–Br
initiated with Cu(I) and Cu(0) Reprinted from Ref. [75] with permission of the American Chemical Society.
G. Montaudo et al. / Prog. Polym. Sci. 31 (2006) 277–357 313
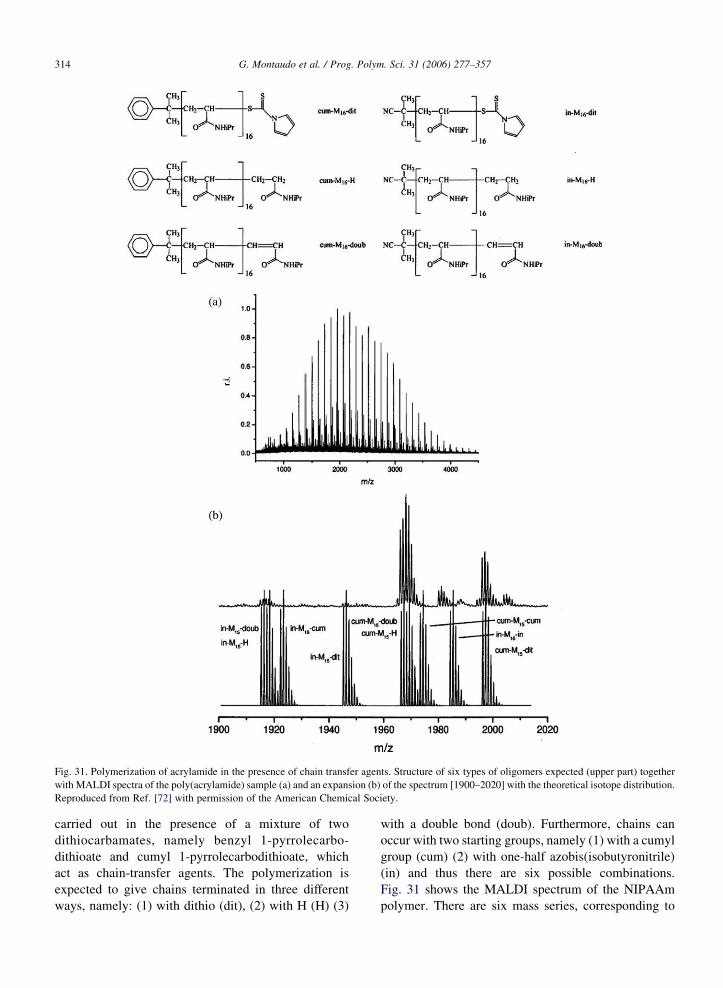
Fig. 31. Polymerization of acrylamide in the presence of chain transfer agents. Structure of six types of oligomers expected (upper part) together
with MALDI spectra of the poly(acrylamide) sample (a) and an expansion (b) of the spectrum [1900–2020] with the theoretical isotope distribution.
Reproduced from Ref. [72] with permission of the American Chemical Society.
G. Montaudo et al. / Prog. Polym. Sci. 31 (2006) 277–357314
carried out in the presence of a mixture of two
dithiocarbamates, namely benzyl 1-pyrrolecarbo-
dithioate and cumyl 1-pyrrolecarbodithioate, which
act as chain-transfer agents. The polymerization is
expected to give chains terminated in three different
ways, namely: (1) with dithio (dit), (2) with H (H) (3)
with a double bond (doub). Furthermore, chains can
occur with two starting groups, namely (1) with a cumyl
group (cum) (2) with one-half azobis(isobutyronitrile)
(in) and thus there are six possible combinations.
Fig. 31 shows the MALDI spectrum of the NIPAAm
polymer. There are six mass series, corresponding to
G. Montaudo et al. / Prog. Polym. Sci. 31 (2006) 277–357 315
the six expected types of chains. The figure also shows
expansion of the spectrum in the mass region 1900–
2020 Da, along with the simulated isotopic pattern. The
experiment and simulation show some analogies but
also some differences, probably due to the fact that the
simulation was performed under the (incorrect)
assumption that all chain species are equally abundant.
3.3. Other polymers with an all-carbon main chain
MALDI spectra of poly(vinyl acetate) [103],
poly(ethylene) [117–123], poly(butadiene) [125,126]
and polyisoprene [116] have been recorded by various
authors [103–127]. As a rule, MALDI analysis of
polyethylene requires careful sample preparation, as
discussed above; but low molar mass samples represent
an exception [118–120].
Switek et al. [108] obtained polyisoprene using sec-
butyllithium or 1-tert-butyldimethylsiloxypropyl-
lithium as the initiator. They reacted the resulting
polymer with hexafluoropropylene oxide (HFPO) and
obtained a three-arm star polymer, plus some side-
reaction products. They proposed a mechanism, in
which HFPO acts as a multifunctional coupling agent.
The MALDI spectrum of the reaction products displays
three mass series. The first series appears only at high
mass, and peaks are due to the three-arm star polymer.
The second series and the third are present exclusively
in the middle range and in the low molar mass range,
respectively. These peaks are due to two-chain ketone
structures and to poly(isoprene) chains simply termi-
nated by a proton. All MALDI peaks support the
proposed coupling agent mechanism.
3.4. Polymers with heteroatoms in the main chain
Polymers with heteroatoms in the chain have been
analyzed by MALDI [128–283]. We shall consider
polysiloxanes, poly(silsesquioxane)s and polysilanes
[128–148], polyethers [149–205], polyesters,
[206–250], polycarbonates, [251–261] polyamides
and polyimides [262–283].
3.5. Polysiloxanes, poly(silsesquioxane)s
and polysilanes
MALDI spectra of polysiloxanes are commented
upon above in the discussion of: impurity detection,
SEC-MALDI [128–131,138,140], using supercritical
CO2 [139] and comparing MMDs obtained by SEC and
by MALDI [130,131]. Poly(silsesquioxane)s are sili-
con-containing polymers with a peculiar stoichiometry;
their MALDI spectra are quite complex, but also very
rich in structural information [143–148].
3.6. Polyethers
More than 50 reports on MALDI of polyethers have
appeared in the period considered [149–205].
Gobom et al. [161] showed that it is possible to
calibrate a MALDI-TOF spectrum with fantastic
accuracy, namely to 10 ppm. In order to achieve their
goal, they had to introduce an alternate function for
time-to mass conversion and they had to select an
analyte which produces many intense equally spaced
peaks in the mass range 1000–7000 Da. Their choice
was PPG or, more precisely, a mixture of four PPGs,
each with a narrow distribution, with different masses
that covered the entire mass range.
Kricheldorf et al. [192] prepared poly(ether sul-
fone)s by polycondensation of silylated 4-tert-butylca-
techol and 4,4-difluorodiphenylsulfone in
N-methylpyrrolidone, varying the proportions of the
reactants. The MALDI spectrum of the polymer
prepared with nearly exact stoichiometry showed a
single mass series, with peaks up to 19 kDa.
Creaser et al. [175] analyzed PEG 1500 was by
atmospheric pressure MALDI quadrupole ion-trap MS
(AP-MALDI-QIT) and by classical vacuum MALDI-
TOF MS. Contrary to the MALDI-TOF spectra that
presented cationized oligomers, the AP-MALDI-QIT
spectra showed dimetallated matrix–analyte adducts, in
addition to the expected PEG-alkali ions, for all the
matrix/alkali salts used.
To study the interaction of PEG with ions likely to
be found in the human body, Mwelase et al. [150]
prepared complexes of bivalent ions of Mg, Ca, Cu,
Zn and Pt with a PEG5000 at pH 7 and characterized
them by MALDI-TOF MS and other techniques (UV,
FT-IR, TG). From the MALDI spectra, they deduced
that Cu(II), Zn(II) and Pt(II) are directly bound to
PEG without water whereas Mg(II) and Ca(II)
complexes hold four and six water molecules,
respectively [150].
MALDI spectra of poly(3-ethyl-3-hydroxymethy-
loxetane) (poly-EOX) and of samples obtained by
cationic polymerization of EOX in presence of an
analogous polyether such poly(3,3-dimethyloxetane)
(poly-DIOX) that does not contain OH groups, show
that the intramolecular reactions (backbiting) observed
during cationic polymerization are due to OH groups
while the ether moiety does not participate in the
backbiting processes [167]. Therefore, this reaction,
limits the MM of poly-EOX allowing formation of
G. Montaudo et al. / Prog. Polym. Sci. 31 (2006) 277–357316
cycles. MALDI analysis of SEC fractions of a
hyperbranched polyether, prepared by melt transether-
ification of 1-(2-hydroxyethoxy)-3,5-bis-(methoxy-
methyl)-2,4,6-trimethylbenzene with mesitol in
presence of an acid catalyst, reveal two families of
peaks due to simple branched structures and to
macrocycles [203]. From the relative intensities of the
two peaks, it is apparent that cyclization is favored at
higher conversions in the melt transetherification
process.
Various end groups in oligo(isobutyl vinyl ether)
(iBVE) have been characterized by MALDI-TOF MS
[105,166], which reveals that oligo-iBVE containing
aryl ketone ends are susceptible to elimination of the
ultimate isobutoxy group in the presence of a strong
Lewis acid, while the ketone groups are unaffected
[105].
MALDI-TOF MS mass spectra of poly(propylene
oxide), obtained by anionic polymerization of propy-
lene oxide in the presence of alkali metal alkoxide
initiators and trialkylaluminum, in addition to the
intense peaks belonging to the expected oligomers
terminated with alkoxide initiator and OH groups,
showed weak peaks due to oligomers terminated with
OH and unsaturated allyl groups, which were not
detected by 1H NMR [162].
In the case of polyethers obtained by polymer-
ization of isosorbide with 1,8-dibromo or dimesyl
octane with phase transfer catalysts under microwave
irradiation or by conventional heating, MALDI-TOF
MS showed that the mechanism of chain termination is
different in the two methods [163]. Polyethers
prepared by conventional heating have short chains
with hydroxylated ends, whereas under microwave
irradiation the polymer chains are longer with ethylene
end groups.
MALDI-TOF MS has also been used to character-
ize ethylene oxide (EO) and propylene oxide (PO)
copolymers [178,346]. Using homemade software,
Terrier et al. [178] determined the copolymer
composition of triblock copolyethers EO–PO–EO,
PO–EO–PO, and a random EO/PO copolymer by
MALDI-TOF. They observed that MALDI spectra of
the triblock copolymers depend on experimental
parameters, such as the number of laser shots relative
to the polymer/salt ratio, and on the nature of the
matrix. They detected the side-reaction products with
unsaturated end groups by MALDI analysis of the
crude copolymer and by MALDI analysis of SEC
fractions. These results were confirmed by 1H NMR
[178].
3.7. Polyesters
There are a number of reports of characterization of
polyesters by MALDI-MS [206–250].
Kricheldorf et al. [227] obtained an aliphatic
polyester by condensation of isosorbide and suberoyl
chloride. The MALDI spectrum showed three types of
peaks (La, Lb, Lc) due to linear polyester chains
terminated in three different ways plus peaks (C) due to
cyclic polyester chains. The intensity ratios were C/La/
Lb/LcZ83/7/7/3. Since cyclodextrins and their partly
methylated derivatives are commercially available and
are known for their ability to thread a variety of linear
polymers (depending on ring size and diameter of the
polymer chains), the authors used this property to
separate linear chains from their cyclic analogs. They
added a concentrated solution of polyesters in
dichloromethane dropwise to a refluxing concentrated
solution of methylated b-cyclodextrin in methanol. Part
of the dichloromethane evaporated, and the polyesters
precipitated. The threading of the methylated cyclo-
dextrin on the linear chains increased their solubility in
methanol and accelerated their methanolytic degra-
dation. The MALDI spectrum of the degradation
product displayed the same peaks as the pristine
polymer, but the intensity ratios changed to C/La/Lb/
LcZ96/1/3/0, implying that the content of linear chains
had been significantly reduced.
Pantiru et al. [208] recorded MALDI and NMR
spectra of a poly(3-caprolactone) (PCL) sample
terminated by ethylene glycol vinyl ether. The molar
mass was low enough to allow for NMR estimation of
the average molar mass (using end group signals); the
result was MnZ1380. The MALDI spectrum indicated
a high purity level (no terminal groups present apart
from those from ethylene glycol vinyl ether) and the
average molar mass computation yielded MnZ1400, in
good accord with the preceding value.
Ming et al. [221] recorded the MALDI spectrum of a
poly(butylene adipate) (PBA) sample. Then, they
reacted the PBA with a large excess of perfluoroocta-
noyl chloride and obtained a partially fluorinated
polymer. The MALDI spectrum showed peaks due to
unreacted PBA plus additional peaks, four or five times
less intense, due to partially fluorinated chains.
Assuming that the difference in cationization efficiency
was not too large, this might indicate that modified
chains are less abundant.
Takashima et al. [217] recorded the MALDI
spectrum of a poly(d-valerolactone) (PDVL) termi-
nated with b-cyclodextrin (CD). The spectrum displays
a series of peaks (separated by about 100 Da) due to
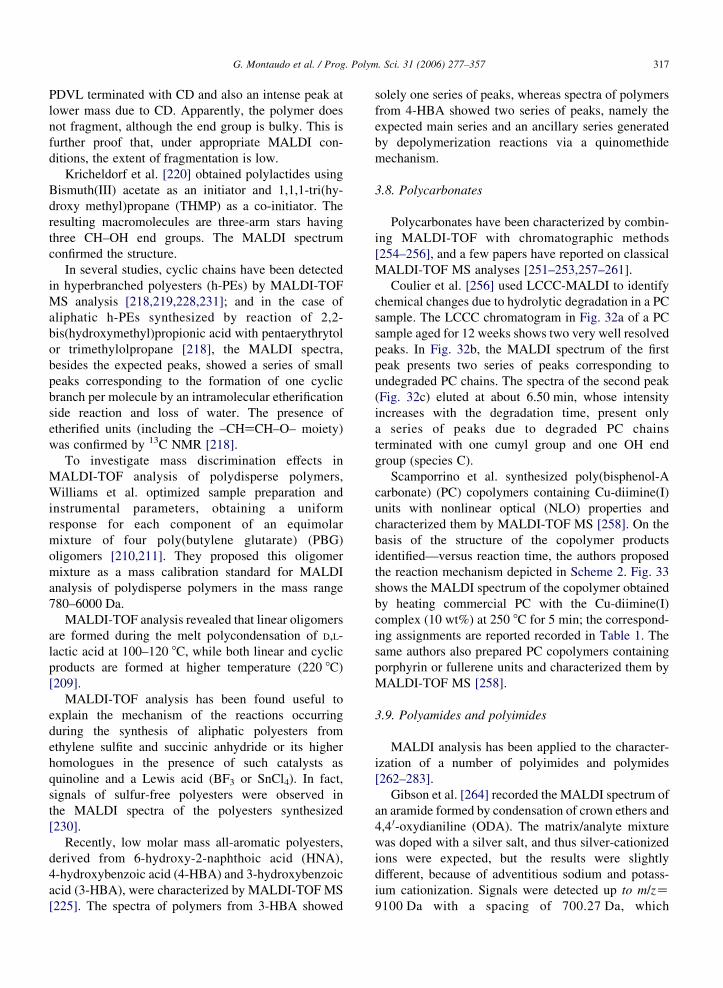
G. Montaudo et al. / Prog. Polym. Sci. 31 (2006) 277–357 317
PDVL terminated with CD and also an intense peak at
lower mass due to CD. Apparently, the polymer does
not fragment, although the end group is bulky. This is
further proof that, under appropriate MALDI con-
ditions, the extent of fragmentation is low.
Kricheldorf et al. [220] obtained polylactides using
Bismuth(III) acetate as an initiator and 1,1,1-tri(hy-
droxy methyl)propane (THMP) as a co-initiator. The
resulting macromolecules are three-arm stars having
three CH–OH end groups. The MALDI spectrum
confirmed the structure.
In several studies, cyclic chains have been detected
in hyperbranched polyesters (h-PEs) by MALDI-TOF
MS analysis [218,219,228,231]; and in the case of
aliphatic h-PEs synthesized by reaction of 2,2-
bis(hydroxymethyl)propionic acid with pentaerythrytol
or trimethylolpropane [218], the MALDI spectra,
besides the expected peaks, showed a series of small
peaks corresponding to the formation of one cyclic
branch per molecule by an intramolecular etherification
side reaction and loss of water. The presence of
etherified units (including the –CHaCH–O– moiety)
was confirmed by 13C NMR [218].
To investigate mass discrimination effects in
MALDI-TOF analysis of polydisperse polymers,
Williams et al. optimized sample preparation and
instrumental parameters, obtaining a uniform
response for each component of an equimolar
mixture of four poly(butylene glutarate) (PBG)
oligomers [210,211]. They proposed this oligomer
mixture as a mass calibration standard for MALDI
analysis of polydisperse polymers in the mass range
780–6000 Da.
MALDI-TOF analysis revealed that linear oligomers
are formed during the melt polycondensation of D,L-
lactic acid at 100–120 8C, while both linear and cyclic
products are formed at higher temperature (220 8C)
[209].
MALDI-TOF analysis has been found useful to
explain the mechanism of the reactions occurring
during the synthesis of aliphatic polyesters from
ethylene sulfite and succinic anhydride or its higher
homologues in the presence of such catalysts as
quinoline and a Lewis acid (BF3 or SnCl4). In fact,
signals of sulfur-free polyesters were observed in
the MALDI spectra of the polyesters synthesized
[230].
Recently, low molar mass all-aromatic polyesters,
derived from 6-hydroxy-2-naphthoic acid (HNA),
4-hydroxybenzoic acid (4-HBA) and 3-hydroxybenzoic
acid (3-HBA), were characterized by MALDI-TOF MS
[225]. The spectra of polymers from 3-HBA showed
solely one series of peaks, whereas spectra of polymers
from 4-HBA showed two series of peaks, namely the
expected main series and an ancillary series generated
by depolymerization reactions via a quinomethide
mechanism.
3.8. Polycarbonates
Polycarbonates have been characterized by combin-
ing MALDI-TOF with chromatographic methods
[254–256], and a few papers have reported on classical
MALDI-TOF MS analyses [251–253,257–261].
Coulier et al. [256] used LCCC-MALDI to identify
chemical changes due to hydrolytic degradation in a PC
sample. The LCCC chromatogram in Fig. 32a of a PC
sample aged for 12 weeks shows two very well resolved
peaks. In Fig. 32b, the MALDI spectrum of the first
peak presents two series of peaks corresponding to
undegraded PC chains. The spectra of the second peak
(Fig. 32c) eluted at about 6.50 min, whose intensity
increases with the degradation time, present only
a series of peaks due to degraded PC chains
terminated with one cumyl group and one OH end
group (species C).
Scamporrino et al. synthesized poly(bisphenol-A
carbonate) (PC) copolymers containing Cu-diimine(I)
units with nonlinear optical (NLO) properties and
characterized them by MALDI-TOF MS [258]. On the
basis of the structure of the copolymer products
identified—versus reaction time, the authors proposed
the reaction mechanism depicted in Scheme 2. Fig. 33
shows the MALDI spectrum of the copolymer obtained
by heating commercial PC with the Cu-diimine(I)
complex (10 wt%) at 250 8C for 5 min; the correspond-
ing assignments are reported recorded in Table 1. The
same authors also prepared PC copolymers containing
porphyrin or fullerene units and characterized them by
MALDI-TOF MS [258].
3.9. Polyamides and polyimides
MALDI analysis has been applied to the character-
ization of a number of polyimides and polymides
[262–283].
Gibson et al. [264] recorded the MALDI spectrum of
an aramide formed by condensation of crown ethers and
4,4 0-oxydianiline (ODA). The matrix/analyte mixture
was doped with a silver salt, and thus silver-cationized
ions were expected, but the results were slightly
different, because of adventitious sodium and potass-
ium cationization. Signals were detected up to m/zZ9100 Da with a spacing of 700.27 Da, which
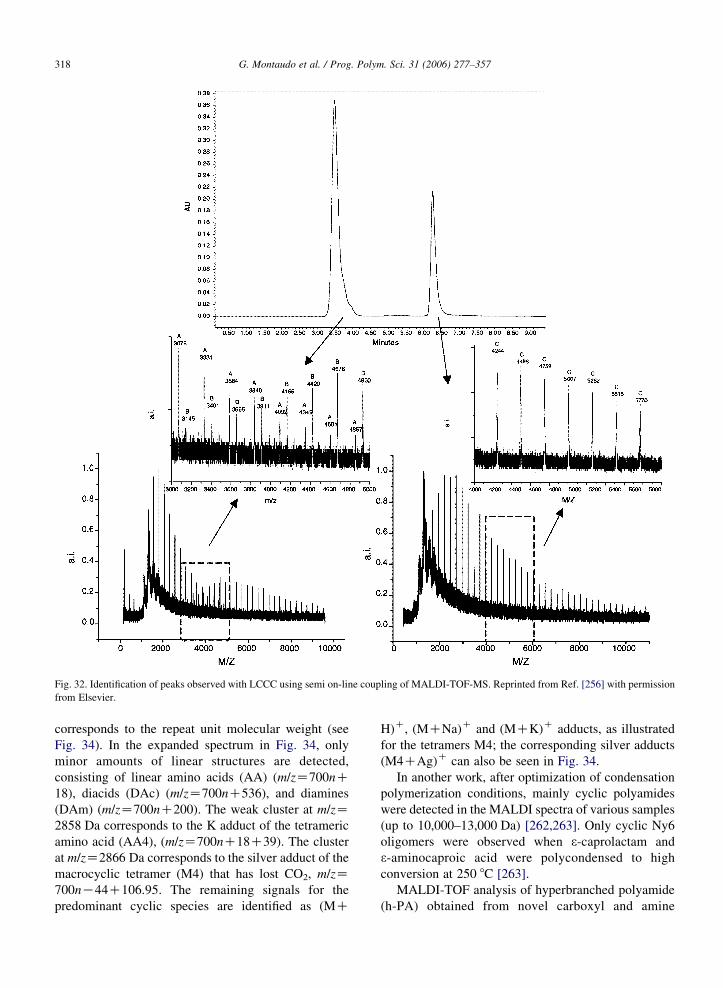
Fig. 32. Identification of peaks observed with LCCC using semi on-line coupling of MALDI-TOF-MS. Reprinted from Ref. [256] with permission
from Elsevier.
G. Montaudo et al. / Prog. Polym. Sci. 31 (2006) 277–357318
corresponds to the repeat unit molecular weight (see
Fig. 34). In the expanded spectrum in Fig. 34, only
minor amounts of linear structures are detected,
consisting of linear amino acids (AA) (m/zZ700nC18), diacids (DAc) (m/zZ700nC536), and diamines
(DAm) (m/zZ700nC200). The weak cluster at m/zZ2858 Da corresponds to the K adduct of the tetrameric
amino acid (AA4), (m/zZ700nC18C39). The cluster
at m/zZ2866 Da corresponds to the silver adduct of the
macrocyclic tetramer (M4) that has lost CO2, m/zZ700nK44C106.95. The remaining signals for the
predominant cyclic species are identified as (MC
H)C, (MCNa)C and (MCK)C adducts, as illustrated
for the tetramers M4; the corresponding silver adducts
(M4CAg)C can also be seen in Fig. 34.
In another work, after optimization of condensation
polymerization conditions, mainly cyclic polyamides
were detected in the MALDI spectra of various samples
(up to 10,000–13,000 Da) [262,263]. Only cyclic Ny6
oligomers were observed when 3-caprolactam and
3-aminocaproic acid were polycondensed to high
conversion at 250 8C [263].
MALDI-TOF analysis of hyperbranched polyamide
(h-PA) obtained from novel carboxyl and amine
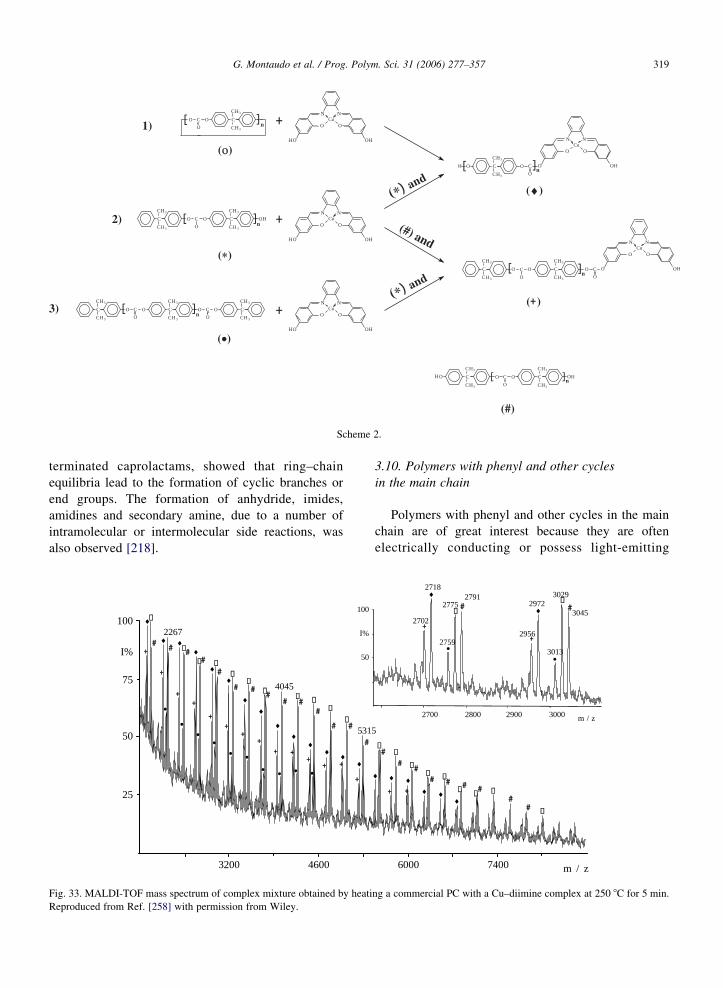
O C
O
C
C
C
H
H
3
3
OH
N N
O OCu
HO O
OC
C
C
H
H
3
3
O
N N
O OCu
HO OOC
C
C
H
H
3
3
C
O
C
O
O O C
C
C
H
H
3
3
C
O[ ] N N
O OCu
HO OH
O O C
C
C
H
H
3
3
C
O n [ OHC
C
C
H
H
3
3
N N
O OCu
HO OH
O O C
C
C
H
H
3
3
C
O
C
C
C
H
H
3
3
O O C
C
C
H
H
3
3
C
O
N N
O OCu
HO OH
+
+
+
1)
2)
3)
( )
( )
( )
( )
(+)
(#) and
( ) and
( ) and
[
]
n
n
]
]n
[
[
]n
O O C
C
C
H
H
3
3
C
On [ ] OHC
C
C
H
H
3
3
OH
(#)
Scheme 2.
G. Montaudo et al. / Prog. Polym. Sci. 31 (2006) 277–357 319
terminated caprolactams, showed that ring–chain
equilibria lead to the formation of cyclic branches or
end groups. The formation of anhydride, imides,
amidines and secondary amine, due to a number of
intramolecular or intermolecular side reactions, was
also observed [218].
3200
100
75
50
25
4600
I%
2267 #
∗
∗
∗ ∗∗
∗∗
∗ ∗∗
∗
#
# ##
+
+
+
++
4045
531#
##
###
#
#
#+
+
++ +
++ +
+
100
50
I%
Fig. 33. MALDI-TOF mass spectrum of complex mixture obtained by heati
Reproduced from Ref. [258] with permission from Wiley.
3.10. Polymers with phenyl and other cycles
in the main chain
Polymers with phenyl and other cycles in the main
chain are of great interest because they are often
electrically conducting or possess light-emitting
6000 7400 m / z
∗∗
∗∗ ∗
∗∗
∗ ∗ ∗
∗
5
##
## # #
##
#
+ +
2700 29002800 3000 m / z
2718
2702
27752791
27592956
2972
3013
3029
3045
++
# #
ng a commercial PC with a Cu–diimine complex at 250 8C for 5 min.
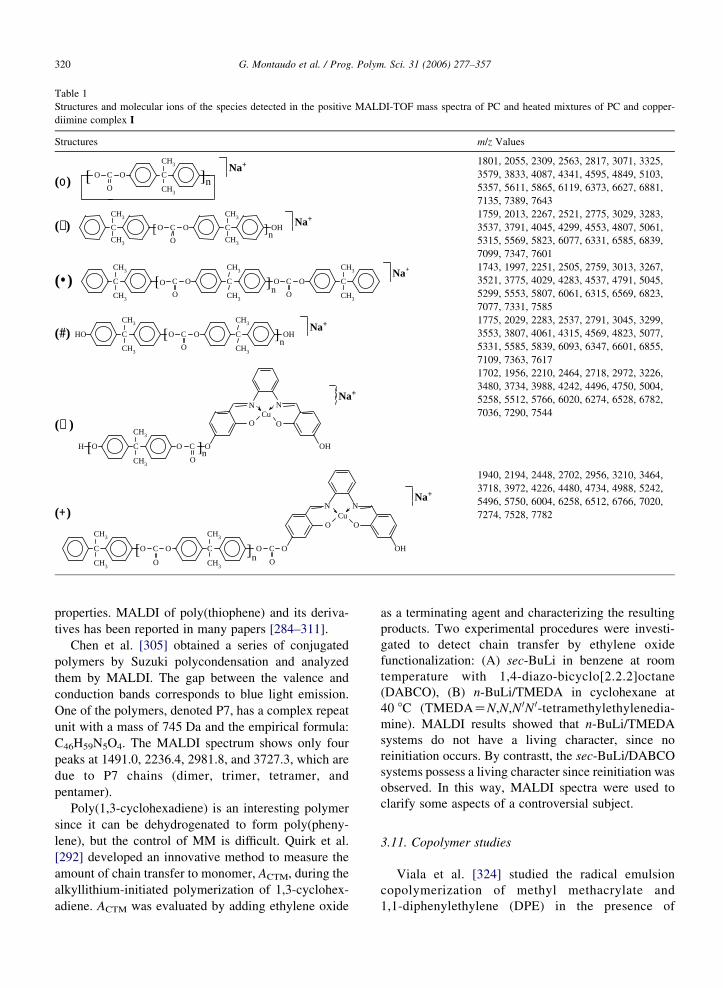
Table 1
Structures and molecular ions of the species detected in the positive MALDI-TOF mass spectra of PC and heated mixtures of PC and copper-
diimine complex I
Structures m/z Values
O O C
CH3
CH3
C
On
Na+
(ο)
1801, 2055, 2309, 2563, 2817, 3071, 3325,
3579, 3833, 4087, 4341, 4595, 4849, 5103,
5357, 5611, 5865, 6119, 6373, 6627, 6881,
7135, 7389, 7643
Na+
CH3OCH3
O O C
CH3
CnOHC
CH3
(∗)1759, 2013, 2267, 2521, 2775, 3029, 3283,
3537, 3791, 4045, 4299, 4553, 4807, 5061,
5315, 5569, 5823, 6077, 6331, 6585, 6839,
7099, 7347, 7601
O OC
O nC
CH3
CH3
C
CH3
CH3
C
CH3
CH3
O OC
O
Na+
(•)1743, 1997, 2251, 2505, 2759, 3013, 3267,
3521, 3775, 4029, 4283, 4537, 4791, 5045,
5299, 5553, 5807, 6061, 6315, 6569, 6823,
7077, 7331, 7585
O OC
OnOHC
CH3
CH3
C
CH3
CH3
HONa+
(#)1775, 2029, 2283, 2537, 2791, 3045, 3299,
3553, 3807, 4061, 4315, 4569, 4823, 5077,
5331, 5585, 5839, 6093, 6347, 6601, 6855,
7109, 7363, 7617
O C
O
C
CH3
CH3
OH
N N
O OCu
O OHn
Na+
(♦)
1702, 1956, 2210, 2464, 2718, 2972, 3226,
3480, 3734, 3988, 4242, 4496, 4750, 5004,
5258, 5512, 5766, 6020, 6274, 6528, 6782,
7036, 7290, 7544
OO
N N
O OCu
O OHn
OC
CH3
CH3
C
CH3
CH3
C
O
C
O
Na+
(+)
1940, 2194, 2448, 2702, 2956, 3210, 3464,
3718, 3972, 4226, 4480, 4734, 4988, 5242,
5496, 5750, 6004, 6258, 6512, 6766, 7020,
7274, 7528, 7782
G. Montaudo et al. / Prog. Polym. Sci. 31 (2006) 277–357320
properties. MALDI of poly(thiophene) and its deriva-
tives has been reported in many papers [284–311].
Chen et al. [305] obtained a series of conjugated
polymers by Suzuki polycondensation and analyzed
them by MALDI. The gap between the valence and
conduction bands corresponds to blue light emission.
One of the polymers, denoted P7, has a complex repeat
unit with a mass of 745 Da and the empirical formula:
C46H59N5O4. The MALDI spectrum shows only four
peaks at 1491.0, 2236.4, 2981.8, and 3727.3, which are
due to P7 chains (dimer, trimer, tetramer, and
pentamer).
Poly(1,3-cyclohexadiene) is an interesting polymer
since it can be dehydrogenated to form poly(pheny-
lene), but the control of MM is difficult. Quirk et al.
[292] developed an innovative method to measure the
amount of chain transfer to monomer, ACTM, during the
alkyllithium-initiated polymerization of 1,3-cyclohex-
adiene. ACTM was evaluated by adding ethylene oxide
as a terminating agent and characterizing the resulting
products. Two experimental procedures were investi-
gated to detect chain transfer by ethylene oxide
functionalization: (A) sec-BuLi in benzene at room
temperature with 1,4-diazo-bicyclo[2.2.2]octane
(DABCO), (B) n-BuLi/TMEDA in cyclohexane at
40 8C (TMEDAZN,N,N 0N 0-tetramethylethylenedia-
mine). MALDI results showed that n-BuLi/TMEDA
systems do not have a living character, since no
reinitiation occurs. By contrastt, the sec-BuLi/DABCO
systems possess a living character since reinitiation was
observed. In this way, MALDI spectra were used to
clarify some aspects of a controversial subject.
3.11. Copolymer studies
Viala et al. [324] studied the radical emulsion
copolymerization of methyl methacrylate and
1,1-diphenylethylene (DPE) in the presence of
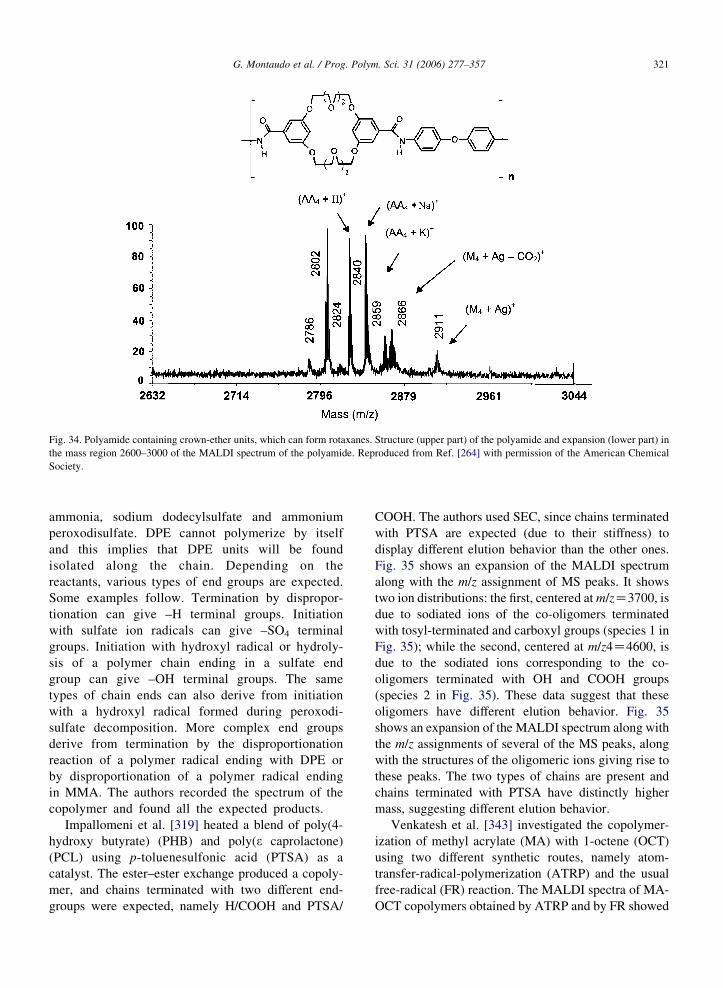
Fig. 34. Polyamide containing crown-ether units, which can form rotaxanes. Structure (upper part) of the polyamide and expansion (lower part) in
the mass region 2600–3000 of the MALDI spectrum of the polyamide. Reproduced from Ref. [264] with permission of the American Chemical
Society.
G. Montaudo et al. / Prog. Polym. Sci. 31 (2006) 277–357 321
ammonia, sodium dodecylsulfate and ammonium
peroxodisulfate. DPE cannot polymerize by itself
and this implies that DPE units will be found
isolated along the chain. Depending on the
reactants, various types of end groups are expected.
Some examples follow. Termination by dispropor-
tionation can give –H terminal groups. Initiation
with sulfate ion radicals can give –SO4 terminal
groups. Initiation with hydroxyl radical or hydroly-
sis of a polymer chain ending in a sulfate end
group can give –OH terminal groups. The same
types of chain ends can also derive from initiation
with a hydroxyl radical formed during peroxodi-
sulfate decomposition. More complex end groups
derive from termination by the disproportionation
reaction of a polymer radical ending with DPE or
by disproportionation of a polymer radical ending
in MMA. The authors recorded the spectrum of the
copolymer and found all the expected products.
Impallomeni et al. [319] heated a blend of poly(4-
hydroxy butyrate) (PHB) and poly(3 caprolactone)
(PCL) using p-toluenesulfonic acid (PTSA) as a
catalyst. The ester–ester exchange produced a copoly-
mer, and chains terminated with two different end-
groups were expected, namely H/COOH and PTSA/
COOH. The authors used SEC, since chains terminated
with PTSA are expected (due to their stiffness) to
display different elution behavior than the other ones.
Fig. 35 shows an expansion of the MALDI spectrum
along with the m/z assignment of MS peaks. It shows
two ion distributions: the first, centered at m/zZ3700, is
due to sodiated ions of the co-oligomers terminated
with tosyl-terminated and carboxyl groups (species 1 in
Fig. 35); while the second, centered at m/z4Z4600, is
due to the sodiated ions corresponding to the co-
oligomers terminated with OH and COOH groups
(species 2 in Fig. 35). These data suggest that these
oligomers have different elution behavior. Fig. 35
shows an expansion of the MALDI spectrum along with
the m/z assignments of several of the MS peaks, along
with the structures of the oligomeric ions giving rise to
these peaks. The two types of chains are present and
chains terminated with PTSA have distinctly higher
mass, suggesting different elution behavior.
Venkatesh et al. [343] investigated the copolymer-
ization of methyl acrylate (MA) with 1-octene (OCT)
using two different synthetic routes, namely atom-
transfer-radical-polymerization (ATRP) and the usual
free-radical (FR) reaction. The MALDI spectra of MA-
OCT copolymers obtained by ATRP and by FR showed
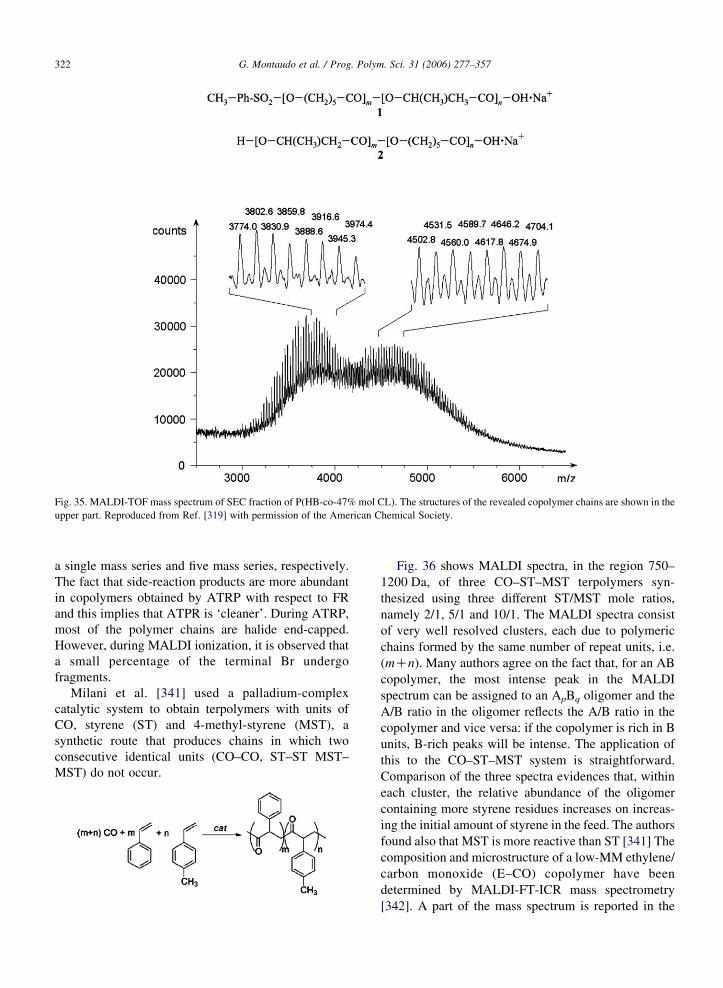
Fig. 35. MALDI-TOF mass spectrum of SEC fraction of P(HB-co-47% mol CL). The structures of the revealed copolymer chains are shown in the
upper part. Reproduced from Ref. [319] with permission of the American Chemical Society.
G. Montaudo et al. / Prog. Polym. Sci. 31 (2006) 277–357322
a single mass series and five mass series, respectively.
The fact that side-reaction products are more abundant
in copolymers obtained by ATRP with respect to FR
and this implies that ATPR is ‘cleaner’. During ATRP,
most of the polymer chains are halide end-capped.
However, during MALDI ionization, it is observed that
a small percentage of the terminal Br undergo
fragments.
Milani et al. [341] used a palladium-complex
catalytic system to obtain terpolymers with units of
CO, styrene (ST) and 4-methyl-styrene (MST), a
synthetic route that produces chains in which two
consecutive identical units (CO–CO, ST–ST MST–
MST) do not occur.
Fig. 36 shows MALDI spectra, in the region 750–
1200 Da, of three CO–ST–MST terpolymers syn-
thesized using three different ST/MST mole ratios,
namely 2/1, 5/1 and 10/1. The MALDI spectra consist
of very well resolved clusters, each due to polymeric
chains formed by the same number of repeat units, i.e.
(mCn). Many authors agree on the fact that, for an AB
copolymer, the most intense peak in the MALDI
spectrum can be assigned to an ApBq oligomer and the
A/B ratio in the oligomer reflects the A/B ratio in the
copolymer and vice versa: if the copolymer is rich in B
units, B-rich peaks will be intense. The application of
this to the CO–ST–MST system is straightforward.
Comparison of the three spectra evidences that, within
each cluster, the relative abundance of the oligomer
containing more styrene residues increases on increas-
ing the initial amount of styrene in the feed. The authors
found also that MST is more reactive than ST [341] The
composition and microstructure of a low-MM ethylene/
carbon monoxide (E–CO) copolymer have been
determined by MALDI-FT-ICR mass spectrometry
[342]. A part of the mass spectrum is reported in the
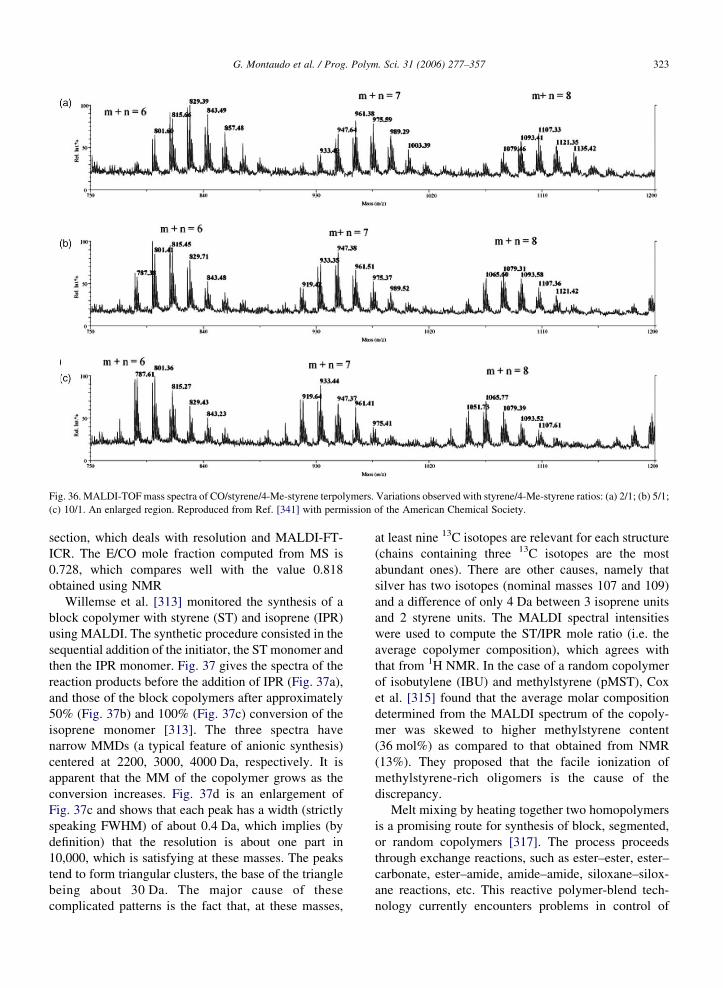
Fig. 36. MALDI-TOFmass spectra of CO/styrene/4-Me-styrene terpolymers. Variations observed with styrene/4-Me-styrene ratios: (a) 2/1; (b) 5/1;
(c) 10/1. An enlarged region. Reproduced from Ref. [341] with permission of the American Chemical Society.
G. Montaudo et al. / Prog. Polym. Sci. 31 (2006) 277–357 323
section, which deals with resolution and MALDI-FT-
ICR. The E/CO mole fraction computed from MS is
0.728, which compares well with the value 0.818
obtained using NMR
Willemse et al. [313] monitored the synthesis of a
block copolymer with styrene (ST) and isoprene (IPR)
using MALDI. The synthetic procedure consisted in the
sequential addition of the initiator, the ST monomer and
then the IPR monomer. Fig. 37 gives the spectra of the
reaction products before the addition of IPR (Fig. 37a),
and those of the block copolymers after approximately
50% (Fig. 37b) and 100% (Fig. 37c) conversion of the
isoprene monomer [313]. The three spectra have
narrow MMDs (a typical feature of anionic synthesis)
centered at 2200, 3000, 4000 Da, respectively. It is
apparent that the MM of the copolymer grows as the
conversion increases. Fig. 37d is an enlargement of
Fig. 37c and shows that each peak has a width (strictly
speaking FWHM) of about 0.4 Da, which implies (by
definition) that the resolution is about one part in
10,000, which is satisfying at these masses. The peaks
tend to form triangular clusters, the base of the triangle
being about 30 Da. The major cause of these
complicated patterns is the fact that, at these masses,
at least nine 13C isotopes are relevant for each structure
(chains containing three 13C isotopes are the most
abundant ones). There are other causes, namely that
silver has two isotopes (nominal masses 107 and 109)
and a difference of only 4 Da between 3 isoprene units
and 2 styrene units. The MALDI spectral intensities
were used to compute the ST/IPR mole ratio (i.e. the
average copolymer composition), which agrees with
that from 1H NMR. In the case of a random copolymer
of isobutylene (IBU) and methylstyrene (pMST), Cox
et al. [315] found that the average molar composition
determined from the MALDI spectrum of the copoly-
mer was skewed to higher methylstyrene content
(36 mol%) as compared to that obtained from NMR
(13%). They proposed that the facile ionization of
methylstyrene-rich oligomers is the cause of the
discrepancy.
Melt mixing by heating together two homopolymers
is a promising route for synthesis of block, segmented,
or random copolymers [317]. The process proceeds
through exchange reactions, such as ester–ester, ester–
carbonate, ester–amide, amide–amide, siloxane–silox-
ane reactions, etc. This reactive polymer-blend tech-
nology currently encounters problems in control of
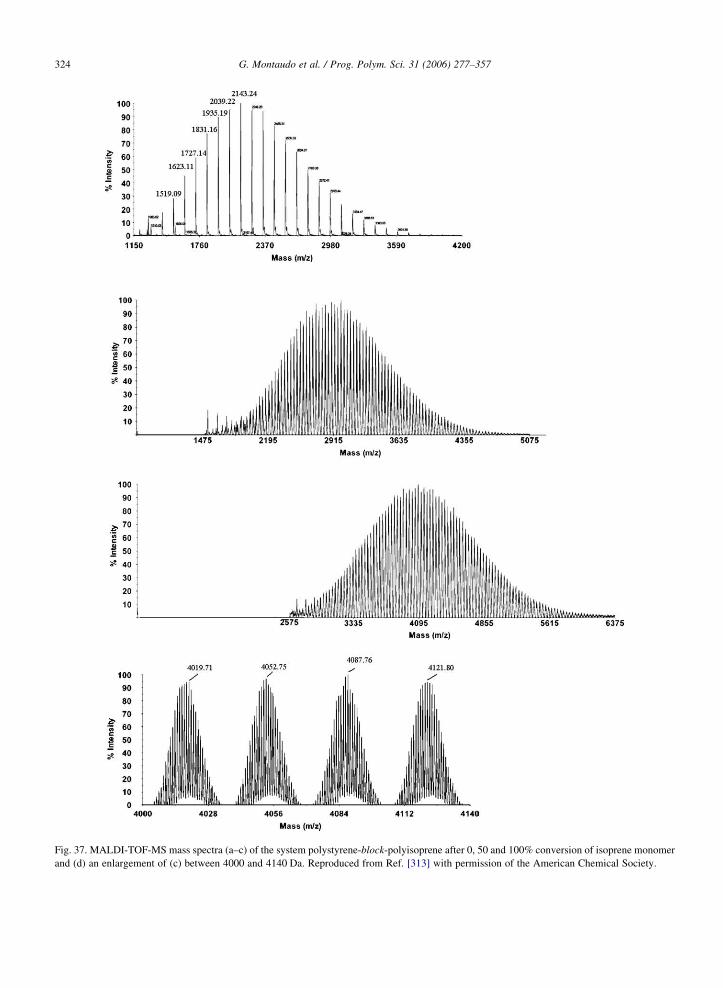
Fig. 37. MALDI-TOF-MS mass spectra (a–c) of the system polystyrene-block-polyisoprene after 0, 50 and 100% conversion of isoprene monomer
and (d) an enlargement of (c) between 4000 and 4140 Da. Reproduced from Ref. [313] with permission of the American Chemical Society.
G. Montaudo et al. / Prog. Polym. Sci. 31 (2006) 277–357324
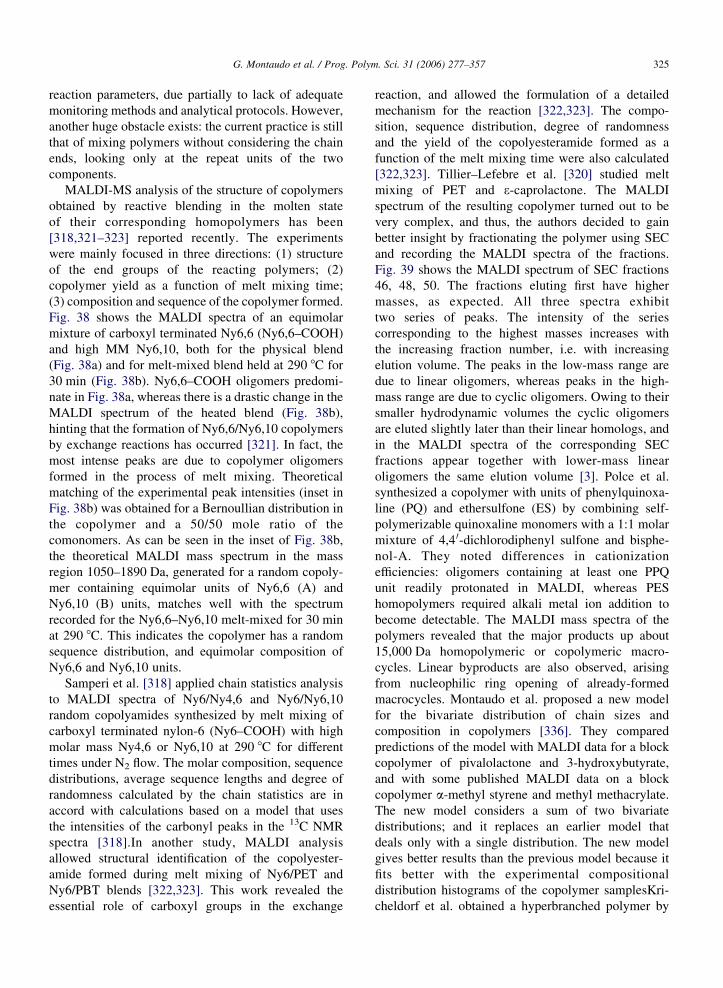
G. Montaudo et al. / Prog. Polym. Sci. 31 (2006) 277–357 325
reaction parameters, due partially to lack of adequate
monitoring methods and analytical protocols. However,
another huge obstacle exists: the current practice is still
that of mixing polymers without considering the chain
ends, looking only at the repeat units of the two
components.
MALDI-MS analysis of the structure of copolymers
obtained by reactive blending in the molten state
of their corresponding homopolymers has been
[318,321–323] reported recently. The experiments
were mainly focused in three directions: (1) structure
of the end groups of the reacting polymers; (2)
copolymer yield as a function of melt mixing time;
(3) composition and sequence of the copolymer formed.
Fig. 38 shows the MALDI spectra of an equimolar
mixture of carboxyl terminated Ny6,6 (Ny6,6–COOH)
and high MM Ny6,10, both for the physical blend
(Fig. 38a) and for melt-mixed blend held at 290 8C for
30 min (Fig. 38b). Ny6,6–COOH oligomers predomi-
nate in Fig. 38a, whereas there is a drastic change in the
MALDI spectrum of the heated blend (Fig. 38b),
hinting that the formation of Ny6,6/Ny6,10 copolymers
by exchange reactions has occurred [321]. In fact, the
most intense peaks are due to copolymer oligomers
formed in the process of melt mixing. Theoretical
matching of the experimental peak intensities (inset in
Fig. 38b) was obtained for a Bernoullian distribution in
the copolymer and a 50/50 mole ratio of the
comonomers. As can be seen in the inset of Fig. 38b,
the theoretical MALDI mass spectrum in the mass
region 1050–1890 Da, generated for a random copoly-
mer containing equimolar units of Ny6,6 (A) and
Ny6,10 (B) units, matches well with the spectrum
recorded for the Ny6,6–Ny6,10 melt-mixed for 30 min
at 290 8C. This indicates the copolymer has a random
sequence distribution, and equimolar composition of
Ny6,6 and Ny6,10 units.
Samperi et al. [318] applied chain statistics analysis
to MALDI spectra of Ny6/Ny4,6 and Ny6/Ny6,10
random copolyamides synthesized by melt mixing of
carboxyl terminated nylon-6 (Ny6–COOH) with high
molar mass Ny4,6 or Ny6,10 at 290 8C for different
times under N2 flow. The molar composition, sequence
distributions, average sequence lengths and degree of
randomness calculated by the chain statistics are in
accord with calculations based on a model that uses
the intensities of the carbonyl peaks in the 13C NMR
spectra [318].In another study, MALDI analysis
allowed structural identification of the copolyester-
amide formed during melt mixing of Ny6/PET and
Ny6/PBT blends [322,323]. This work revealed the
essential role of carboxyl groups in the exchange
reaction, and allowed the formulation of a detailed
mechanism for the reaction [322,323]. The compo-
sition, sequence distribution, degree of randomness
and the yield of the copolyesteramide formed as a
function of the melt mixing time were also calculated
[322,323]. Tillier–Lefebre et al. [320] studied melt
mixing of PET and 3-caprolactone. The MALDI
spectrum of the resulting copolymer turned out to be
very complex, and thus, the authors decided to gain
better insight by fractionating the polymer using SEC
and recording the MALDI spectra of the fractions.
Fig. 39 shows the MALDI spectrum of SEC fractions
46, 48, 50. The fractions eluting first have higher
masses, as expected. All three spectra exhibit
two series of peaks. The intensity of the series
corresponding to the highest masses increases with
the increasing fraction number, i.e. with increasing
elution volume. The peaks in the low-mass range are
due to linear oligomers, whereas peaks in the high-
mass range are due to cyclic oligomers. Owing to their
smaller hydrodynamic volumes the cyclic oligomers
are eluted slightly later than their linear homologs, and
in the MALDI spectra of the corresponding SEC
fractions appear together with lower-mass linear
oligomers the same elution volume [3]. Polce et al.
synthesized a copolymer with units of phenylquinoxa-
line (PQ) and ethersulfone (ES) by combining self-
polymerizable quinoxaline monomers with a 1:1 molar
mixture of 4,4 0-dichlorodiphenyl sulfone and bisphe-
nol-A. They noted differences in cationization
efficiencies: oligomers containing at least one PPQ
unit readily protonated in MALDI, whereas PES
homopolymers required alkali metal ion addition to
become detectable. The MALDI mass spectra of the
polymers revealed that the major products up about
15,000 Da homopolymeric or copolymeric macro-
cycles. Linear byproducts are also observed, arising
from nucleophilic ring opening of already-formed
macrocycles. Montaudo et al. proposed a new model
for the bivariate distribution of chain sizes and
composition in copolymers [336]. They compared
predictions of the model with MALDI data for a block
copolymer of pivalolactone and 3-hydroxybutyrate,
and with some published MALDI data on a block
copolymer a-methyl styrene and methyl methacrylate.
The new model considers a sum of two bivariate
distributions; and it replaces an earlier model that
deals only with a single distribution. The new model
gives better results than the previous model because it
fits better with the experimental compositional
distribution histograms of the copolymer samplesKri-
cheldorf et al. obtained a hyperbranched polymer by
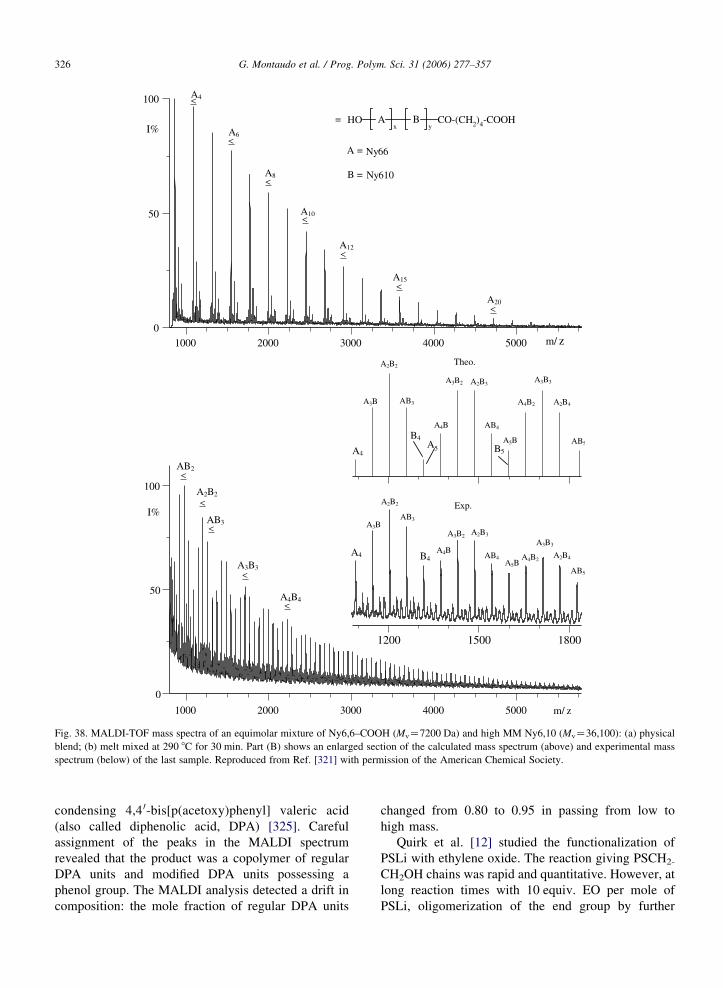
Fig. 38. MALDI-TOF mass spectra of an equimolar mixture of Ny6,6–COOH (MvZ7200 Da) and high MM Ny6,10 (MvZ36,100): (a) physical
blend; (b) melt mixed at 290 8C for 30 min. Part (B) shows an enlarged section of the calculated mass spectrum (above) and experimental mass
spectrum (below) of the last sample. Reproduced from Ref. [321] with permission of the American Chemical Society.
G. Montaudo et al. / Prog. Polym. Sci. 31 (2006) 277–357326
condensing 4,4 0-bis[p(acetoxy)phenyl] valeric acid
(also called diphenolic acid, DPA) [325]. Careful
assignment of the peaks in the MALDI spectrum
revealed that the product was a copolymer of regular
DPA units and modified DPA units possessing a
phenol group. The MALDI analysis detected a drift in
composition: the mole fraction of regular DPA units
changed from 0.80 to 0.95 in passing from low to
high mass.
Quirk et al. [12] studied the functionalization of
PSLi with ethylene oxide. The reaction giving PSCH2-
CH2OH chains was rapid and quantitative. However, at
long reaction times with 10 equiv. EO per mole of
PSLi, oligomerization of the end group by further
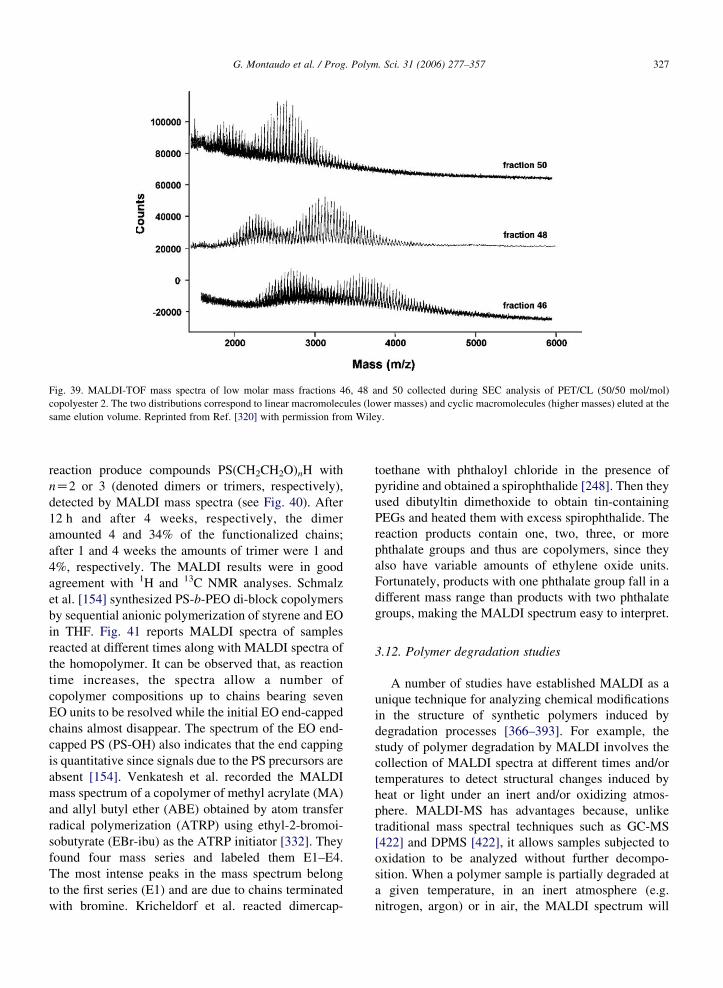
Fig. 39. MALDI-TOF mass spectra of low molar mass fractions 46, 48 and 50 collected during SEC analysis of PET/CL (50/50 mol/mol)
copolyester 2. The two distributions correspond to linear macromolecules (lower masses) and cyclic macromolecules (higher masses) eluted at the
same elution volume. Reprinted from Ref. [320] with permission from Wiley.
G. Montaudo et al. / Prog. Polym. Sci. 31 (2006) 277–357 327
reaction produce compounds PS(CH2CH2O)nH with
nZ2 or 3 (denoted dimers or trimers, respectively),
detected by MALDI mass spectra (see Fig. 40). After
12 h and after 4 weeks, respectively, the dimer
amounted 4 and 34% of the functionalized chains;
after 1 and 4 weeks the amounts of trimer were 1 and
4%, respectively. The MALDI results were in good
agreement with 1H and 13C NMR analyses. Schmalz
et al. [154] synthesized PS-b-PEO di-block copolymers
by sequential anionic polymerization of styrene and EO
in THF. Fig. 41 reports MALDI spectra of samples
reacted at different times along with MALDI spectra of
the homopolymer. It can be observed that, as reaction
time increases, the spectra allow a number of
copolymer compositions up to chains bearing seven
EO units to be resolved while the initial EO end-capped
chains almost disappear. The spectrum of the EO end-
capped PS (PS-OH) also indicates that the end capping
is quantitative since signals due to the PS precursors are
absent [154]. Venkatesh et al. recorded the MALDI
mass spectrum of a copolymer of methyl acrylate (MA)
and allyl butyl ether (ABE) obtained by atom transfer
radical polymerization (ATRP) using ethyl-2-bromoi-
sobutyrate (EBr-ibu) as the ATRP initiator [332]. They
found four mass series and labeled them E1–E4.
The most intense peaks in the mass spectrum belong
to the first series (E1) and are due to chains terminated
with bromine. Kricheldorf et al. reacted dimercap-
toethane with phthaloyl chloride in the presence of
pyridine and obtained a spirophthalide [248]. Then they
used dibutyltin dimethoxide to obtain tin-containing
PEGs and heated them with excess spirophthalide. The
reaction products contain one, two, three, or more
phthalate groups and thus are copolymers, since they
also have variable amounts of ethylene oxide units.
Fortunately, products with one phthalate group fall in a
different mass range than products with two phthalate
groups, making the MALDI spectrum easy to interpret.
3.12. Polymer degradation studies
A number of studies have established MALDI as a
unique technique for analyzing chemical modifications
in the structure of synthetic polymers induced by
degradation processes [366–393]. For example, the
study of polymer degradation by MALDI involves the
collection of MALDI spectra at different times and/or
temperatures to detect structural changes induced by
heat or light under an inert and/or oxidizing atmos-
phere. MALDI-MS has advantages because, unlike
traditional mass spectral techniques such as GC-MS
[422] and DPMS [422], it allows samples subjected to
oxidation to be analyzed without further decompo-
sition. When a polymer sample is partially degraded at
a given temperature, in an inert atmosphere (e.g.
nitrogen, argon) or in air, the MALDI spectrum will
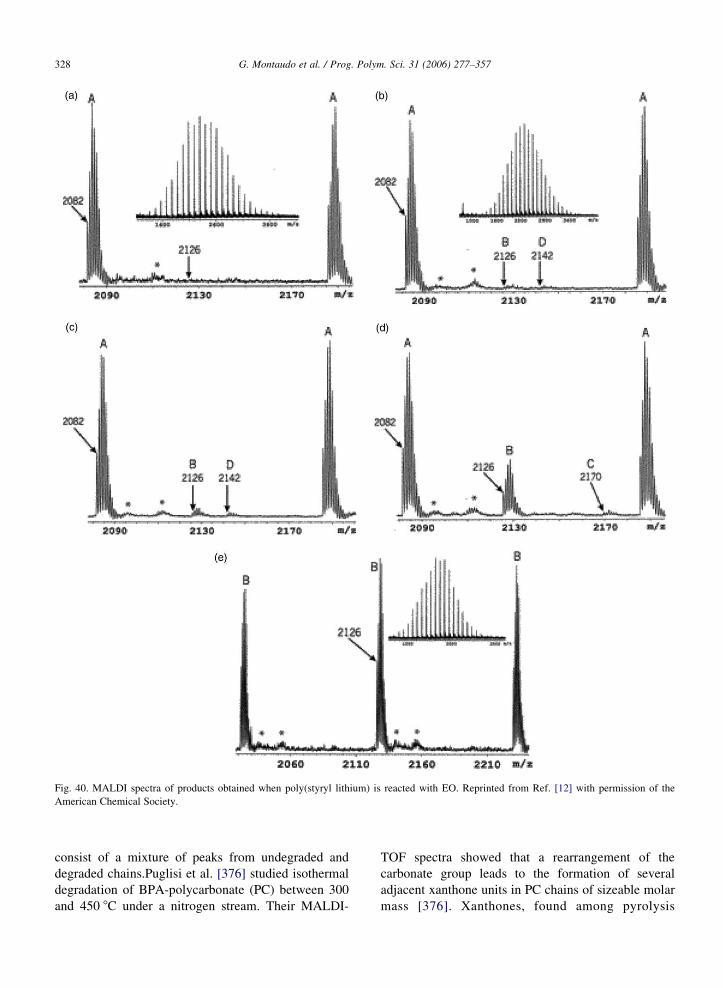
Fig. 40. MALDI spectra of products obtained when poly(styryl lithium) is reacted with EO. Reprinted from Ref. [12] with permission of the
American Chemical Society.
G. Montaudo et al. / Prog. Polym. Sci. 31 (2006) 277–357328
consist of a mixture of peaks from undegraded and
degraded chains.Puglisi et al. [376] studied isothermal
degradation of BPA-polycarbonate (PC) between 300
and 450 8C under a nitrogen stream. Their MALDI-
TOF spectra showed that a rearrangement of the
carbonate group leads to the formation of several
adjacent xanthone units in PC chains of sizeable molar
mass [376]. Xanthones, found among pyrolysis

Fig. 41. MALDI-TOF mass spectra of samples taken during EO polymerization of S19EO38 (SZstyrene). Spectra were measured in reflectron mode
using AgTFA as cationizing agent and dithranol as matrix. Reprinted from Ref. [154] with permission from Wiley.
2800 2900 3000 3100
D
G
B
G
C
D
B
L
QS
E
O
P
S
E
I
T
N
V I
3033
2779
2793
2809
2821
2835
2875
2885
2913
2929
2941
2955
2971
3019
3047
3063
3103
3089
D
G
B
G
C
D
B
L
QS
E
O
P
S
E
I
T
N
V I
3033
2779
2793
2809
2821
2835
2875
2885
2913
2929
2941
2955
2971
3019
3047
3063
3089
m/z
Fig. 42. Enlarged section of MALDI-TOF spectrum of SEC fraction,
collected at 28 ml, of a PC sample oxidized at 300 8C. Reprinted from
Ref. [378] with permission from Elsevier.
G. Montaudo et al. / Prog. Polym. Sci. 31 (2006) 277–357 329
products, are believed to be precursors of graphite-like
structures in the char residue that is produced at
temperatures higher than 450 8C under an inert
atmosphere. The structure of the species produced in
the thermal oxidative degradation of PC has been also
analyzed [377,378]. PC samples heated at 300 and
350 8C in air up to 180 min produced a THF insoluble
gel at the longer heating times. The MALDI spectra of
oxidized PC samples and of their SEC fractions,
showed the presence of oligomers containing acet-
ophenone (peak S, Fig. 42), phenyl substituted acetone
(peaks E and I, Fig. 42), phenols (peaks L, O, P and Q,
Fig. 42), benzyl-,alcohol (peak G, Fig. 42), and
biphenyl terminal groups (peaks T and V, Fig. 42)
[378]. The presence of biphenyl units among the
thermal oxidation products confirms the occurrence of
cross-linking processes, which are responsible for the
formation of the insoluble gel fraction [377,378]. It has
been proposed that the mechanisms accounting for the
formations of thermal oxidation products of PC involve
the simultaneous operation of several reactions: (i)
hydrolysis of carbonate groups of PC to form free
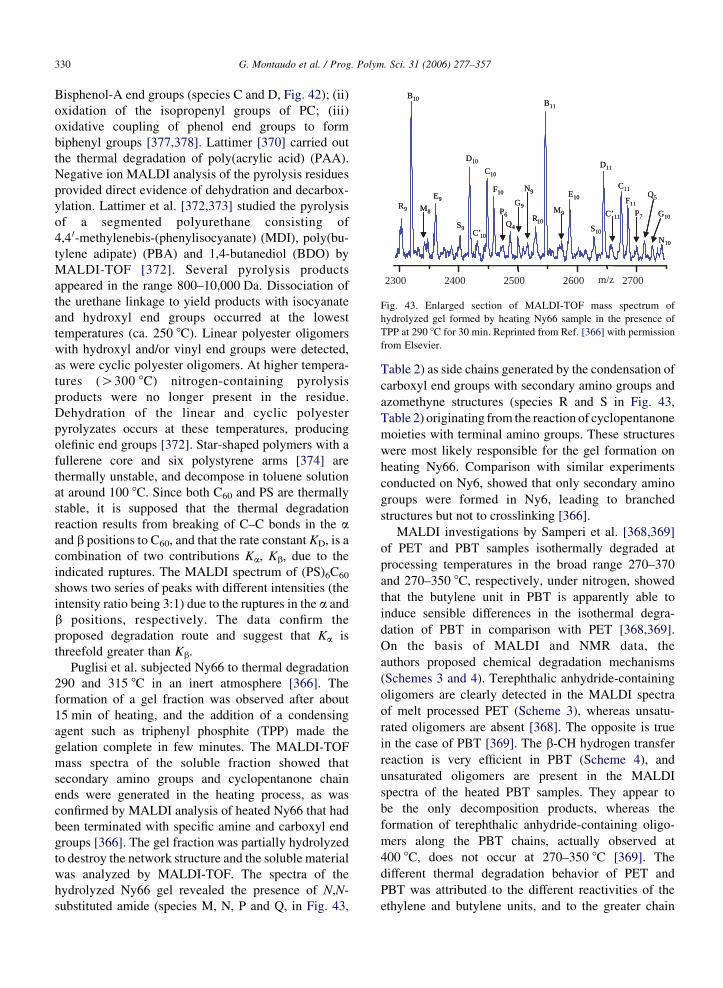
2700
B10B11
E9
F10
C10
D10
S9
D11
E10
R9
S10
R10
F11
C11
M8
C’10
P6
Q4
G9
N9
N10
M9 C’11 P7
Q5
G10
m/z2300 2400 2500 2600
B10B11
E9
F10
C10
D10
S9
D11
E10
R9
S10
R10
F11
C11
M8
C’10
P6
Q4
G9
N9
N10
M9 C’11 P7
Q5
G10
Fig. 43. Enlarged section of MALDI-TOF mass spectrum of
hydrolyzed gel formed by heating Ny66 sample in the presence of
TPP at 290 8C for 30 min. Reprinted from Ref. [366] with permission
from Elsevier.
G. Montaudo et al. / Prog. Polym. Sci. 31 (2006) 277–357330
Bisphenol-A end groups (species C and D, Fig. 42); (ii)
oxidation of the isopropenyl groups of PC; (iii)
oxidative coupling of phenol end groups to form
biphenyl groups [377,378]. Lattimer [370] carried out
the thermal degradation of poly(acrylic acid) (PAA).
Negative ion MALDI analysis of the pyrolysis residues
provided direct evidence of dehydration and decarbox-
ylation. Lattimer et al. [372,373] studied the pyrolysis
of a segmented polyurethane consisting of
4,4 0-methylenebis-(phenylisocyanate) (MDI), poly(bu-
tylene adipate) (PBA) and 1,4-butanediol (BDO) by
MALDI-TOF [372]. Several pyrolysis products
appeared in the range 800–10,000 Da. Dissociation of
the urethane linkage to yield products with isocyanate
and hydroxyl end groups occurred at the lowest
temperatures (ca. 250 8C). Linear polyester oligomers
with hydroxyl and/or vinyl end groups were detected,
as were cyclic polyester oligomers. At higher tempera-
tures (O300 8C) nitrogen-containing pyrolysis
products were no longer present in the residue.
Dehydration of the linear and cyclic polyester
pyrolyzates occurs at these temperatures, producing
olefinic end groups [372]. Star-shaped polymers with a
fullerene core and six polystyrene arms [374] are
thermally unstable, and decompose in toluene solution
at around 100 8C. Since both C60 and PS are thermally
stable, it is supposed that the thermal degradation
reaction results from breaking of C–C bonds in the aand b positions to C60, and that the rate constant KD, is a
combination of two contributions Ka, Kb, due to the
indicated ruptures. The MALDI spectrum of (PS)6C60
shows two series of peaks with different intensities (the
intensity ratio being 3:1) due to the ruptures in the a and
b positions, respectively. The data confirm the
proposed degradation route and suggest that Ka is
threefold greater than Kb.
Puglisi et al. subjected Ny66 to thermal degradation
290 and 315 8C in an inert atmosphere [366]. The
formation of a gel fraction was observed after about
15 min of heating, and the addition of a condensing
agent such as triphenyl phosphite (TPP) made the
gelation complete in few minutes. The MALDI-TOF
mass spectra of the soluble fraction showed that
secondary amino groups and cyclopentanone chain
ends were generated in the heating process, as was
confirmed by MALDI analysis of heated Ny66 that had
been terminated with specific amine and carboxyl end
groups [366]. The gel fraction was partially hydrolyzed
to destroy the network structure and the soluble material
was analyzed by MALDI-TOF. The spectra of the
hydrolyzed Ny66 gel revealed the presence of N,N-
substituted amide (species M, N, P and Q, in Fig. 43,
Table 2) as side chains generated by the condensation of
carboxyl end groups with secondary amino groups and
azomethyne structures (species R and S in Fig. 43,
Table 2) originating from the reaction of cyclopentanone
moieties with terminal amino groups. These structures
were most likely responsible for the gel formation on
heating Ny66. Comparison with similar experiments
conducted on Ny6, showed that only secondary amino
groups were formed in Ny6, leading to branched
structures but not to crosslinking [366].
MALDI investigations by Samperi et al. [368,369]
of PET and PBT samples isothermally degraded at
processing temperatures in the broad range 270–370
and 270–350 8C, respectively, under nitrogen, showed
that the butylene unit in PBT is apparently able to
induce sensible differences in the isothermal degra-
dation of PBT in comparison with PET [368,369].
On the basis of MALDI and NMR data, the
authors proposed chemical degradation mechanisms
(Schemes 3 and 4). Terephthalic anhydride-containing
oligomers are clearly detected in the MALDI spectra
of melt processed PET (Scheme 3), whereas unsatu-
rated oligomers are absent [368]. The opposite is true
in the case of PBT [369]. The b-CH hydrogen transfer
reaction is very efficient in PBT (Scheme 4), and
unsaturated oligomers are present in the MALDI
spectra of the heated PBT samples. They appear to
be the only decomposition products, whereas the
formation of terephthalic anhydride-containing oligo-
mers along the PBT chains, actually observed at
400 8C, does not occur at 270–350 8C [369]. The
different thermal degradation behavior of PET and
PBT was attributed to the different reactivities of the
ethylene and butylene units, and to the greater chain
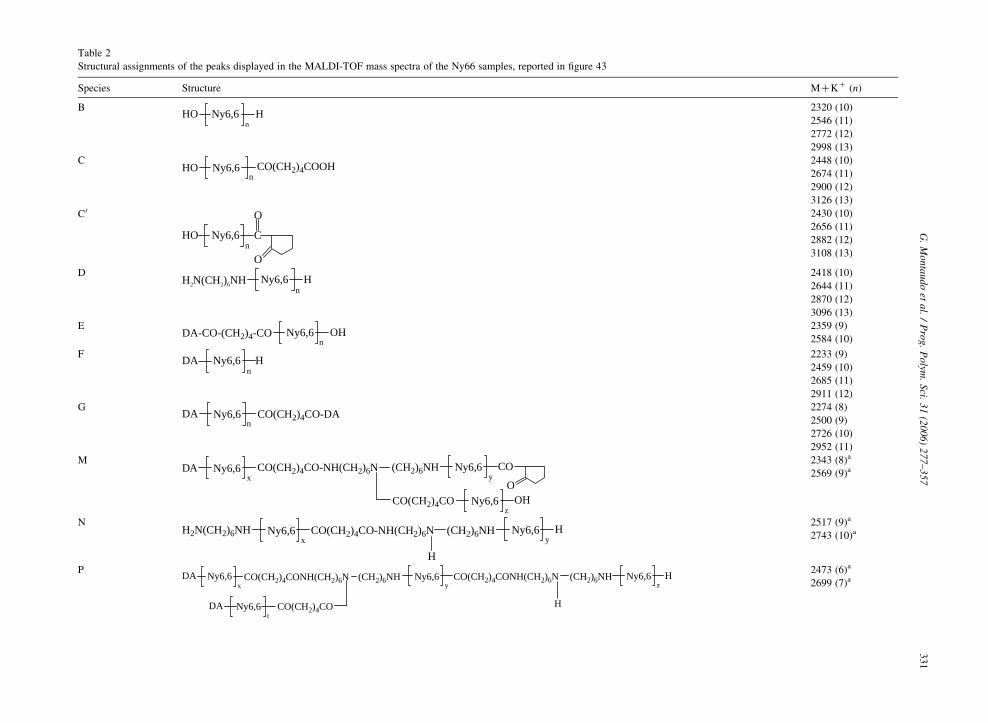
Table 2
Structural assignments of the peaks displayed in the MALDI-TOF mass spectra of the Ny66 samples, reported in figure 43
Species Structure MCKC (n)
BHO H
nNy6,6
2320 (10)
2546 (11)
2772 (12)
2998 (13)
CHO
nCO(CH2)4COOHNy6,6
2448 (10)
2674 (11)
2900 (12)
3126 (13)
C 0
HOn
Ny6,6
O
C
O 2430 (10)
2656 (11)
2882 (12)
3108 (13)
DH2N(CH2)6NH H
nNy6,6
2418 (10)
2644 (11)
2870 (12)
3096 (13)
EDA-CO-(CH2)4-CO OH
nNy6,6
2359 (9)
2584 (10)
FDA
nNy6,6 H
2233 (9)
2459 (10)
2685 (11)
2911 (12)
GDA
nNy6,6 CO(CH2)4CO-DA
2274 (8)
2500 (9)
2726 (10)
2952 (11)
M(CH2)6NH
yNy6,6 CO
O
DAx
Ny6,6 CO(CH2)4CO-NH(CH2)6N
CO(CH2)4CO OHz
Ny6,6
2343 (8)a
2569 (9)a
NH2N(CH2)6NH CO(CH2)4CO-NH(CH2)6N (CH2)6NH
H
yNy6,6 H
xNy6,6
2517 (9)a
2743 (10)a
PCO(CH2)4CONH(CH2)6N (CH2)6NHDA CO(CH2)4CONH(CH2)6N (CH2)6NH
yNy6,6
CO(CH2)4CODAt
Ny6,6 H
zNy6,6 H
xNy6,6
2473 (6)a
2699 (7)a
G.
Mo
nta
ud
oet
al.
/P
rog
.P
olym
.S
ci.3
1(2
00
6)
27
7–
35
7331
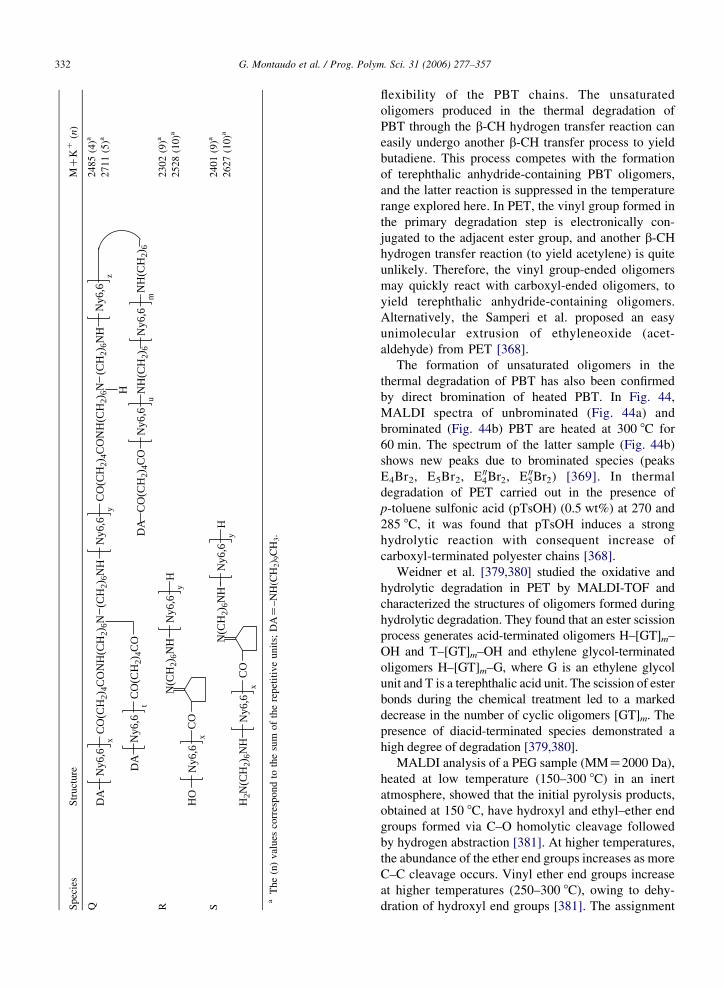
Species
Structure
MCKC
(n)
QC
O(C
H2)
4CO
NH
(CH
2)6N
(CH
2)6N
HD
AC
O(C
H2)
4CO
NH
(CH
2)6N
(CH
2)6N
Hy
Ny6
,6
CO
(CH
2)4C
ON
H(C
H2)
6
zN
y6,6
xN
y6,6
H NH
(CH
2)6
mN
y6,6
uN
y6,6
DA
CO
(CH
2)4C
OD
At
Ny6
,6
2485(4)a
2711(5)a
R
CO
N(C
H2)
6NH
Hy
Ny6
,6
HO
xN
y6,6
2302(9)a
2528(10)a
S
CO
N(C
H2)
6NH
Hy
Ny6
,6
H2N
(CH
2)6N
Hx
Ny6
,6
2401(9)a
2627(10)a
aThe(n)values
correspondto
thesum
oftherepetitiveunits;DAZ–NH(CH2) 9CH3.
G. Montaudo et al. / Prog. Polym. Sci. 31 (2006) 277–357332
flexibility of the PBT chains. The unsaturated
oligomers produced in the thermal degradation of
PBT through the b-CH hydrogen transfer reaction can
easily undergo another b-CH transfer process to yield
butadiene. This process competes with the formation
of terephthalic anhydride-containing PBT oligomers,
and the latter reaction is suppressed in the temperature
range explored here. In PET, the vinyl group formed in
the primary degradation step is electronically con-
jugated to the adjacent ester group, and another b-CHhydrogen transfer reaction (to yield acetylene) is quite
unlikely. Therefore, the vinyl group-ended oligomers
may quickly react with carboxyl-ended oligomers, to
yield terephthalic anhydride-containing oligomers.
Alternatively, the Samperi et al. proposed an easy
unimolecular extrusion of ethyleneoxide (acet-
aldehyde) from PET [368].
The formation of unsaturated oligomers in the
thermal degradation of PBT has also been confirmed
by direct bromination of heated PBT. In Fig. 44,
MALDI spectra of unbrominated (Fig. 44a) and
brominated (Fig. 44b) PBT are heated at 300 8C for
60 min. The spectrum of the latter sample (Fig. 44b)
shows new peaks due to brominated species (peaks
E4Br2, E5Br2, E004Br2, E00
5Br2) [369]. In thermal
degradation of PET carried out in the presence of
p-toluene sulfonic acid (pTsOH) (0.5 wt%) at 270 and
285 8C, it was found that pTsOH induces a strong
hydrolytic reaction with consequent increase of
carboxyl-terminated polyester chains [368].
Weidner et al. [379,380] studied the oxidative and
hydrolytic degradation in PET by MALDI-TOF and
characterized the structures of oligomers formed during
hydrolytic degradation. They found that an ester scission
process generates acid-terminated oligomers H–[GT]m–
OH and T–[GT]m–OH and ethylene glycol-terminated
oligomers H–[GT]m–G, where G is an ethylene glycol
unit and T is a terephthalic acid unit. The scission of ester
bonds during the chemical treatment led to a marked
decrease in the number of cyclic oligomers [GT]m. The
presence of diacid-terminated species demonstrated a
high degree of degradation [379,380].
MALDI analysis of a PEG sample (MMZ2000 Da),
heated at low temperature (150–300 8C) in an inert
atmosphere, showed that the initial pyrolysis products,
obtained at 150 8C, have hydroxyl and ethyl–ether end
groups formed via C–O homolytic cleavage followed
by hydrogen abstraction [381]. At higher temperatures,
the abundance of the ether end groups increases as more
C–C cleavage occurs. Vinyl ether end groups increase
at higher temperatures (250–300 8C), owing to dehy-
dration of hydroxyl end groups [381]. The assignment
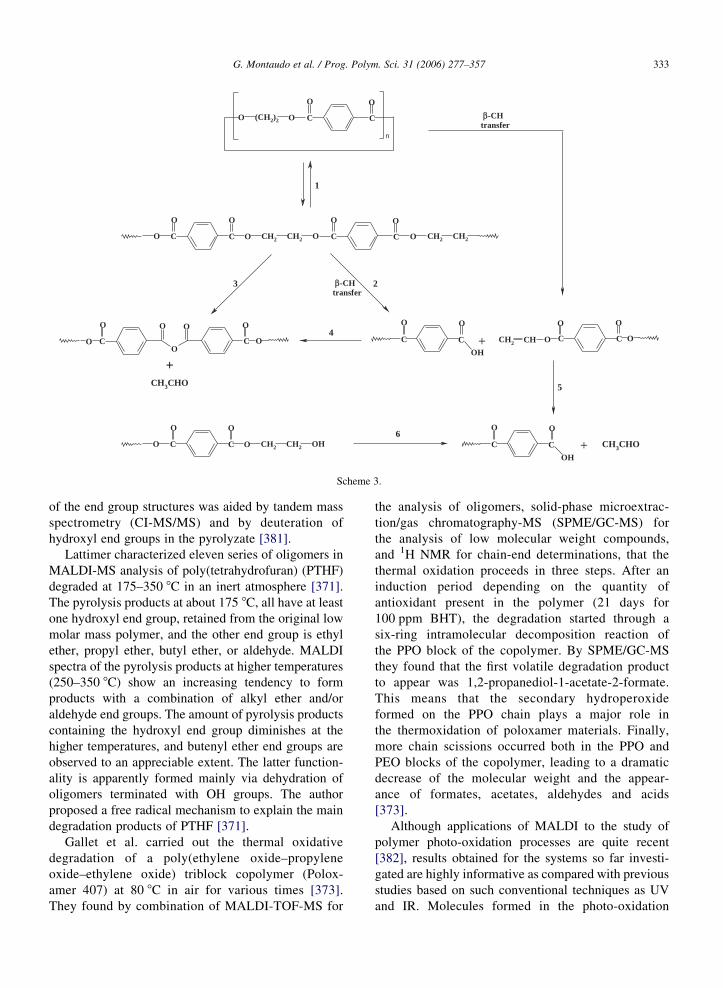
-CH transfer
CH2 CH OC
O
OH
C
O
C
O
C
O
O
C
O
C
O
O O CH2 OC
O
C
O
OCH2 CH2 CH2
O
n
(CH2)2 C
O
CO O
C
O
C
O
OOO
OO
CH3CHO
++
+
C
O
OH
C
O
CH3CHO+O O CH2 OHC
O
C
O
CH2
1
23
4
6
5
-CHtransfer
Scheme 3.
G. Montaudo et al. / Prog. Polym. Sci. 31 (2006) 277–357 333
of the end group structures was aided by tandem mass
spectrometry (CI-MS/MS) and by deuteration of
hydroxyl end groups in the pyrolyzate [381].
Lattimer characterized eleven series of oligomers in
MALDI-MS analysis of poly(tetrahydrofuran) (PTHF)
degraded at 175–350 8C in an inert atmosphere [371].
The pyrolysis products at about 175 8C, all have at least
one hydroxyl end group, retained from the original low
molar mass polymer, and the other end group is ethyl
ether, propyl ether, butyl ether, or aldehyde. MALDI
spectra of the pyrolysis products at higher temperatures
(250–350 8C) show an increasing tendency to form
products with a combination of alkyl ether and/or
aldehyde end groups. The amount of pyrolysis products
containing the hydroxyl end group diminishes at the
higher temperatures, and butenyl ether end groups are
observed to an appreciable extent. The latter function-
ality is apparently formed mainly via dehydration of
oligomers terminated with OH groups. The author
proposed a free radical mechanism to explain the main
degradation products of PTHF [371].
Gallet et al. carried out the thermal oxidative
degradation of a poly(ethylene oxide–propylene
oxide–ethylene oxide) triblock copolymer (Polox-
amer 407) at 80 8C in air for various times [373].
They found by combination of MALDI-TOF-MS for
the analysis of oligomers, solid-phase microextrac-
tion/gas chromatography-MS (SPME/GC-MS) for
the analysis of low molecular weight compounds,
and 1H NMR for chain-end determinations, that the
thermal oxidation proceeds in three steps. After an
induction period depending on the quantity of
antioxidant present in the polymer (21 days for
100 ppm BHT), the degradation started through a
six-ring intramolecular decomposition reaction of
the PPO block of the copolymer. By SPME/GC-MS
they found that the first volatile degradation product
to appear was 1,2-propanediol-1-acetate-2-formate.
This means that the secondary hydroperoxide
formed on the PPO chain plays a major role in
the thermoxidation of poloxamer materials. Finally,
more chain scissions occurred both in the PPO and
PEO blocks of the copolymer, leading to a dramatic
decrease of the molecular weight and the appear-
ance of formates, acetates, aldehydes and acids
[373].
Although applications of MALDI to the study of
polymer photo-oxidation processes are quite recent
[382], results obtained for the systems so far investi-
gated are highly informative as compared with previous
studies based on such conventional techniques as UV
and IR. Molecules formed in the photo-oxidation
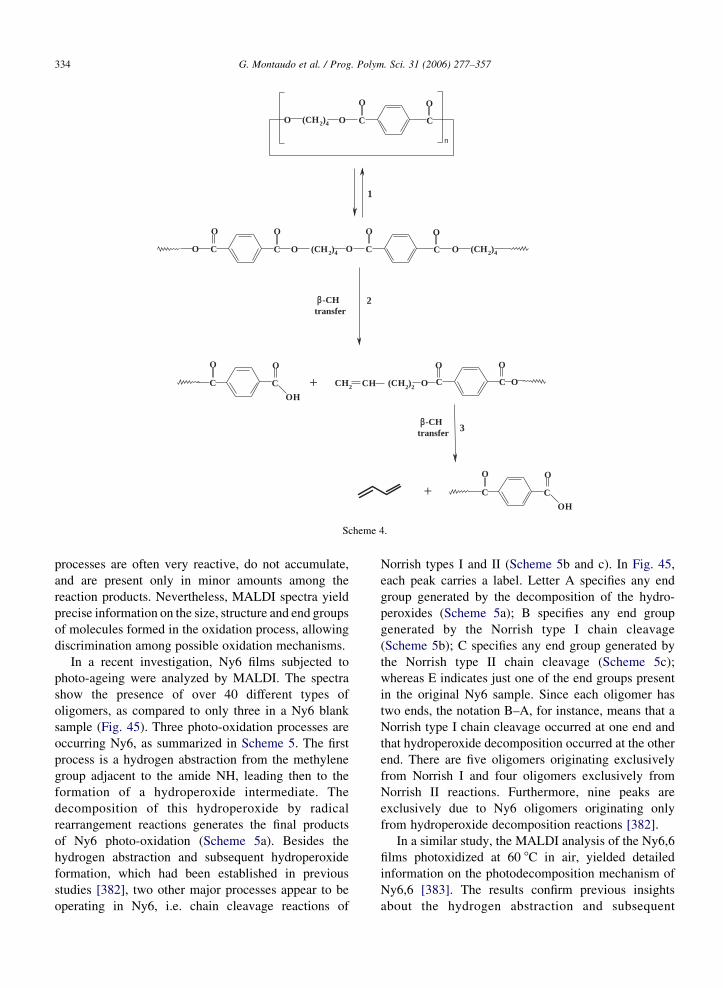
ββ-CH transfer
CH2 CH OC
O
OH
C
O
C
O
C
O
O
C
O
C
O
O O (CH2)4 OC
O
C
O
O (CH2)4
O
n
(CH2)4 C
O
CO O
+
C
O
OH
C
O
1
2
3
(CH2)2
+
β-CH transfer
Scheme 4.
G. Montaudo et al. / Prog. Polym. Sci. 31 (2006) 277–357334
processes are often very reactive, do not accumulate,
and are present only in minor amounts among the
reaction products. Nevertheless, MALDI spectra yield
precise information on the size, structure and end groups
of molecules formed in the oxidation process, allowing
discrimination among possible oxidation mechanisms.
In a recent investigation, Ny6 films subjected to
photo-ageing were analyzed by MALDI. The spectra
show the presence of over 40 different types of
oligomers, as compared to only three in a Ny6 blank
sample (Fig. 45). Three photo-oxidation processes are
occurring Ny6, as summarized in Scheme 5. The first
process is a hydrogen abstraction from the methylene
group adjacent to the amide NH, leading then to the
formation of a hydroperoxide intermediate. The
decomposition of this hydroperoxide by radical
rearrangement reactions generates the final products
of Ny6 photo-oxidation (Scheme 5a). Besides the
hydrogen abstraction and subsequent hydroperoxide
formation, which had been established in previous
studies [382], two other major processes appear to be
operating in Ny6, i.e. chain cleavage reactions of
Norrish types I and II (Scheme 5b and c). In Fig. 45,
each peak carries a label. Letter A specifies any end
group generated by the decomposition of the hydro-
peroxides (Scheme 5a); B specifies any end group
generated by the Norrish type I chain cleavage
(Scheme 5b); C specifies any end group generated by
the Norrish type II chain cleavage (Scheme 5c);
whereas E indicates just one of the end groups present
in the original Ny6 sample. Since each oligomer has
two ends, the notation B–A, for instance, means that a
Norrish type I chain cleavage occurred at one end and
that hydroperoxide decomposition occurred at the other
end. There are five oligomers originating exclusively
from Norrish I and four oligomers exclusively from
Norrish II reactions. Furthermore, nine peaks are
exclusively due to Ny6 oligomers originating only
from hydroperoxide decomposition reactions [382].
In a similar study, the MALDI analysis of the Ny6,6
films photoxidized at 60 8C in air, yielded detailed
information on the photodecomposition mechanism of
Ny6,6 [383]. The results confirm previous insights
about the hydrogen abstraction and subsequent
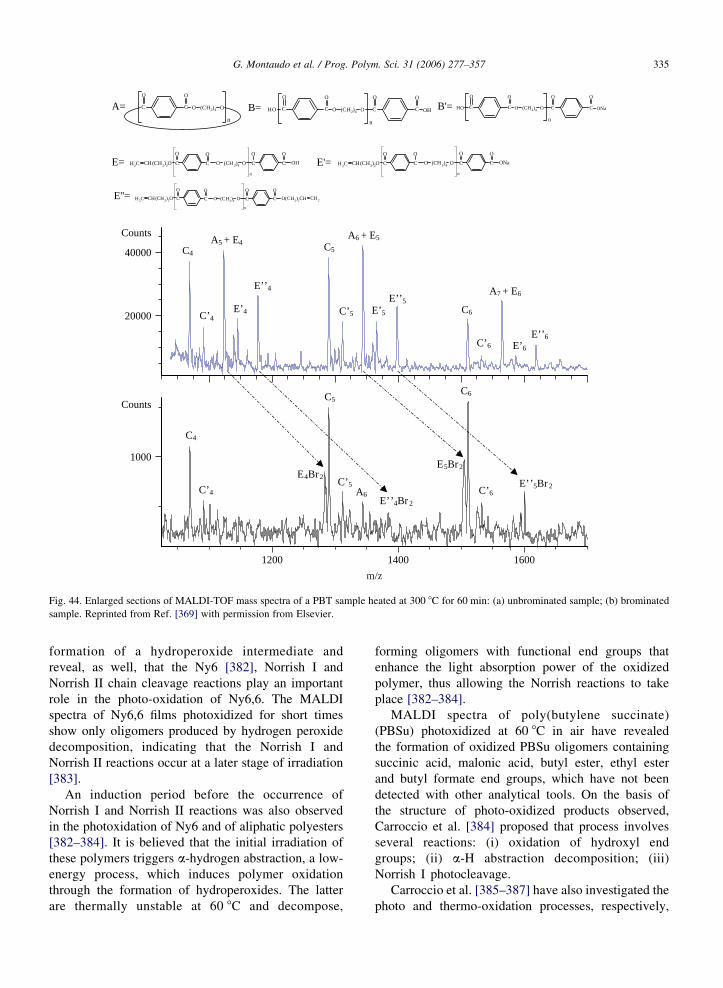
1000
20000
40000
1200 1400 1600
m/z
A5 + E4A6 + E5
A7 + E6
E’4 E’5
E’6
E’’4
E’’5
E’’6
C4C5
C6C’4C’5
C’6
A6
C4
C5C6
E5Br2E4Br2
E’’4Br 2
E’’5Br 2C’6
C’5C’4
Counts
Counts
C C O
OO
O(CH2)4
n
C C O
OO
OOH (CH2)4
n
C C OH
OO
C C O
OO
OOH (CH 2)4
n
C C ONa
OO
C
O
C
O
O (CH 2)4 O
n
C
O
C
O
OHCH (CH2)2OCH2 C
O
C
O
O (CH 2)4 O
n
C
O
C
O
ONaCH(CH2)2OCH2
n
C
O
C
O
O (CH2)4 O C
O
C
O
O(CH2)2CHCH(CH 2)2OCH2CH 2
A= B= B'=
E= E'=
E''=
Fig. 44. Enlarged sections of MALDI-TOF mass spectra of a PBT sample heated at 300 8C for 60 min: (a) unbrominated sample; (b) brominated
sample. Reprinted from Ref. [369] with permission from Elsevier.
G. Montaudo et al. / Prog. Polym. Sci. 31 (2006) 277–357 335
formation of a hydroperoxide intermediate and
reveal, as well, that the Ny6 [382], Norrish I and
Norrish II chain cleavage reactions play an important
role in the photo-oxidation of Ny6,6. The MALDI
spectra of Ny6,6 films photoxidized for short times
show only oligomers produced by hydrogen peroxide
decomposition, indicating that the Norrish I and
Norrish II reactions occur at a later stage of irradiation
[383].
An induction period before the occurrence of
Norrish I and Norrish II reactions was also observed
in the photoxidation of Ny6 and of aliphatic polyesters
[382–384]. It is believed that the initial irradiation of
these polymers triggers a-hydrogen abstraction, a low-
energy process, which induces polymer oxidation
through the formation of hydroperoxides. The latter
are thermally unstable at 60 8C and decompose,
forming oligomers with functional end groups that
enhance the light absorption power of the oxidized
polymer, thus allowing the Norrish reactions to take
place [382–384].
MALDI spectra of poly(butylene succinate)
(PBSu) photoxidized at 60 8C in air have revealed
the formation of oxidized PBSu oligomers containing
succinic acid, malonic acid, butyl ester, ethyl ester
and butyl formate end groups, which have not been
detected with other analytical tools. On the basis of
the structure of photo-oxidized products observed,
Carroccio et al. [384] proposed that process involves
several reactions: (i) oxidation of hydroxyl end
groups; (ii) a-H abstraction decomposition; (iii)
Norrish I photocleavage.
Carroccio et al. [385–387] have also investigated the
photo and thermo-oxidation processes, respectively,
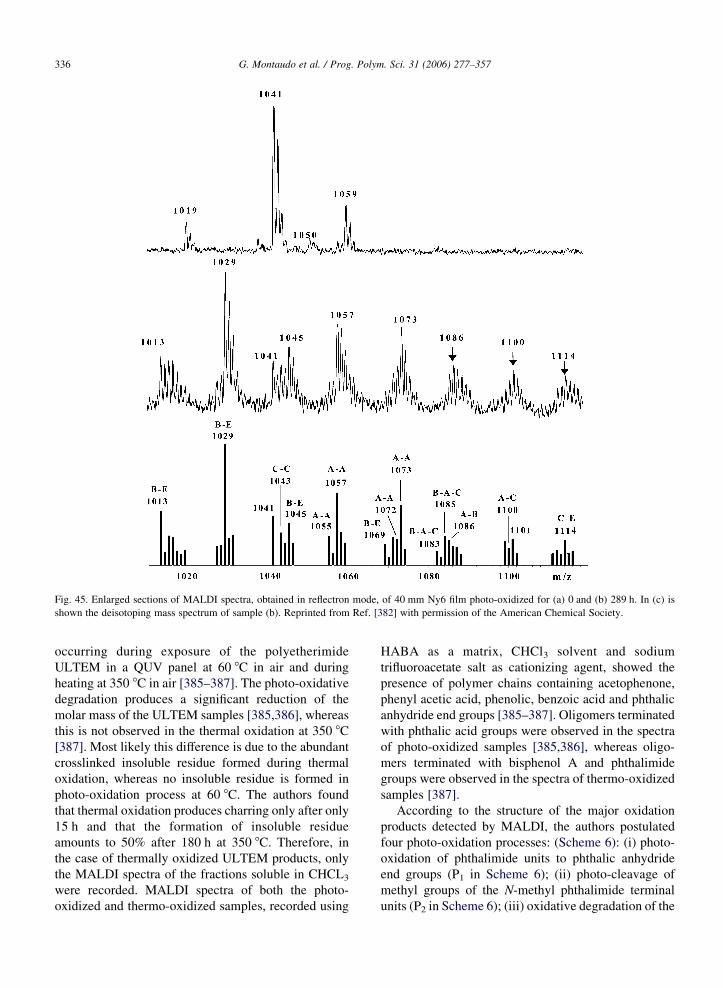
Fig. 45. Enlarged sections of MALDI spectra, obtained in reflectron mode, of 40 mm Ny6 film photo-oxidized for (a) 0 and (b) 289 h. In (c) is
shown the deisotoping mass spectrum of sample (b). Reprinted from Ref. [382] with permission of the American Chemical Society.
G. Montaudo et al. / Prog. Polym. Sci. 31 (2006) 277–357336
occurring during exposure of the polyetherimide
ULTEM in a QUV panel at 60 8C in air and during
heating at 350 8C in air [385–387]. The photo-oxidative
degradation produces a significant reduction of the
molar mass of the ULTEM samples [385,386], whereas
this is not observed in the thermal oxidation at 350 8C
[387]. Most likely this difference is due to the abundant
crosslinked insoluble residue formed during thermal
oxidation, whereas no insoluble residue is formed in
photo-oxidation process at 60 8C. The authors found
that thermal oxidation produces charring only after only
15 h and that the formation of insoluble residue
amounts to 50% after 180 h at 350 8C. Therefore, in
the case of thermally oxidized ULTEM products, only
the MALDI spectra of the fractions soluble in CHCL3
were recorded. MALDI spectra of both the photo-
oxidized and thermo-oxidized samples, recorded using
HABA as a matrix, CHCl3 solvent and sodium
trifluoroacetate salt as cationizing agent, showed the
presence of polymer chains containing acetophenone,
phenyl acetic acid, phenolic, benzoic acid and phthalic
anhydride end groups [385–387]. Oligomers terminated
with phthalic acid groups were observed in the spectra
of photo-oxidized samples [385,386], whereas oligo-
mers terminated with bisphenol A and phthalimide
groups were observed in the spectra of thermo-oxidized
samples [387].
According to the structure of the major oxidation
products detected by MALDI, the authors postulated
four photo-oxidation processes: (Scheme 6): (i) photo-
oxidation of phthalimide units to phthalic anhydride
end groups (P1 in Scheme 6); (ii) photo-cleavage of
methyl groups of the N-methyl phthalimide terminal
units (P2 in Scheme 6); (iii) oxidative degradation of the
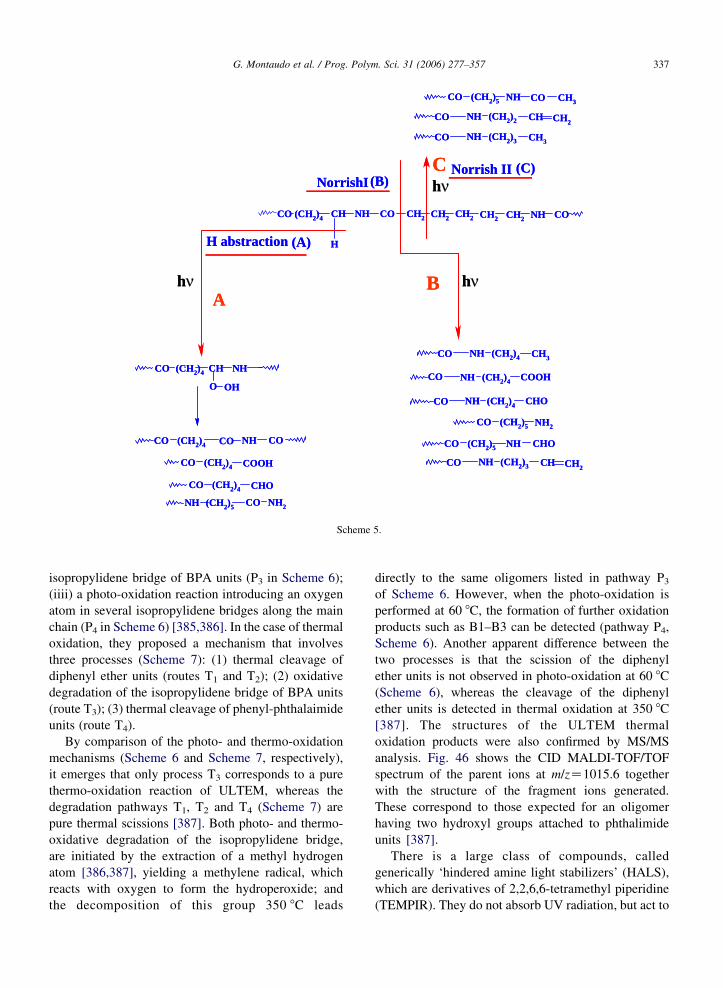
CH
H
NH COCO (CH2)4 CH2 CH2 CH2 CH2 CH2 NH CO
H abstraction
NorrishI Norrish II
CO (CH2)4NH CHO
CO (CH2)4NH COOH
CO (CH2)4NH CH3
(B)
(CH2)5CO NH2
(CH2)5CO NH CHO
CO (CH2)3NH CH CH2
CO (CH2)3NH CH3
CO (CH2)2NH CH CH2
(CH2)5CO NH CO CH3
(C)
(A)
CH NH
O OH
CO (CH2)4
(CH2)4CO CHO
(CH2)4CO COOH
NH CO NH2(CH2)5
NH(CH2)4CO CO CO
h
hhA
B
C
Scheme 5.
G. Montaudo et al. / Prog. Polym. Sci. 31 (2006) 277–357 337
isopropylidene bridge of BPA units (P3 in Scheme 6);
(iiii) a photo-oxidation reaction introducing an oxygen
atom in several isopropylidene bridges along the main
chain (P4 in Scheme 6) [385,386]. In the case of thermal
oxidation, they proposed a mechanism that involves
three processes (Scheme 7): (1) thermal cleavage of
diphenyl ether units (routes T1 and T2); (2) oxidative
degradation of the isopropylidene bridge of BPA units
(route T3); (3) thermal cleavage of phenyl-phthalaimide
units (route T4).
By comparison of the photo- and thermo-oxidation
mechanisms (Scheme 6 and Scheme 7, respectively),
it emerges that only process T3 corresponds to a pure
thermo-oxidation reaction of ULTEM, whereas the
degradation pathways T1, T2 and T4 (Scheme 7) are
pure thermal scissions [387]. Both photo- and thermo-
oxidative degradation of the isopropylidene bridge,
are initiated by the extraction of a methyl hydrogen
atom [386,387], yielding a methylene radical, which
reacts with oxygen to form the hydroperoxide; and
the decomposition of this group 350 8C leads
directly to the same oligomers listed in pathway P3of Scheme 6. However, when the photo-oxidation is
performed at 60 8C, the formation of further oxidation
products such as B1–B3 can be detected (pathway P4,
Scheme 6). Another apparent difference between the
two processes is that the scission of the diphenyl
ether units is not observed in photo-oxidation at 60 8C
(Scheme 6), whereas the cleavage of the diphenyl
ether units is detected in thermal oxidation at 350 8C
[387]. The structures of the ULTEM thermal
oxidation products were also confirmed by MS/MS
analysis. Fig. 46 shows the CID MALDI-TOF/TOF
spectrum of the parent ions at m/zZ1015.6 together
with the structure of the fragment ions generated.
These correspond to those expected for an oligomer
having two hydroxyl groups attached to phthalimide
units [387].
There is a large class of compounds, called
generically ‘hindered amine light stabilizers’ (HALS),
which are derivatives of 2,2,6,6-tetramethyl piperidine
(TEMPIR). They do not absorb UV radiation, but act to
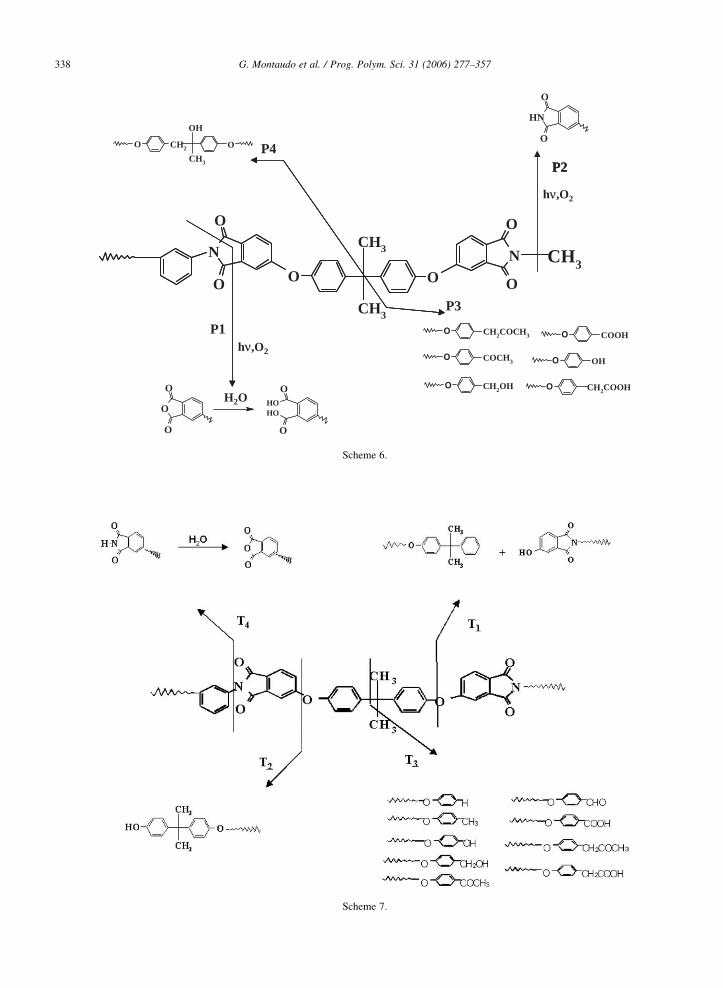
CH3
CH3
O
N
O
O
NO
O
O
CH3
P1
COCH3O
COOHOCH2COCH3O
OHO
CH2OHO CH2COOHO
NH
O
O
O
O
O
O
O
OHOH
H2O
h ,O2
P2
P3
P4
OH
CH3
OO CH2
h ,O2
P2
Scheme 6.
Scheme 7.
G. Montaudo et al. / Prog. Polym. Sci. 31 (2006) 277–357338
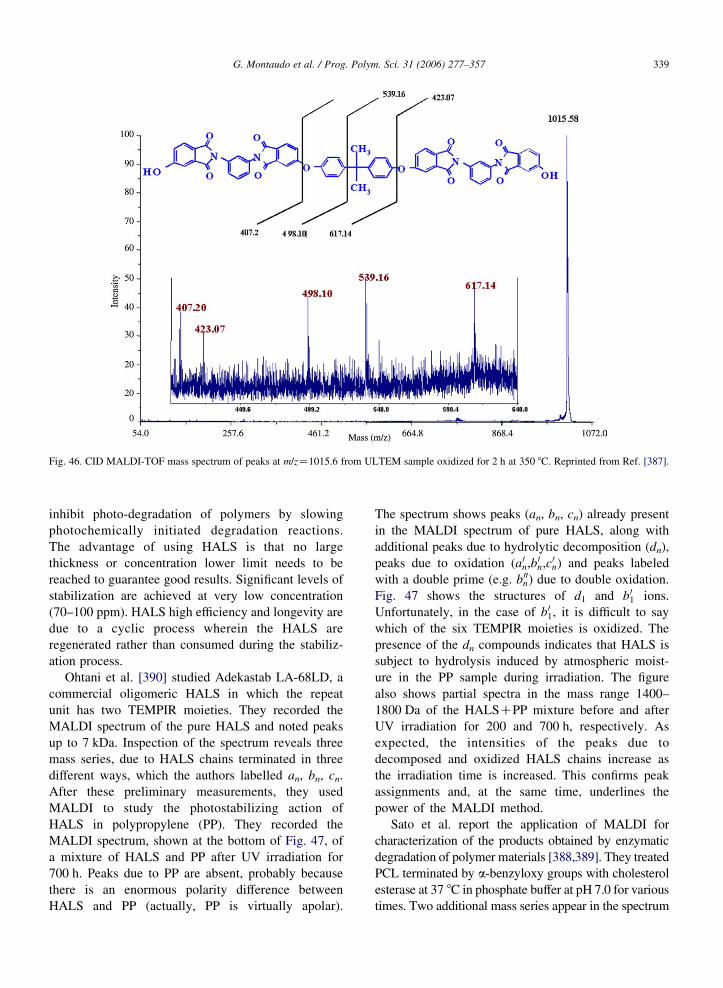
Fig. 46. CID MALDI-TOF mass spectrum of peaks at m/zZ1015.6 from ULTEM sample oxidized for 2 h at 350 8C. Reprinted from Ref. [387].
G. Montaudo et al. / Prog. Polym. Sci. 31 (2006) 277–357 339
inhibit photo-degradation of polymers by slowing
photochemically initiated degradation reactions.
The advantage of using HALS is that no large
thickness or concentration lower limit needs to be
reached to guarantee good results. Significant levels of
stabilization are achieved at very low concentration
(70–100 ppm). HALS high efficiency and longevity are
due to a cyclic process wherein the HALS are
regenerated rather than consumed during the stabiliz-
ation process.
Ohtani et al. [390] studied Adekastab LA-68LD, a
commercial oligomeric HALS in which the repeat
unit has two TEMPIR moieties. They recorded the
MALDI spectrum of the pure HALS and noted peaks
up to 7 kDa. Inspection of the spectrum reveals three
mass series, due to HALS chains terminated in three
different ways, which the authors labelled an, bn, cn.
After these preliminary measurements, they used
MALDI to study the photostabilizing action of
HALS in polypropylene (PP). They recorded the
MALDI spectrum, shown at the bottom of Fig. 47, of
a mixture of HALS and PP after UV irradiation for
700 h. Peaks due to PP are absent, probably because
there is an enormous polarity difference between
HALS and PP (actually, PP is virtually apolar).
The spectrum shows peaks (an, bn, cn) already present
in the MALDI spectrum of pure HALS, along with
additional peaks due to hydrolytic decomposition (dn),
peaks due to oxidation ða0n;b
0n;c
0nÞ and peaks labeled
with a double prime (e.g. b00n) due to double oxidation.
Fig. 47 shows the structures of d1 and b01 ions.
Unfortunately, in the case of b01, it is difficult to say
which of the six TEMPIR moieties is oxidized. The
presence of the dn compounds indicates that HALS is
subject to hydrolysis induced by atmospheric moist-
ure in the PP sample during irradiation. The figure
also shows partial spectra in the mass range 1400–
1800 Da of the HALSCPP mixture before and after
UV irradiation for 200 and 700 h, respectively. As
expected, the intensities of the peaks due to
decomposed and oxidized HALS chains increase as
the irradiation time is increased. This confirms peak
assignments and, at the same time, underlines the
power of the MALDI method.
Sato et al. report the application of MALDI for
characterization of the products obtained by enzymatic
degradation of polymer materials [388,389]. They treated
PCL terminated by a-benzyloxy groups with cholesterol
esterase at 37 8C in phosphate buffer at pH 7.0 for various
times. Two additional mass series appear in the spectrum
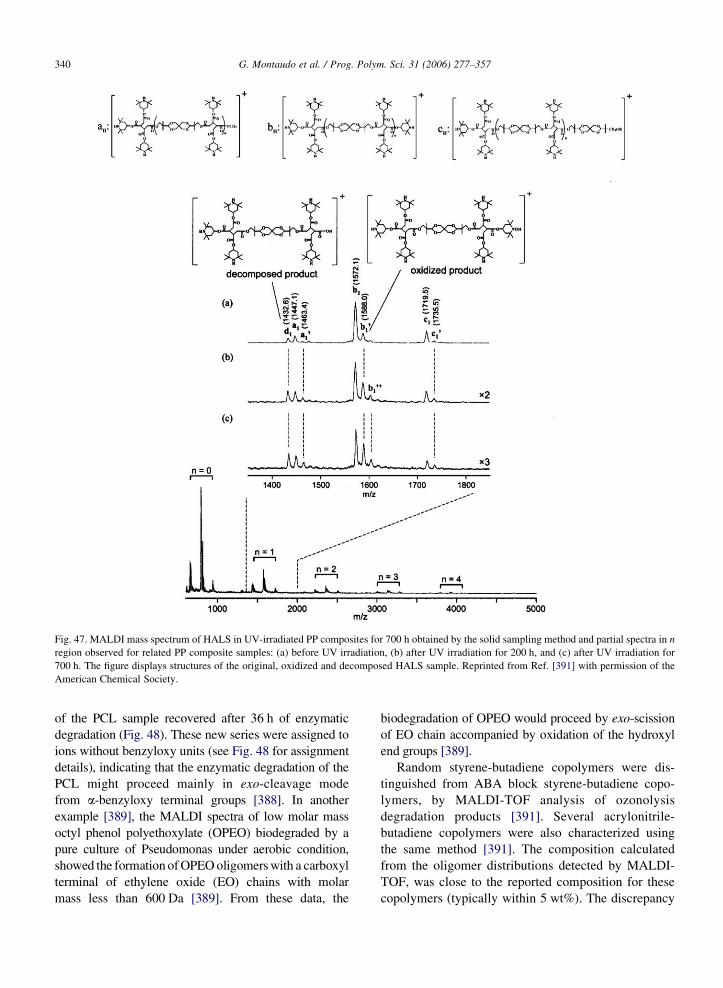
Fig. 47. MALDI mass spectrum of HALS in UV-irradiated PP composites for 700 h obtained by the solid sampling method and partial spectra in n
region observed for related PP composite samples: (a) before UV irradiation, (b) after UV irradiation for 200 h, and (c) after UV irradiation for
700 h. The figure displays structures of the original, oxidized and decomposed HALS sample. Reprinted from Ref. [391] with permission of the
American Chemical Society.
G. Montaudo et al. / Prog. Polym. Sci. 31 (2006) 277–357340
of the PCL sample recovered after 36 h of enzymatic
degradation (Fig. 48). These new series were assigned to
ions without benzyloxy units (see Fig. 48 for assignment
details), indicating that the enzymatic degradation of the
PCL might proceed mainly in exo-cleavage mode
from a-benzyloxy terminal groups [388]. In another
example [389], the MALDI spectra of low molar mass
octyl phenol polyethoxylate (OPEO) biodegraded by a
pure culture of Pseudomonas under aerobic condition,
showed the formationofOPEOoligomerswith a carboxyl
terminal of ethylene oxide (EO) chains with molar
mass less than 600 Da [389]. From these data, the
biodegradation of OPEO would proceed by exo-scission
of EO chain accompanied by oxidation of the hydroxyl
end groups [389].
Random styrene-butadiene copolymers were dis-
tinguished from ABA block styrene-butadiene copo-
lymers, by MALDI-TOF analysis of ozonolysis
degradation products [391]. Several acrylonitrile-
butadiene copolymers were also characterized using
the same method [391]. The composition calculated
from the oligomer distributions detected by MALDI-
TOF, was close to the reported composition for these
copolymers (typically within 5 wt%). The discrepancy
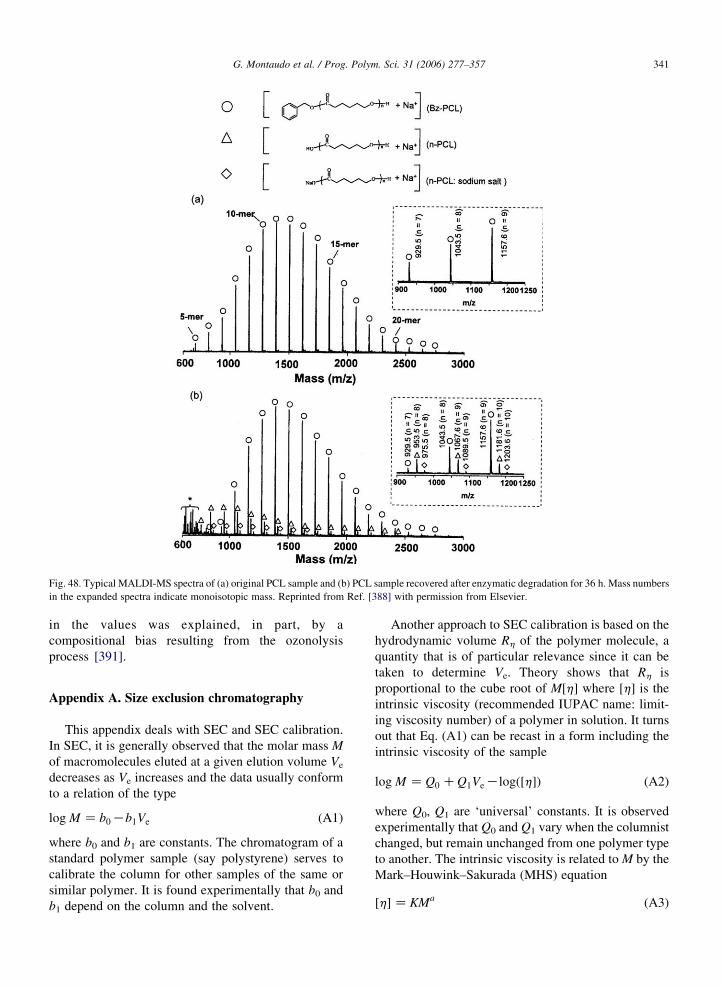
Fig. 48. Typical MALDI-MS spectra of (a) original PCL sample and (b) PCL sample recovered after enzymatic degradation for 36 h. Mass numbers
in the expanded spectra indicate monoisotopic mass. Reprinted from Ref. [388] with permission from Elsevier.
G. Montaudo et al. / Prog. Polym. Sci. 31 (2006) 277–357 341
in the values was explained, in part, by a
compositional bias resulting from the ozonolysis
process [391].
Appendix A. Size exclusion chromatography
This appendix deals with SEC and SEC calibration.
In SEC, it is generally observed that the molar mass M
of macromolecules eluted at a given elution volume Ve
decreases as Ve increases and the data usually conform
to a relation of the type
log M Z b0Kb1Ve (A1)
where b0 and b1 are constants. The chromatogram of a
standard polymer sample (say polystyrene) serves to
calibrate the column for other samples of the same or
similar polymer. It is found experimentally that b0 and
b1 depend on the column and the solvent.
Another approach to SEC calibration is based on the
hydrodynamic volume Rh of the polymer molecule, a
quantity that is of particular relevance since it can be
taken to determine Ve. Theory shows that Rh is
proportional to the cube root of M[h] where [h] is the
intrinsic viscosity (recommended IUPAC name: limit-
ing viscosity number) of a polymer in solution. It turns
out that Eq. (A1) can be recast in a form including the
intrinsic viscosity of the sample
log M ZQ0 CQ1VeKlogð½h�Þ (A2)
where Q0, Q1 are ‘universal’ constants. It is observed
experimentally that Q0 and Q1 vary when the columnist
changed, but remain unchanged from one polymer type
to another. The intrinsic viscosity is related to M by the
Mark–Houwink–Sakurada (MHS) equation
½h�ZKMa (A3)
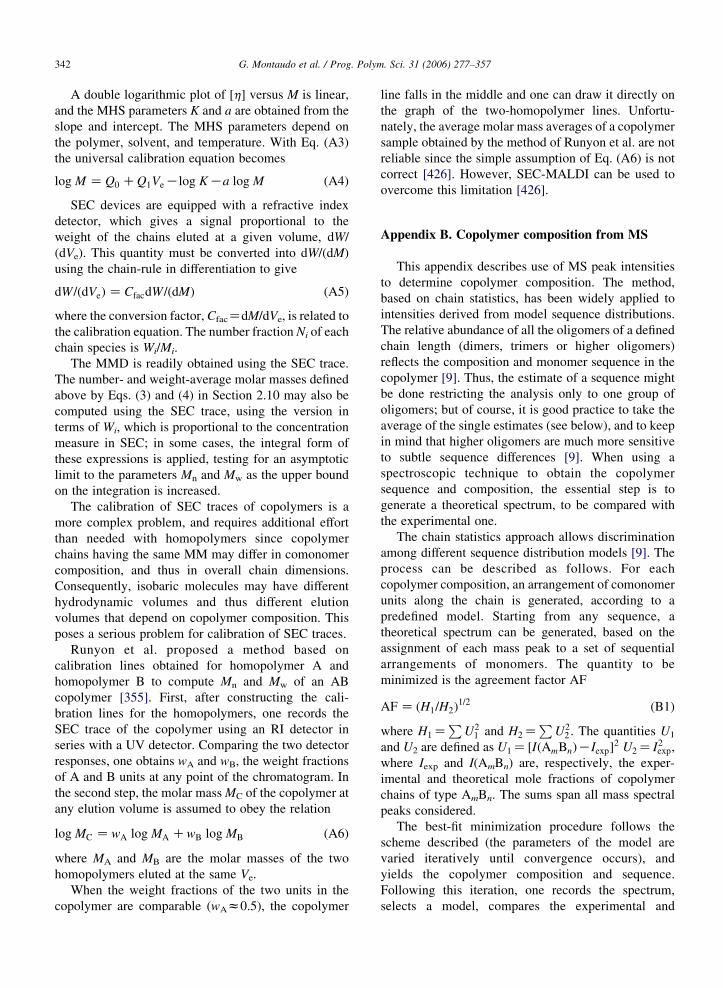
G. Montaudo et al. / Prog. Polym. Sci. 31 (2006) 277–357342
A double logarithmic plot of [h] versus M is linear,
and the MHS parameters K and a are obtained from the
slope and intercept. The MHS parameters depend on
the polymer, solvent, and temperature. With Eq. (A3)
the universal calibration equation becomes
log M ZQ0 CQ1VeKlog KKa log M (A4)
SEC devices are equipped with a refractive index
detector, which gives a signal proportional to the
weight of the chains eluted at a given volume, dW/
(dVe). This quantity must be converted into dW/(dM)
using the chain-rule in differentiation to give
dW=ðdVeÞZCfacdW=ðdMÞ (A5)
where the conversion factor, CfacZdM/dVe, is related to
the calibration equation. The number fraction Ni of each
chain species is Wi/Mi.
The MMD is readily obtained using the SEC trace.
The number- and weight-average molar masses defined
above by Eqs. (3) and (4) in Section 2.10 may also be
computed using the SEC trace, using the version in
terms of Wi, which is proportional to the concentration
measure in SEC; in some cases, the integral form of
these expressions is applied, testing for an asymptotic
limit to the parameters Mn and Mw as the upper bound
on the integration is increased.
The calibration of SEC traces of copolymers is a
more complex problem, and requires additional effort
than needed with homopolymers since copolymer
chains having the same MM may differ in comonomer
composition, and thus in overall chain dimensions.
Consequently, isobaric molecules may have different
hydrodynamic volumes and thus different elution
volumes that depend on copolymer composition. This
poses a serious problem for calibration of SEC traces.
Runyon et al. proposed a method based on
calibration lines obtained for homopolymer A and
homopolymer B to compute Mn and Mw of an AB
copolymer [355]. First, after constructing the cali-
bration lines for the homopolymers, one records the
SEC trace of the copolymer using an RI detector in
series with a UV detector. Comparing the two detector
responses, one obtains wA and wB, the weight fractions
of A and B units at any point of the chromatogram. In
the second step, the molar mass MC of the copolymer at
any elution volume is assumed to obey the relation
log MC ZwA log MA CwB log MB (A6)
where MA and MB are the molar masses of the two
homopolymers eluted at the same Ve.
When the weight fractions of the two units in the
copolymer are comparable (wAz0.5), the copolymer
line falls in the middle and one can draw it directly on
the graph of the two-homopolymer lines. Unfortu-
nately, the average molar mass averages of a copolymer
sample obtained by the method of Runyon et al. are not
reliable since the simple assumption of Eq. (A6) is not
correct [426]. However, SEC-MALDI can be used to
overcome this limitation [426].
Appendix B. Copolymer composition from MS
This appendix describes use of MS peak intensities
to determine copolymer composition. The method,
based on chain statistics, has been widely applied to
intensities derived from model sequence distributions.
The relative abundance of all the oligomers of a defined
chain length (dimers, trimers or higher oligomers)
reflects the composition and monomer sequence in the
copolymer [9]. Thus, the estimate of a sequence might
be done restricting the analysis only to one group of
oligomers; but of course, it is good practice to take the
average of the single estimates (see below), and to keep
in mind that higher oligomers are much more sensitive
to subtle sequence differences [9]. When using a
spectroscopic technique to obtain the copolymer
sequence and composition, the essential step is to
generate a theoretical spectrum, to be compared with
the experimental one.
The chain statistics approach allows discrimination
among different sequence distribution models [9]. The
process can be described as follows. For each
copolymer composition, an arrangement of comonomer
units along the chain is generated, according to a
predefined model. Starting from any sequence, a
theoretical spectrum can be generated, based on the
assignment of each mass peak to a set of sequential
arrangements of monomers. The quantity to be
minimized is the agreement factor AF
AFZ ðH1=H2Þ1=2 (B1)
where H1ZP
U21 and H2Z
PU2
2 . The quantities U1
and U2 are defined as U1Z ½IðAmBnÞKIexp�2 U2Z I2exp,
where Iexp and I(AmBn) are, respectively, the exper-
imental and theoretical mole fractions of copolymer
chains of type AmBn. The sums span all mass spectral
peaks considered.
The best-fit minimization procedure follows the
scheme described (the parameters of the model are
varied iteratively until convergence occurs), and
yields the copolymer composition and sequence.
Following this iteration, one records the spectrum,
selects a model, compares the experimental and
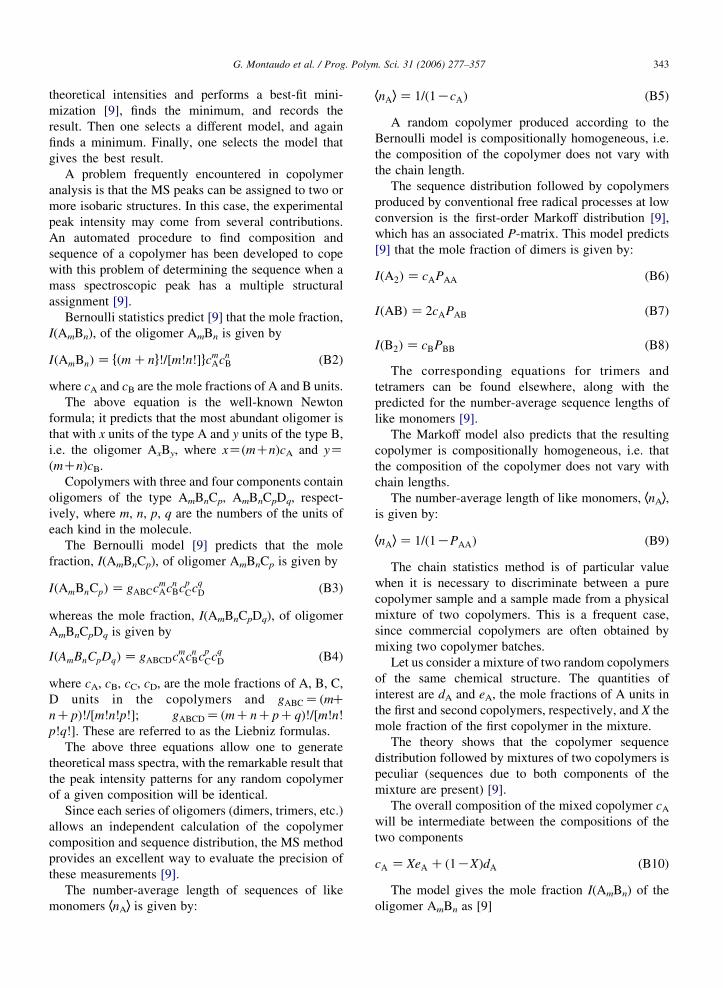
G. Montaudo et al. / Prog. Polym. Sci. 31 (2006) 277–357 343
theoretical intensities and performs a best-fit mini-
mization [9], finds the minimum, and records the
result. Then one selects a different model, and again
finds a minimum. Finally, one selects the model that
gives the best result.
A problem frequently encountered in copolymer
analysis is that the MS peaks can be assigned to two or
more isobaric structures. In this case, the experimental
peak intensity may come from several contributions.
An automated procedure to find composition and
sequence of a copolymer has been developed to cope
with this problem of determining the sequence when a
mass spectroscopic peak has a multiple structural
assignment [9].
Bernoulli statistics predict [9] that the mole fraction,
I(AmBn), of the oligomer AmBn is given by
IðAmBnÞZ fðmCng!=½m!n!�gcmAcn
B (B2)
where cA and cB are the mole fractions of A and B units.
The above equation is the well-known Newton
formula; it predicts that the most abundant oligomer is
that with x units of the type A and y units of the type B,
i.e. the oligomer AxBy, where xZ(mCn)cA and yZ(mCn)cB.
Copolymers with three and four components contain
oligomers of the type AmBnCp, AmBnCpDq, respect-
ively, where m, n, p, q are the numbers of the units of
each kind in the molecule.
The Bernoulli model [9] predicts that the mole
fraction, I(AmBnCp), of oligomer AmBnCp is given by
IðAmBnCpÞZ gABCcmAcn
BcpCc
qD (B3)
whereas the mole fraction, I(AmBnCpDq), of oligomer
AmBnCpDq is given by
IðAmBnCpDqÞZ gABCDcmAcn
BcpCc
qD (B4)
where cA, cB, cC, cD, are the mole fractions of A, B, C,
D units in the copolymers and gABCZ ðmCnCpÞ!=½m!n!p!�; gABCDZ ðmCnCpCqÞ!=½m!n!p!q!�. These are referred to as the Liebniz formulas.
The above three equations allow one to generate
theoretical mass spectra, with the remarkable result that
the peak intensity patterns for any random copolymer
of a given composition will be identical.
Since each series of oligomers (dimers, trimers, etc.)
allows an independent calculation of the copolymer
composition and sequence distribution, the MS method
provides an excellent way to evaluate the precision of
these measurements [9].
The number-average length of sequences of like
monomers hnAi is given by:
hnAiZ 1=ð1KcAÞ (B5)
A random copolymer produced according to the
Bernoulli model is compositionally homogeneous, i.e.
the composition of the copolymer does not vary with
the chain length.
The sequence distribution followed by copolymers
produced by conventional free radical processes at low
conversion is the first-order Markoff distribution [9],
which has an associated P-matrix. This model predicts
[9] that the mole fraction of dimers is given by:
IðA2ÞZ cAPAA (B6)
IðABÞZ 2cAPAB (B7)
IðB2ÞZ cBPBB (B8)
The corresponding equations for trimers and
tetramers can be found elsewhere, along with the
predicted for the number-average sequence lengths of
like monomers [9].
The Markoff model also predicts that the resulting
copolymer is compositionally homogeneous, i.e. that
the composition of the copolymer does not vary with
chain lengths.
The number-average length of like monomers, hnAi,
is given by:
hnAiZ 1=ð1KPAAÞ (B9)
The chain statistics method is of particular value
when it is necessary to discriminate between a pure
copolymer sample and a sample made from a physical
mixture of two copolymers. This is a frequent case,
since commercial copolymers are often obtained by
mixing two copolymer batches.
Let us consider a mixture of two random copolymers
of the same chemical structure. The quantities of
interest are dA and eA, the mole fractions of A units in
the first and second copolymers, respectively, and X the
mole fraction of the first copolymer in the mixture.
The theory shows that the copolymer sequence
distribution followed by mixtures of two copolymers is
peculiar (sequences due to both components of the
mixture are present) [9].
The overall composition of the mixed copolymer cAwill be intermediate between the compositions of the
two components
cA ZXeA C ð1KXÞdA (B10)
The model gives the mole fraction I(AmBn) of the
oligomer AmBn as [9]
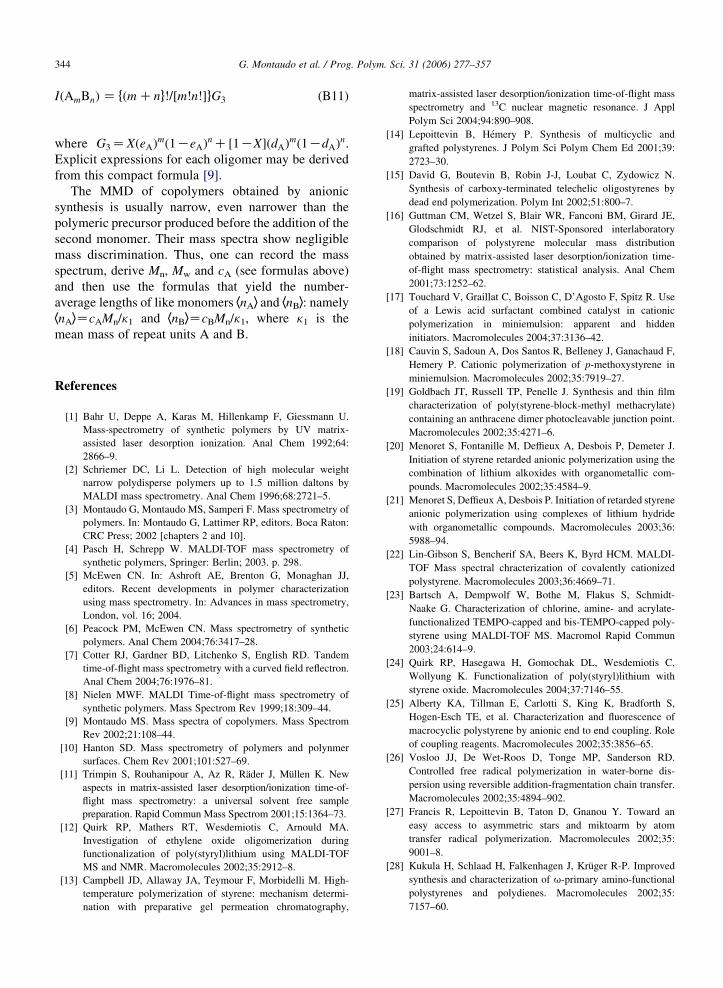
G. Montaudo et al. / Prog. Polym. Sci. 31 (2006) 277–357344
IðAmBnÞZ fðmCng!=½m!n!�gG3 (B11)
where G3ZXðeAÞmð1KeAÞ
nC ½1KX�ðdAÞmð1KdAÞ
n.
Explicit expressions for each oligomer may be derived
from this compact formula [9].
The MMD of copolymers obtained by anionic
synthesis is usually narrow, even narrower than the
polymeric precursor produced before the addition of the
second monomer. Their mass spectra show negligible
mass discrimination. Thus, one can record the mass
spectrum, derive Mn, Mw and cA (see formulas above)
and then use the formulas that yield the number-
average lengths of like monomers hnAi and hnBi: namely
hnAiZcAMn/k1 and hnBiZcBMn/k1, where k1 is the
mean mass of repeat units A and B.
References
[1] Bahr U, Deppe A, Karas M, Hillenkamp F, Giessmann U.
Mass-spectrometry of synthetic polymers by UV matrix-
assisted laser desorption ionization. Anal Chem 1992;64:
2866–9.
[2] Schriemer DC, Li L. Detection of high molecular weight
narrow polydisperse polymers up to 1.5 million daltons by
MALDI mass spectrometry. Anal Chem 1996;68:2721–5.
[3] Montaudo G, Montaudo MS, Samperi F. Mass spectrometry of
polymers. In: Montaudo G, Lattimer RP, editors. Boca Raton:
CRC Press; 2002 [chapters 2 and 10].
[4] Pasch H, Schrepp W. MALDI-TOF mass spectrometry of
synthetic polymers, Springer: Berlin; 2003. p. 298.
[5] McEwen CN. In: Ashroft AE, Brenton G, Monaghan JJ,
editors. Recent developments in polymer characterization
using mass spectrometry. In: Advances in mass spectrometry,
London, vol. 16; 2004.
[6] Peacock PM, McEwen CN. Mass spectrometry of synthetic
polymers. Anal Chem 2004;76:3417–28.
[7] Cotter RJ, Gardner BD, Litchenko S, English RD. Tandem
time-of-flight mass spectrometry with a curved field reflectron.
Anal Chem 2004;76:1976–81.
[8] Nielen MWF. MALDI Time-of-flight mass spectrometry of
synthetic polymers. Mass Spectrom Rev 1999;18:309–44.
[9] Montaudo MS. Mass spectra of copolymers. Mass Spectrom
Rev 2002;21:108–44.
[10] Hanton SD. Mass spectrometry of polymers and polynmer
surfaces. Chem Rev 2001;101:527–69.
[11] Trimpin S, Rouhanipour A, Az R, Rader J, Mullen K. New
aspects in matrix-assisted laser desorption/ionization time-of-
flight mass spectrometry: a universal solvent free sample
preparation. Rapid Commun Mass Spectrom 2001;15:1364–73.
[12] Quirk RP, Mathers RT, Wesdemiotis C, Arnould MA.
Investigation of ethylene oxide oligomerization during
functionalization of poly(styryl)lithium using MALDI-TOF
MS and NMR. Macromolecules 2002;35:2912–8.
[13] Campbell JD, Allaway JA, Teymour F, Morbidelli M. High-
temperature polymerization of styrene: mechanism determi-
nation with preparative gel permeation chromatography,
matrix-assisted laser desorption/ionization time-of-flight mass
spectrometry and 13C nuclear magnetic resonance. J Appl
Polym Sci 2004;94:890–908.
[14] Lepoittevin B, Hemery P. Synthesis of multicyclic and
grafted polystyrenes. J Polym Sci Polym Chem Ed 2001;39:
2723–30.
[15] David G, Boutevin B, Robin J-J, Loubat C, Zydowicz N.
Synthesis of carboxy-terminated telechelic oligostyrenes by
dead end polymerization. Polym Int 2002;51:800–7.
[16] Guttman CM, Wetzel S, Blair WR, Fanconi BM, Girard JE,
Glodschmidt RJ, et al. NIST-Sponsored interlaboratory
comparison of polystyrene molecular mass distribution
obtained by matrix-assisted laser desorption/ionization time-
of-flight mass spectrometry: statistical analysis. Anal Chem
2001;73:1252–62.
[17] Touchard V, Graillat C, Boisson C, D’Agosto F, Spitz R. Use
of a Lewis acid surfactant combined catalyst in cationic
polymerization in miniemulsion: apparent and hidden
initiators. Macromolecules 2004;37:3136–42.
[18] Cauvin S, Sadoun A, Dos Santos R, Belleney J, Ganachaud F,
Hemery P. Cationic polymerization of p-methoxystyrene in
miniemulsion. Macromolecules 2002;35:7919–27.
[19] Goldbach JT, Russell TP, Penelle J. Synthesis and thin film
characterization of poly(styrene-block-methyl methacrylate)
containing an anthracene dimer photocleavable junction point.
Macromolecules 2002;35:4271–6.
[20] Menoret S, Fontanille M, Deffieux A, Desbois P, Demeter J.
Initiation of styrene retarded anionic polymerization using the
combination of lithium alkoxides with organometallic com-
pounds. Macromolecules 2002;35:4584–9.
[21] Menoret S, Deffieux A, Desbois P. Initiation of retarded styrene
anionic polymerization using complexes of lithium hydride
with organometallic compounds. Macromolecules 2003;36:
5988–94.
[22] Lin-Gibson S, Bencherif SA, Beers K, Byrd HCM. MALDI-
TOF Mass spectral chracterization of covalently cationized
polystyrene. Macromolecules 2003;36:4669–71.
[23] Bartsch A, Dempwolf W, Bothe M, Flakus S, Schmidt-
Naake G. Characterization of chlorine, amine- and acrylate-
functionalized TEMPO-capped and bis-TEMPO-capped poly-
styrene using MALDI-TOF MS. Macromol Rapid Commun
2003;24:614–9.
[24] Quirk RP, Hasegawa H, Gomochak DL, Wesdemiotis C,
Wollyung K. Functionalization of poly(styryl)lithium with
styrene oxide. Macromolecules 2004;37:7146–55.
[25] Alberty KA, Tillman E, Carlotti S, King K, Bradforth S,
Hogen-Esch TE, et al. Characterization and fluorescence of
macrocyclic polystyrene by anionic end to end coupling. Role
of coupling reagents. Macromolecules 2002;35:3856–65.
[26] Vosloo JJ, De Wet-Roos D, Tonge MP, Sanderson RD.
Controlled free radical polymerization in water-borne dis-
persion using reversible addition-fragmentation chain transfer.
Macromolecules 2002;35:4894–902.
[27] Francis R, Lepoittevin B, Taton D, Gnanou Y. Toward an
easy access to asymmetric stars and miktoarm by atom
transfer radical polymerization. Macromolecules 2002;35:
9001–8.
[28] Kukula H, Schlaad H, Falkenhagen J, Kruger R-P. Improved
synthesis and characterization of u-primary amino-functional
polystyrenes and polydienes. Macromolecules 2002;35:
7157–60.
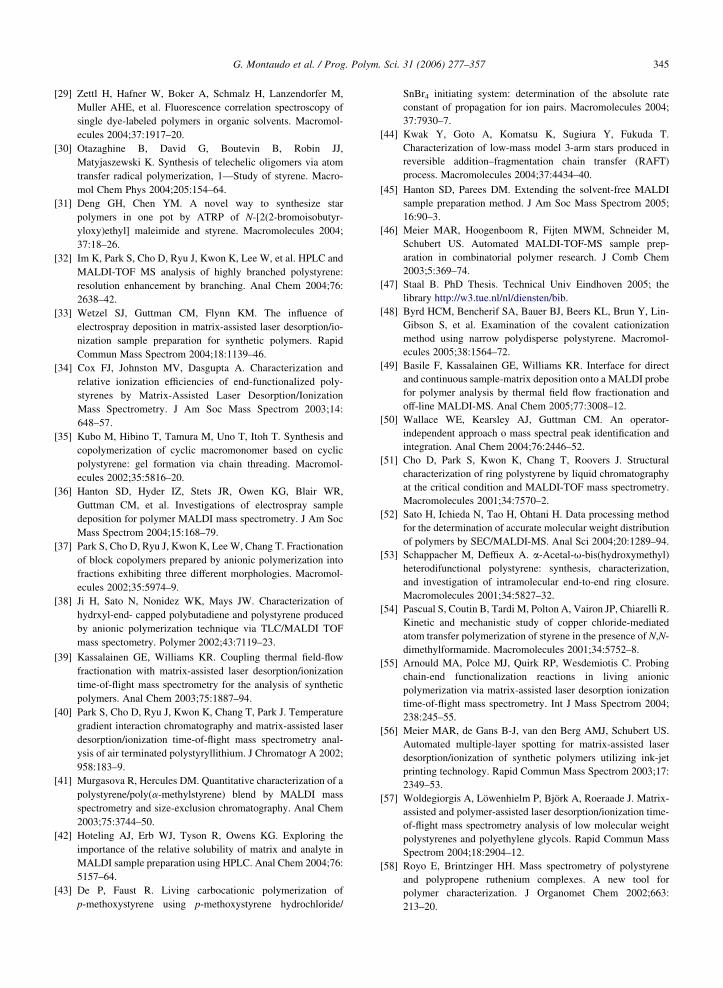
G. Montaudo et al. / Prog. Polym. Sci. 31 (2006) 277–357 345
[29] Zettl H, Hafner W, Boker A, Schmalz H, Lanzendorfer M,
Muller AHE, et al. Fluorescence correlation spectroscopy of
single dye-labeled polymers in organic solvents. Macromol-
ecules 2004;37:1917–20.
[30] Otazaghine B, David G, Boutevin B, Robin JJ,
Matyjaszewski K. Synthesis of telechelic oligomers via atom
transfer radical polymerization, 1—Study of styrene. Macro-
mol Chem Phys 2004;205:154–64.
[31] Deng GH, Chen YM. A novel way to synthesize star
polymers in one pot by ATRP of N-[2(2-bromoisobutyr-
yloxy)ethyl] maleimide and styrene. Macromolecules 2004;
37:18–26.
[32] Im K, Park S, Cho D, Ryu J, Kwon K, Lee W, et al. HPLC and
MALDI-TOF MS analysis of highly branched polystyrene:
resolution enhancement by branching. Anal Chem 2004;76:
2638–42.
[33] Wetzel SJ, Guttman CM, Flynn KM. The influence of
electrospray deposition in matrix-assisted laser desorption/io-
nization sample preparation for synthetic polymers. Rapid
Commun Mass Spectrom 2004;18:1139–46.
[34] Cox FJ, Johnston MV, Dasgupta A. Characterization and
relative ionization efficiencies of end-functionalized poly-
styrenes by Matrix-Assisted Laser Desorption/Ionization
Mass Spectrometry. J Am Soc Mass Spectrom 2003;14:
648–57.
[35] Kubo M, Hibino T, Tamura M, Uno T, Itoh T. Synthesis and
copolymerization of cyclic macromonomer based on cyclic
polystyrene: gel formation via chain threading. Macromol-
ecules 2002;35:5816–20.
[36] Hanton SD, Hyder IZ, Stets JR, Owen KG, Blair WR,
Guttman CM, et al. Investigations of electrospray sample
deposition for polymer MALDI mass spectrometry. J Am Soc
Mass Spectrom 2004;15:168–79.
[37] Park S, Cho D, Ryu J, Kwon K, Lee W, Chang T. Fractionation
of block copolymers prepared by anionic polymerization into
fractions exhibiting three different morphologies. Macromol-
ecules 2002;35:5974–9.
[38] Ji H, Sato N, Nonidez WK, Mays JW. Characterization of
hydrxyl-end- capped polybutadiene and polystyrene produced
by anionic polymerization technique via TLC/MALDI TOF
mass spectometry. Polymer 2002;43:7119–23.
[39] Kassalainen GE, Williams KR. Coupling thermal field-flow
fractionation with matrix-assisted laser desorption/ionization
time-of-flight mass spectrometry for the analysis of synthetic
polymers. Anal Chem 2003;75:1887–94.
[40] Park S, Cho D, Ryu J, Kwon K, Chang T, Park J. Temperature
gradient interaction chromatography and matrix-assisted laser
desorption/ionization time-of-flight mass spectrometry anal-
ysis of air terminated polystyryllithium. J Chromatogr A 2002;
958:183–9.
[41] Murgasova R, Hercules DM. Quantitative characterization of a
polystyrene/poly(a-methylstyrene) blend by MALDI mass
spectrometry and size-exclusion chromatography. Anal Chem
2003;75:3744–50.
[42] Hoteling AJ, Erb WJ, Tyson R, Owens KG. Exploring the
importance of the relative solubility of matrix and analyte in
MALDI sample preparation using HPLC. Anal Chem 2004;76:
5157–64.
[43] De P, Faust R. Living carbocationic polymerization of
p-methoxystyrene using p-methoxystyrene hydrochloride/
SnBr4 initiating system: determination of the absolute rate
constant of propagation for ion pairs. Macromolecules 2004;
37:7930–7.
[44] Kwak Y, Goto A, Komatsu K, Sugiura Y, Fukuda T.
Characterization of low-mass model 3-arm stars produced in
reversible addition–fragmentation chain transfer (RAFT)
process. Macromolecules 2004;37:4434–40.
[45] Hanton SD, Parees DM. Extending the solvent-free MALDI
sample preparation method. J Am Soc Mass Spectrom 2005;
16:90–3.
[46] Meier MAR, Hoogenboom R, Fijten MWM, Schneider M,
Schubert US. Automated MALDI-TOF-MS sample prep-
aration in combinatorial polymer research. J Comb Chem
2003;5:369–74.
[47] Staal B. PhD Thesis. Technical Univ Eindhoven 2005; the
library http://w3.tue.nl/nl/diensten/bib.
[48] Byrd HCM, Bencherif SA, Bauer BJ, Beers KL, Brun Y, Lin-
Gibson S, et al. Examination of the covalent cationization
method using narrow polydisperse polystyrene. Macromol-
ecules 2005;38:1564–72.
[49] Basile F, Kassalainen GE, Williams KR. Interface for direct
and continuous sample-matrix deposition onto a MALDI probe
for polymer analysis by thermal field flow fractionation and
off-line MALDI-MS. Anal Chem 2005;77:3008–12.
[50] Wallace WE, Kearsley AJ, Guttman CM. An operator-
independent approach o mass spectral peak identification and
integration. Anal Chem 2004;76:2446–52.
[51] Cho D, Park S, Kwon K, Chang T, Roovers J. Structural
characterization of ring polystyrene by liquid chromatography
at the critical condition and MALDI-TOF mass spectrometry.
Macromolecules 2001;34:7570–2.
[52] Sato H, Ichieda N, Tao H, Ohtani H. Data processing method
for the determination of accurate molecular weight distribution
of polymers by SEC/MALDI-MS. Anal Sci 2004;20:1289–94.
[53] Schappacher M, Deffieux A. a-Acetal-u-bis(hydroxymethyl)
heterodifunctional polystyrene: synthesis, characterization,
and investigation of intramolecular end-to-end ring closure.
Macromolecules 2001;34:5827–32.
[54] Pascual S, Coutin B, Tardi M, Polton A, Vairon JP, Chiarelli R.
Kinetic and mechanistic study of copper chloride-mediated
atom transfer polymerization of styrene in the presence of N,N-
dimethylformamide. Macromolecules 2001;34:5752–8.
[55] Arnould MA, Polce MJ, Quirk RP, Wesdemiotis C. Probing
chain-end functionalization reactions in living anionic
polymerization via matrix-assisted laser desorption ionization
time-of-flight mass spectrometry. Int J Mass Spectrom 2004;
238:245–55.
[56] Meier MAR, de Gans B-J, van den Berg AMJ, Schubert US.
Automated multiple-layer spotting for matrix-assisted laser
desorption/ionization of synthetic polymers utilizing ink-jet
printing technology. Rapid Commun Mass Spectrom 2003;17:
2349–53.
[57] Woldegiorgis A, Lowenhielm P, Bjork A, Roeraade J. Matrix-
assisted and polymer-assisted laser desorption/ionization time-
of-flight mass spectrometry analysis of low molecular weight
polystyrenes and polyethylene glycols. Rapid Commun Mass
Spectrom 2004;18:2904–12.
[58] Royo E, Brintzinger HH. Mass spectrometry of polystyrene
and polypropene ruthenium complexes. A new tool for
polymer characterization. J Organomet Chem 2002;663:
213–20.

G. Montaudo et al. / Prog. Polym. Sci. 31 (2006) 277–357346
[59] Shimada K, Lusenkova MA, Sato K, Saito T, Matsuyama S,
Nakahara H, et al. Evaluation of mass discrimination effects in
the quantitative analysis of polydisperse polymers by MALDI
TOF mass spectrometry using uniform oligostyrenes. Rapid
Commun Mass Spectrom 2001;15:277–82.
[60] Gibson HW, Ge ZX, Huang FH, Jones JW, Lefebvre H,
Vergne MJ, et al. Syntheses and model complexation studies of
well-defined crown terminated polymers. Macromolecules
2005;38:2626–37.
[61] Tatro SR, Baker GR, Fleming R, Harmon JP. Matrix-assisted
laser desorption/ionisation (MALDI) mass spectrometry:
determining Mark–Houwink–Sakurada parameters and analyz-
ing the breadth of polymer molecular weight distributions.
Polymer 2002;43:2329–35.
[62] Montaudo MS. MALDI for the estimation of viscosity
parameters. A modified method which applies also to
polycondensates. Polymer 2004;45:6291–8.
[63] Wetzel SJ, Guttman CM, Girard JE. The influence of matrix
and laser energy on the molecular mass distribution of
synthetic polymers obtained by MALDI-TOF-MS. Int J Mass
Spectrom 2004;238:215–25.
[64] Hirao A, Matsuo A. Synthesis of chain-end-functionalized
poly(methyl methacrylate)s with a definite number of benzyl
bromide moieties and their application to star-branched
polymers. Macromolecules 2003;36:9742–51.
[65] Willemse RXE, Staal BBP, van Herk AM, Pierik SCJ,
Klumperman B. Application of matrix-assisted laser deso-
rption ionization time-of-flight mass spectrometry in pulsed
laser polymerization. chain-length-dependent propagation rate
coefficients at high molecular weight: an artifact caused by
band broadening in size exclusion chromatography? Macro-
molecules 2003;36:9797–803.
[66] Nonaka H, Ouchi M, Kamigaito M, Sawamoto M. MALDI-
TOF-MS analysis of ruthenium (II)-mediated living polymer-
isations of methyl methacrylate, methyl acrylate, and styrene.
Macromolecules 2001;34:2083–8.
[67] Ihara E, Tanaka S, Inoue K. Anionic polymerization of methyl
methacrylate initiated with molybdenum and tungsten chlor-
ide/organolithium/triisobutylaluminum systems. Poly(3-ethyl-
3-hydroxymethyloxetane. J Polym Sci Part A Polym Chem
2002;40:4302–15.
[68] Rodriguez-Delgado A, Chen EYX. Mechanistic studies of
stereospecific polymerization of methacrylates using a cat-
ionic, chiral ansa-zirconocene ester enolate. Macromolecules
2005;38:2587–94.
[69] Tatro SR, Baker GR, Bisht K, Harmon JP. A MALDI, TGA,
TG/MS, and DEA study of he irradiation effects on PMMA.
Polymer 2003;44:167–76.
[70] Ihara E, Ikeda J, Itoh T, Inoue K. tBuOK/iBu(3)Al as new
initiating system for controlled anionic polymerization of tert-
butyl acrylate and methyl methacrylate. Macromolecules 2004;
37:4048–54.
[71] Norman J, Moratti SC, Slark AT, Irvine DJ, Jackson AT.
Synthesis of well-defined macromonomers by sequential
ATRP-catalytic chain transfer and copolymerization with
ehtyl acrylate. Macromolecules 2002;35:8954–61.
[72] Schilli C, Lanzendorfer MG, Muller AHE. Benzyl and
cumyl dithiocarbamates as chain transfer agents in RAFT
polymerization of N-isopropylacrylamide. In situ FT-NIR
and MALDI-TOF MS investigation. Macromolecules 2002;
35:6819–27.
[73] Farcet C, Belleney J, Charleux B, Pirri R. Structural
characterization of nitroxide-terminated poly(n-butyl acrylate)
prepared in bulk and miniemulsion polymerizations. Macro-
molecules 2002;35:4912–28.
[74] Otazaghine B, Boutevin B. Synthesis of Telechelic oligomers
via atom transfer radical polymerization, 3a study of butyl
a-fluoroacrylate. Macromol Chem Phys 2004;205:2002–11.
[75] Venkatesh R, Staal BBP, Klumperman B, Monteiro MJ.
Characterization of 3- and 4-arm stars from reactions of
poly(butyl acrylate) RAFT and ATRP precursors. Macromol-
ecules 2004;37:7906–17.
[76] Favier A, Ladaviere C, Charreyre T, Pichot C. MALDI-TOF
MS Investigations of the RAFT polymerization of a water-
soluble acylamide derivative. Macromolecules 2004;37:
2026–34.
[77] Loiseau J, Doerr N, Suau JM, Egraz JB, Llauro MF,
Ladaviere C, et al. Synthesis and characterization of
poly(acrylic acid) produced by RAFT polymerization. Appli-
cation as a very efficient dispersant of CaCO3, kaolin, and
TiO2. Macromolecules 2003;36:3066–77.
[78] Desponds A, Freitag R. Synthesis and characterization of
photoresponsive N-isoprppylacrylamide cotelomers. Langmuir
2003;19:6261–70.
[79] Ray B, Isobe Y, Matsumoto K, Habaue S, Okamoto Y,
Kamigaito M, et al. RAFT polymerization of N-isopropyla-
crylamide in the absence and presence of Y(OTf)3: simul-
taneous control of molecular weight and tacticity.
Macromolecules 2004;37:1702–10.
[80] Roberts GE, Heuts JPA, Davis TP. Direct observation of
cobalt–carbon bond formation in the catalytic chain transfer
polymerization of methyl acrylate using matrix-assisted laser
desorption ionization time-of-flight mass spectrometry. Macro-
molecules 2000;33:7765–8.
[81] loninger C, Rehahn M1. 1,1-dimethylsilacyclobutane-
mediated living anionic block copolymerization of [1]dimethyl
silaferrocenophane and methyl methacrylate. Macromolecules
2004;37:1720–7.
[82] Jiang X, Schoenmakers PJ, van Dongen JLJ, Lou X, Lima V,
Brokken-Zijp J. Mass spectrometric characterization of
functional poly(methyl methacrylate) in combination with
critical liquid chromatography. Anal Chem 2003;75:5517–24.
[83] Sadhu VB, Pionteck J, Voigt D, Komber H, Fischer D, Voigt B.
Atom-transfer polymerization: a strategy for the synthesis of
halogen-free amino-functionalized poly(methyl methacrylate)
in a one-pot reaction. Macromol Chem Phys 2004;205:
2356–65.
[84] Singha NK, Rimmer S, Klumperman B. Mass spectrometry of
poly(methyl methacrylate) (PMMA) prepared by atom transfer
radical polymerization (ATRP). Eur Polym J 2004;40:159–63.
[85] Cho D, Park S, Chang T, Ute K, Fukuda I, Kitayama T.
Temperature gradient interaction chromatography and
MALDI-TOF mass spectrometry analysis of stereoregular
poly(ethyl methacrylate)s. Anal Chem 2002;74:1928–31.
[86] Llauro MF, Loiseau J, Boisson F, Delolme F, Ladaviere C,
Claverie J. Unexpected end-groups of poly(acrylic acid)
prepared by RAFT polymerization. J Polym Sci Pol Chem
2004;42:5439–62.
[87] Laine O, Trimpin S, Raader HJ, Mullen K. Changes in post-
source decay fragmentation behavior of poly(methyl metha-
crylate) polymers with increasing molecular weight studies by
matrix-assisted laser desorption/ionization time-of-flight mass
spectrometry. Eur J Mass Spectrom 2003;9:195–201.
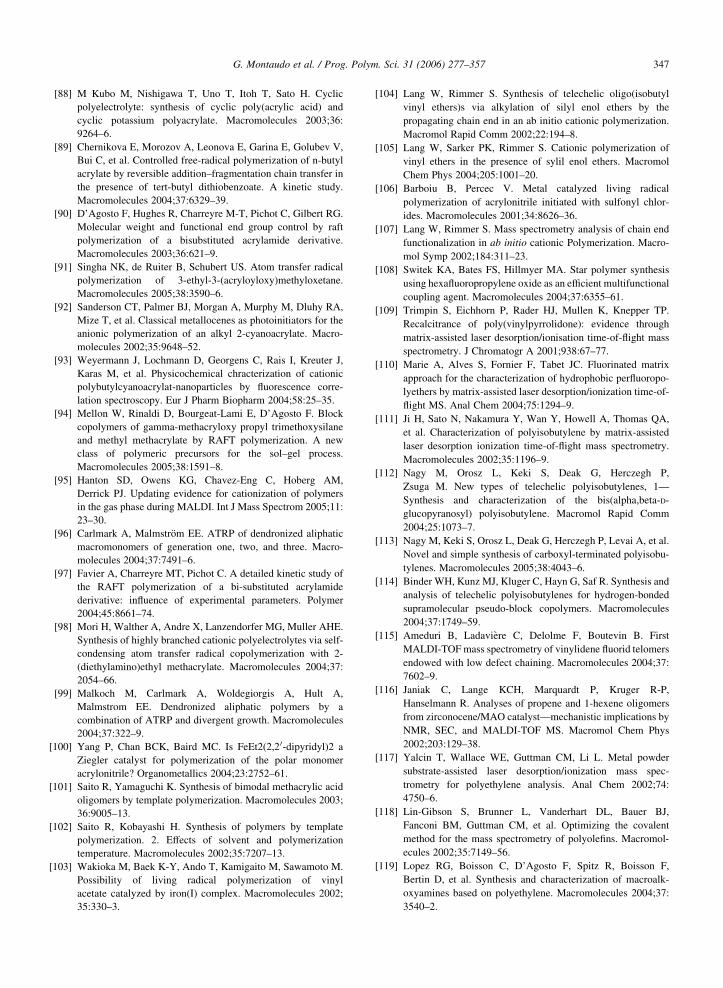
G. Montaudo et al. / Prog. Polym. Sci. 31 (2006) 277–357 347
[88] M Kubo M, Nishigawa T, Uno T, Itoh T, Sato H. Cyclic
polyelectrolyte: synthesis of cyclic poly(acrylic acid) and
cyclic potassium polyacrylate. Macromolecules 2003;36:
9264–6.
[89] Chernikova E, Morozov A, Leonova E, Garina E, Golubev V,
Bui C, et al. Controlled free-radical polymerization of n-butyl
acrylate by reversible addition–fragmentation chain transfer in
the presence of tert-butyl dithiobenzoate. A kinetic study.
Macromolecules 2004;37:6329–39.
[90] D’Agosto F, Hughes R, Charreyre M-T, Pichot C, Gilbert RG.
Molecular weight and functional end group control by raft
polymerization of a bisubstituted acrylamide derivative.
Macromolecules 2003;36:621–9.
[91] Singha NK, de Ruiter B, Schubert US. Atom transfer radical
polymerization of 3-ethyl-3-(acryloyloxy)methyloxetane.
Macromolecules 2005;38:3590–6.
[92] Sanderson CT, Palmer BJ, Morgan A, Murphy M, Dluhy RA,
Mize T, et al. Classical metallocenes as photoinitiators for the
anionic polymerization of an alkyl 2-cyanoacrylate. Macro-
molecules 2002;35:9648–52.
[93] Weyermann J, Lochmann D, Georgens C, Rais I, Kreuter J,
Karas M, et al. Physicochemical chracterization of cationic
polybutylcyanoacrylat-nanoparticles by fluorescence corre-
lation spectroscopy. Eur J Pharm Biopharm 2004;58:25–35.
[94] Mellon W, Rinaldi D, Bourgeat-Lami E, D’Agosto F. Block
copolymers of gamma-methacryloxy propyl trimethoxysilane
and methyl methacrylate by RAFT polymerization. A new
class of polymeric precursors for the sol–gel process.
Macromolecules 2005;38:1591–8.
[95] Hanton SD, Owens KG, Chavez-Eng C, Hoberg AM,
Derrick PJ. Updating evidence for cationization of polymers
in the gas phase during MALDI. Int J Mass Spectrom 2005;11:
23–30.
[96] Carlmark A, Malmstrom EE. ATRP of dendronized aliphatic
macromonomers of generation one, two, and three. Macro-
molecules 2004;37:7491–6.
[97] Favier A, Charreyre MT, Pichot C. A detailed kinetic study of
the RAFT polymerization of a bi-substituted acrylamide
derivative: influence of experimental parameters. Polymer
2004;45:8661–74.
[98] Mori H, Walther A, Andre X, Lanzendorfer MG, Muller AHE.
Synthesis of highly branched cationic polyelectrolytes via self-
condensing atom transfer radical copolymerization with 2-
(diethylamino)ethyl methacrylate. Macromolecules 2004;37:
2054–66.
[99] Malkoch M, Carlmark A, Woldegiorgis A, Hult A,
Malmstrom EE. Dendronized aliphatic polymers by a
combination of ATRP and divergent growth. Macromolecules
2004;37:322–9.
[100] Yang P, Chan BCK, Baird MC. Is FeEt2(2,2 0-dipyridyl)2 a
Ziegler catalyst for polymerization of the polar monomer
acrylonitrile? Organometallics 2004;23:2752–61.
[101] Saito R, Yamaguchi K. Synthesis of bimodal methacrylic acid
oligomers by template polymerization. Macromolecules 2003;
36:9005–13.
[102] Saito R, Kobayashi H. Synthesis of polymers by template
polymerization. 2. Effects of solvent and polymerization
temperature. Macromolecules 2002;35:7207–13.
[103] Wakioka M, Baek K-Y, Ando T, Kamigaito M, Sawamoto M.
Possibility of living radical polymerization of vinyl
acetate catalyzed by iron(I) complex. Macromolecules 2002;
35:330–3.
[104] Lang W, Rimmer S. Synthesis of telechelic oligo(isobutyl
vinyl ethers)s via alkylation of silyl enol ethers by the
propagating chain end in an ab initio cationic polymerization.
Macromol Rapid Comm 2002;22:194–8.
[105] Lang W, Sarker PK, Rimmer S. Cationic polymerization of
vinyl ethers in the presence of sylil enol ethers. Macromol
Chem Phys 2004;205:1001–20.
[106] Barboiu B, Percec V. Metal catalyzed living radical
polymerization of acrylonitrile initiated with sulfonyl chlor-
ides. Macromolecules 2001;34:8626–36.
[107] Lang W, Rimmer S. Mass spectrometry analysis of chain end
functionalization in ab initio cationic Polymerization. Macro-
mol Symp 2002;184:311–23.
[108] Switek KA, Bates FS, Hillmyer MA. Star polymer synthesis
using hexafluoropropylene oxide as an efficient multifunctional
coupling agent. Macromolecules 2004;37:6355–61.
[109] Trimpin S, Eichhorn P, Rader HJ, Mullen K, Knepper TP.
Recalcitrance of poly(vinylpyrrolidone): evidence through
matrix-assisted laser desorption/ionisation time-of-flight mass
spectrometry. J Chromatogr A 2001;938:67–77.
[110] Marie A, Alves S, Fornier F, Tabet JC. Fluorinated matrix
approach for the characterization of hydrophobic perfluoropo-
lyethers by matrix-assisted laser desorption/ionization time-of-
flight MS. Anal Chem 2004;75:1294–9.
[111] Ji H, Sato N, Nakamura Y, Wan Y, Howell A, Thomas QA,
et al. Characterization of polyisobutylene by matrix-assisted
laser desorption ionization time-of-flight mass spectrometry.
Macromolecules 2002;35:1196–9.
[112] Nagy M, Orosz L, Keki S, Deak G, Herczegh P,
Zsuga M. New types of telechelic polyisobutylenes, 1—
Synthesis and characterization of the bis(alpha,beta-D-
glucopyranosyl) polyisobutylene. Macromol Rapid Comm
2004;25:1073–7.
[113] Nagy M, Keki S, Orosz L, Deak G, Herczegh P, Levai A, et al.
Novel and simple synthesis of carboxyl-terminated polyisobu-
tylenes. Macromolecules 2005;38:4043–6.
[114] Binder WH, Kunz MJ, Kluger C, Hayn G, Saf R. Synthesis and
analysis of telechelic polyisobutylenes for hydrogen-bonded
supramolecular pseudo-block copolymers. Macromolecules
2004;37:1749–59.
[115] Ameduri B, Ladaviere C, Delolme F, Boutevin B. First
MALDI-TOFmass spectrometry of vinylidene fluorid telomers
endowed with low defect chaining. Macromolecules 2004;37:
7602–9.
[116] Janiak C, Lange KCH, Marquardt P, Kruger R-P,
Hanselmann R. Analyses of propene and 1-hexene oligomers
from zirconocene/MAO catalyst—mechanistic implications by
NMR, SEC, and MALDI-TOF MS. Macromol Chem Phys
2002;203:129–38.
[117] Yalcin T, Wallace WE, Guttman CM, Li L. Metal powder
substrate-assisted laser desorption/ionization mass spec-
trometry for polyethylene analysis. Anal Chem 2002;74:
4750–6.
[118] Lin-Gibson S, Brunner L, Vanderhart DL, Bauer BJ,
Fanconi BM, Guttman CM, et al. Optimizing the covalent
method for the mass spectrometry of polyolefins. Macromol-
ecules 2002;35:7149–56.
[119] Lopez RG, Boisson C, D’Agosto F, Spitz R, Boisson F,
Bertin D, et al. Synthesis and characterization of macroalk-
oxyamines based on polyethylene. Macromolecules 2004;37:
3540–2.
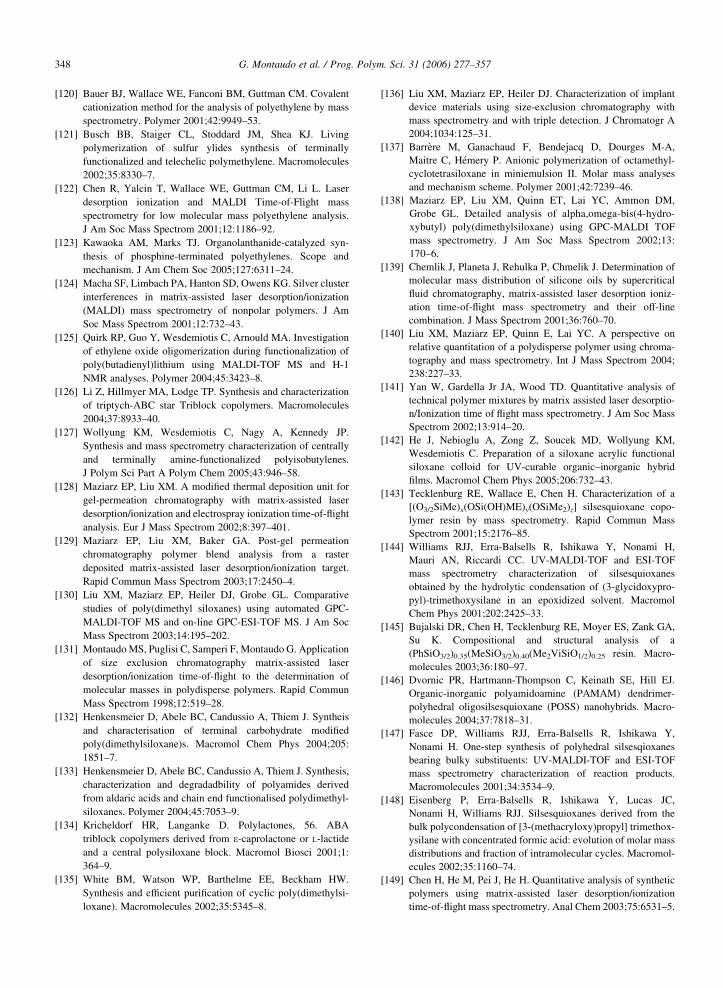
G. Montaudo et al. / Prog. Polym. Sci. 31 (2006) 277–357348
[120] Bauer BJ, Wallace WE, Fanconi BM, Guttman CM. Covalent
cationization method for the analysis of polyethylene by mass
spectrometry. Polymer 2001;42:9949–53.
[121] Busch BB, Staiger CL, Stoddard JM, Shea KJ. Living
polymerization of sulfur ylides synthesis of terminally
functionalized and telechelic polymethylene. Macromolecules
2002;35:8330–7.
[122] Chen R, Yalcin T, Wallace WE, Guttman CM, Li L. Laser
desorption ionization and MALDI Time-of-Flight mass
spectrometry for low molecular mass polyethylene analysis.
J Am Soc Mass Spectrom 2001;12:1186–92.
[123] Kawaoka AM, Marks TJ. Organolanthanide-catalyzed syn-
thesis of phosphine-terminated polyethylenes. Scope and
mechanism. J Am Chem Soc 2005;127:6311–24.
[124] Macha SF, Limbach PA, Hanton SD, Owens KG. Silver cluster
interferences in matrix-assisted laser desorption/ionization
(MALDI) mass spectrometry of nonpolar polymers. J Am
Soc Mass Spectrom 2001;12:732–43.
[125] Quirk RP, Guo Y, Wesdemiotis C, Arnould MA. Investigation
of ethylene oxide oligomerization during functionalization of
poly(butadienyl)lithium using MALDI-TOF MS and H-1
NMR analyses. Polymer 2004;45:3423–8.
[126] Li Z, Hillmyer MA, Lodge TP. Synthesis and characterization
of triptych-ABC star Triblock copolymers. Macromolecules
2004;37:8933–40.
[127] Wollyung KM, Wesdemiotis C, Nagy A, Kennedy JP.
Synthesis and mass spectrometry characterization of centrally
and terminally amine-functionalized polyisobutylenes.
J Polym Sci Part A Polym Chem 2005;43:946–58.
[128] Maziarz EP, Liu XM. A modified thermal deposition unit for
gel-permeation chromatography with matrix-assisted laser
desorption/ionization and electrospray ionization time-of-flight
analysis. Eur J Mass Spectrom 2002;8:397–401.
[129] Maziarz EP, Liu XM, Baker GA. Post-gel permeation
chromatography polymer blend analysis from a raster
deposited matrix-assisted laser desorption/ionization target.
Rapid Commun Mass Spectrom 2003;17:2450–4.
[130] Liu XM, Maziarz EP, Heiler DJ, Grobe GL. Comparative
studies of poly(dimethyl siloxanes) using automated GPC-
MALDI-TOF MS and on-line GPC-ESI-TOF MS. J Am Soc
Mass Spectrom 2003;14:195–202.
[131] MontaudoMS, Puglisi C, Samperi F, Montaudo G. Application
of size exclusion chromatography matrix-assisted laser
desorption/ionization time-of-flight to the determination of
molecular masses in polydisperse polymers. Rapid Commun
Mass Spectrom 1998;12:519–28.
[132] Henkensmeier D, Abele BC, Candussio A, Thiem J. Syntheis
and characterisation of terminal carbohydrate modified
poly(dimethylsiloxane)s. Macromol Chem Phys 2004;205:
1851–7.
[133] Henkensmeier D, Abele BC, Candussio A, Thiem J. Synthesis,
characterization and degradadbility of polyamides derived
from aldaric acids and chain end functionalised polydimethyl-
siloxanes. Polymer 2004;45:7053–9.
[134] Kricheldorf HR, Langanke D. Polylactones, 56. ABA
triblock copolymers derived from 3-caprolactone or L-lactide
and a central polysiloxane block. Macromol Biosci 2001;1:
364–9.
[135] White BM, Watson WP, Barthelme EE, Beckham HW.
Synthesis and efficient purification of cyclic poly(dimethylsi-
loxane). Macromolecules 2002;35:5345–8.
[136] Liu XM, Maziarz EP, Heiler DJ. Characterization of implant
device materials using size-exclusion chromatography with
mass spectrometry and with triple detection. J Chromatogr A
2004;1034:125–31.
[137] Barrere M, Ganachaud F, Bendejacq D, Dourges M-A,
Maitre C, Hemery P. Anionic polymerization of octamethyl-
cyclotetrasiloxane in miniemulsion II. Molar mass analyses
and mechanism scheme. Polymer 2001;42:7239–46.
[138] Maziarz EP, Liu XM, Quinn ET, Lai YC, Ammon DM,
Grobe GL. Detailed analysis of alpha,omega-bis(4-hydro-
xybutyl) poly(dimethylsiloxane) using GPC-MALDI TOF
mass spectrometry. J Am Soc Mass Spectrom 2002;13:
170–6.
[139] Chemlik J, Planeta J, Rehulka P, Chmelik J. Determination of
molecular mass distribution of silicone oils by supercritical
fluid chromatography, matrix-assisted laser desorption ioniz-
ation time-of-flight mass spectrometry and their off-line
combination. J Mass Spectrom 2001;36:760–70.
[140] Liu XM, Maziarz EP, Quinn E, Lai YC. A perspective on
relative quantitation of a polydisperse polymer using chroma-
tography and mass spectrometry. Int J Mass Spectrom 2004;
238:227–33.
[141] Yan W, Gardella Jr JA, Wood TD. Quantitative analysis of
technical polymer mixtures by matrix assisted laser desorptio-
n/Ionization time of flight mass spectrometry. J Am Soc Mass
Spectrom 2002;13:914–20.
[142] He J, Nebioglu A, Zong Z, Soucek MD, Wollyung KM,
Wesdemiotis C. Preparation of a siloxane acrylic functional
siloxane colloid for UV-curable organic–inorganic hybrid
films. Macromol Chem Phys 2005;206:732–43.
[143] Tecklenburg RE, Wallace E, Chen H. Characterization of a
[(O3/2SiMe)x(OSi(OH)ME)y(OSiMe2)z] silsesquioxane copo-
lymer resin by mass spectrometry. Rapid Commun Mass
Spectrom 2001;15:2176–85.
[144] Williams RJJ, Erra-Balsells R, Ishikawa Y, Nonami H,
Mauri AN, Riccardi CC. UV-MALDI-TOF and ESI-TOF
mass spectrometry characterization of silsesquioxanes
obtained by the hydrolytic condensation of (3-glycidoxypro-
pyl)-trimethoxysilane in an epoxidized solvent. Macromol
Chem Phys 2001;202:2425–33.
[145] Bujalski DR, Chen H, Tecklenburg RE, Moyer ES, Zank GA,
Su K. Compositional and structural analysis of a
(PhSiO3/2)0.35(MeSiO3/2)0.40(Me2ViSiO1/2)0.25 resin. Macro-
molecules 2003;36:180–97.
[146] Dvornic PR, Hartmann-Thompson C, Keinath SE, Hill EJ.
Organic-inorganic polyamidoamine (PAMAM) dendrimer-
polyhedral oligosilsesquioxane (POSS) nanohybrids. Macro-
molecules 2004;37:7818–31.
[147] Fasce DP, Williams RJJ, Erra-Balsells R, Ishikawa Y,
Nonami H. One-step synthesis of polyhedral silsesqioxanes
bearing bulky substituents: UV-MALDI-TOF and ESI-TOF
mass spectrometry characterization of reaction products.
Macromolecules 2001;34:3534–9.
[148] Eisenberg P, Erra-Balsells R, Ishikawa Y, Lucas JC,
Nonami H, Williams RJJ. Silsesquioxanes derived from the
bulk polycondensation of [3-(methacryloxy)propyl] trimethox-
ysilane with concentrated formic acid: evolution of molar mass
distributions and fraction of intramolecular cycles. Macromol-
ecules 2002;35:1160–74.
[149] Chen H, He M, Pei J, He H. Quantitative analysis of synthetic
polymers using matrix-assisted laser desorption/ionization
time-of-flight mass spectrometry. Anal Chem 2003;75:6531–5.
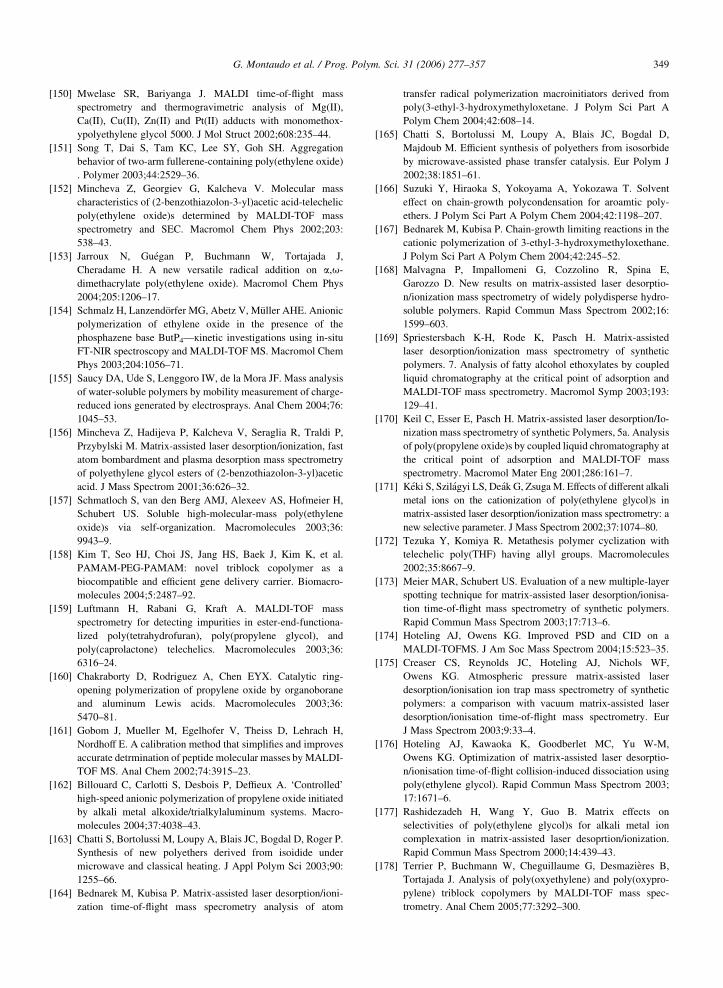
G. Montaudo et al. / Prog. Polym. Sci. 31 (2006) 277–357 349
[150] Mwelase SR, Bariyanga J. MALDI time-of-flight mass
spectrometry and thermogravimetric analysis of Mg(II),
Ca(II), Cu(II), Zn(II) and Pt(II) adducts with monomethox-
ypolyethylene glycol 5000. J Mol Struct 2002;608:235–44.
[151] Song T, Dai S, Tam KC, Lee SY, Goh SH. Aggregation
behavior of two-arm fullerene-containing poly(ethylene oxide)
. Polymer 2003;44:2529–36.
[152] Mincheva Z, Georgiev G, Kalcheva V. Molecular mass
characteristics of (2-benzothiazolon-3-yl)acetic acid-telechelic
poly(ethylene oxide)s determined by MALDI-TOF mass
spectrometry and SEC. Macromol Chem Phys 2002;203:
538–43.
[153] Jarroux N, Guegan P, Buchmann W, Tortajada J,
Cheradame H. A new versatile radical addition on a,u-
dimethacrylate poly(ethylene oxide). Macromol Chem Phys
2004;205:1206–17.
[154] Schmalz H, Lanzendorfer MG, Abetz V, Muller AHE. Anionic
polymerization of ethylene oxide in the presence of the
phosphazene base ButP4—Kinetic investigations using in-situ
FT-NIR spectroscopy and MALDI-TOF MS. Macromol Chem
Phys 2003;204:1056–71.
[155] Saucy DA, Ude S, Lenggoro IW, de la Mora JF. Mass analysis
of water-soluble polymers by mobility measurement of charge-
reduced ions generated by electrosprays. Anal Chem 2004;76:
1045–53.
[156] Mincheva Z, Hadijeva P, Kalcheva V, Seraglia R, Traldi P,
Przybylski M. Matrix-assisted laser desorption/ionization, fast
atom bombardment and plasma desorption mass spectrometry
of polyethylene glycol esters of (2-benzothiazolon-3-yl)acetic
acid. J Mass Spectrom 2001;36:626–32.
[157] Schmatloch S, van den Berg AMJ, Alexeev AS, Hofmeier H,
Schubert US. Soluble high-molecular-mass poly(ethylene
oxide)s via self-organization. Macromolecules 2003;36:
9943–9.
[158] Kim T, Seo HJ, Choi JS, Jang HS, Baek J, Kim K, et al.
PAMAM-PEG-PAMAM: novel triblock copolymer as a
biocompatible and efficient gene delivery carrier. Biomacro-
molecules 2004;5:2487–92.
[159] Luftmann H, Rabani G, Kraft A. MALDI-TOF mass
spectrometry for detecting impurities in ester-end-functiona-
lized poly(tetrahydrofuran), poly(propylene glycol), and
poly(caprolactone) telechelics. Macromolecules 2003;36:
6316–24.
[160] Chakraborty D, Rodriguez A, Chen EYX. Catalytic ring-
opening polymerization of propylene oxide by organoborane
and aluminum Lewis acids. Macromolecules 2003;36:
5470–81.
[161] Gobom J, Mueller M, Egelhofer V, Theiss D, Lehrach H,
Nordhoff E. A calibration method that simplifies and improves
accurate detrmination of peptide molecular masses byMALDI-
TOF MS. Anal Chem 2002;74:3915–23.
[162] Billouard C, Carlotti S, Desbois P, Deffieux A. ‘Controlled’
high-speed anionic polymerization of propylene oxide initiated
by alkali metal alkoxide/trialkylaluminum systems. Macro-
molecules 2004;37:4038–43.
[163] Chatti S, Bortolussi M, Loupy A, Blais JC, Bogdal D, Roger P.
Synthesis of new polyethers derived from isoidide under
microwave and classical heating. J Appl Polym Sci 2003;90:
1255–66.
[164] Bednarek M, Kubisa P. Matrix-assisted laser desorption/ioni-
zation time-of-flight mass specrometry analysis of atom
transfer radical polymerization macroinitiators derived from
poly(3-ethyl-3-hydroxymethyloxetane. J Polym Sci Part A
Polym Chem 2004;42:608–14.
[165] Chatti S, Bortolussi M, Loupy A, Blais JC, Bogdal D,
Majdoub M. Efficient synthesis of polyethers from isosorbide
by microwave-assisted phase transfer catalysis. Eur Polym J
2002;38:1851–61.
[166] Suzuki Y, Hiraoka S, Yokoyama A, Yokozawa T. Solvent
effect on chain-growth polycondensation for aroamtic poly-
ethers. J Polym Sci Part A Polym Chem 2004;42:1198–207.
[167] Bednarek M, Kubisa P. Chain-growth limiting reactions in the
cationic polymerization of 3-ethyl-3-hydroxymethyloxethane.
J Polym Sci Part A Polym Chem 2004;42:245–52.
[168] Malvagna P, Impallomeni G, Cozzolino R, Spina E,
Garozzo D. New results on matrix-assisted laser desorptio-
n/ionization mass spectrometry of widely polydisperse hydro-
soluble polymers. Rapid Commun Mass Spectrom 2002;16:
1599–603.
[169] Spriestersbach K-H, Rode K, Pasch H. Matrix-assisted
laser desorption/ionization mass spectrometry of synthetic
polymers. 7. Analysis of fatty alcohol ethoxylates by coupled
liquid chromatography at the critical point of adsorption and
MALDI-TOF mass spectrometry. Macromol Symp 2003;193:
129–41.
[170] Keil C, Esser E, Pasch H. Matrix-assisted laser desorption/Io-
nization mass spectrometry of synthetic Polymers, 5a. Analysis
of poly(propylene oxide)s by coupled liquid chromatography at
the critical point of adsorption and MALDI-TOF mass
spectrometry. Macromol Mater Eng 2001;286:161–7.
[171] Keki S, Szilagyi LS, Deak G, ZsugaM. Effects of different alkali
metal ions on the cationization of poly(ethylene glycol)s in
matrix-assisted laser desorption/ionization mass spectrometry: a
new selective parameter. J Mass Spectrom 2002;37:1074–80.
[172] Tezuka Y, Komiya R. Metathesis polymer cyclization with
telechelic poly(THF) having allyl groups. Macromolecules
2002;35:8667–9.
[173] Meier MAR, Schubert US. Evaluation of a new multiple-layer
spotting technique for matrix-assisted laser desorption/ionisa-
tion time-of-flight mass spectrometry of synthetic polymers.
Rapid Commun Mass Spectrom 2003;17:713–6.
[174] Hoteling AJ, Owens KG. Improved PSD and CID on a
MALDI-TOFMS. J Am Soc Mass Spectrom 2004;15:523–35.
[175] Creaser CS, Reynolds JC, Hoteling AJ, Nichols WF,
Owens KG. Atmospheric pressure matrix-assisted laser
desorption/ionisation ion trap mass spectrometry of synthetic
polymers: a comparison with vacuum matrix-assisted laser
desorption/ionisation time-of-flight mass spectrometry. Eur
J Mass Spectrom 2003;9:33–4.
[176] Hoteling AJ, Kawaoka K, Goodberlet MC, Yu W-M,
Owens KG. Optimization of matrix-assisted laser desorptio-
n/ionisation time-of-flight collision-induced dissociation using
poly(ethylene glycol). Rapid Commun Mass Spectrom 2003;
17:1671–6.
[177] Rashidezadeh H, Wang Y, Guo B. Matrix effects on
selectivities of poly(ethylene glycol)s for alkali metal ion
complexation in matrix-assisted laser desoprtion/ionization.
Rapid Commun Mass Spectrom 2000;14:439–43.
[178] Terrier P, Buchmann W, Cheguillaume G, Desmazieres B,
Tortajada J. Analysis of poly(oxyethylene) and poly(oxypro-
pylene) triblock copolymers by MALDI-TOF mass spec-
trometry. Anal Chem 2005;77:3292–300.
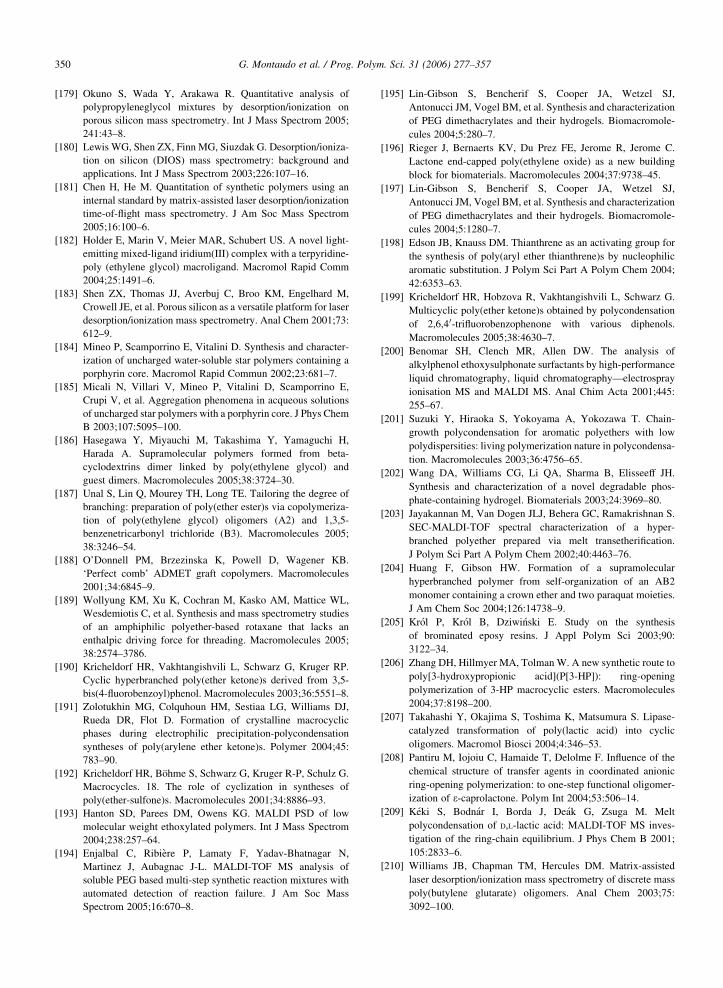
G. Montaudo et al. / Prog. Polym. Sci. 31 (2006) 277–357350
[179] Okuno S, Wada Y, Arakawa R. Quantitative analysis of
polypropyleneglycol mixtures by desorption/ionization on
porous silicon mass spectrometry. Int J Mass Spectrom 2005;
241:43–8.
[180] Lewis WG, Shen ZX, Finn MG, Siuzdak G. Desorption/ioniza-
tion on silicon (DIOS) mass spectrometry: background and
applications. Int J Mass Spectrom 2003;226:107–16.
[181] Chen H, He M. Quantitation of synthetic polymers using an
internal standard by matrix-assisted laser desorption/ionization
time-of-flight mass spectrometry. J Am Soc Mass Spectrom
2005;16:100–6.
[182] Holder E, Marin V, Meier MAR, Schubert US. A novel light-
emitting mixed-ligand iridium(III) complex with a terpyridine-
poly (ethylene glycol) macroligand. Macromol Rapid Comm
2004;25:1491–6.
[183] Shen ZX, Thomas JJ, Averbuj C, Broo KM, Engelhard M,
Crowell JE, et al. Porous silicon as a versatile platform for laser
desorption/ionization mass spectrometry. Anal Chem 2001;73:
612–9.
[184] Mineo P, Scamporrino E, Vitalini D. Synthesis and character-
ization of uncharged water-soluble star polymers containing a
porphyrin core. Macromol Rapid Commun 2002;23:681–7.
[185] Micali N, Villari V, Mineo P, Vitalini D, Scamporrino E,
Crupi V, et al. Aggregation phenomena in acqueous solutions
of uncharged star polymers with a porphyrin core. J Phys Chem
B 2003;107:5095–100.
[186] Hasegawa Y, Miyauchi M, Takashima Y, Yamaguchi H,
Harada A. Supramolecular polymers formed from beta-
cyclodextrins dimer linked by poly(ethylene glycol) and
guest dimers. Macromolecules 2005;38:3724–30.
[187] Unal S, Lin Q, Mourey TH, Long TE. Tailoring the degree of
branching: preparation of poly(ether ester)s via copolymeriza-
tion of poly(ethylene glycol) oligomers (A2) and 1,3,5-
benzenetricarbonyl trichloride (B3). Macromolecules 2005;
38:3246–54.
[188] O’Donnell PM, Brzezinska K, Powell D, Wagener KB.
‘Perfect comb’ ADMET graft copolymers. Macromolecules
2001;34:6845–9.
[189] Wollyung KM, Xu K, Cochran M, Kasko AM, Mattice WL,
Wesdemiotis C, et al. Synthesis and mass spectrometry studies
of an amphiphilic polyether-based rotaxane that lacks an
enthalpic driving force for threading. Macromolecules 2005;
38:2574–3786.
[190] Kricheldorf HR, Vakhtangishvili L, Schwarz G, Kruger RP.
Cyclic hyperbranched poly(ether ketone)s derived from 3,5-
bis(4-fluorobenzoyl)phenol. Macromolecules 2003;36:5551–8.
[191] Zolotukhin MG, Colquhoun HM, Sestiaa LG, Williams DJ,
Rueda DR, Flot D. Formation of crystalline macrocyclic
phases during electrophilic precipitation-polycondensation
syntheses of poly(arylene ether ketone)s. Polymer 2004;45:
783–90.
[192] Kricheldorf HR, Bohme S, Schwarz G, Kruger R-P, Schulz G.
Macrocycles. 18. The role of cyclization in syntheses of
poly(ether-sulfone)s. Macromolecules 2001;34:8886–93.
[193] Hanton SD, Parees DM, Owens KG. MALDI PSD of low
molecular weight ethoxylated polymers. Int J Mass Spectrom
2004;238:257–64.
[194] Enjalbal C, Ribiere P, Lamaty F, Yadav-Bhatnagar N,
Martinez J, Aubagnac J-L. MALDI-TOF MS analysis of
soluble PEG based multi-step synthetic reaction mixtures with
automated detection of reaction failure. J Am Soc Mass
Spectrom 2005;16:670–8.
[195] Lin-Gibson S, Bencherif S, Cooper JA, Wetzel SJ,
Antonucci JM, Vogel BM, et al. Synthesis and characterization
of PEG dimethacrylates and their hydrogels. Biomacromole-
cules 2004;5:280–7.
[196] Rieger J, Bernaerts KV, Du Prez FE, Jerome R, Jerome C.
Lactone end-capped poly(ethylene oxide) as a new building
block for biomaterials. Macromolecules 2004;37:9738–45.
[197] Lin-Gibson S, Bencherif S, Cooper JA, Wetzel SJ,
Antonucci JM, Vogel BM, et al. Synthesis and characterization
of PEG dimethacrylates and their hydrogels. Biomacromole-
cules 2004;5:1280–7.
[198] Edson JB, Knauss DM. Thianthrene as an activating group for
the synthesis of poly(aryl ether thianthrene)s by nucleophilic
aromatic substitution. J Polym Sci Part A Polym Chem 2004;
42:6353–63.
[199] Kricheldorf HR, Hobzova R, Vakhtangishvili L, Schwarz G.
Multicyclic poly(ether ketone)s obtained by polycondensation
of 2,6,40-trifluorobenzophenone with various diphenols.
Macromolecules 2005;38:4630–7.
[200] Benomar SH, Clench MR, Allen DW. The analysis of
alkylphenol ethoxysulphonate surfactants by high-performance
liquid chromatography, liquid chromatography—electrospray
ionisation MS and MALDI MS. Anal Chim Acta 2001;445:
255–67.
[201] Suzuki Y, Hiraoka S, Yokoyama A, Yokozawa T. Chain-
growth polycondensation for aromatic polyethers with low
polydispersities: living polymerization nature in polycondensa-
tion. Macromolecules 2003;36:4756–65.
[202] Wang DA, Williams CG, Li QA, Sharma B, Elisseeff JH.
Synthesis and characterization of a novel degradable phos-
phate-containing hydrogel. Biomaterials 2003;24:3969–80.
[203] Jayakannan M, Van Dogen JLJ, Behera GC, Ramakrishnan S.
SEC-MALDI-TOF spectral characterization of a hyper-
branched polyether prepared via melt transetherification.
J Polym Sci Part A Polym Chem 2002;40:4463–76.
[204] Huang F, Gibson HW. Formation of a supramolecular
hyperbranched polymer from self-organization of an AB2
monomer containing a crown ether and two paraquat moieties.
J Am Chem Soc 2004;126:14738–9.
[205] Krol P, Krol B, Dziwinski E. Study on the synthesis
of brominated eposy resins. J Appl Polym Sci 2003;90:
3122–34.
[206] Zhang DH, Hillmyer MA, Tolman W. A new synthetic route to
poly[3-hydroxypropionic acid](P[3-HP]): ring-opening
polymerization of 3-HP macrocyclic esters. Macromolecules
2004;37:8198–200.
[207] Takahashi Y, Okajima S, Toshima K, Matsumura S. Lipase-
catalyzed transformation of poly(lactic acid) into cyclic
oligomers. Macromol Biosci 2004;4:346–53.
[208] Pantiru M, Iojoiu C, Hamaide T, Delolme F. Influence of the
chemical structure of transfer agents in coordinated anionic
ring-opening polymerization: to one-step functional oligomer-
ization of 3-caprolactone. Polym Int 2004;53:506–14.
[209] Keki S, Bodnar I, Borda J, Deak G, Zsuga M. Melt
polycondensation of D,L-lactic acid: MALDI-TOF MS inves-
tigation of the ring-chain equilibrium. J Phys Chem B 2001;
105:2833–6.
[210] Williams JB, Chapman TM, Hercules DM. Matrix-assisted
laser desorption/ionization mass spectrometry of discrete mass
poly(butylene glutarate) oligomers. Anal Chem 2003;75:
3092–100.
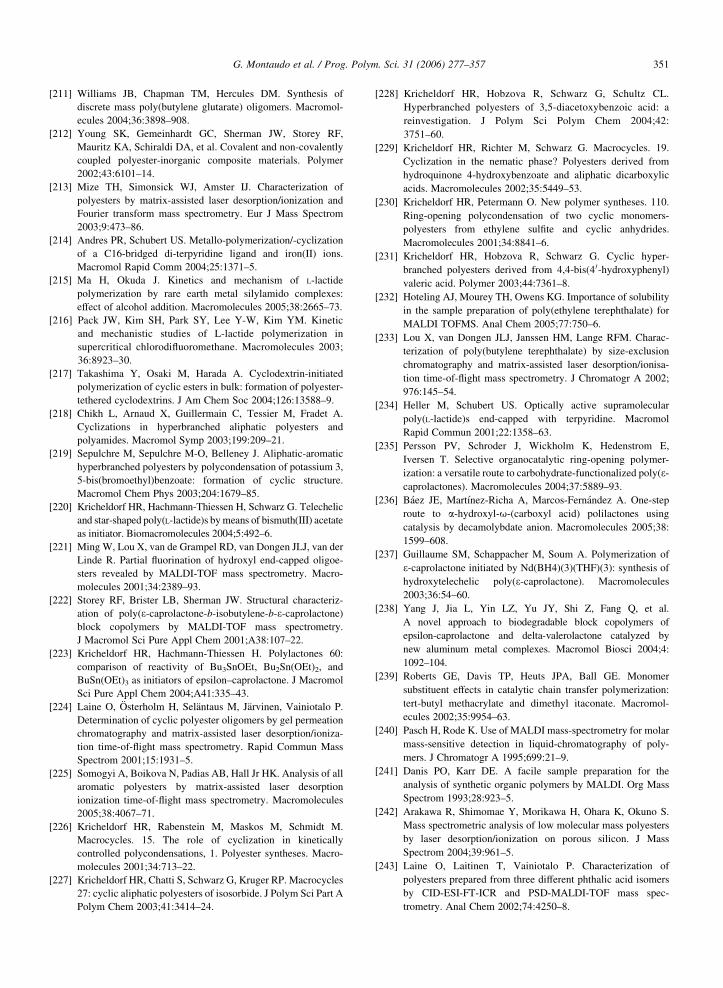
G. Montaudo et al. / Prog. Polym. Sci. 31 (2006) 277–357 351
[211] Williams JB, Chapman TM, Hercules DM. Synthesis of
discrete mass poly(butylene glutarate) oligomers. Macromol-
ecules 2004;36:3898–908.
[212] Young SK, Gemeinhardt GC, Sherman JW, Storey RF,
Mauritz KA, Schiraldi DA, et al. Covalent and non-covalently
coupled polyester-inorganic composite materials. Polymer
2002;43:6101–14.
[213] Mize TH, Simonsick WJ, Amster IJ. Characterization of
polyesters by matrix-assisted laser desorption/ionization and
Fourier transform mass spectrometry. Eur J Mass Spectrom
2003;9:473–86.
[214] Andres PR, Schubert US. Metallo-polymerization/-cyclization
of a C16-bridged di-terpyridine ligand and iron(II) ions.
Macromol Rapid Comm 2004;25:1371–5.
[215] Ma H, Okuda J. Kinetics and mechanism of L-lactide
polymerization by rare earth metal silylamido complexes:
effect of alcohol addition. Macromolecules 2005;38:2665–73.
[216] Pack JW, Kim SH, Park SY, Lee Y-W, Kim YM. Kinetic
and mechanistic studies of L-lactide polymerization in
supercritical chlorodifluoromethane. Macromolecules 2003;
36:8923–30.
[217] Takashima Y, Osaki M, Harada A. Cyclodextrin-initiated
polymerization of cyclic esters in bulk: formation of polyester-
tethered cyclodextrins. J Am Chem Soc 2004;126:13588–9.
[218] Chikh L, Arnaud X, Guillermain C, Tessier M, Fradet A.
Cyclizations in hyperbranched aliphatic polyesters and
polyamides. Macromol Symp 2003;199:209–21.
[219] Sepulchre M, Sepulchre M-O, Belleney J. Aliphatic-aromatic
hyperbranched polyesters by polycondensation of potassium 3,
5-bis(bromoethyl)benzoate: formation of cyclic structure.
Macromol Chem Phys 2003;204:1679–85.
[220] Kricheldorf HR, Hachmann-Thiessen H, Schwarz G. Telechelic
and star-shaped poly(L-lactide)s bymeans of bismuth(III) acetate
as initiator. Biomacromolecules 2004;5:492–6.
[221] Ming W, Lou X, van de Grampel RD, van Dongen JLJ, van der
Linde R. Partial fluorination of hydroxyl end-capped oligoe-
sters revealed by MALDI-TOF mass spectrometry. Macro-
molecules 2001;34:2389–93.
[222] Storey RF, Brister LB, Sherman JW. Structural characteriz-
ation of poly(3-caprolactone-b-isobutylene-b-3-caprolactone)
block copolymers by MALDI-TOF mass spectrometry.
J Macromol Sci Pure Appl Chem 2001;A38:107–22.
[223] Kricheldorf HR, Hachmann-Thiessen H. Polylactones 60:
comparison of reactivity of Bu3SnOEt, Bu2Sn(OEt)2, and
BuSn(OEt)3 as initiators of epsilon–caprolactone. J Macromol
Sci Pure Appl Chem 2004;A41:335–43.
[224] Laine O, Osterholm H, Selantaus M, Jarvinen, Vainiotalo P.
Determination of cyclic polyester oligomers by gel permeation
chromatography and matrix-assisted laser desorption/ioniza-
tion time-of-flight mass spectrometry. Rapid Commun Mass
Spectrom 2001;15:1931–5.
[225] Somogyi A, Boikova N, Padias AB, Hall Jr HK. Analysis of all
aromatic polyesters by matrix-assisted laser desorption
ionization time-of-flight mass spectrometry. Macromolecules
2005;38:4067–71.
[226] Kricheldorf HR, Rabenstein M, Maskos M, Schmidt M.
Macrocycles. 15. The role of cyclization in kinetically
controlled polycondensations, 1. Polyester syntheses. Macro-
molecules 2001;34:713–22.
[227] Kricheldorf HR, Chatti S, Schwarz G, Kruger RP. Macrocycles
27: cyclic aliphatic polyesters of isosorbide. J Polym Sci Part A
Polym Chem 2003;41:3414–24.
[228] Kricheldorf HR, Hobzova R, Schwarz G, Schultz CL.
Hyperbranched polyesters of 3,5-diacetoxybenzoic acid: a
reinvestigation. J Polym Sci Polym Chem 2004;42:
3751–60.
[229] Kricheldorf HR, Richter M, Schwarz G. Macrocycles. 19.
Cyclization in the nematic phase? Polyesters derived from
hydroquinone 4-hydroxybenzoate and aliphatic dicarboxylic
acids. Macromolecules 2002;35:5449–53.
[230] Kricheldorf HR, Petermann O. New polymer syntheses. 110.
Ring-opening polycondensation of two cyclic monomers-
polyesters from ethylene sulfite and cyclic anhydrides.
Macromolecules 2001;34:8841–6.
[231] Kricheldorf HR, Hobzova R, Schwarz G. Cyclic hyper-
branched polyesters derived from 4,4-bis(4 0-hydroxyphenyl)
valeric acid. Polymer 2003;44:7361–8.
[232] Hoteling AJ, Mourey TH, Owens KG. Importance of solubility
in the sample preparation of poly(ethylene terephthalate) for
MALDI TOFMS. Anal Chem 2005;77:750–6.
[233] Lou X, van Dongen JLJ, Janssen HM, Lange RFM. Charac-
terization of poly(butylene terephthalate) by size-exclusion
chromatography and matrix-assisted laser desorption/ionisa-
tion time-of-flight mass spectrometry. J Chromatogr A 2002;
976:145–54.
[234] Heller M, Schubert US. Optically active supramolecular
poly(L-lactide)s end-capped with terpyridine. Macromol
Rapid Commun 2001;22:1358–63.
[235] Persson PV, Schroder J, Wickholm K, Hedenstrom E,
Iversen T. Selective organocatalytic ring-opening polymer-
ization: a versatile route to carbohydrate-functionalized poly(3-
caprolactones). Macromolecules 2004;37:5889–93.
[236] Baez JE, Martınez-Richa A, Marcos-Fernandez A. One-step
route to a-hydroxyl-u-(carboxyl acid) polilactones using
catalysis by decamolybdate anion. Macromolecules 2005;38:
1599–608.
[237] Guillaume SM, Schappacher M, Soum A. Polymerization of
3-caprolactone initiated by Nd(BH4)(3)(THF)(3): synthesis of
hydroxytelechelic poly(3-caprolactone). Macromolecules
2003;36:54–60.
[238] Yang J, Jia L, Yin LZ, Yu JY, Shi Z, Fang Q, et al.
A novel approach to biodegradable block copolymers of
epsilon-caprolactone and delta-valerolactone catalyzed by
new aluminum metal complexes. Macromol Biosci 2004;4:
1092–104.
[239] Roberts GE, Davis TP, Heuts JPA, Ball GE. Monomer
substituent effects in catalytic chain transfer polymerization:
tert-butyl methacrylate and dimethyl itaconate. Macromol-
ecules 2002;35:9954–63.
[240] Pasch H, Rode K. Use of MALDI mass-spectrometry for molar
mass-sensitive detection in liquid-chromatography of poly-
mers. J Chromatogr A 1995;699:21–9.
[241] Danis PO, Karr DE. A facile sample preparation for the
analysis of synthetic organic polymers by MALDI. Org Mass
Spectrom 1993;28:923–5.
[242] Arakawa R, Shimomae Y, Morikawa H, Ohara K, Okuno S.
Mass spectrometric analysis of low molecular mass polyesters
by laser desorption/ionization on porous silicon. J Mass
Spectrom 2004;39:961–5.
[243] Laine O, Laitinen T, Vainiotalo P. Characterization of
polyesters prepared from three different phthalic acid isomers
by CID-ESI-FT-ICR and PSD-MALDI-TOF mass spec-
trometry. Anal Chem 2002;74:4250–8.
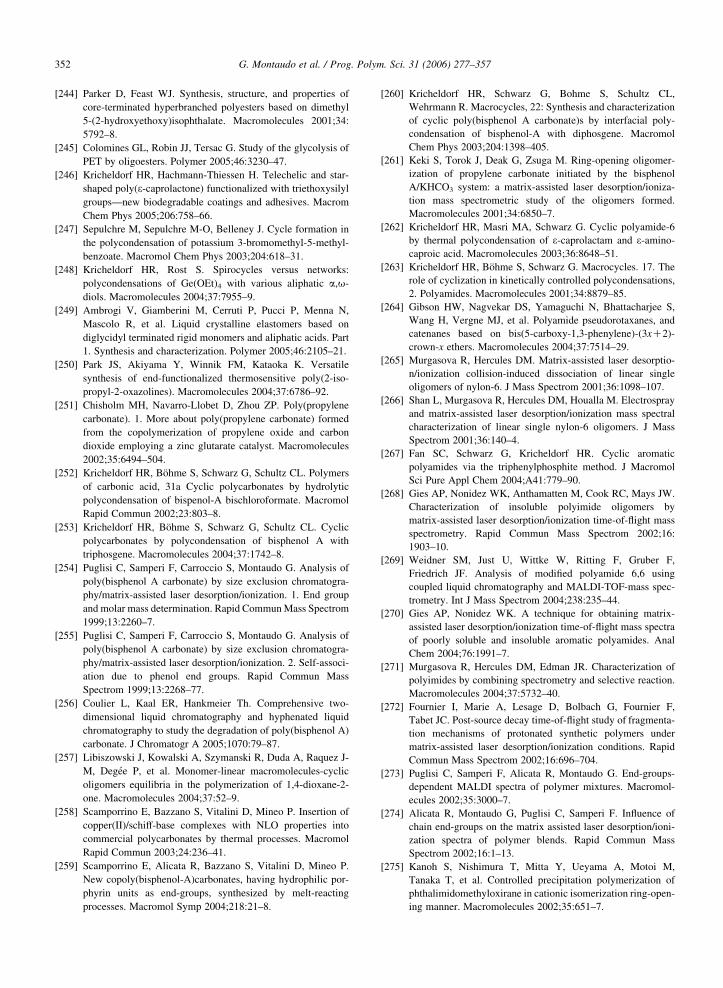
G. Montaudo et al. / Prog. Polym. Sci. 31 (2006) 277–357352
[244] Parker D, Feast WJ. Synthesis, structure, and properties of
core-terminated hyperbranched polyesters based on dimethyl
5-(2-hydroxyethoxy)isophthalate. Macromolecules 2001;34:
5792–8.
[245] Colomines GL, Robin JJ, Tersac G. Study of the glycolysis of
PET by oligoesters. Polymer 2005;46:3230–47.
[246] Kricheldorf HR, Hachmann-Thiessen H. Telechelic and star-
shaped poly(3-caprolactone) functionalized with triethoxysilyl
groups—new biodegradable coatings and adhesives. Macrom
Chem Phys 2005;206:758–66.
[247] Sepulchre M, Sepulchre M-O, Belleney J. Cycle formation in
the polycondensation of potassium 3-bromomethyl-5-methyl-
benzoate. Macromol Chem Phys 2003;204:618–31.
[248] Kricheldorf HR, Rost S. Spirocycles versus networks:
polycondensations of Ge(OEt)4 with various aliphatic a,u-
diols. Macromolecules 2004;37:7955–9.
[249] Ambrogi V, Giamberini M, Cerruti P, Pucci P, Menna N,
Mascolo R, et al. Liquid crystalline elastomers based on
diglycidyl terminated rigid monomers and aliphatic acids. Part
1. Synthesis and characterization. Polymer 2005;46:2105–21.
[250] Park JS, Akiyama Y, Winnik FM, Kataoka K. Versatile
synthesis of end-functionalized thermosensitive poly(2-iso-
propyl-2-oxazolines). Macromolecules 2004;37:6786–92.
[251] Chisholm MH, Navarro-Llobet D, Zhou ZP. Poly(propylene
carbonate). 1. More about poly(propylene carbonate) formed
from the copolymerization of propylene oxide and carbon
dioxide employing a zinc glutarate catalyst. Macromolecules
2002;35:6494–504.
[252] Kricheldorf HR, Bohme S, Schwarz G, Schultz CL. Polymers
of carbonic acid, 31a Cyclic polycarbonates by hydrolytic
polycondensation of bispenol-A bischloroformate. Macromol
Rapid Commun 2002;23:803–8.
[253] Kricheldorf HR, Bohme S, Schwarz G, Schultz CL. Cyclic
polycarbonates by polycondensation of bisphenol A with
triphosgene. Macromolecules 2004;37:1742–8.
[254] Puglisi C, Samperi F, Carroccio S, Montaudo G. Analysis of
poly(bisphenol A carbonate) by size exclusion chromatogra-
phy/matrix-assisted laser desorption/ionization. 1. End group
and molar mass determination. Rapid CommunMass Spectrom
1999;13:2260–7.
[255] Puglisi C, Samperi F, Carroccio S, Montaudo G. Analysis of
poly(bisphenol A carbonate) by size exclusion chromatogra-
phy/matrix-assisted laser desorption/ionization. 2. Self-associ-
ation due to phenol end groups. Rapid Commun Mass
Spectrom 1999;13:2268–77.
[256] Coulier L, Kaal ER, Hankmeier Th. Comprehensive two-
dimensional liquid chromatography and hyphenated liquid
chromatography to study the degradation of poly(bisphenol A)
carbonate. J Chromatogr A 2005;1070:79–87.
[257] Libiszowski J, Kowalski A, Szymanski R, Duda A, Raquez J-
M, Degee P, et al. Monomer-linear macromolecules-cyclic
oligomers equilibria in the polymerization of 1,4-dioxane-2-
one. Macromolecules 2004;37:52–9.
[258] Scamporrino E, Bazzano S, Vitalini D, Mineo P. Insertion of
copper(II)/schiff-base complexes with NLO properties into
commercial polycarbonates by thermal processes. Macromol
Rapid Commun 2003;24:236–41.
[259] Scamporrino E, Alicata R, Bazzano S, Vitalini D, Mineo P.
New copoly(bisphenol-A)carbonates, having hydrophilic por-
phyrin units as end-groups, synthesized by melt-reacting
processes. Macromol Symp 2004;218:21–8.
[260] Kricheldorf HR, Schwarz G, Bohme S, Schultz CL,
Wehrmann R. Macrocycles, 22: Synthesis and characterization
of cyclic poly(bisphenol A carbonate)s by interfacial poly-
condensation of bisphenol-A with diphosgene. Macromol
Chem Phys 2003;204:1398–405.
[261] Keki S, Torok J, Deak G, Zsuga M. Ring-opening oligomer-
ization of propylene carbonate initiated by the bisphenol
A/KHCO3 system: a matrix-assisted laser desorption/ioniza-
tion mass spectrometric study of the oligomers formed.
Macromolecules 2001;34:6850–7.
[262] Kricheldorf HR, Masri MA, Schwarz G. Cyclic polyamide-6
by thermal polycondensation of 3-caprolactam and 3-amino-
caproic acid. Macromolecules 2003;36:8648–51.
[263] Kricheldorf HR, Bohme S, Schwarz G. Macrocycles. 17. The
role of cyclization in kinetically controlled polycondensations,
2. Polyamides. Macromolecules 2001;34:8879–85.
[264] Gibson HW, Nagvekar DS, Yamaguchi N, Bhattacharjee S,
Wang H, Vergne MJ, et al. Polyamide pseudorotaxanes, and
catenanes based on bis(5-carboxy-1,3-phenylene)-(3xC2)-
crown-x ethers. Macromolecules 2004;37:7514–29.
[265] Murgasova R, Hercules DM. Matrix-assisted laser desorptio-
n/ionization collision-induced dissociation of linear single
oligomers of nylon-6. J Mass Spectrom 2001;36:1098–107.
[266] Shan L, Murgasova R, Hercules DM, Houalla M. Electrospray
and matrix-assisted laser desorption/ionization mass spectral
characterization of linear single nylon-6 oligomers. J Mass
Spectrom 2001;36:140–4.
[267] Fan SC, Schwarz G, Kricheldorf HR. Cyclic aromatic
polyamides via the triphenylphosphite method. J Macromol
Sci Pure Appl Chem 2004;A41:779–90.
[268] Gies AP, Nonidez WK, Anthamatten M, Cook RC, Mays JW.
Characterization of insoluble polyimide oligomers by
matrix-assisted laser desorption/ionization time-of-flight mass
spectrometry. Rapid Commun Mass Spectrom 2002;16:
1903–10.
[269] Weidner SM, Just U, Wittke W, Ritting F, Gruber F,
Friedrich JF. Analysis of modified polyamide 6,6 using
coupled liquid chromatography and MALDI-TOF-mass spec-
trometry. Int J Mass Spectrom 2004;238:235–44.
[270] Gies AP, Nonidez WK. A technique for obtaining matrix-
assisted laser desorption/ionization time-of-flight mass spectra
of poorly soluble and insoluble aromatic polyamides. Anal
Chem 2004;76:1991–7.
[271] Murgasova R, Hercules DM, Edman JR. Characterization of
polyimides by combining spectrometry and selective reaction.
Macromolecules 2004;37:5732–40.
[272] Fournier I, Marie A, Lesage D, Bolbach G, Fournier F,
Tabet JC. Post-source decay time-of-flight study of fragmenta-
tion mechanisms of protonated synthetic polymers under
matrix-assisted laser desorption/ionization conditions. Rapid
Commun Mass Spectrom 2002;16:696–704.
[273] Puglisi C, Samperi F, Alicata R, Montaudo G. End-groups-
dependent MALDI spectra of polymer mixtures. Macromol-
ecules 2002;35:3000–7.
[274] Alicata R, Montaudo G, Puglisi C, Samperi F. Influence of
chain end-groups on the matrix assisted laser desorption/ioni-
zation spectra of polymer blends. Rapid Commun Mass
Spectrom 2002;16:1–13.
[275] Kanoh S, Nishimura T, Mitta Y, Ueyama A, Motoi M,
Tanaka T, et al. Controlled precipitation polymerization of
phthalimidomethyloxirane in cationic isomerization ring-open-
ing manner. Macromolecules 2002;35:651–7.
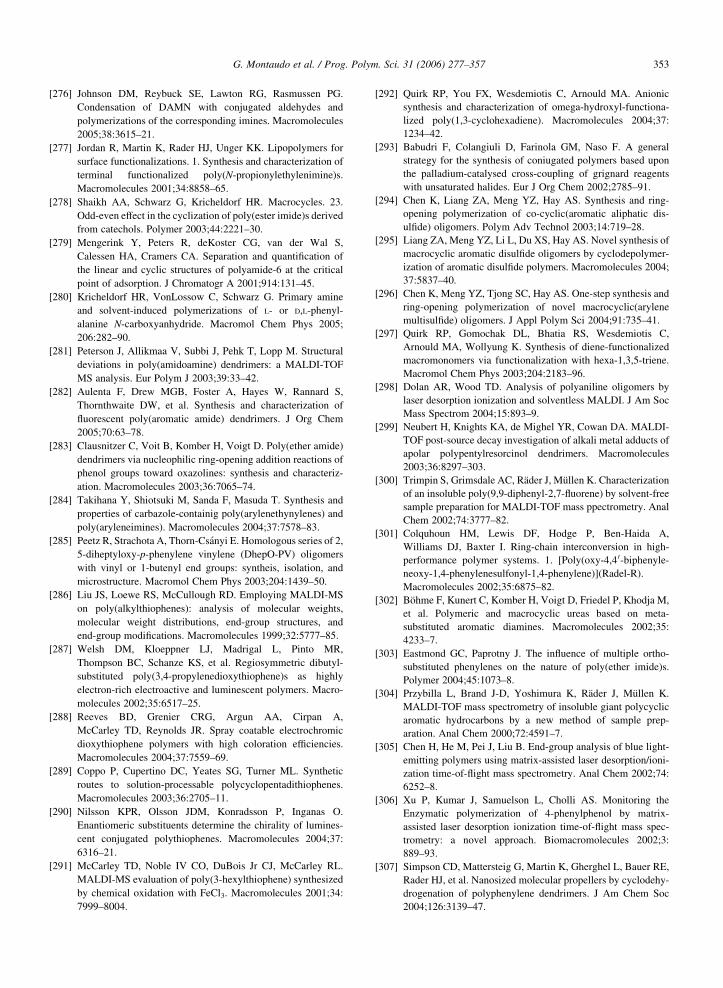
G. Montaudo et al. / Prog. Polym. Sci. 31 (2006) 277–357 353
[276] Johnson DM, Reybuck SE, Lawton RG, Rasmussen PG.
Condensation of DAMN with conjugated aldehydes and
polymerizations of the corresponding imines. Macromolecules
2005;38:3615–21.
[277] Jordan R, Martin K, Rader HJ, Unger KK. Lipopolymers for
surface functionalizations. 1. Synthesis and characterization of
terminal functionalized poly(N-propionylethylenimine)s.
Macromolecules 2001;34:8858–65.
[278] Shaikh AA, Schwarz G, Kricheldorf HR. Macrocycles. 23.
Odd-even effect in the cyclization of poly(ester imide)s derived
from catechols. Polymer 2003;44:2221–30.
[279] Mengerink Y, Peters R, deKoster CG, van der Wal S,
Calessen HA, Cramers CA. Separation and quantification of
the linear and cyclic structures of polyamide-6 at the critical
point of adsorption. J Chromatogr A 2001;914:131–45.
[280] Kricheldorf HR, VonLossow C, Schwarz G. Primary amine
and solvent-induced polymerizations of L- or D,L-phenyl-
alanine N-carboxyanhydride. Macromol Chem Phys 2005;
206:282–90.
[281] Peterson J, Allikmaa V, Subbi J, Pehk T, Lopp M. Structural
deviations in poly(amidoamine) dendrimers: a MALDI-TOF
MS analysis. Eur Polym J 2003;39:33–42.
[282] Aulenta F, Drew MGB, Foster A, Hayes W, Rannard S,
Thornthwaite DW, et al. Synthesis and characterization of
fluorescent poly(aromatic amide) dendrimers. J Org Chem
2005;70:63–78.
[283] Clausnitzer C, Voit B, Komber H, Voigt D. Poly(ether amide)
dendrimers via nucleophilic ring-opening addition reactions of
phenol groups toward oxazolines: synthesis and characteriz-
ation. Macromolecules 2003;36:7065–74.
[284] Takihana Y, Shiotsuki M, Sanda F, Masuda T. Synthesis and
properties of carbazole-containig poly(arylenethynylenes) and
poly(aryleneimines). Macromolecules 2004;37:7578–83.
[285] Peetz R, Strachota A, Thorn-Csanyi E. Homologous series of 2,
5-diheptyloxy-p-phenylene vinylene (DhepO-PV) oligomers
with vinyl or 1-butenyl end groups: syntheis, isolation, and
microstructure. Macromol Chem Phys 2003;204:1439–50.
[286] Liu JS, Loewe RS, McCullough RD. Employing MALDI-MS
on poly(alkylthiophenes): analysis of molecular weights,
molecular weight distributions, end-group structures, and
end-group modifications. Macromolecules 1999;32:5777–85.
[287] Welsh DM, Kloeppner LJ, Madrigal L, Pinto MR,
Thompson BC, Schanze KS, et al. Regiosymmetric dibutyl-
substituted poly(3,4-propylenedioxythiophene)s as highly
electron-rich electroactive and luminescent polymers. Macro-
molecules 2002;35:6517–25.
[288] Reeves BD, Grenier CRG, Argun AA, Cirpan A,
McCarley TD, Reynolds JR. Spray coatable electrochromic
dioxythiophene polymers with high coloration efficiencies.
Macromolecules 2004;37:7559–69.
[289] Coppo P, Cupertino DC, Yeates SG, Turner ML. Synthetic
routes to solution-processable polycyclopentadithiophenes.
Macromolecules 2003;36:2705–11.
[290] Nilsson KPR, Olsson JDM, Konradsson P, Inganas O.
Enantiomeric substituents determine the chirality of lumines-
cent conjugated polythiophenes. Macromolecules 2004;37:
6316–21.
[291] McCarley TD, Noble IV CO, DuBois Jr CJ, McCarley RL.
MALDI-MS evaluation of poly(3-hexylthiophene) synthesized
by chemical oxidation with FeCl3. Macromolecules 2001;34:
7999–8004.
[292] Quirk RP, You FX, Wesdemiotis C, Arnould MA. Anionic
synthesis and characterization of omega-hydroxyl-functiona-
lized poly(1,3-cyclohexadiene). Macromolecules 2004;37:
1234–42.
[293] Babudri F, Colangiuli D, Farinola GM, Naso F. A general
strategy for the synthesis of coniugated polymers based upon
the palladium-catalysed cross-coupling of grignard reagents
with unsaturated halides. Eur J Org Chem 2002;2785–91.
[294] Chen K, Liang ZA, Meng YZ, Hay AS. Synthesis and ring-
opening polymerization of co-cyclic(aromatic aliphatic dis-
ulfide) oligomers. Polym Adv Technol 2003;14:719–28.
[295] Liang ZA, Meng YZ, Li L, Du XS, Hay AS. Novel synthesis of
macrocyclic aromatic disulfide oligomers by cyclodepolymer-
ization of aromatic disulfide polymers. Macromolecules 2004;
37:5837–40.
[296] Chen K, Meng YZ, Tjong SC, Hay AS. One-step synthesis and
ring-opening polymerization of novel macrocyclic(arylene
multisulfide) oligomers. J Appl Polym Sci 2004;91:735–41.
[297] Quirk RP, Gomochak DL, Bhatia RS, Wesdemiotis C,
Arnould MA, Wollyung K. Synthesis of diene-functionalized
macromonomers via functionalization with hexa-1,3,5-triene.
Macromol Chem Phys 2003;204:2183–96.
[298] Dolan AR, Wood TD. Analysis of polyaniline oligomers by
laser desorption ionization and solventless MALDI. J Am Soc
Mass Spectrom 2004;15:893–9.
[299] Neubert H, Knights KA, de Mighel YR, Cowan DA. MALDI-
TOF post-source decay investigation of alkali metal adducts of
apolar polypentylresorcinol dendrimers. Macromolecules
2003;36:8297–303.
[300] Trimpin S, Grimsdale AC, Rader J, Mullen K. Characterization
of an insoluble poly(9,9-diphenyl-2,7-fluorene) by solvent-free
sample preparation for MALDI-TOF mass ppectrometry. Anal
Chem 2002;74:3777–82.
[301] Colquhoun HM, Lewis DF, Hodge P, Ben-Haida A,
Williams DJ, Baxter I. Ring-chain interconversion in high-
performance polymer systems. 1. [Poly(oxy-4,4 0-biphenyle-
neoxy-1,4-phenylenesulfonyl-1,4-phenylene)](Radel-R).
Macromolecules 2002;35:6875–82.
[302] Bohme F, Kunert C, Komber H, Voigt D, Friedel P, Khodja M,
et al. Polymeric and macrocyclic ureas based on meta-
substituted aromatic diamines. Macromolecules 2002;35:
4233–7.
[303] Eastmond GC, Paprotny J. The influence of multiple ortho-
substituted phenylenes on the nature of poly(ether imide)s.
Polymer 2004;45:1073–8.
[304] Przybilla L, Brand J-D, Yoshimura K, Rader J, Mullen K.
MALDI-TOF mass spectrometry of insoluble giant polycyclic
aromatic hydrocarbons by a new method of sample prep-
aration. Anal Chem 2000;72:4591–7.
[305] Chen H, He M, Pei J, Liu B. End-group analysis of blue light-
emitting polymers using matrix-assisted laser desorption/ioni-
zation time-of-flight mass spectrometry. Anal Chem 2002;74:
6252–8.
[306] Xu P, Kumar J, Samuelson L, Cholli AS. Monitoring the
Enzymatic polymerization of 4-phenylphenol by matrix-
assisted laser desorption ionization time-of-flight mass spec-
trometry: a novel approach. Biomacromolecules 2002;3:
889–93.
[307] Simpson CD, Mattersteig G, Martin K, Gherghel L, Bauer RE,
Rader HJ, et al. Nanosized molecular propellers by cyclodehy-
drogenation of polyphenylene dendrimers. J Am Chem Soc
2004;126:3139–47.
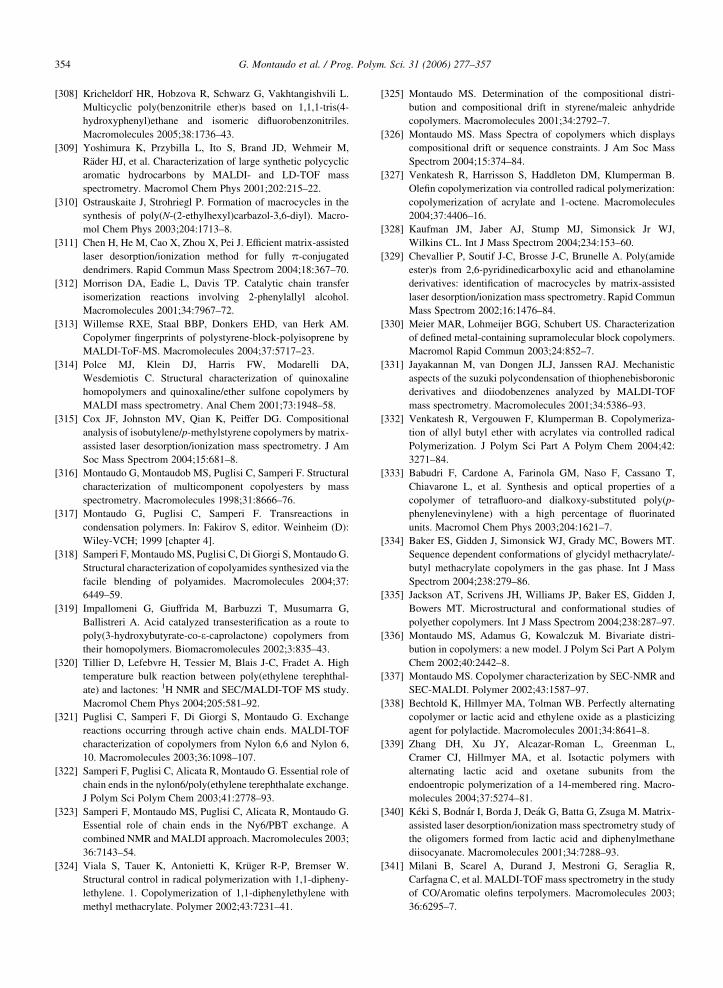
G. Montaudo et al. / Prog. Polym. Sci. 31 (2006) 277–357354
[308] Kricheldorf HR, Hobzova R, Schwarz G, Vakhtangishvili L.
Multicyclic poly(benzonitrile ether)s based on 1,1,1-tris(4-
hydroxyphenyl)ethane and isomeric difluorobenzonitriles.
Macromolecules 2005;38:1736–43.
[309] Yoshimura K, Przybilla L, Ito S, Brand JD, Wehmeir M,
Rader HJ, et al. Characterization of large synthetic polycyclic
aromatic hydrocarbons by MALDI- and LD-TOF mass
spectrometry. Macromol Chem Phys 2001;202:215–22.
[310] Ostrauskaite J, Strohriegl P. Formation of macrocycles in the
synthesis of poly(N-(2-ethylhexyl)carbazol-3,6-diyl). Macro-
mol Chem Phys 2003;204:1713–8.
[311] Chen H, He M, Cao X, Zhou X, Pei J. Efficient matrix-assisted
laser desorption/ionization method for fully p-conjugated
dendrimers. Rapid Commun Mass Spectrom 2004;18:367–70.
[312] Morrison DA, Eadie L, Davis TP. Catalytic chain transfer
isomerization reactions involving 2-phenylallyl alcohol.
Macromolecules 2001;34:7967–72.
[313] Willemse RXE, Staal BBP, Donkers EHD, van Herk AM.
Copolymer fingerprints of polystyrene-block-polyisoprene by
MALDI-ToF-MS. Macromolecules 2004;37:5717–23.
[314] Polce MJ, Klein DJ, Harris FW, Modarelli DA,
Wesdemiotis C. Structural characterization of quinoxaline
homopolymers and quinoxaline/ether sulfone copolymers by
MALDI mass spectrometry. Anal Chem 2001;73:1948–58.
[315] Cox JF, Johnston MV, Qian K, Peiffer DG. Compositional
analysis of isobutylene/p-methylstyrene copolymers by matrix-
assisted laser desorption/ionization mass spectrometry. J Am
Soc Mass Spectrom 2004;15:681–8.
[316] Montaudo G, Montaudob MS, Puglisi C, Samperi F. Structural
characterization of multicomponent copolyesters by mass
spectrometry. Macromolecules 1998;31:8666–76.
[317] Montaudo G, Puglisi C, Samperi F. Transreactions in
condensation polymers. In: Fakirov S, editor. Weinheim (D):
Wiley-VCH; 1999 [chapter 4].
[318] Samperi F, MontaudoMS, Puglisi C, Di Giorgi S, Montaudo G.
Structural characterization of copolyamides synthesized via the
facile blending of polyamides. Macromolecules 2004;37:
6449–59.
[319] Impallomeni G, Giuffrida M, Barbuzzi T, Musumarra G,
Ballistreri A. Acid catalyzed transesterification as a route to
poly(3-hydroxybutyrate-co-3-caprolactone) copolymers from
their homopolymers. Biomacromolecules 2002;3:835–43.
[320] Tillier D, Lefebvre H, Tessier M, Blais J-C, Fradet A. High
temperature bulk reaction between poly(ethylene terephthal-
ate) and lactones: 1H NMR and SEC/MALDI-TOF MS study.
Macromol Chem Phys 2004;205:581–92.
[321] Puglisi C, Samperi F, Di Giorgi S, Montaudo G. Exchange
reactions occurring through active chain ends. MALDI-TOF
characterization of copolymers from Nylon 6,6 and Nylon 6,
10. Macromolecules 2003;36:1098–107.
[322] Samperi F, Puglisi C, Alicata R, Montaudo G. Essential role of
chain ends in the nylon6/poly(ethylene terephthalate exchange.
J Polym Sci Polym Chem 2003;41:2778–93.
[323] Samperi F, Montaudo MS, Puglisi C, Alicata R, Montaudo G.
Essential role of chain ends in the Ny6/PBT exchange. A
combined NMR and MALDI approach. Macromolecules 2003;
36:7143–54.
[324] Viala S, Tauer K, Antonietti K, Kruger R-P, Bremser W.
Structural control in radical polymerization with 1,1-dipheny-
lethylene. 1. Copolymerization of 1,1-diphenylethylene with
methyl methacrylate. Polymer 2002;43:7231–41.
[325] Montaudo MS. Determination of the compositional distri-
bution and compositional drift in styrene/maleic anhydride
copolymers. Macromolecules 2001;34:2792–7.
[326] Montaudo MS. Mass Spectra of copolymers which displays
compositional drift or sequence constraints. J Am Soc Mass
Spectrom 2004;15:374–84.
[327] Venkatesh R, Harrisson S, Haddleton DM, Klumperman B.
Olefin copolymerization via controlled radical polymerization:
copolymerization of acrylate and 1-octene. Macromolecules
2004;37:4406–16.
[328] Kaufman JM, Jaber AJ, Stump MJ, Simonsick Jr WJ,
Wilkins CL. Int J Mass Spectrom 2004;234:153–60.
[329] Chevallier P, Soutif J-C, Brosse J-C, Brunelle A. Poly(amide
ester)s from 2,6-pyridinedicarboxylic acid and ethanolamine
derivatives: identification of macrocycles by matrix-assisted
laser desorption/ionization mass spectrometry. Rapid Commun
Mass Spectrom 2002;16:1476–84.
[330] Meier MAR, Lohmeijer BGG, Schubert US. Characterization
of defined metal-containing supramolecular block copolymers.
Macromol Rapid Commun 2003;24:852–7.
[331] Jayakannan M, van Dongen JLJ, Janssen RAJ. Mechanistic
aspects of the suzuki polycondensation of thiophenebisboronic
derivatives and diiodobenzenes analyzed by MALDI-TOF
mass spectrometry. Macromolecules 2001;34:5386–93.
[332] Venkatesh R, Vergouwen F, Klumperman B. Copolymeriza-
tion of allyl butyl ether with acrylates via controlled radical
Polymerization. J Polym Sci Part A Polym Chem 2004;42:
3271–84.
[333] Babudri F, Cardone A, Farinola GM, Naso F, Cassano T,
Chiavarone L, et al. Synthesis and optical properties of a
copolymer of tetrafluoro-and dialkoxy-substituted poly(p-
phenylenevinylene) with a high percentage of fluorinated
units. Macromol Chem Phys 2003;204:1621–7.
[334] Baker ES, Gidden J, Simonsick WJ, Grady MC, Bowers MT.
Sequence dependent conformations of glycidyl methacrylate/-
butyl methacrylate copolymers in the gas phase. Int J Mass
Spectrom 2004;238:279–86.
[335] Jackson AT, Scrivens JH, Williams JP, Baker ES, Gidden J,
Bowers MT. Microstructural and conformational studies of
polyether copolymers. Int J Mass Spectrom 2004;238:287–97.
[336] Montaudo MS, Adamus G, Kowalczuk M. Bivariate distri-
bution in copolymers: a new model. J Polym Sci Part A Polym
Chem 2002;40:2442–8.
[337] Montaudo MS. Copolymer characterization by SEC-NMR and
SEC-MALDI. Polymer 2002;43:1587–97.
[338] Bechtold K, Hillmyer MA, Tolman WB. Perfectly alternating
copolymer or lactic acid and ethylene oxide as a plasticizing
agent for polylactide. Macromolecules 2001;34:8641–8.
[339] Zhang DH, Xu JY, Alcazar-Roman L, Greenman L,
Cramer CJ, Hillmyer MA, et al. Isotactic polymers with
alternating lactic acid and oxetane subunits from the
endoentropic polymerization of a 14-membered ring. Macro-
molecules 2004;37:5274–81.
[340] Keki S, Bodnar I, Borda J, Deak G, Batta G, Zsuga M. Matrix-
assisted laser desorption/ionization mass spectrometry study of
the oligomers formed from lactic acid and diphenylmethane
diisocyanate. Macromolecules 2001;34:7288–93.
[341] Milani B, Scarel A, Durand J, Mestroni G, Seraglia R,
Carfagna C, et al. MALDI-TOF mass spectrometry in the study
of CO/Aromatic olefins terpolymers. Macromolecules 2003;
36:6295–7.
G. Montaudo et al. / Prog. Polym. Sci. 31 (2006) 277–357 355
[342] Cox FJ, Qian K, Patil AO, Johnston MV. Microstructure and
composition of ethylene-carbon monoxide copolymers by
matrix-assisted laser desorption/ionization mass spectrometry.
Macromolecules 2003;36:8544–50.
[343] Venkatesh R, Klumperman B. Olefin copolymerization via
controlled radical polymerization: copolymerization of methyl
methacrylate and 1-octene. Macromolecules 2004;37:1226–33.
[344] Cai Y, Tang Y, Armes SP. Direct synthesis and stimulus-
responsive micellization of y-shaped hydrophilic block
copolymers. Macromolecules 2004;37:9728–37.
[345] Przybilla L, Francke V, Rader HJ, Mullen K. Block length
determination of a poly(ethylene oxide)-b-poly(p-phenylene
ethynylene) diblock copolymer by means of MALDI-TOF
mass spectrometry combined with fragment-ion analysis.
Macromolecules 2001;34:4401–5.
[346] Chen R, Tseng AM, Uhing M, Li L. Application of an
integrated matrix-assisted laser desorption/ionization time-of-
flight mass spectrometry and tandem mass spectrometry
approach to characterizing complex polyol mixtures. J Am
Soc Mass Spectrom 2001;12:55–60.
[347] Arnould MA, Wesdemiotis C, Geiger RJ, Park ME,
Buehner RW, Vanderrorst D. Structural characterization of
polyester copolymers by MALDI mass spectrometry. Prog Org
Coat 2002;45:305–12.
[348] Dhanabalan A, van Dongen JLJ, van Duren JKJ, Janssen HM,
van Hal PA, Janssen RAJ. Synthesis, characterization, and
electrooptical properties of a new alternating N-dodecyl-
pyrrole-benzothiadiazole copolymer. Macromolecules 2001;
34:2495–501.
[349] Scherman OA, Rutenberg IM, Grubbs RH. Direct synthesis of
soluble, end-functionalized polyenes and polyacetylene block
copolymers. J Am Chem Soc 2003;125:8515–22.
[350] Berlin A, Zotti G, Zecchin S, Schiavon G. Thiophene/cyclo-
pentadiene regular copolymers from electrochemical oxidation
of dithienylcyclopentadienes. Macromol Chem Phys 2002;203:
1228–37.
[351] Baek JB, Harris FW. Fluorine- and hydroxyl-terminated
hyperbranched poly(phenylquinoxalines) (PPQs) from copo-
lymerization of self-polymerizable AB and AB2, BA, and BA2
monomers. Macromolecules 2005;38:1131–40.
[352] Salhi S, Tessier M, Blais J-C, El Gharbi R, Fradet A. Synthesis
of aliphatic–aromatic copolyesters by a high temperature bulk
reaction between poly(ethylene terephthalate) cyclodi(ethylene
succinate). Macromol Chem Phys 2004;205:2391–7.
[353] Chen H, He M, Wan X, Yang L, He H. Matrix-assisted laser
desorption/ionization study of cationization of PEO–PPP rod-
coil diblock polymers. Rapid Commun Mass Spectrom 2003;
17:177–82.
[354] Lee H, Chang T, Lee D, Shim MS, Ji H, Nonidez WK, et al.
Chraracterization of poly(L-lactide)-block-poly(ethylene
oxide)-block-poly(L-lactide) triblock copolymer by liquid
chromatography at the critical condition and by MALDI-
TOF mass spectrometry. Anal Chem 2001;73:126–32.
[355] Runyon JR, Barnes DE, Rudd JF, Tung LH. Multiple detectors
for molecular weight and compositional analysis of copoly-
mers by gel permeation chromatography. J Appl Polym Sci
1969;13:2359–66.
[356] Ihara E, Kurokawa A, Koda T, Muraki T, Itoh T, Inoue K.
Benzyne as a monomer for polymerization: alternating
copolymerization of benzyne and pyridine to give novel
polymers with o-phenylene and 2,3-dihydropyridine units in
the main chain. Macromolecules 2005;38:2167–72.
[357] Rajot I, Bone S, Graillat C, Hamaide Th. Nonionic
nanoparticles by miniemulsion polymerization of vinyl acetate
with oligocaprolactone macromonomer or miglyol as hydro-
phobe. Application to the encapsulation of indomethacin.
Macromolecules 2003;36:7484–90.
[358] Bernaerts KV, Schacht EH, Goethals EJ, Du Prez FE. Synthesis
of poly(tetrahydrofuran)-b-polystyrene block copolymers from
dual initiators for cationic ring-opening polymerization and
atom transfer radical polymerization. J Polym Sci Part A
Polym Chem 2003;41:3206–17.
[359] Elyashiv-Barad S, Greinert N, Sen A. Copolymerization of
methyl acrylate with norbornene derivatives by atom transfer
radical polymerization. Macromolecules 2002;35:7521–6.
[360] Maier S, Loontjens T, Scholtens B, Mulhaupt R. Isocyanate-
free route to caprolactam-blocked oligomeric isocyanates via
carbonylbiscaprolactam- (CBC-) mediated end group conver-
sion. Macromolecules 2003;36:4727–34.
[361] Ma Q, Wooley KL. The preparation of t-butyl acrylate, methyl
acrylate, and styrene block copolymers by atom transfer
radical polymerization: precursor to amphiphilic and hydro-
philic block copolymers and conversion to complex nanos-
tructured materials. J Polym Sci Part A Polym Chem 2000;38:
4805–20.
[362] Rizzarelli P, Puglisi C, Montaudo G. Sequence determination
in aliphatic poly(ester amide)s by PSD-MALDI/TOF/TOF-
MS/MS. Rapid Commun Mass Spectrom, 2005;19:2407–18.
[363] Zhang C, Ochiai B, Endo T. Matrix-assisted laser desorptio-
n/ionization time-of-flight mass spectrometry study on copo-
lymers obtained by the alternating copolymerization of bis (g-
lactone) and epoxide with potassium tert-butoxide. J Polym Sci
Part A Polym Chem 2005;43:2643–9.
[364] Mucke A, Rieger B. Novel linear and branched poly(1,4-
ketone)-b-polyalcohol block structures through control of the
catalyst initiation mechanism. Macromolecules 2002;35:
2865–7.
[365] Shi SDH, Hendrickson CL, Marshall AG, Simonsick WJ,
Aaserud DJ. Identification, composition, and asymmetric
formation mechanism of glycidyl methacrylate butyl metha-
crylate copolymers up to 7000 Da from electrospray ionization
ultrahigh-resolution Fourier transform ion cyclotron resonance
mass spectrometry. Anal Chem 1998;70:3220–6.
[366] Puglisi C, Samperi F, Di Giorgi S, Montaudo G. MALDI-TOF
characterisation of thermally generated gel from nylon 66.
Polym Degrad Stab 2002;78:369–78.
[367] Murgasova R, Brantley EL, Hercules DM, Nefzger H.
Characterization of polyester–polyurethane soft and hard
blocks by a combination of MALDI, SEC, and chemical
degradation. Macromolecules 2002;35:8338–45.
[368] Samperi F, Puglisi C, Alicata R, Montaudo G. Thermal
degradation of poly(ethylene terephthalate) at the processing
temperature. Polym Degrad Stab 2004;83:3–10.
[369] Samperi F, Puglisi C, Alicata R, Montaudo G. Thermal
degradation of poly(butylene terephthalate) at the processing
temperature. Polym Degrad Stab 2004;83:11–17.
[370] Lattimer RP. Pyrolysis mass spectrometry of acrylic acid
polymers. J Anal Appl Pyrolysis 2003;68–69:3–14.
[371] Lattimer RP. Mass spectral analysis of low-temperature
pyrolysis products from poly(tetrahydrofuran). J Anal Appl
Pyrolysis 2001;57:57–76.
[372] Lattimer RP, Polce MJ, Wesdemiotis C. MALDI-MS analysis
of pyrolysis products from a segmented polyurethane. J Anal
Appl Pyrolysis 1998;48:1–15.
G. Montaudo et al. / Prog. Polym. Sci. 31 (2006) 277–357356
[373] Gallet G, Carroccio S, Rizzarelli P, Karlsson S. Thermal
degradation of poly(ethylene oxide–propylene oxide–ethylene
oxide) triblock copolymer: comparative study by SEC/NMR,
SEC/MALDI-TOF-MS and SPME/GC-MS. Polymer 2002;43:
1081–94.
[374] Audouin F, Nuffer R, Mathis C. Thermal stability of the
fullerene-chain link in 6-arm PS stars with a C60 core. J Polym
Sci Part A Polym Chem 2004;42:4820–9.
[375] Apicella B, Ciajolo A, Milian M, Galmes C, Herod AA,
Kandiyoti R. Oligomeric carbon and siloxane series observed
by matrix-assisted laser desorption/ionisation and laser
desorption/ionisation mass spectrometry during the analysis
of soot formed in fuel-rich flames. Rapid Commun Mass
Spectrom 2004;18:331–8.
[376] Puglisi C, Samperi F, Carroccio S, Montaudo G. MALDI-TOF
investigation of polymer degradation pyrolysis of poly(bi-
sphenol A carbonate). Macromolecules 1999;26:8821–8.
[377] Carroccio S, Puglisi C, Montaudo G. Mechanism of thermal
oxidation of poly(bisphenol A carbonate). Macromolecules
2002;35:4297–305.
[378] Montaudo G, Carroccio S, Puglisi C. Thermal oxidation of
poly(bisphenol A carbonate) investigated by SEC/MALDI.
Polym Degrad Stab 2002;77:137–46.
[379] Weidner S, Kuhn G, Friedrich J, Schroder H. Plasmaoxidative
and chemical degradation of poly(ethylene terephthalate)
studied by matrix-assisted laser/desorption ionization mass
spectrometry. Rapid Commun Mass Spectrom 1996;10:40–6.
[380] Weidner S, Kuhn G, Werthmann B, Schroeder H, Just U,
Borowski R, et al. A new approach of characterizing the
hydrolytic degradation of poly(ethylene terephthalate) by
MALDI-MS. J Polym Sci A Polym Chem 1997;35:2183–92.
[381] Lattimer RP. Mass spectral analysis of low-temperature
pyrolysis products from poly(ethylene glycol). J Anal Appl
Pyrolysis 2000;56:61–78.
[382] Carroccio S, Puglisi C, Montaudo G. New vistas in the photo-
oxidation of nylon 6. Macromolecules 2003;36:7499–507.
[383] Carroccio S, Puglisi C, Montaudo G. MALDI investigation of
the photooxidation of nylon-66. Macromolecules 2004;37:
6037–49.
[384] Carroccio S, Rizzarelli P, Puglisi C, Montaudo G. MALDI
investigation of photooxidation in aliphatic polyesters:
poly(butylene succinate). Macromolecules 2004;37:6576–86.
[385] Carroccio S, Puglisi C, Montaudo G. Photo-oxidation products
of polyetherimide ULTEM determined by MALDI-TOF- MS.
Kinetics and mechanisms. Polym Degrad Stabil 2003;80:
459–76.
[386] Carroccio S, Puglisi C, Montaudo G. Comparison of photo and
thermal oxidation processes in polyetherimide. Macromol-
ecules 2005;38:6863–70.
[387] Carroccio S, Puglisi C, Montaudo G. 1. New vistas in polymer
degradation. Thermal oxidation processes in poly(ether imide).
Macromolecules 2005;38:6849–62.
[388] Sato H, Kiyono Y, Ohtani H, Tsuge S, Aoi H, Aoi K.
Evaluation of biodegradation behavior of poly(3 caprolactone)
with controlled terminal structure by pyrolysis-gas-chroma-
tography and matrix-assisted laser desorption/ionization mass
spectrometry. J Anal Appl Pyrolysis 2003;68–69:37–49.
[389] Sato H, Shibata A, Wang Y, Yoshikawa H, Tamura H.
Characterization of biodegradation intermediates of non-ionic
surfactants by matrix-assisted laser desorption/ionization-mass
spectrometry. 1. Bacterial biodegradation of octylphenol
polyethoxylate under aerobic conditions. Polym Degrad Stab
2001;74:69–75.
[390] Taguchi Y, Ishida Y, Ohtani H, Matsubara H. Direct analysis of
an oligomeric hindered amine light stabilizer in polypropylene
materials by MALDI-MS using a solid sampling technique to
study its photostabilizing action. Anal Chem 2004;76:697–703.
[391] Zoller DL, Johnston MV. Microstructure of butadiene
copolymers determined by ozonolysis/MALDI mass spec-
trometry. Macromolecules 2000;33:1664–70.
[392] Bankova M, Kumar A, Impallomeni G, Ballistreri A,
Gross RA. Mass-selective lipase-catalyzed poly(3-caprolac-
tone) transesteriication reactions. Macromolecules 2002;35:
6858–66.
[393] Cheng G, Boker A, Zhang M, Krausch G, Muller AHE.
Amphiphilic cylindrical core-shell brushes via a ‘grafting
from’ process using ATRP. Macromolecules 2001;34:6883–8.
[394] Whittal RM, Li L. High-resolution MALDI in a linear time-of-
flight mass-spectrometer. Anal Chem 1995;67:1950–4.
[395] Juhasz P, Roskey MT, Smirnov IP, Haff LA, Vestal ML,
Martin SA. Applications of delayed extraction MALDI-time-
of-flight mass spectrometry to oligonucleotide analysis. Anal
Chem 1996;68:941–6.
[396] Whittal RM, Li L, Lee S, Winnik MA. Characterization of
pyrene end-labeled poly(ethylene glycol) by high resolution
MALDI time-of-flight mass spectrometry. Macromol Rapid
Comm 1996;17:59–64.
[397] Lee S, Winnik MA, Whittal RM, Li L. Synthesis of symmetric
fluorescently labeled poly(ethylene glycols) using phosphor-
amidites of pyrenebutanol and their characterization by
MALDI mass spectrometry. Macromolecules 1996;29:
3060–72.
[398] Jackson AT, Yates HT, Lindsay CI, Didier Y, Segal JA,
Scrivens JH, et al. Utilizing time-lag focusing MALDI mass
spectrometry for the end group analysis of synthetic polymers.
Rapid Commun Mass Spectrom 1997;11:520–6.
[399] Jackson AT, Yates HT, MacDonald WA, Scrivens JH,
Critchley G, Brown J, et al. Time-lag focusing and cation
attachment in the analysis of synthetic polymers by MALDI-
time-of-flight mass spectrometry. J Am Soc Mass Spectrom
1997;8:132–9.
[400] Erra-Balsells R, Nonami H. UV-matrix-assisted laser deso-
rption/ionization time-of-flight mass spectrometry analysis of
synthetic polymers by using nor-harmane as matrix. Arkivoc
2003;517–37.
[401] Zhang J, Zenobi R. Matrix-dependent cationization in MALDI
mass spectrometry. J Mass Spectrm 2004;39:808–16.
[402] Bauer BJ, Guttman CM, Liu DW, Blair WR. Tri-alpha-
naphthylbenzene as a crystalline or glassy matrix for matrix-
assisted laser desorption/ionization: a model system for the
study of effects of dispersion of polymer samples at a
molecular level. Rapid Commun Mass Spectrom 2002;16:
1192–8.
[403] Soltzberg LJ, Patel P. Small molecule matrix-assisted laser
desorption/ionization time-of-flight mass spectrometry using a
polymer matrix. Rapid Commun Mass Spectrom 2004;18:
1455–8.
[404] Guo Z, Zhang Q, Zou H, Ni J. A method for the analysis of
low-mass molecules by MALDI-TOF mass spectrometry. Anal
Chem 2002;74:1637–41.
G. Montaudo et al. / Prog. Polym. Sci. 31 (2006) 277–357 357
[405] deVries MS, Hunziker HE. Polymer characterization by laser
desorption with multiphoton ionization of end-group chromo-
phores. Appl Surf Sci 1996;106:466–72.
[406] Vitalini D, Mineo P, Scamporrino E. Effect of combined
changes in delayed extraction time and potential gradient on
the mass resolution and ion discrimination in the analysis of
polydisperse polymers and polymer blends by delayed
extraction matrix-assisted laser desorption/ionization time-of-
flight mass spectrometry. Rapid Commun Mass Spectrom
1999;13:2511–7.
[407] Brown RS, Weil DA, Wilkins CL. Laser desorption-Fourier
transform mass spectrometry for the characterization of
polymers. Macromolecules 1986;19:1255–60.
[408] Montaudo G, Puglisi C, Samperi F. Characterization of
polymers by matrix-assisted laser desorption/ionization time-
of-flight mass spectrometry: molecular weight estimates in
samples of varying polydispersity. Rapid Commun Mass
Spectrom 1995;9:453–60.
[409] Ulmer L, Mattay J, Torres-Garcia HG, Luftmann H. The use of
2-[(2E)-3-(4-tert-butylphenyl)-2-methylprop-2-enylidene]
malononitrile as a matrix for MALDI mass spectrometry. Eur
J Mass Spectrom 2000;6:49–52.
[410] Montaudo G, Scamporrino E, Vitalini D, Mineo P. Novel
procedure for molecular weight averages measurement of
polydisperse polymers directly from matrix-assisted laser
desorption/ionization time-of-flight mass spectra. Rapid Com-
mun Mass Spectrom 1996;12:1551–9.
[411] Scamporrino E, Maravigna P, Vitalini D, Mineo P. A new
procedure for quantitative correction of matrix-assisted laser
desorption/ionization time-of-flight mass spectrometric
responce. Rapid Commun Mass Spectrom 1998;12:646–50.
[412] Mourey TH, Hoteling AJ, Balke ST, Owens KG. Molar mass
distributions of polymers from size exclusion chromatography
and matrix-assisted laser desorption ionization time-of-flight
mass spectrometry. J Appl Polym Sci 2005;97:627–39.
[413] Murgasova R, Hercules DM. Polymer characterization by
combining liquid chromatography with MALDI and ESI mass
spectrometry. Anal Bioanal Chem 2002;373:481–9.
[414] Ericson C, Phung QT, Horn DM, Peters EC, Fitchett JR,
Ficarro SB, et al. An automated noncontact deposition
interface for liquid chromatography matrix-assisted laser
desorption/ionization mass spectrometry. Anal Chem 2003;
75:2309–15.
[415] Zhang BY, McDonald C, Li L. Combining liquid chromatog-
raphy with MALDI mass spectrometry using a heated droplet
interface. Anal Chem 2004;76:992–1001.
[416] Mukhopadhyay R. The automated union of LC and MALDI
MS. Anal Chem 2005;76:150A–12.
[417] Wright PV, Beevers MS. In: Semlyen JA, editor. Cyclic
polymers. Amsterdam: Elsevier; 1986. p. 109.
[418] Flory P, In: Principles of polymer chemistry. Ithaca, NY:
Cornell University Press; 1971.
[419] Elias HG, In: Macromolecules. New York: Plenum Press;
1984.
[420] Glockner G. Chromatographic cross fractionation. In: Com-
prehensive polymer science, Allen G. Bevington J, editors.
vol. 1. Oxford: Pergamon; 1989 [Chapter 6].
[421] Gores F, Kilz P. Chromatography of polymers. In: Provdes T,
editor. ACS symposium series 521. Washington: ACS Publish-
ing; 1993.
[422] Chapman JR. Practical organic mass spectrometry: a guide for
chemical and biochemical analysis. 2nd ed. NY: Wiley; 1993.
[423] Loboda AV, Krutchinsky AN, Bromirski M, Ens W,
Standing KG. A tandem quadrupole/time-of-flight mass
spectrometer with a matrix-assisted laser desorption/ionisation
source: design and performance. Rapid Commun Mass
Spectrom 2000;14:1047–57.
[424] Sleno L, Volmer DA. Ion activation methods for tandem mass
spectrometry. J Mass Spectrom 2004;39:1091–112.
[425] Muscat D, Henderickx H, Kwakkenbos G, van Benthem R, de
Koster CG. In-source decay of hyperbranched polyesteramides
in matrix-assisted laser desorption/ionisation time-of-flight
mass spectrometry. J Am Soc Mass Spectrom 2000;11:218–27.
[426] Montando MS, Puglisi C, Samperi F, Montando G. Molar mass
distributions and hydrodynamic interactions in random
copolyesters investigated by SEC/MALDI. Macromolecules
1998;31:3839–45.


