Download - CEE Leasing market
Central & Eastern Europe and the Financial Crisis: the Impact on the Banking Sector and the Leasing Market
Matteo Ferrazzi, CEE Strategic Analysis, UniCredit Group
Thursday, 2 April 2009 – Istanbul, Turkey
2
AGENDA
The global financial crisis and the effects on Central Eastern Europe
The banking sectors in CEE
The challenges for the leasing market
Conclusions
3
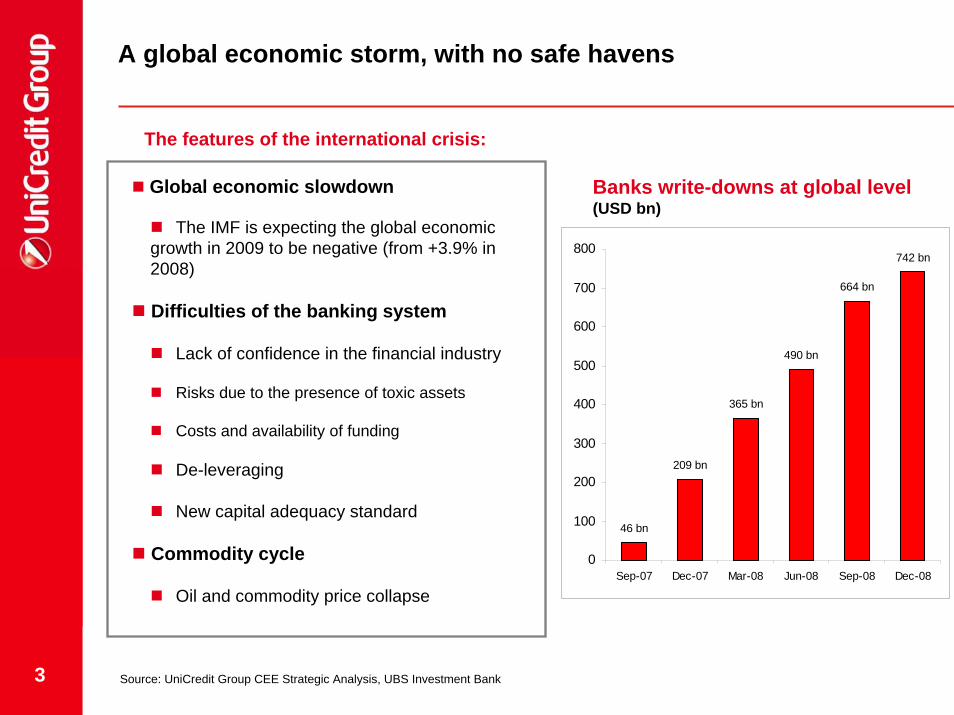
A global economic storm, with no safe havens
The features of the international crisis:
Banks write-downs at global level (USD bn)
Global economic slowdown
The IMF is expecting the global economic growth in 2009 to be negative (from +3.9% in 2008)
Difficulties of the banking system
Lack of confidence in the financial industry
Risks due to the presence of toxic assets
Costs and availability of funding
De-leveraging
New capital adequacy standard
Commodity cycle
Oil and commodity price collapse
46 bn
209 bn
365 bn
490 bn
664 bn
742 bn
0
100
200
300
400
500
600
700
800
Sep-07 Dec-07 Mar-08 Jun-08 Sep-08 Dec-08
Source: UniCredit Group CEE Strategic Analysis, UBS Investment Bank
4
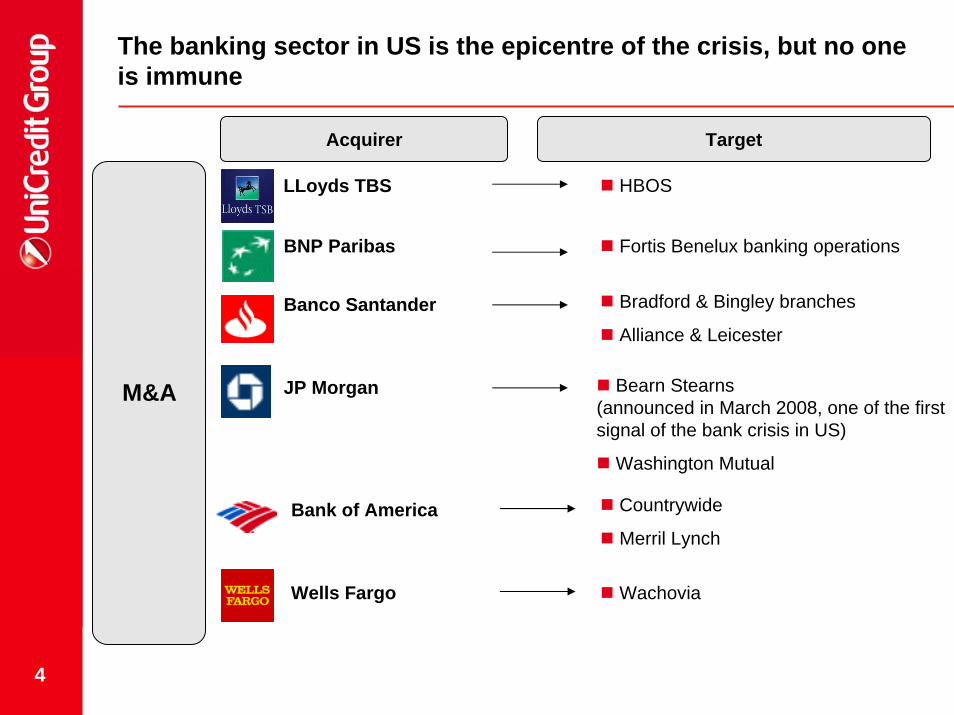
The banking sector in US is the epicentre of the crisis, but no one is immune
Acquirer Target
M&A
LLoyds TBS HBOS
BNP Paribas Fortis Benelux banking operations
Bradford & Bingley branches
Alliance & LeicesterBanco Santander
JP Morgan Bearn Stearns(announced in March 2008, one of the first signal of the bank crisis in US)
Washington Mutual
Countrywide
Merril LynchBank of America
Wells Fargo Wachovia
5
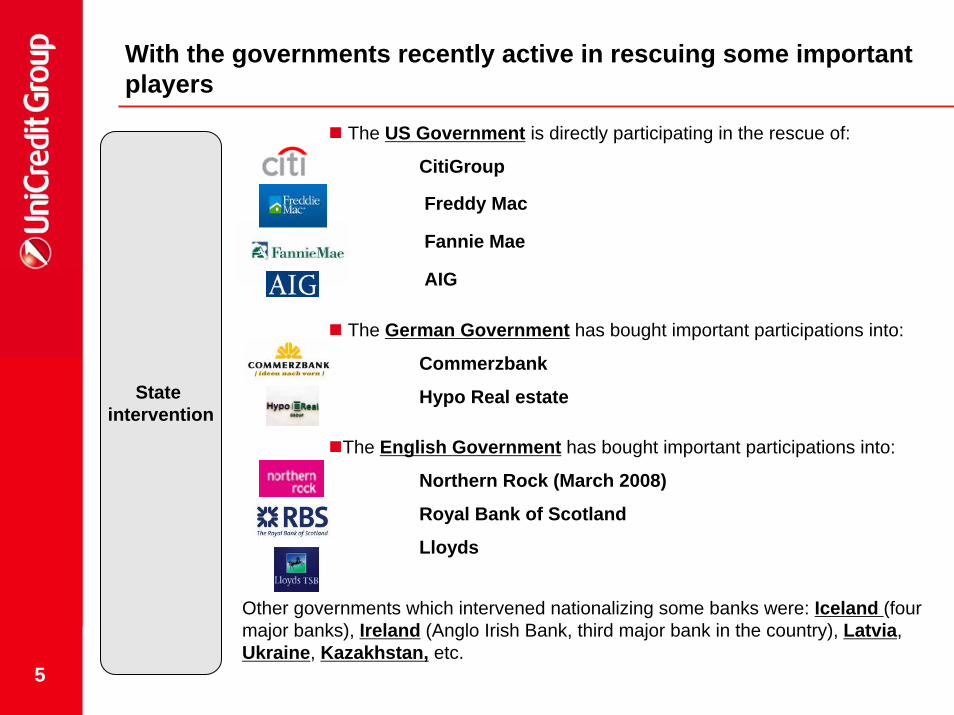
With the governments recently active in rescuing some important players
State intervention
The US Government is directly participating in the rescue of:
CitiGroup
Freddy Mac
Fannie Mae
AIG
The German Government has bought important participations into:
Commerzbank
Hypo Real estate
The English Government has bought important participations into:
Northern Rock (March 2008)
Royal Bank of Scotland
Lloyds
Other governments which intervened nationalizing some banks were: Iceland (four major banks), Ireland (Anglo Irish Bank, third major bank in the country), Latvia,Ukraine, Kazakhstan, etc.
6
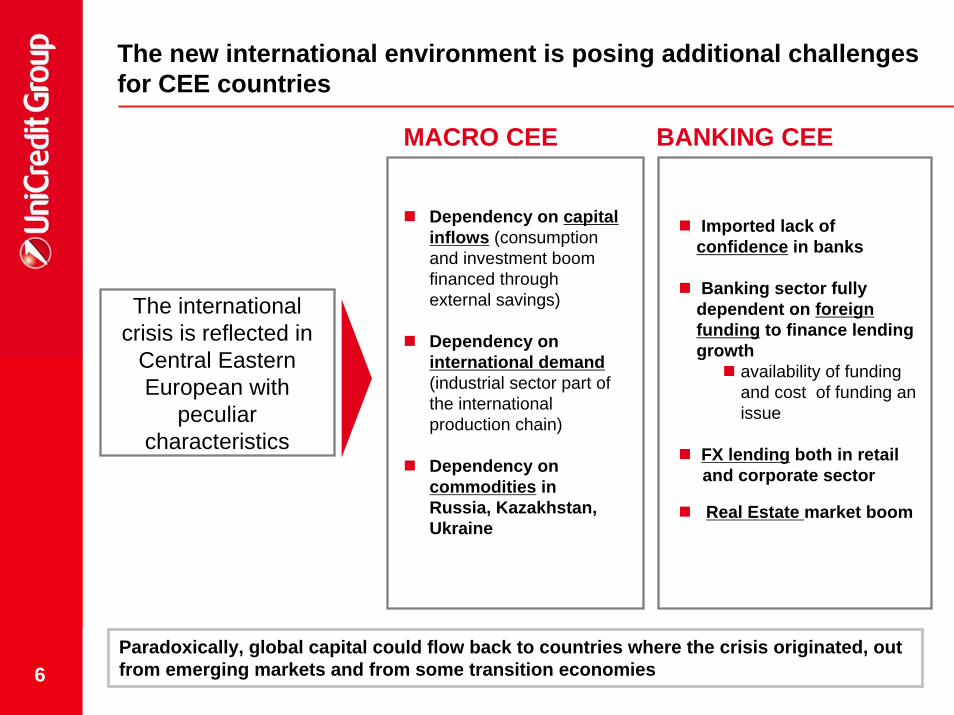
The new international environment is posing additional challenges for CEE countries
MACRO CEE BANKING CEE
Dependency on capital inflows (consumption and investment boom financed through external savings)
Dependency on international demand(industrial sector part of the international production chain)
Dependency on commodities in Russia, Kazakhstan, Ukraine
Imported lack ofconfidence in banks
Banking sector fully dependent on foreign funding to finance lending growth
availability of funding and cost of funding an issue
FX lending both in retail and corporate sector
Real Estate market boom
The international crisis is reflected in
Central Eastern European with
peculiar characteristics
Paradoxically, global capital could flow back to countries where the crisis originated, out from emerging markets and from some transition economies
7
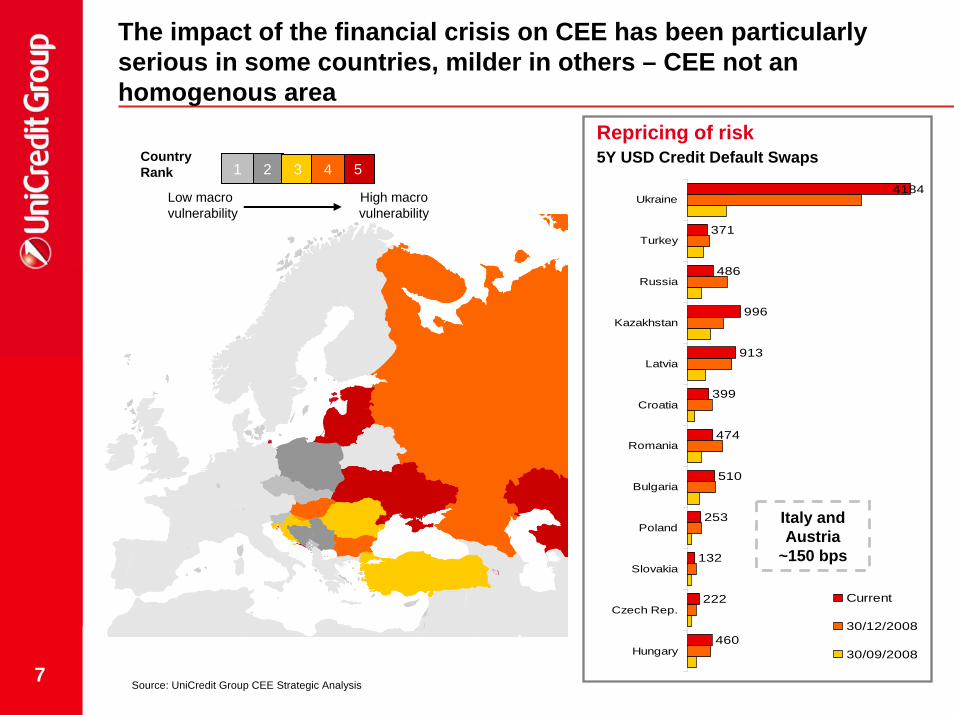
The impact of the financial crisis on CEE has been particularly serious in some countries, milder in others – CEE not an homogenous area
Source: UniCredit Group CEE Strategic Analysis
Low macro vulnerability
2 5
High macro vulnerability
3 41Country Rank
460
222
132
253
510
474
399
913
996
486
371
4184
Hungary
Czech Rep.
Slovakia
Poland
Bulgaria
Romania
Croatia
Latvia
Kazakhstan
Russia
Turkey
Ukraine
Current
30/12/2008
30/09/2008
Repricing of risk5Y USD Credit Default Swaps
Italy and Austria
~150 bps
8
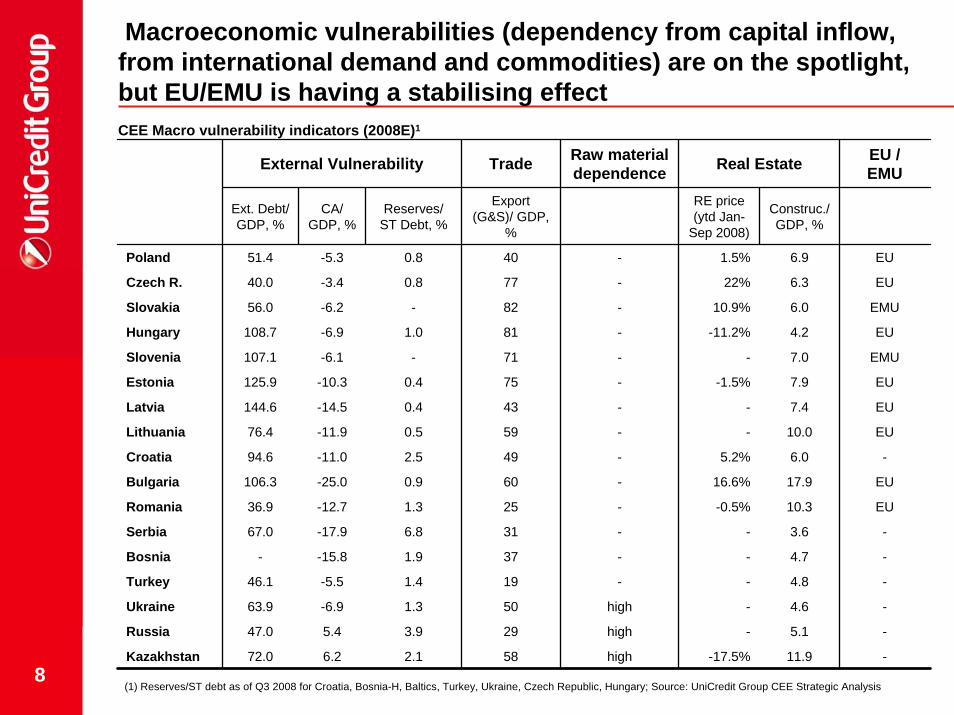
Macroeconomic vulnerabilities (dependency from capital inflow, from international demand and commodities) are on the spotlight,but EU/EMU is having a stabilising effectCEE Macro vulnerability indicators (2008E)1
External Vulnerability Trade Raw material dependence Real Estate EU /
EMU
Ext. Debt/GDP, %
CA/ GDP, %
Reserves/ ST Debt, %
Export (G&S)/ GDP,
%
RE price(ytd Jan-
Sep 2008)
Construc./ GDP, %
Poland 51.4 -5.3 0.8 40 - 1.5% 6.9 EU
Czech R. 40.0 -3.4 0.8 77 - 22% 6.3 EU
Slovakia 56.0 -6.2 - 82 - 10.9% 6.0 EMU
Hungary 108.7 -6.9 1.0 81 - -11.2% 4.2 EU
Slovenia 107.1 -6.1 - 71 - - 7.0 EMU
Estonia 125.9 -10.3 0.4 75 - -1.5% 7.9 EU
Latvia 144.6 -14.5 0.4 43 - - 7.4 EU
Lithuania 76.4 -11.9 0.5 59 - - 10.0 EU
Croatia 94.6 -11.0 2.5 49 - 5.2% 6.0 -
Bulgaria 106.3 -25.0 0.9 60 - 16.6% 17.9 EU
Romania 36.9 -12.7 1.3 25 - -0.5% 10.3 EU
Serbia 67.0 -17.9 6.8 31 - - 3.6 -
Bosnia - -15.8 1.9 37 - - 4.7 -
Turkey 46.1 -5.5 1.4 19 - - 4.8 -
Ukraine 63.9 -6.9 1.3 50 high - 4.6 -
Russia 47.0 5.4 3.9 29 high - 5.1 -
Kazakhstan 72.0 6.2 2.1 58 high -17.5% 11.9 -
(1) Reserves/ST debt as of Q3 2008 for Croatia, Bosnia-H, Baltics, Turkey, Ukraine, Czech Republic, Hungary; Source: UniCredit Group CEE Strategic Analysis
9
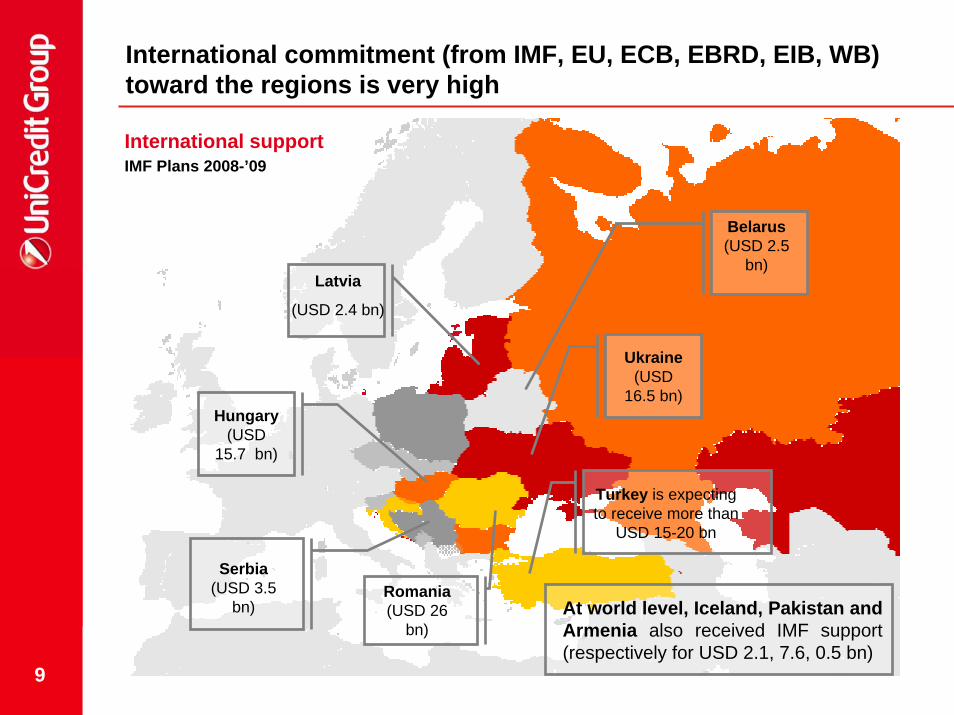
International commitment (from IMF, EU, ECB, EBRD, EIB, WB) toward the regions is very high
Ukraine (USD
16.5 bn)Hungary
(USD 15.7 bn)
Belarus(USD 2.5
bn)Latvia
(USD 2.4 bn)
Serbia (USD 3.5
bn)
Turkey is expecting to receive more than
USD 15-20 bn
At world level, Iceland, Pakistan and Armenia also received IMF support (respectively for USD 2.1, 7.6, 0.5 bn)
Romania (USD 26
bn)
International supportIMF Plans 2008-’09
10
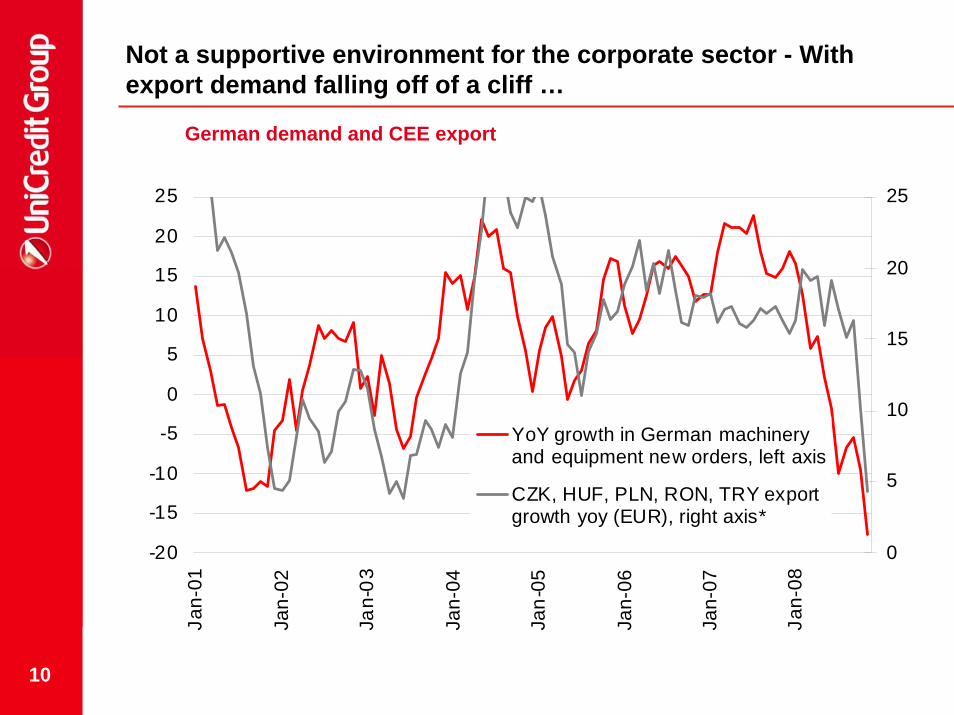
Not a supportive environment for the corporate sector - With export demand falling off of a cliff …
German demand and CEE export
-20
-15
-10
-5
0
5
10
15
20
25Ja
n-01
Jan-
02
Jan-
03
Jan-
04
Jan-
05
Jan-
06
Jan-
07
Jan-
08
0
5
10
15
20
25
YoY growth in German machineryand equipment new orders, left axis
CZK, HUF, PLN, RON, TRY exportgrowth yoy (EUR), right axis*
11
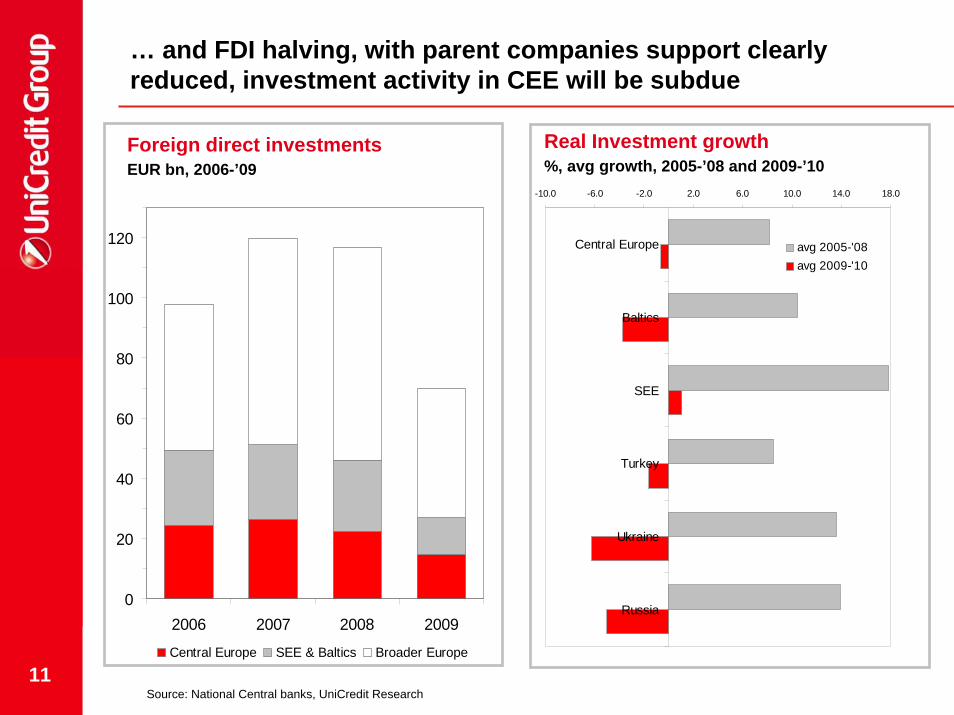
… and FDI halving, with parent companies support clearlyreduced, investment activity in CEE will be subdue
0
20
40
60
80
100
120
2006 2007 2008 2009
Central Europe SEE & Baltics Broader Europe
Foreign direct investmentsEUR bn, 2006-’09
-10.0 -6.0 -2.0 2.0 6.0 10.0 14.0 18.0
Central Europe
Baltics
SEE
Turkey
Ukraine
Russia
avg 2005-'08avg 2009-'10
Real Investment growth%, avg growth, 2005-’08 and 2009-’10
Source: National Central banks, UniCredit Research
12
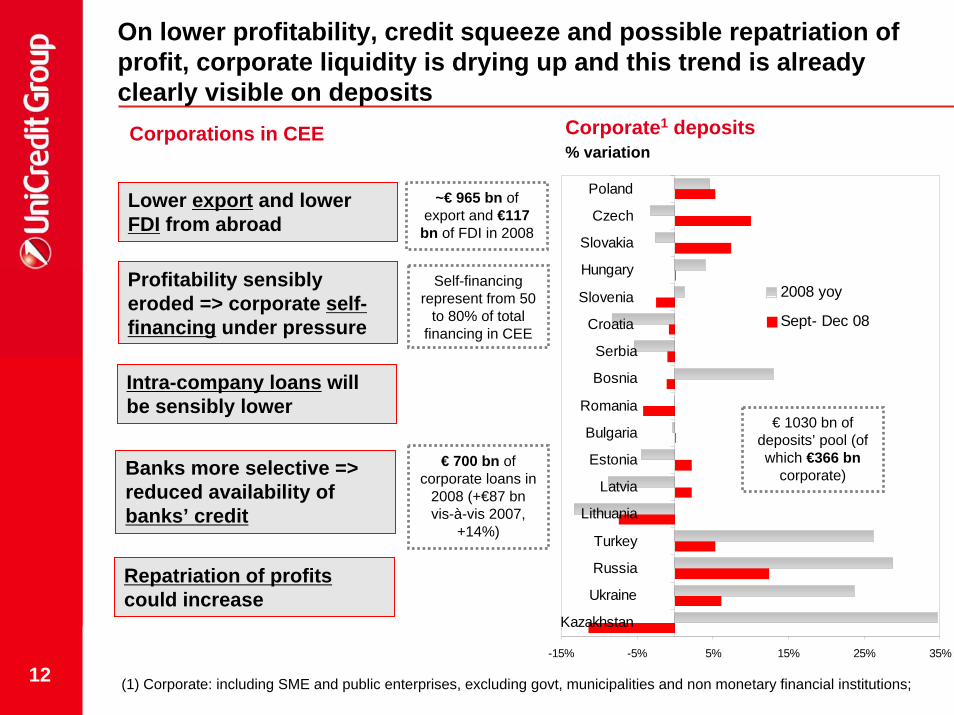
On lower profitability, credit squeeze and possible repatriation of profit, corporate liquidity is drying up and this trend is already clearly visible on deposits
Corporate1 deposits% variation
Corporations in CEE
-15% -5% 5% 15% 25% 35%
Poland
Czech
Slovakia
Hungary
Slovenia
Croatia
Serbia
Bosnia
Romania
Bulgaria
Estonia
Latvia
Lithuania
Turkey
Russia
Ukraine
Kazakhstan
2008 yoy
Sept- Dec 08
(1) Corporate: including SME and public enterprises, excluding govt, municipalities and non monetary financial institutions;
Profitability sensibly eroded => corporate self-financing under pressure
Repatriation of profitscould increase
Banks more selective => reduced availability of banks’ credit
Intra-company loans will be sensibly lower
Lower export and lower FDI from abroad
Self-financing represent from 50
to 80% of total financing in CEE
~€ 965 bn of export and €117
bn of FDI in 2008
€ 700 bn of corporate loans in
2008 (+€87 bnvis-à-vis 2007,
+14%)
€ 1030 bn of deposits’ pool (of which €366 bn
corporate)
13
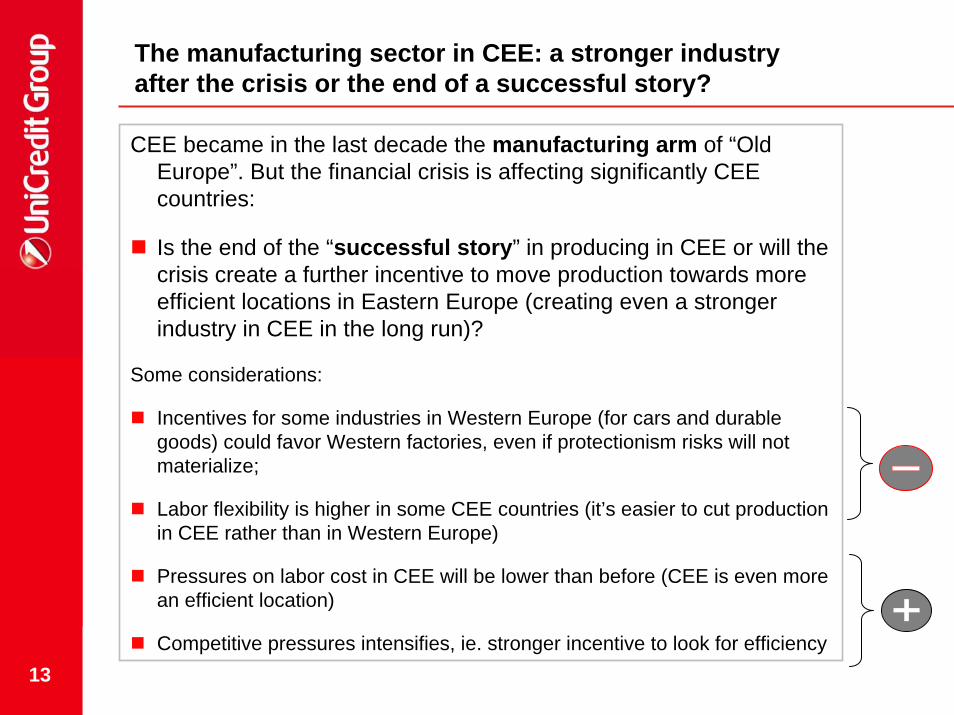
The manufacturing sector in CEE: a stronger industry after the crisis or the end of a successful story?
CEE became in the last decade the manufacturing arm of “Old Europe”. But the financial crisis is affecting significantly CEE countries:
Is the end of the “successful story” in producing in CEE or will the crisis create a further incentive to move production towards more efficient locations in Eastern Europe (creating even a stronger industry in CEE in the long run)?
Some considerations:
Incentives for some industries in Western Europe (for cars and durable goods) could favor Western factories, even if protectionism risks will not materialize;
Labor flexibility is higher in some CEE countries (it’s easier to cut production in CEE rather than in Western Europe)
Pressures on labor cost in CEE will be lower than before (CEE is even more an efficient location)
Competitive pressures intensifies, ie. stronger incentive to look for efficiency
14
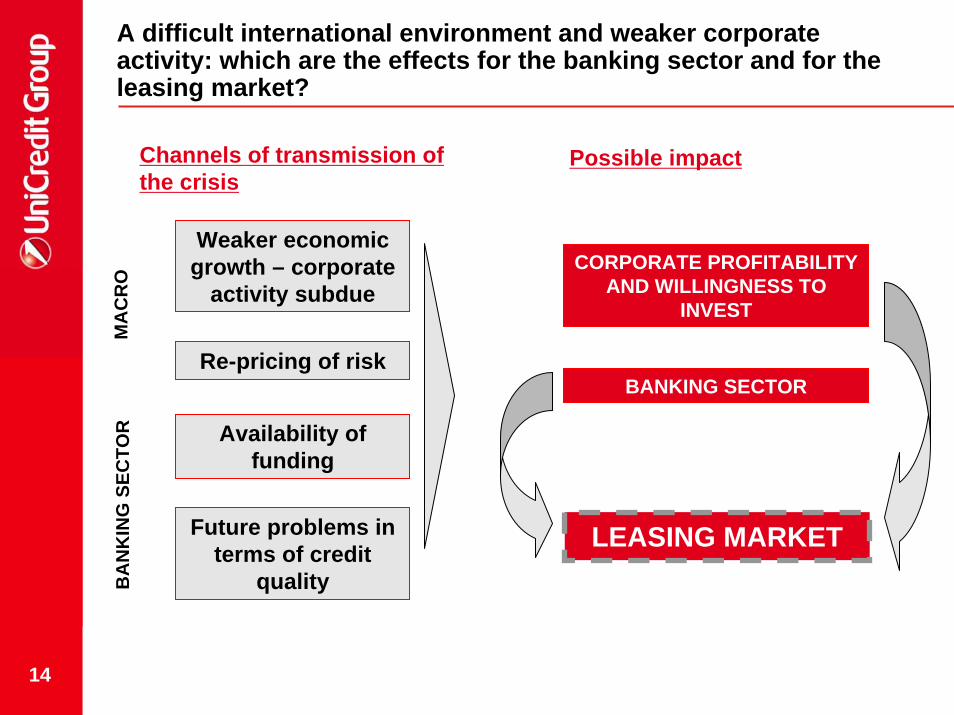
A difficult international environment and weaker corporate activity: which are the effects for the banking sector and for the leasing market?
Channels of transmission of the crisis
Possible impact
Weaker economic growth – corporate
activity subdueCORPORATE PROFITABILITY
AND WILLINGNESS TO INVEST
MA
CR
O
Re-pricing of riskBANKING SECTOR
LEASING MARKET
Availability of funding
BA
NK
ING
SEC
TOR
Future problems in terms of credit
quality
15
AGENDA
The global financial crisis and the effects on Central Eastern Europe
The banking sectors in CEE
The challenges for the leasing market
Conclusions
16
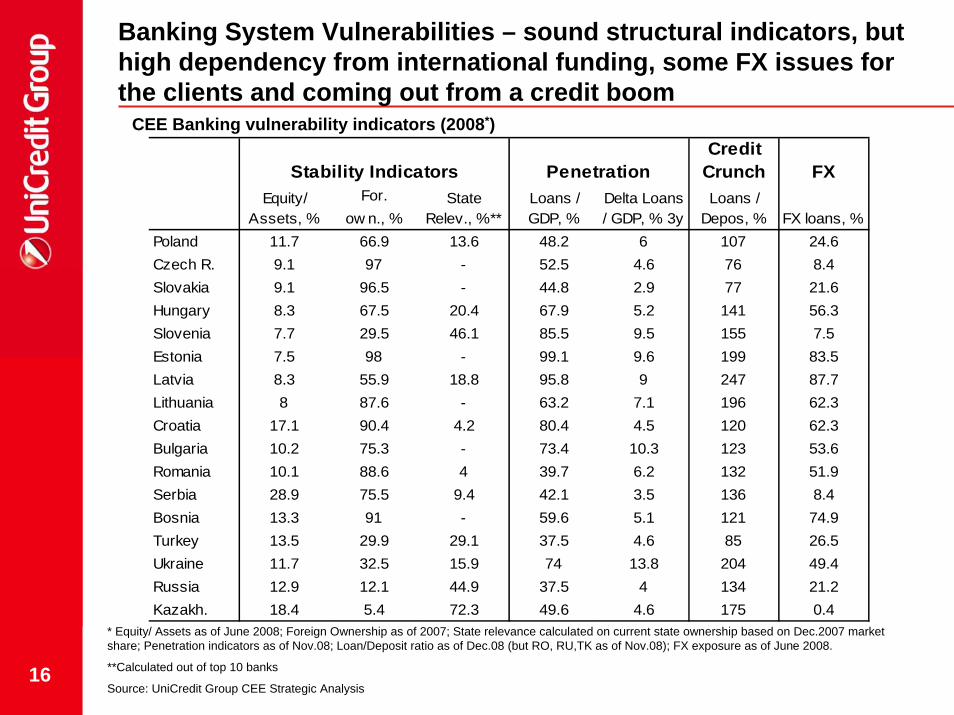
Banking System Vulnerabilities – sound structural indicators, but high dependency from international funding, some FX issues for the clients and coming out from a credit boom
* Equity/ Assets as of June 2008; Foreign Ownership as of 2007; State relevance calculated on current state ownership based on Dec.2007 market share; Penetration indicators as of Nov.08; Loan/Deposit ratio as of Dec.08 (but RO, RU,TK as of Nov.08); FX exposure as of June 2008.
**Calculated out of top 10 banks
Source: UniCredit Group CEE Strategic Analysis
CEE Banking vulnerability indicators (2008*)Credit
Crunch FXFor.
ow n., %Poland 11.7 66.9 13.6 48.2 6 107 24.6Czech R. 9.1 97 - 52.5 4.6 76 8.4Slovakia 9.1 96.5 - 44.8 2.9 77 21.6Hungary 8.3 67.5 20.4 67.9 5.2 141 56.3Slovenia 7.7 29.5 46.1 85.5 9.5 155 7.5Estonia 7.5 98 - 99.1 9.6 199 83.5Latvia 8.3 55.9 18.8 95.8 9 247 87.7Lithuania 8 87.6 - 63.2 7.1 196 62.3Croatia 17.1 90.4 4.2 80.4 4.5 120 62.3Bulgaria 10.2 75.3 - 73.4 10.3 123 53.6Romania 10.1 88.6 4 39.7 6.2 132 51.9Serbia 28.9 75.5 9.4 42.1 3.5 136 8.4Bosnia 13.3 91 - 59.6 5.1 121 74.9Turkey 13.5 29.9 29.1 37.5 4.6 85 26.5Ukraine 11.7 32.5 15.9 74 13.8 204 49.4Russia 12.9 12.1 44.9 37.5 4 134 21.2Kazakh. 18.4 5.4 72.3 49.6 4.6 175 0.4
FX loans, %
Stability Indicators PenetrationEquity/
Assets, %State
Relev., %**Loans / GDP, %
Delta Loans / GDP, % 3y
Loans / Depos, %
17
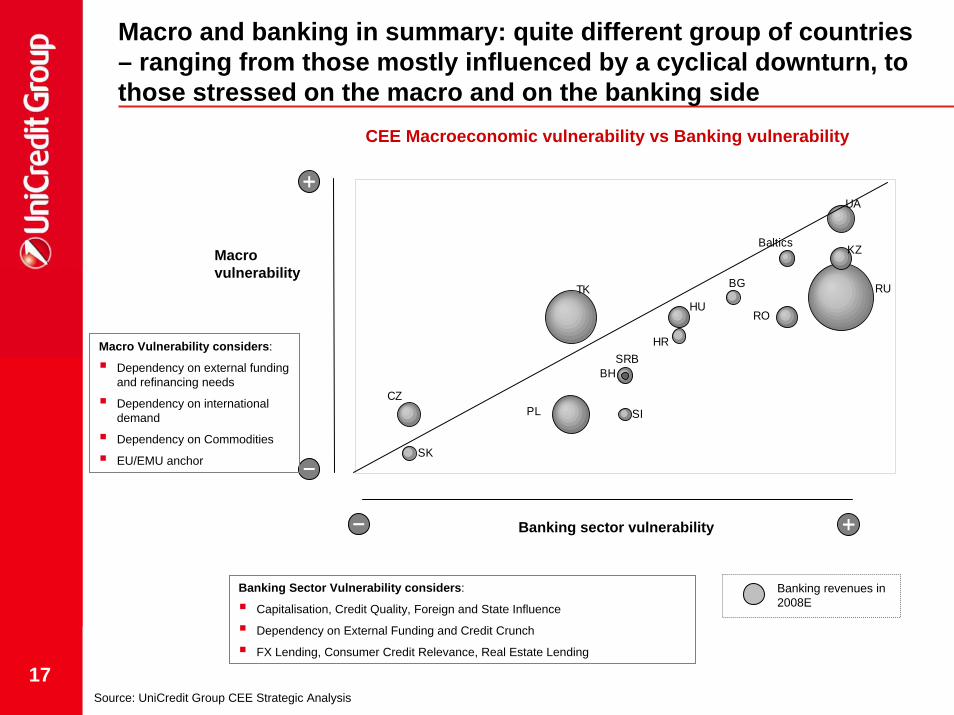
Macro and banking in summary: quite different group of countries– ranging from those mostly influenced by a cyclical downturn, tothose stressed on the macro and on the banking side
CEE Macroeconomic vulnerability vs Banking vulnerability
SK
CZSIPL
SRBBH
TKHU
HR
RO
BG
Baltics KZ
RU
UA
Macro vulnerability
Source: UniCredit Group CEE Strategic Analysis
Macro Vulnerability considers:
Dependency on external fundingand refinancing needs
Dependency on international demand
Dependency on Commodities
EU/EMU anchor
Banking sector vulnerability
Banking revenues in 2008E
Banking Sector Vulnerability considers:
Capitalisation, Credit Quality, Foreign and State Influence
Dependency on External Funding and Credit Crunch
FX Lending, Consumer Credit Relevance, Real Estate Lending
18
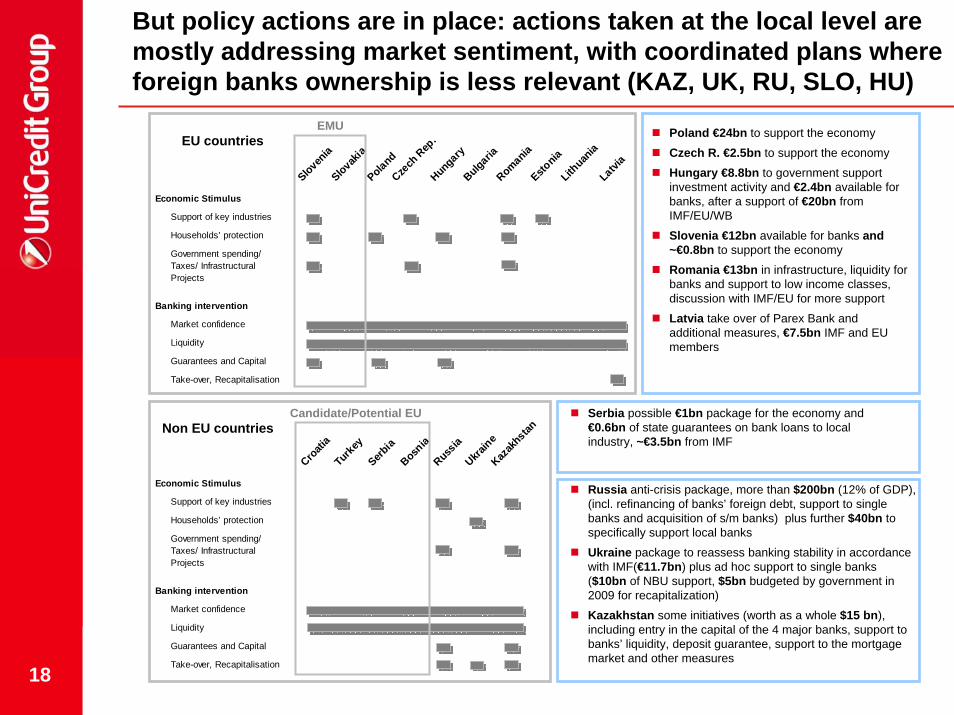
But policy actions are in place: actions taken at the local level are mostly addressing market sentiment, with coordinated plans whereforeign banks ownership is less relevant (KAZ, UK, RU, SLO, HU)
Slovenia
Slovakia
PolandCze
ch R
ep.
HungaryBulgariaRomaniaEsto
niaLith
uania
Latvia
Economic Stimulus
Support of key industries
Households’ protection
Government spending/ Taxes/ Infrastructural Projects
Banking intervention
Market confidence
Liquidity
Guarantees and Capital
Take-over, Recapitalisation
Croati
aTurk
eySerb
iaBosn
iaRuss
iaUkra
ineKaz
akhstan
Economic Stimulus
Support of key industries
Households’ protection
Government spending/ Taxes/ Infrastructural Projects
Banking intervention
Market confidence
Liquidity
Guarantees and Capital
Take-over, Recapitalisation
EU countries
Non EU countries
EMU
Candidate/Potential EU
Poland €24bn to support the economy
Czech R. €2.5bn to support the economy
Hungary €8.8bn to government support investment activity and €2.4bn available for banks, after a support of €20bn from IMF/EU/WB
Slovenia €12bn available for banks and ~€0.8bn to support the economy
Romania €13bn in infrastructure, liquidity for banks and support to low income classes, discussion with IMF/EU for more support
Latvia take over of Parex Bank and additional measures, €7.5bn IMF and EU members
Serbia possible €1bn package for the economy and €0.6bn of state guarantees on bank loans to local industry, ~€3.5bn from IMF
Russia anti-crisis package, more than $200bn (12% of GDP), (incl. refinancing of banks’ foreign debt, support to single banks and acquisition of s/m banks) plus further $40bn to specifically support local banks
Ukraine package to reassess banking stability in accordance with IMF(€11.7bn) plus ad hoc support to single banks ($10bn of NBU support, $5bn budgeted by government in 2009 for recapitalization)
Kazakhstan some initiatives (worth as a whole $15 bn), including entry in the capital of the 4 major banks, support to banks’ liquidity, deposit guarantee, support to the mortgage market and other measures
19
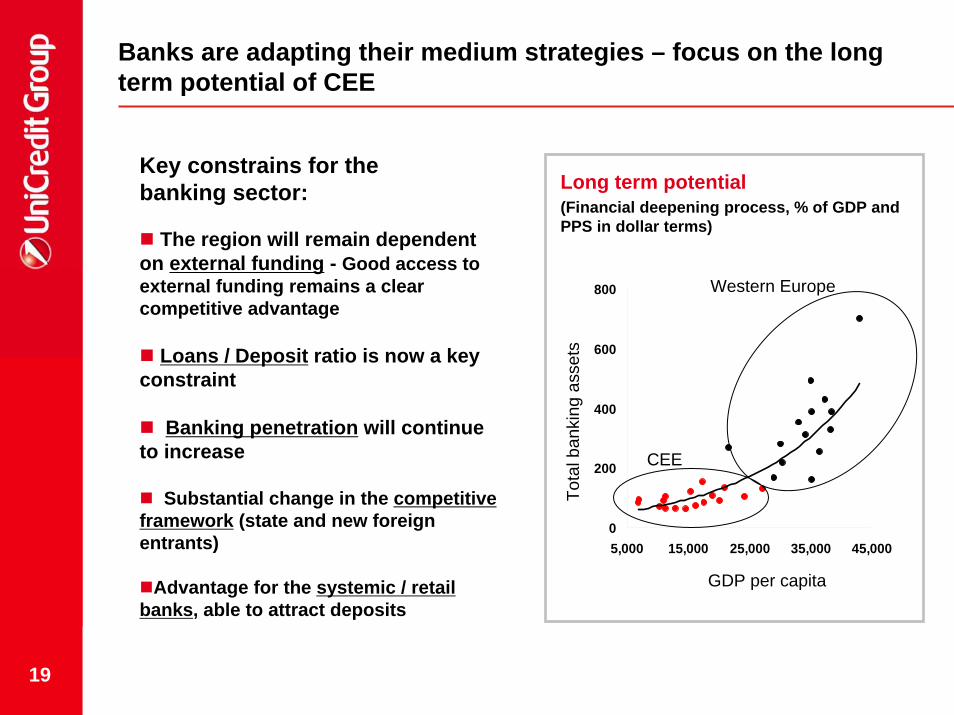
Banks are adapting their medium strategies – focus on the long term potential of CEE
Key constrains for the banking sector:
0
200
400
600
800
5,000 15,000 25,000 35,000 45,000
Long term potential (Financial deepening process, % of GDP and PPS in dollar terms)
GDP per capitaTo
tal b
anki
ng a
sset
s
Western Europe
CEE
The region will remain dependent on external funding - Good access to external funding remains a clear competitive advantage
Loans / Deposit ratio is now a key constraint
Banking penetration will continue to increase
Substantial change in the competitiveframework (state and new foreign entrants)
Advantage for the systemic / retail banks, able to attract deposits
20
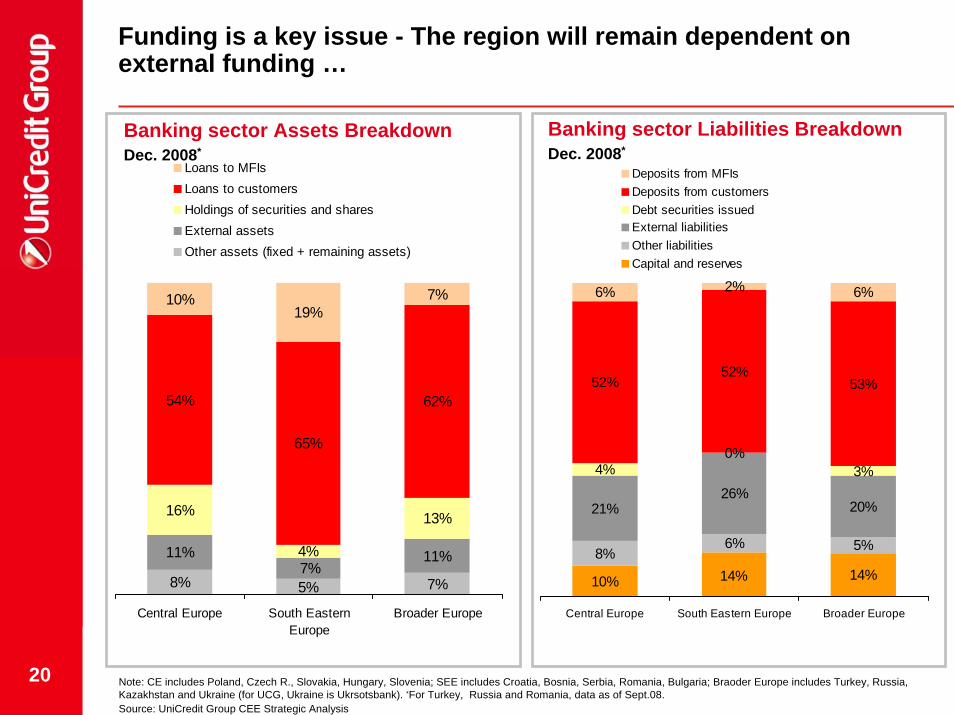
8% 7%
11% 11%
16%
4%
13%
54%
65%
62%
10%19%
7%
5%7%
Central Europe South EasternEurope
Broader Europe
Loans to MFIsLoans to customersHoldings of securities and sharesExternal assetsOther assets (fixed + remaining assets)
10%
8%6% 5%
21%26%
20%
4%0%
3%
52%52%
53%
6% 2% 6%
14% 14%
Central Europe South Eastern Europe Broader Europe
Deposits from MFIsDeposits from customersDebt securities issuedExternal liabilitiesOther liabilitiesCapital and reserves
Banking sector Assets BreakdownDec. 2008*
Banking sector Liabilities BreakdownDec. 2008*
Funding is a key issue - The region will remain dependent on external funding …
Note: CE includes Poland, Czech R., Slovakia, Hungary, Slovenia; SEE includes Croatia, Bosnia, Serbia, Romania, Bulgaria; Braoder Europe includes Turkey, Russia, Kazakhstan and Ukraine (for UCG, Ukraine is Ukrsotsbank). *For Turkey, Russia and Romania, data as of Sept.08.Source: UniCredit Group CEE Strategic Analysis
21
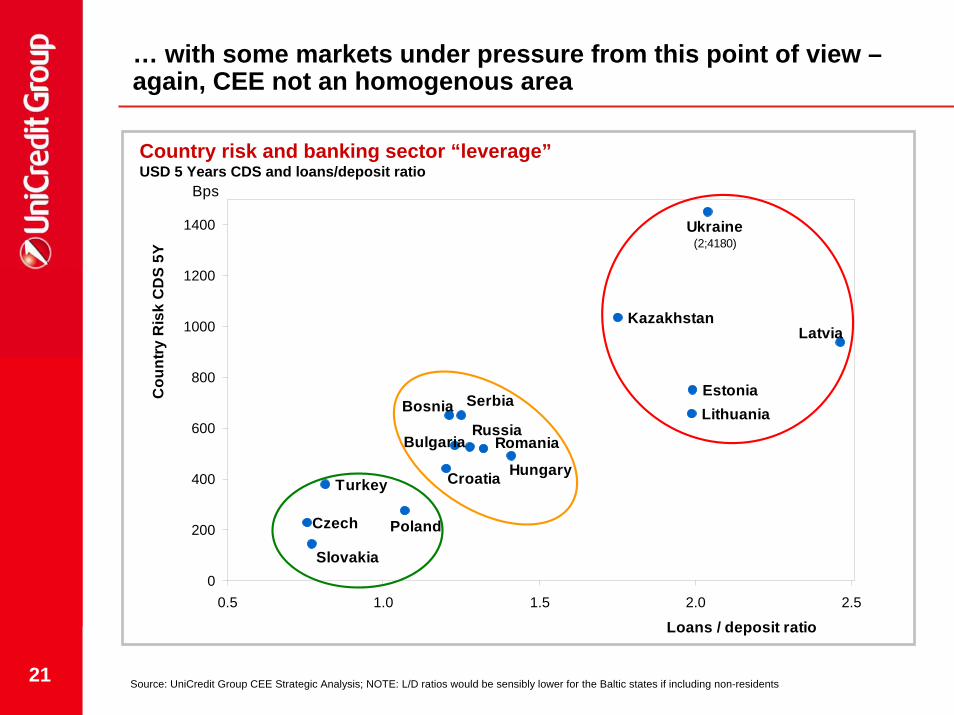
… with some markets under pressure from this point of view –again, CEE not an homogenous area
Bosnia
Kazakhstan
Russia
Ukraine(2;4180)
Turkey
Serbia
Croatia
Bulgaria Romania
Estonia
Latvia
Lithuania
Slovakia
Czech
Hungary
Poland
0
200
400
600
800
1000
1200
1400
0.5 1.0 1.5 2.0 2.5
Bps
Cou
ntry
Ris
k C
DS
5Y
Loans / deposit ratio
Country risk and banking sector “leverage”USD 5 Years CDS and loans/deposit ratio
Source: UniCredit Group CEE Strategic Analysis; NOTE: L/D ratios would be sensibly lower for the Baltic states if including non-residents
22
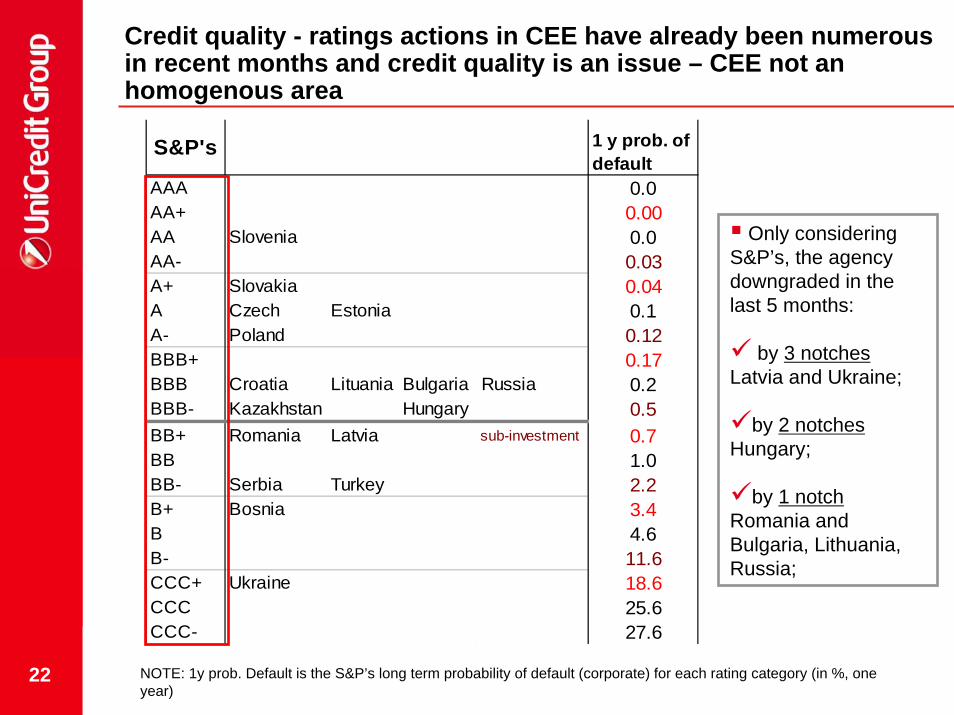
Credit quality - ratings actions in CEE have already been numerous in recent months and credit quality is an issue – CEE not an homogenous area
S&P's 1 y prob. of default
AAA 0.0AA+ 0.00AA Slovenia 0.0AA- 0.03A+ Slovakia 0.04A Czech Estonia 0.1A- Poland 0.12BBB+ 0.17BBB Croatia Lituania Bulgaria Russia 0.2BBB- Kazakhstan Hungary 0.5BB+ Romania Latvia sub-investment 0.7BB 1.0BB- Serbia Turkey 2.2B+ Bosnia 3.4B 4.6B- 11.6CCC+ Ukraine 18.6CCC 25.6CCC- 27.6
Only considering S&P’s, the agency downgraded in the last 5 months:
by 3 notchesLatvia and Ukraine;
by 2 notchesHungary;
by 1 notchRomania and Bulgaria, Lithuania, Russia;
NOTE: 1y prob. Default is the S&P’s long term probability of default (corporate) for each rating category (in %, one year)
23
AGENDA
The global financial crisis and the effects on Central Eastern Europe
The banking sectors in CEE
The challenges for the leasing market
Conclusions
24
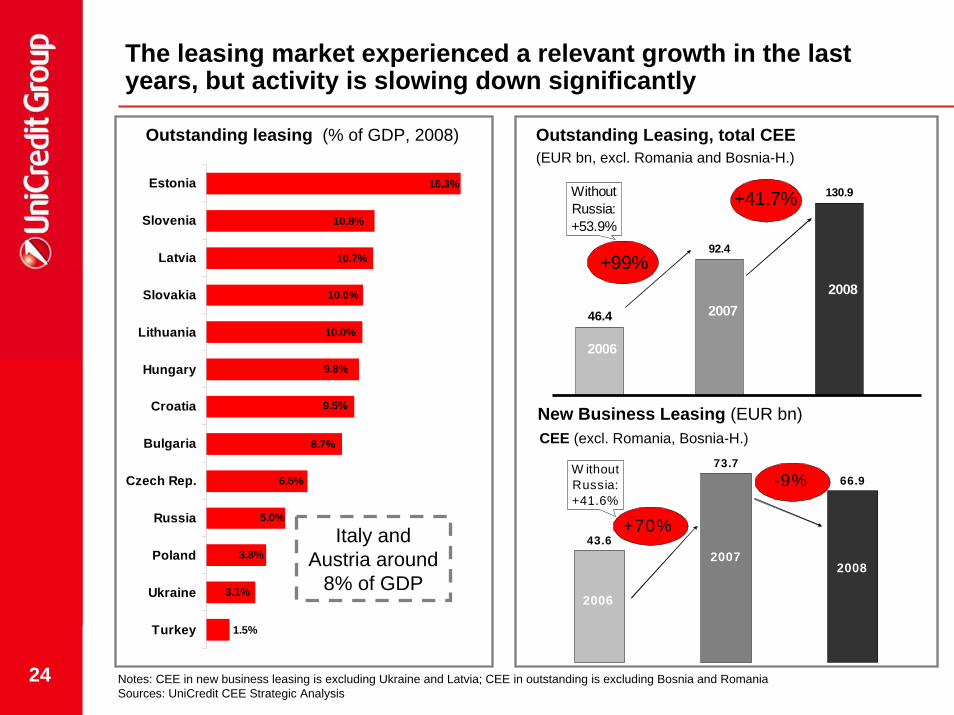
The leasing market experienced a relevant growth in the last years, but activity is slowing down significantly
73.766.9
43.6
2006
20072008
+70%
-9%W ithout Russia: +41.6%
1.5%
3.1%
3.8%
5.0%
6.5%
8.7%
9.5%
9.8%
10.0%
10.0%
10.7%
16.3%
10.8%
Turkey
Ukraine
Poland
Russia
Czech Rep.
Bulgaria
Croatia
Hungary
Lithuania
Slovakia
Latvia
Slovenia
Estonia
92.4
130.9
46.4
2006
20072008
+99%
+41.7%Without Russia: +53.9%
Outstanding Leasing, total CEE(EUR bn, excl. Romania and Bosnia-H.)
CEE (excl. Romania, Bosnia-H.)
Outstanding leasing (% of GDP, 2008)
New Business Leasing (EUR bn)
Italy and Austria around
8% of GDP
Notes: CEE in new business leasing is excluding Ukraine and Latvia; CEE in outstanding is excluding Bosnia and RomaniaSources: UniCredit CEE Strategic Analysis

25
The growth of the leasing business surpassed corporate loans growth in most of the countries – leasing can continue to bridge the gap between investments and banks’ long term loans
0%
10%
20%
30%
40%
50%
60%
70%
80%
Poland
Czech
Slovakia
Slovenia
LithuaniaLatvi
aEsto
niaBulgar
iaCro
atiaTurk
eyUkra
ineRussia CEE
Corporate loans avgGrowth 2007-2008
Leasing OutstandingAvg Growth 2007-2008
Source: UniCredit CEE Strategic analysis
Outstanding Leasing and corporate loansAvg % 2007-’08 growth
Growth of leasing business in EMU area was around 9% nominally
during the last decade
26
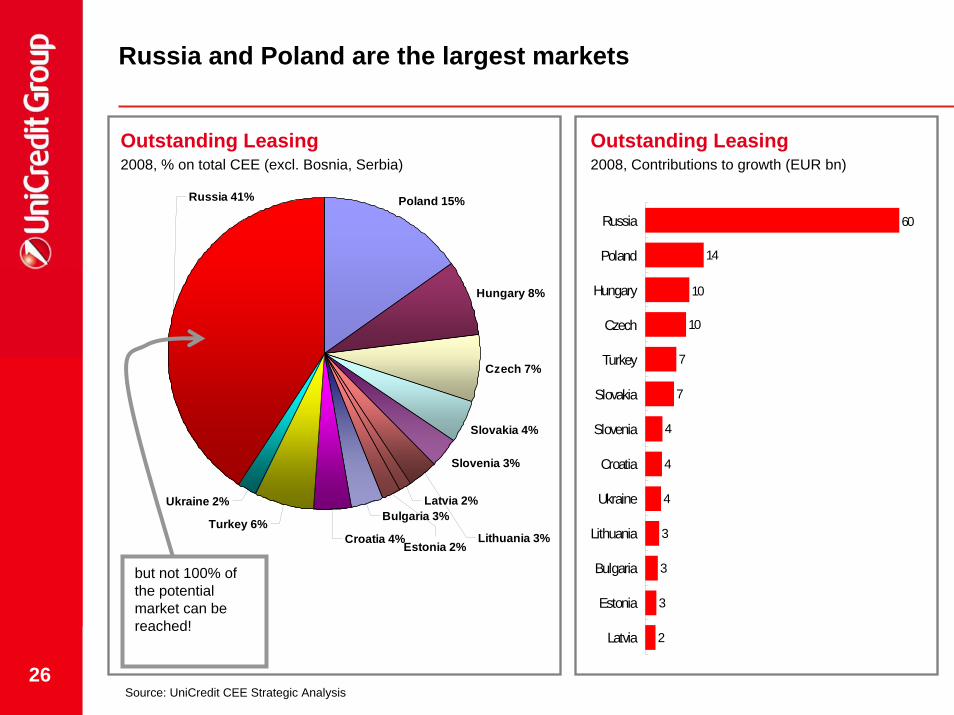
Russia and Poland are the largest markets
2
3
3
3
4
4
4
7
7
10
10
14
60
Latvia
Estonia
Bulgaria
Lithuania
Ukraine
Croatia
Slovenia
Slovakia
Turkey
Czech
Hungary
Poland
Russia
Outstanding Leasing2008, % on total CEE (excl. Bosnia, Serbia)
Outstanding Leasing2008, Contributions to growth (EUR bn)
Poland 15%
Hungary 8%
Czech 7%
Slovakia 4%
Slovenia 3%
Bulgaria 3%
Croatia 4%Turkey 6%
Ukraine 2%
Russia 41%
Estonia 2%
Latvia 2%
Lithuania 3%
but not 100% of the potential market can be reached!
Source: UniCredit CEE Strategic Analysis
27
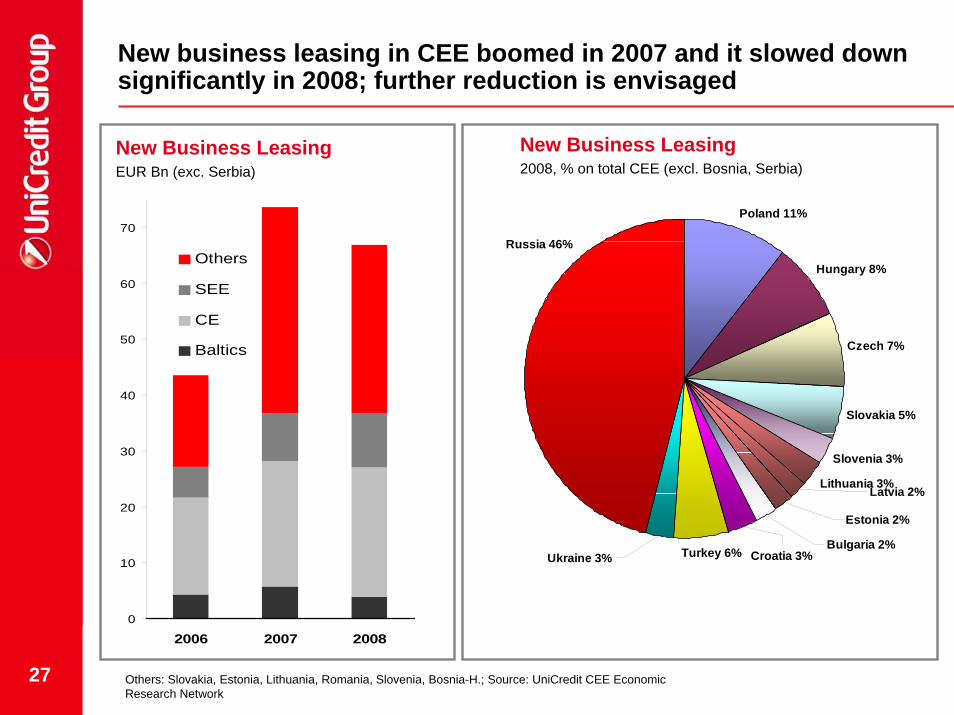
New business leasing in CEE boomed in 2007 and it slowed down significantly in 2008; further reduction is envisaged
New Business LeasingEUR Bn (exc. Serbia)
New Business Leasing2008, % on total CEE (excl. Bosnia, Serbia)
0
10
20
30
40
50
60
70
2006 2007 2008
Others
SEE
CE
Baltics
Poland 11%
Hungary 8%
Czech 7%
Slovakia 5%
Slovenia 3%
Lithuania 3%
Turkey 6%Ukraine 3% Croatia 3%
Russia 46%
Estonia 2%
Latvia 2%
Bulgaria 2%
Others: Slovakia, Estonia, Lithuania, Romania, Slovenia, Bosnia-H.; Source: UniCredit CEE EconomicResearch Network
28
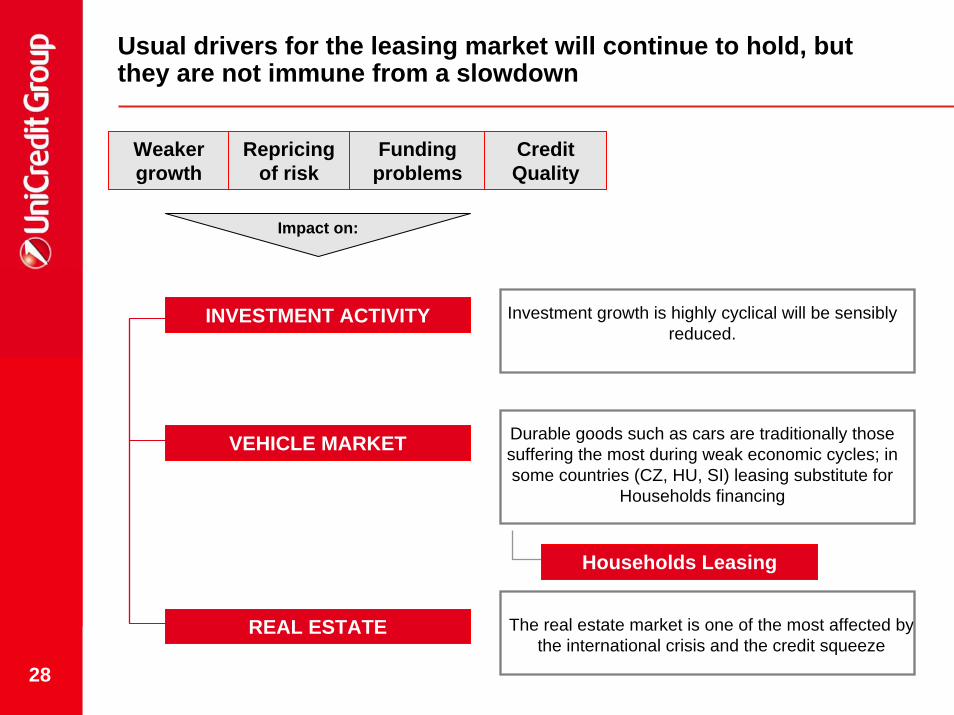
Usual drivers for the leasing market will continue to hold, but they are not immune from a slowdown
Weaker growth
Repricingof risk
Funding problems
Credit Quality
Impact on:
INVESTMENT ACTIVITY
VEHICLE MARKET
REAL ESTATE
Investment growth is highly cyclical will be sensibly reduced.
Durable goods such as cars are traditionally those suffering the most during weak economic cycles; in some countries (CZ, HU, SI) leasing substitute for
Households financing
Households Leasing
The real estate market is one of the most affected by the international crisis and the credit squeeze
29
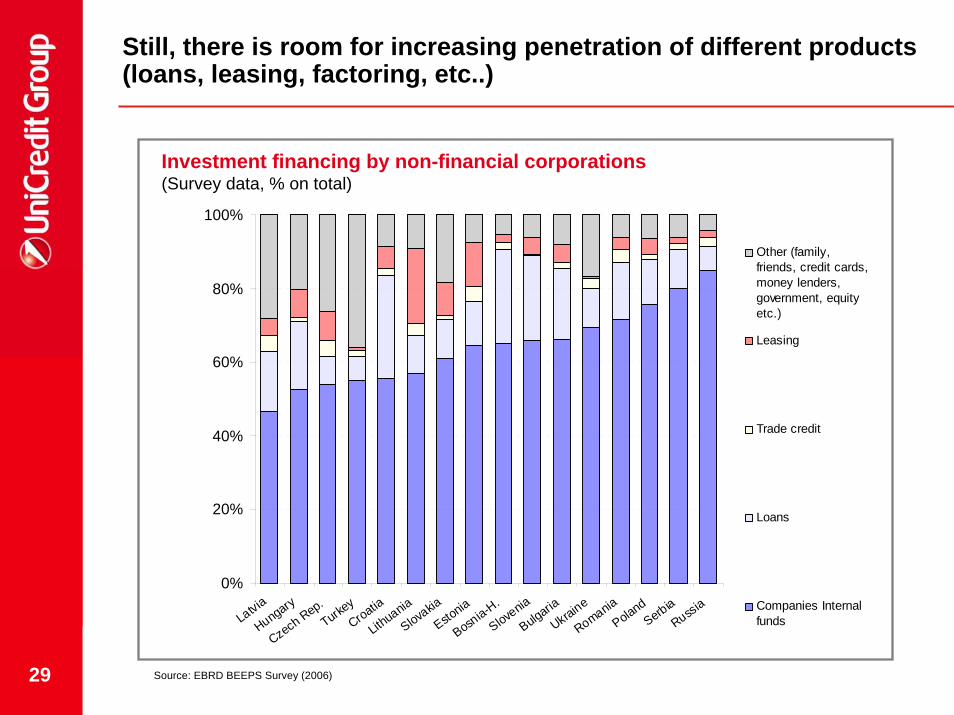
Still, there is room for increasing penetration of different products (loans, leasing, factoring, etc..)
Investment financing by non-financial corporations (Survey data, % on total)
0%
20%
40%
60%
80%
100%
Latvia
Hungary
Czech Rep.Turke
yCroatia
Lithuania
Slovakia
Estonia
Bosnia-H.
Slovenia
Bulgaria
Ukraine
RomaniaPoland
SerbiaRussia
Other (family,friends, credit cards,money lenders,government, equityetc.)
Leasing
Trade credit
Loans
Companies Internalfunds
Source: EBRD BEEPS Survey (2006)
30
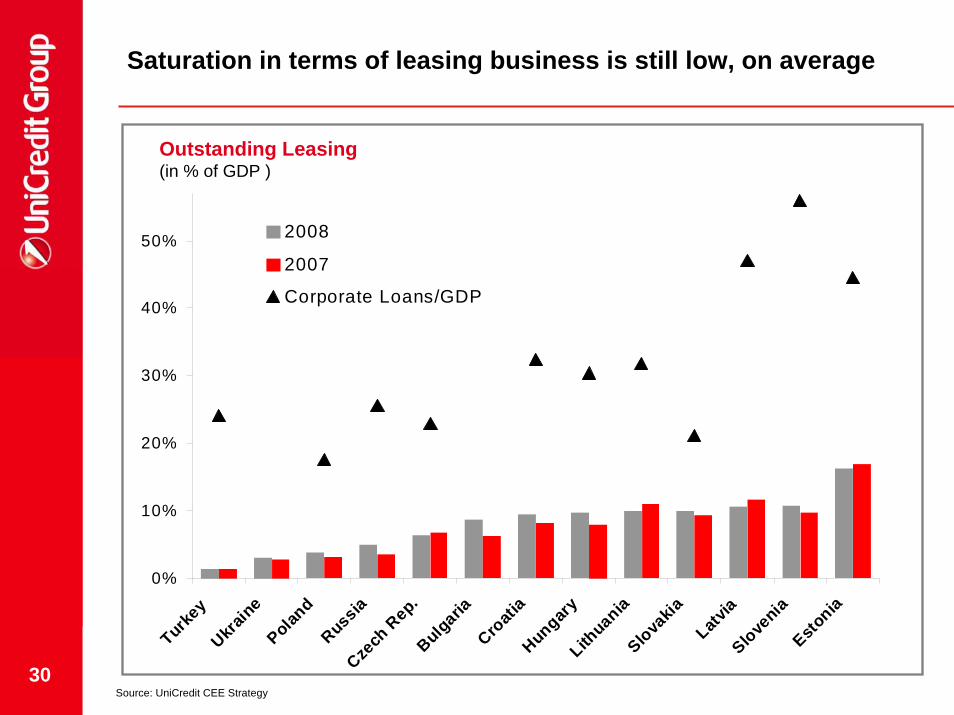
Saturation in terms of leasing business is still low, on average
0%
10%
20%
30%
40%
50%
Turkey
Ukrain
ePolan
dRussia
Czech
Rep.
BulgariaCro
atia
Hungary
Lithuania
Slovakia
Latvia
Slovenia
Estonia
2008
2007
Corporate Loans/GDP
Source: UniCredit CEE Strategy
Outstanding Leasing (in % of GDP )
31
AGENDA
The global financial crisis and the effects on Central Eastern Europe
The banking sectors in CEE
The challenges for the leasing market
Conclusions
32
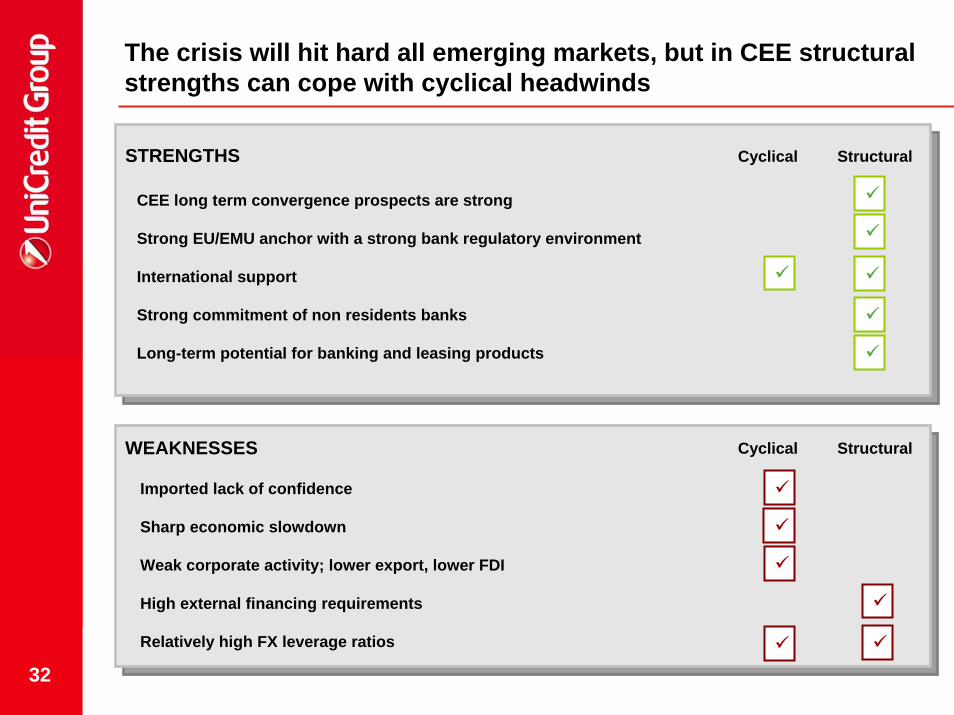
The crisis will hit hard all emerging markets, but in CEE structural strengths can cope with cyclical headwinds
STRENGTHS
CEE long term convergence prospects are strong
Strong EU/EMU anchor with a strong bank regulatory environment
International support
Strong commitment of non residents banks
Long-term potential for banking and leasing products
Cyclical Structural
WEAKNESSES Cyclical Structural
Imported lack of confidence
Sharp economic slowdown
Weak corporate activity; lower export, lower FDI
High external financing requirements
Relatively high FX leverage ratios
33
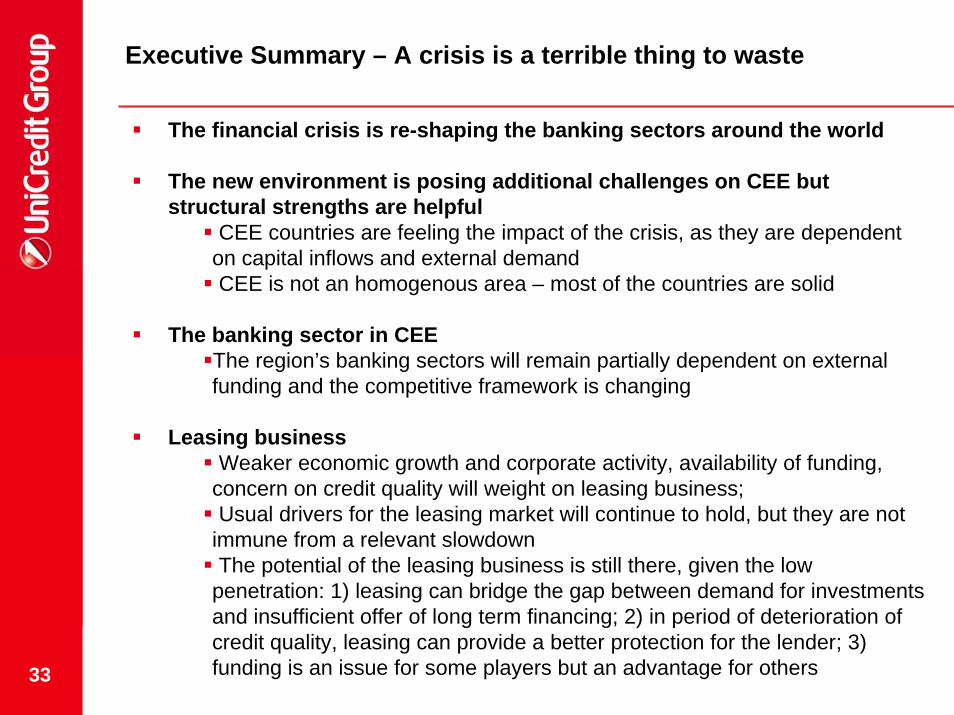
Executive Summary – A crisis is a terrible thing to waste
The financial crisis is re-shaping the banking sectors around the world
The new environment is posing additional challenges on CEE but structural strengths are helpful
CEE countries are feeling the impact of the crisis, as they are dependent on capital inflows and external demandCEE is not an homogenous area – most of the countries are solid
The banking sector in CEE The region’s banking sectors will remain partially dependent on external funding and the competitive framework is changing
Leasing business Weaker economic growth and corporate activity, availability of funding,
concern on credit quality will weight on leasing business; Usual drivers for the leasing market will continue to hold, but they are not
immune from a relevant slowdownThe potential of the leasing business is still there, given the low
penetration: 1) leasing can bridge the gap between demand for investments and insufficient offer of long term financing; 2) in period of deterioration of credit quality, leasing can provide a better protection for the lender; 3) funding is an issue for some players but an advantage for others
34
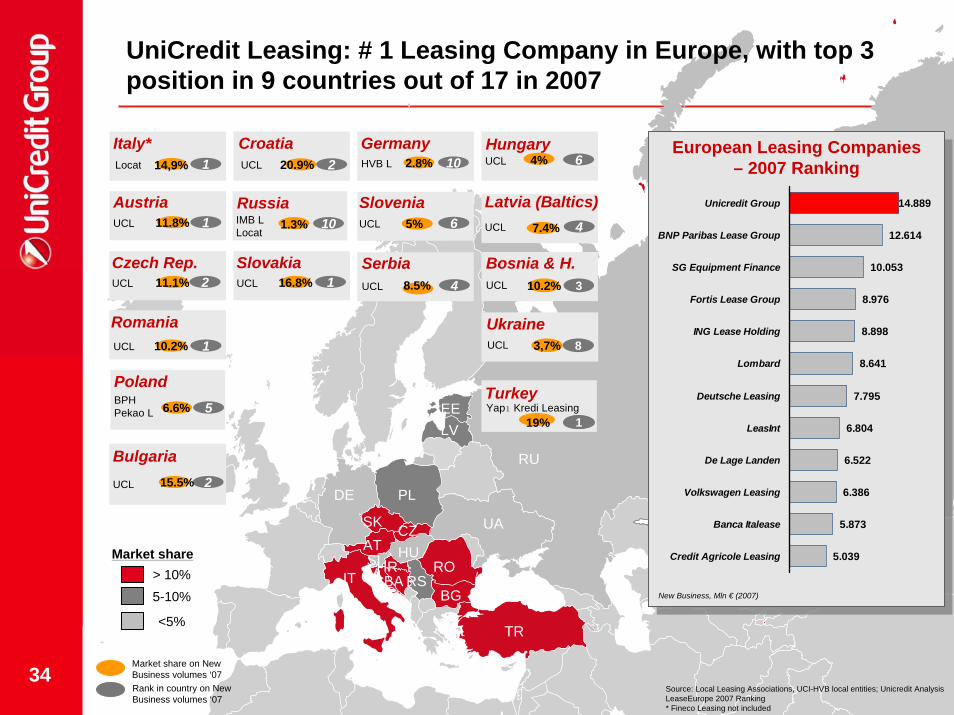
PL
RU
ROIT
SI
TR
DE
ATSK CZ
HUHRBA RS
BG
LVEE
UA
> 10%5-10%
<5%
Market share
Rank in country on New Business volumes ‘07
Market share on New Business volumes ‘07
GermanyHVB L 102.8%
Czech Rep.UCL 211.1%
RomaniaUCL 110.2%
Italy*Locat 114,9%
AustriaUCL 111.8%
RussiaIMB LLocat
101.3%
PolandBPH Pekao L 56.6%
SlovakiaUCL 116.8%
BulgariaUCL 215.5%
Bosnia & H. UCL 10.2% 3
CroatiaUCL 220.9%
Ukraine3,7% 8UCL
Source: Local Leasing Associations, UCI-HVB local entities; Unicredit AnalysisLeaseEurope 2007 Ranking* Fineco Leasing not included
UCL
Slovenia65%
HungaryUCL 64%
SerbiaUCL 48.5%
Latvia (Baltics)UCL 47.4%
TurkeyYapı Kredi Leasing
119%
14.889
12.614
10.053
8.976
8.898
8.641
7.795
6.804
6.522
6.386
5.873
5.039
Unicredit Group
BNP Paribas Lease Group
SG Equipment Finance
Fortis Lease Group
ING Lease Holding
Lombard
Deutsche Leasing
LeasInt
De Lage Landen
Volkswagen Leasing
Banca Italease
Credit Agricole Leasing
European Leasing Companies– 2007 Ranking
New Business, Mln € (2007)
UniCredit Leasing: # 1 Leasing Company in Europe, with top 3 position in 9 countries out of 17 in 2007
36
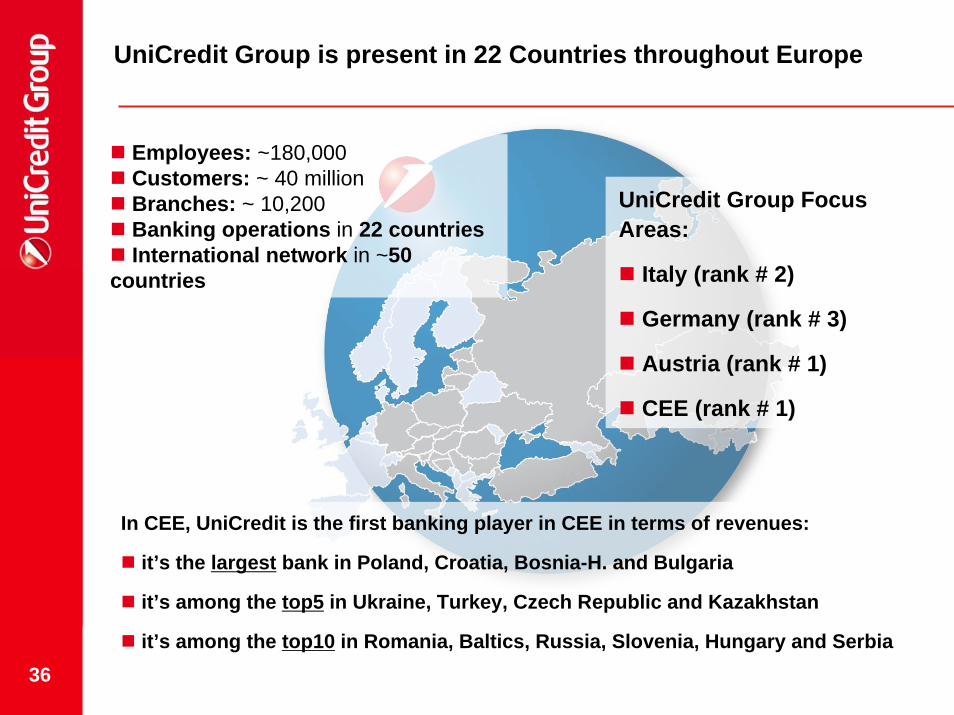
UniCredit Group is present in 22 Countries throughout Europe
In CEE, UniCredit is the first banking player in CEE in terms of revenues:
it’s the largest bank in Poland, Croatia, Bosnia-H. and Bulgaria
it’s among the top5 in Ukraine, Turkey, Czech Republic and Kazakhstan
it’s among the top10 in Romania, Baltics, Russia, Slovenia, Hungary and Serbia
Employees: ~180,000Customers: ~ 40 millionBranches: ~ 10,200Banking operations in 22 countriesInternational network in ~50
countries
UniCredit Group Focus Areas:
Italy (rank # 2)
Germany (rank # 3)
Austria (rank # 1)
CEE (rank # 1)
37
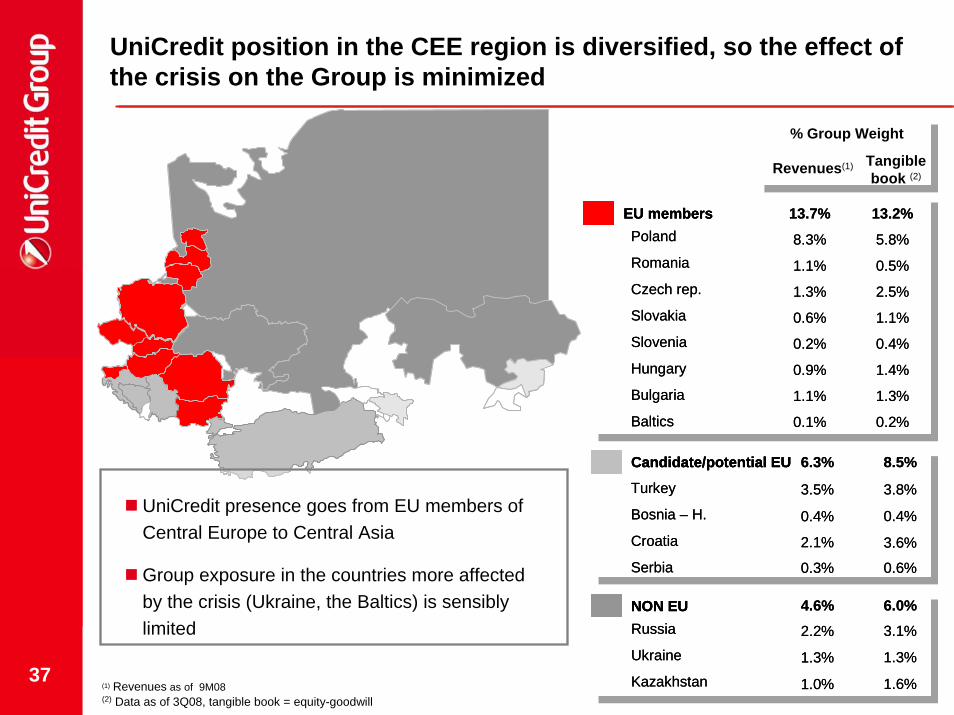
UniCredit position in the CEE region is diversified, so the effect of the crisis on the Group is minimized
UniCredit presence goes from EU members of Central Europe to Central Asia
Group exposure in the countries more affected by the crisis (Ukraine, the Baltics) is sensibly limited
% Group Weight
Revenues(1) Tangiblebook (2)
EU membersPoland
Romania
Czech rep.
Slovakia
Slovenia
Hungary
Bulgaria
Baltics
13.7% 13.2%
8.3% 5.8%
1.1% 0.5%
1.3% 2.5%
0.6% 1.1%
0.2% 0.4%
1.1% 1.3%
0.1% 0.2%
0.9% 1.4%
EU membersEU membersPoland
Romania
Czech rep.
Slovakia
Slovenia
Hungary
Bulgaria
Baltics
13.7% 13.2%
8.3% 5.8%
1.1% 0.5%
1.3% 2.5%
0.6% 1.1%
0.2% 0.4%
1.1% 1.3%
0.1% 0.2%
0.9% 1.4%
Candidate/potential EU
Turkey
Bosnia – H.
Croatia
Serbia
6.3% 8.5%
3.5% 3.8%
0.4% 0.4%
0.3%
3.6%2.1%
0.6%
Candidate/potential EUCandidate/potential EU
Turkey
Bosnia – H.
Croatia
Serbia
6.3% 8.5%
3.5% 3.8%
0.4% 0.4%
0.3%
3.6%2.1%
0.6%
NON EURussia
Ukraine
Kazakhstan
4.6% 6.0%
2.2% 3.1%
1.3% 1.3%
1.0% 1.6%
NON EUNON EURussia
Ukraine
Kazakhstan
4.6% 6.0%
2.2% 3.1%
1.3% 1.3%
1.0% 1.6%(2) Data as of 3Q08, tangible book = equity-goodwill(1) Revenues as of 9M08


