
_______________________________________________________________________________________________© Center for Energy Economics, Bureau of Economic Geology, University of Texas at Austin. All rights reserved. 1
©CEE-BEG-UT, 1
CEE Analytics – Power & GasCEE Annual Meeting, December 6, 2012
©CEE-BEG-UT, 2
Resource Adequacy in Texas
• ERCOT is an energy‐only market
• There is a reserve margin target of 13.75% (was 12.5%)
– ERCOT’s interpretation of “1 load‐shed event in 10 years” is more stringent than “1 day of outage in 10 years”
• After the summer of 2011, a concern has emerged that generation capacity expansion would not keep up with demand growth in the future
• System‐wide offer cap (price cap) was raised to $4,500 (from $3,000) on August 1, 2012; and will increase to $9,000 by 2015.
• We tested impacts of these price caps (AURORAxmp)

_______________________________________________________________________________________________© Center for Energy Economics, Bureau of Economic Geology, University of Texas at Austin. All rights reserved. 2
©CEE-BEG-UT, 3
Departure from normal temperature (F) 8/2/2011 – 8/31/2011
Was this a “once in 100 years” event or more of a new normal?
©CEE-BEG-UT, 4
ERCOT Forecasts of Reserve Margin
2012 CDR Report
2012 Update 1
2012 Update 2
‐2%
0%
2%
4%
6%
8%
10%
12%
14%
16%
18%
20%
22%
2005 2006 2007 2008 2009 2010 2011 2012 2013 2014 2015 2016 2017 2018 2019 2020 2021 2022
Target Reserve Margin 2005 CDR Report 2006 CDR Report
2007 CDR Report 2008 CDR Report 2009 CDR Report
2010 CDR Report 2011 CDR Report Realized Reserve Margins
2012 CDR Report 2012 Update 1 2012 Update 2
2012 Update 1: de‐mothballed units2012 Update 2: de‐mothballed units, lower demand growth, new resources
_______________________________________________________________________________________________© Center for Energy Economics, Bureau of Economic Geology, University of Texas at Austin. All rights reserved. 3
©CEE-BEG-UT, 5
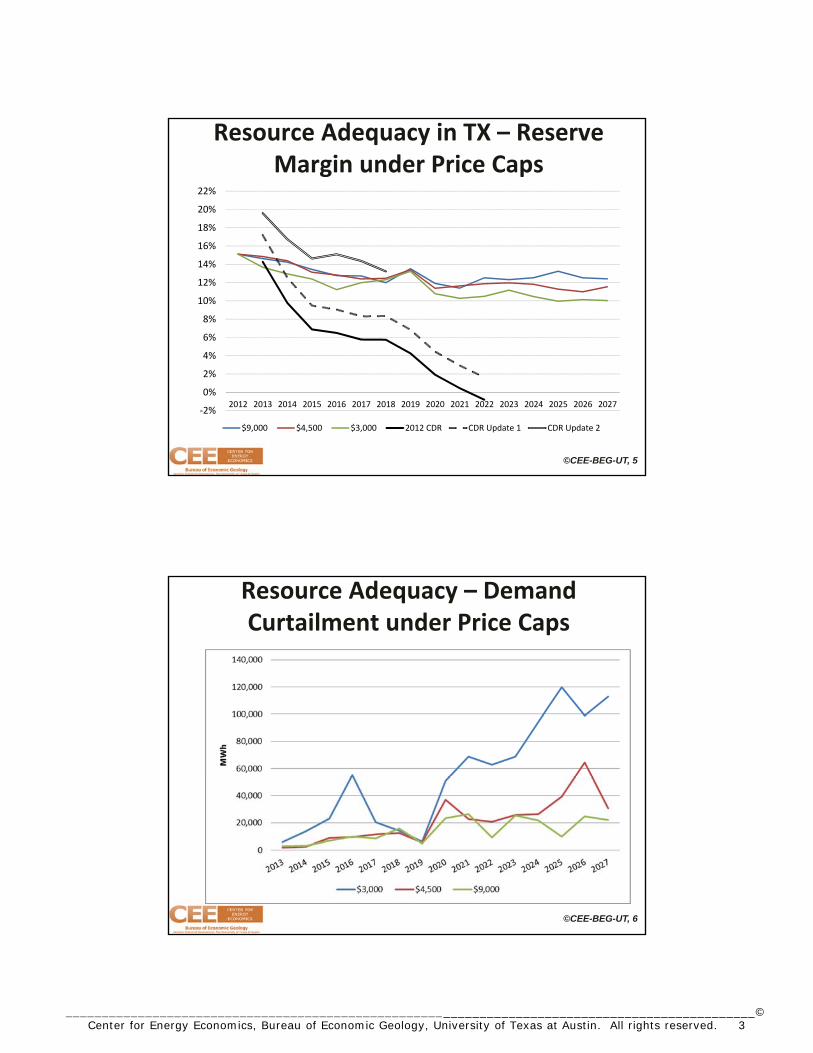
Resource Adequacy in TX – Reserve Margin under Price Caps
‐2%
0%
2%
4%
6%
8%
10%
12%
14%
16%
18%
20%
22%
2012 2013 2014 2015 2016 2017 2018 2019 2020 2021 2022 2023 2024 2025 2026 2027
$9,000 $4,500 $3,000 2012 CDR CDR Update 1 CDR Update 2
©CEE-BEG-UT, 6
Resource Adequacy – Demand Curtailment under Price Caps

_______________________________________________________________________________________________© Center for Energy Economics, Bureau of Economic Geology, University of Texas at Austin. All rights reserved. 4
©CEE-BEG-UT, 7
Resource Adequacy – Average Wholesale Price of Electricity (nominal)
©CEE-BEG-UT, 8
Conclusions
• On average, the reserve margin will be highest under the $9,000 price cap
– 12.8%, 12.4%, 11.4% for $9,000, $4,500 and $3,000, respectively (but lower than 13.75% target RM).
• The 15‐year (2013‐2027) average nominal price is roughly the same for all 3 scenarios
– In real terms, prices > average prices since 2009 but similar to prices seen before 2009 because they reflect an increase in natural gas price from its lows in 2009‐2012.
• Curtailment is highest with $3,000 cap & increases over time while it is low and fairly stable with $9,000 cap.
_______________________________________________________________________________________________© Center for Energy Economics, Bureau of Economic Geology, University of Texas at Austin. All rights reserved. 5
©CEE-BEG-UT, 9
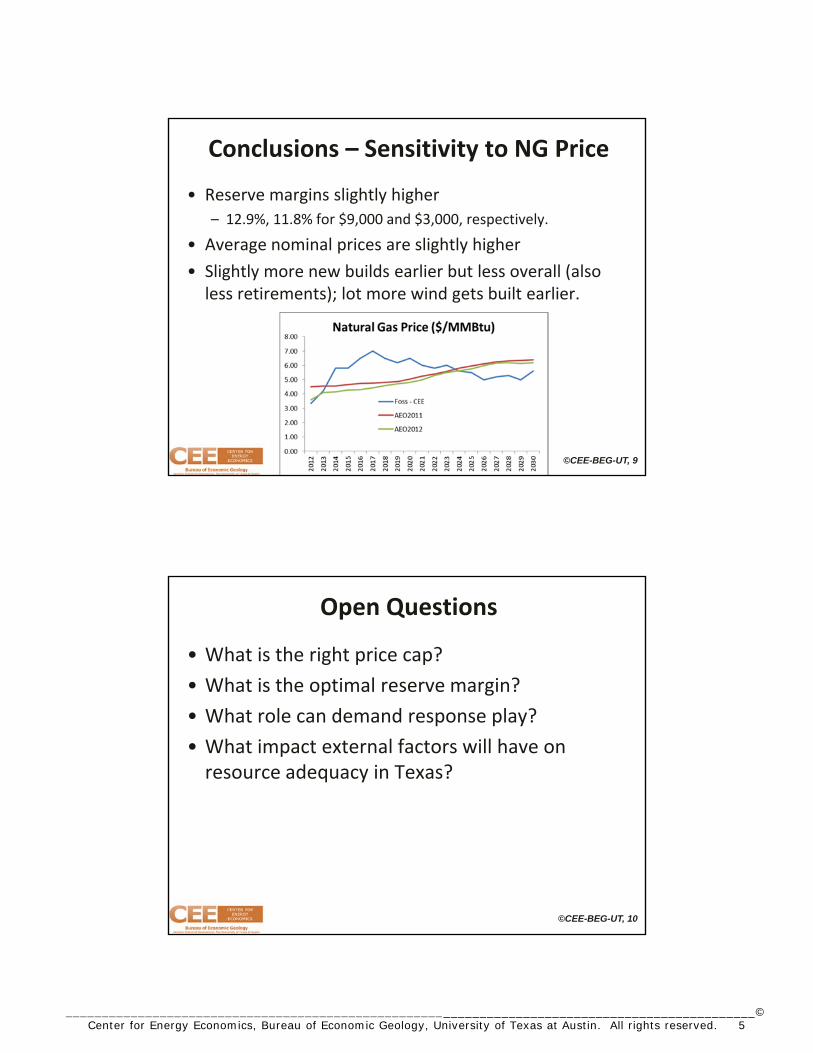
Conclusions – Sensitivity to NG Price
• Reserve margins slightly higher
– 12.9%, 11.8% for $9,000 and $3,000, respectively.
• Average nominal prices are slightly higher
• Slightly more new builds earlier but less overall (also less retirements); lot more wind gets built earlier.
©CEE-BEG-UT, 10
Open Questions
• What is the right price cap?
• What is the optimal reserve margin?
• What role can demand response play?
• What impact external factors will have on resource adequacy in Texas?
_______________________________________________________________________________________________© Center for Energy Economics, Bureau of Economic Geology, University of Texas at Austin. All rights reserved. 6
©CEE-BEG-UT, 11
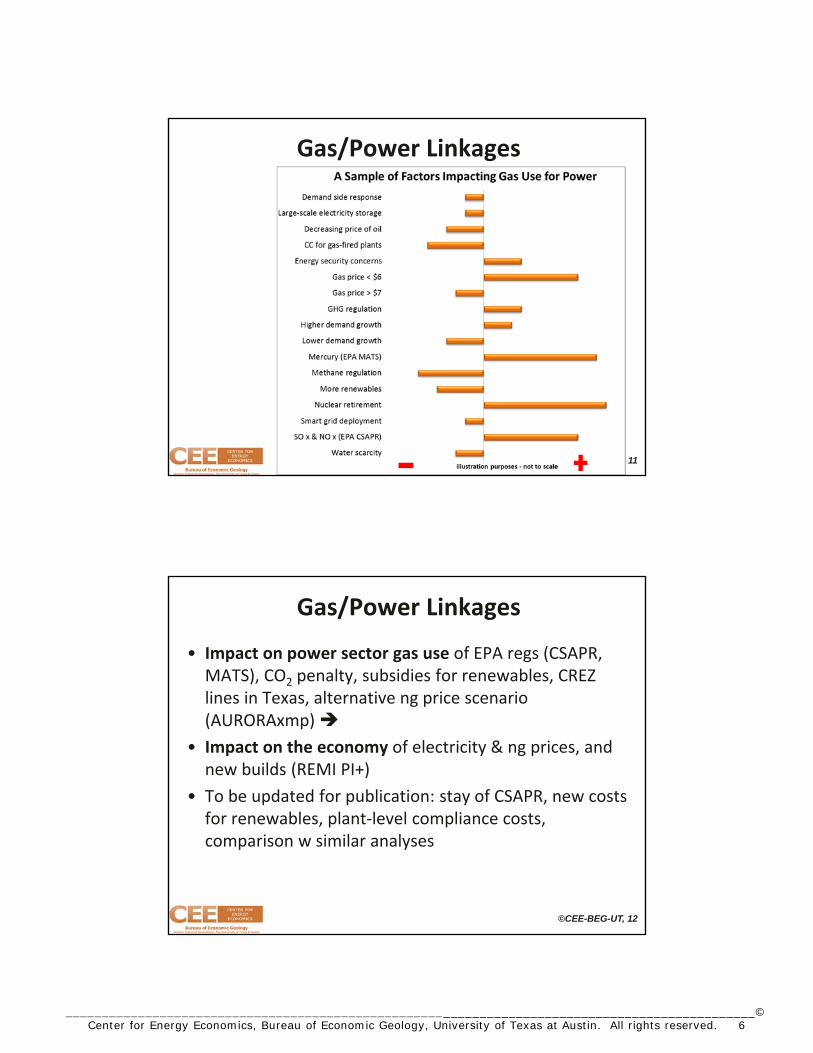
Gas/Power Linkages
©CEE-BEG-UT, 12
Gas/Power Linkages
• Impact on power sector gas use of EPA regs (CSAPR, MATS), CO2 penalty, subsidies for renewables, CREZ lines in Texas, alternative ng price scenario (AURORAxmp)
• Impact on the economy of electricity & ng prices, and new builds (REMI PI+)
• To be updated for publication: stay of CSAPR, new costs for renewables, plant‐level compliance costs, comparison w similar analyses

_______________________________________________________________________________________________© Center for Energy Economics, Bureau of Economic Geology, University of Texas at Austin. All rights reserved. 7
©CEE-BEG-UT, 13
Gas/Power Linkages
• Joint modeling of multiple factors with AURORAxmp
– EPA CSAPR for NOX and SO2
– EPA MACT/MATS for mercury & other hazardous pollutants
– CO2 ($14/t in 2018 to $40/t in 2030)
– Renewable incentives ($15/MWh to $30/MWh)
– Natural gas price cycle
– CREZ transmission addition in ERCOT
©CEE-BEG-UT, 14
Natural Gas Price InputsCEE gas upstream
economics research

_______________________________________________________________________________________________© Center for Energy Economics, Bureau of Economic Geology, University of Texas at Austin. All rights reserved. 8
©CEE-BEG-UT, 15
Increase in Gas Use for Power ‐ Results from A Modeling Exercise*
0
1
2
3
4
5
6
7
8
9
2030
Quad
s
Nuclear shutdowns
Change in Gas Price Forecast
CSAPR / Other Coal Risk
*See U.S. Gas‐Power Linkages: Building Future Views for details: http://www.beg.utexas.edu/energyecon/thinkcorner/Think%20Corner%20Gas‐
Power%20Linkages.pdf
©CEE-BEG-UT, 16
Emission Regulations Force Coal Retirements
• Over 50 GW retire by 2030. Most occur before 2020 ‐~40GW (consistent with current predictions).
_______________________________________________________________________________________________© Center for Energy Economics, Bureau of Economic Geology, University of Texas at Austin. All rights reserved. 9
©CEE-BEG-UT, 17
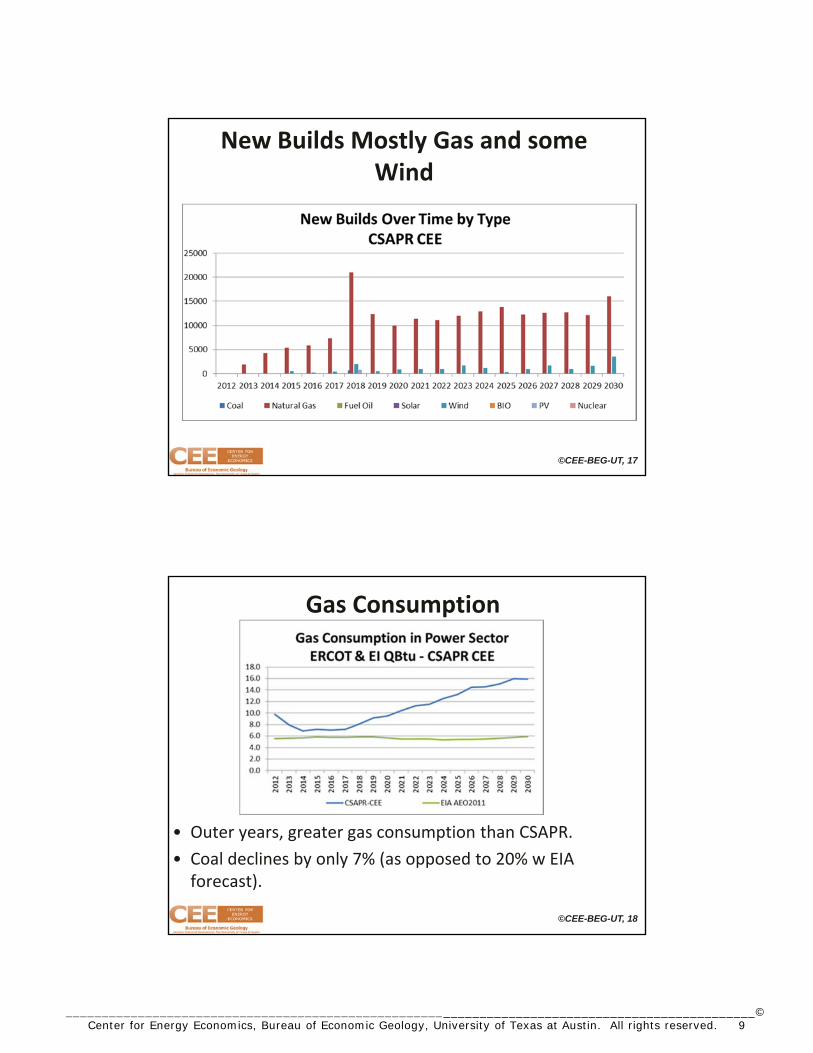
New Builds Mostly Gas and some Wind
©CEE-BEG-UT, 18
Gas Consumption
• Outer years, greater gas consumption than CSAPR.
• Coal declines by only 7% (as opposed to 20% w EIA forecast).
_______________________________________________________________________________________________© Center for Energy Economics, Bureau of Economic Geology, University of Texas at Austin. All rights reserved. 10
©CEE-BEG-UT, 19
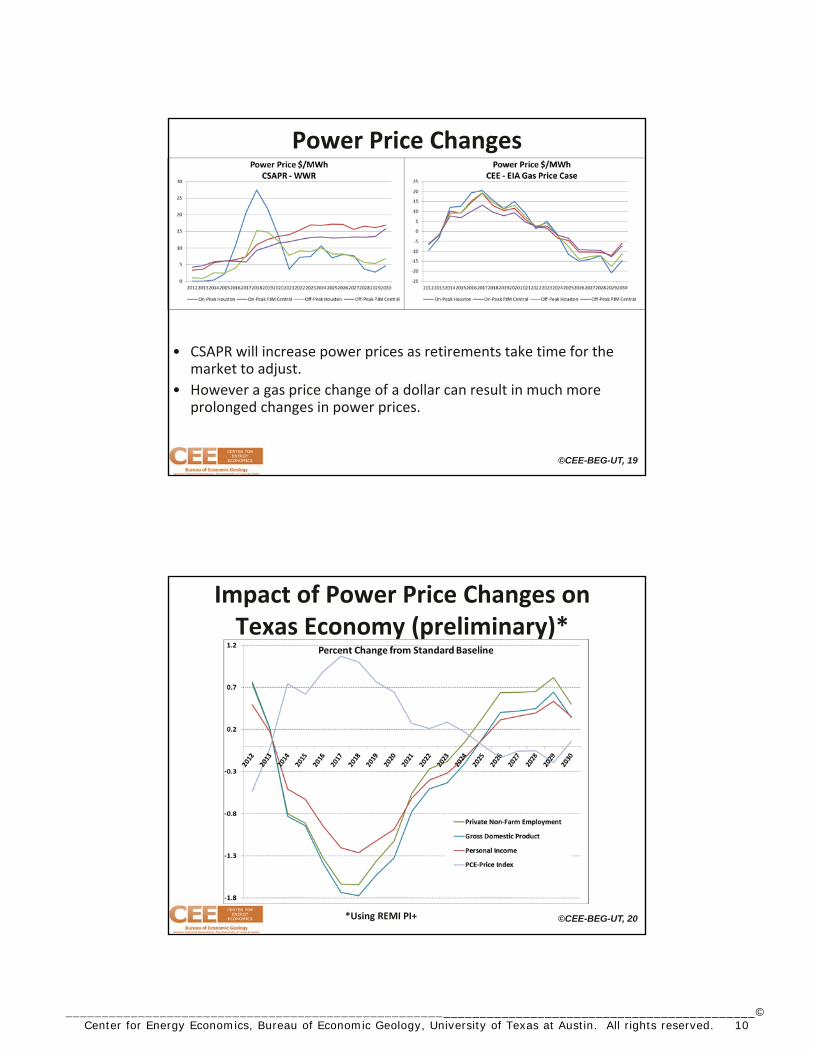
Power Price Changes
• CSAPR will increase power prices as retirements take time for the market to adjust.
• However a gas price change of a dollar can result in much more prolonged changes in power prices.
©CEE-BEG-UT, 20
Impact of Power Price Changes on Texas Economy (preliminary)*
*Using REMI PI+
_______________________________________________________________________________________________© Center for Energy Economics, Bureau of Economic Geology, University of Texas at Austin. All rights reserved. 11
©CEE-BEG-UT, 21
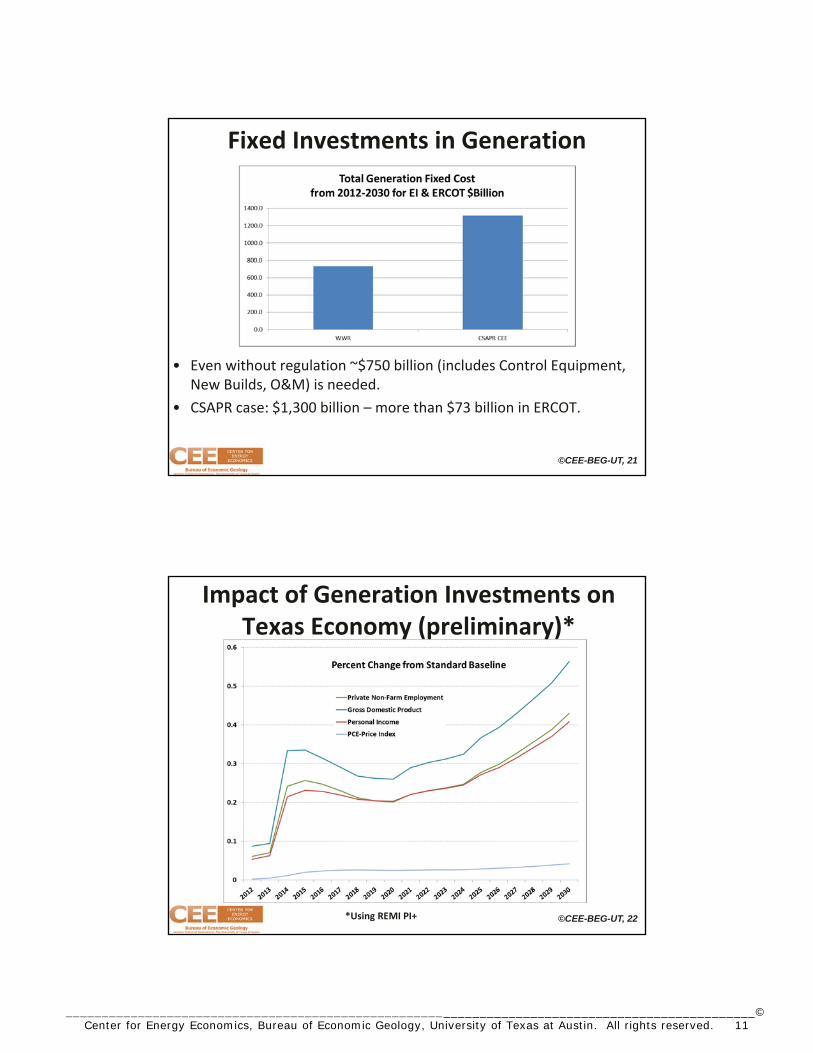
Fixed Investments in Generation
• Even without regulation ~$750 billion (includes Control Equipment, New Builds, O&M) is needed.
• CSAPR case: $1,300 billion – more than $73 billion in ERCOT.
©CEE-BEG-UT, 22
Impact of Generation Investments on Texas Economy (preliminary)*
*Using REMI PI+

_______________________________________________________________________________________________© Center for Energy Economics, Bureau of Economic Geology, University of Texas at Austin. All rights reserved. 12
©CEE-BEG-UT, 23
Combined Economic Impact (preliminary)*
*Using REMI PI+
©CEE-BEG-UT, 24
CREZ and Renewable Incentives
• CREZ by itself does not lead to new renewables capacity.
• CREZ with high subsidies will result in more renewables.
• Coincidentally, renewable builds start when CO2 prices are introduced.


