RESEARCH Open Access
Categorization of species based on theirmicroRNAs employing sequence motifs,information-theoretic sequence featureextraction, and k-mersMalik Yousef1* , Dawit Nigatu2, Dalit Levy1, Jens Allmer3,4 and Werner Henkel2
Abstract
Background: Diseases like cancer can manifest themselves through changes in protein abundance, and microRNAs(miRNAs) play a key role in the modulation of protein quantity. MicroRNAs are used throughout all kingdoms andhave been shown to be exploited by viruses to modulate their host environment. Since the experimental detectionof miRNAs is difficult, computational methods have been developed. Many such tools employ machine learning forpre-miRNA detection, and many features for miRNA parameterization have been proposed. To train machine learningmodels, negative data is of importance yet hard to come by; therefore, we recently started to employ pre-miRNAs fromone species as positive data versus another species’ pre-miRNAs as negative examples based on sequence motifs andk-mers. Here, we introduce the additional usage of information-theoretic (IT) features.
Results: Pre-miRNAs from one species were used as positive and another species’ pre-miRNAs as negative training datafor machine learning. The categorization capability of IT and k-mer features was investigated. Both feature sets and theircombinations yielded a very high accuracy, which is as good as the previously suggested sequence motif and k-merbased method. However, for obtaining a high performance, a sufficiently large phylogenetic distance between thespecies and sufficiently high number of pre-miRNAs in the training set is required. To examine the contribution of the ITand k-mer features, an information gain-based feature ranking was performed. Although the top 3 are IT features, 80%of the top 100 features are k-mers. The comparison of all three individual approaches (motifs, IT, and k-mers) shows thatthe distinction of species based on their pre-miRNAs k-mers are sufficient.
Conclusions: IT sequence feature extraction enables the distinction among species and is less computationally expensivethan motif calculations. However, since IT features need larger amounts of data to have enough statistics for producinghighly accurate results, future categorization into species can be effectively done using k-mers only. The biologicalreasoning for this is the existence of a codon bias between species which can, at least, be observed in exonic miRNAs.Future work in this direction will be the ab initio detection of pre-miRNA. In addition, prediction of pre-miRNAfrom RNA-seq can be done.
Keywords: MicroRNA, Sequence motifs, Pre-microRNA, Machine learning, Differentiate miRNAs among species,k-mer, miRNA categorization, Information theory
* Correspondence: [email protected] Information Systems, Zefat Academic College, 13206 Zefat,IsraelFull list of author information is available at the end of the article
EURASIP Journal on Advancesin Signal Processing
© The Author(s). 2017 Open Access This article is distributed under the terms of the Creative Commons Attribution 4.0International License (http://creativecommons.org/licenses/by/4.0/), which permits unrestricted use, distribution, andreproduction in any medium, provided you give appropriate credit to the original author(s) and the source, provide a link tothe Creative Commons license, and indicate if changes were made.
Yousef et al. EURASIP Journal on Advances in Signal Processing (2017) 2017:70 DOI 10.1186/s13634-017-0506-8
1 IntroductionProteins define a phenotype, and their dysregulationoften leads to a disease. Protein abundance is highlyregulated, and microRNAs are responsible for itspost-transcriptional modulation. Mature microRNAs(miRNAs), which act as recognition sequences fortheir target messenger RNAs, are produced from amolecular pathway which is different for plants andanimals [1]. They have in common that pri-miRNAsare transcribed from the genome and that hairpins(pre-miRNAs) are excised from these transcripts. Eachpre-miRNA can have multiple mature miRNAs (18–24nucleotides in length) which are incorporated into a pro-tein complex, responsible for modulating the translationefficiency of multiple targets. MicroRNAs have beenshown to exist in a variety of species ranging from viruses[2] to plants [3]. MicroRNAs need to be co-expressed withtheir targets [4] in order to be functional, and many tran-scripts in an organism are only produced in response tointernal or external stresses. Thus, it may not be possibleto experimentally determine all miRNAs, their targets,and their interactions. Computational approaches todetect miRNAs have been developed to overcome thelimitation, and most methods for pre-miRNA detectionare based on machine learning [5–7]. With the exceptionof few approaches based on one class classification [8–10],most methods rely on two class classification. While allparts contributing to model establishment are important[11], the selection of negative data is crucial since no goldstandard is available. Although other databases likemiRTarBase [12], TarBase [13], and MirGeneDB [14] areavailable, positive data is generally derived from miRBase[15]. While negative data is of unknown quality, also positivedata from miRBase contains questionable entries [14, 16]and even MirGeneDB which filters miRBase entries is notfree from questionable examples [17].Parameterization of pre-miRNAs is important for ap-
plying machine learning algorithms, and numerous fea-tures have been proposed [18]. Short sequences (k-mers)have been used early on for the machine learning-basedab initio detection of pre-miRNAs [19]. Since miRNAgenesis depends on a pathway involving several proteincomplexes, structural features of pre-miRNAs have beenfound to be important [20]. Additionally, we haverecently established the use of sequence motifs asfeatures enabling the detection of pre-miRNAs [21, 22].Many machine learning models for pre-miRNA detectionhave been established using a variety of learning algo-rithms and training schemes [23–26]. All the establishedmodels suffer from the selection of arbitrary examples forthe negative class. Gao and colleagues [27], for example,reasoned that exons and other non-coding RNAs wouldbe useful as negative data, but miRNAs can be derivedfrom anywhere in the genome, including exons [28].
Due to the unknown quality of the negative data, ina previous work, we successfully used the one-classclassification approach for the detection of pre-miRNAs[29, 30]. However, we realized that using positive examplesto represent the negative class from different species holdsa number of promises [31]. One of the promises is that itenables the categorization of pre-miRNAs into species.Hairpins can be structurally classified fairly well, andmany approaches are available despite data quality issues[32–35]. Categorization of the identified pre-miRNAs intotheir species of origin or a very closely related one adds afurther line of evidence to their identification. Weestablished random forest machine learning models usingtwo-class classification with the positive class being pre-miRNAs from one species and the negative pre-miRNAsfrom a different species. Therefore, both positive andnegative classes for training and testing were derived fromknown pre-miRNAs, effectively removing the need forpseudo negative data. We have previously proposed thesame strategy [31] using sequence motifs and k-mers. Inthis study, we further introduced information-theoreticapproaches and important additional analyses. In ourprevious work, we showed that discrimination amongmiRNAs from different species is possible which is likelydue to alleged fast evolution for some miRNAs [36–38],supporting the possibility to differentiate among evolu-tionary distant species based on miRNAs. We thenfocused on sequence motifs since structure is evolutionarilymore conserved than sequence. Due to the large impact ofk-mers on the categorization in our previous work, in anattempt to add more discriminating power, here, we addedinformation theory (IT)-based features. Apart from our pre-vious study [31], only Lopes and colleagues attempted touse pre-miRNAs to discriminate between species [33].However, they resorted to establishing ab initio pre-miRNAdetection models with the same bias on negative data asexisting pre-miRNA detection methods [26, 39–42]; usingthe same training and testing strategies [32, 42–44]. Fur-thermore, a large part of the features they used assessesstructural features of pre-miRNAs, which poses problemswhen analyzing closely related species since structure ismore conserved than sequence. In this work, we analyzedthe discriminative power of sequence motifs, information-theoretic quantities, and k-mers for the categorization ofpre-miRNAs into species. It became clear that k-mers alonecan separate between species that are not strongly related.We also showed that the number of examples is importantfor the establishment of suitable machine learning models.If enough examples are not available for a species, a modelcan be established for the next higher level (genus), whichmay even outperform all species-based models. Sincesequence motifs and IT features are computationally expen-sive compared to k-mers, it would be extremely difficult toestablish models for all pairs of species for automatic
Yousef et al. EURASIP Journal on Advances in Signal Processing (2017) 2017:70 Page 2 of 10
categorization. However, since we were able to showthat k-mers have enough discriminative power, auto-matic species categorization will become possible in thefuture. All in all, this work not only provides an import-ant additional line of evidence for detecting pre-miRNAs but is also useful for studies depending ondeep sequencing data which often contains contami-nated sequences [45].
2 Methods2.1 DatasetsAll data were downloaded from miRBase [46] Release 21.From the family Hominidae (3629 hairpins), Gorilla gorilla(ggo, 352), Homo sapiens (has, 1881), Pan paniscus (ppa,88), Pongo pygmaeus (ppy, 642), Pan troglodytes (ptr, 655),and Symphalangus syndactylus (ssy, 11) were acquired.From the clade Nematoda (1856 hairpins), 10 specieswere downloaded: Ascaris suum (asu, 97), Brugiamalayi (bma, 115), Caenorhabditis brenneri (cbn, 214),Caenorhabditis briggsae (cbr, 175), Caenorhabditiselegans (cel, 250), Caenorhabditis remanei (crm, 157),Haemonchus contortus (hco, 188), Pristionchus pacificus(ppc, 354), Panagrellus redivivus (prd, 200), and Stron-gyloides ratti (str, 106). From the clade which miRBasestill calls pisces (1623 hairpins), the following species’ datahairpins were attained: Cyprinus carpio (ccr, 134), Daniorerio (dre, 346), Fugu rubripes (fru, 131), Hippoglossushippoglossus (hhi, 40), Ictalurus punctatus (ipu, 281), Ory-zias latipes (ola, 168), Paralichthys olivaceus (pol, 20),Salmo salar (ssa, 371), and Tetraodon nigroviridis (tni,132). Finally, from the group of hexapoda (3119 hairpins),Aedes aegypti (aae, 101), Anopheles gambiae (aga, 66),Apis mellifera (ame, 254), Acyrthosiphon pisum (api, 123),Bombyx mori (bmo, 487), Culex quinquefasciatus (cpu,74), Drosophila ananassae (dan, 76), Drosophila erecta(der, 81), Drosophila grimshawi (dgr, 82), Drosophila mela-nogaster (dme, 256), Drosophila mojavensis (dmo, 71),Drosophila persimilis (dpe, 75), Drosophila pseudoobscura(dps, 210), Drosophila sechellia (dse, 78), Drosophila simu-lans (dsi, 135), Drosophila virilis (dvi, 134), Drosophilawillistoni (dwi, 77), Drosophila yakuba (dya, 76), Helico-nius melpomene (hme, 92), Locusta migratoria (lmi, 7),Manduca sexta (mse, 98), Nasonia giraulti (ngi, 32),Nasonia longicornis (nlo, 28), Nasonia vitripennis (nvi,53), Plutella xylostella (pxy, 133), and Tribolium casta-neum (tca, 220). In addition to these data, several cladesfrom miRBase (e.g., the fabaceae dataset consisting ofAcacia auriculiformis, Arachis hypogaea, Acacia man-gium, Glycine max, Glycine soja, Lotus japonicus,Medicago truncatula, Phaseolus vulgaris, and Vignaunguiculata with a total of about 1400 pre-miRNAs)were used by combining all the hairpins of the spe-cies within the clade.
All hairpins were filtered for sequence similarity as inYousef et al. [31] before training machine learningmodels using the Usearch tool [47].
2.2 Parameterization of pre-miRNAsIn order to allow the application of machine learning,biological features need to be translated into mathemat-ical parameters. It is our hypothesis that structural andthermodynamic features which have previously beendescribed [18] are evolutionarily more conserved thansequence features. Therefore, only sequence-basedfeatures were used for parameterization in this study.Sequence motifs (200) as in [31] were used as well as 84k-mers and their information-theoretic transformations(91). In the following, the parameters used in this studyare detailed.
2.3 k-mer featuresMany studies performing pre-miRNA detection basedon machine learning include simple sequence-basedfeatures. These features are words, k-mers, or n-grams,all of which describe a short sequence of nucleotides.Here, we use k-mers to describe a short nucleotidesequence of length k. For example, a 1-mer over thealphabet {A, U, C, G} can produce the words A, U, C,and G; a 2-mer can generate AA, AC, …, UU, and a 3-mer leads to 64 short nucleotide sequences ranging fromAAA to UUU. Higher k have also been used [48], buthere, we chose 1-, 2-, and 3-mers as features. The k-mercounts in a given sequence were normalized by the totalnumber of k-mers in the sequence (i.e., len(sequence)− k + 1)[49]. Hence, for k-mers with k = {1, 2, 3}, 84 features werecalculated per example. The k-mer frequency rangesbetween 0 (if the k-mer is not present in the sequence) and1 (if the sequence is a repeat of a mononucleotide which isnot observed since such a sequence does not fold intosecondary structures).
2.4 Motif featuresMotif features differ from k-mers since they are approxi-mate sequence matches instead of an exact match.Motifs are discovered by searches for short overrepre-sented approximate sequences within a larger pool ofsequences. The MEME Suite (Multiple ExpectationMaximization for Motif Elicitation) [50] was used formotif discovery in our previous study [31], and thediscovered motifs were used. For positive and negativedata, 100 motifs were discovered, and thus, 200 featureswere created.
2.5 Information-theoretic featuresInformation-theoretic (IT) features have been widelyused in computational biology and bioinformatics tomeasure, analyze, and model the structural and
Yousef et al. EURASIP Journal on Advances in Signal Processing (2017) 2017:70 Page 3 of 10
organizational properties of biological sequences. In[51], we used theses IT features for the classification ofessential and non-essential genes. The IT features usedin this study are 4 entropy (E), 17 mutual information(MI), 65 conditional mutual information (CMI), 1Kullback-Leibler divergence (DKL), and 4 Markovmodel (M) related. Next, we will present a briefdescription of the information-theoretic quantities usedin this study. For a more detailed explanations, we referthe reader to [52].
2.6 Mutual informationWe used mutual information to measure the informa-tion between consecutive bases X and Y. The mutual in-formation measures the dependency between tworandom variables and is mathematically defined as
I X;Yð Þ ¼Xx∈Ω
Xy∈Ω
P x; yð Þ log2P x; yð ÞP xð ÞP yð Þ ; ð1Þ
where P(x) and P(y) are the marginal probabilities andP(x, y) is the joint probability and Ω is the set of nucleo-tides {A, C, G, U}. The probabilities are estimated fromthe relative frequencies in the corresponding pre-miRNA sequences. Along with the total mutual informa-tion computed according to Eq. (1), for each base pair(x, y), the quantity P(x, y)log2(P(x, y)/P(x)P(y)) is calcu-lated and used as a feature. Thus, 17 mutual informationrelated features are defined in this manner.
2.7 Conditional mutual informationThe mutual information between two random variablesX and Y conditioned on a third random variable Z hav-ing a probability mass function (pmf) P(z) is given by
I X;Y jZð Þ ¼ Pz∈Ω
P zð ÞPx∈Ω
Py∈Ω
P x; yjzð Þ log2P x; yjzð Þ
P xjzð ÞP yjzð Þ ;
¼Xx∈Ω
Xy∈Ω
Xz∈Ω
P x; y; zð Þ log2P zð ÞP x; y; zð ÞP x; zð ÞP y; zð Þ ;
ð2Þ
where P(xyz), P(xz), and P(yz) are the joint pmfs of therandom variables shown in parentheses. The three posi-tions in a triplet are regarded as the random variablesX, Z, and Y. The mutual information between the basesat the first and the third position conditioned on thebase in the middle is calculated according to Eq. (1) andused as a feature. In addition, for each possible triplet,we computed the quantity p x; y; zð Þ log2 P zð ÞP x;y;zð Þ
P x;zð ÞP y;zð Þ. A totalof 65 conditional mutual information based features are,therefore, considered.
2.8 EntropyThe Shannon [53] and Gibbs [54] entropies were usedto measure the average information content and thethermodynamic stability of the miRNA sequences, re-spectively. In [55] and [56], we used these entropy mea-sures to quantify digital information content andthermodynamic stability of bacterial genomes. TheShannon entropy for a block size of N is defined as
HN ¼ −Xi
PNS xið Þ log2P Nð Þ
S xið Þ ð3Þ
PNS xið Þ is the probability of the ithword of block size
N. Likewise, the Gibbs entropy is defined as
SG ¼ −kBXi
PNG xið Þ ln P Nð Þ
G xið Þ ð4Þ
where PNG xið Þ is the probability to be in the xith state
and kB is the Boltzmann constant (1.38 × 10 ^ − 23 J/K).Gibbs’ entropy is similar to Shannon’s entropy except forthe Boltzmann constant (kB = 1.38 × 10 ^ − 23 J/K).Nevertheless, unlike the Shannon case, where the prob-ability is defined according to the frequency of occur-rence, we associated the probability distribution with thethermodynamic stability quantified by the nearest-neighbor free energy parameters. The probability distri-bution, P Nð Þ
G , was modeled by the Boltzmann distribution[57], which provides a functional relationship betweenenergy and temperature
P Nð ÞG xið Þ ¼ nxie
−E xið ÞkBT
Pjnxj e
−E xjð ÞkBT
: ð5Þ
T is the temperature in Kelvin, nxi the frequency, andE(xi) the energy of the ith word of block size N. We usedSantaLucia’s unified free energy parameters for di-nucleotide steps at 37°C [58]. For block sizes greaterthan two, the energies were computed by adding the in-volved di-nucleotides. Shannon and Gibbs entropies forblock size of 2 and 3 were calculated and used asfeatures.
2.9 Kullback-Leibler divergenceThe Kullback-Leibler divergence or distance (DKL) [59]is a quantitative measure of how similar a probabilitydistribution P(x) is to a model distribution Q(x):
DKL ¼ −Xi
P xð Þ log2P xð ÞQ xð Þ : ð6Þ
The relative frequencies of the nucleotides in the givenmiRNA sequence, P(x), were compared against a uni-form distribution Q(x), i.e., the divergence from a uni-form distribution is computed.
Yousef et al. EURASIP Journal on Advances in Signal Processing (2017) 2017:70 Page 4 of 10
2.10 Markov modelAssuming that the sequences in the positive and nega-tive classes were generated by two separate Markovsources, we construct a Markov chain and use the scoresof miRNA sequences as Markov features. The trainingset is subdivided into a subset containing the positiveand negative samples. Thereafter, each subset is used togenerate a Markov chain of a preselected order m (MC
+(m) and MC−(m)). The transition probabilities of thetwo Markov chains are empirically estimated using theso-called Lidstone estimator [60]. Let Nx(v) denote thenumber of times a word v of length m appears in a se-quence x. The probability that the next nucleotide is a,where a ∈Ω = {A,C,G,U}, conditioned on the contextv ∈Ωm is
pv;a ¼Nx vað Þ þ δ
Nx vð Þ þ 4δ: ð7Þ
The parameter δ assigns a pseudo count to unseensymbols. In this work, we experimentally checked andfound that better results were obtained using smallervalues for δ and consequently set δ = 0.001. After theMarkov chains for the positive and negative classes wereconstructed, they were used to score each miRNAsequence. If we represent the sequence as b1b2b3…bL,the score is calculated as
Score ¼Xi¼1
L−m
p bibiþ1…biþmð Þ log2p biþmjbibiþ1…biþm−1ð Þ
p biþmð Þ� �
:
ð8ÞThe score gives an indication of how likely the miRNA
sequence is generated by the given mth order Markovchain. The scores of the miRNA sequence on the Mar-kov chains MC+(m) and MC−(m) were used as features.In a previous work [51], we estimated the Markov ordersfrom the training set. However, due to the very shortlength of the miRNA sequences, the results of orderestimation were too poor. Hence, to capture both shortand relatively longer dependencies, we decided to selecttwo Markov orders. A combination of orders 1 andeither 4 or 5 (i.e., m = 1, 4) were found to give betterresults. Thus, we used four Markov features obtainedfrom scoring the miRNA sequences with the Markovchains MC+(1), MC−(1), MC+(4), and MC−(4).
2.11 Feature vector and feature selectionFor feature selection on a per experiment basis, we haveconsidered the information gain measurement [61] im-plemented in KNIME (version 3.1.2) [62]. We definedfour feature sets, one consists of sequence motifs com-bined with k-mers (284 features) of which 100 featureswith highest information gain were used during modeltraining, the second is a combination of IT features with
k-mers (175 features), the third comprises of IT features(91 features), and the last considered only k-mers (84features). Previously [18], it was shown that 50 featuresmight be enough to establish successful models, but wechose to be more conservative here and used 100features.
2.12 Classification approachFollowing the study of [31], we used the random forest(RF) classifiers implemented by the platform KNIME[62]. Classifiers were trained and tested with a split into80% training and 20% testing data. Negative and positiveexamples were forced to equal amounts while perform-ing a 100-fold Monte Carlo cross-validation (MCCV)[63] for model establishment.
2.13 Performance evaluationFor each established model, we calculated a number ofstatistical measures like the Matthews’s correlation coef-ficient (MCC) [64], sensitivity, specificity, and accuracyfor evaluation of model performance. The followingformulations were used to calculate the statistics (withTP true positive, FP false positive, TN true negative, andFN referring to false negative classifications):
Sensitivity SE;Recallð Þ ¼ TP= TPþ FNð ÞSpecificity SPð Þ ¼ TN= TNþ FPð ÞPrecision ¼ TP= TP þ FPð ÞF‐Measure ¼ 2� precision� recallð Þ= precision þ recallð ÞAccuracy ACCð Þ ¼ TPþ TNð Þ= TPþ TNþ FPþ FNð Þ;ACCMCC ¼ TP=TN‐FP=FNð Þffiffiffiffiffiffiffiffiffiffiffiffiffiffiffiffiffiffiffiffiffiffiffiffiffiffiffiffiffiffiffiffiffiffiffiffiffiffiffiffiffiffiffiffiffiffiffiffiffiffiffiffiffiffiffiffiffiffiffiffiffiffiffiffiffiffiffiffiffiffiffiffiffiffiffiffiffiffiffiffiffiffiffiffiffiffiffi
TPþ FPð Þ TPþ FNð Þ TNþ FNð Þ TNþ FPð Þp
All reported performance measures refer to the aver-age of 100-fold MCCVs.
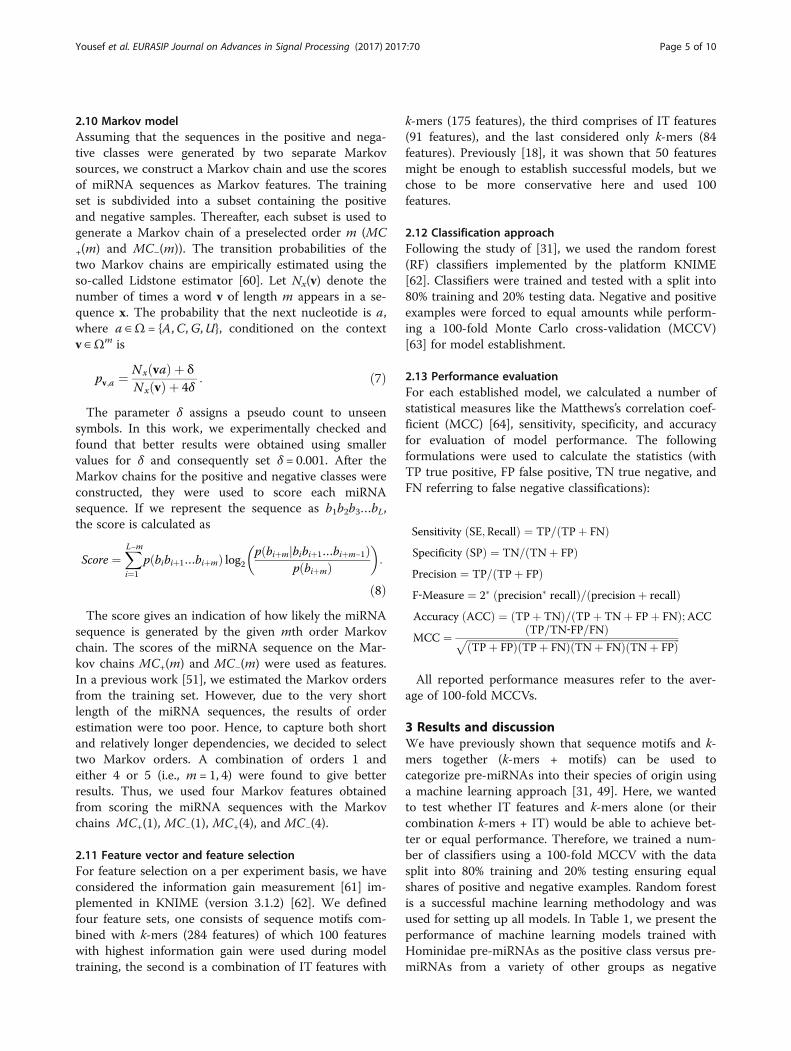
3 Results and discussionWe have previously shown that sequence motifs and k-mers together (k-mers + motifs) can be used tocategorize pre-miRNAs into their species of origin usinga machine learning approach [31, 49]. Here, we wantedto test whether IT features and k-mers alone (or theircombination k-mers + IT) would be able to achieve bet-ter or equal performance. Therefore, we trained a num-ber of classifiers using a 100-fold MCCV with the datasplit into 80% training and 20% testing ensuring equalshares of positive and negative examples. Random forestis a successful machine learning methodology and wasused for setting up all models. In Table 1, we present theperformance of machine learning models trained withHominidae pre-miRNAs as the positive class versus pre-miRNAs from a variety of other groups as negative
Yousef et al. EURASIP Journal on Advances in Signal Processing (2017) 2017:70 Page 5 of 10
classes. Similarly to [31], classification between Homini-dae and Hexapoda was very accurate (~ 0.93 averageaccuracy) while classification into Hominidae andCercopithecidae was impossible (~ 0.50 average accur-acy) which is likely due to the very close evolutionaryrelationship. Moreover, compared to k-mers + motifs(0.793 on average), the average accuracy of IT (0.786) isalmost as equal whereas k-mers + IT (0.803) performslightly better. The difference between highest andlowest accuracies among feature sets is quite similar.K-mers + motifs (0.423), IT (0.426), k-mers (0.427),and k-mers + IT (0.500). The latter range is thelargest which we interpret as being best suited fordiscriminating between species. The distribution ofaccuracies for categorization into different clades issimilar and with increasing phylogenetic distance theaverage model accuracy also increased for all featuresets, in general (Table 1). Due to the smaller evolu-tionary distance, a classification between Homosapiens and Hominiae (without Homo sapiens) yieldeda relatively low accuracy.Interestingly, k-mers only and IT features achieved a
similar performance on average and the results wereclose to that of IT + k-mers as well as sequencemotifs + k-mers. This is very promising observationwhich could mean that one can rely only on IT and/ork-mer features thereby dropping the computationally
expensive generation of sequence motifs and in turn sim-plifying the process of miRNA categorization. K-mers canbe calculated in O(n), but motif discovery is NP complete[65] and it is likely that IT features are probably at mostO(n2). A classification of Hominidae as the positive classand the combination of all the other data as the negativeclass using k-mers lead to an accuracy of 0.751 which isclose to the average accuracy (0.793; Table 1).To assess the contribution of IT and k-mer features,
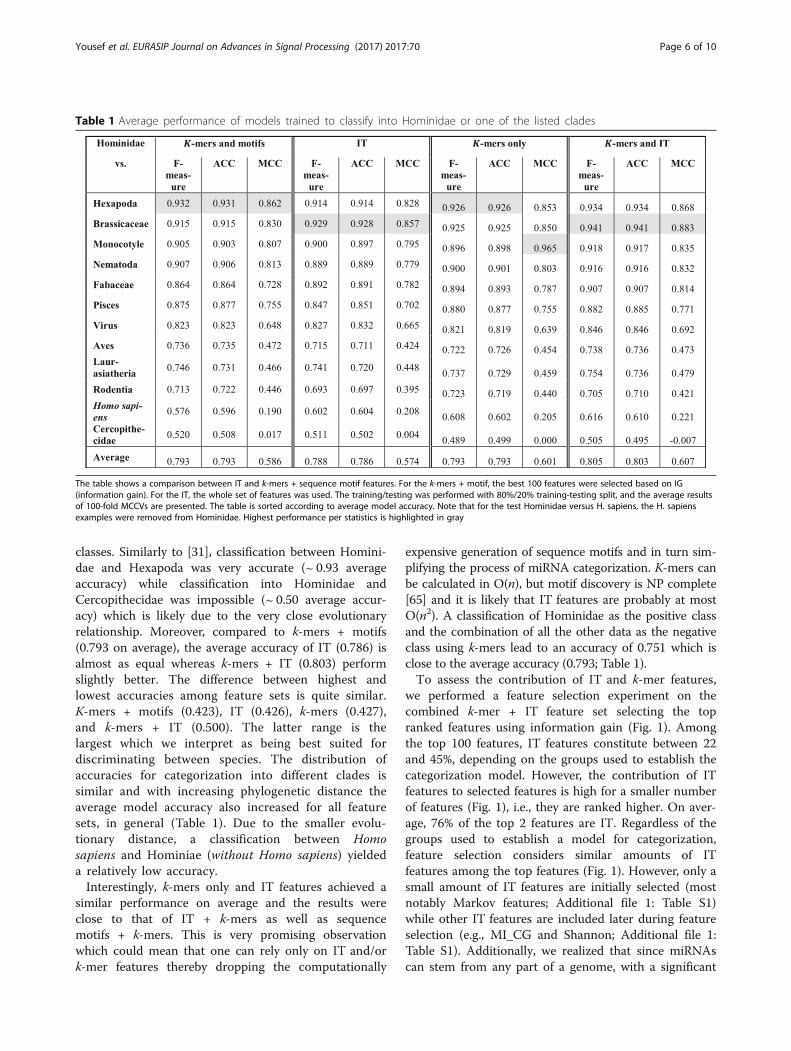
we performed a feature selection experiment on thecombined k-mer + IT feature set selecting the topranked features using information gain (Fig. 1). Amongthe top 100 features, IT features constitute between 22and 45%, depending on the groups used to establish thecategorization model. However, the contribution of ITfeatures to selected features is high for a smaller numberof features (Fig. 1), i.e., they are ranked higher. On aver-age, 76% of the top 2 features are IT. Regardless of thegroups used to establish a model for categorization,feature selection considers similar amounts of ITfeatures among the top features (Fig. 1). However, only asmall amount of IT features are initially selected (mostnotably Markov features; Additional file 1: Table S1)while other IT features are included later during featureselection (e.g., MI_CG and Shannon; Additional file 1:Table S1). Additionally, we realized that since miRNAscan stem from any part of a genome, with a significant
Table 1 Average performance of models trained to classify into Hominidae or one of the listed clades
The table shows a comparison between IT and k-mers + sequence motif features. For the k-mers + motif, the best 100 features were selected based on IG(information gain). For the IT, the whole set of features was used. The training/testing was performed with 80%/20% training-testing split, and the average resultsof 100-fold MCCVs are presented. The table is sorted according to average model accuracy. Note that for the test Hominidae versus H. sapiens, the H. sapiensexamples were removed from Hominidae. Highest performance per statistics is highlighted in gray
Yousef et al. EURASIP Journal on Advances in Signal Processing (2017) 2017:70 Page 6 of 10
amount harbored in exons [28], that codon bias [66]would be able to explain how k-mer features attain theirdistinction power between species (k-mers were co-dominating the top 10).Table 1 considers categorization into Hominidae and
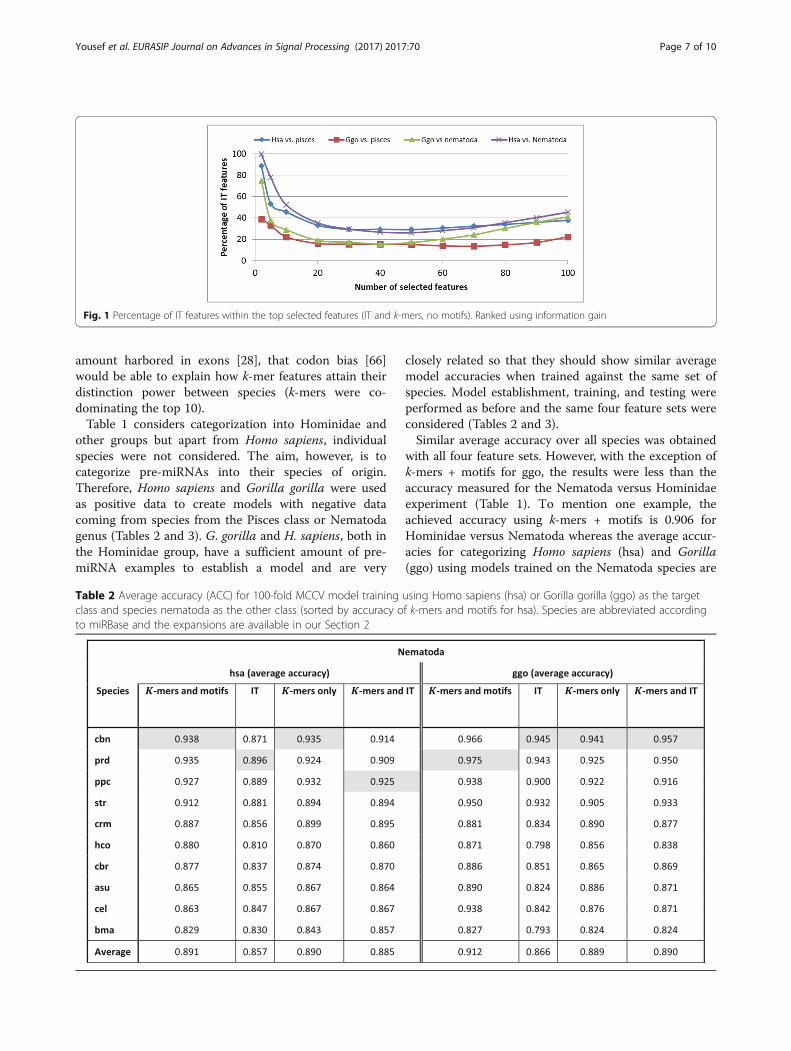
other groups but apart from Homo sapiens, individualspecies were not considered. The aim, however, is tocategorize pre-miRNAs into their species of origin.Therefore, Homo sapiens and Gorilla gorilla were usedas positive data to create models with negative datacoming from species from the Pisces class or Nematodagenus (Tables 2 and 3). G. gorilla and H. sapiens, both inthe Hominidae group, have a sufficient amount of pre-miRNA examples to establish a model and are very
closely related so that they should show similar averagemodel accuracies when trained against the same set ofspecies. Model establishment, training, and testing wereperformed as before and the same four feature sets wereconsidered (Tables 2 and 3).Similar average accuracy over all species was obtained
with all four feature sets. However, with the exception ofk-mers + motifs for ggo, the results were less than theaccuracy measured for the Nematoda versus Hominidaeexperiment (Table 1). To mention one example, theachieved accuracy using k-mers + motifs is 0.906 forHominidae versus Nematoda whereas the average accur-acies for categorizing Homo sapiens (hsa) and Gorilla(ggo) using models trained on the Nematoda species are
Fig. 1 Percentage of IT features within the top selected features (IT and k-mers, no motifs). Ranked using information gain
Table 2 Average accuracy (ACC) for 100-fold MCCV model training using Homo sapiens (hsa) or Gorilla gorilla (ggo) as the targetclass and species nematoda as the other class (sorted by accuracy of k-mers and motifs for hsa). Species are abbreviated accordingto miRBase and the expansions are available in our Section 2
Yousef et al. EURASIP Journal on Advances in Signal Processing (2017) 2017:70 Page 7 of 10
0.891 and 0.912, respectively. The generated modelsmostly agree on the order of species based on the sortedaccuracies, which can be seen from the highlighted high-est performance per feature set (Table 2). As expected,the performance of the hsa and ggo trained models arecomparable. In summary, the distinction into Hominidaeand Nematoda can be performed with a very highaccuracy and the categorization into specific speciesis also satisfactory. Nematoda are evolutionary distantto Hominidae and may, therefore, perform particularlywell. Fish are evolutionary closer and were tested inthe same manner (Table 3).As observed for Nematoda, the average accuracy of
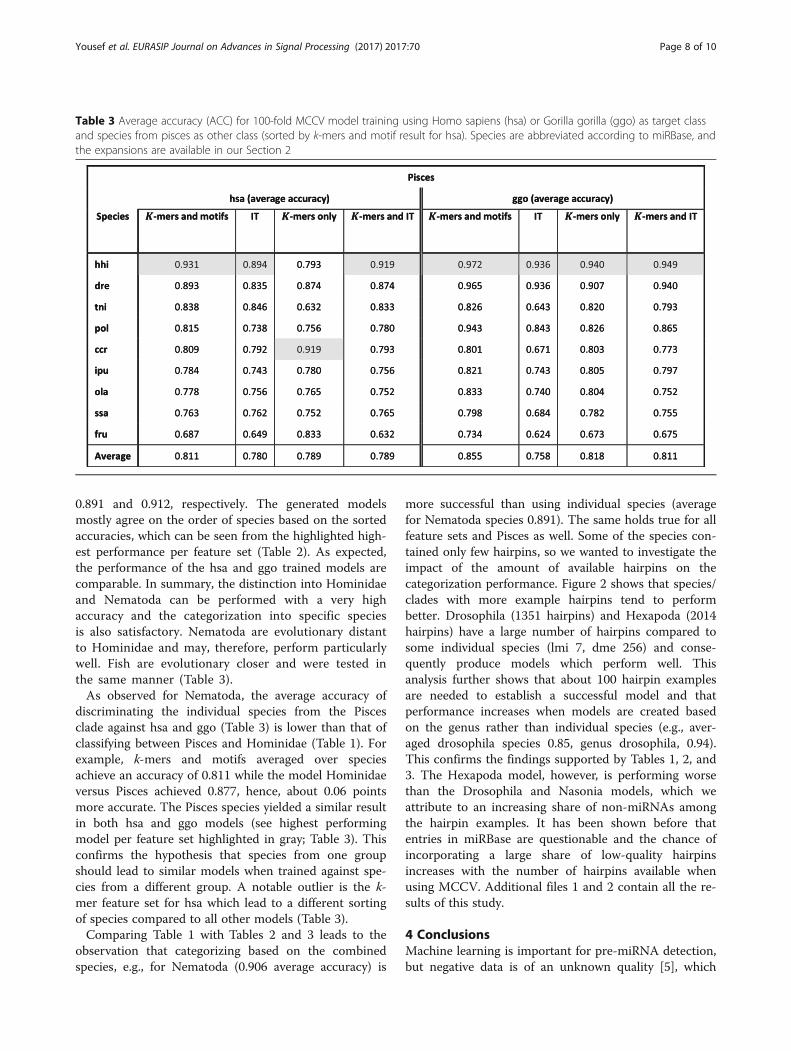
discriminating the individual species from the Piscesclade against hsa and ggo (Table 3) is lower than that ofclassifying between Pisces and Hominidae (Table 1). Forexample, k-mers and motifs averaged over speciesachieve an accuracy of 0.811 while the model Hominidaeversus Pisces achieved 0.877, hence, about 0.06 pointsmore accurate. The Pisces species yielded a similar resultin both hsa and ggo models (see highest performingmodel per feature set highlighted in gray; Table 3). Thisconfirms the hypothesis that species from one groupshould lead to similar models when trained against spe-cies from a different group. A notable outlier is the k-mer feature set for hsa which lead to a different sortingof species compared to all other models (Table 3).Comparing Table 1 with Tables 2 and 3 leads to the
observation that categorizing based on the combinedspecies, e.g., for Nematoda (0.906 average accuracy) is
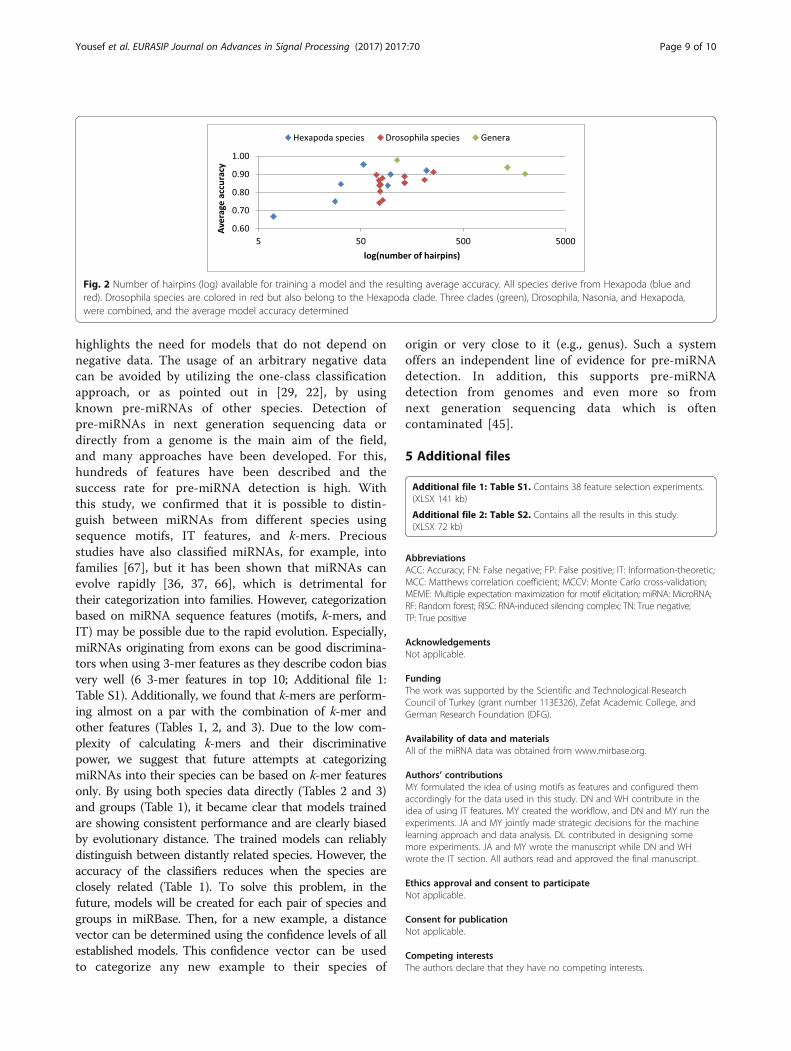
more successful than using individual species (averagefor Nematoda species 0.891). The same holds true for allfeature sets and Pisces as well. Some of the species con-tained only few hairpins, so we wanted to investigate theimpact of the amount of available hairpins on thecategorization performance. Figure 2 shows that species/clades with more example hairpins tend to performbetter. Drosophila (1351 hairpins) and Hexapoda (2014hairpins) have a large number of hairpins compared tosome individual species (lmi 7, dme 256) and conse-quently produce models which perform well. Thisanalysis further shows that about 100 hairpin examplesare needed to establish a successful model and thatperformance increases when models are created basedon the genus rather than individual species (e.g., aver-aged drosophila species 0.85, genus drosophila, 0.94).This confirms the findings supported by Tables 1, 2, and3. The Hexapoda model, however, is performing worsethan the Drosophila and Nasonia models, which weattribute to an increasing share of non-miRNAs amongthe hairpin examples. It has been shown before thatentries in miRBase are questionable and the chance ofincorporating a large share of low-quality hairpinsincreases with the number of hairpins available whenusing MCCV. Additional files 1 and 2 contain all the re-sults of this study.
4 ConclusionsMachine learning is important for pre-miRNA detection,but negative data is of an unknown quality [5], which
Table 3 Average accuracy (ACC) for 100-fold MCCV model training using Homo sapiens (hsa) or Gorilla gorilla (ggo) as target classand species from pisces as other class (sorted by k-mers and motif result for hsa). Species are abbreviated according to miRBase, andthe expansions are available in our Section 2
Yousef et al. EURASIP Journal on Advances in Signal Processing (2017) 2017:70 Page 8 of 10
highlights the need for models that do not depend onnegative data. The usage of an arbitrary negative datacan be avoided by utilizing the one-class classificationapproach, or as pointed out in [29, 22], by usingknown pre-miRNAs of other species. Detection ofpre-miRNAs in next generation sequencing data ordirectly from a genome is the main aim of the field,and many approaches have been developed. For this,hundreds of features have been described and thesuccess rate for pre-miRNA detection is high. Withthis study, we confirmed that it is possible to distin-guish between miRNAs from different species usingsequence motifs, IT features, and k-mers. Preciousstudies have also classified miRNAs, for example, intofamilies [67], but it has been shown that miRNAs canevolve rapidly [36, 37, 66], which is detrimental fortheir categorization into families. However, categorizationbased on miRNA sequence features (motifs, k-mers, andIT) may be possible due to the rapid evolution. Especially,miRNAs originating from exons can be good discrimina-tors when using 3-mer features as they describe codon biasvery well (6 3-mer features in top 10; Additional file 1:Table S1). Additionally, we found that k-mers are perform-ing almost on a par with the combination of k-mer andother features (Tables 1, 2, and 3). Due to the low com-plexity of calculating k-mers and their discriminativepower, we suggest that future attempts at categorizingmiRNAs into their species can be based on k-mer featuresonly. By using both species data directly (Tables 2 and 3)and groups (Table 1), it became clear that models trainedare showing consistent performance and are clearly biasedby evolutionary distance. The trained models can reliablydistinguish between distantly related species. However, theaccuracy of the classifiers reduces when the species areclosely related (Table 1). To solve this problem, in thefuture, models will be created for each pair of species andgroups in miRBase. Then, for a new example, a distancevector can be determined using the confidence levels of allestablished models. This confidence vector can be usedto categorize any new example to their species of
origin or very close to it (e.g., genus). Such a systemoffers an independent line of evidence for pre-miRNAdetection. In addition, this supports pre-miRNAdetection from genomes and even more so fromnext generation sequencing data which is oftencontaminated [45].
5 Additional files
Additional file 1: Table S1. Contains 38 feature selection experiments.(XLSX 141 kb)
Additional file 2: Table S2. Contains all the results in this study.(XLSX 72 kb)
AbbreviationsACC: Accuracy; FN: False negative; FP: False positive; IT: Information-theoretic;MCC: Matthews correlation coefficient; MCCV: Monte Carlo cross-validation;MEME: Multiple expectation maximization for motif elicitation; miRNA: MicroRNA;RF: Random forest; RISC: RNA-induced silencing complex; TN: True negative;TP: True positive
AcknowledgementsNot applicable.
FundingThe work was supported by the Scientific and Technological ResearchCouncil of Turkey (grant number 113E326), Zefat Academic College, andGerman Research Foundation (DFG).
Availability of data and materialsAll of the miRNA data was obtained from www.mirbase.org.
Authors’ contributionsMY formulated the idea of using motifs as features and configured themaccordingly for the data used in this study. DN and WH contribute in theidea of using IT features. MY created the workflow, and DN and MY run theexperiments. JA and MY jointly made strategic decisions for the machinelearning approach and data analysis. DL contributed in designing somemore experiments. JA and MY wrote the manuscript while DN and WHwrote the IT section. All authors read and approved the final manuscript.
Ethics approval and consent to participateNot applicable.
Consent for publicationNot applicable.
Competing interestsThe authors declare that they have no competing interests.
Fig. 2 Number of hairpins (log) available for training a model and the resulting average accuracy. All species derive from Hexapoda (blue andred). Drosophila species are colored in red but also belong to the Hexapoda clade. Three clades (green), Drosophila, Nasonia, and Hexapoda,were combined, and the average model accuracy determined
Yousef et al. EURASIP Journal on Advances in Signal Processing (2017) 2017:70 Page 9 of 10
Publisher’s NoteSpringer Nature remains neutral with regard to jurisdictional claims inpublished maps and institutional affiliations.
Author details1Community Information Systems, Zefat Academic College, 13206 Zefat,Israel. 2Transmission Systems Group (TrSys), Jacobs University Bremen,Bremen, Germany. 3Molecular Biology and Genetics, Izmir Institute ofTechnology, Urla, Izmir, Turkey. 4Applied Bioinformatics, WageningenUniversity and Research, Wageningen, the Netherlands.
Received: 17 May 2017 Accepted: 2 October 2017
References1. EJ Chapman, JC Carrington, Nat Rev Genet 8, 884 (2007)2. F Grey, J. Gen. Virol. 96, 739 (2015)3. M. Yousef, J. Allmer, and W. Khalifa, Plant microRNA prediction employing
sequence motifs achieves high accuracy (2016).4. MD Saçar, J Allmer, J Pakistan, Clin. Biomed. Res. 1, 3 (2013)5. J Allmer, M Yousef, Front. Genet. 3, 209 (2012)6. M Saçar, J Allmer, ed. by M Yousef, J Allmer, miRNomics MicroRNA Biol.
Comput. Anal. SE - 10, vol 2014 (Humana Press), pp. 177–1877. M Yousef, M Nebozhyn, H Shatkay, S Kanterakis, LC Showe, MK Showe,
Bioinformatics 22, 1325 (2006)8. HT Dang, HP Tho, K Satou, BH Tu, 2nd Int. Conf. Bioinforma. Biomed. Eng.
iCBBE 2008 (2008), pp. 33–369. W Khalifa, M Yousef, MD Sacar Demirci, J Allmer, PeerJ 4, e2135 (2016)10. DH Tran, TH Pham, K Satov, TB Ho, 2nd Int. Conf. Bioinforma Biomed. Eng.
(2008), pp. 33–3611. MD Saçar Demirci, J Allmer, PeerJ 5, e3131 (2017)12. S-D Hsu, Y-T Tseng, S Shrestha, Y-L Lin, A Khaleel, C-H Chou, C-F Chu, H-Y
Huang, C-M Lin, S-Y Ho, T-Y Jian, F-M Lin, T-H Chang, S-L Weng, K-W Liao, I-E Liao, C-C Liu, H-D Huang, Nucleic Acids Res. 42, D78 (2014)
13. T Vergoulis, IS Vlachos, P Alexiou, G Georgakilas, M Maragkakis, M Reczko, SGerangelos, N Koziris, T Dalamagas, AG Hatzigeorgiou, Nucleic Acids Res.40, D222 (2012)
14. B Fromm, T Billipp, LE Peck, M Johansen, JE Tarver, BL King, JM Newcomb, LFSempere, K Flatmark, E Hovig, KJ Peterson, Annu. Rev. Genet. 49, 213 (2015)
15. A Kozomara, S Griffiths-Jones, Nucleic Acids Res. 39, D152 (2011)16. MD Saçar, H Hamzeiy, J Allmer, J. Integr. Bioinform. 10, 215 (2013)17. M Duygu, S Demirci, J Allmer, J. Integr. Bioinform. (2017)18. MD Sacar, J Allmer, 2013 8th Int. Symp. Heal. Informatics Bioinforma
(IEEE, 2013), pp. 1–619. EC Lai, P Tomancak, RW Williams, GM Rubin, Genome Biol. 4, R42 (2003)20. A Sewer, N Paul, P Landgraf, A Aravin, S Pfeffer, MJ Brownstein, T Tuschl, E
van Nimwegen, M Zavolan, BMC Bioinformatics 6, 267 (2005)21. M Yousef, J Allmer, W Khalifa, J. Intell. Learn. Syst. Appl. 08, 9 (2016)22. M Yousef, J Allmer, W Khalifa, J. Biomed. Sci. Eng. 08, 684 (2015)23. J Ding, S Zhou, J Guan, BMC Bioinformatics 11, S11 (2010)24. D Song, Y Yang, B Yu, B Zheng, Z Deng, B-L Lu, X Chen, T Jiang, BMC
Bioinformatics 10(Suppl 1), S36 (2009)25. Y. Xu, X. Zhou, and W. Zhang, 24, i50 (2008).26. KLS Ng, SK Mishra, Bioinformatics 23, 1321 (2007)27. Z Gao, X Luo, T Shi, B Cai, Z Zhang, Z Cheng, W Zhuang, Mol. Cells
34, 239 (2012)28. VN Kim, J Han, MC Siomi, Nat. Rev. Mol. Cell Biol. 10, 126 (2009)29. M Yousef, S Jung, LC Showe, MK Showe, Algorithms Mol. Biol. 3, 2 (2008)30. M Yousef, J Allmer, W Khalifa, Proc. 9th Int. Jt. Conf. Biomed. Eng. Syst.
Technol (Rome, 2016), pp. 219–22531. M Yousef, W Khalifa, IE Acar, J Allmer, BMC Bioinformatics 18, 170 (2017)32. R Batuwita, V Palade, Bioinformatics 25, 989 (2009)33. I. D. O. N. Lopes, A. Schliep, A. C. P. de L. F. de Carvalho, I. de On Lopes, A.
Schliep, A. C. de Lf de Carvalho, I. D. O. N. Lopes, A. C. P. de L. F. deCarvalho, A. Schliep, and A. C. P. de L. F. de Carvalho, BMC Bioinformatics15, 124 (2014).
34. W Ritchie, D Gao, JEJ Rasko, Bioinformatics 28, 1058 (2012)35. J Chen, X Wang, B Liu, Sci Rep 6, 19062 (2016)36. H Liang, W-H Li, Mol. Biol. Evol. 26, 1195 (2009)37. J Lu, Y Shen, Q Wu, S Kumar, B He, S Shi, RW Carthew, SM Wang, C-I Wu,
Nat. Genet. 40, 351 (2008)
38. N Fahlgren, S Jogdeo, KD Kasschau, CM Sullivan, EJ Chapman, S Laubinger,LM Smith, M Dasenko, SA Givan, D Weigel, JC Carrington, Plant Cell Online22, 1074 (2010)
39. J-H Teune, G Steger, J. Nucleic Acids 2010, 201040. Y Wu, B Wei, H Liu, T Li, S Rayner, BMC Bioinformatics 12, 107 (2011)41. D Gerlach, EV Kriventseva, N Rahman, CE Vejnar, EM Zdobnov, Nucleic Acids
Res. 37, D111 (2009)42. C Xue, F Li, T He, G-P Liu, Y Li, X Zhang, BMC Bioinformatics 6, 310 (2005)43. P Jiang, H Wu, W Wang, W Ma, X Sun, Z Lu, Nucleic Acids Res. 35, W339
(2007)44. A van der Burgt, MWJE Fiers, J-P Nap, RCHJ van Ham, BMC Genomics
10, 204 (2009)45. C Bağcı, J Allmer, PLoS One 11, e0145065 (2016)46. S Griffiths-Jones, RJ Grocock, S van Dongen, A Bateman, AJ Enright, Nucleic
Acids Res. 34, D140 (2006)47. RC Edgar, Bioinformatics 26, 2460 (2010)48. MV Cakir, J Allmer, Heal. Informatics Bioinforma. (HIBIT), 2010 5th Int. Symp
(IEEE, Ankara, Turkey, 2010), pp. 31–3849. M. Yousef, W. Khalifa, I. E. Acar, and J. Allmer, in Proc. BIOSTEC 2017, 10th
Int. Jt. Conf. Biomed. Eng. Syst. Technol. (2017).50. TL Bailey, M Boden, FA Buske, M Frith, CE Grant, L Clementi, J Ren, WW Li,
WS Noble, Nucleic Acids Res. 37, W202 (2009)51. D Nigatu, W Henkel, 8th Int. Conf. Bioinforma. Model. Methods Algorithms
(2017), pp. 81–9252. TM Cover, JA Thomas, Elements of Information Theory, 2nd edn. (Wiley, 2006)53. CE Shannon, Bell Syst. Tech. J. 27, 379 (1948)54. F Reif, Fundamentals of Statistical and Thermal Physics, 56946th edn.
(Waveland Pr Inc, 2008)55. D Nigatu, A Mahmood, W Henkel, P Sobetzko, G Muskhelishvili, IEEE Glob.
Conf. Signal Inf. Process. 1338(2014) (2014)56. D Nigatu, W Henkel, P Sobetzko, G Muskhelishvili, EURASIP J. Bioinforma.
Syst. Biol. 2016, 4 (2016)57. J Kovac, J. Chem. Educ. 79, 1322 (2002)58. J SantaLucia, Proc. Natl. Acad. Sci. 95, 1460 (1998)59. S Kullback, RA Leibler, Ann. Math. Stat. 22, 79 (1951)60. GJ Lindstone, Trans. Fac. Actuar. 8, 182 (1920)61. NAN Shaltout, M El-Hefnawi, A Rafea, A Moustafa, Proc. World Congr. Eng
(Newswood Limited, 2014), pp. 625–63162. MR Berthold, N Cebron, F Dill, TR Gabriel, T Kötter, T Meinl, P Ohl, C Sieb, K
Thiel, B Wiswedel, SIGKDD Explor (2008), pp. 319–32663. Q-S Xu, Y-Z Liang, Chemom. Intell. Lab. Syst. 56, 1 (2001)64. BW Matthews, BBA - Protein Struct. 405, 442 (1975)65. U Keich, PA Pevzner, Bioinformatics 18, 1374 (2002)66. M Burset, R Guigó, Genomics 34, 353 (1996)67. J Ding, S Zhou, J Guan, BMC Bioinformatics 12, 216 (2011)
Yousef et al. EURASIP Journal on Advances in Signal Processing (2017) 2017:70 Page 10 of 10


