Catch Me If You Can: Detecting Pickpocket Suspects fromLarge-Scale Transit Records
Bowen DuState Key Lab of SoftwareDevelopment Environment
Beihang UniversityBeijing, China
Chuanren LiuDecision Sciences and MISLeBow College of Business
Drexel UniversityPhiladelphia, US
Wenjun ZhouBusiness Analytics & StatisticsHaslam College of Business
University of TennesseeKnoxville, US
Zhenshan HouState Key Lab of SoftwareDevelopment Environment
Beihang UniversityBeijing, China
Hui Xiong∗
Management Science andInformation SystemsRutgers University
New Jersey, [email protected]
ABSTRACTMassive data collected by automated fare collection (AFC)systems provide opportunities for studying both personaltraveling behaviors and collective mobility patterns in theurban area. Existing studies on the AFC data have primar-ily focused on identifying passengers’ movement patterns.In this paper, however, we creatively leveraged such datafor identifying thieves in the public transit systems. In-deed, stopping pickpockets in the public transit systems hasbeen critical for improving passenger satisfaction and publicsafety. However, it is challenging to tell thieves from regularpassengers in practice. To this end, we developed a suspectdetection and surveillance system, which can identify pick-pocket suspects based on their daily transit records. Specif-ically, we first extracted a number of features from eachpassenger’s daily activities in the transit systems. Then,we took a two-step approach that exploits the strengths ofunsupervised outlier detection and supervised classificationmodels to identify thieves, who exhibit abnormal travelingbehaviors. Experimental results demonstrated the effective-ness of our method. We also developed a prototype systemwith a user-friendly interface for the security personnel.
CCS Concepts•Information systems → Spatial-temporal systems;Data mining; •Computing methodologies→Anomalydetection;
∗Corresponding Author
Permission to make digital or hard copies of all or part of this work for personal orclassroom use is granted without fee provided that copies are not made or distributedfor profit or commercial advantage and that copies bear this notice and the full cita-tion on the first page. Copyrights for components of this work owned by others thanACM must be honored. Abstracting with credit is permitted. To copy otherwise, or re-publish, to post on servers or to redistribute to lists, requires prior specific permissionand/or a fee. Request permissions from [email protected].
KDD ’16, August 13-17, 2016, San Francisco, CA, USAc© 2016 ACM. ISBN 978-1-4503-4232-2/16/08. . . $15.00
DOI: http://dx.doi.org/10.1145/2939672.2939687
KeywordsAutomated Fare Collection; Travel Behaviors; Mobility Pat-terns; Public Safety; Anomaly Detection.
1. INTRODUCTIONPassengers in the public transit systems have been the
main target for pickpockets. In many cities, thefts happenfrequently in public transit systems, because passengers tendto pay less attention to their belongings when they are ina rush or in a crowded environment. For example, duringthe first nine months of 2014, 350 pickpockets were caught inthe subway system and 490 were caught on buses1 in Beijing,China. Many other big cities in the world, such as Barcelona,Prague, Rome, and Paris, are also reported to suffer fromthe pickpocket problem 2, which has led to public safetyconcerns [23, 7]. Indeed, it is challenging to detect theftactivities committed by cunning thieves who know how toescape without being disclosed. Despite the substantial costin manpower and resources, many thieves are still at large.It is critical to provide a smart surveillance and tracking toolfor the security personnel of the transit systems.
With rapid advances in information technology and dataprocessing capacities, transactional records collected by au-tomated fare collection (AFC) systems [20] have becomevaluable for understanding passengers’ mobility patterns andthe urban dynamics [6, 3, 20, 29, 18]. However, most of theexisting studies focused on identifying regular, collective mo-bility patterns, such as commute flows and transit networks.Our study is the first to focus on identifying thieves basedon AFC data. In fact, it is possible to detect thieves usingAFC records because behavioral differences are coined inthe mobility footprints, which can help to separate suspectsfrom regular passengers. Examples of such behaviors, whichcan make suspects notable, include traveling for an extendedlength of time, making unnecessary transfers, and/or wan-dering on certain routes while making random stops.
1http://www.bjgaj.gov.cn/web/detail zxftDetail 397242.html
2http://abcnews.go.com/Travel/top-10-pickpocket-cities-watch-wallet-avoid-thieves/story?id=11769828
CE
A
DB
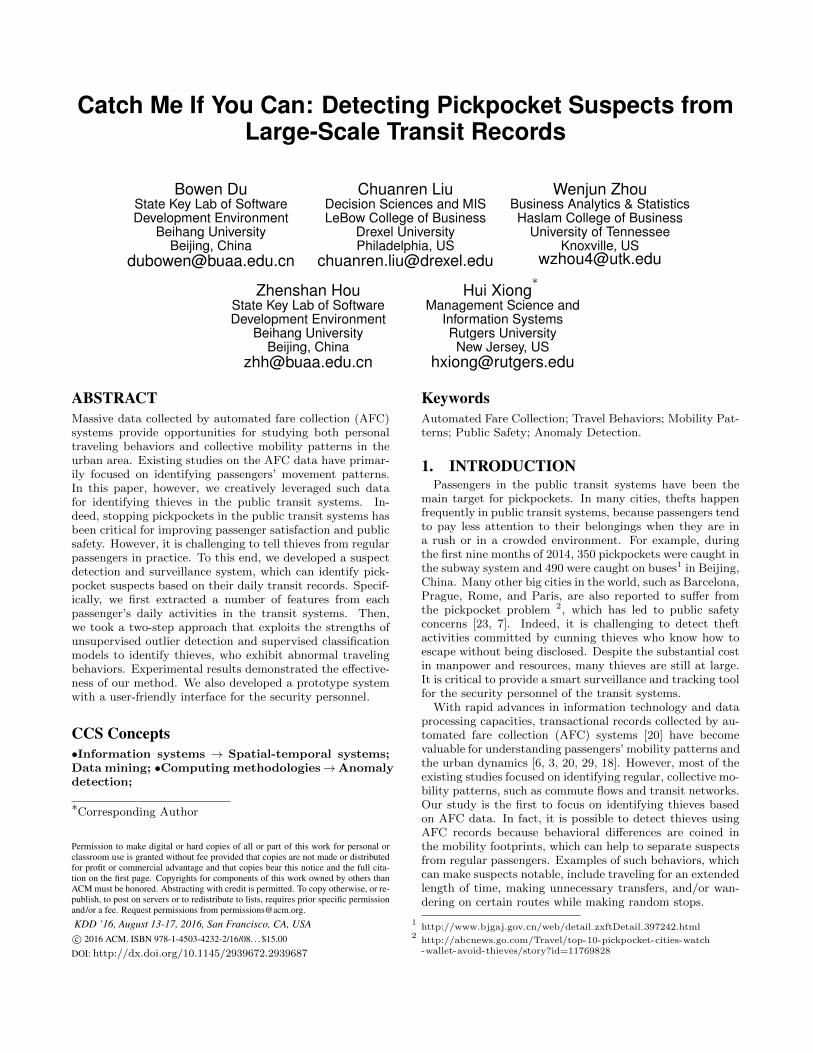
Figure 1: Trajectories of passengers.
However, detecting thieves based on AFC records is nota simple outlier detection problem. Figure 1 shows the dif-ference between a known thief and an outlier. We can seea number of trajectories between hot regions A and B. Bycareful examination, we can see that most passengers movefrom one region to another using near-optimal configuration(e.g., shortest time/distance, or a minimal number of trans-fers). However, a passenger (a known suspect) who tookthe path A → C → D → B looks suspicious because thereis no need to make transfers at C and D in order to reachB. Based on the above observation, passengers who exhibitsuch abnormal behaviors will be selected for further exam-ination. In contrast, another passenger who travels from Eto B is an outlier, since few passengers take the same path.However, this passenger is likely just a regular passengerwho originates from a less crowded area.
In summary, to identify thieves from AFC records, we arefaced with a number of inherent challenges.
• The first challenge is how to identify useful features to dis-tinguish thieves from regular passengers. These featuresshould not only help us understand the behaviors of pick-pockets, but also help us build a suspect detection andtracking system for supporting the security personnel.
• Second, using regular outlier detection methods tends toresult in a large number of false positives. In particular,not every trip made by a regular passenger looks normal.Regular commuters may occasionally make trips to visitfriends or places of interest, and some of such trips maylook suspicious by how much they deviate from regularbehaviors.
• Third, a large number of AFC records are being collectedfrom millions of passengers, only a tiny fraction of whichare pickpockets. Identifying such a small group of peoplein such a large-scale dataset is like looking for a needle inthe haystack.
• Finally, we also need to effectively transform our knowl-edge based on model development into a decision supportsystem, so that real-time, personalized deployment rec-ommendations could be made to help to guide securitypersonnel to perform their work more efficiently.
To this end, in this paper, a comprehensive approach istaken to meet the above challenges. Specifically, we firstconstruct a feature representation for profiling passengers.Furthermore, we establish a two-step framework to separatenormal movement patterns from irregular behaviors, and
eventually, distinguish thieves from regular passengers. Fi-nally, we leverage real-world datasets from multiple sourcesfor model training and validation, and implement a proto-type system for end users.
Mapdatabase
Bustransaction
Subwaytransaction
Incidence reports
Individualmobilitydatabase
Map partition
Extract mobilitycharacters
Functionalregions
Regular passenger filter
Extract mobilitypattern of civilian Suspect detection
Extract mobilitypattern of
pickpocket
User interaction
Feedback
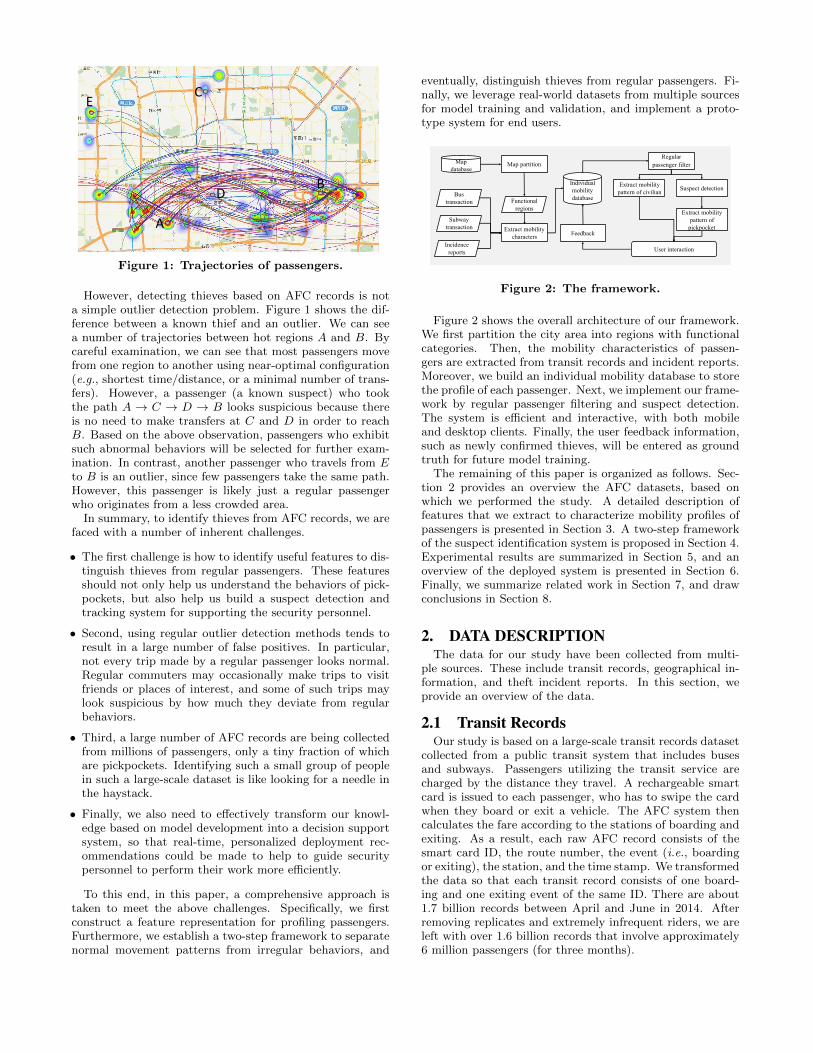
Figure 2: The framework.
Figure 2 shows the overall architecture of our framework.We first partition the city area into regions with functionalcategories. Then, the mobility characteristics of passen-gers are extracted from transit records and incident reports.Moreover, we build an individual mobility database to storethe profile of each passenger. Next, we implement our frame-work by regular passenger filtering and suspect detection.The system is efficient and interactive, with both mobileand desktop clients. Finally, the user feedback information,such as newly confirmed thieves, will be entered as groundtruth for future model training.
The remaining of this paper is organized as follows. Sec-tion 2 provides an overview the AFC datasets, based onwhich we performed the study. A detailed description offeatures that we extract to characterize mobility profiles ofpassengers is presented in Section 3. A two-step frameworkof the suspect identification system is proposed in Section 4.Experimental results are summarized in Section 5, and anoverview of the deployed system is presented in Section 6.Finally, we summarize related work in Section 7, and drawconclusions in Section 8.
2. DATA DESCRIPTIONThe data for our study have been collected from multi-
ple sources. These include transit records, geographical in-formation, and theft incident reports. In this section, weprovide an overview of the data.
2.1 Transit RecordsOur study is based on a large-scale transit records dataset
collected from a public transit system that includes busesand subways. Passengers utilizing the transit service arecharged by the distance they travel. A rechargeable smartcard is issued to each passenger, who has to swipe the cardwhen they board or exit a vehicle. The AFC system thencalculates the fare according to the stations of boarding andexiting. As a result, each raw AFC record consists of thesmart card ID, the route number, the event (i.e., boardingor exiting), the station, and the time stamp. We transformedthe data so that each transit record consists of one board-ing and one exiting event of the same ID. There are about1.7 billion records between April and June in 2014. Afterremoving replicates and extremely infrequent riders, we areleft with over 1.6 billion records that involve approximately6 million passengers (for three months).
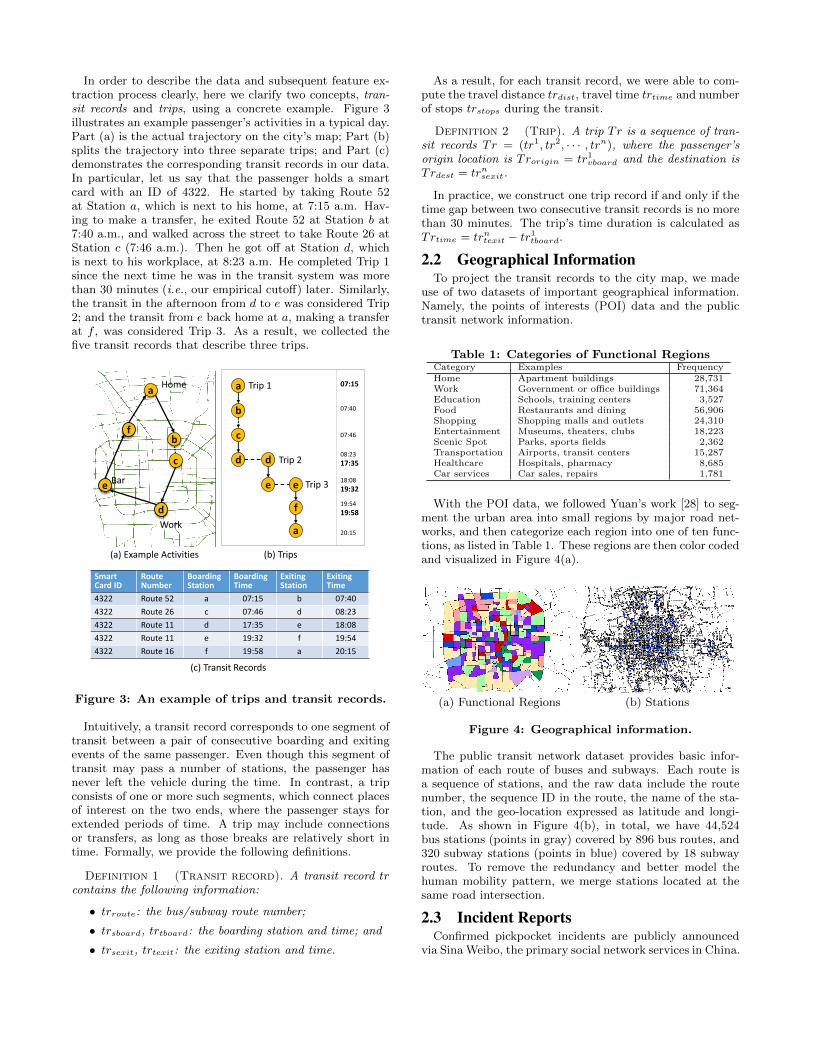
In order to describe the data and subsequent feature ex-traction process clearly, here we clarify two concepts, tran-sit records and trips, using a concrete example. Figure 3illustrates an example passenger’s activities in a typical day.Part (a) is the actual trajectory on the city’s map; Part (b)splits the trajectory into three separate trips; and Part (c)demonstrates the corresponding transit records in our data.In particular, let us say that the passenger holds a smartcard with an ID of 4322. He started by taking Route 52at Station a, which is next to his home, at 7:15 a.m. Hav-ing to make a transfer, he exited Route 52 at Station b at7:40 a.m., and walked across the street to take Route 26 atStation c (7:46 a.m.). Then he got off at Station d, whichis next to his workplace, at 8:23 a.m. He completed Trip 1since the next time he was in the transit system was morethan 30 minutes (i.e., our empirical cutoff) later. Similarly,the transit in the afternoon from d to e was considered Trip2; and the transit from e back home at a, making a transferat f , was considered Trip 3. As a result, we collected thefive transit records that describe three trips.
a
b
c
d
e
f
a
07:15
20:15
19:54
19:58
07:46
07:40
18:08
19:32
08:23
17:35Trip 2
Trip 3
d
a
b
c
e
f
(b) Trips
(c) Transit Records
SmartCard ID
Route Number
Boarding Station
Boarding Time
Exiting Station
Exiting Time
4322 Route 52 a 07:15 b 07:40
4322 Route 26 c 07:46 d 08:23
4322 Route 11 d 17:35 e 18:08
4322 Route 11 e 19:32 f 19:54
4322 Route 16 f 19:58 a 20:15
Home
Work
Bar
d
e
(a) Example Activities
Trip 1
Figure 3: An example of trips and transit records.
Intuitively, a transit record corresponds to one segment oftransit between a pair of consecutive boarding and exitingevents of the same passenger. Even though this segment oftransit may pass a number of stations, the passenger hasnever left the vehicle during the time. In contrast, a tripconsists of one or more such segments, which connect placesof interest on the two ends, where the passenger stays forextended periods of time. A trip may include connectionsor transfers, as long as those breaks are relatively short intime. Formally, we provide the following definitions.
Definition 1 (Transit record). A transit record trcontains the following information:
• trroute: the bus/subway route number;
• trsboard, trtboard: the boarding station and time; and
• trsexit, trtexit: the exiting station and time.
As a result, for each transit record, we were able to com-pute the travel distance trdist, travel time trtime and numberof stops trstops during the transit.
Definition 2 (Trip). A trip Tr is a sequence of tran-sit records Tr = (tr1, tr2, · · · , trn), where the passenger’sorigin location is Trorigin = tr1vboard and the destination isTrdest = trnsexit.
In practice, we construct one trip record if and only if thetime gap between two consecutive transit records is no morethan 30 minutes. The trip’s time duration is calculated asTrtime = trntexit − tr1tboard.
2.2 Geographical InformationTo project the transit records to the city map, we made
use of two datasets of important geographical information.Namely, the points of interests (POI) data and the publictransit network information.
Table 1: Categories of Functional RegionsCategory Examples FrequencyHome Apartment buildings 28,731Work Government or office buildings 71,364Education Schools, training centers 3,527Food Restaurants and dining 56,906Shopping Shopping malls and outlets 24,310Entertainment Museums, theaters, clubs 18,223Scenic Spot Parks, sports fields 2,362Transportation Airports, transit centers 15,287Healthcare Hospitals, pharmacy 8,685Car services Car sales, repairs 1,781
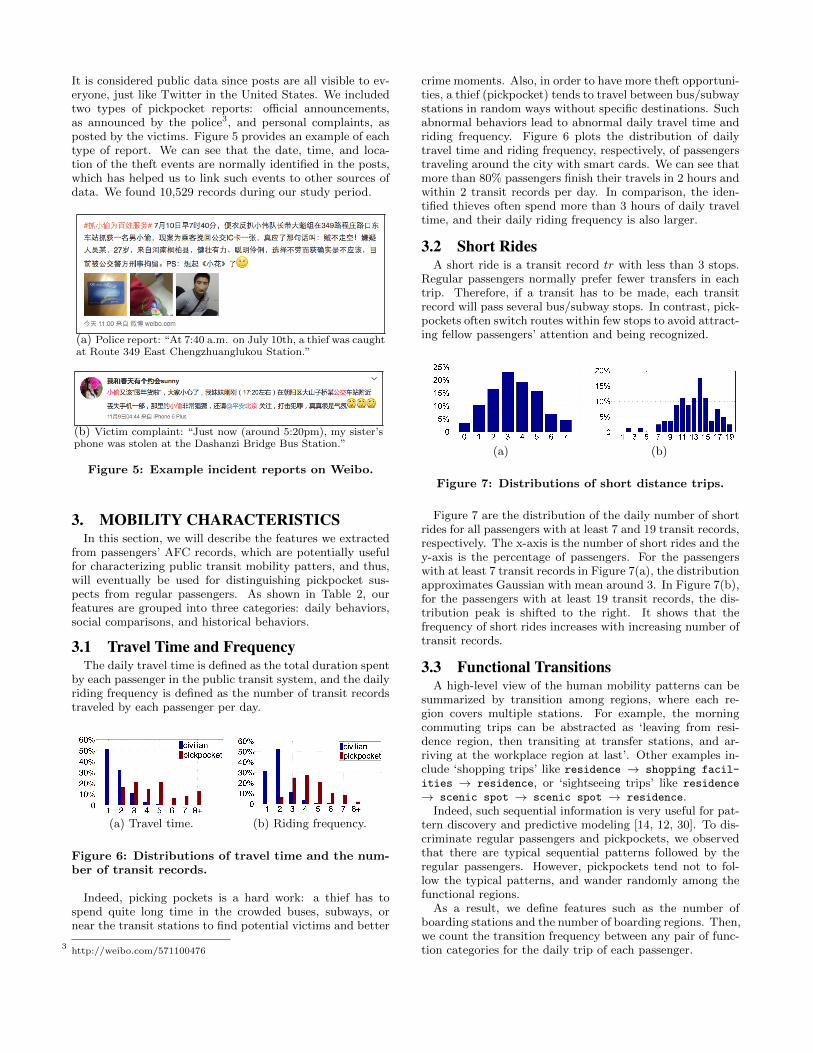
With the POI data, we followed Yuan’s work [28] to seg-ment the urban area into small regions by major road net-works, and then categorize each region into one of ten func-tions, as listed in Table 1. These regions are then color codedand visualized in Figure 4(a).
(a) Functional Regions (b) Stations
Figure 4: Geographical information.
The public transit network dataset provides basic infor-mation of each route of buses and subways. Each route isa sequence of stations, and the raw data include the routenumber, the sequence ID in the route, the name of the sta-tion, and the geo-location expressed as latitude and longi-tude. As shown in Figure 4(b), in total, we have 44,524bus stations (points in gray) covered by 896 bus routes, and320 subway stations (points in blue) covered by 18 subwayroutes. To remove the redundancy and better model thehuman mobility pattern, we merge stations located at thesame road intersection.
2.3 Incident ReportsConfirmed pickpocket incidents are publicly announced
via Sina Weibo, the primary social network services in China.
It is considered public data since posts are all visible to ev-eryone, just like Twitter in the United States. We includedtwo types of pickpocket reports: official announcements,as announced by the police3, and personal complaints, asposted by the victims. Figure 5 provides an example of eachtype of report. We can see that the date, time, and loca-tion of the theft events are normally identified in the posts,which has helped us to link such events to other sources ofdata. We found 10,529 records during our study period.
(a) Police report: “At 7:40 a.m. on July 10th, a thief was caughtat Route 349 East Chengzhuanglukou Station.”
(b) Victim complaint: “Just now (around 5:20pm), my sister’sphone was stolen at the Dashanzi Bridge Bus Station.”
Figure 5: Example incident reports on Weibo.
3. MOBILITY CHARACTERISTICSIn this section, we will describe the features we extracted
from passengers’ AFC records, which are potentially usefulfor characterizing public transit mobility patters, and thus,will eventually be used for distinguishing pickpocket sus-pects from regular passengers. As shown in Table 2, ourfeatures are grouped into three categories: daily behaviors,social comparisons, and historical behaviors.
3.1 Travel Time and FrequencyThe daily travel time is defined as the total duration spent
by each passenger in the public transit system, and the dailyriding frequency is defined as the number of transit recordstraveled by each passenger per day.
(a) Travel time. (b) Riding frequency.
Figure 6: Distributions of travel time and the num-ber of transit records.
Indeed, picking pockets is a hard work: a thief has tospend quite long time in the crowded buses, subways, ornear the transit stations to find potential victims and better
3http://weibo.com/571100476
crime moments. Also, in order to have more theft opportuni-ties, a thief (pickpocket) tends to travel between bus/subwaystations in random ways without specific destinations. Suchabnormal behaviors lead to abnormal daily travel time andriding frequency. Figure 6 plots the distribution of dailytravel time and riding frequency, respectively, of passengerstraveling around the city with smart cards. We can see thatmore than 80% passengers finish their travels in 2 hours andwithin 2 transit records per day. In comparison, the iden-tified thieves often spend more than 3 hours of daily traveltime, and their daily riding frequency is also larger.
3.2 Short RidesA short ride is a transit record tr with less than 3 stops.
Regular passengers normally prefer fewer transfers in eachtrip. Therefore, if a transit has to be made, each transitrecord will pass several bus/subway stops. In contrast, pick-pockets often switch routes within few stops to avoid attract-ing fellow passengers’ attention and being recognized.
(a) (b)
Figure 7: Distributions of short distance trips.
Figure 7 are the distribution of the daily number of shortrides for all passengers with at least 7 and 19 transit records,respectively. The x-axis is the number of short rides and they-axis is the percentage of passengers. For the passengerswith at least 7 transit records in Figure 7(a), the distributionapproximates Gaussian with mean around 3. In Figure 7(b),for the passengers with at least 19 transit records, the dis-tribution peak is shifted to the right. It shows that thefrequency of short rides increases with increasing number oftransit records.
3.3 Functional TransitionsA high-level view of the human mobility patterns can be
summarized by transition among regions, where each re-gion covers multiple stations. For example, the morningcommuting trips can be abstracted as ‘leaving from resi-dence region, then transiting at transfer stations, and ar-riving at the workplace region at last’. Other examples in-clude ‘shopping trips’ like residence → shopping facil-
ities → residence, or ‘sightseeing trips’ like residence
→ scenic spot → scenic spot → residence.Indeed, such sequential information is very useful for pat-
tern discovery and predictive modeling [14, 12, 30]. To dis-criminate regular passengers and pickpockets, we observedthat there are typical sequential patterns followed by theregular passengers. However, pickpockets tend not to fol-low the typical patterns, and wander randomly among thefunctional regions.
As a result, we define features such as the number ofboarding stations and the number of boarding regions. Then,we count the transition frequency between any pair of func-tion categories for the daily trip of each passenger.
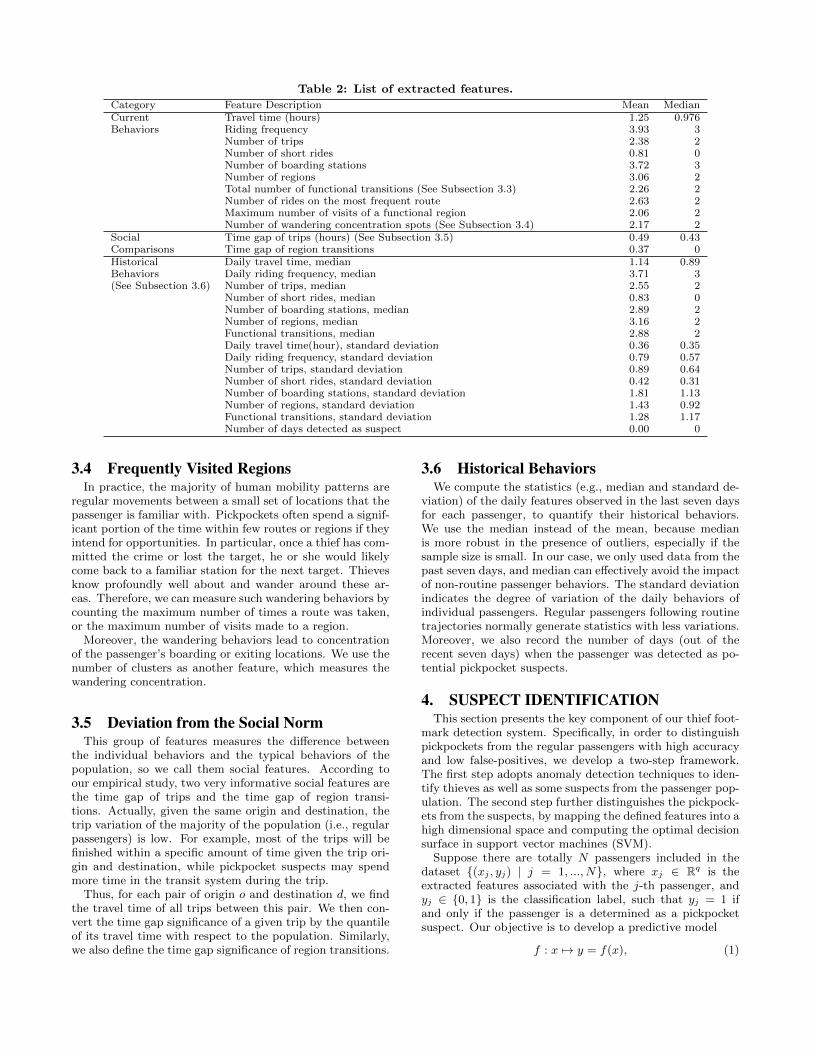
Table 2: List of extracted features.
Category Feature Description Mean MedianCurrent Travel time (hours) 1.25 0.976Behaviors Riding frequency 3.93 3
Number of trips 2.38 2Number of short rides 0.81 0Number of boarding stations 3.72 3Number of regions 3.06 2Total number of functional transitions (See Subsection 3.3) 2.26 2Number of rides on the most frequent route 2.63 2Maximum number of visits of a functional region 2.06 2Number of wandering concentration spots (See Subsection 3.4) 2.17 2
Social Time gap of trips (hours) (See Subsection 3.5) 0.49 0.43Comparisons Time gap of region transitions 0.37 0Historical Daily travel time, median 1.14 0.89Behaviors Daily riding frequency, median 3.71 3(See Subsection 3.6) Number of trips, median 2.55 2
Number of short rides, median 0.83 0Number of boarding stations, median 2.89 2Number of regions, median 3.16 2Functional transitions, median 2.88 2Daily travel time(hour), standard deviation 0.36 0.35Daily riding frequency, standard deviation 0.79 0.57Number of trips, standard deviation 0.89 0.64Number of short rides, standard deviation 0.42 0.31Number of boarding stations, standard deviation 1.81 1.13Number of regions, standard deviation 1.43 0.92Functional transitions, standard deviation 1.28 1.17Number of days detected as suspect 0.00 0
3.4 Frequently Visited RegionsIn practice, the majority of human mobility patterns are
regular movements between a small set of locations that thepassenger is familiar with. Pickpockets often spend a signif-icant portion of the time within few routes or regions if theyintend for opportunities. In particular, once a thief has com-mitted the crime or lost the target, he or she would likelycome back to a familiar station for the next target. Thievesknow profoundly well about and wander around these ar-eas. Therefore, we can measure such wandering behaviors bycounting the maximum number of times a route was taken,or the maximum number of visits made to a region.
Moreover, the wandering behaviors lead to concentrationof the passenger’s boarding or exiting locations. We use thenumber of clusters as another feature, which measures thewandering concentration.
3.5 Deviation from the Social NormThis group of features measures the difference between
the individual behaviors and the typical behaviors of thepopulation, so we call them social features. According toour empirical study, two very informative social features arethe time gap of trips and the time gap of region transi-tions. Actually, given the same origin and destination, thetrip variation of the majority of the population (i.e., regularpassengers) is low. For example, most of the trips will befinished within a specific amount of time given the trip ori-gin and destination, while pickpocket suspects may spendmore time in the transit system during the trip.
Thus, for each pair of origin o and destination d, we findthe travel time of all trips between this pair. We then con-vert the time gap significance of a given trip by the quantileof its travel time with respect to the population. Similarly,we also define the time gap significance of region transitions.
3.6 Historical BehaviorsWe compute the statistics (e.g., median and standard de-
viation) of the daily features observed in the last seven daysfor each passenger, to quantify their historical behaviors.We use the median instead of the mean, because medianis more robust in the presence of outliers, especially if thesample size is small. In our case, we only used data from thepast seven days, and median can effectively avoid the impactof non-routine passenger behaviors. The standard deviationindicates the degree of variation of the daily behaviors ofindividual passengers. Regular passengers following routinetrajectories normally generate statistics with less variations.Moreover, we also record the number of days (out of therecent seven days) when the passenger was detected as po-tential pickpocket suspects.
4. SUSPECT IDENTIFICATIONThis section presents the key component of our thief foot-
mark detection system. Specifically, in order to distinguishpickpockets from the regular passengers with high accuracyand low false-positives, we develop a two-step framework.The first step adopts anomaly detection techniques to iden-tify thieves as well as some suspects from the passenger pop-ulation. The second step further distinguishes the pickpock-ets from the suspects, by mapping the defined features into ahigh dimensional space and computing the optimal decisionsurface in support vector machines (SVM).
Suppose there are totally N passengers included in thedataset {(xj , yj) | j = 1, ..., N}, where xj ∈ Rq is theextracted features associated with the j-th passenger, andyj ∈ {0, 1} is the classification label, such that yj = 1 ifand only if the passenger is a determined as a pickpocketsuspect. Our objective is to develop a predictive model
f : x 7→ y = f(x), (1)
which can be used to identify pickpockets from the regularpassenger population.
4.1 A Two-Step FrameworkIn this study, we develop a two-step framework for identi-
fying pickpocket suspects. On one hand, since the dominantmajority of the passengers are regular ones, it is non-trivialto use a classification algorithm. Specifically, the percentageof confirmed pickpockets is extremely low in the passengerpopulation. Simple heuristics like over-sampling and under-sampling would only be helpful for handling moderate classimbalance, but not imbalance as extreme as ours. Buildingrobust machine learning models for such unbalanced data isstill an active research area in the literature [21, 4, 16, 17].On the other hand, utilizing anomaly detection algorithms,which are typically unsupervised, not only cannot scale well,but also may lead to significant false-positives, since manyregular passengers who occasionally perform irregular activ-ities can be misclassified as suspects.
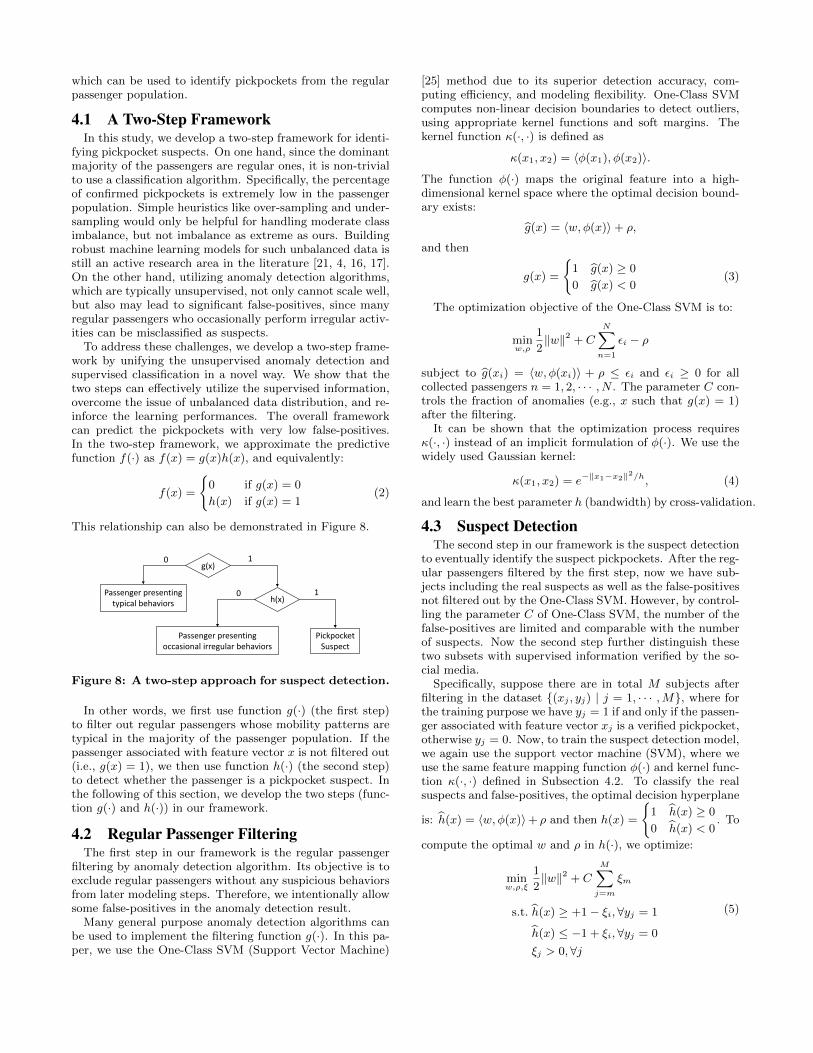
To address these challenges, we develop a two-step frame-work by unifying the unsupervised anomaly detection andsupervised classification in a novel way. We show that thetwo steps can effectively utilize the supervised information,overcome the issue of unbalanced data distribution, and re-inforce the learning performances. The overall frameworkcan predict the pickpockets with very low false-positives.In the two-step framework, we approximate the predictivefunction f(·) as f(x) = g(x)h(x), and equivalently:
f(x) =
{0 if g(x) = 0
h(x) if g(x) = 1(2)
This relationship can also be demonstrated in Figure 8.
g(x)
h(x)Passenger presenting
typical behaviors
Passenger presenting occasional irregular behaviors
Pickpocket Suspect
0 1
0 1
Figure 8: A two-step approach for suspect detection.
In other words, we first use function g(·) (the first step)to filter out regular passengers whose mobility patterns aretypical in the majority of the passenger population. If thepassenger associated with feature vector x is not filtered out(i.e., g(x) = 1), we then use function h(·) (the second step)to detect whether the passenger is a pickpocket suspect. Inthe following of this section, we develop the two steps (func-tion g(·) and h(·)) in our framework.
4.2 Regular Passenger FilteringThe first step in our framework is the regular passenger
filtering by anomaly detection algorithm. Its objective is toexclude regular passengers without any suspicious behaviorsfrom later modeling steps. Therefore, we intentionally allowsome false-positives in the anomaly detection result.
Many general purpose anomaly detection algorithms canbe used to implement the filtering function g(·). In this pa-per, we use the One-Class SVM (Support Vector Machine)
[25] method due to its superior detection accuracy, com-puting efficiency, and modeling flexibility. One-Class SVMcomputes non-linear decision boundaries to detect outliers,using appropriate kernel functions and soft margins. Thekernel function κ(·, ·) is defined as
κ(x1, x2) = 〈φ(x1), φ(x2)〉.
The function φ(·) maps the original feature into a high-dimensional kernel space where the optimal decision bound-ary exists:
g(x) = 〈w, φ(x)〉+ ρ,
and then
g(x) =
{1 g(x) ≥ 0
0 g(x) < 0(3)
The optimization objective of the One-Class SVM is to:
minw,ρ
1
2‖w‖2 + C
N∑n=1
εi − ρ
subject to g(xi) = 〈w, φ(xi)〉 + ρ ≤ εi and εi ≥ 0 for allcollected passengers n = 1, 2, · · · , N . The parameter C con-trols the fraction of anomalies (e.g., x such that g(x) = 1)after the filtering.
It can be shown that the optimization process requiresκ(·, ·) instead of an implicit formulation of φ(·). We use thewidely used Gaussian kernel:
κ(x1, x2) = e−‖x1−x2‖2/h, (4)
and learn the best parameter h (bandwidth) by cross-validation.
4.3 Suspect DetectionThe second step in our framework is the suspect detection
to eventually identify the suspect pickpockets. After the reg-ular passengers filtered by the first step, now we have sub-jects including the real suspects as well as the false-positivesnot filtered out by the One-Class SVM. However, by control-ling the parameter C of One-Class SVM, the number of thefalse-positives are limited and comparable with the numberof suspects. Now the second step further distinguish thesetwo subsets with supervised information verified by the so-cial media.
Specifically, suppose there are in total M subjects afterfiltering in the dataset {(xj , yj) | j = 1, · · · ,M}, where forthe training purpose we have yj = 1 if and only if the passen-ger associated with feature vector xj is a verified pickpocket,otherwise yj = 0. Now, to train the suspect detection model,we again use the support vector machine (SVM), where weuse the same feature mapping function φ(·) and kernel func-tion κ(·, ·) defined in Subsection 4.2. To classify the realsuspects and false-positives, the optimal decision hyperplane
is: h(x) = 〈w, φ(x)〉+ ρ and then h(x) =
{1 h(x) ≥ 0
0 h(x) < 0. To
compute the optimal w and ρ in h(·), we optimize:
minw,ρ,ξ
1
2‖w‖2 + C
M∑j=m
ξm
s.t. h(x) ≥ +1− ξi, ∀yj = 1
h(x) ≤ −1 + ξi, ∀yj = 0
ξj > 0,∀j
(5)
Again, C is trade-off parameter and the computing dependsonly on the kernel function define in Equation 4.
5. EXPERIMENTAL RESULTSIn this section, we present experimental results with our
proposed framework. First, we describe the experimentalenvironments and provide implementation details. Then, incomparison with several baseline methods, we demonstratethe effectiveness of our framework. We will also evaluate theusefulness of feature extracted in Table 2. Finally, we showpractical usage of our methods in a real-world system.
5.1 Experiment SettingsDatasets. We conduct our experiments on real-world
datasets containing over 1.6 billion transit records, as dis-cussed in Section 2. We split the data into historical trainingset and evaluation test set. Specifically, training set coversthree months (from April to June, 2014) and test set comesfrom the following two weeks (in July 2014). Also, fromthe training set, we filter out passengers whose maximumnumber of daily records is no more than three.
Platform. All experiments were conducted on a Win-dows Server 2012 64-bit system (4-CPU, each with 2.6GHzwith Quad-Core, and 128G main memory). All algorithmsand our real-world system were implemented with Java.
Baselines. The method is compared with a variety ofcompeting methods grouped into the following categories:
Classification methods (CM). The classification meth-ods, including logistic regression (LR), decision trees(DT), and support vector machines (SVM), are straight-forwardly fitted with the training set and evaluatedwith the test set. Since the proportion of positive in-stances are extremely low, the classification problem isunbalanced and it’s expected to observe high Type IIError. In experiments, we under-sample the negativeinstances to balance the data and improve the results.For each method, we repeat the sampling 10 times andreport the averaged results.
Anomaly detection (AD). Anomaly detection methods,such as one-class SVM (OCSVM) and local outlierfactor (LOF), seem more appropriate for our setting.Among them, LOF is unsupervised, finding outliersby measuring the local deviation of a given data pointwith respect to its neighbors. OC-SVM can be fitted ina supervised manner, with only the negative instancesin the training set, to identify the suspects.
Two-step (TS) methods. As aforementioned, our approachis a TS method, consisting of unsupervised one-classSVM and supervised two-class SVM. For comparison,we also experiment using the LOF as the first step toidentify potential suspects, and further use a classifi-cation method (e.g., LR or DT) the second step, tofilter out the false positives.
For all the methods with parameters, we optimize the pa-rameters with 10-fold cross-validation by further dividingthe training set into 80% for model fitting and 20% for pa-rameter validation.
Evaluation metrics. We use precision, recall, and F-score computed with test set to evaluate the performances
of different methods. The precision is the number of cor-rectly identified positives divided by the number of identi-fied positives instances. The recall is the number of correctlyidentified positives divided by the number of all positive in-stances in the test set. Then, the F-score is defined as:
F-score = 2× precision× recallprecision+ recall
.
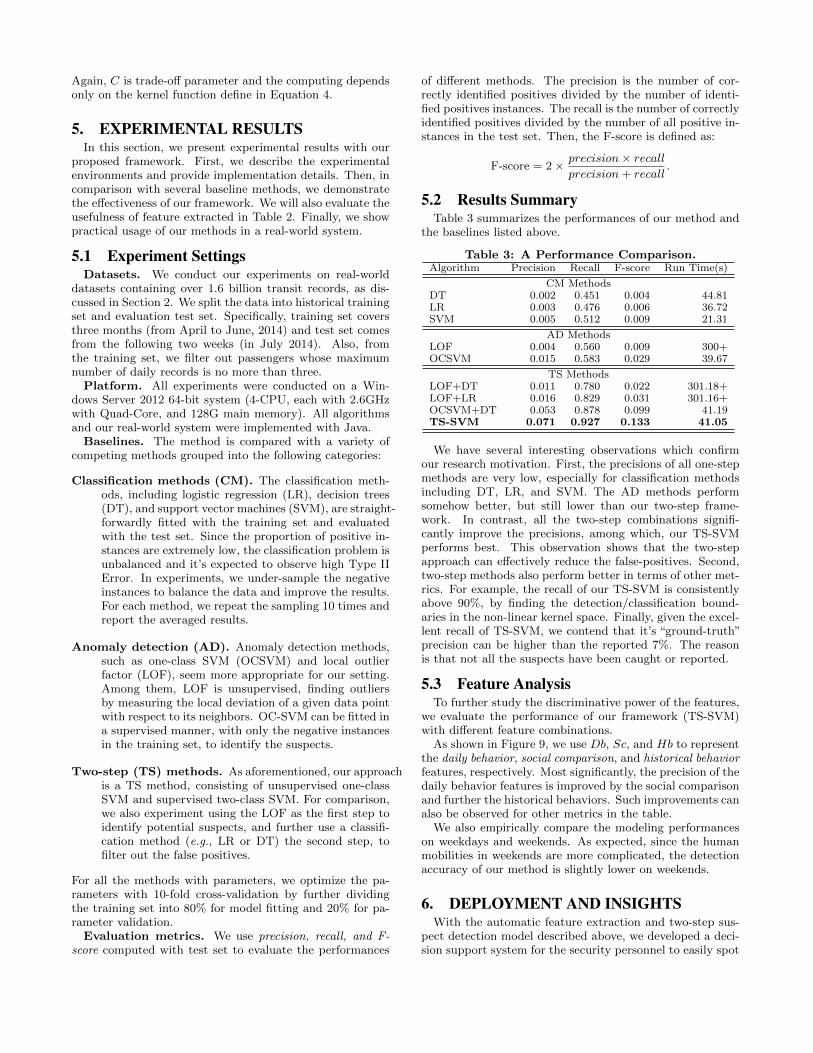
5.2 Results SummaryTable 3 summarizes the performances of our method and
the baselines listed above.
Table 3: A Performance Comparison.Algorithm Precision Recall F-score Run Time(s)
CM MethodsDT 0.002 0.451 0.004 44.81LR 0.003 0.476 0.006 36.72SVM 0.005 0.512 0.009 21.31
AD MethodsLOF 0.004 0.560 0.009 300+OCSVM 0.015 0.583 0.029 39.67
TS MethodsLOF+DT 0.011 0.780 0.022 301.18+LOF+LR 0.016 0.829 0.031 301.16+OCSVM+DT 0.053 0.878 0.099 41.19TS-SVM 0.071 0.927 0.133 41.05
We have several interesting observations which confirmour research motivation. First, the precisions of all one-stepmethods are very low, especially for classification methodsincluding DT, LR, and SVM. The AD methods performsomehow better, but still lower than our two-step frame-work. In contrast, all the two-step combinations signifi-cantly improve the precisions, among which, our TS-SVMperforms best. This observation shows that the two-stepapproach can effectively reduce the false-positives. Second,two-step methods also perform better in terms of other met-rics. For example, the recall of our TS-SVM is consistentlyabove 90%, by finding the detection/classification bound-aries in the non-linear kernel space. Finally, given the excel-lent recall of TS-SVM, we contend that it’s “ground-truth”precision can be higher than the reported 7%. The reasonis that not all the suspects have been caught or reported.
5.3 Feature AnalysisTo further study the discriminative power of the features,
we evaluate the performance of our framework (TS-SVM)with different feature combinations.
As shown in Figure 9, we use Db, Sc, and Hb to representthe daily behavior, social comparison, and historical behaviorfeatures, respectively. Most significantly, the precision of thedaily behavior features is improved by the social comparisonand further the historical behaviors. Such improvements canalso be observed for other metrics in the table.
We also empirically compare the modeling performanceson weekdays and weekends. As expected, since the humanmobilities in weekends are more complicated, the detectionaccuracy of our method is slightly lower on weekends.
6. DEPLOYMENT AND INSIGHTSWith the automatic feature extraction and two-step sus-
pect detection model described above, we developed a deci-sion support system for the security personnel to easily spot
(a) Precision (b) Recall
(c) F-score
1.5%
1%
0.5%
0
(d) Standard Deviations
Figure 9: The impact of feature combinations.
pickpocket hotspots, and crack down on the suspects effi-ciently at the crime scene. In this section, we demonstratehow our system works in practice.
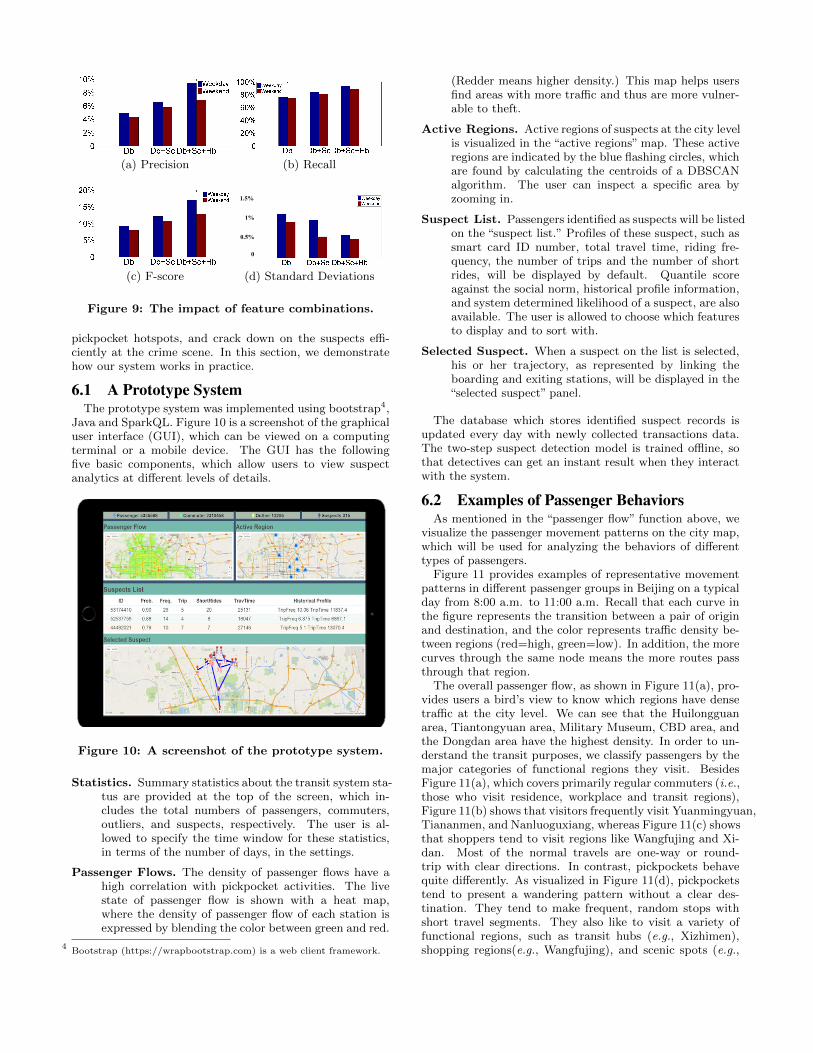
6.1 A Prototype SystemThe prototype system was implemented using bootstrap4,
Java and SparkQL. Figure 10 is a screenshot of the graphicaluser interface (GUI), which can be viewed on a computingterminal or a mobile device. The GUI has the followingfive basic components, which allow users to view suspectanalytics at different levels of details.
Figure 10: A screenshot of the prototype system.
Statistics. Summary statistics about the transit system sta-tus are provided at the top of the screen, which in-cludes the total numbers of passengers, commuters,outliers, and suspects, respectively. The user is al-lowed to specify the time window for these statistics,in terms of the number of days, in the settings.
Passenger Flows. The density of passenger flows have ahigh correlation with pickpocket activities. The livestate of passenger flow is shown with a heat map,where the density of passenger flow of each station isexpressed by blending the color between green and red.
4Bootstrap (https://wrapbootstrap.com) is a web client framework.
(Redder means higher density.) This map helps usersfind areas with more traffic and thus are more vulner-able to theft.
Active Regions. Active regions of suspects at the city levelis visualized in the “active regions” map. These activeregions are indicated by the blue flashing circles, whichare found by calculating the centroids of a DBSCANalgorithm. The user can inspect a specific area byzooming in.
Suspect List. Passengers identified as suspects will be listedon the “suspect list.” Profiles of these suspect, such assmart card ID number, total travel time, riding fre-quency, the number of trips and the number of shortrides, will be displayed by default. Quantile scoreagainst the social norm, historical profile information,and system determined likelihood of a suspect, are alsoavailable. The user is allowed to choose which featuresto display and to sort with.
Selected Suspect. When a suspect on the list is selected,his or her trajectory, as represented by linking theboarding and exiting stations, will be displayed in the“selected suspect” panel.
The database which stores identified suspect records isupdated every day with newly collected transactions data.The two-step suspect detection model is trained offline, sothat detectives can get an instant result when they interactwith the system.
6.2 Examples of Passenger BehaviorsAs mentioned in the “passenger flow” function above, we
visualize the passenger movement patterns on the city map,which will be used for analyzing the behaviors of differenttypes of passengers.
Figure 11 provides examples of representative movementpatterns in different passenger groups in Beijing on a typicalday from 8:00 a.m. to 11:00 a.m. Recall that each curve inthe figure represents the transition between a pair of originand destination, and the color represents traffic density be-tween regions (red=high, green=low). In addition, the morecurves through the same node means the more routes passthrough that region.
The overall passenger flow, as shown in Figure 11(a), pro-vides users a bird’s view to know which regions have densetraffic at the city level. We can see that the Huilongguanarea, Tiantongyuan area, Military Museum, CBD area, andthe Dongdan area have the highest density. In order to un-derstand the transit purposes, we classify passengers by themajor categories of functional regions they visit. BesidesFigure 11(a), which covers primarily regular commuters (i.e.,those who visit residence, workplace and transit regions),Figure 11(b) shows that visitors frequently visit Yuanmingyuan,Tiananmen, and Nanluoguxiang, whereas Figure 11(c) showsthat shoppers tend to visit regions like Wangfujing and Xi-dan. Most of the normal travels are one-way or round-trip with clear directions. In contrast, pickpockets behavequite differently. As visualized in Figure 11(d), pickpocketstend to present a wandering pattern without a clear des-tination. They tend to make frequent, random stops withshort travel segments. They also like to visit a variety offunctional regions, such as transit hubs (e.g., Xizhimen),shopping regions(e.g., Wangfujing), and scenic spots (e.g.,
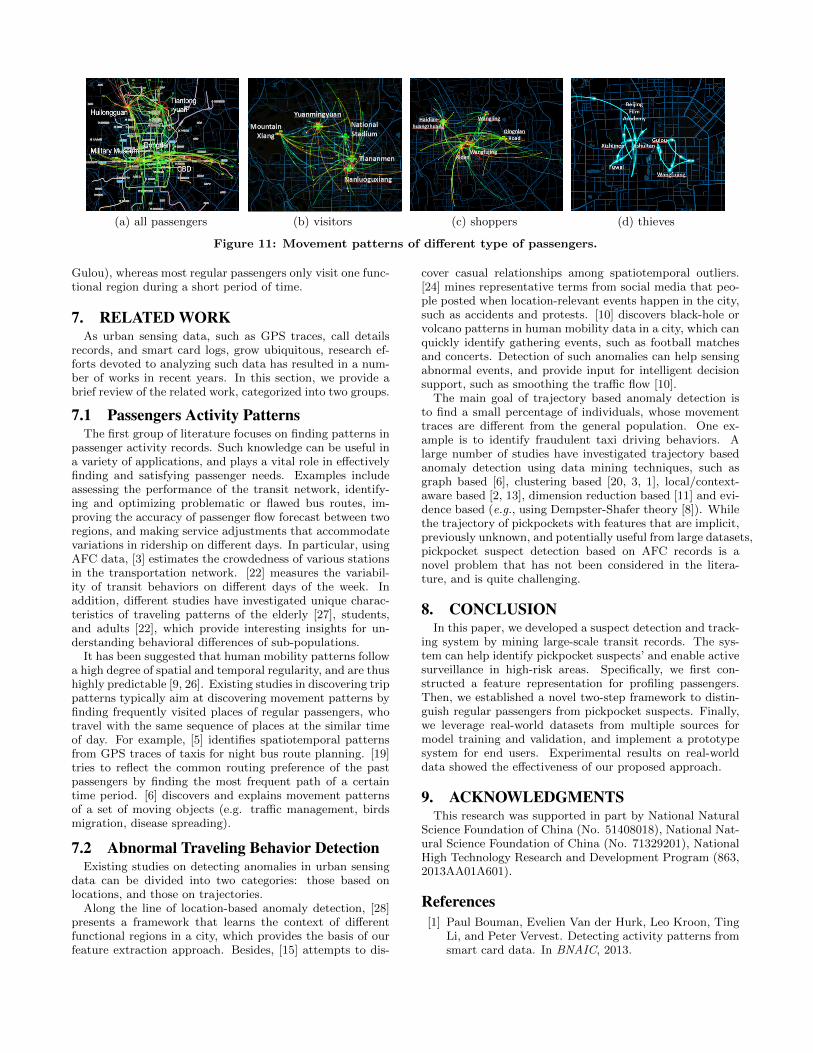
(a) all passengers (b) visitors (c) shoppers (d) thieves
Figure 11: Movement patterns of different type of passengers.
Gulou), whereas most regular passengers only visit one func-tional region during a short period of time.
7. RELATED WORKAs urban sensing data, such as GPS traces, call details
records, and smart card logs, grow ubiquitous, research ef-forts devoted to analyzing such data has resulted in a num-ber of works in recent years. In this section, we provide abrief review of the related work, categorized into two groups.
7.1 Passengers Activity PatternsThe first group of literature focuses on finding patterns in
passenger activity records. Such knowledge can be useful ina variety of applications, and plays a vital role in effectivelyfinding and satisfying passenger needs. Examples includeassessing the performance of the transit network, identify-ing and optimizing problematic or flawed bus routes, im-proving the accuracy of passenger flow forecast between tworegions, and making service adjustments that accommodatevariations in ridership on different days. In particular, usingAFC data, [3] estimates the crowdedness of various stationsin the transportation network. [22] measures the variabil-ity of transit behaviors on different days of the week. Inaddition, different studies have investigated unique charac-teristics of traveling patterns of the elderly [27], students,and adults [22], which provide interesting insights for un-derstanding behavioral differences of sub-populations.
It has been suggested that human mobility patterns followa high degree of spatial and temporal regularity, and are thushighly predictable [9, 26]. Existing studies in discovering trippatterns typically aim at discovering movement patterns byfinding frequently visited places of regular passengers, whotravel with the same sequence of places at the similar timeof day. For example, [5] identifies spatiotemporal patternsfrom GPS traces of taxis for night bus route planning. [19]tries to reflect the common routing preference of the pastpassengers by finding the most frequent path of a certaintime period. [6] discovers and explains movement patternsof a set of moving objects (e.g. traffic management, birdsmigration, disease spreading).
7.2 Abnormal Traveling Behavior DetectionExisting studies on detecting anomalies in urban sensing
data can be divided into two categories: those based onlocations, and those on trajectories.
Along the line of location-based anomaly detection, [28]presents a framework that learns the context of differentfunctional regions in a city, which provides the basis of ourfeature extraction approach. Besides, [15] attempts to dis-
cover casual relationships among spatiotemporal outliers.[24] mines representative terms from social media that peo-ple posted when location-relevant events happen in the city,such as accidents and protests. [10] discovers black-hole orvolcano patterns in human mobility data in a city, which canquickly identify gathering events, such as football matchesand concerts. Detection of such anomalies can help sensingabnormal events, and provide input for intelligent decisionsupport, such as smoothing the traffic flow [10].
The main goal of trajectory based anomaly detection isto find a small percentage of individuals, whose movementtraces are different from the general population. One ex-ample is to identify fraudulent taxi driving behaviors. Alarge number of studies have investigated trajectory basedanomaly detection using data mining techniques, such asgraph based [6], clustering based [20, 3, 1], local/context-aware based [2, 13], dimension reduction based [11] and evi-dence based (e.g., using Dempster-Shafer theory [8]). Whilethe trajectory of pickpockets with features that are implicit,previously unknown, and potentially useful from large datasets,pickpocket suspect detection based on AFC records is anovel problem that has not been considered in the litera-ture, and is quite challenging.
8. CONCLUSIONIn this paper, we developed a suspect detection and track-
ing system by mining large-scale transit records. The sys-tem can help identify pickpocket suspects’ and enable activesurveillance in high-risk areas. Specifically, we first con-structed a feature representation for profiling passengers.Then, we established a novel two-step framework to distin-guish regular passengers from pickpocket suspects. Finally,we leverage real-world datasets from multiple sources formodel training and validation, and implement a prototypesystem for end users. Experimental results on real-worlddata showed the effectiveness of our proposed approach.
9. ACKNOWLEDGMENTSThis research was supported in part by National Natural
Science Foundation of China (No. 51408018), National Nat-ural Science Foundation of China (No. 71329201), NationalHigh Technology Research and Development Program (863,2013AA01A601).
References[1] Paul Bouman, Evelien Van der Hurk, Leo Kroon, Ting
Li, and Peter Vervest. Detecting activity patterns fromsmart card data. In BNAIC, 2013.
[2] Markus M. Breunig, Hans-Peter Kriegel, Raymond T.Ng, and Jorg Sander. LOF: Identifying density-basedlocal outliers. SIGMOD Rec., 29(2):93–104, May 2000.
[3] Irina Ceapa, Chris Smith, and Licia Capra. Avoidingthe crowds: understanding tube station congestion pat-terns from trip data. In UrbComp, pages 134–141, 2012.
[4] Olivier Chapelle, Eren Manavoglu, and Romer Rosales.Simple and scalable response prediction for display ad-vertising. ACM Trans. Intell. Syst. Technol., 5(4):61:1–61:34, 2014.
[5] Chao Chen, Daqing Zhang, Zhi-Hua Zhou, Nan Li,Tulin Atmaca, and Shijian Li. B-planner: Night busroute planning using large-scale taxi gps traces. In Per-Com, pages 225–233, 2013.
[6] Ticiana L. Coelho da Silva, Jose A. F. de Macedo, andMarco A. Casanova. Discovering frequent mobility pat-terns on moving object data. In MobiGIS, pages 60–67,2014.
[7] Marcus Felson and Ronald V Clarke. Opportunitymakes the thief: Practical theory for crime prevention.Report 98, Policing and Reducing Crime Unit: PoliceResearch Series, 1998.
[8] Yong Ge, Hui Xiong, Chuanren Liu, and Zhi-Hua Zhou.A taxi driving fraud detection system. In ICDM, pages181–190, 2011.
[9] Marta C Gonzalez, Cesar A Hidalgo, and Albert-LaszloBarabasi. Understanding individual human mobilitypatterns. Nature, 453(7196):779–782, 2008.
[10] Liang Hong, Yu Zheng, Duncan Yung, Jingbo Shang,and Lei Zou. Detecting urban black holes based onhuman mobility data. In GIS, 2015.
[11] Shan Jiang, Joseph Ferreira Jr, and Marta C Gonza-lez. Discovering urban spatial-temporal structure fromhuman activity patterns. In UrbComp, pages 95–102,2012.
[12] Chuanren Liu, Fei Wang, Jianying Hu, and HuiXiong. Temporal phenotyping from longitudinal elec-tronic health records: A graph based framework. InKDD, pages 705–714. ACM, 2015.
[13] Chuanren Liu, Hui Xiong, Yong Ge, Wei Geng, andMatt Perkins. A stochastic model for context-awareanomaly detection in indoor location traces. In ICDM,pages 449–458, 2012.
[14] Chuanren Liu, Kai Zhang, Hui Xiong, Guofei Jiang,and Qiang Yang. Temporal skeletonization on sequen-tial data: Patterns, categorization, and visualization.IEEE Transactions on Knowledge and Data Engineer-ing, 28(1):211–223, Jan 2016.
[15] Wei Liu, Yu Zheng, Sanjay Chawla, Jing Yuan, and XieXing. Discovering spatio-temporal causal interactionsin traffic data streams. In KDD, pages 1010–1018, 2011.
[16] Xianglong Liu, Cheng Deng, Bo Lang, Dacheng Tao,and Xuelong Li. Query-adaptive reciprocal hash tablesfor nearest neighbor search. IEEE Transactions on Im-age Processing, 25(2):907–919, 2016.
[17] Xianglong Liu, Yadong Mu, Bo Lang, and Shih-FuChang. Mixed image-keyword query adaptive hashingover multilabel images. ACM Transactions on Multi-media Computing, Communications, and Applications,10(2):22:1–22:21, 2014.
[18] Yanchi Liu, Chuanren Liu, Jing Yuan, Lian Duan, Yan-jie Fu, Hui Xiong, Songhua Xu, and Junjie Wu. Intel-ligent bus routing with heterogeneous human mobilitypatterns. Knowledge and Information Systems, Forth-coming (Accepted as of Feb 2016).
[19] Wuman Luo, Haoyu Tan, Lei Chen, and Lionel M Ni.Finding time period-based most frequent path in bigtrajectory data. In SIGMOD, pages 713–724, 2013.
[20] Xiaolei Ma, Yao-Jan Wu, Yinhai Wang, Feng Chen,and Jianfeng Liu. Mining smart card data for transitriders travel patterns. Transportation Research Part C,36:1–12, 2013.
[21] H. Brendan McMahan, Gary Holt, D. Sculley, MichaelYoung, Dietmar Ebner, Julian Grady, Lan Nie, ToddPhillips, Eugene Davydov, Daniel Golovin, SharatChikkerur, Dan Liu, Martin Wattenberg, Arnar MarHrafnkelsson, Tom Boulos, and Jeremy Kubica. Adclick prediction: A view from the trenches. In KDD,pages 1222–1230, 2013.
[22] Catherine Morency, Martin Trepanier, and BrunoAgard. Analysing the variability of transit users be-haviour with smart card data. In ITSC, pages 44–49,2006.
[23] Graeme R Newman and Megan M McNally. Identitytheft literature review. Report 210459, United StatesDepartment of Justice, July 2005.
[24] Bei Pan, Yu Zheng, David Wilkie, and Cyrus Shahabi.Crowd sensing of traffic anomalies based on human mo-bility and social media. In GIS, pages 344–353, 2013.
[25] Bernhard Scholkopf, John C. Platt, John C. Shawe-Taylor, Alex J. Smola, and Robert C. Williamson. Es-timating the support of a high-dimensional distribution.Neural Computation, 13(7):1443–1471, 2001.
[26] Chaoming Song, Zehui Qu, Nicholas Blumm, andAlbert-Laszlo Barabasi. Limits of predictability in hu-man mobility. Science, 327(5968):1018–1021, 2010.
[27] Myung Joon Sung. Analysis of travel patterns of theelderly using transit smart card data. In TRB, volume11-2357, 2011.
[28] Jing Yuan, Yu Zheng, and Xing Xie. Discovering re-gions of different functions in a city using human mo-bility and pois. In KDD, pages 186–194, 2012.
[29] Kai Zheng, Yu Zheng, Nicholas Jing Yuan, Shuo Shang,and Xiaofang Zhou. Online discovery of gathering pat-terns over trajectories. IEEE Transactions on Knowl-edge and Data Engineering, 26(8):1974–1988, 2014.
[30] Hengshu Zhu, Chuanren Liu, Yong Ge, Hui Xiong, andEnhong Chen. Popularity modeling for mobile apps: Asequential approach. Cybernetics, IEEE Transactionson, 45(7):1303–1314, 2015.


