2008-07-01Chart 1
Developing Infrastructure and OperatingModels for Intermodal Shift (DIOMIS 2)
Benchmarking Intermodal Transport in the U.S. and Europe
10 March 2009
2008-07-01Chart 2
Benchmarking intermodal transport US and Europe
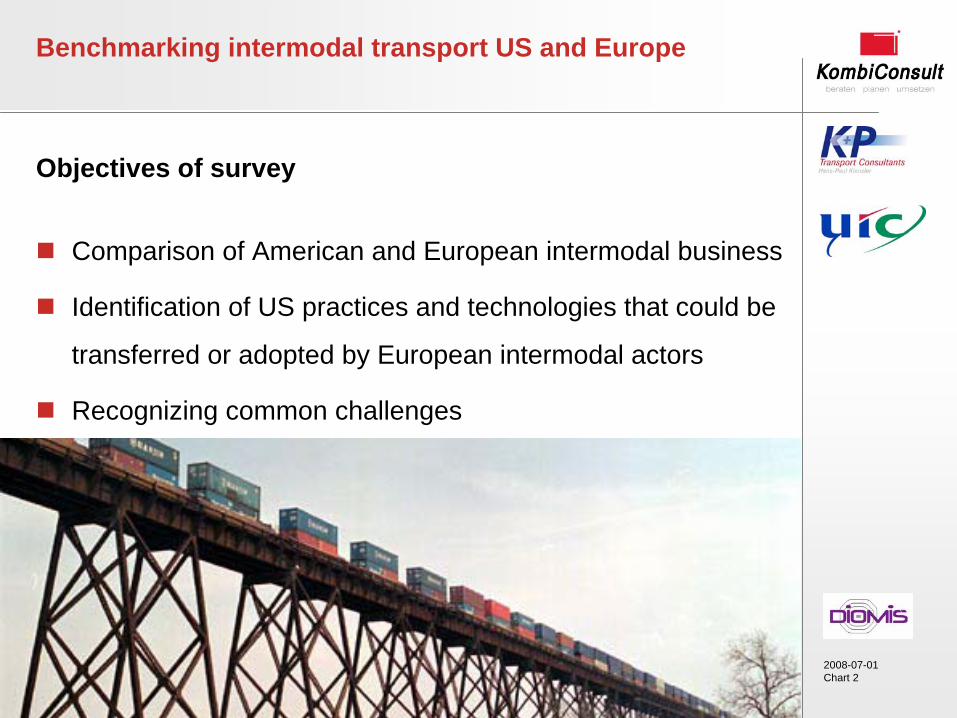
Objectives of survey
Comparison of American and European intermodal business
Identification of US practices and technologies that could be
transferred or adopted by European intermodal actors
Recognizing common challenges

2008-07-01Chart 3
Benchmarking intermodal transport US and Europe
Who provides intermodal services in the U.S.? -Class I freight railways (revenues > $360m)
2008-07-01Chart 6
Benchmarking intermodal transport US and Europe
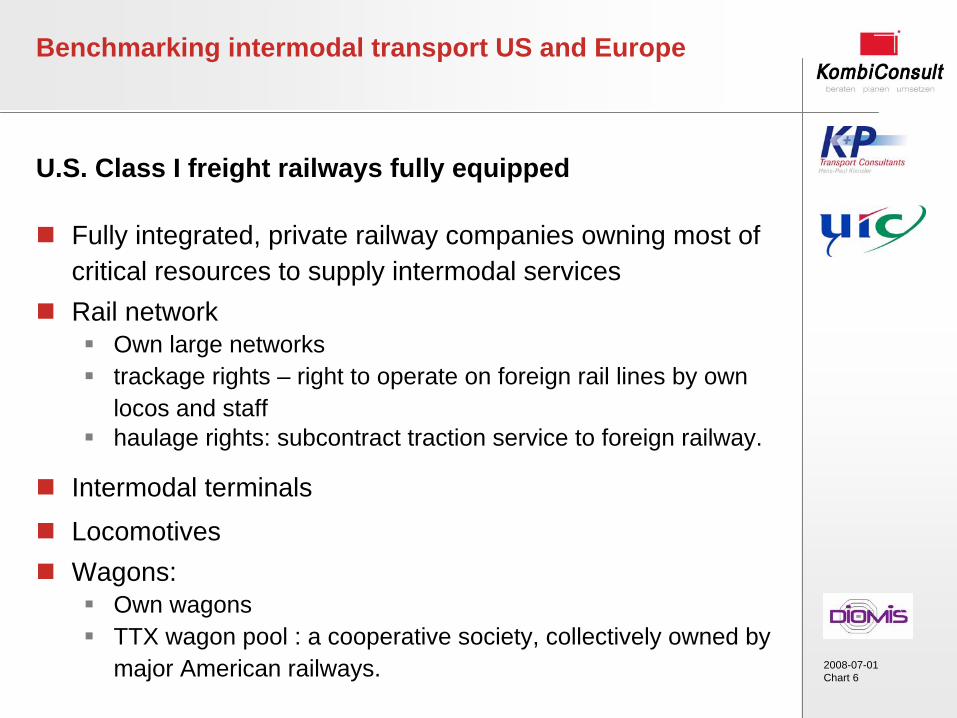
Fully integrated, private railway companies owning most of critical resources to supply intermodal services
Rail network
Own large networks
trackage rights – right to operate on foreign rail lines by own locos and staff
haulage rights: subcontract traction service to foreign railway.
Intermodal terminals
Locomotives
Wagons:
Own wagons
TTX wagon pool : a cooperative society, collectively owned by major American railways.
U.S. Class I freight railways fully equipped
2008-07-01Chart 7
Benchmarking intermodal transport US and Europe
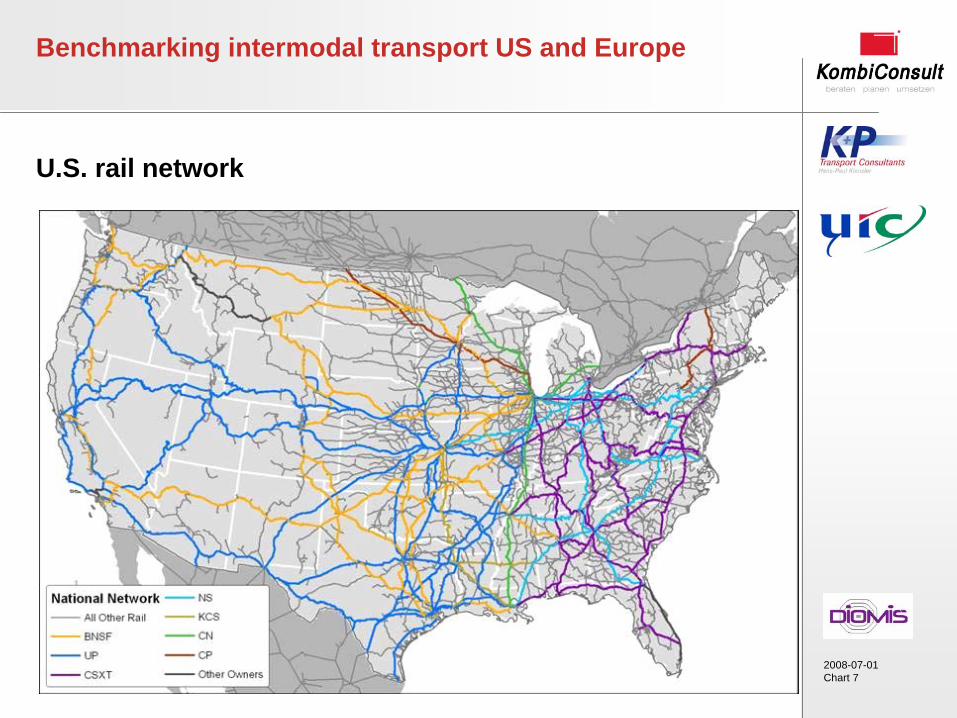
U.S. rail network
2008-07-01Chart 8
Benchmarking intermodal transport US and Europe
Intermodal market segments of U.S. railways
International traffic (container hinterland transport):
intermodal transport of sea-borne freight containers, mostly
marine (ISO) containers between American sea ports and
inland areas.
Domestic traffic (continental traffic)
intermodal transport of commodities with origin and
destination in North America, employing domestic containers,
liftable trailers (semi-trailers), and RoadRailers.
2008-07-01Chart 9
Benchmarking intermodal transport US and Europe
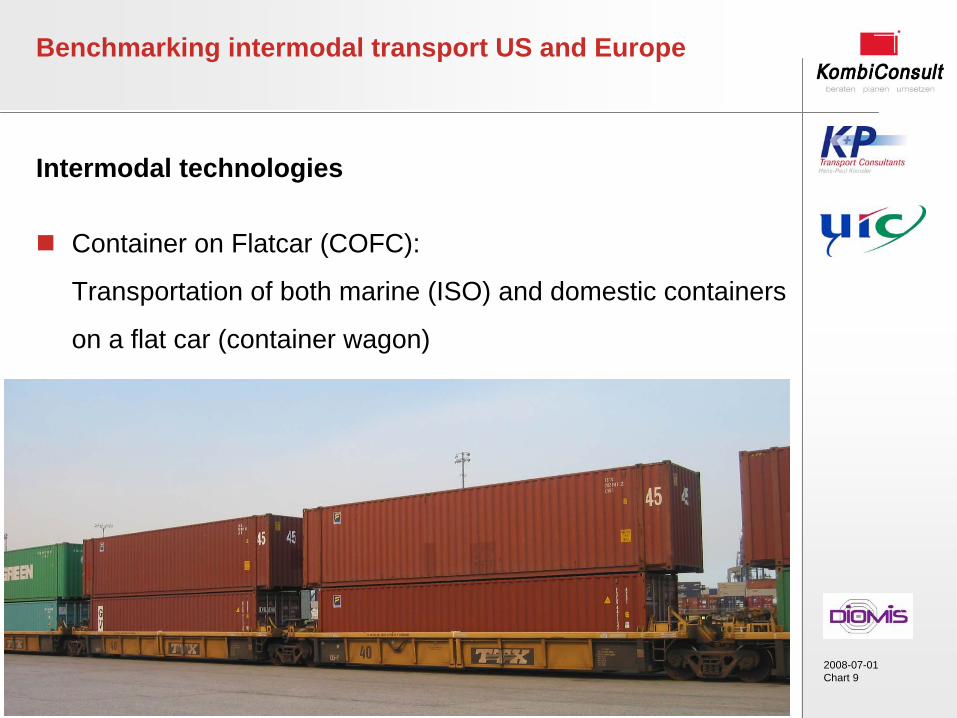
Intermodal technologies
Container on Flatcar (COFC):
Transportation of both marine (ISO) and domestic containers
on a flat car (container wagon)
2008-07-01Chart 10
Benchmarking intermodal transport US and Europe
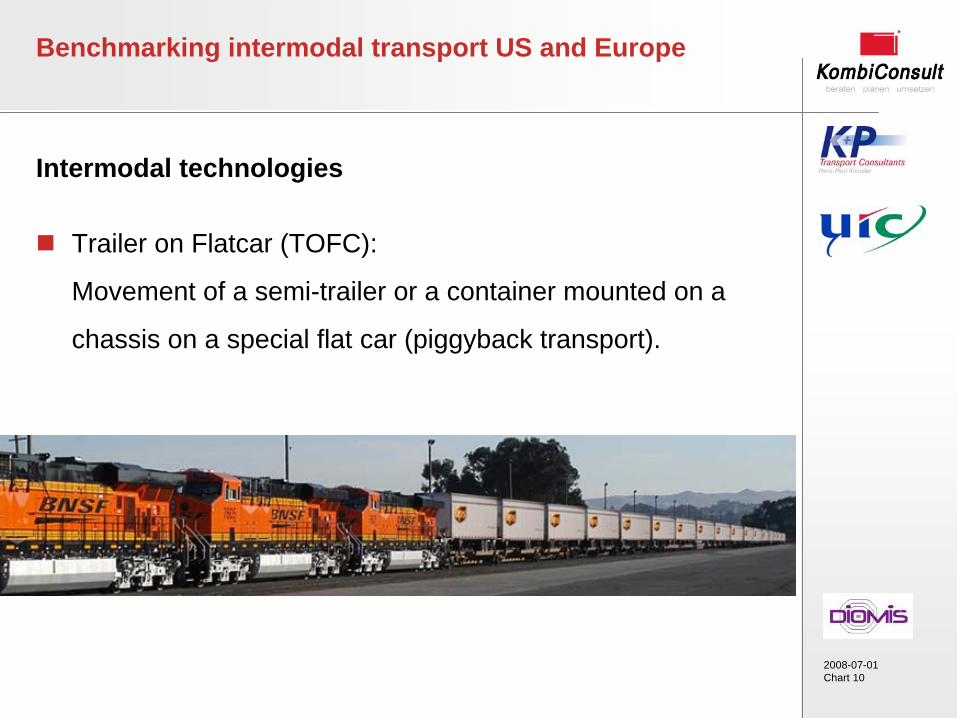
Intermodal technologies
Trailer on Flatcar (TOFC):
Movement of a semi-trailer or a container mounted on a
chassis on a special flat car (piggyback transport).
2008-07-01Chart 11
Benchmarking intermodal transport US and Europe
Intermodal technologies
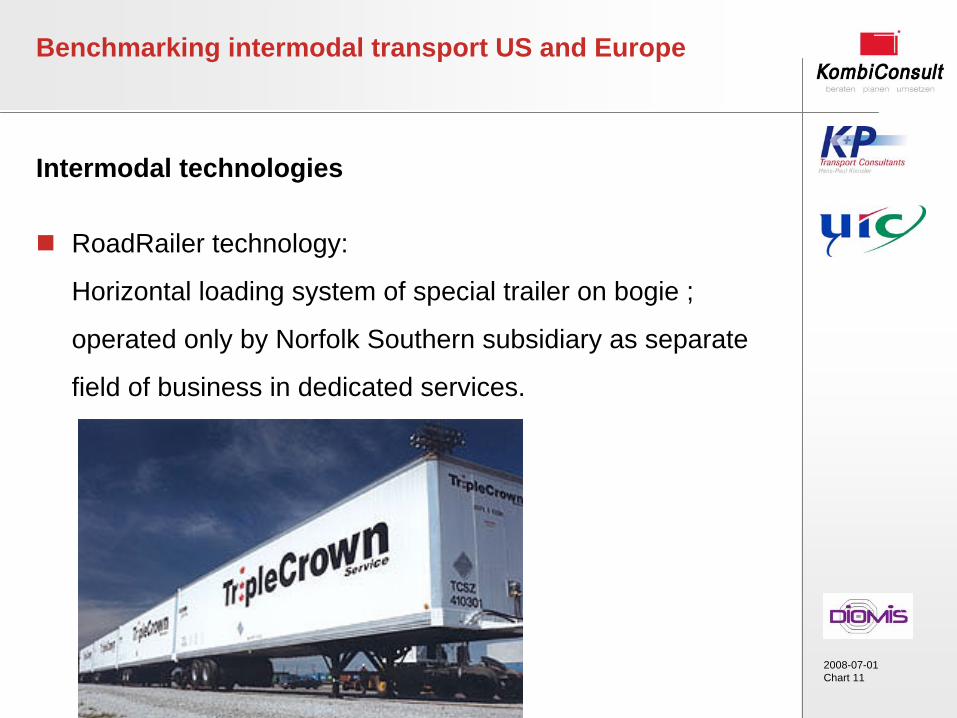
RoadRailer technology:
Horizontal loading system of special trailer on bogie ;
operated only by Norfolk Southern subsidiary as separate
field of business in dedicated services.
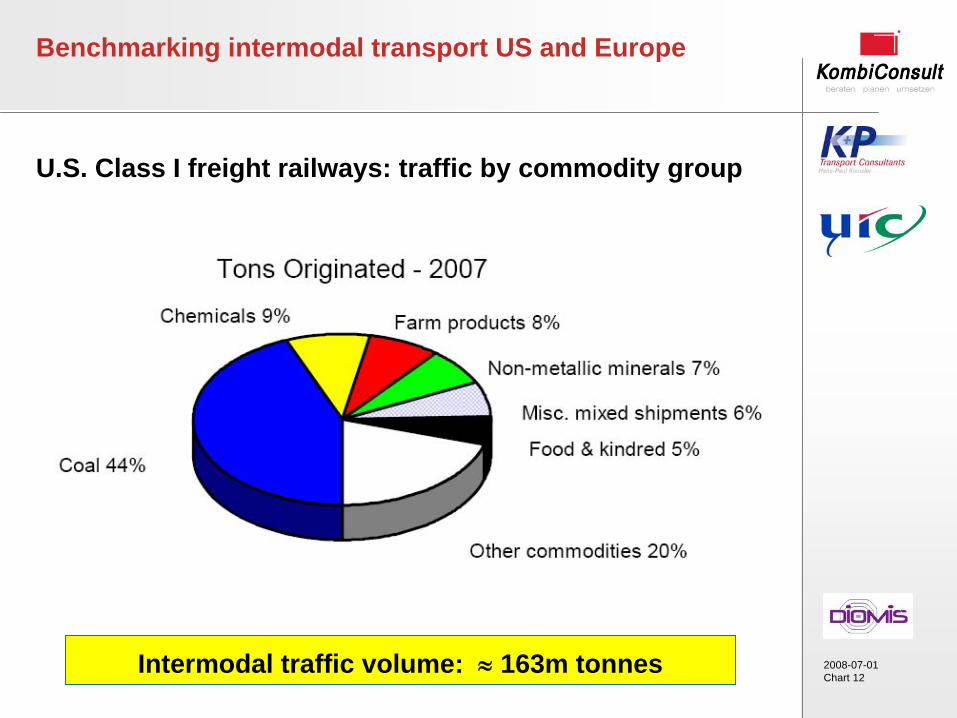
2008-07-01Chart 12
Benchmarking intermodal transport US and Europe
U.S. Class I freight railways: traffic by commodity group
Intermodal traffic volume:
163m tonnes
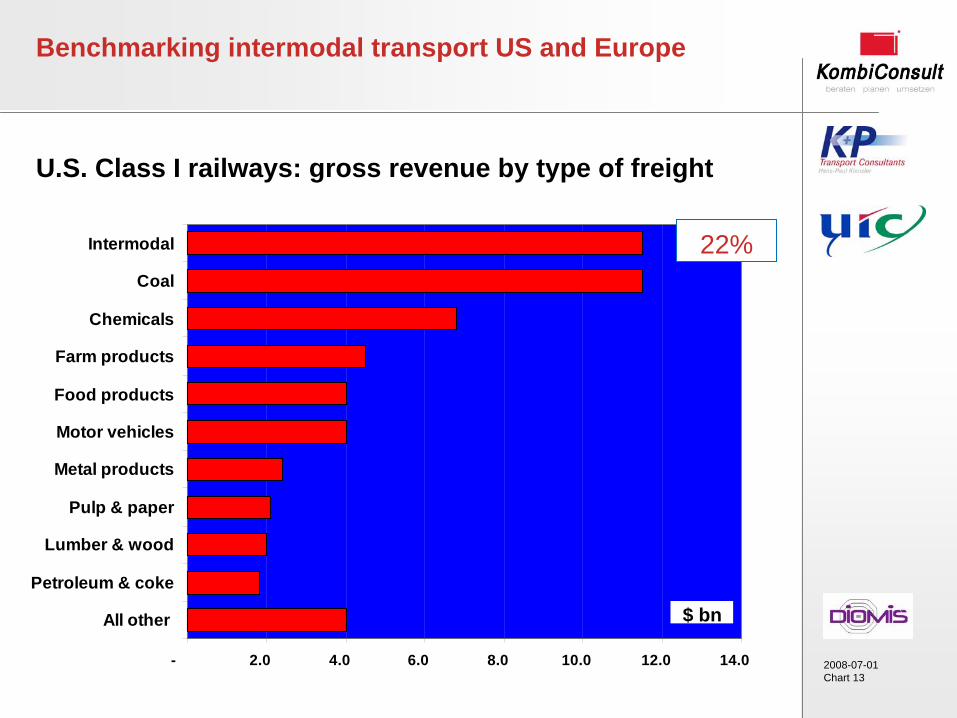
2008-07-01Chart 13
- 2.0 4.0 6.0 8.0 10.0 12.0 14.0
All other
Petroleum & coke
Lumber & wood
Pulp & paper
Metal products
Motor vehicles
Food products
Farm products
Chemicals
Coal
Intermodal
$ bn
Benchmarking intermodal transport US and Europe
U.S. Class I railways: gross revenue by type of freight
22%
2008-07-01Chart 14
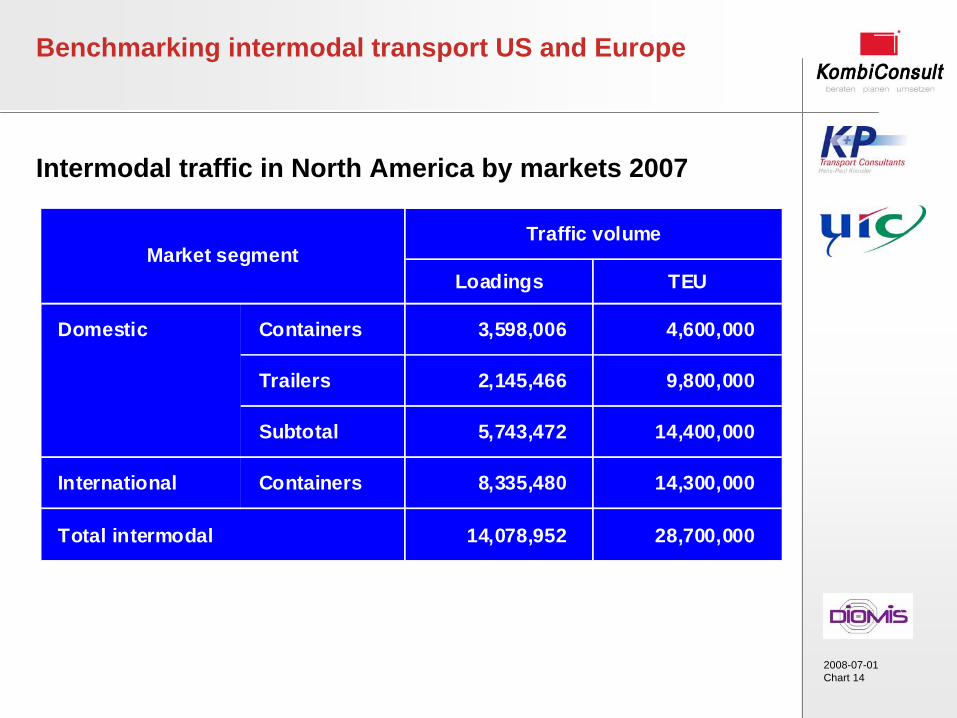
Benchmarking intermodal transport US and Europe
Intermodal traffic in North America by markets 2007
Loadings TEU
Domestic Containers 3,598,006 4,600,000
Trailers 2,145,466 9,800,000
Subtotal 5,743,472 14,400,000
International Containers 8,335,480 14,300,000
Total intermodal 14,078,952 28,700,000
Market segmentTraffic volume
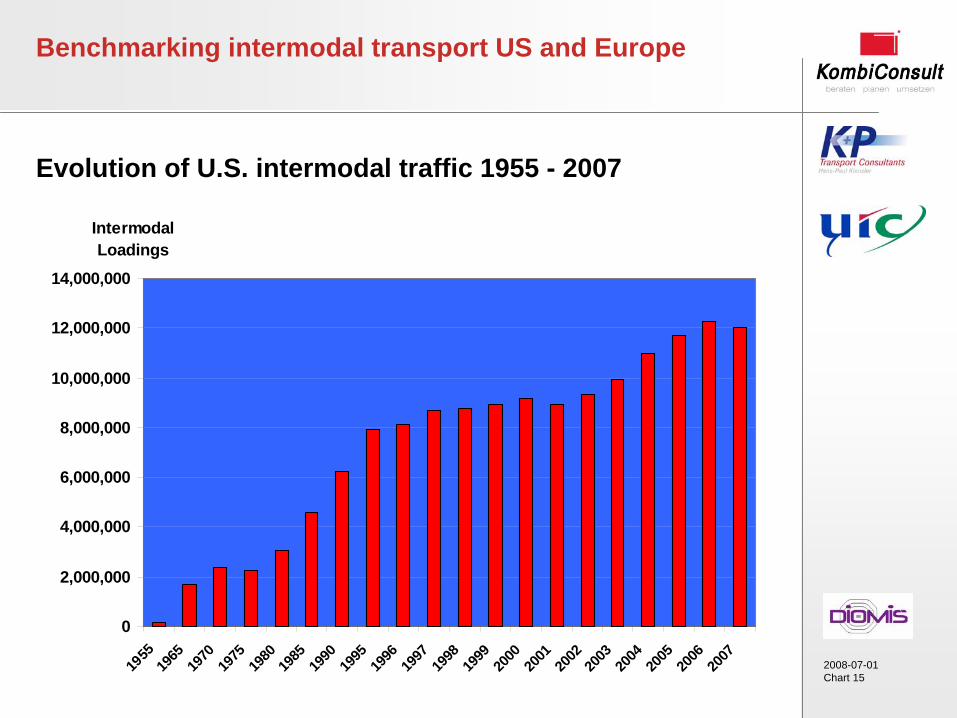
2008-07-01Chart 15
Benchmarking intermodal transport US and Europe
Evolution of U.S. intermodal traffic 1955 - 2007
0
2,000,000
4,000,000
6,000,000
8,000,000
10,000,000
12,000,000
14,000,000
1955
1965
19
70
1975
19
80
1985
19
90
1995
19
96
1997
19
98
1999
20
00
2001
20
02
2003
20
04
2005
20
06
2007
Intermodal Loadings
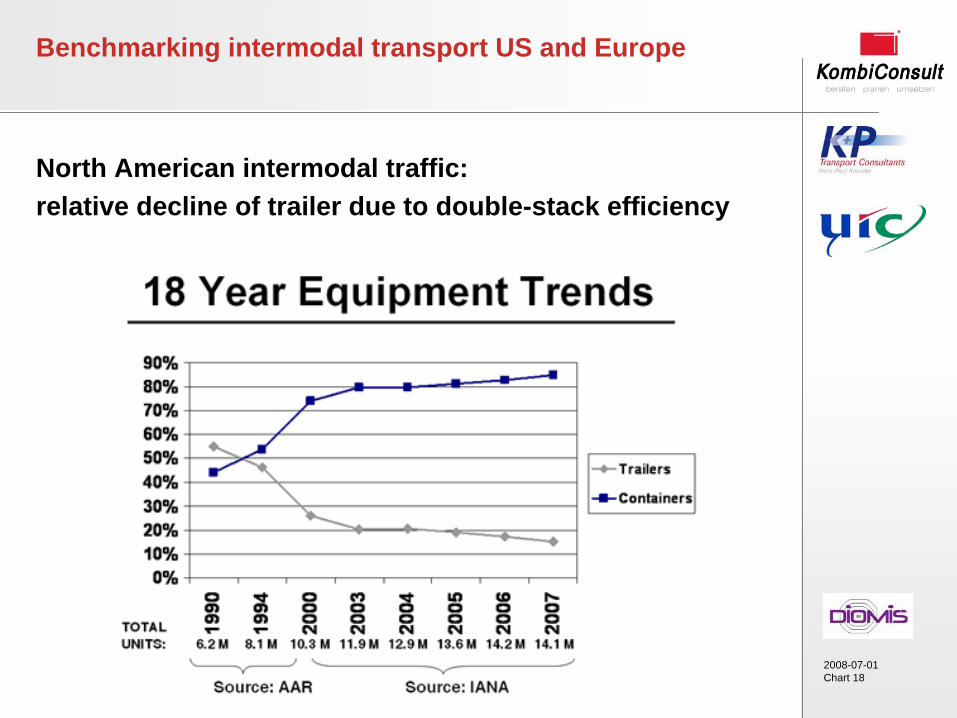
2008-07-01Chart 18
Benchmarking intermodal transport US and Europe
North American intermodal traffic: relative decline of trailer due to double-stack efficiency
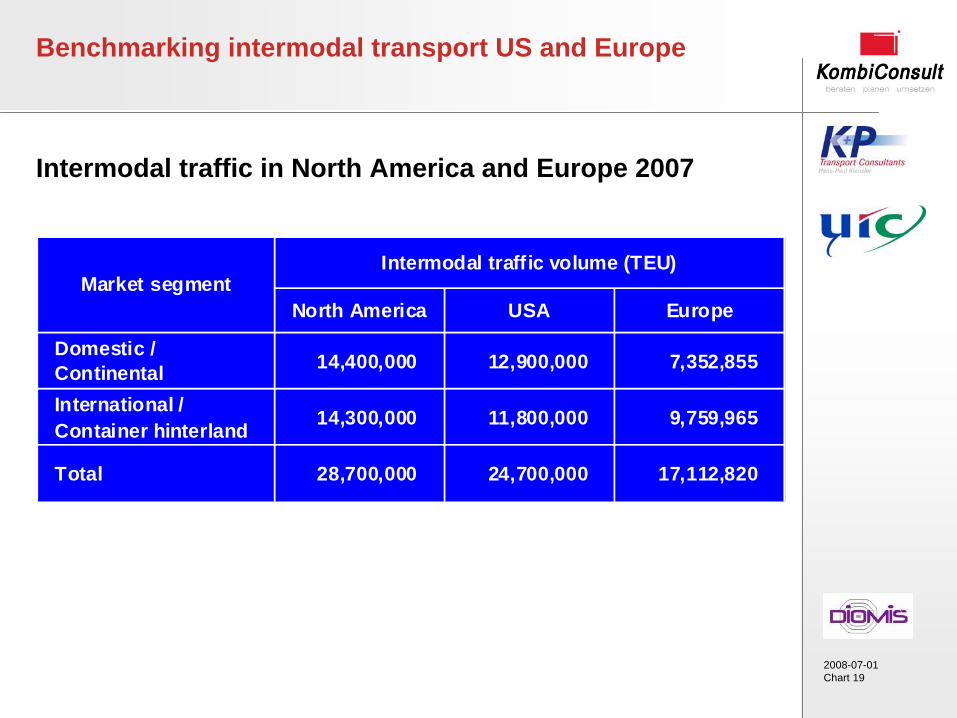
2008-07-01Chart 19
Benchmarking intermodal transport US and Europe
Intermodal traffic in North America and Europe 2007
North America USA Europe
Domestic / Continental 14,400,000 12,900,000 7,352,855
International / Container hinterland 14,300,000 11,800,000 9,759,965
Total 28,700,000 24,700,000 17,112,820
Intermodal traffic volume (TEU)Market segment
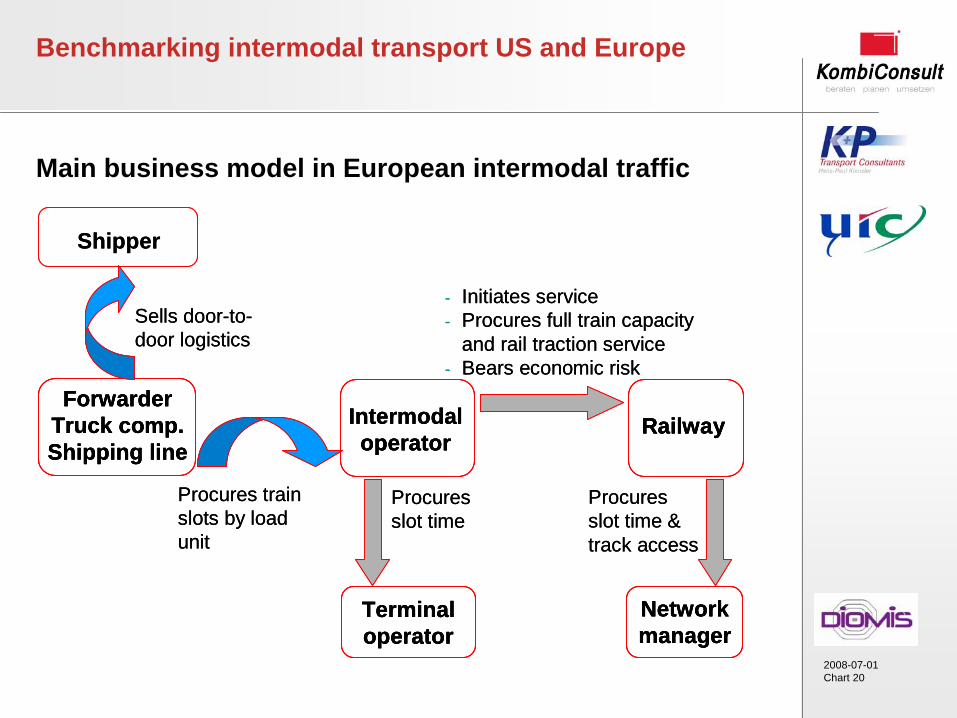
2008-07-01Chart 20
Intermodal operator
Networkmanager
Terminal operator
ForwarderTruck comp.Shipping line
Shipper
Railway
- Initiates service- Procures full train capacity
and rail traction service- Bears economic risk
Procures trainslots by loadunit
Sells door-to-door logistics
Procures slot time
Procures slot time & track access
Intermodal operator
Intermodal operator
NetworkmanagerNetworkmanager
Terminal operatorTerminal operator
ForwarderTruck comp.Shipping line
ForwarderTruck comp.Shipping line
Shipper
RailwayRailway
- Initiates service- Procures full train capacity
and rail traction service- Bears economic risk
Procures trainslots by loadunit
Sells door-to-door logistics
Procures slot time
Procures slot time & track access
Benchmarking intermodal transport US and Europe
Main business model in European intermodal traffic
2008-07-01Chart 21
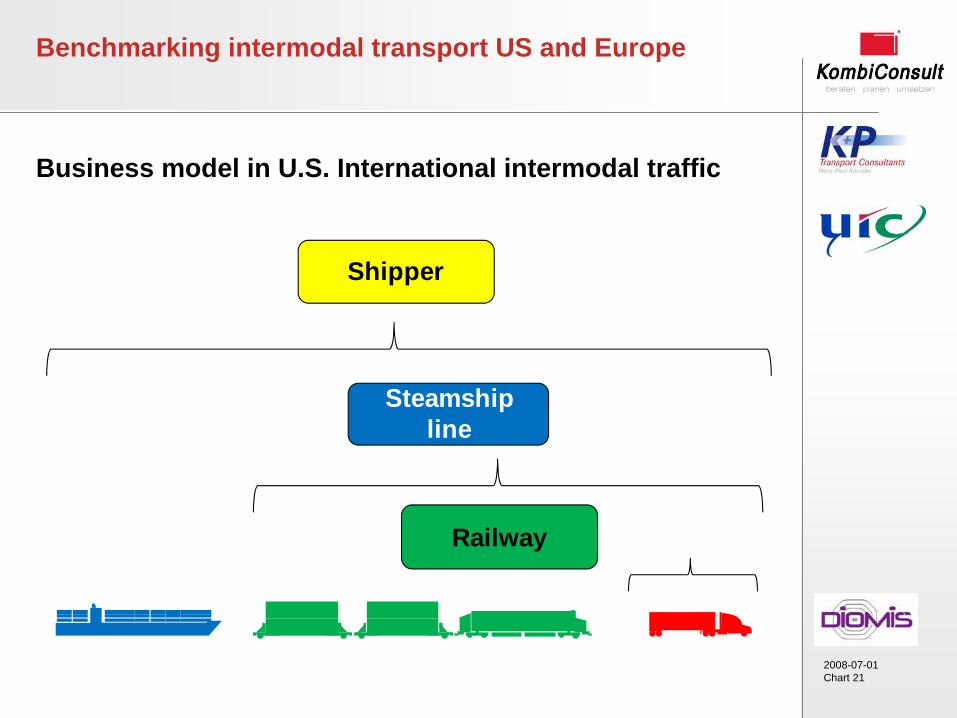
Benchmarking intermodal transport US and Europe
Business model in U.S. International intermodal traffic
Railway
Steamshipline
Shipper
2008-07-01Chart 22
Benchmarking intermodal transport US and Europe
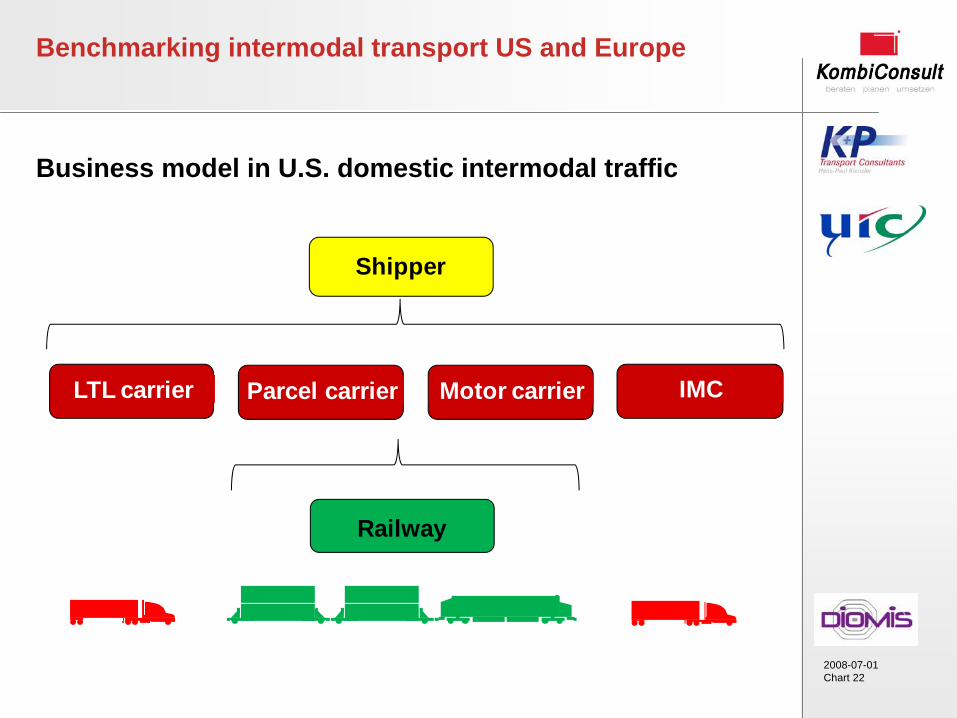
Business model in U.S. domestic intermodal traffic
Railway
LTL carrier
Shipper
Parcel carrier Motor carrier IMC
2008-07-01Chart 23
Benchmarking intermodal transport US and Europe
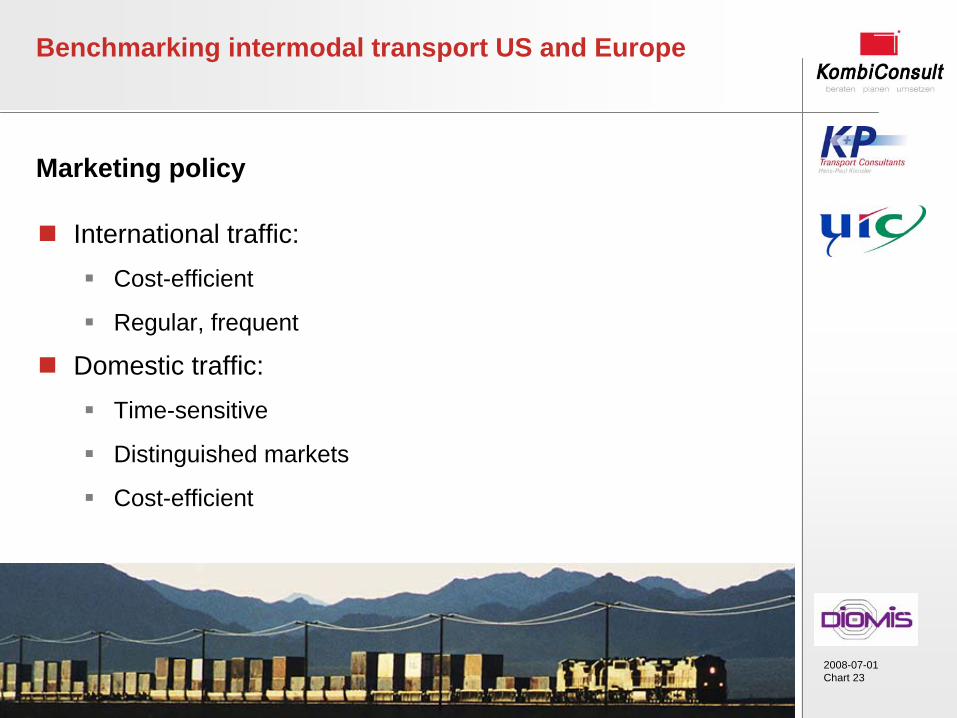
Marketing policy
International traffic:
Cost-efficient
Regular, frequent
Domestic traffic:
Time-sensitive
Distinguished markets
Cost-efficient
2008-07-01Chart 24
Benchmarking intermodal transport US and Europe
Marketing policy in domestic traffic
Partnerships with parcel carriers (UPS) or motor carriers (J.B. Hunt since 20 years!) - also in international traffic with shipping lines (APL) – which systematically shift traffic from road to intermodal:
Contributing base load
Loadings from other customers used to complete train capacity
Supply of various service levels differentiated by speed of service (O/D transit time)
Premium services usually are geared to high-end customers e.g. parcel and LTL carriers (UPS)
Also used by „Express“ marine containers
2008-07-01Chart 25
Benchmarking intermodal transport US and Europe
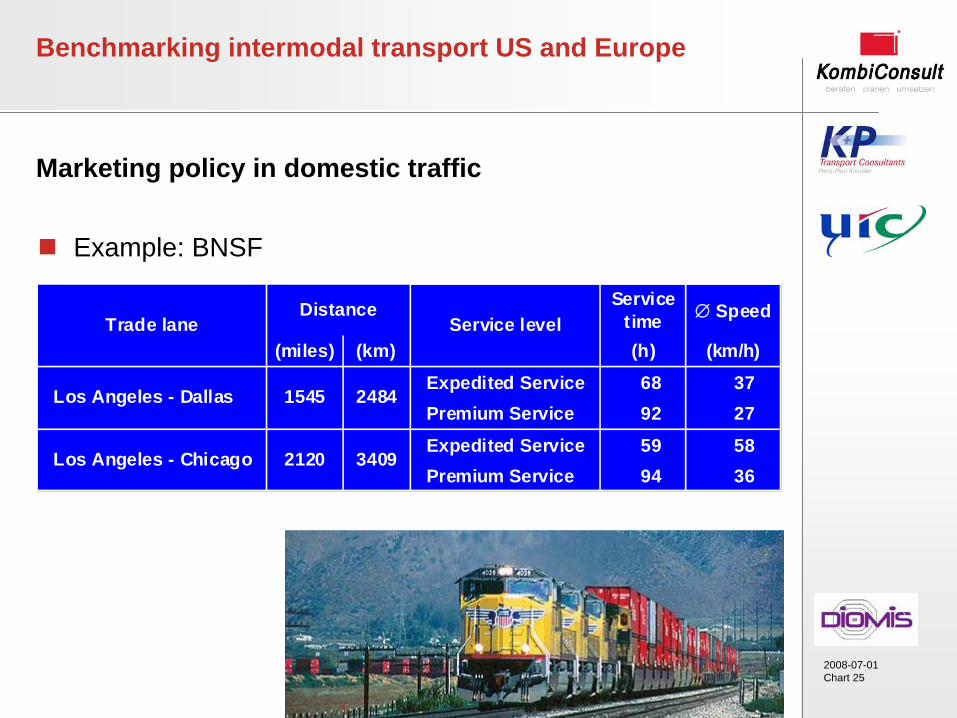
Marketing policy in domestic traffic
Example: BNSF
Service time Speed
(miles) (km) (h) (km/h)
Expedited Service 68 37 Premium Service 92 27
Expedited Service 59 58 Premium Service 94 36
Los Angeles - Chicago 2120 3409
Trade laneDistance
Los Angeles - Dallas 1545 2484
Service level
2008-07-01Chart 26
Benchmarking intermodal transport US and Europe
Marketing policy in domestic traffic
Supply of service levels differentiated by other features:
Priority access on train: reserved capacity.
Priority cut-off time and time of availability: last in the gate; first off the train - first out of gate.
Service guarantee: e.g. full or partly refund of freight rate if schedule is failed.
Guaranteed reservations of equipment
Proactive service monitoring: if train is running behind schedule the railways keep the customer informed of its status.
Subject to next-day rolling: shipments moved in “Standard” service level can be shifted on the next day departure.
2008-07-01Chart 28
Benchmarking intermodal transport US and Europe
Price policy
Mostly non-public prices („price authorities“)
Price differentiation follows service level differentiation
for domestic services: customer pay a premium for higher
service levels
Bill optimizer for international traffic
Transloading issue at ports: marketing channel conflicts
between international and domestic traffic
2008-07-01Chart 29
Benchmarking intermodal transport US and Europe
Price policy
Numerous surcharges:
Surcharge for transport of units carrying hazardous goods.
Surcharge for transport of temperature-controlled units.
Fuel surcharge: weekly adjusted based on the price index of the
U.S. Federal Department of Energy
Alameda Corridor surcharge: levied to pay off bond debt &
federal loan; e.g. $38.62 for a loaded 40’ seaborne container
and $12.96 for a loaded 53’ domestic container or trailer)
2008-07-01Chart 31
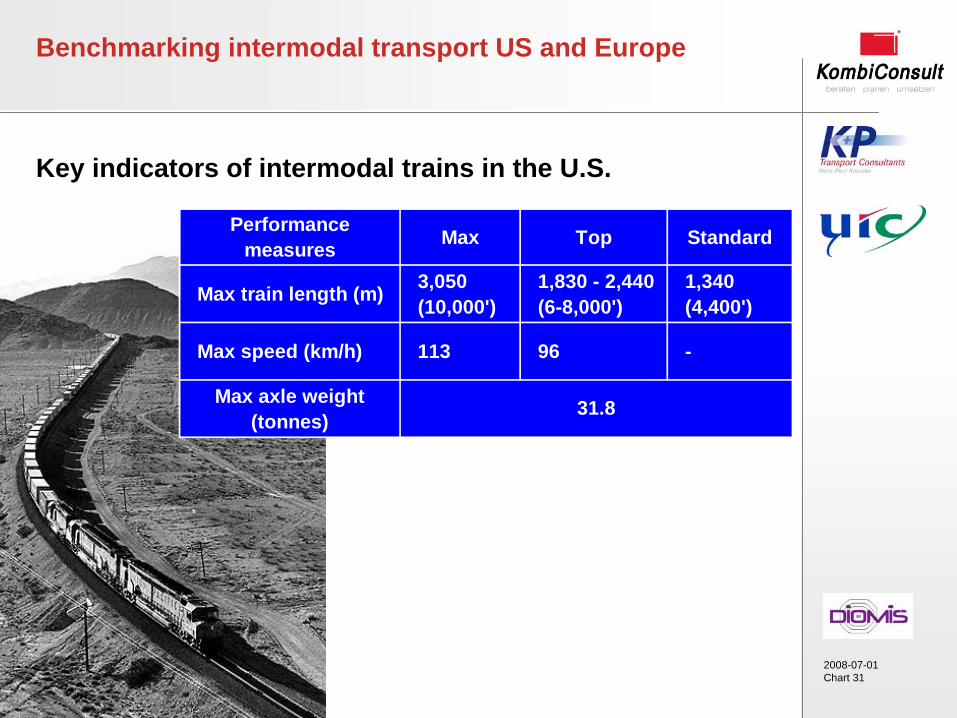
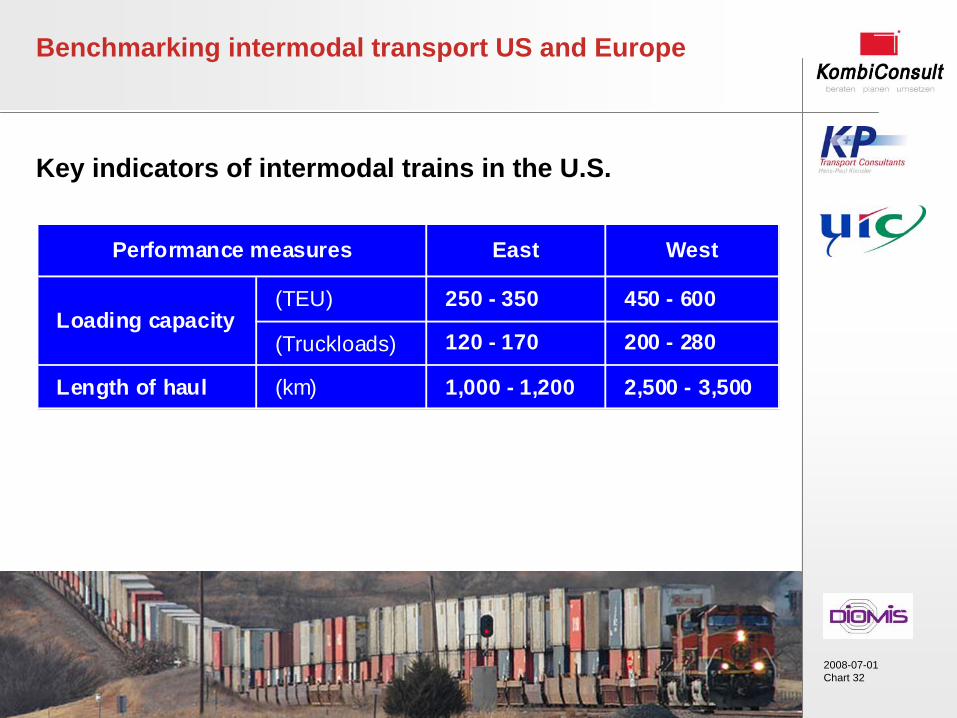
Key indicators of intermodal trains in the U.S.
Benchmarking intermodal transport US and Europe
Performance measures Max Top Standard
Max train length (m) 3,050 (10,000')
1,830 - 2,440 (6-8,000')
1,340 (4,400')
Max speed (km/h) 113 96 -
Max axle weight (tonnes)
31.8
2008-07-01Chart 32
Key indicators of intermodal trains in the U.S.
Benchmarking intermodal transport US and Europe
East West
(TEU) 250 - 350 450 - 600
(Truckloads) 120 - 170 200 - 280
Length of haul (km) 1,000 - 1,200 2,500 - 3,500
Loading capacity
Performance measures
2008-07-01Chart 33
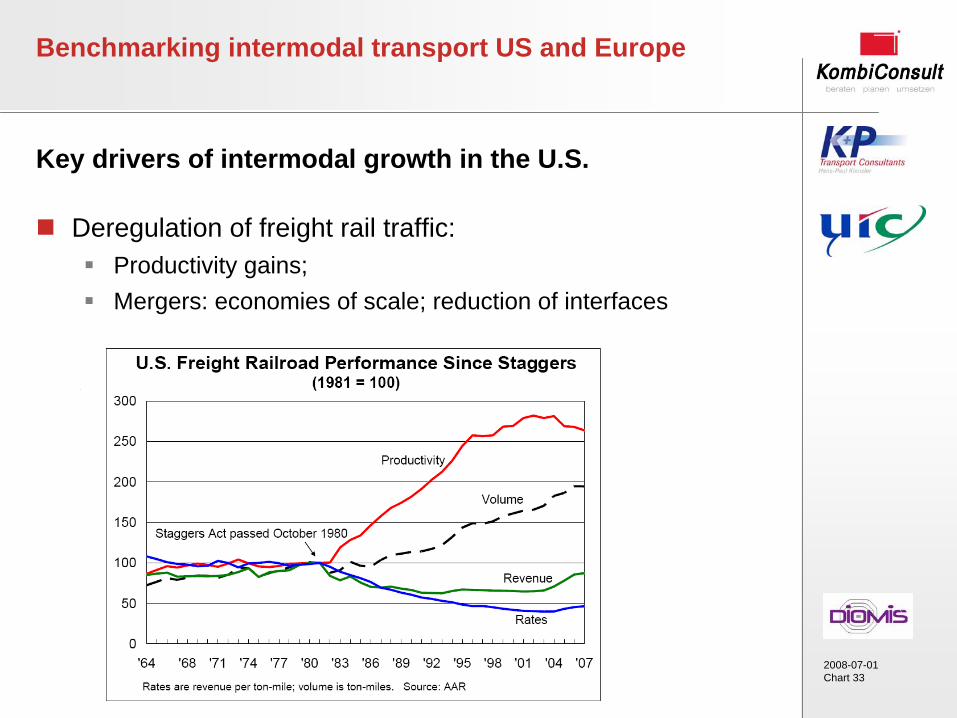
Key drivers of intermodal growth in the U.S.
Deregulation of freight rail traffic:
Productivity gains;
Mergers: economies of scale; reduction of interfaces
Benchmarking intermodal transport US and Europe
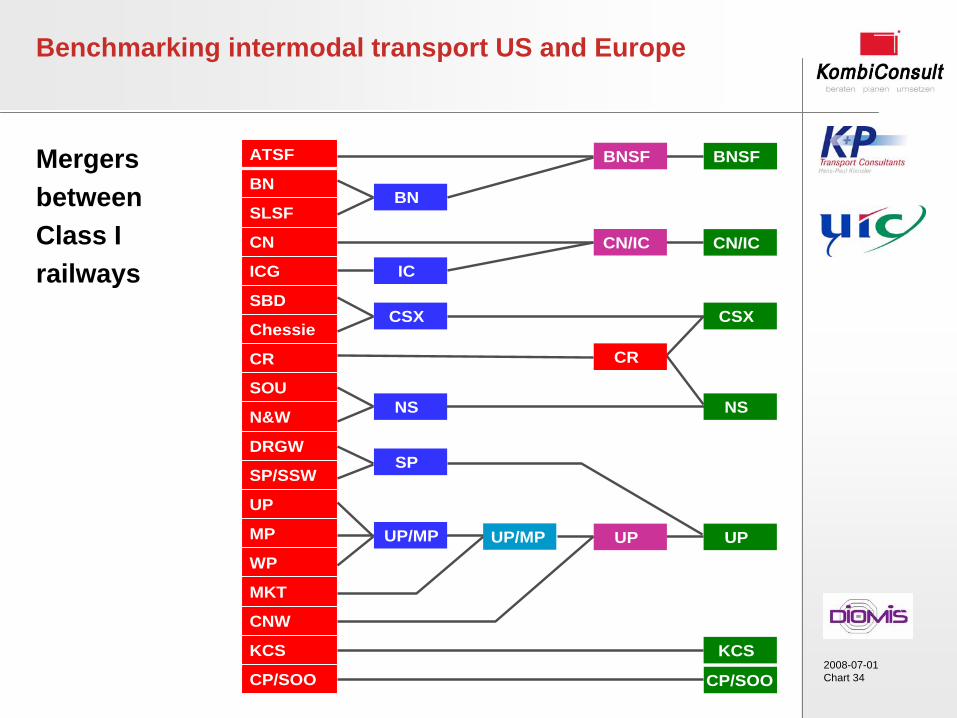
2008-07-01Chart 34
Mergers between Class I railways
Benchmarking intermodal transport US and Europe
ATSF
BN
SLSF
CN
ICG
SBD
Chessie
CR
SOU
N&W
DRGW
SP/SSW
UP
MP
WP
MKT
CNW
KCS
CP/SOO
ATSF
BN
SLSF
CN
ICG
SBD
Chessie
CR
SOU
N&W
DRGW
SP/SSW
UP
MP
WP
MKT
CNW
KCS
CP/SOO
BN
CSX
NS
IC
SP
UP/MP UP/MP UP UP
NS
CR
CSX
KCS
CP/SOO
CN/IC CN/IC
BNSF BNSF
2008-07-01Chart 35
Key drivers of intermodal growth in the U.S.
Clear, easy to understand and rather standardized business models and distribution channels
Intermodal service innovations
Dedicated intermodal services
Service levels
Guaranteed services
Partnerships with LSP (parcel & motor carriers, steamship lines)
Improved performance; goal: 92% rate of punctuality.
Benchmarking intermodal transport US and Europe
2008-07-01Chart 36
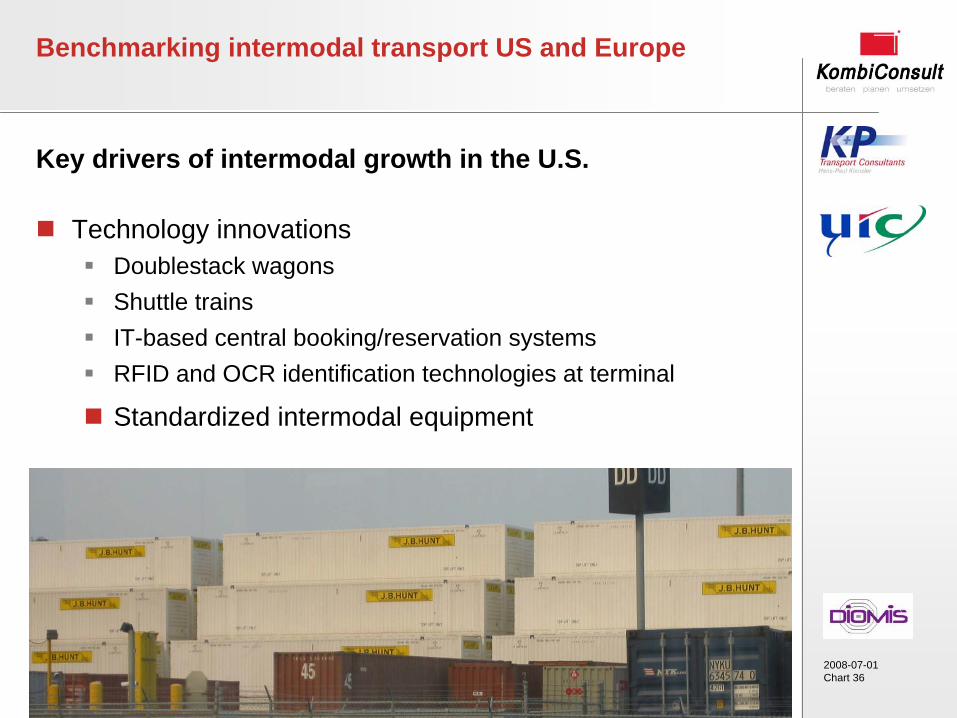
Key drivers of intermodal growth in the U.S.
Technology innovations
Doublestack wagons
Shuttle trains
IT-based central booking/reservation systems
RFID and OCR identification technologies at terminal
Standardized intermodal equipment
Benchmarking intermodal transport US and Europe
2008-07-01Chart 37
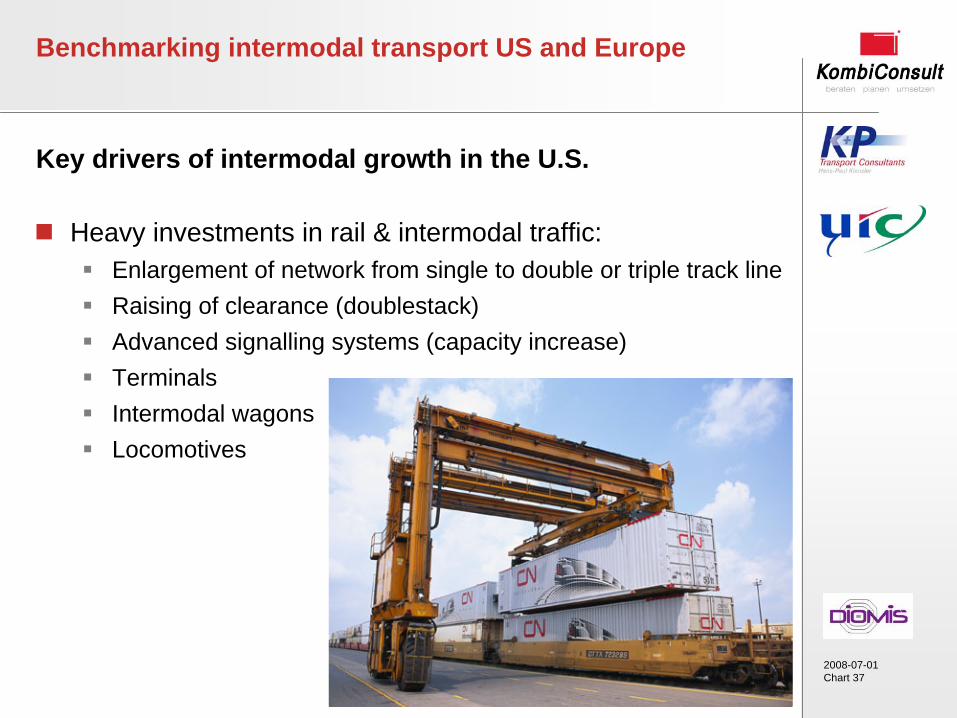
Key drivers of intermodal growth in the U.S.
Heavy investments in rail & intermodal traffic:
Enlargement of network from single to double or triple track line
Raising of clearance (doublestack)
Advanced signalling systems (capacity increase)
Terminals
Intermodal wagons
Locomotives
Benchmarking intermodal transport US and Europe
2008-07-01Chart 38
Key drivers of intermodal growth in the U.S.
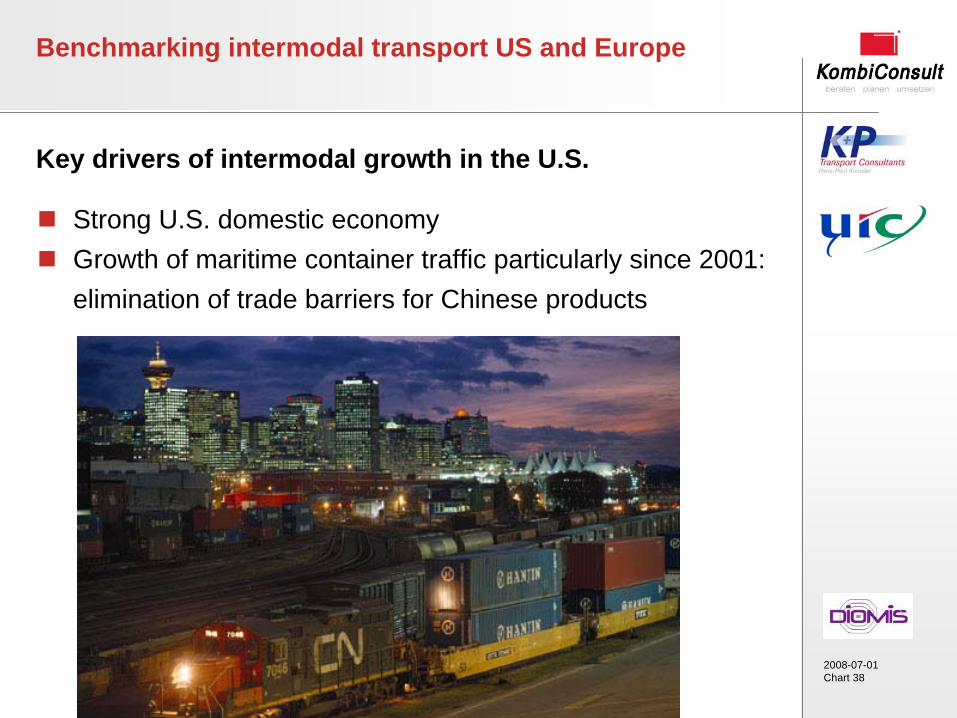
Strong U.S. domestic economy
Growth of maritime container traffic particularly since 2001: elimination of trade barriers for Chinese products
Benchmarking intermodal transport US and Europe
2008-07-01Chart 43
THANK YOU


