Australia’sIdentified Mineral
Resources 2014
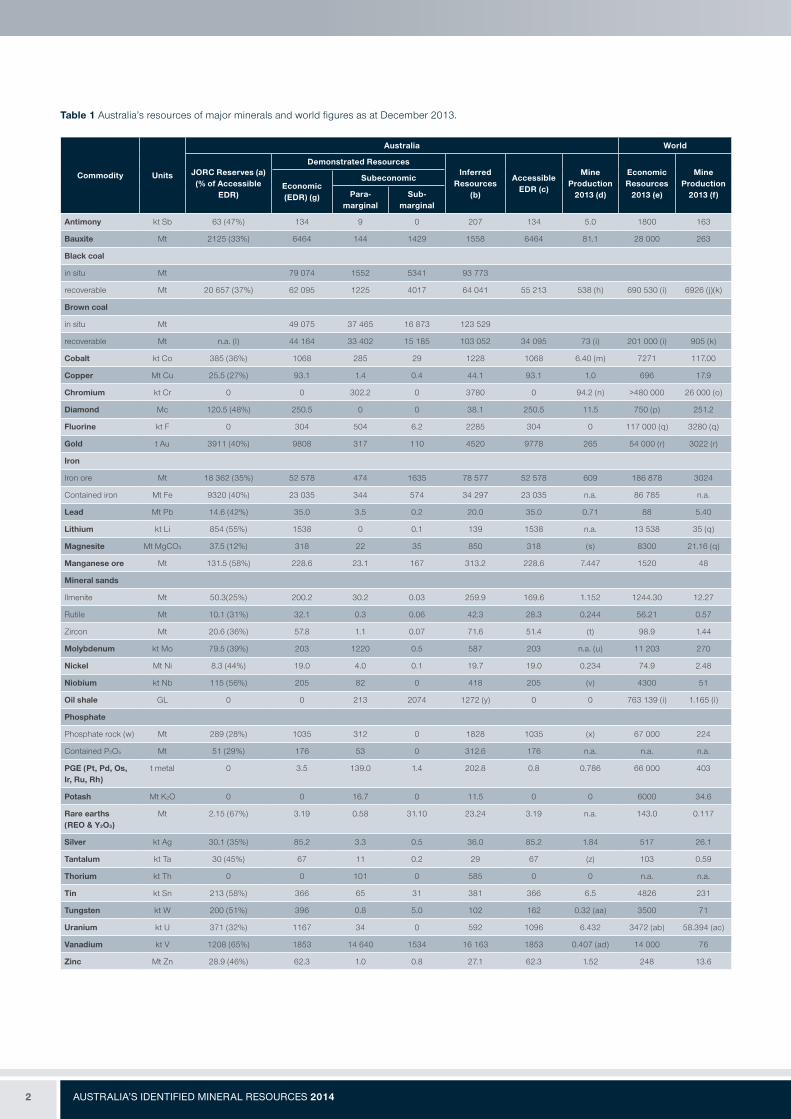
Australia’s Identified Mineral Resources is an annual national assessment that takes a long-term view of mineral resources likely to be available for mining. The highest category in the national inventory is Economic Demonstrated Resources (EDR) which, in essence, combines the Joint Ore Reserve Committee (JORC) Code categories of Ore Reserves and most of the JORC Code Measured and Indicated Resources. JORC Code Ore Commodity Reserves are included for comparison, which provides a short- to medium-term view of mineral stocks. The assessment also includes evaluations of long-term trends in mineral resources, world rankings and a snapshot of resource to production ratios.
Geoscience Australia and its predecessors have prepared annual assessments of Australia’s mineral resources since 1975. Australia’s Identified Mineral Resources 2014 presents estimates of Australia’s mineral resources at end of December 2013 for all major and several minor mineral commodities (Table 1). This national minerals inventory is based on published company reports of Ore Reserves and Mineral Resources. Mine production data are based on figures from the Bureau of Resources and Energy Economics (BREE). World rankings of Australia’s mineral resources have been calculated mainly using information published by the United States Geological Survey (USGS). The resource data and related information from Australia’s Identified Mineral Resources provide input into Australian Government policy decisions and programs associated with the minerals sector and the sustainable development of resources.
National Resource Classification SystemThe mineral resource classification system used for Australia’s national inventory is based on two general criteria:• the geological certainty of the existence of the mineral
resource, and
• the economic feasibility of its extraction over the long term.
For a full description of the system see Appendix 1 ‘Australia’s National Classification System for Identified Mineral Resources’ in Australia’s Identified Mineral Resources 2013 (http://www.ga.gov.au/corporate_data/78988/78988_AIMR_2013.pdf).
The description of the National Resource Classification System shows how mineral resources reported by companies under the Australasian Code for Reporting of Exploration Results, Mineral Resources and Ore Reserves (referred to as the JORC Code) are used when compiling national total resources. The classification category Economic Demonstrated Resources (EDR) is used for national totals of economic resources and provides a basis for meaningful comparisons of Australia’s economic resources with those of other nations. Long-term trends in EDR for bauxite, black coal (recoverable), iron ore, gold, copper, lead, zinc, nickel, mineral sands and uranium (recoverable) are presented in Figure 1 and the reasons for significant changes in resource trends are noted.
Accessible ResourcesSome mineral deposits are not currently accessible for mining because of government policies or various environmental and land access restrictions such as location within national and state parks and conservation zones, military training areas or environmental protection areas, as well as areas over which mining approval has not been granted by traditional owners. Accessible Economic Demonstrated Resources (AEDR), as shown in Table 1, represent the resources within the EDR category that are accessible for mining.
AUSTRALIA’S IDENTIFIED MINERAL RESOURCES 20142
Table 1 Australia’s resources of major minerals and world figures as at December 2013.
Commodity Units
Australia World
JORC Reserves (a) (% of Accessible
EDR)
Demonstrated ResourcesInferred
Resources (b)
Accessible EDR (c)
Mine Production
2013 (d)
Economic Resources
2013 (e)
Mine Production
2013 (f)Economic (EDR) (g)
Subeconomic
Para-marginal
Sub-marginal
Antimony kt Sb 63 (47%) 134 9 0 207 134 5.0 1800 163
Bauxite Mt 2125 (33%) 6464 144 1429 1558 6464 81.1 28 000 263
Black coal
in situ Mt 79 074 1552 5341 93 773
recoverable Mt 20 657 (37%) 62 095 1225 4017 64 041 55 213 538 (h) 690 530 (i) 6926 (j)(k)
Brown coal
in situ Mt 49 075 37 465 16 873 123 529
recoverable Mt n.a. (l) 44 164 33 402 15 185 103 052 34 095 73 (i) 201 000 (i) 905 (k)
Cobalt kt Co 385 (36%) 1068 285 29 1228 1068 6.40 (m) 7271 117.00
Copper Mt Cu 25.5 (27%) 93.1 1.4 0.4 44.1 93.1 1.0 696 17.9
Chromium kt Cr 0 0 302.2 0 3780 0 94.2 (n) >480 000 26 000 (o)
Diamond Mc 120.5 (48%) 250.5 0 0 38.1 250.5 11.5 750 (p) 251.2
Fluorine kt F 0 304 504 6.2 2285 304 0 117 000 (q) 3280 (q)
Gold t Au 3911 (40%) 9808 317 110 4520 9778 265 54 000 (r) 3022 (r)
Iron
Iron ore Mt 18 362 (35%) 52 578 474 1635 78 577 52 578 609 186 878 3024
Contained iron Mt Fe 9320 (40%) 23 035 344 574 34 297 23 035 n.a. 86 785 n.a.
Lead Mt Pb 14.6 (42%) 35.0 3.5 0.2 20.0 35.0 0.71 88 5.40
Lithium kt Li 854 (55%) 1538 0 0.1 139 1538 n.a. 13 538 35 (q)
Magnesite Mt MgCO3 37.5 (12%) 318 22 35 850 318 (s) 8300 21.16 (q)
Manganese ore Mt 131.5 (58%) 228.6 23.1 167 313.2 228.6 7.447 1520 48
Mineral sands
Ilmenite Mt 50.3(25%) 200.2 30.2 0.03 259.9 169.6 1.152 1244.30 12.27
Rutile Mt 10.1 (31%) 32.1 0.3 0.06 42.3 28.3 0.244 56.21 0.57
Zircon Mt 20.6 (36%) 57.8 1.1 0.07 71.6 51.4 (t) 98.9 1.44
Molybdenum kt Mo 79.5 (39%) 203 1220 0.5 587 203 n.a. (u) 11 203 270
Nickel Mt Ni 8.3 (44%) 19.0 4.0 0.1 19.7 19.0 0.234 74.9 2.48
Niobium kt Nb 115 (56%) 205 82 0 418 205 (v) 4300 51
Oil shale GL 0 0 213 2074 1272 (y) 0 0 763 139 (i) 1.165 (i)
Phosphate
Phosphate rock (w) Mt 289 (28%) 1035 312 0 1828 1035 (x) 67 000 224
Contained P2O5 Mt 51 (29%) 176 53 0 312.6 176 n.a. n.a. n.a.
PGE (Pt, Pd, Os, Ir, Ru, Rh)
t metal 0 3.5 139.0 1.4 202.8 0.8 0.786 66 000 403
Potash Mt K2O 0 0 16.7 0 11.5 0 0 6000 34.6
Rare earths (REO & Y2O3)
Mt 2.15 (67%) 3.19 0.58 31.10 23.24 3.19 n.a. 143.0 0.117
Silver kt Ag 30.1 (35%) 85.2 3.3 0.5 36.0 85.2 1.84 517 26.1
Tantalum kt Ta 30 (45%) 67 11 0.2 29 67 (z) 103 0.59
Thorium kt Th 0 0 101 0 585 0 0 n.a. n.a.
Tin kt Sn 213 (58%) 366 65 31 381 366 6.5 4826 231
Tungsten kt W 200 (51%) 396 0.8 5.0 102 162 0.32 (aa) 3500 71
Uranium kt U 371 (32%) 1167 34 0 592 1096 6.432 3472 (ab) 58.394 (ac)
Vanadium kt V 1208 (65%) 1853 14 640 1534 16 163 1853 0.407 (ad) 14 000 76
Zinc Mt Zn 28.9 (46%) 62.3 1.0 0.8 27.1 62.3 1.52 248 13.6
3
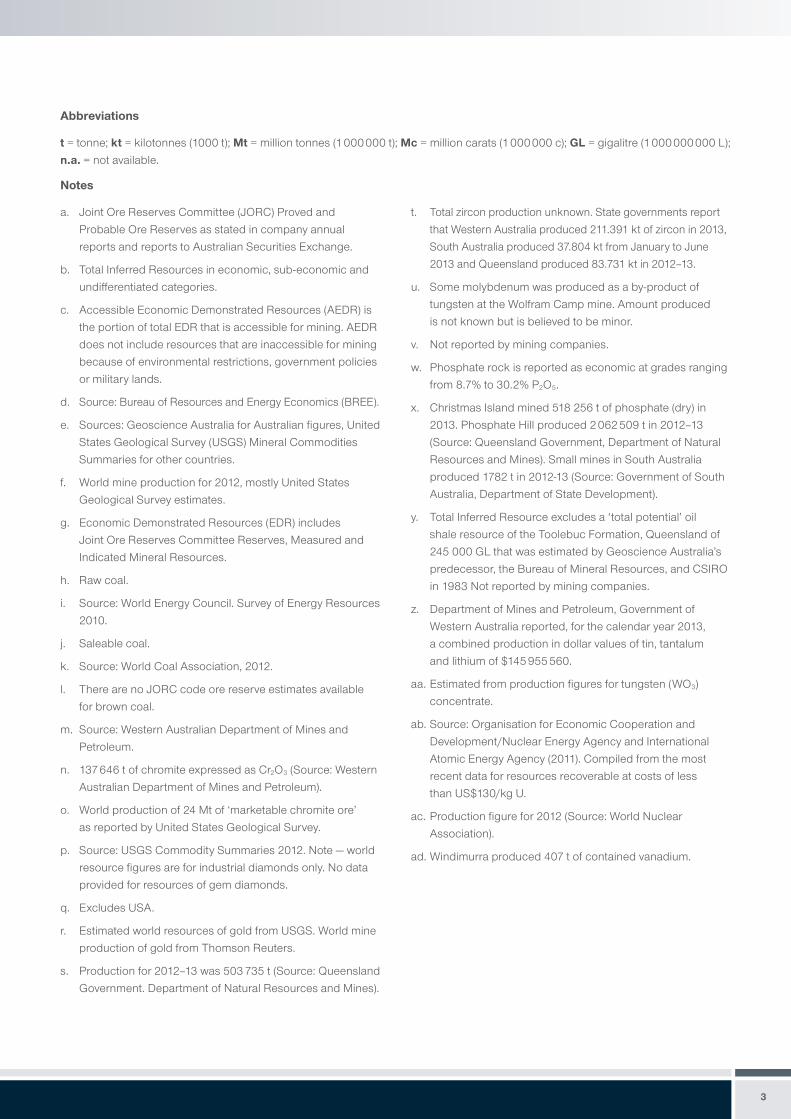
Abbreviations
t = tonne; kt = kilotonnes (1000 t); Mt = million tonnes (1 000 000 t); Mc = million carats (1 000 000 c); GL = gigalitre (1 000 000 000 L);
n.a. = not available.
Notes
a. Joint Ore Reserves Committee (JORC) Proved and
Probable Ore Reserves as stated in company annual
reports and reports to Australian Securities Exchange.
b. Total Inferred Resources in economic, sub-economic and
undifferentiated categories.
c. Accessible Economic Demonstrated Resources (AEDR) is
the portion of total EDR that is accessible for mining. AEDR
does not include resources that are inaccessible for mining
because of environmental restrictions, government policies
or military lands.
d. Source: Bureau of Resources and Energy Economics (BREE).
e. Sources: Geoscience Australia for Australian figures, United
States Geological Survey (USGS) Mineral Commodities
Summaries for other countries.
f. World mine production for 2012, mostly United States
Geological Survey estimates.
g. Economic Demonstrated Resources (EDR) includes
Joint Ore Reserves Committee Reserves, Measured and
Indicated Mineral Resources.
h. Raw coal.
i. Source: World Energy Council. Survey of Energy Resources
2010.
j. Saleable coal.
k. Source: World Coal Association, 2012.
l. There are no JORC code ore reserve estimates available
for brown coal.
m. Source: Western Australian Department of Mines and
Petroleum.
n. 137 646 t of chromite expressed as Cr2O3 (Source: Western
Australian Department of Mines and Petroleum).
o. World production of 24 Mt of ‘marketable chromite ore’
as reported by United States Geological Survey.
p. Source: USGS Commodity Summaries 2012. Note — world
resource figures are for industrial diamonds only. No data
provided for resources of gem diamonds.
q. Excludes USA.
r. Estimated world resources of gold from USGS. World mine
production of gold from Thomson Reuters.
s. Production for 2012–13 was 503 735 t (Source: Queensland
Government. Department of Natural Resources and Mines).
t. Total zircon production unknown. State governments report
that Western Australia produced 211.391 kt of zircon in 2013,
South Australia produced 37.804 kt from January to June
2013 and Queensland produced 83.731 kt in 2012–13.
u. Some molybdenum was produced as a by-product of
tungsten at the Wolfram Camp mine. Amount produced
is not known but is believed to be minor.
v. Not reported by mining companies.
w. Phosphate rock is reported as economic at grades ranging
from 8.7% to 30.2% P2O5.
x. Christmas Island mined 518 256 t of phosphate (dry) in
2013. Phosphate Hill produced 2 062 509 t in 2012–13
(Source: Queensland Government, Department of Natural
Resources and Mines). Small mines in South Australia
produced 1782 t in 2012-13 (Source: Government of South
Australia, Department of State Development).
y. Total Inferred Resource excludes a ‘total potential’ oil
shale resource of the Toolebuc Formation, Queensland of
245 000 GL that was estimated by Geoscience Australia’s
predecessor, the Bureau of Mineral Resources, and CSIRO
in 1983 Not reported by mining companies.
z. Department of Mines and Petroleum, Government of
Western Australia reported, for the calendar year 2013,
a combined production in dollar values of tin, tantalum
and lithium of $145 955 560.
aa. Estimated from production figures for tungsten (WO3)
concentrate.
ab. Source: Organisation for Economic Cooperation and
Development/Nuclear Energy Agency and International
Atomic Energy Agency (2011). Compiled from the most
recent data for resources recoverable at costs of less
than US$130/kg U.
ac. Production figure for 2012 (Source: World Nuclear
Association).
ad. Windimurra produced 407 t of contained vanadium.
AUSTRALIA’S IDENTIFIED MINERAL RESOURCES 20144
Commodity OverviewAustralia’s EDR for the following 20 mineral commodities increased during 2013 — antimony, bauxite, black coal, brown coal, cobalt, copper, fluorine, ilmenite, iron ore, lead, manganese ore, nickel, phosphate, rutile, tantalum, tin, tungsten, uranium, vanadium and zircon. EDR for chromium, lithium, molybdenum, niobium, oil shale, potash, rare earth elements, silver and thorium remained at levels similar to those reported in 2012. However, during the same period there was a decrease in the EDR of five commodities — diamonds, gold, magnesite, platinum group elements and zinc.
Australia’s EDR of diamond, gold, iron ore, lead, nickel rutile, tantalum, uranium, zinc and zircon are the world’s largest, while antimony, bauxite, black coal, brown coal, cobalt, copper, ilmenite, lithium, manganese, niobium, silver, tantalum, tin, tungsten and vanadium all rank in the top six worldwide.
Bauxite: Australia’s EDR of bauxite were estimated to be 6464 Mt in 2013 (slightly up from 6281 Mt in 2012), ranking second in the world behind the Republic of Guinea and ahead of Brazil, Vietnam, Jamaica and Indonesia. Australia was the world’s leading producer of bauxite in 2013, the second largest producer of alumina and the sixth largest producer of aluminium. Australia’s aluminium industry is underpinned by vast resources of bauxite at Cape York in Queensland (3446 Mt, 54% of national EDR), Gove in the Northern Territory (195 Mt, 3%) and in the Darling Range southeast of Perth in Western Australia (2779 Mt, 43%). Australia’s aluminium industry continues to be a highly integrated sector of mining, refining, smelting and semi-fabrication and is of major economic importance nationally and globally. In recent years, however, processing costs have made some operations unviable, leading to the closure in 2012 of the Kurri Kurri aluminium smelter in New South Wales and in 2014, the Gove alumina refinery in the Northern Territory and the Point Henry aluminium smelter in Victoria.
Black Coal: In 2013, the estimate of Australia’s recoverable EDR of black coal was revised upwards to 62 095 Mt, an increase of less than 2% on the previous year. The resource constitutes 9% of the world’s recoverable black coal EDR. Globally, Australia is ranked fifth (behind the United States, Russia, China and India) in terms of recoverable economic coal resources and fifth (behind China, the United States, India and Indonesia) as a coal producer.
Most of Australia’s black coal EDR is located in Queensland (58%) and New South Wales (38%). The Bowen Basin in Queensland and the Sydney Basin in NSW dominate black coal production in Australia and contain 60% of the nation’s recoverable black coal EDR. Significant black coal resources are found also in the Surat, Clarence-Moreton and Galilee Basins in Queensland and in the Gunnedah Basin in New South Wales. Recent exploration has led to significant increases in black coal resource estimates associated with the Galilee Basin where several large, new, greenfield developments are proposed. At 2013 rates of production, Australia’s black coal Accessible EDR will support more than 100 years of production.
Brown Coal: The 2013 estimate of Australia’s recoverable brown coal EDR (44 164 Mt) remains unchanged from 2012. Approximately 19% of the world’s recoverable brown coal resources are located in Australia, with the nation ranked second behind Germany in terms of brown coal reserves. All of Australia’s recoverable brown coal EDR is located in Victoria with approximately 93% in the Latrobe Valley. During 2013, brown coal production in Australia was estimated at 73 Mt. Brown coal mined in Australia is used almost exclusively for domestic electricity generation and at current rates of extraction the accessible resource base will support approximately 465 years of production.
Copper: Australia’s EDR of copper rose by 2 Mt in 2013 to 93.1 Mt, an increase of 2%. Australia has the second largest economic resources of copper at 13% after Chile’s 28%. South Australia has 68% of the national total of EDR, mainly in the Olympic Dam deposit, followed by New South Wales with 14% and Queensland with 12%. In 2013, mine production of copper rose by almost 10% and exports totalled $8.044 billion, down slightly from $8.100 billion in 2012. Spending on copper exploration in 2013 dramatically fell by 46% to $222.8 million. The bulk of exploration took place in South Australia ($57.9 million) and Queensland ($55.7 million).
Diamond: Australia’s EDR of total diamond resources decreased by 7% in 2013 to 250.5 Mc. Production from the Argyle and Ellendale mines in Western Australia increased to 11.5 Mc during 2013, 2.9 Mc more than in 2012. Diamond EDR and production are dominated by the Argyle diamond mine.
Gold: National EDR of gold dropped 101 t or about 1% in 2013 to 9808 t. Australia continued to hold the largest resources by country for the commodity with about 18% of the world total. South Africa (6000 t) and Russia (5000 t) maintained their world rankings with the second and third largest gold resource inventories, respectively. Within Australia, reductions in EDR for Western Australia (-419 t), Tasmania (-6 t) and Victoria (-1 t) outweighed rises in the Northern Territory (+141 t), New South Wales (+85 t), Queensland (+64 t) and South Australia (+40 t).
Australian mine production of gold rose 14 t or 5.6% to 265 t in 2013. Imports of primary and secondary gold declined 13 t to 87 t while export of the commodity declined minimally by 0.5 t to 281.5 t. The value of exported gold, however, dropped 10% or about $1.58 billion to $13.7 billion owing to a substantial and sustained fall in the price of gold during April.
The price of gold in US dollars fell 25 %, or about US$400/oz, over two months from April 2013. Between July and December 2013, the price recovered a little, fluctuating between US$1200/oz and US$1395/oz. In Australian dollars, the price fall was lower at about AUD$260/oz due to near coincident adjustments in the AUD$/US$ exchange rate which saw the price vary between AUD$1340/oz and AUD$1558/oz for the latter half of the year. This adjustment in the gold price, attributed by the press to equity markets

5
shifting investment away from the gold sector, corresponded with a large drop in general exploration expenditure as mineral companies attempted to conserve cash. Exploration expenditure on gold in Australia declined $188 million to $553 million during 2013 while expenditure on base metals (-$317 million), iron ore (-$304 million) and coal (-$269 million) fell by greater amounts.
With tougher economic times prevailing, 2013 saw the closure of several gold operations including Wiluna (Apex Minerals NL), Laverton and Three Mile Hill (Focus Minerals Ltd), Lindsays (KalNorth Gold Mines Ltd), Burnakura (Kentor Gold Ltd), Bronzewing/Mt McClure (Navigator Resources Ltd), and Blue Bird - Meekatharra (Reed Resources Ltd). Closures were, however, offset by the commencement of production from a number of projects including Mount Carlton (Evolution Mining Ltd), Tropicana (Anglogold Ashanti Ltd/Independence Group NL), Andy Well (Doray Minerals Ltd), Enterprise (Norton Gold Fields Ltd), Nullagine (Millennium Minerals Ltd), Rosemont (Regis Resources Ltd), and Tuckabianna (Silver Lake Resources Ltd).
Iron Ore: Because of major changes in Australia’s iron ore mining industry and the development of large magnetite deposits in Australia, Geoscience Australia has estimated national resources of iron in two categories: (1) iron ore and (2) contained iron. Australia’s EDR of iron ore increased by 18% to 52 578 Mt during 2013 with the EDR of contained iron estimated to be 23 035 Mt. Magnetite resources increased by 24% to 23 947 Mt in 2013, accounting for approximately 46% of iron ore EDR.
Western Australia has the largest share of iron ore with 89% of Australia’s EDR, the majority of which is in the Pilbara region. Australia has the world’s largest EDR with 28% of the world’s iron ore followed by Brazil with 17%. Western Australia produced 593 Mt or 97% of Australia’s total production of iron ore in 2013. Iron-ore exploration expenditure in Australia during 2013 totalled $858.8 million, a 25% decrease on the $1138.2 million spent in 2012. Exploration for iron ore in 2013 accounted for 34% of Australia’s total mineral exploration expenditure.
Lithium: Australia’s EDR of lithium was 1538 kt in 2013, unchanged from 2012 and ranking it third largest globally, behind Chile and China, with just over 11% of the world’s economic resources. All of Australia’s EDR of lithium occur within hard rock pegmatite deposits in WA. The bulk of Australia’s EDR of lithium resides in the Greenbushes (WA) deposit, which is the world’s largest and highest grade spodumene deposit.
Magnesite: Australia’s EDR of magnesite totalled 318 Mt, representing about 4% of the world’s economic resources of magnesite. South Australia has the largest share of these resources with 74% followed by Queensland with 20%. The Kunwarara deposit in Queensland is the world’s largest known resource of ultrafine-grained cryptocrystalline to microcrystalline nodular magnesite.
Manganese Ore: Australia’s EDR of manganese ore increased by 22% to 228.6 Mt in 2013, ranking Australia’s resources as the world’s fifth largest. All of the EDR occur in the Northern Territory and Western Australia. Australia’s mine production of manganese ore reached record levels of 7.4 Mt in 2013, ranked third behind China and South Africa.
Mineral Sands: The regions containing the major proportion of Australia’s mineral sands resources (ilmenite, rutile and zircon) are the Perth Basin north of Perth (WA), the Murray Basin (NSW, Vic and SA) and in the Eucla Basin (WA and SA), with major economic resources more recently identified in the Canning Basin (WA). Reflecting these recent exploration developments, EDR increased by 22% to 57.8 Mt for zircon, 21% to 32.1 Mt for rutile and 7% to 200.2 Mt for ilmenite. Australia’s economic resources of rutile and zircon are the largest in the world, while ilmenite resources are the second largest worldwide behind China.
Molybdenum: Australia’s EDR of molybdenum in 2013 was 203 kt, unchanged from 2012 and ranking it seventh globally with 1.8% of the world’s economic resources. Most recent growth in Australia’s EDR has been the result of large increases in resources at Dart Mining NL’s Unicorn deposit in Victoria. Resource figures for Australia’s EDR do not include 220 kt of resources at Australia’s largest molybdenum deposit at Spinifex Ridge in WA, which the owner, Moly Mines Ltd, has indicated is currently uneconomic.
Niobium: Australia’s EDR of niobium remained stable at 205 kt in 2013, ranking Australia’s resource as the second largest in the world behind Brazil. The bulk of the EDR are associated with the Toongi deposit, 20 km south of Dubbo in New South Wales.
Nickel: Australia’s EDR of nickel increased by 7% in 2013 to 19.0 Mt, which is still down from the peak EDR of 26.4 Mt recorded in 2008. Australia continues to contain the world’s largest economic resources with 25%. Western Australia remains the largest holder of nickel resources with 95% of total Australian EDR made up of both sulphide and lateritic deposits. Nickel production ceased in 2013 at the Leinster Perseverance, Maggie Hays, Cosmos and Sinclair deposits, partly because of a prolonged period of low nickel prices.
Oil Shale: Resources of oil shale predominantly occur in a series of sedimentary basins around Gladstone, Mackay and Proserpine in central Queensland. Australia currently has no EDR of oil shale, with all resources being assessed as subeconomic. Exploration activity in the sector has returned with the lifting of Queensland’s moratorium on shale oil development. Queensland Energy Resources Ltd’s Paraho IITM oil shale technology demonstration plant at the Stuart deposit, near Gladstone, produced its first crude oil in September 2011 and operated successfully for two years.
AUSTRALIA’S IDENTIFIED MINERAL RESOURCES 20146
Phosphate: Geoscience Australia assesses both phosphate rock (phosphorite and guano) and contained P2O5 which, as well as being a component of phosphate rock, can be found in other rock types in which alternative minerals are the primary target. Australia’s EDR of phosphate rock was 1035 Mt in 2013, up from the 2012 figure of 869 Mt mainly owing to a large resource increase at the Ammaroo Phosphate project in the Northern Territory. Contained P2O5 EDR concurrently increased by almost 19% to 176 Mt in 2013, up from 148 Mt in 2012. The phosphorites of the Georgina Basin (Queensland and Northern Territory) account for almost all of Australia’s EDR of phosphate rock and 91% of Australia’s EDR of contained P2O5. The remaining phosphate rock occurs at Christmas Island and the Mount Weld (Western Australia) and Nolans Bore (Northern Territory) rare earth deposits also have EDR of contained P2O5. Australia has about 2% of the world’s economic resources of phosphate rock.
Potash: Potash is a generic term covering a variety of potassium-bearing ores, minerals and refined products. Potash is not mined in Australia, which has only modest resources by world standards. Australia’s fertiliser requirements are met through phosphate rock production and imports of potassium fertiliser. Ongoing exploration in recent years has led to recent published resources for some deposits such as Lake Disappointment, Lake Chandler and Dandaragan Trough/Dinner Hill deposits in Western Australia, in the Western Australia/Northern Territory portion of Lake Mackay and in the Karinga Creek Salt Lakes area in the southern Northern Territory. Project investigations are ongoing at the Lake Disappointment, Karinga Creek Salt Lakes and the Dandaragan greensand deposits. A new type of potash deposit hosted in ultrapotassic microsyenite lava flows was reported at Oxley in the northern Moora Basin, Western Australia, in 2013.
Rare Earth Oxides: Australia’s EDR of rare earth oxides (REO) in 2013 were 3.19 Mt, unchanged from 2012, and currently account for 2.8% of the world’s economic resources of REO. Significant resources of rare earths are contained in the monazite component of heavy mineral sand deposits, which are mined for their ilmenite, rutile, leucoxene and zircon content. Currently, extraction of rare earths from monazite is not viable because of the cost involved with the disposal of thorium and uranium present in the monazite. However, scoping studies at the Charlie Creek alluvial heavy mineral deposit in the Northern Territory suggest that extraction of REO from xenotime and monazite would be viable. Commissioning of the Lynas advanced materials plant in Malaysia, which is processing REO concentrates from Mount Weld in Western Australia, commenced in 2012. By early June 2013, the plant had achieved phase 1 production capacity (11 000 tonnes per annum REO capacity) and production for the 12 months to June 2014 was 3965 t. Phase 2 cracking & leaching, solvent extraction and product finishing was commissioned in 2013 and 2014 and will bring production capacity to 22 000 tonnes per annum.
Tantalum: Australia’s EDR of tantalum increased by 12% to 67 kt in 2013, ranking Australia the largest in the world ahead of Brazil. The bulk (77%) of tantalum EDR is located in Western Australia, mainly at the Greenbushes (45%) and Wodgina (28%) deposits and the remaining 23% is at the Toongi deposit in New South Wales.
Tin: Australia’s EDR of tin increased by over 30% to 366 kt in 2013, ranking Australia’s resources as the world’s fifth largest. The majority of Australia’s EDR of tin are contained in the Renison Bell deposit in Tasmania.
Tungsten: Australia’s EDR of tungsten in 2013 remained largely unchanged at 396 kt. Australia has just over 10% of the world’s economic resources, ranking it the second behind China. Half of Australia’s EDR is contained within the O’Callaghans multi-commodity deposit in Western Australia.
Uranium: Australia’s Reasonably Assured Resources (RAR) of uranium that can be produced at costs of less than US$130/kg of uranium at December 2013 were estimated to be 1167 kt, a minor decrease on the estimate for December 2012. Australia’s RAR of uranium is the world’s largest, accounting for over 30% of the global estimate. Market prices for uranium progressively decreased from early 2011 through to mid-2014, remaining below the level required to encourage investment in new mines. Mining and exploration companies in Australia have delayed uranium projects that have become uneconomic in the current market. Australia’s mine production for 2013 was 6432 t of uranium (7585 t U3O8), which was an 8% decrease on production recorded in 2012.
Vanadium: Australia’s vanadium EDR increased by 10% during 2013 to 1853 kt. This represents approximately 3% of estimated global vanadium resources, ranking Australia fourth in the world. The economic impacts of volatile prices and the nature of the vanadium market, which is supplied largely from secondary sources, has a significant impact on Australia’s vanadium EDR and the development of Australian vanadium projects. The bulk of Australia’s vanadium is located in Western Australia at Windimurra, approximately 600 km north of Perth, which reopened in 2011. It is the only vanadium mine in production.
Zinc, Lead and Silver: Australia’s EDR of zinc declined further in 2013 by 3% to 62.3 Mt, lead EDR increased by 2% to 35.0 Mt and silver EDR was unchanged from 2012 at 85.2 kt. Australia’s economic resources for both zinc and lead are the world’s largest holdings at 25% for zinc and 40% for lead and Australia has the second largest holdings of silver (16%). Queensland has 53% of the national total of EDR for zinc, 56% for lead and 57% for silver, mainly in the Mount Isa region. The Northern Territory has 32% of the national total of EDR for zinc, 25% for lead and 10% for silver, almost all of which is at the McArthur River mine. Significant EDR of silver are also found in New South Wales (14%) and South Australia (12%). Exploration expenditure on lead, zinc and silver in 2013 was $64.5 million, down 22.6%.
7
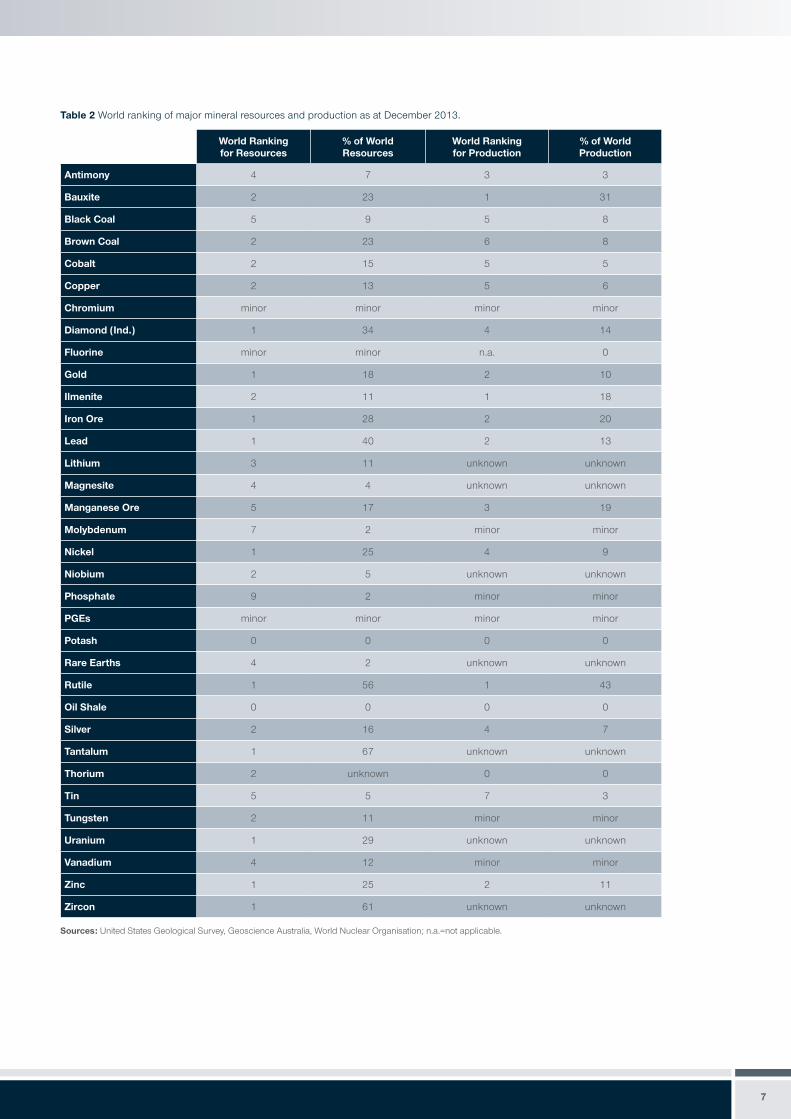
Table 2 World ranking of major mineral resources and production as at December 2013.
World Ranking for Resources
% of World Resources
World Ranking for Production
% of World Production
Antimony 4 7 3 3
Bauxite 2 23 1 31
Black Coal 5 9 5 8
Brown Coal 2 23 6 8
Cobalt 2 15 5 5
Copper 2 13 5 6
Chromium minor minor minor minor
Diamond (Ind.) 1 34 4 14
Fluorine minor minor n.a. 0
Gold 1 18 2 10
Ilmenite 2 11 1 18
Iron Ore 1 28 2 20
Lead 1 40 2 13
Lithium 3 11 unknown unknown
Magnesite 4 4 unknown unknown
Manganese Ore 5 17 3 19
Molybdenum 7 2 minor minor
Nickel 1 25 4 9
Niobium 2 5 unknown unknown
Phosphate 9 2 minor minor
PGEs minor minor minor minor
Potash 0 0 0 0
Rare Earths 4 2 unknown unknown
Rutile 1 56 1 43
Oil Shale 0 0 0 0
Silver 2 16 4 7
Tantalum 1 67 unknown unknown
Thorium 2 unknown 0 0
Tin 5 5 7 3
Tungsten 2 11 minor minor
Uranium 1 29 unknown unknown
Vanadium 4 12 minor minor
Zinc 1 25 2 11
Zircon 1 61 unknown unknown
Sources: United States Geological Survey, Geoscience Australia, World Nuclear Organisation; n.a.=not applicable.
AUSTRALIA’S IDENTIFIED MINERAL RESOURCES 20148
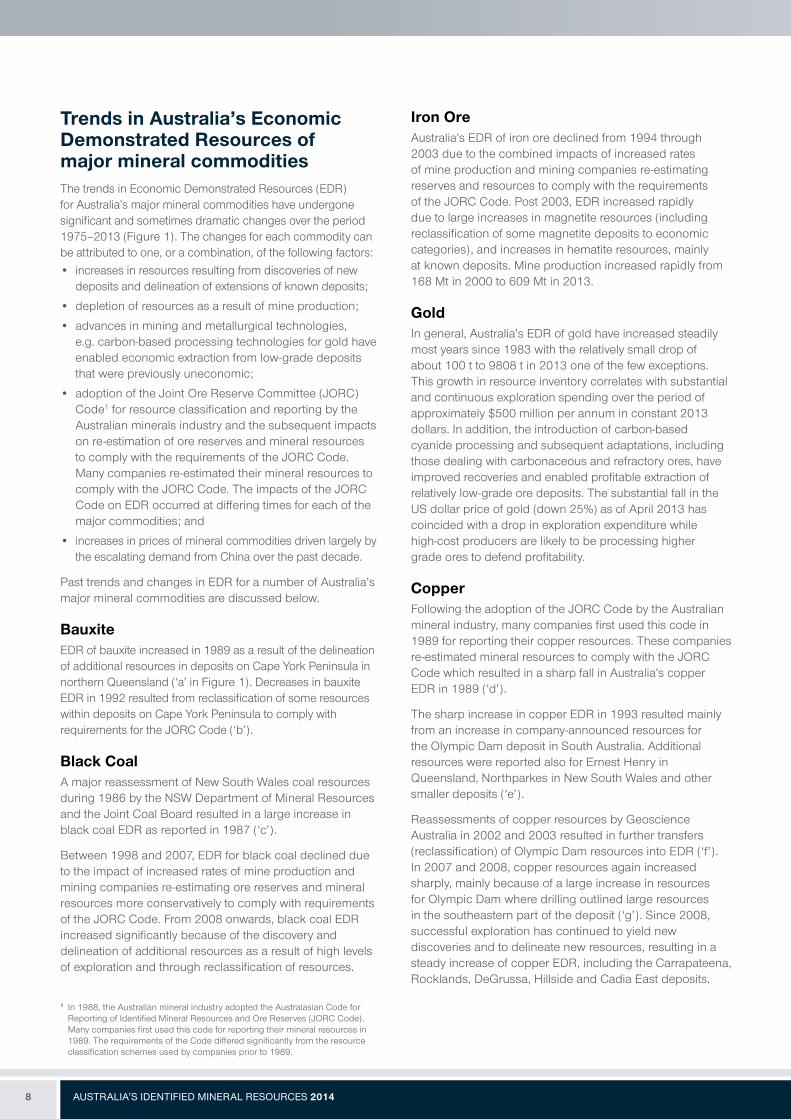
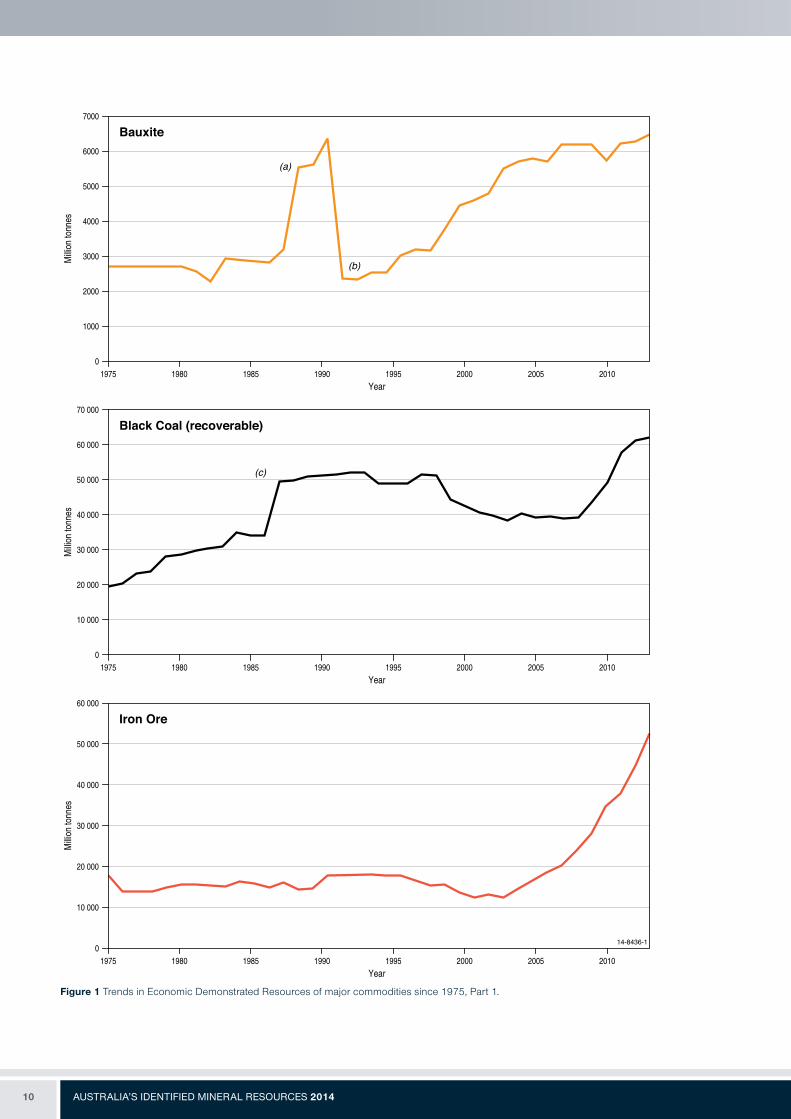
Trends in Australia’s Economic Demonstrated Resources of major mineral commoditiesThe trends in Economic Demonstrated Resources (EDR) for Australia’s major mineral commodities have undergone significant and sometimes dramatic changes over the period 1975–2013 (Figure 1). The changes for each commodity can be attributed to one, or a combination, of the following factors:• increases in resources resulting from discoveries of new
deposits and delineation of extensions of known deposits;
• depletion of resources as a result of mine production;
• advances in mining and metallurgical technologies, e.g. carbon-based processing technologies for gold have enabled economic extraction from low-grade deposits that were previously uneconomic;
• adoption of the Joint Ore Reserve Committee (JORC) Code1 for resource classification and reporting by the Australian minerals industry and the subsequent impacts on re-estimation of ore reserves and mineral resources to comply with the requirements of the JORC Code. Many companies re-estimated their mineral resources to comply with the JORC Code. The impacts of the JORC Code on EDR occurred at differing times for each of the major commodities; and
• increases in prices of mineral commodities driven largely by the escalating demand from China over the past decade.
Past trends and changes in EDR for a number of Australia’s major mineral commodities are discussed below.
BauxiteEDR of bauxite increased in 1989 as a result of the delineation of additional resources in deposits on Cape York Peninsula in northern Queensland (‘a’ in Figure 1). Decreases in bauxite EDR in 1992 resulted from reclassification of some resources within deposits on Cape York Peninsula to comply with requirements for the JORC Code (‘b’).
Black CoalA major reassessment of New South Wales coal resources during 1986 by the NSW Department of Mineral Resources and the Joint Coal Board resulted in a large increase in black coal EDR as reported in 1987 (‘c’).
Between 1998 and 2007, EDR for black coal declined due to the impact of increased rates of mine production and mining companies re-estimating ore reserves and mineral resources more conservatively to comply with requirements of the JORC Code. From 2008 onwards, black coal EDR increased significantly because of the discovery and delineation of additional resources as a result of high levels of exploration and through reclassification of resources.
1 In 1988, the Australian mineral industry adopted the Australasian Code for Reporting of Identified Mineral Resources and Ore Reserves (JORC Code). Many companies first used this code for reporting their mineral resources in 1989. The requirements of the Code differed significantly from the resource classification schemes used by companies prior to 1989.
Iron OreAustralia’s EDR of iron ore declined from 1994 through 2003 due to the combined impacts of increased rates of mine production and mining companies re-estimating reserves and resources to comply with the requirements of the JORC Code. Post 2003, EDR increased rapidly due to large increases in magnetite resources (including reclassification of some magnetite deposits to economic categories), and increases in hematite resources, mainly at known deposits. Mine production increased rapidly from 168 Mt in 2000 to 609 Mt in 2013.
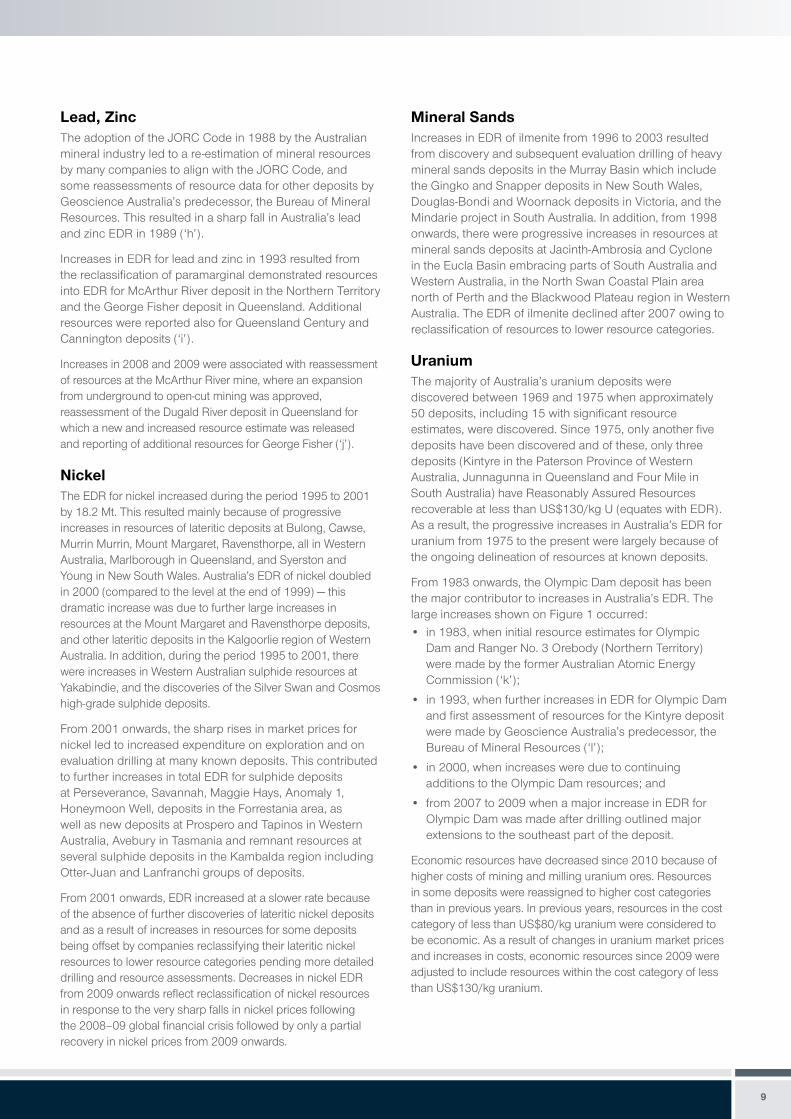
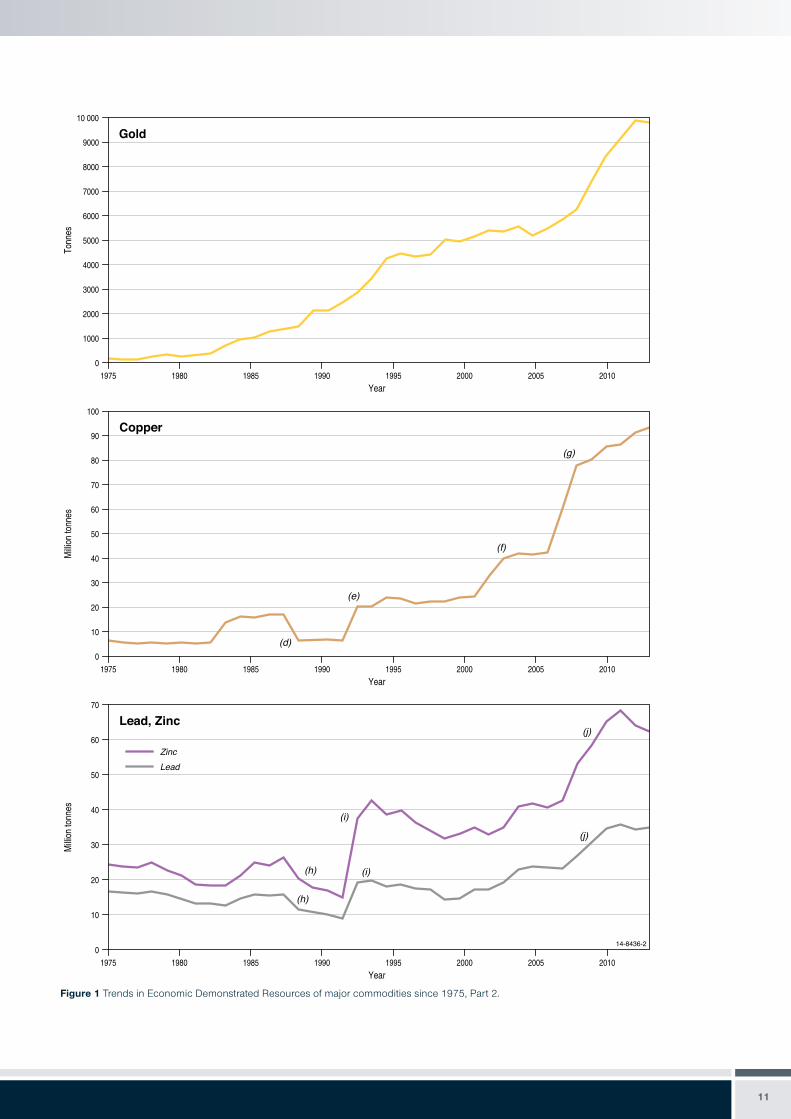
GoldIn general, Australia’s EDR of gold have increased steadily most years since 1983 with the relatively small drop of about 100 t to 9808 t in 2013 one of the few exceptions. This growth in resource inventory correlates with substantial and continuous exploration spending over the period of approximately $500 million per annum in constant 2013 dollars. In addition, the introduction of carbon-based cyanide processing and subsequent adaptations, including those dealing with carbonaceous and refractory ores, have improved recoveries and enabled profitable extraction of relatively low-grade ore deposits. The substantial fall in the US dollar price of gold (down 25%) as of April 2013 has coincided with a drop in exploration expenditure while high-cost producers are likely to be processing higher grade ores to defend profitability.
CopperFollowing the adoption of the JORC Code by the Australian mineral industry, many companies first used this code in 1989 for reporting their copper resources. These companies re-estimated mineral resources to comply with the JORC Code which resulted in a sharp fall in Australia’s copper EDR in 1989 (‘d’).
The sharp increase in copper EDR in 1993 resulted mainly from an increase in company-announced resources for the Olympic Dam deposit in South Australia. Additional resources were reported also for Ernest Henry in Queensland, Northparkes in New South Wales and other smaller deposits (‘e’).
Reassessments of copper resources by Geoscience Australia in 2002 and 2003 resulted in further transfers (reclassification) of Olympic Dam resources into EDR (‘f’). In 2007 and 2008, copper resources again increased sharply, mainly because of a large increase in resources for Olympic Dam where drilling outlined large resources in the southeastern part of the deposit (‘g’). Since 2008, successful exploration has continued to yield new discoveries and to delineate new resources, resulting in a steady increase of copper EDR, including the Carrapateena, Rocklands, DeGrussa, Hillside and Cadia East deposits.
9
Lead, ZincThe adoption of the JORC Code in 1988 by the Australian mineral industry led to a re-estimation of mineral resources by many companies to align with the JORC Code, and some reassessments of resource data for other deposits by Geoscience Australia’s predecessor, the Bureau of Mineral Resources. This resulted in a sharp fall in Australia’s lead and zinc EDR in 1989 (‘h’).
Increases in EDR for lead and zinc in 1993 resulted from the reclassification of paramarginal demonstrated resources into EDR for McArthur River deposit in the Northern Territory and the George Fisher deposit in Queensland. Additional resources were reported also for Queensland Century and Cannington deposits (‘i’).
Increases in 2008 and 2009 were associated with reassessment of resources at the McArthur River mine, where an expansion from underground to open-cut mining was approved, reassessment of the Dugald River deposit in Queensland for which a new and increased resource estimate was released and reporting of additional resources for George Fisher (‘j’).
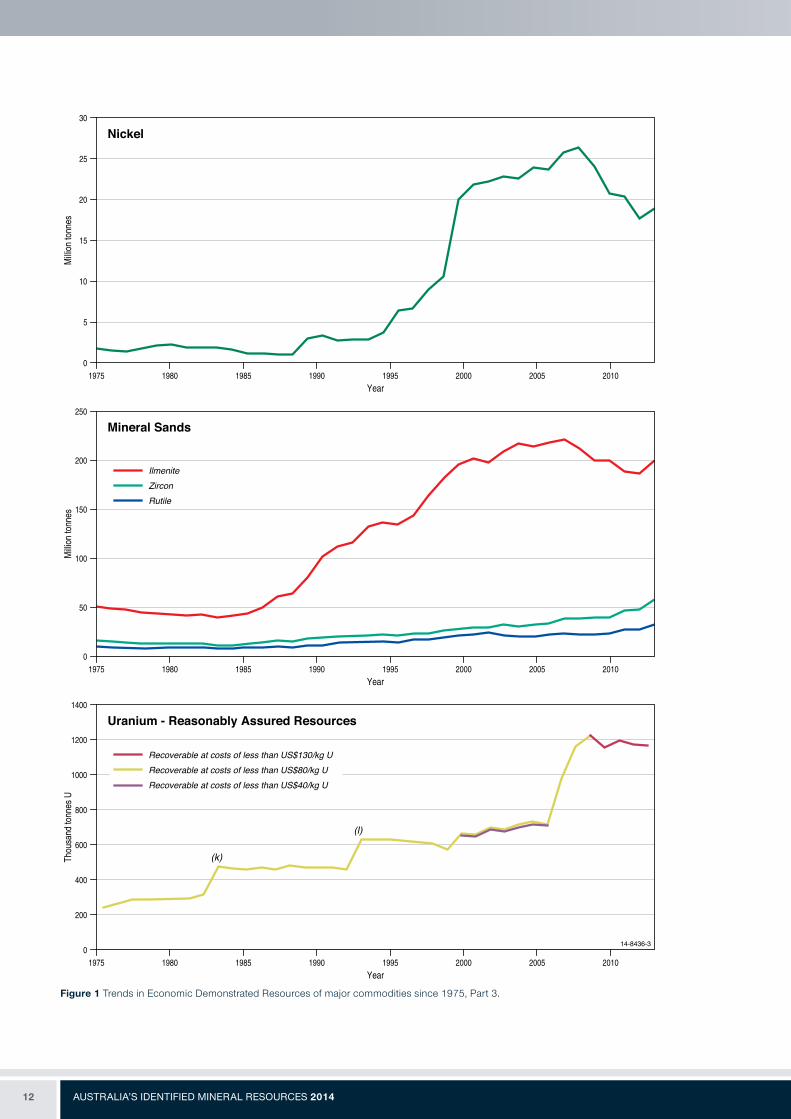
NickelThe EDR for nickel increased during the period 1995 to 2001 by 18.2 Mt. This resulted mainly because of progressive increases in resources of lateritic deposits at Bulong, Cawse, Murrin Murrin, Mount Margaret, Ravensthorpe, all in Western Australia, Marlborough in Queensland, and Syerston and Young in New South Wales. Australia’s EDR of nickel doubled in 2000 (compared to the level at the end of 1999) — this dramatic increase was due to further large increases in resources at the Mount Margaret and Ravensthorpe deposits, and other lateritic deposits in the Kalgoorlie region of Western Australia. In addition, during the period 1995 to 2001, there were increases in Western Australian sulphide resources at Yakabindie, and the discoveries of the Silver Swan and Cosmos high-grade sulphide deposits.
From 2001 onwards, the sharp rises in market prices for nickel led to increased expenditure on exploration and on evaluation drilling at many known deposits. This contributed to further increases in total EDR for sulphide deposits at Perseverance, Savannah, Maggie Hays, Anomaly 1, Honeymoon Well, deposits in the Forrestania area, as well as new deposits at Prospero and Tapinos in Western Australia, Avebury in Tasmania and remnant resources at several sulphide deposits in the Kambalda region including Otter-Juan and Lanfranchi groups of deposits.
From 2001 onwards, EDR increased at a slower rate because of the absence of further discoveries of lateritic nickel deposits and as a result of increases in resources for some deposits being offset by companies reclassifying their lateritic nickel resources to lower resource categories pending more detailed drilling and resource assessments. Decreases in nickel EDR from 2009 onwards reflect reclassification of nickel resources in response to the very sharp falls in nickel prices following the 2008–09 global financial crisis followed by only a partial recovery in nickel prices from 2009 onwards.
Mineral SandsIncreases in EDR of ilmenite from 1996 to 2003 resulted from discovery and subsequent evaluation drilling of heavy mineral sands deposits in the Murray Basin which include the Gingko and Snapper deposits in New South Wales, Douglas-Bondi and Woornack deposits in Victoria, and the Mindarie project in South Australia. In addition, from 1998 onwards, there were progressive increases in resources at mineral sands deposits at Jacinth-Ambrosia and Cyclone in the Eucla Basin embracing parts of South Australia and Western Australia, in the North Swan Coastal Plain area north of Perth and the Blackwood Plateau region in Western Australia. The EDR of ilmenite declined after 2007 owing to reclassification of resources to lower resource categories.
UraniumThe majority of Australia’s uranium deposits were discovered between 1969 and 1975 when approximately 50 deposits, including 15 with significant resource estimates, were discovered. Since 1975, only another five deposits have been discovered and of these, only three deposits (Kintyre in the Paterson Province of Western Australia, Junnagunna in Queensland and Four Mile in South Australia) have Reasonably Assured Resources recoverable at less than US$130/kg U (equates with EDR). As a result, the progressive increases in Australia’s EDR for uranium from 1975 to the present were largely because of the ongoing delineation of resources at known deposits.
From 1983 onwards, the Olympic Dam deposit has been the major contributor to increases in Australia’s EDR. The large increases shown on Figure 1 occurred:• in 1983, when initial resource estimates for Olympic
Dam and Ranger No. 3 Orebody (Northern Territory) were made by the former Australian Atomic Energy Commission (‘k’);
• in 1993, when further increases in EDR for Olympic Dam and first assessment of resources for the Kintyre deposit were made by Geoscience Australia’s predecessor, the Bureau of Mineral Resources (‘l’);
• in 2000, when increases were due to continuing additions to the Olympic Dam resources; and
• from 2007 to 2009 when a major increase in EDR for Olympic Dam was made after drilling outlined major extensions to the southeast part of the deposit.
Economic resources have decreased since 2010 because of higher costs of mining and milling uranium ores. Resources in some deposits were reassigned to higher cost categories than in previous years. In previous years, resources in the cost category of less than US$80/kg uranium were considered to be economic. As a result of changes in uranium market prices and increases in costs, economic resources since 2009 were adjusted to include resources within the cost category of less than US$130/kg uranium.
AUSTRALIA’S IDENTIFIED MINERAL RESOURCES 201410
0
Year
14-8436-1
Iron Ore
1975 19901985 1995 20001980 20102005
Milli
on to
nnes
Milli
on to
nnes
Milli
on to
nnes
7000
6000
5000
4000
3000
2000
1000
Bauxite
Black Coal (recoverable)
(c)
70 000
60 000
50 000
40 000
30 000
20 000
10 000
(b)
(a)
0
Year1975 19901985 1995 20001980 20102005
60 000
50 000
40 000
30 000
20 000
10 000
0
Year1975 19901985 1995 20001980 20102005
Figure 1 Trends in Economic Demonstrated Resources of major commodities since 1975, Part 1.
11
70
14-8436-2
100
80
60
40
20
Milli
on to
nnes
Lead, Zinc60
50
40
30
20
10
Milli
on to
nnes
ZincLead
Gold
0
Year1975 19901985 1995 20001980 20102005
10 000
Tonn
es
8000
6000
4000
2000
9000
7000
5000
3000
1000
Copper90
70
50
30
10
0
Year1975 19901985 1995 20001980 20102005
0
Year1975 19901985 1995 20001980 20102005
(d)
(e)
(f)
(g)
(h)
(h)
(i)
(i)
(j)
(j)
Figure 1 Trends in Economic Demonstrated Resources of major commodities since 1975, Part 2.
AUSTRALIA’S IDENTIFIED MINERAL RESOURCES 201412
Year
1975 1990
Year1985 1995 20001980 20102005
Year
14-8436-3
1975 19901985 1995 20001980 20102005
1975 19901985 1995 20001980 20102005
30
25
0
250
50
0
Milli
on to
nnes
0
Milli
on to
nnes
Nickel
20
15
10
5
Mineral Sands
100
150
200Ilmenite
RutileZircon
Recoverable at costs of less than US$130/kg URecoverable at costs of less than US$80/kg URecoverable at costs of less than US$40/kg U
Thou
sand
tonn
es U
1400
1200
1000
800
600
400
200
(k)
(l)
Uranium - Reasonably Assured Resources
Figure 1 Trends in Economic Demonstrated Resources of major commodities since 1975, Part 3.

13
Resources to Production RatiosThe continuing contribution of mineral resources to Australia’s economic performance in the medium and longer term will depend on the discovery and development of new, good quality resources. To assist with an assessment of the future long-term supply capability of identified resources, an indicator of long-term resource life using ratios of Accessible Economic Demonstrated Resources (AEDR) to current mine production are compiled in Table 3. Ratios of AEDR to current mine production provide indicative estimates of resource life. AEDR of most of Australia’s major commodities can sustain current rates of mine production for many decades. Resource life based on Ore Reserves compliant with the JORC Code is lower, reflecting a shorter term commercial outlook.
The annual AEDR/production ratio, rounded to the nearest 5 years, is merely a snapshot in time and is not necessarily representative of the long-term trend. Variations in the rates of production in response to demand can radically change the resource/production ratio. A case in point is mineral sands: In Table 3, rutile has an AEDR/production ratio of 50 in 2012 which has more than doubled to 115 in 2013. This was caused by the almost halving of production from 439 kt in 2012 to 244 kt in 2013 as the mineral sands industry was affected by low prices.
Table 3 presents the AEDR/production ratios from 1998 to 2013 and Reserves/production ratios are provided for 2003, 2008 and 2013 for comparison with the longer term AEDR/production ratios. The AEDR/production ratios differ for various commodities over this 15 year period:• In 2013, the AEDR/production ratios (resource life at
current rates of production) ranged between 20 years (diamonds) and 465 years (brown coal).
• The commodities with the longest resource life based on AEDR/production ratios in 2013 are brown coal (465 years at current rates of production), uranium (170 years), ilmenite (145 years), rutile (115 years) and black coal (100 years).
• Commodities with a resource life of less than 50 years at current rates of production are diamond (20 years) manganese ore (30 years), gold (35 years), zinc (40 years) and silver (45 years).
• Long-term decline between 1998 and 2013 for black coal and nickel reflect major increases in production and downgrading of resources.
• The decline in iron ore prior to 2008 has been partly offset by the development of large magnetite iron ore deposits in the Pilbara and mid-west regions of Western Australia. These magnetite resources, which were previously considered to be subeconomic, are becoming increasingly more viable.
• Long-term increases in AEDR/production ratios are evident for copper, diamond, ilmenite, gold, lead, silver and zinc.
• Increases in the AEDR/production ratios between 2012 and 2013 were recorded for ilmenite, manganese ore, nickel, rutile and uranium. Ilmenite, rutile and nickel had significant increases in AERD with concurrent decreases in production. Manganese production increased in 2013 but resources increased more and uranium production was down by 8% but resources almost unchanged.
• Reductions in AEDR/production ratios during 2013 were recorded for black coal, brown coal, copper, diamond, gold, lead and silver. For diamond and gold the reductions were the result of decreases in resources with concurrent increases in production. For brown coal and silver, production increased but AEDR was unchanged. For black coal, copper and lead AEDR increased but there was a greater increase in production.
Changes in the ratios of Ore Reserves to production predominantly reflect the ongoing practice of companies replenishing depleted Reserves by upgrading Measured and Indicated Resources to maintain a steady supply of mineable ore for mine production. Reserve/production ratios for the period 2003 to 2013 show that:• In 2013, the Reserve/production ratios (Reserve life in
years at current rates of production) ranged between 10 years for diamonds and 60 years for uranium with 9 out of 14 commodities (excluding brown coal and zircon) having a ratio of 10 to 30 years.
• Reserve/production ratios fall within a narrower bandwidth than the AEDR/production ratios and have changed little during the period between 2003 and 2013 with the shortest Reserve/production ratio of five years for diamonds in 2003 (10 years in 2013) and the longest at 55 years for uranium in 2003 and again in 2013.
• These figures indicate that as Reserves are depleted by mining these are replenished by upgrading Measured and Indicated Resources to Reserves as required.
It is important to note that a long resource life for a particular commodity is not a guarantee that the resource will continue to be extracted in Australia. In an increasingly globalised and competitive commodity market, multinational mining companies search for mineral deposits that offer the most attractive returns on investment. These returns are influenced by both the quality of the resources (grade and tonnage) and by environmental, social and political factors as well as land access, infrastructure and the location and scale of the mining operations proposed by the company.
The global financial crisis in 2008 forced many companies to reassess their options for both existing and planned operations in Australia. In the case of black coal and iron ore, the initial impact of the global financial crisis caused some mining operations to scale back production while others delayed plans for expansion and some mines closed at the end of 2008. By mid-2009, recovery in mining operations and development plans were well underway but this trend has been less pronounced recently because of volatile commodity prices, particularly for iron ore and coal.
AUSTRALIA’S IDENTIFIED MINERAL RESOURCES 201414
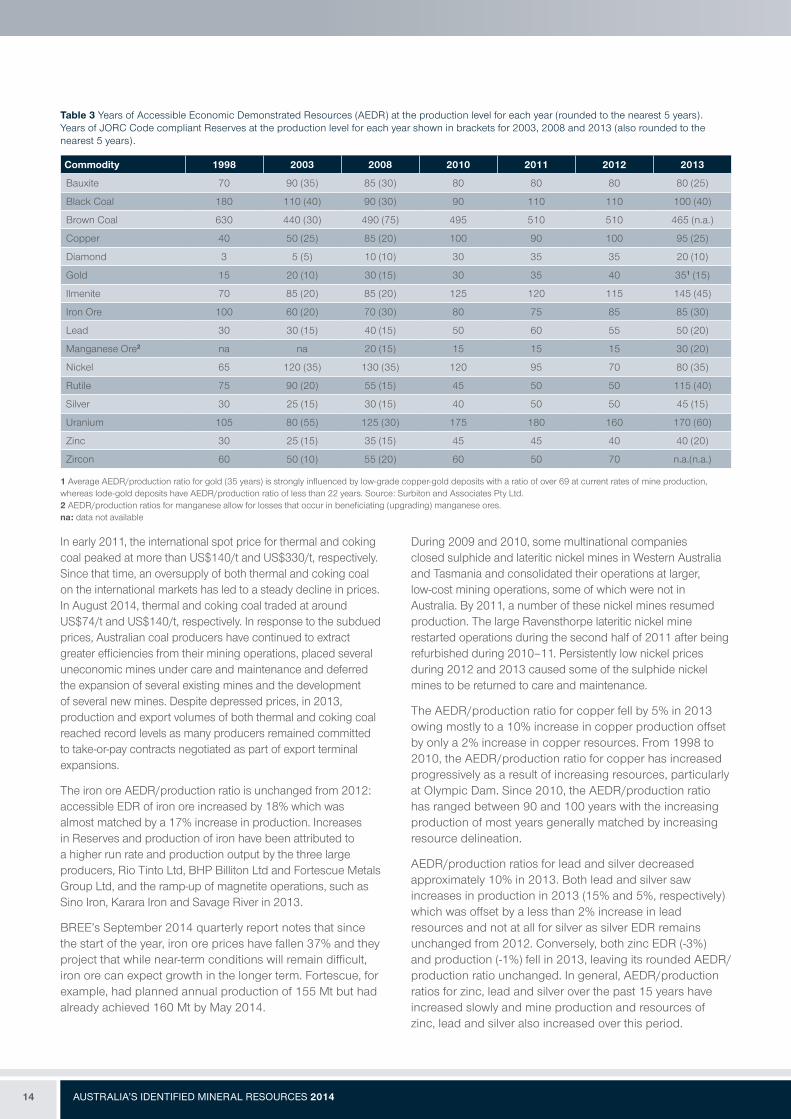
Table 3 Years of Accessible Economic Demonstrated Resources (AEDR) at the production level for each year (rounded to the nearest 5 years). Years of JORC Code compliant Reserves at the production level for each year shown in brackets for 2003, 2008 and 2013 (also rounded to the nearest 5 years).
Commodity 1998 2003 2008 2010 2011 2012 2013
Bauxite 70 90 (35) 85 (30) 80 80 80 80 (25)
Black Coal 180 110 (40) 90 (30) 90 110 110 100 (40)
Brown Coal 630 440 (30) 490 (75) 495 510 510 465 (n.a.)
Copper 40 50 (25) 85 (20) 100 90 100 95 (25)
Diamond 3 5 (5) 10 (10) 30 35 35 20 (10)
Gold 15 20 (10) 30 (15) 30 35 40 351 (15)
Ilmenite 70 85 (20) 85 (20) 125 120 115 145 (45)
Iron Ore 100 60 (20) 70 (30) 80 75 85 85 (30)
Lead 30 30 (15) 40 (15) 50 60 55 50 (20)
Manganese Ore2 na na 20 (15) 15 15 15 30 (20)
Nickel 65 120 (35) 130 (35) 120 95 70 80 (35)
Rutile 75 90 (20) 55 (15) 45 50 50 115 (40)
Silver 30 25 (15) 30 (15) 40 50 50 45 (15)
Uranium 105 80 (55) 125 (30) 175 180 160 170 (60)
Zinc 30 25 (15) 35 (15) 45 45 40 40 (20)
Zircon 60 50 (10) 55 (20) 60 50 70 n.a.(n.a.)
1 Average AEDR/production ratio for gold (35 years) is strongly influenced by low-grade copper-gold deposits with a ratio of over 69 at current rates of mine production, whereas lode-gold deposits have AEDR/production ratio of less than 22 years. Source: Surbiton and Associates Pty Ltd. 2 AEDR/production ratios for manganese allow for losses that occur in beneficiating (upgrading) manganese ores. na: data not available
In early 2011, the international spot price for thermal and coking coal peaked at more than US$140/t and US$330/t, respectively. Since that time, an oversupply of both thermal and coking coal on the international markets has led to a steady decline in prices. In August 2014, thermal and coking coal traded at around US$74/t and US$140/t, respectively. In response to the subdued prices, Australian coal producers have continued to extract greater efficiencies from their mining operations, placed several uneconomic mines under care and maintenance and deferred the expansion of several existing mines and the development of several new mines. Despite depressed prices, in 2013, production and export volumes of both thermal and coking coal reached record levels as many producers remained committed to take-or-pay contracts negotiated as part of export terminal expansions.
The iron ore AEDR/production ratio is unchanged from 2012: accessible EDR of iron ore increased by 18% which was almost matched by a 17% increase in production. Increases in Reserves and production of iron have been attributed to a higher run rate and production output by the three large producers, Rio Tinto Ltd, BHP Billiton Ltd and Fortescue Metals Group Ltd, and the ramp-up of magnetite operations, such as Sino Iron, Karara Iron and Savage River in 2013.
BREE’s September 2014 quarterly report notes that since the start of the year, iron ore prices have fallen 37% and they project that while near-term conditions will remain difficult, iron ore can expect growth in the longer term. Fortescue, for example, had planned annual production of 155 Mt but had already achieved 160 Mt by May 2014.
During 2009 and 2010, some multinational companies closed sulphide and lateritic nickel mines in Western Australia and Tasmania and consolidated their operations at larger, low-cost mining operations, some of which were not in Australia. By 2011, a number of these nickel mines resumed production. The large Ravensthorpe lateritic nickel mine restarted operations during the second half of 2011 after being refurbished during 2010–11. Persistently low nickel prices during 2012 and 2013 caused some of the sulphide nickel mines to be returned to care and maintenance.
The AEDR/production ratio for copper fell by 5% in 2013 owing mostly to a 10% increase in copper production offset by only a 2% increase in copper resources. From 1998 to 2010, the AEDR/production ratio for copper has increased progressively as a result of increasing resources, particularly at Olympic Dam. Since 2010, the AEDR/production ratio has ranged between 90 and 100 years with the increasing production of most years generally matched by increasing resource delineation.
AEDR/production ratios for lead and silver decreased approximately 10% in 2013. Both lead and silver saw increases in production in 2013 (15% and 5%, respectively) which was offset by a less than 2% increase in lead resources and not at all for silver as silver EDR remains unchanged from 2012. Conversely, both zinc EDR (-3%) and production (-1%) fell in 2013, leaving its rounded AEDR/production ratio unchanged. In general, AEDR/production ratios for zinc, lead and silver over the past 15 years have increased slowly and mine production and resources of zinc, lead and silver also increased over this period.
15
AEDR for gold decreased by 101 t or about 1% in 2013 while JORC Code Reserves declined by 208 t or 5%. Production for the year was 265 t or 14 t more than in 2012. These figures resulted in a decrease in the AEDR/production ratio to about 35 years (about 40 years in 2012) while the Reserve/production ratio decreased marginally to just below 15 years.
As lode-gold deposits dominate annual production while copper-gold deposits dominate resources, it is instructive to review the AEDR/production ratio of these deposit groupings separately. In 2013, the AEDR of lode-gold deposits rose by 52 t to 3752 t while production from the group rose 8 t to 172 t or 65% of national production. These figures yield a AEDR/production ratio of about 22 years, considerably less than the 35 years for all gold deposits. In contrast, the AEDR of copper-gold deposits fell 250 t to 5537 t in 2013, while production from the group rose by 7 t to 80 t or 30% of national production. The AEDR/production ratio for the group in 2013 fell about 9 years to 69 years but remained substantially larger than that for all gold deposits.
For heavy mineral sands operations, some producers closed down low-grade ilmenite deposits in 2008 to concentrate on deposits that have higher zircon content or are more readily amenable to beneficiation. However, sharply lower levels of production of ilmenite, rutile and zircon in 2009 resulting from the flow-on effects of the global financial crisis in late 2008 and early 2009 led to increases in resource life in 2010. In 2012, an increase in ilmenite production to 1.344 Mt decreased the ilmenite AEDR/production ratio but in 2013 the mineral sands industry was again affected by low prices leading to a drop in production and a consequent large increase in the AEDR/production ratio for rutile and ilmenite. Zircon production for 2013 has not been reported so its AERD/production ratio is unknown.
For uranium, AEDR/production ratios increased progressively from 2003 to 2011, the result of significant increases in Australia’s uranium resources. A large proportion of this increase was a consequence ongoing mineral resource evaluation at the Olympic Dam deposit. From 2011 onwards, uranium resources have remained fairly static and operational problems have affected production rates at three uranium mines (damage to a haulage shaft at Olympic Dam, flooding of the Ranger 3 pit and operating problems at Beverley), as reflected in AEDR/production ratios.
Australia’s mine production of uranium for 2013 decreased 8% relative to production recorded in 2012. Rectification of operational problems from 2012 onwards has led to increased production, resulting in a slightly lower AEDR/production ratio. Increases in mining and processing costs since 2011 have limited the growth of Australia’s AEDR, though a significant one-off increase in AEDR of uranium resulted from the Queensland State Government lifting its ban on uranium mining. Recognising improvements in nationally endorsed safety and environmental regulation, the New South Wales State Government has also lifted its prohibition on uranium exploration.
Market prices for uranium progressively decreased from 2011 to early 2014. A changing supply to demand balance has led to increases in market prices from mid-2014 onwards. From 2011 to 2014, spot prices remained below the level required to encourage investment in new mines. Mining and exploration companies in Australia have delayed uranium projects that have become uneconomic in the soft market, focusing investment on advancing only those projects that should result in the highest return on capital investments.
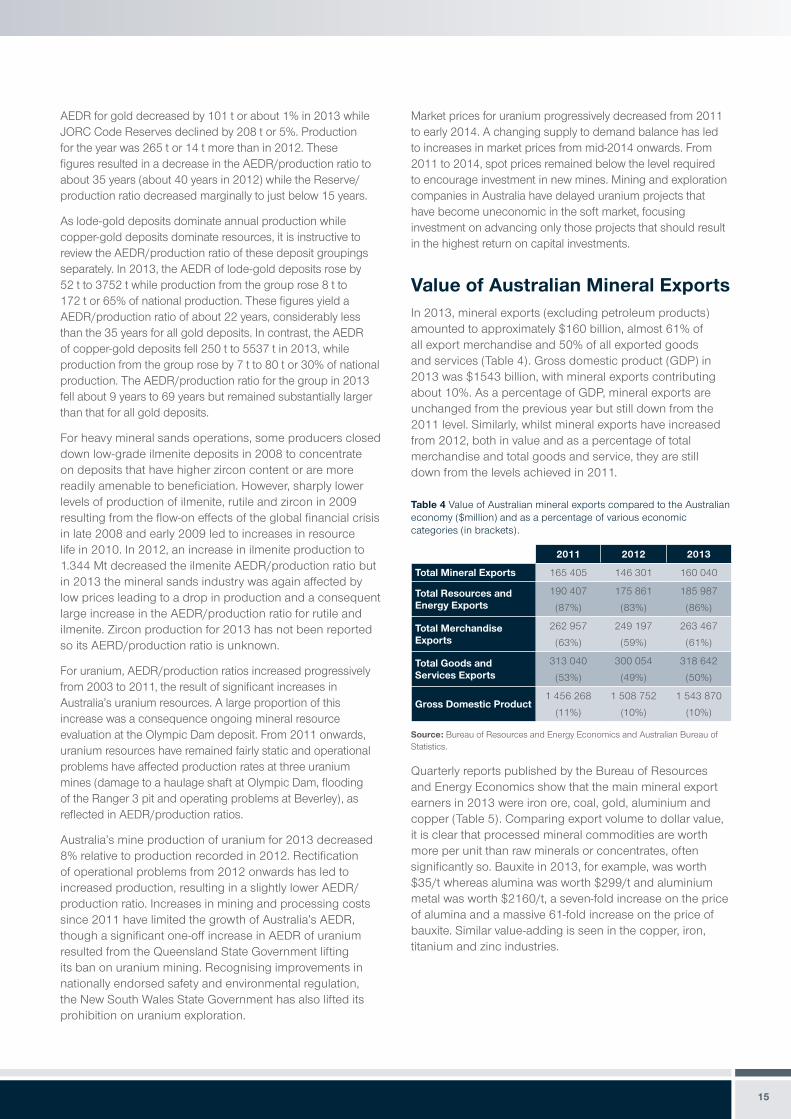
Value of Australian Mineral ExportsIn 2013, mineral exports (excluding petroleum products) amounted to approximately $160 billion, almost 61% of all export merchandise and 50% of all exported goods and services (Table 4). Gross domestic product (GDP) in 2013 was $1543 billion, with mineral exports contributing about 10%. As a percentage of GDP, mineral exports are unchanged from the previous year but still down from the 2011 level. Similarly, whilst mineral exports have increased from 2012, both in value and as a percentage of total merchandise and total goods and service, they are still down from the levels achieved in 2011.
Table 4 Value of Australian mineral exports compared to the Australian economy ($million) and as a percentage of various economic categories (in brackets).
2011 2012 2013
Total Mineral Exports 165 405 146 301 160 040
Total Resources and Energy Exports
190 407
(87%)
175 861
(83%)
185 987
(86%)
Total Merchandise Exports
262 957
(63%)
249 197
(59%)
263 467
(61%)
Total Goods and Services Exports
313 040
(53%)
300 054
(49%)
318 642
(50%)
Gross Domestic Product1 456 268
(11%)
1 508 752
(10%)
1 543 870
(10%)
Source: Bureau of Resources and Energy Economics and Australian Bureau of Statistics.
Quarterly reports published by the Bureau of Resources and Energy Economics show that the main mineral export earners in 2013 were iron ore, coal, gold, aluminium and copper (Table 5). Comparing export volume to dollar value, it is clear that processed mineral commodities are worth more per unit than raw minerals or concentrates, often significantly so. Bauxite in 2013, for example, was worth $35/t whereas alumina was worth $299/t and aluminium metal was worth $2160/t, a seven-fold increase on the price of alumina and a massive 61-fold increase on the price of bauxite. Similar value-adding is seen in the copper, iron, titanium and zinc industries.
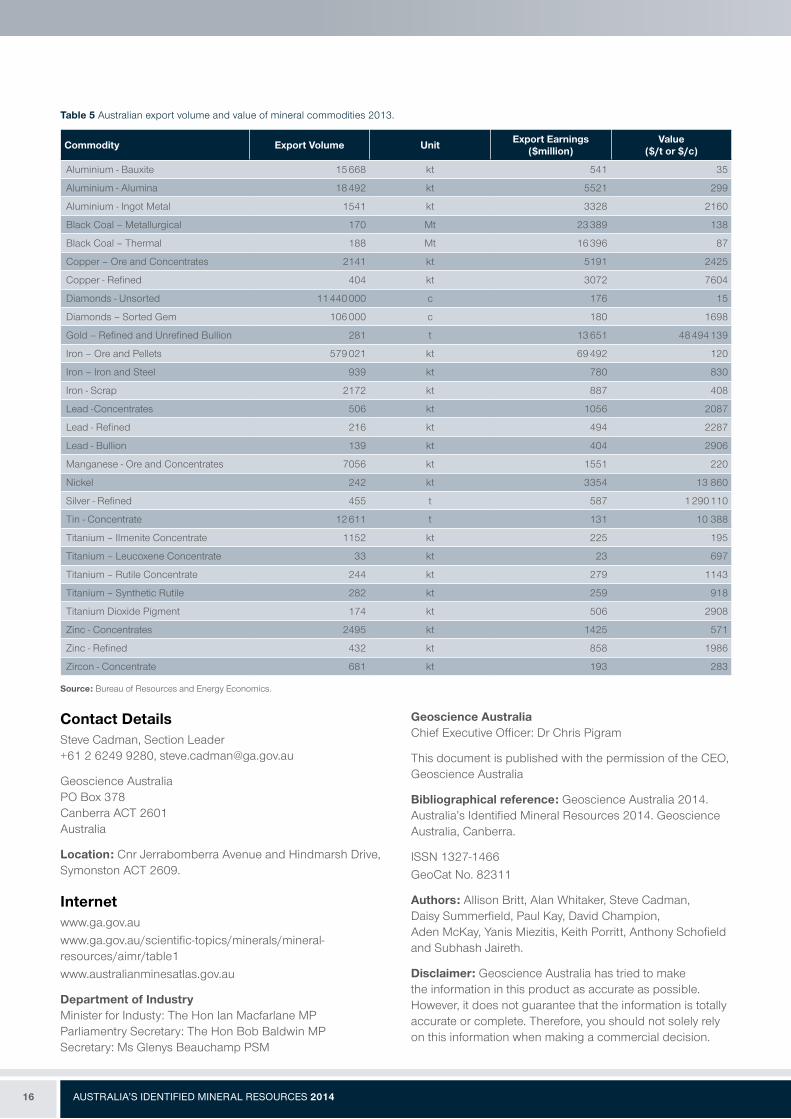
Table 5 Australian export volume and value of mineral commodities 2013.
Commodity Export Volume Unit Export Earnings ($million)
Value ($/t or $/c)
Aluminium - Bauxite 15 668 kt 541 35
Aluminium - Alumina 18 492 kt 5521 299
Aluminium - Ingot Metal 1541 kt 3328 2160
Black Coal – Metallurgical 170 Mt 23 389 138
Black Coal – Thermal 188 Mt 16 396 87
Copper – Ore and Concentrates 2141 kt 5191 2425
Copper - Refined 404 kt 3072 7604
Diamonds - Unsorted 11 440 000 c 176 15
Diamonds – Sorted Gem 106 000 c 180 1698
Gold – Refined and Unrefined Bullion 281 t 13 651 48 494 139
Iron – Ore and Pellets 579 021 kt 69 492 120
Iron – Iron and Steel 939 kt 780 830
Iron - Scrap 2172 kt 887 408
Lead -Concentrates 506 kt 1056 2087
Lead - Refined 216 kt 494 2287
Lead - Bullion 139 kt 404 2906
Manganese - Ore and Concentrates 7056 kt 1551 220
Nickel 242 kt 3354 13 860
Silver - Refined 455 t 587 1 290 110
Tin - Concentrate 12 611 t 131 10 388
Titanium – Ilmenite Concentrate 1152 kt 225 195
Titanium – Leucoxene Concentrate 33 kt 23 697
Titanium – Rutile Concentrate 244 kt 279 1143
Titanium – Synthetic Rutile 282 kt 259 918
Titanium Dioxide Pigment 174 kt 506 2908
Zinc - Concentrates 2495 kt 1425 571
Zinc - Refined 432 kt 858 1986
Zircon - Concentrate 681 kt 193 283
Source: Bureau of Resources and Energy Economics.
Contact DetailsSteve Cadman, Section Leader +61 2 6249 9280, [email protected]
Geoscience Australia PO Box 378 Canberra ACT 2601 Australia
Location: Cnr Jerrabomberra Avenue and Hindmarsh Drive, Symonston ACT 2609.
Internetwww.ga.gov.auwww.ga.gov.au/scientific-topics/minerals/mineral-resources/aimr/table1www.australianminesatlas.gov.au
Department of Industry Minister for Industy: The Hon Ian Macfarlane MP Parliamentry Secretary: The Hon Bob Baldwin MP Secretary: Ms Glenys Beauchamp PSM
Geoscience Australia Chief Executive Officer: Dr Chris Pigram
This document is published with the permission of the CEO, Geoscience Australia
Bibliographical reference: Geoscience Australia 2014. Australia’s Identified Mineral Resources 2014. Geoscience Australia, Canberra.
ISSN 1327-1466GeoCat No. 82311
Authors: Allison Britt, Alan Whitaker, Steve Cadman, Daisy Summerfield, Paul Kay, David Champion, Aden McKay, Yanis Miezitis, Keith Porritt, Anthony Schofield and Subhash Jaireth.
Disclaimer: Geoscience Australia has tried to make the information in this product as accurate as possible. However, it does not guarantee that the information is totally accurate or complete. Therefore, you should not solely rely on this information when making a commercial decision.
AUSTRALIA’S IDENTIFIED MINERAL RESOURCES 201416


