
Journal of Colloid and Interface Science 434 (2014) 104–112
Contents lists available at ScienceDirect
Journal of Colloid and Interface Science
www.elsevier .com/locate / jc is
Au(I)–thiolate nanostructures fabricated by chemical exfoliation andtheir transformation to gold nanoparticle assemblies
http://dx.doi.org/10.1016/j.jcis.2014.08.0030021-9797/� 2014 Elsevier Inc. All rights reserved.
⇑ Corresponding authors. Fax: +86 0431 85153812.E-mail addresses: [email protected] (M. Li), [email protected] (S.X.-A.
Zhang).
Hui Nie, Minjie Li ⇑, Yajiao Hao, Xudong Wang, Sheng Gao, Bingjie Yang, Mengdi Gu, Linlin Sun,Sean Xiao-An Zhang ⇑State Key Lab of Supramolecular Structure and Materials, Jilin University, Changchun 130000, PR China
a r t i c l e i n f o a b s t r a c t
Article history:Received 26 May 2014Accepted 2 August 2014Available online 12 August 2014
Keywords:Au(I)–thiolate coordination polymerNanosheetNanostringGold nanoparticle assembliesChemical exfoliationThermal decomposition
Chemical exfoliation method was applied to transform bulky assemblies of Au(I)–3-mercaptopropionate(MPA) coordination polymer (CP) to nanosheets and nanostrings using sodium citrate as an exfoliator.The exfoliation process and the structural characteristics of the Au(I)–MPA nanosheets and nanostringswere fully investigated by transmission electron microscopy, atomic force microscopy, UV–vis absorptionspectroscopy, X-ray photoelectron spectroscopy and so on. As the structural rigidity and stability of theobtained Au(I)–MPA nanosheets, they are ideal precursors for fabrication of water soluble gold nanopar-ticle assemblies through progressive pyrolysis. This work provides a significant strategy toward the mor-phology regulation of CP nanostructures and will inspire further development of this research area.
� 2014 Elsevier Inc. All rights reserved.
1. Introduction
Coordination polymers (CPs) are an important class of self-assembly functional materials [1,2]. Among these materials, coor-dination polymer particles (CPPs) have attracted growing interestdue to their highly structural tailorability [3–6]. The size- and mor-phology-dependent properties of CPPs promise a wide scope ofapplications including catalysis [7,8], imaging [9], drug delivery[10], and so on [11]. Thus, developing CPPs with diversified mor-phologies are highly important. Until now, CPP materials are typi-cally prepared by bottom-up methods from ligands and metal ions.For examples, Mirkin et al. have prepared chemically tailorablemetal–metalloligand colloidal nanospheres by solvent-inducedprecipitation in 2005 [12]. Lin et al. have used the water-in-oilmicroemulsion strategy to fabricate Gd(III), Gd(III)/doped-Eu(III)and Gd(III)/doped-Tb(III) CP nanorods, and then evaluated themas MRI contrast agents [9]. However, there is very little informationabout how and why one CPP morphology or shape forms asopposed to another. Therefore, morphology control of CPPs in apredictable manner is still a great challenge and a major obstaclewhich hampers its further development. Chemical exfoliation rep-resents a typical top-down method to downsize the architectures
and fabricate nanomaterials with diverse morphologies [13,14].However, it has not been applied to prepare CPPs yet.
Metal(I)–thiolate CP materials, such as Au(I)–thiolate and Ag(I)–thiolate CPs, have long been investigated for their unique lamellarstructures and metallophilic interactions [15–17]. Metal(I)–thio-late lamellar structures are comprised of parallel slabs of stronglyconnected metal ions and S atoms, with the substituents on Sextending from both sides of each slab. And the stacking of layersthen involves weak interlayer interactions, such as Van der Waalsforce and hydrogen bonding between the ligands. Such lamellarmaterials have exhibited a versatile range of applications from pre-cursor of nanoparticles to the recent development as sensors andemitters [18–20]. However, the lamellar structures are usually inmacroscopic scale, resulting in poor dispersibility and thus limitedapplications. As the anisotropic interactions in metal(I)–thiolatelamellar structures, they are deduced as ideal objects for chemicalexfoliation and precursors for diverse metal(I)–thiolate nanostruc-tures with unique optic or electronic properties.
Here, we report our success on control of the size and morphol-ogy of CPPs from bulky Au(I)-3-mercaptopropionate (MPA) lamel-lar assemblies by post chemical exfoliation. Au(I)–MPA nanosheetswith tunable size and thickness, as well as nanostrings wereobtained by using different amount of exfoliation agent. Here,sodium citrate (CA–Na) is found to be a good choice for exfoliationagent, which acts as not only a decomposable pH tuner, but also asurfactant to enhance the dispersibility of the products (Scheme 1).The structural attributes of the obtained nanosheets and
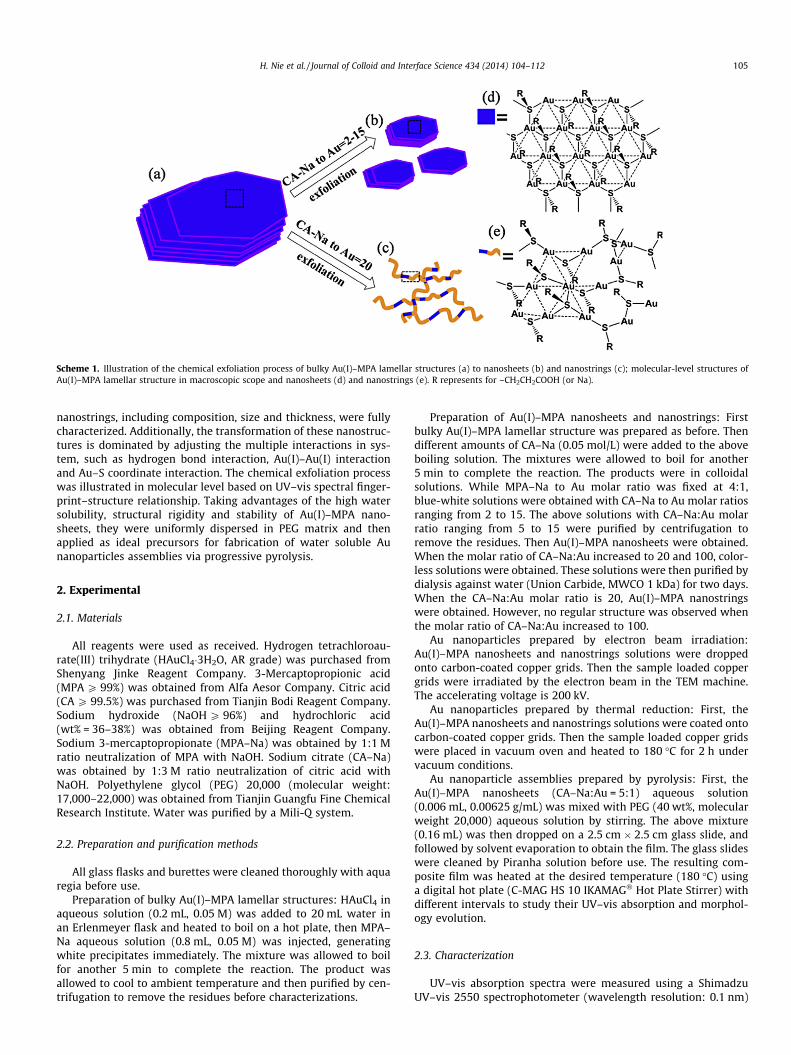
Scheme 1. Illustration of the chemical exfoliation process of bulky Au(I)–MPA lamellar structures (a) to nanosheets (b) and nanostrings (c); molecular-level structures ofAu(I)–MPA lamellar structure in macroscopic scope and nanosheets (d) and nanostrings (e). R represents for –CH2CH2COOH (or Na).
H. Nie et al. / Journal of Colloid and Interface Science 434 (2014) 104–112 105
nanostrings, including composition, size and thickness, were fullycharacterized. Additionally, the transformation of these nanostruc-tures is dominated by adjusting the multiple interactions in sys-tem, such as hydrogen bond interaction, Au(I)–Au(I) interactionand Au–S coordinate interaction. The chemical exfoliation processwas illustrated in molecular level based on UV–vis spectral finger-print–structure relationship. Taking advantages of the high watersolubility, structural rigidity and stability of Au(I)–MPA nano-sheets, they were uniformly dispersed in PEG matrix and thenapplied as ideal precursors for fabrication of water soluble Aunanoparticles assemblies via progressive pyrolysis.
2. Experimental
2.1. Materials
All reagents were used as received. Hydrogen tetrachloroau-rate(III) trihydrate (HAuCl4�3H2O, AR grade) was purchased fromShenyang Jinke Reagent Company. 3-Mercaptopropionic acid(MPA P 99%) was obtained from Alfa Aesor Company. Citric acid(CA P 99.5%) was purchased from Tianjin Bodi Reagent Company.Sodium hydroxide (NaOH P 96%) and hydrochloric acid(wt% = 36–38%) was obtained from Beijing Reagent Company.Sodium 3-mercaptopropionate (MPA–Na) was obtained by 1:1 Mratio neutralization of MPA with NaOH. Sodium citrate (CA–Na)was obtained by 1:3 M ratio neutralization of citric acid withNaOH. Polyethylene glycol (PEG) 20,000 (molecular weight:17,000–22,000) was obtained from Tianjin Guangfu Fine ChemicalResearch Institute. Water was purified by a Mili-Q system.
2.2. Preparation and purification methods
All glass flasks and burettes were cleaned thoroughly with aquaregia before use.
Preparation of bulky Au(I)–MPA lamellar structures: HAuCl4 inaqueous solution (0.2 mL, 0.05 M) was added to 20 mL water inan Erlenmeyer flask and heated to boil on a hot plate, then MPA–Na aqueous solution (0.8 mL, 0.05 M) was injected, generatingwhite precipitates immediately. The mixture was allowed to boilfor another 5 min to complete the reaction. The product wasallowed to cool to ambient temperature and then purified by cen-trifugation to remove the residues before characterizations.
Preparation of Au(I)–MPA nanosheets and nanostrings: Firstbulky Au(I)–MPA lamellar structure was prepared as before. Thendifferent amounts of CA–Na (0.05 mol/L) were added to the aboveboiling solution. The mixtures were allowed to boil for another5 min to complete the reaction. The products were in colloidalsolutions. While MPA–Na to Au molar ratio was fixed at 4:1,blue-white solutions were obtained with CA–Na to Au molar ratiosranging from 2 to 15. The above solutions with CA–Na:Au molarratio ranging from 5 to 15 were purified by centrifugation toremove the residues. Then Au(I)–MPA nanosheets were obtained.When the molar ratio of CA–Na:Au increased to 20 and 100, color-less solutions were obtained. These solutions were then purified bydialysis against water (Union Carbide, MWCO 1 kDa) for two days.When the CA–Na:Au molar ratio is 20, Au(I)–MPA nanostringswere obtained. However, no regular structure was observed whenthe molar ratio of CA–Na:Au increased to 100.
Au nanoparticles prepared by electron beam irradiation:Au(I)–MPA nanosheets and nanostrings solutions were droppedonto carbon-coated copper grids. Then the sample loaded coppergrids were irradiated by the electron beam in the TEM machine.The accelerating voltage is 200 kV.
Au nanoparticles prepared by thermal reduction: First, theAu(I)–MPA nanosheets and nanostrings solutions were coated ontocarbon-coated copper grids. Then the sample loaded copper gridswere placed in vacuum oven and heated to 180 �C for 2 h undervacuum conditions.
Au nanoparticle assemblies prepared by pyrolysis: First, theAu(I)–MPA nanosheets (CA–Na:Au = 5:1) aqueous solution(0.006 mL, 0.00625 g/mL) was mixed with PEG (40 wt%, molecularweight 20,000) aqueous solution by stirring. The above mixture(0.16 mL) was then dropped on a 2.5 cm � 2.5 cm glass slide, andfollowed by solvent evaporation to obtain the film. The glass slideswere cleaned by Piranha solution before use. The resulting com-posite film was heated at the desired temperature (180 �C) usinga digital hot plate (C-MAG HS 10 IKAMAG� Hot Plate Stirrer) withdifferent intervals to study their UV–vis absorption and morphol-ogy evolution.
2.3. Characterization
UV–vis absorption spectra were measured using a ShimadzuUV–vis 2550 spectrophotometer (wavelength resolution: 0.1 nm)

Fig. 1. Dynamic diameters of the nanosized Au(I)–MPA structures with differentCA–Na to Au molar ratios (a); UV–vis absorption spectra of products prepared withdifferent CA–Na to Au molar ratios (b).
Fig. 2. SEM image of Au(I)–MPA bulky lamellar structures (a); TEM images of Au(I)–MPA
106 H. Nie et al. / Journal of Colloid and Interface Science 434 (2014) 104–112
with 1 cm light path cuvettes, utilizing Mili-Q water as reference.The scan step was set as 1 nm. X-ray photoelectron spectroscopy(XPS) measurements were carried out at 15 kV and 17 mA, usinga Thermo ESCALAB 250 spectrometer with a twin-anode Al Ka(1486.6 eV) X-ray source. Transmission electron microscopy(TEM) images were obtained using a JEOL-2010 electronmicroscope operating at 200 kV. Samples were deposited onto car-bon-coated copper grids for measurements. Scanning electronmicroscopy (SEM) images were obtained using a JEOL JSM 6700Felectron microscope operating at 200 kV. Samples were depositedonto silicon wafers for measurements. Atomic force microscopy(AFM) images were recorded in the tapping mode with a Nano-scope IIIa scanning probe microscope from Digital Instrumentsunder ambient conditions. X-ray diffraction (XRD) data were col-lected with a Rigaku D-Max 2550 diffractometer with Cu Ka radi-ation (k = 1.5418 Å). Tube voltage and current were 50 kV and200 mA, respectively; scan range (2h) was from 3.0� to 70.0�, scanstep was 0.02�. Dynamic light scattering (DLS) data were measuredby a Malvern Zetasizer Nano ZS instrument, which are equippedwith a 4 mW He–Ne 633 nm laser and a back-scattering detector(175�). The Dispersion Technology Software (DTS) (V5.30) wasused for data collection and analysis. Samples ([Au] = 0.005 M)were equilibrated (typically 2 min) to 25 �C before measurement.
3. Results and discussion
3.1. Morphological control of Au(I)–MPA CPPs
Typically, Au(I)–MPA bulky lamellar structures were preparedby adding MPA–Na to boiling HAuCl4 solution (MPA–Na:Au = 4:1)and the products were white precipitates. The obtained lamellarstructures are highly pH sensitive due to the COO� group inMPA ligand. By adding base to the system, the carboxylate groupsare deprotonated and the hydrogen bonding interaction convert
nanostructures with CA–Na to Au molar ratios of 5 (b), 15 (c) and 20 (d) respectively.

Fig. 3. XRD patterns of Au(I)–MPA assemblies with/without CA–Na.
H. Nie et al. / Journal of Colloid and Interface Science 434 (2014) 104–112 107
to the static repulsive interaction. In our previous work, it hasbeen proved that the static repulsion between the ligands isstrong enough to break the Au(I)–Au(I) bonds by increasing theAu–Au distance. And this change would finally affect the Au(I)–S coordination modes, which can be probed from UV–vis spectra[21]. CA–Na is found to be a good choice, which acts as not only a
Fig. 4. AFM images (a–c) and height analysis (d–f) of Au(I)–MPA nanosheets with
base, but also a surfactant to enhance the dispersibility of theproduct.
It is found that the precipitates disappeared and stable colloidsolution can be obtained when CA–Na:Au ratio reached 2. Bychanging molar ratio of CA–Na:Au from 2 to 20, the sizes of theassemblies can be continuously reduced from about 220 nm to40 nm as shown in DLS analysis (Fig. 1a). Then, well-resolvedUV–vis absorption spectra can be obtained for these colloid solu-tions. Based on the spectra-structure relationship we have learnedbefore, nanosized Au(I)–MPA lamellar structures with strong auro-philic interactions show typical sharp paired absorption peaks at�391 and �350 nm [21]. The first transition absorption at�391 nm corresponds to the ligand-to-metal charge transfer(LMCT), while the second transition band is assigned to metal-centered charge transfer (MCCT) modified with Au(I)–Au(I)aurophilic interaction [21–23]. Meanwhile, the LMCT and MCCTtransition energies of Au(I)–MPA structures in UV–vis spectra arevery sensitive to the coordination environments [24]. Increase ineither Au(I)–Au(I) bond strength or bond numbers would lead toa gradual red-shift of LMCT and MCCT transitions [21,23,25,26].As shown in Fig. 1b, when the ratio of CA–Na:Au was less than15, the obtained solutions had absorption peaks at �391 and�350 nm, which are the characteristic absorption of lamellar struc-tures. These two absorption peaks blue-shifted and diminished inintensity with the increasing amount of CA–Na, indicating the
CA–Na to Au ratio of 2 (a), 5 (b) and 15 (c) respectively (scale bar = 500 nm).

Fig. 5. XPS analyses for Au(I)–MPA nanostructures with different CA–Na to Aumolar ratios, (a) and (b) are Au 4f and S 2p binding energies.
Fig. 6. Photoemission spectra of Au(I)–MPA nanostructures with different CA–Na toAu molar ratios.
108 H. Nie et al. / Journal of Colloid and Interface Science 434 (2014) 104–112
increase of Au–Au distance and structural transformation. As theratio of CA–Na:Au was 100, no distinct absorption in UV–vis spec-trum was observed. Then we can conclude that no Au(I)–Au(I)interaction existed in that structure.
The exfoliation process of the bulky Au(I)–MPA precipitates asthe addition of CA–Na is confirmed by scanning electron micro-scope (SEM) and transmission electron microscopy (TEM) images.First, macroscopic precipitates were generated in the absence ofCA–Na (Fig. 2a). With the addition of CA–Na, nanosheets wereobserved in TEM images for the solutions with LMCT and MCCTabsorption at 391 and 350 nm respectively (Fig. 2b and c). Thenwith the increasing amount of CA–Na (CA–Na:Au = 20), a newstructure of nanostring appeared with the blue-shift of LMCT andMCCT absorption (Fig. 2d). The lengths of the strings were hun-dreds of nanometers. The very tiny nanoparticles appeared onthe edge or distributed in thinner sheets and string structures weregenerated from reduction of the Au(I)–thiolate by TEM electronbombard [19,21]. The diameters of the particles were centered at2.5–4 nm, indicating that the strings are very uniform in diameter.If the CA–Na:Au ratio increased to 100, the product was well solu-ble in water and no regular structure was observed in TEM image.Then the obtained structures with/without CA–Na were examinedby X-ray diffraction (XRD) (Fig. 3). Results prove that the bulky pre-cipitates and products with CA–Na:Au ratio smaller than 15 havelamellar structures similar to that in literatures [15]. There werethree distinct diffraction peaks between 3� and 20� with equalspacing as (010), (020) and (030) diffraction planes, correspond-ing to the stacking periodicity of the inorganic layers. When theratio reached to 20, the peaks almost disappeared, indicating thatthe string structures possess almost no characteristic of lamellarstructure.
Furthermore, the thicknesses of the nanosheets were investi-gated with atomic force microscopy (AFM). The nanosheets havelateral dimensions from tens to hundreds nanometers, which arein accordance with the results from TEM images. The thicknessesof the typical nanosheets evaluated from AFM were 5–13 nm,3–6 nm and 3 nm with CA–Na:Au ratios of 2, 5, 15 respectively(Fig. 4). Obviously, the thicknesses of the nanosheets decrease withthe increased amount of CA–Na. From our previous study, theheight of a single layer in Au(I)–MPA lamellar structures is about1.4–1.5 nm [21]. This indicates that the layer numbers of theobtained structures are about 4–9, 2–5 and 2 for the three nano-sheet samples. Thus the chemical exfoliation method can controlthe thicknesses of Au(I)–MPA nanosheets in solution easily. Here,the size, shape and thickness for the various Au(I)–MPA nanostruc-tures have been characterized thoroughly by DLS, TEM and AFMmeasurements. The DLS method can provide the hydrodynamicsize of nanostructures statistically. However, it can only give theequivalent spherical diameter of the measured samples no matterwhat practical shape the nanostructures may have. The TEMimages show not only the size changes, but two-dimensionalprojection of the nanostructures as well. AFM can give accurate,three-dimensional images of Au(I)–MPA nanostructures, however,the scanning speed is slow and scanning area is limited, then theoverall sample information can hardly be provided. Therefore,the combination of these three techniques can give the accurateand comprehensive description of these samples.
To further analyze the structural characteristic of Au(I)–MPAnanostructures, X-ray photoelectron spectroscopy (XPS) analysiswas carried out. Fig. 5a shows the high-resolution Au 4f XPS spec-tra for Au(I)–MPA nanostructures with different CA–Na:Au ratios.XPS analysis demonstrate that the electron binding energy (BE)of the Au 4f7/2 in Au(I)–MPA nanosheets (CA–Na:Au = 5) was84.5 eV. As the reported Au(I) 4f7/2 BE in Au(I) complexes withoutAu(I)–Au(I) interaction lies in 85.0–86.0 eV [27,28], it is deducedthat strong Au(I)–Au(I) interaction exists in Au(I)–MPA nanosheets.
With the increasing amount of CA–Na, the BE of Au(I) shifted to85.3 eV, meanwhile, a small shoulder at 84.5 eV was also observed,indicating the weakening of Au(I)–Au(I) interaction partially andthe peeling off of the lamellar structures. Meanwhile, the S 2p3/2
BE in the Au(I)–MPA nanosheets was 162.9 eV with CA–Na:Au ratioof 5. Then the S 2p3/2 BE of nanostructures prepared with higherratio of CA–Na:Au shifted positively as much as 1.1 eV with ashoulder at 162.9 eV, suggesting a lessening of the extent of nega-tive charge residing on the S atom (Fig. 5b). The XPS data thus pro-vide evidence for the weakening of Au(I)–Au(I) interaction and thesignificant change of gold-sulfur coordination mode from 3

Fig. 7. TEM images of Au nanoparticles obtained by electron beam irradiation from Au(I)–MPA nanostrings (a) and nanosheets (b); TEM images of Au nanoparticles obtainedby thermal reduction in Au(I)–MPA nanostrings (c) and nanosheets (d). Inset for (a): the SAED pattern of Au nanoparticles; inset for (c): HRTEM image of Au nanoparticle,scale bar = 5 nm.
Fig. 8. (a) UV–vis absorption spectra of Au(I)–MPA nanosheets/PEG composite filmon glass and (b) their corresponding photos (from left to right) after heating at180 �C for different time.
H. Nie et al. / Journal of Colloid and Interface Science 434 (2014) 104–112 109
coordination conical structure to 2 coordination linear structurewith higher ratio of CA–Na:Au [26]. As the photoemission ofAu(I) complexes from MCCT transition is a reflection for intensityof Au(I)–Au(I) interaction [29–32], photoemission properties ofthe obtained Au(I)–MPA nanostructures were investigated asshown in Fig. 6. With the increasing ratio of CA–Na:Au, the emis-sion peaks blue shifted gradually, which also confirm the weaken-ing of Au–Au bonds and structural transformation.
3.2. Preparation of Au nanoparticle assemblies
Au nanoparticles assemblies represent an area of growing inter-est and exhibit fascinating and useful electronic, optical and mag-netic properties originated from both the constituent material andthe long-range order [33–39]. Although many methods have beendeveloped to fabricate Au nanoparticle assemblies [40–45], devel-oping simple and effective routes is still very attractive. As weknow, Au(I) complexes are ideal precursors for preparation of Aunanoparticles [46–51]. However, as the bulky structures of tradi-tional Au(I) complexes, unavoidable coalescence between theresulted Au nanoparticles happens during reduction process. Ran-domly dispersed Au nanoparticles are obtained in most cases. Here,as illustrated in the previous section, Au(I)–MPA nanostrings andnanosheets can be fabricated with CA–Na to Au ratios of 20 and5 respectively. Meanwhile, Au nanoparticles with average diame-ters of 3.7 ± 1.5 nm and 5.0 ± 3.0 nm (calculated from 200 nanopar-ticles) can form in situ by electron beam irradiation with relativelylow concentration of Au(I)–MPA nanostrings and nanosheets oncopper grids respectively (Fig. 7a and b, Fig. S1a and S1b). The cor-responding selected area electron diffraction (SAED) pattern of theobtained nanoparticle shows an fcc packing arrangement (inset ofFig. 7a). More importantly, the distribution of the resulted Aunanoparticles is highly dependent on the morphology of theirAu(I) precursors. Then we can conclude that the fusion of theresulted Au nanoparticles can be prevented effectively by the sep-aration of the nanosized Au(I) precursors. The rigid and stable
framework of the Au(I)–MPA nanostructures also has confinementeffect on the movement of the resulted Au nanoparticles. Conse-quently, taking advantages of the good dispersibility and structuralrigidity of Au(I)–MPA nanostructures, they are deduced as idealprecursors for Au nanoparticle assemblies.
Compared with electron beam irradiation, thermal decomposi-tion is a more accessible and controllable way to transformAu(I)–MPA nanostructures into Au nanoparticles [46–48]. How-ever, randomly dispersed Au nanoparticles with diameters of

110 H. Nie et al. / Journal of Colloid and Interface Science 434 (2014) 104–112
11.6 ± 7.6 nm and 14.0 ± 8.2 nm (calculated from 200 nanoparti-cles) were obtained when the Au(I)–MPA nanostrings and nano-sheets were deposited directly on copper grids and pyrolyzed at180 �C, respectively (Fig. 7c and d, Fig. S1c and S1d). The character-istic lattice fringes (lattice spacing = 2.5 Å) of the fcc crystal struc-ture of Au are clearly shown in the high-resolution TEM images(inset of Fig. 7c). In addition, Au nanoparticles with irregularshapes were also observed, indicating coagulation between theparticles may occur with the decomposition of MPA during heattreatment. To achieve the fabrication of Au nanoparticle assem-blies, here, Au(I)–MPA nanostructures were incorporated intopolymer media (polyethylene glycol, PEG) [52]. Their thermal tran-sition process can be controlled by heating the resulted compositesat desired temperature for different time. In our experiment, Au(I)–MPA nanosheets (MPA:Au = 4:1, CA–Na:Au = 5:1) were firstlymixed with PEG solution, followed by drop casting and solventevaporation to obtain Au(I)–MPA nanosheets/PEG composite. Dueto the excellent water solubility of Au(I)–MPA nanosheets, uniformAu(I)–MPA nanosheets/PEG composites were obtained (Fig. 8b),which feature the characteristic absorption peak at 391 nm fromthe Au(I)–MPA nanosheets. This result implies that PEG does notaffect the structure and property of Au(I)–MPA nanosheets,because the aggregation or breakdown of Au(I)–MPA nanosheetswould cause the broadening or shifting of UV–vis absorption.Moreover, TEM images revealed that Au(I)–MPA nanosheets inPEG matrix have no obvious morphology change compared withthat in aqueous solution (Fig. 9a). Therefore, UV–vis spectra andTEM are used to monitor the thermal transformation process ofthe Au(I)–MPA nanosheets/PEG composites. Fig. 8 shows thechanges of UV–vis spectra and color of the Au(I)–MPA nano-sheets/PEG composite during heat treatment at 180 �C for differenttime intervals on glass.
As shown in Fig. 7c and d, the generation of Au nanoparticlescan occur when the Au(I) precursors are pyrolyzed at 180 �C. Forthe Au(I)–MPA nanosheets/PEG composite, in the first stage, thepyrolyzation showed a quick appearance of reddish violet colorat about 40 s (Fig. 8b). Continuous heating the composite filmsled to a deepened reddish violet color within 1 min 20 s, however,
Fig. 9. TEM images of Au(I)–MPA nanosheets/PEG composite after heating at 180 �C fo
earthy red was developed gradually (1 min 20 s to 2 min 40 s).Consistent with the color change of the composite with time, theevolution of UV–vis absorption spectra of the composites showssimilar change trend (Fig. 8a). Firstly, a peak corresponding tothe surface plasmon resonance absorption of gold nanoparticlesappeared around 530 nm while the absorption at 391 nmdecreased upon heating (40 s). Then, rapid increase in absorptionintensity at around 530 nm was observed (40 s to 1 min 20 s). Withfurther heating (1 min 20 s to 2 min 40 s), the absorption spectra ofthe composite lost its absorbance in 500–580 nm slightly, mean-while, a slightly increased absorption in the 580–700 nm rangewas observed. In our experiment, it is easy to understand thatthe deepened reddish violet color and increased absorption inten-sity with reaction time are caused by the increased number of gen-erated Au nanoparticles (40 s to 1 min 20 s). The subsequent colorchange (from reddish violet to earthy red) and broadening of thespectra with reaction time may originate from the aggregation ofthe resulted Au nanoparticles. TEM measurement is exploited tofurther unveil the evolution process of Au(I)–MPA nanosheets/PEG composite at this stage (Fig. 9b). It is revealed that (i) within2 min 40 s, relatively smaller nanosheets converted to randomlydispersed Au nanoparticles quickly, while the larger nanosheetshardly changed; (ii) the obtained Au nanoparticles (2 min 40 s)have average diameter of 37.4 ± 18 nm (calculated from 200 nano-particles) with wide size distribution (Fig. S2a); (iii) aggregationbetween the randomly dispersed Au nanoparticles during heatingwas observed from the TEM images of the products obtained at1 min 20 s (Fig. S3) and 2 min 40 s, respectively. In short, the gen-eration and aggregation of Au nanoparticles contribute to the colorand spectra change of the Au(I)–MPA nanosheets/PEG compositesin this stage.
However, in the second stage, the rate of further color and spec-tra change with reaction time is very slow. Until 5 min 40 s, thecolor of the composite changed toward wine red gradually. Mean-while, a gradual blue-shift of the absorption peaks for Au nanopar-ticles, accompanied with little decrease in intensity at 391 nm wasobserved with the increase of reaction time (2 min 40 s to 11 min40 s). Consistent with the color and spectral evolution, in this
r 0 min (a), 2 min 40 s (b), 5 min 40 s (c), and 21 min 30 s (d); scale bar = 100 nm.

H. Nie et al. / Journal of Colloid and Interface Science 434 (2014) 104–112 111
stage, the fully assembled Au(I)–MPA nanosheets with relativelylarge sizes transformed into Au nanoparticles from their edgeslowly from TEM image. The average diameter of the resulted Aunanoparticles is 15.0 ± 9.6 nm (Fig. 9c, Fig. S2b). Here, it is sup-posed that the confinement effect originating from the structuralrigidity of the fully assembled Au(I)–MPA nanosheets contributesto the generation of Au nanoparticles with smaller size (comparedwith Au nanoparticles observed in the first stage) and slow trans-formation rate.
In the third stage, further heating led to increasing intensity andslightly red-shift of absorption peak for Au nanoparticles, mean-while, the intensity of absorption peak at 391 nm decreasedgreatly, indicating the partially destruction of the lamellar struc-tures. The spectroscopic changes can also be visualized directly.As shown in Fig. 8b, the color of composite deepened and changeda little more toward purple with further heating (11 min 40 s to21 min 30 s). In Fig. 9d, one striking structural feature, Au nanopar-ticle assemblies, were observed. The obtained Au nanoparticleassemblies have the following characteristics: (i) Au nanoparticleswere generated throughout the Au(I)–MPA nanosheets and inter-connected by the unreacted frames; (ii) The Au nanoparticles onthe edges (average diameters: 17.2 ± 8.7 nm) of the nanosheetsare larger than the ones in the middle (average diameters:7.8 ± 6.0 nm) (Fig. S2c). Here, the higher flexibility and strongerpropensity for fusion between Au nanoparticles at the edge ofnanoassemblies than that in the inner surface are responsible forthe larger size. Further heating would fully destroy the structuresof the assembled nanosheets and result in randomly dispersedAu nanoparticles [16].
Thanks to the different sizes of randomly dispersed Au nanopar-ticles and Au nanoparticle assemblies, they can be easily separatedby centrifugation. The success for fabrication of Au nanoparticleassemblies takes advantages of the structural rigidity and stabilityof Au(I)–MPA nanosheets and the difference in reaction activitybetween the edges and the interior. To further confirm the influ-ence of structural rigidity on the morphology of the products,nanostrings, which have higher structural flexibility thannanosheets, were used as another precursor for Au nanoparticleby thermal decomposition in PEG matrix. As expected, only ran-domly dispersed Au nanoparticles were obtained due to the 1Dconnection mode of Au(I)–MPA nanostrings and their high reactionactivity (Fig. S4).
These novel and highly water-soluble Au nanoparticleassemblies show the superiority of nanosized CPPs toward bulkyassemblies and their potential as new functional materials.Compared with randomly dispersed Au nanoparticles, the obtainedAu nanoparticle assemblies have the following advantages: (i) TheAu nanoparticles in the assemblies possess higher stability againstaggregation than randomly dispersed Au nanoparticles; (ii) Thenovel nanoassemblies feature both Au(0) and Au(I) species. There-fore, it can supply biactive sites for organic catalysis in a coopera-tive manner [53]; (iii) The near-field plasmonic coupling and localfield enhancement properties in the assemblies may be appliedpotentially for surface-enhanced Raman scattering.
4. Conclusion
In conclusion, chemical exfoliation method was applied todownsize bulky Au(I)–MPA lamellar assemblies to nanostructures.By adjusting the amount of exfoliator, nanosheets with tunablethicknesses and nanostrings were achieved. The chemical exfolia-tion process is dominated by manipulating the multipleinteractions in system, such as hydrogen bonding interaction,Au(I)–Au(I) interaction and Au–S coordinate interaction. Theirstructural transformation process was illustrated in molecular
level based on UV–vis spectral fingerprint–structure relationship.Further, the Au(I)–MPA nanosheets are ideal precursors to preparenovel Au nanoparticle assemblies, which feature Au(0) nanoparti-cles linked by Au(I) species. This work provides new idea and inspi-ration on preparation, characterization and application of CPPs. It isbelieved that this strategy of chemical exfoliation is applicable toother anisotropic CP systems for CPPs preparation.
Acknowledgment
We thank the National Natural Science Foundation of China(51001020, 21072025) for financial support.
Appendix A. Supplementary material
Supplementary data associated with this article can be found, inthe online version, at http://dx.doi.org/10.1016/j.jcis.2014.08.003.
References
[1] S. Kitagawa, R. Kitaura, S. Noro, Angew. Chem. Int. Ed. 43 (2004) 2334–2375.[2] G. Férey, Chem. Soc. Rev. 37 (2008) 191–214.[3] A.M. Spokoyny, D. Kim, A. Sumrein, C.A. Mirkin, Chem. Soc. Rev. 38 (2009)
1218–1227.[4] S. Jung, M. Oh, Angew. Chem. Int. Ed. 47 (2008) 2049–2051.[5] W. Lu, S.S.Y. Chui, K.M. Ng, C.M. Che, Angew. Chem. Int. Ed. 47 (2008) 4568–
4572.[6] W. Lin, W.J. Rieter, K.M. Taylor, Angew. Chem. Int. Ed. 48 (2009) 650–658.[7] J. Yang, S. Ding, M. Radosz, Y. Shen, Macromolecules 37 (2004) 1728–1734.[8] K.H. Park, K. Jang, S.U. Son, D.A. Sweigart, J. Am. Chem. Soc. 128 (2006) 8740–
8741.[9] W.J. Rieter, K.M. Taylor, H. An, W. Lin, J. Am. Chem. Soc. 128 (2006) 9024–9025.
[10] W.J. Rieter, K.M. Pott, K.M.L. Taylor, W. Lin, J. Am. Chem. Soc. 130 (2008)11584–11585.
[11] M. Hu, S. Ishihara, Y. Yamauchi, Angew. Chem. 125 (2013) 1273–1277.[12] M. Oh, C.A. Mirkin, Nature 438 (2005) 651–654.[13] J.N. Coleman et al., Science 331 (2011) 568–571.[14] L. Zhang, J.J. Liang, Y. Huang, Y.F. Ma, Y. Wang, Y.S. Chen, Carbon 47 (2009)
3365–3380.[15] S.H. Cha, J.U. Kim, K.H. Kim, J.C. Lee, Chem. Mater. 19 (2007) 6297–6303.[16] S.H. Cha, K.H. Kim, J.U. Kim, W.K. Lee, J.C. Lee, J. Phys. Chem. C 112 (2008)
13862–13868.[17] A. Parikh, S. Gillmor, J. Beers, K. Beardmore, R. Cutts, B. Swanson, J. Phys. Chem.
B 103 (1999) 2850–2861.[18] J.S. Shen, D.H. Li, M.B. Zhang, J. Zhou, H. Zhang, Y.B. Jiang, Langmuir 27 (2010)
481–486.[19] J.U. Kim, S.H. Cha, K. Shin, J.Y. Jho, J.C. Lee, J. Am. Chem. Soc. 127 (2005) 9962–
9963.[20] H.G. Fijolek, J.R. Grohal, J.L. Sample, M.J. Natan, Inorg. Chem. 36 (1997) 622–
628.[21] H. Nie, M. Li, Y. Hao, X. Wang, S.X.A. Zhang, Chem. Sci. 4 (2013) 1852–1857.[22] R. Narayanaswamy, M.A. Young, E. Parkhurst, M. Ouellette, M.E. Kerr, D.M. Ho,
R.C. Elder, A.E. Bruce, M.R.M. Bruce, Inorg. Chem. 32 (1993) 2506–2517.[23] J.M. Forward, D. Bohmann, J.P. Fackler Jr, R.J. Staples, Inorg. Chem. 34 (1995)
6330–6336.[24] V.W.W. Yam, C.L. Chan, C.K. Li, K.M.C. Wong, Coord. Chem. Rev. 216 (2001)
173–194.[25] M. Zhu, C.M. Aikens, F.J. Hollander, G.C. Schatz, R. Jin, J. Am. Chem. Soc. 130
(2008) 5883–5885.[26] R.L. White-Morris, M.M. Olmstead, A.L. Balch, J. Am. Chem. Soc. 125 (2003)
1033–1040.[27] Y. Negishi, K. Nobusada, T. Tsukuda, J. Am. Chem. Soc. 127 (2005) 5261–5270.[28] C. Zhou, C. Sun, M. Yu, Y. Qin, J. Wang, M. Kim, J. Zheng, J. Phys. Chem. C 114
(2010) 7727–7732.[29] V.W.W. Yam, Angew. Chem. Int. Ed. 38 (1999) 197–199.[30] M.A. Mansour, W.B. Connick, R.J. Lachicotte, H.J. Gysling, R. Eisenberg, J. Am.
Chem. Soc. 120 (1998) 1329–1330.[31] R.E. Bachman, S.A. Bodolosky-Bettis, S.C. Glennon, S.A. Sirchio, J. Am. Chem.
Soc. 122 (2000) 7146–7159.[32] V.W.W. Yam, E.C.C. Cheng, Z.Y. Zhou, Angew. Chem. 112 (2000) 1749–1751.[33] S.W. Boettcher, N.C. Strandwitz, M. Schierhorn, N. Lock, M.C. Lonergan, G.D.
Stucky, Nat. Mater. 6 (2007) 592–596.[34] S. Eustis, M.A. El-Sayed, Chem. Soc. Rev. 35 (2006) 209–217.[35] P.N. Prasad, Nanophotonics, Wiley, Hoboken, NJ, 2004.[36] X. Zeng, F. Liu, A.G. Fowler, G. Ungar, L. Cseh, G.H. Mehl, J.E. Macdonald, Adv.
Mater. 21 (2009) 1746–1750.[37] T. Teranishi, A. Sugawara, T. Shimizu, M. Miyake, J. Am. Chem. Soc. 124 (2002)
4210–4211.[38] Y.j. Kang, K.J. Erickson, T.A. Taton, J. Am. Chem. Soc. 127 (2005) 13800–13801.

112 H. Nie et al. / Journal of Colloid and Interface Science 434 (2014) 104–112
[39] S.M. Adams, S. Campione, J.D. Caldwell, F.J. Bezares, J.C. Culbertson, F. Capolino,R. Ragan, Small 8 (2012) 2239–2249.
[40] S.W. Chen, Langmuir 17 (2001) 2878–2884.[41] F. Kim, S. Kwan, J. Akana, P. Yang, J. Am. Chem. Soc. 123 (2001) 4360–4361.[42] F.A. Aldaye, H.F. Sleiman, J. Am. Chem. Soc. 129 (2007) 4130–4131.[43] K.B. Andrew, I. Faysal, E.D. Jason, T.A. Thomas, P.R. Thomas, M.R. Vincent,
Nature 404 (2000) 746–748.[44] H.X. He, H. Zhang, Q.G. Li, T. Zhu, S. Li, Z.F. Liu, Langmuir 16 (2000) 3846–3851.[45] M. Brust, D. Bethell, C.J. Kiely, D.J. Schiffrin, Langmuir 14 (1998) 5425–5429.[46] S.J. Lee, S.W. Han, K. Kim, Chem. Commun. (2002) 442–443.
[47] K. Abe, T. Hanada, Y. Yoshida, N. Tanigaki, H. Takiguchi, H. Nagasawa, M.Nakamoto, T. Yamaguchi, K. Yase, Thin Solid Films 327–329 (1998) 524–527.
[48] S. Gomez, K. Philippot, Chem. Commun. (2000) 1945–1946.[49] M.K. Corbierre, R.B. Lennox, Chem. Mater. 17 (2005) 5691–5696.[50] M.K. Corbierre, J. Beerens, R.B. Lennox, Chem. Mater. 17 (2005) 5774–5779.[51] R.P. Briñas, M. Hu, L. Qian, E.S. Lymar, J.F. Hainfeld, J. Am. Chem. Soc. 130
(2008) 975–982.[52] H. Zhang, Y. Tang, J.H. Zhang, M.J. Li, X. Yao, X. Li, B. Yang, Soft Matter 5 (2009)
4113–4117.[53] J. Guzman, B.C. Gates, J. Am. Chem. Soc. 126 (2004) 2672–2673.


