
Food Policy 1994 19 (5) 443-457
Assessing the impact of the sugar programme on the US economy
Noel I) Uri Commodity Economics Division, Economic Research Service, US Department of Agriculture, Washington, DC, USA
Roy Boyd Department of Economics, Ohio University, Athens, OH, USA
This study examines the effect of the sugar tariff-rate import quota program on the United States economy. Based on a computable general equilibrium model, the analysis suggests that a complete elimjnation of the sugar program would reduce output for all producing sectors by about $2.85 billion. For producing sectors besides the agriculture programme crops, crude oil and petroleum refining sectors, output would increase by about $2.98 billion. Additionally, there would be an increase of about $197 million and $121 million in the consumption of goods and services and in welfare respectively. The government sector would realize a reduction in revenue of about $15 million.
Keywords: agricultural policy, compatible general equilibrium modefling, sugar
Introduction
Since 1789 the United States has had some sort of sugar programme (Schmitz, Allen and Leu, 1984). It was originally intended to raise revenue, but later evolved into a strategy mainly to protect domestic sugar cane and sugar beet producers from foreign competition. In recent times, the programme has taken the form of a support price with domestic market quota allocations administered by the US Department of Agriculture (USDA). In addition, country-by-country quotas are imposed which result in the domestic price of sugar being above support levels thereby avoiding any direct cost to the United States government.’
The current US sugar programme has had a number of effects. One is that it has created a complicated picture of the caloric sweetener market in the United States. Besides sucrose (ie sugar), the caloric sweetener market consists of glucose, dextrose and high fructose corn syrup (HFCS). The dominant caloric substitute for
‘A small tariff exists for countries outside the Caribbean. These are listed in the Harmonized Trade Schedule of the United States, Chapter 17.
The views expressed are those of the authors and do not necessarily represent the policies of the organizations with which the authors are affiliated,
03~~-9192/94/050443-15 0 1994 ~utterworth-Heinemann Ltd 443
Impact of the sugar programme on the US economy: N D Uri and R Boyd
80 ,
70 1
r m m 2 60 -
3
E 7 50 -
,
z 40 -
k a
Y 30-
,' u
s 20 - .-
&
10 -
01 I I I I I I I
1960 1965 1970 1975 1980 1985 1990
Year
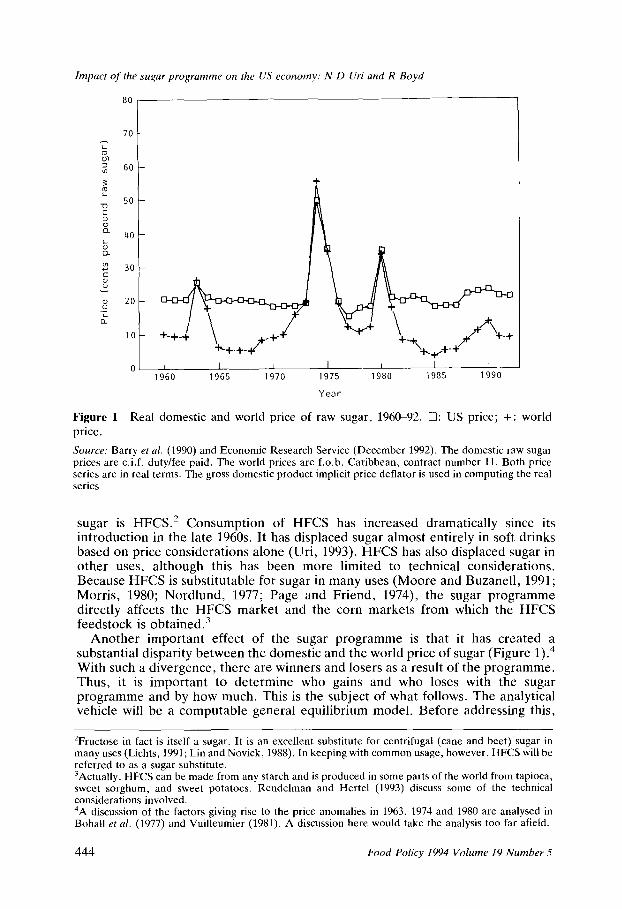
Figure 1 Real domestic and world price of raw sugar, 196C92. 0: US price; +: price.
world
Source: Barry et al. (1990) and Economic Research Service (December 1992). The domestic raw sugar prices are c.i.f. duty/fee paid. The world prices are f.o.b. Caribbean, contract number 11. Both price series are in real terms. The gross domestic product implicit price deflator is used in computing the real series
sugar is HFCS.* Consumption of HFCS has increased dramatically since its introduction in the late 1960s. It has displaced sugar almost entirely in soft drinks based on price considerations alone (Uri, 1993). HFCS has also displaced sugar in other uses, although this has been more limited to technical considerations. Because HFCS is substitutable for sugar in many uses (Moore and Buzanell, 1991; Morris, 1980; Nordlund, 1977; Page and Friend, 1974), the sugar programme directly affects the HFCS market and the corn markets from which the HFCS feedstock is obtained.”
Another important effect of the sugar programme is that it has created a substantial disparity between the domestic and the world price of sugar (Figure l).” With such a divergence, there are winners and losers as a result of the programme. Thus, it is important to determine who gains and who loses with the sugar programme and by how much. This is the subject of what follows. The analytical vehicle will be a computable genera1 equilibrium model. Before addressing this,
‘Fructose in fact is itself a sugar. It is an excellent substitute for centrifugal (cane and beet) sugar in many uses (Lichts, 1991; Lin and Novick, 1988). In keeping with common usage, however, HFCS will be referred to as a sugar substitute. 3Actually, HFCS can be made from any starch and is produced in some parts of the world from tapioca, sweet sorghum, and sweet potatoes. Rendelman and Hertel (1993) discuss some of the technical considerations involved. 4A discussion of the factors giving rise to the price anomalies in 1963, 1974 and 1980 are analysed in Bohall et al. (1977) and Vuilleumier (1981). A discussion here would take the analysis too far afield.
444 Food Policy 1994 Volume 19 Number 5

Impact of the sugar programme on the US economy: N D Uri and R Boyd
however, it is useful to understand the nuances of the sugar programme. Subse- quent to this and prior to quantifying the gains and losses associated with the US sugar programme, an overview of the modelling approach will be provided.
The sugar programme
The outline of current sugar programme as configured in the Food, Agriculture, Conservation, and Trade Act of 1990 (P.L. 101~624), was set in place in the Food and Agriculture Act of 1981 (P.L. 97-98). Designed to operate at no net cost to the federal government, the sugar programme provides three tools to support domestic sugar prices which are administered by the USDA: {I) a nonrecourse loan, (2) tariff-rate import quota, and (3) standby domestic marketing allotments.
The loan programme guarantees sugar producers a minimum support price for their sugar. The loan programme, however, must operate without cost to the federal government. Raw cane and refined beet sugar are used as the collateral for loans obtained. The processors use the loan to pay growers for their cane and beets upon delivery to the processing facility. Growers typically receive at least 60 per cent of the loan at delivery. Final payment is made to the grower based on the price at which sugar was sold. When the sugar is sold, the processor repays the loan.
The loan programme effectively sets the guaranteed price because producers can forfeit, without penalty, their sugar which serves as the collateral for full payment of the loan. Processors may choose to forfeit their sugar rather than repay the loan, if the market price for sugar is not sufficient to recover the additional costs involved in selling the sugar. The programme’s provisions of no net cost to the federal government has brought about the use of an import quota to keep sugar price sufficiently high to prevent forfeitures.
Currently, a tariff-rate import quota is used to restrict the supply of foreign raw cane sugar, and hence, to support the domestic price of sugar. A tariff-rate import quota permits only a limited quantity of sugar to be imported at a low tariff level. Any imports above this level are assessed a relatively high second-tier tariff. Under this system, foreign producers may exceed their quota but any sugar exported to the United States in excess of their quota is assessed a $0.16 per pound tariff. This tariff is high enough to effectively preclude additional sugar exports to the United States.
The USDA annually estimates the domestic production, quantity demand and the supply needed to keep domestic prices at a level that prevents producers from forfeiting sugar, In consultation with the Sugar Working Group, the USDA then determines the quantity of sugar to import. The Sugar Working Group is composed of representatives of various government agencies with an interest in the sugar programme. The Food, Agriculture, Conservation and Trade Act of 1990 requires that the quota be at least 1.25 million short tons to ensure that sugar cane refiners continue to have access to foreign raw sugar. The quota also enables the federal governmentto meet foreign policy objectives. The US Trade Representative allocates the quota to individual countries that export sugar to the United States.
If the import quota is met and the price of sugar falls below the forfeiture level, domestic marketing allotments will be used to support prices. These allotments Iimit the quantity of domestically produced sugar and crystallized HFCS that each manufacturer can sell. To administer marketing allotments, marketing rights based
%omplete descriptions of the sugar tariff-rate import quota program are presented in Barry er al. (1991) and Lord and Barry (1991). This section draws upon these sources.
Food PO&y 1994 Volume I9 ~urn~~r 5 445

Impact of the sugar programme on the US ec~~~rn~: N D Uri and R Boyd
Table 1. Classitication of producing sectors and consumer goods and services
Industries Consumer goods
1. 2. 3. 4. 5. 6. 7. 8. 9.
10. Il. 12‘ 13. 14.
Manufacturing Coal mining Other mining Service Chemicals and plastics Food and tobacco products Petroleum refining Financial Forestry Wood products Crude oil and natma gas Agriculture 1 - Program crops Agriculture 2 - Livestock Agriculture 3 -All other agriculture
1. 2. 3 _ 4. 5.
3: 8. 9.
10. 11. 12. 13. 14
Food Alcohol and tobacco Utilities Furnishings and appliances Housing Clothing and jewellery Transportation Financial services Other services Motor vehicles Gasoline and other fuels Reading and recreation Nondurable household items Savings
on historical production, ability to market sugar, and production capacity of sugar cane millers and sugar beet processors are used. On June 30 1993, for the first time, the USDA announced market allotments for sugar and crystalline fructose for fiscal year 1993 (Economic Research Service, 1993).
The modelling approach
The sugar sector is closely interrelated with other sectors of the economy because sugar is not only an input into many production processes but also consumed directly by consumers (Uri, 1993). In 1991, approximately 55 per cent of the US sugar supply used in the manufacture of ice cream and dairy products, canned, bottled and frozen foods and bakery, cereal and allied products. Additionally, sugar used in the production of beverages including soft drinks and noncarbonated beverages accounted for another 2.5 per cent. Finally, about 40 per cent of the sugar is sold to consumers through retail and wholesale grocery outlets.
A comprehensive analysis of the sugar programme is employed to account for the linkages between economic sectors and the responsiveness of producers and consumers both to absolute and relative changes in the prices of the various goods and services (including sugar). In this study, the incidence of the sugar programme is endogenous to the analysis with no prior assumptions being made. The analytical approach used is a computable general equilibrium model that has been disaggre- gated into producing sectors, 14 consuming sectors, six household categories (Table 1) and one government sector. This level of disaggregation allows for an assessment of the direct effects as well as the indirect effects of the sugar programme. By measuring these effects, we identify the extent to which the agricultural sector (e.g. sugar producers) and the other producing and consuming sectors and household groups gain or lose. Hence, equity considerations as well as efficiency considera- tions can be addressed.
The ~~n~~~~ e~u~l~b~i~rn model The use of a general equilibrium model to assess the effect of the sugar programme on the economy is not unique to this study. An earlier application was provided by Rendelman (1989). In his analysis, Rendelman uses a static model and considers consumers only in the aggregate. Consequently, the distributional {equity) effects

Impact of the sugar ~~*~~~rnrn~ on the US economy: N D Uri and R Boyd
of the sugar programme cannot be evaluated. Another shortcoming of Rendel- man’s model is that no government sector is included in the analysis. The model presented below attempts to address these shortcomings.
This study follows Shoven and Whalley’s (1972) tax analysis research, and incorporates some methodological enhancements of the general equilibrium model developed by Hudson and Jorgenson (1974). Specifically, the study recognizes the differences in consumer preferences as a function of their incomes and specifies a distinct demand system for each group of households. In addition, a neoclassical microeconomic model of producer behaviour that contains a price-responsive input-output component is employed. The consumer behaviour model is integrated with the model of producer behaviour to provide a comprehensive framework for policy simulations.
The producirzg sectors. The production sector of the model consists of an input-output matrix with flexibility for substituting factor inputs (capital, labour and land). Technologies are represented by production functions that exhibit constant elasticities of substitution (CES). Absence of technological progress, both embodied and disembodied (see, for example, Uri, 1984) is assumed over the period of investigation. Furthermore, for each production sector the value added by the specific sector is assumed as a function of labour and capital.’
For the three agricultural and forestry sectors, a third factor of production - land - is included, because it is an especially important input to these sectors. Note that sugar production is included in the Program Crops sector Agriculture 1). The incorporation of land into the production function is accomplished by nesting the CES production function. In particular, an input is defined solely as a function (in CES form) of land and capital which, in turn, takes the place of capital in the original production function specification.’
The consuming sectors. On the demand side, the model captures the behaviour of consumers, the government and foreigners. Consumers are grouped according to income (Table 1) and a demand system is specified for each group. Each income group has an endowment of labour and capital. Given the vector of prices, consumers decide the amount of each good and service to consume (purchase) and the amount to save and invest. Thus, the consumers also serve as investors in the model and their investments are determined by the amount of their savings.
The output of the 14 producing sectors accrues to the owners of the factors of production which they sell. With the receipts from sales, these individuals either consume domestic or foreign goods and services, save or pay taxes to the government. The savings are used for investment and the taxes are ultimately returned to these individuals in the forms of government assistance and services provided.
The demand for final goods and services comes from three primary sources:
“There is a transformation matrix whereby raw inputs in the producing sectors arc transformed into consumption goods and services. Thus, the fact that agricultural goods are combined with, say, manufacturing goods, food processing, and transportation to produce food for consumption is accounted for. ‘While it would be possible to simply add land as an explicit input in the production function, this would implicitly assume that the elasticity of substitution between all pairs of inputs are the same. By nesting, however, the substitution elasticities are permitted to be different between different inputs. The substitution elasticities used here are derived from Hertel and Tsigas’ (1987) analysis, which discusses how sLIbstitutable land is in various uses.
Food Policy I994 Volume 19 Number 5 447

Impact of the sugar programme on the US economy: N D Uri and R Boyd
(1) final goods and services which are directly consumed by individuals, (2) investment (which is equal to savings), and (3) foreign demand. Note that the composition of the consumer goods and services sector in Table 1 does not match that of the producing sectors, This is because the final goods and services produced by the producing sectors must go through various channels (i.e. transportation and distribution) before they are consumed. To address this problem, a transformation matrix is introduced that defines the contribution of each producing sector to the composition of each of the final (consumer) goods and services.
For each category of households (Table l), utility is assumed to be a weighted CES function of the 14 consumer goods and services. The weights on these goods and services, which are household category specific, are computed as the share of total purchases going to a specific consumer good or service. The nature of the CES utility function implies that the elasticity of substitution is the same between any pair of goods and/or services. Due to lack of reliable estimates, the respective substitution elasticities across pairs of goods and/or services are assumed to equal one for all of the combinations. Finally, consumers obtain utility from the consumption of all goods and services including leisure (consumer good and service sector number 12). Hence, it is necessary to determine a weight for this factor in the utility function. For the purpose of this analysis, the value of leisure is assumed to be 0.5 times labour income. The net effect of adding leisure is to account explicitly for the fact that consumers not only derive utility from the act of consuming goods and services, which comes from owning the factors of production, but also from leisure. Thus, an increase in leisure can lead to an enhancement of individual well-being in the model.
A household’s budget constraint is defined such that expenditures on goods and services must be less than or equal to its income. Household income is defined as the sum of returns to its endowment of factors of production including labour, capital, and land. That is, household expenditures must be less than or equal to the total factor payments received. Maximizing utility subject to this expenditure constraint yields the demand functions for the various goods and services by household categories (Mixon and Uri, 1985). Since savings are considered as one of the items in an individual’s utility function, the choice between consumption and savings (i.e. intertemporal tradeoffs) is made explicit as an integral part of the model.
The second component of the demand for goods and sevices is investment. Total investment is disaggregated (though a transformation matrix) by the sector of the economy that produces it. For the purposes of constructing and calibrating the genera1 equilibrium model, investment is taken directly from the national income and product accounts as compiled by the Bureau of Economic Analysis (BEA) of the US Department of Commerce and reported in the Survey of Currerrt busyness, given the assumption that savings and investment are exactly equal, personal savings are scaled to equal the gross investment observed for each of the 14 producing sectors.
The last component of demand for goods and services is the demand by foreign consumers. The foreign sector produces imports and consumes exports. In other words, foreigners are regarded as consumers who purchase United States exports with income produced from the sale of imports to the United States. The model assumes a balanced trade in an open economy {i.e. the nominal values of exports and imports are assumed equal in equilibrium). The exchange rate, however, is not explicitly incorporated into the model specification.
In the model, exports are delineated by producing sectors with a transformation
448 Food Policy fYY4 Volume I9 Number 5

matrix analogous to that used for the consumption of final goods and services. A similar delineation is utilized for imports. The exports and imports are then scaled so that the total foreign account is balanced. Finally, the import and export demand relationships for each producing sector are constructed by employing the demand and supply elasticities estimated by Boyd (1988).
The government sector. The government levies taxes on factors of production, output, income and consumption. Revenues are distributed back to consumers as income for purchasing goods and services, capital and Iabour. The government is treated as a separate sector with a CES production function in the general equilibrium model. The elasticity of substitution is assumed to be one. This means that the CES production function collapses to a Cob~Douglas type production function.
Taxes are collected in various form. The model includes explicitly personal income tax, labour taxes (e.g. a social security tax), capital taxes (e.g. a corporate income tax), property taxes, and sales and excise taxes. All these are treated as ad valor-em taxes and a marginal rate is used for each household category, consumer good and service sector, producing sector and factor input. In this respect, the model is a distinct improvement over earlier general equilibrium models (e.g. Shoven and Whalley, 1972), which simply employed lump sum transfer schemes or used average tax rates.
A mathernatica~ statement of the model For a general equilibrium to exist given the foregoing considerations, it is usefut to state precisely the conditions for which the model must satisfy. First, there cannot be positive excess quantities demanded. That is,
5 aij Mj - Ei(p, Y) 2 0 p; 10 j=l
where i (i = 1,2,. . .,n) denotes the consumer goods and services; yi (j = 1,2, . . .m) denotes the activity levels; aij denotes the ijth element in the activtty analysis matrix; Y denotes a vector of incomes for the k consumers; p denotes a vector of prices for the n consumer goods and services; and Ei denotes the excess demand for good or service i.
The second requirement for general equilibrium is that the economic profits associated with a given activity are non-positive (i.e. there are no monopoIy rents). That is,
(2)
Finally, all prices and activity levels must be non-negative. That is,
pi 10
M,?O
(34
(3b)
The model is .solved for a general equilibrium using the iterative algorithm nominally referred to as the Sequence of Linear complementary Problems (SLCP)
Food Policy I994 Volume 19 Number 5 449

Impact of the sugar programme on the US economy: N D Uri and R Boyd
developed by Mathiesen (1985a, b).’ This algorithm is based on the fixed point theorem proved by Scarf.
The data
To analyse the potential impacts of a complete elimination of the sugar programme on the US economy, the general equilibrium model discussed above was estimated using the 1988 data. For each of the 14 producing sectors, data on capital receipts and taxes were computed from reports of the BEA, the USDA, the US Depart- ment of Energy, and from Hertel and Tsigas (1987). The various elasticities of substitution employed in the analysis were obtained from Boyd (1988).
Capital earnings and labour income were obtained from the BEA. Land income was estimated using factor shares obtained from the Economic Research Services (ERS) of the USDA and applied to the capital earnings component noted above. Expenditure data for each of the 14 goods and services by household categories were obtained from the Consumer Expenditure Survey: Interview Survey, 1984 (Bureau of Labor Statistics, 1986). By combining this information with the number of households in each income category obtained from the BEA, the aggregate expenditures on each category of consumer goods and services by household category were computed. The various tax rates used in the analysis were obtained from a variety of sources including the Internal Revenue Service, the ERS, Hertel and Tsigas (1987), and Ballard et al (1985). These rates, as noted previously, are marginal rates. The value of exports and imports in 1988 were taken from various issues of the Survey of Current Business with the exception of the energy agriculture data. The energy and agriculture data were obtained from the Energy Information Administration of the US Department of Energy and the ERS, respectively.
The price responsiveness of the demand for sugar is an important consideration. For the purpose of this study, this price responsiveness, measured as an own price elasticity, is assumed equal to -0.50 (Uri, 1993). This means that for each one per cent reduction in the price of sugar, the quantity demanded will increase by 0.50 per cent. The assumption of the own price elasticity has important implication to the results of the analysis. Because the own price elasticity of -0.50 is somewhat larger than that used in other studies, a sensitivity analysis is performed in which the elasticity measured is allowed to vary around the point estimate.
Results and discussion
Effects of removing sugar tariff-rate import quota The general equilibrium model was first estimated to provide the baseline estimates with the sugar programme in effect. The model was then re-estimated assuming that the sugar tariff-rate import quota was completely eliminated. Thus, by comparing these results with the reference case, the effects of program elimination can be easily ascertained and analysed. Note that additional assumptions were made in the estimation of the no sugar programme general equilibrium model. Specifically, a positive sugar import elasticity and a positive change in world sugar price were assumed. It is expected that the United States demand for sugar will increase with the elimination of the sugar programme. Since the United States is such a large importer of sugar, this increase in demand will have a positive impact
“A complete listing of the equilibrium conditions together with relevant definitions is available from the authors upon request.
450 Food Policy 1994 Volume I9 Number 5

impact of the sugar programme on the US economy: N D Uri and R Boyd
Table 2. Household categories based on income
Category Income range
I $@9 999 II $10 000-19 999
III $20 000-29 999 IV $30 000-39 999 V $40 000-49 999
VI $50 000 and over
on the world sugar market to cause an upward price adjustment. Therefore, instead of assuming that the US sugar price will fall to the world level, the presumption is the world sugar price will increase with the elimination of the sugar programme. In what follows, the results of the complete elimination of the programme on the US economy with respect to the producing sector, the consuming sector, the household categories and the government sector are discussed.
The impact of the complete elimination of the sugar programme on the producing sector are presented in Table 2.” The equilibrium prices and quantities with the programme in effect are shown for the reference case to provide a basis for comparison. The total output of the producing sectors is valued at about $81.05 billions in 1988. Note that the magnitude of the equilibrium values per se is of little importance. The significance of these measures is to reflect the relative changes corresponding to the policy initiative that perturbs the general equilibrium.
As shown in Table 2, in response to the elimination of the sugar programme, total output in the producing sectors will fall by 0.035 per cent, or by about $2.85 billion. This decrease, however, is somewhat misleading since it is not spread uniformly across producing sectors. For example, the output of the agricuitural programme crops sector, which includes both sugar and corn production, will fall by 2.41 per cent ($1.76 billion).“’ The domestic price of sugar would fall both in relative and absolute terms. This results from the increased availability of sugar at a lower price. With the lower price and greater availability of sugar in the world market, less sugar will be produced domestically and more will be imported. With the fall in the relative price of sugar, less HFCS will be demanded as sugar is substituted for HFCS, resulting in a reduction of corn prices.
The two other sectors adversely affected in terms of reduced output are the crude oil producing sector and petroleum refining sector. The fall in the output in these sectors is an artifact of the model assumptions. ’ ’ In particular, exports and imports are scaled so that the total foreign account is balanced. With the change in the price of sugar relative to the price of crude oil (sugar is relatively cheaper after the sugar tariff-rate import quota is eliminated as shown in Table 2), more of the available foreign exchange will be devoted to imports of sugar and less to crude oil. This results in less crude oil being imported, produced and refined.
‘Note that domestically produced corn and sugar are both included in the programme crops sector. Sugar purchased from foreign sources is not included. however, in the programme crops sector. Moreover, imported sugar is not a perfect substitute for domestically produced corn. “‘To limit the number of tables, some of the equilibrium prices and quantities will not be explicitly presented although selected values will he discussed. Such is the case with the prices and quantities of imported goods and services. The omitted tables arc available from the authors upon request. “The crude oil and petroleum sectors are the only sectors so affected by the model’s trade specification, Any further inaccuracies caused by such trade specifications are likely to he small owing to the relatively small size of trade in the United States.
Food Policy i994 Volume 19 Number 5 451

Impact of the sugar programme on the US economy: N D Uri and R Boyd
Table 3. Equilibrium prices (normalized) and quantities (in hundreds of billions of dollars) for the producing sectors
Sector2
Reference
Price Quantity
Sugar programme elimination
Price Quantity
1 Manufacturing 2 Coal mining 3 Other mining 4 Service 5 Chemicals 6 Food and tobacco 7 Petroleum refining 8 Financial 9 Forestry
10 Wood products 11 Crude Oil 12 Agriculture - PC 13 Agriculture - L 14 Agriculture - 0
Total
1 .oOOoo 22.3977 1.00000 22.4019 0.018 1.00000 0.28022 0.99994 0.28089 0.239 1 .ooooo 0.23889 0.99979 0.23892 0.013 1 .oooOO 34.0791 1.00001 34.0924 0.039 1 .ooooo 3.37973 0.99996 3.38121 0.044 1 .oOOoo 3.85858 0.99858 3.86282 0.110 1.00000 1.64365 0.99877 1.64338 -0.164 1 .ooooo 8.60248 1.00002 8.60251 0.001 1 .ooooo 0.15030 0.99547 0.15089 0.393 1 .ooooo 2.28792 0.99983 2.28951 0.069 1.00000 1.29060 0.99771 1.25005 -3.142 1 .ooooo 0.72849 0.99682 0.71094 -2.409 1 .ooooo 1.41446 0.99599 1.41752 0.216 1.00000 0.69644 0.99626 0.69707 0.090
1 .ooooo 81.04856 0.99973 81.02002 -0.035
“The per cent change represents the percentage change in the equilibrium quantities between the elimination of the sugar program and the reference case ‘For the agriculture sectors, PC denotes program crops, L denotes livestock and 0 denotes all other agricultural activities. Also, some of the other titles have been abbreviated. The complete titles are given in Table 1
Except for the agriculture programme crops, crude oil and petroleum refining sectors, elimination of the sugar programme will actually increase output in the other producing sectors by 0.038 per cent ($2.98 billion). The magnitude of sector specific effects, however, are somewhat variable. For example, output for the service sector, will increase by 0.039 per cent ($1.33 billion). In response to lower sugar prices, output in the manufacturing sector will increase by 0.018 per cent ($420 million), while output in the food and tobacco products sector will expand by 0.110 per cent ($424 million). Output in the coal mining sector increases by 0.239 per cent ($67 million) as coal is substituted for the crude oil in the generation of electricity. Furthermore, output in the livestock and all other agriculture sector will increase by 0.216 per cent ($306 million) and 0.090 per cent ($63 million), respectively. These effects are caused by shifting some of the land from production of sugar and corn to production of livestock and other agricultural commodities.
Accompanying the changes in agricultural output are changes in the prices of the agricultural commodities. The results suggest that the price of the programme crops will fall by 0.318 per cent due to sugar being imported at the world price. Moreover, the prices of the livestock and all other agricultural commodities will be reduced by 0.401 per cent and 0.374 per cent, respectively. These latter price decreases are the result of increasing production of livestock and other agricultural commodities in response to the lower sugar and corn prices.
Finally, imports of sugar, livestock and all other agricultural commodities will expand by 4.701 per cent ($230 million), 0.178 per cent ($036 thousand) and 0.769 per cent ($839 thousand), respectively. These increases in imports are caused by the reduction in the domestic prices of these agricultural commodities in the absence of the sugar programme.
452 Food Policy I994 Volume 19 Number 5

Impact of the sugar programme on the US economy: N D Uri and R Boyd
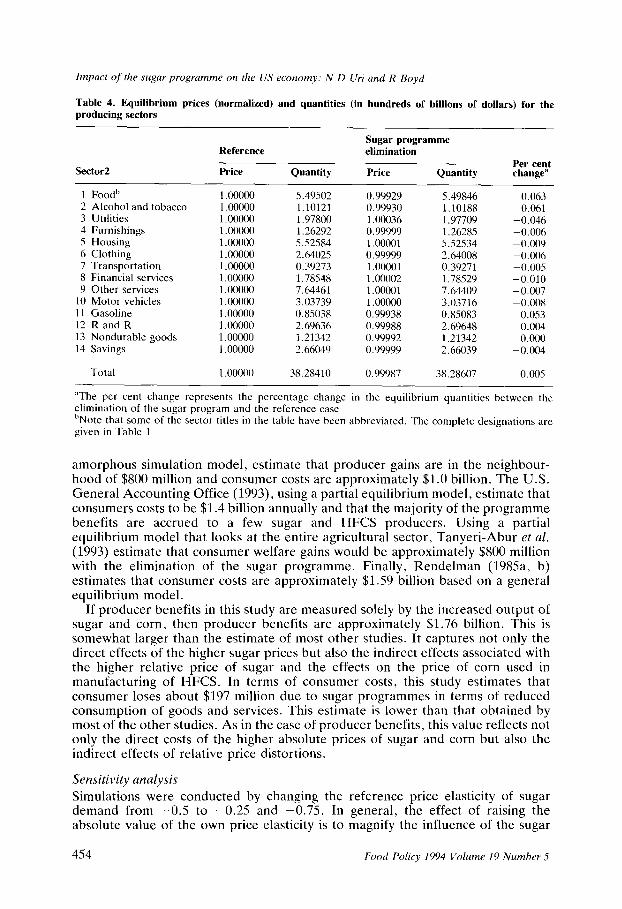
With regard to the consuming sectors, the elimination of the sugar programme results in an increase in the consumption of goods and services by about 0.005 per cent or $197 million (Table 3). The food sector benefited the most with a 0.063 per cent ($344 million) increase in consumption. The second most significantly affected sector (in percentage terms) is the alcohol and tobacco sector, which realizes a 0.061 per cent ($67 million) rise in consumption. Most other sectors experience minimal changes attributable to the indirect effects of the sugar programme elimination. These indirect effects include a slightly higher real income brought about by a reduction in the price of sugar and corn. In addition, changing relative prices also leads to substitution of relatively less expensive for relatively more expensive goods and services.
Table 4 shows that aggregate utility is expected to increase by 0.001 per cent ($121 million) for all household categories when the sugar programme is abolished.” The increase, however, is not distributed evenly across households. Category I and Category II households suffer a decline in utility while the utility level of the remaining households increases. The reduction in utility of the Category I and Category II households is the result of relatively higher prices for utilities, housing and transportation. These commodities are consumed in greater proportion by these category households relative to the remaining household categories. ” Thus considering all direct and indirect effects of abolishing sugar import quotas, the policy option is, in general, regressive. That is, the adverse effects of eliminating the sugar programme fall mostly on the lowest household income categories. The effects, however, are extremely small and cannot be estimated precisely by the model.
The government realizes a slight reduction in revenue by abolishing the sugar programme (Table 4). This result is primarily due to changes in the consumption patterns of goods and services that have low tax rates. The aggregate effect in the reduction of government revenue is estimated to equal 0.001 per cent, or about $15 million.
A comparison
Most of the existing studies on the effects of the sugar programme are partial equilibrium in nature. Tarr and Morkre (1984) estimate that the sugar producers benefit $414 million from the tariff-rate import quota while consumers lose $735 million. Dardis and Young (1985) estimate the benefits to sugar producers between $782 and $886 million, and the losses to consumers are between $1.9 to $2.4 billion. Leu, Schmitz and Knutson (1987), focusing on the interactions between the sugar and corn and corn syrup markets, approximate producer gains to be $169 to $578 million and consumer losses to be $372 million to $1.6 billion. Using a simple single equation partial equilibrium model, Maskus (1989) suggests that producer benefits are about $700 to $840 million. Sturgis, Field and Young (1990), using an
“Note that it is a mistake to compare producer sector ‘losses’ with consumption and utility gains. Producing sectors’ activity consists of the use of not only basic (unprocessed) inputs but manufactured and processed inputs from the other producing sectors (through the input-output matrix) as well. Additionally, some loss by the producing sectors is a function of the depreciation of the capital stock as a result of an increase imports. Ultimately, what is of consequence is the return to workers and this is what is reflected in the measure of consumer welfare. 13The prices of housing, transportation and utilities rise because all three sectors rely heavily on the service and financial (a non-traded good) sectors. The relative prices in these producing sectors rise after the abolition of the sugar programme. Hence, even though the price of coal drops, the increase in the prices of other inputs cause housing, transportation and utility prices to increase incrementally.
Food Policy 1994 Volume I9 Number 5 453
Impact of lhe sugar programme on the US economy: N D Uri and R Boyd
Table 4. Equilibrium prices (normalized) and quantities (in hundreds of billions of dollars) for the producing sectors
Sector2
Reference
Price Quantity
Sugar programme elimination
Price Quantity Per cent change”
1 Foodh 1 00000 2 Alcohol and tobacco 1.00000 3 Utilities 1 .ooooo 4 Furnishings 1.00000 5 Housing 1 .ooooo 6 Clothing 1 .ooooo 7 Transportation 1 .ooooo 8 Financial services 1 .ooooo 9 Other services 1 .ooooo
10 Motor vehicles 1.00000 11 Gasoline 1 .ooooo 12 R and R 1 .ooooo 13 Nondurable goods 1 .ooooo 14 Savings 1.00000
Total 1 .ooooo
5.49502 0.99929 5.49846 0.063 1.10121 0.99930 1.10188 0.061 1 .Y7800 1.00036 1.97709 -0.046 I .26292 0.99999 1.26285 -0.006 5.52584 1.00001 5.52534 -0.009 2.64025 0.99999 2.64008 -0.006 0.39273 1.00001 0.39271 -0.005 1.78548 1.00002 1.78529 -0.010 7.64461 1.00001 7.64409 -0.007 3.03739 1 .ooooo 3.03716 -0.008 0.85038 0.99938 0.85083 0.053 2.69636 0.99988 2.69648 0.004 1.21342 0.99992 I .21342 0.000 2.66049 0.99999 2.66039 -0.004
38.28410 0.99987 38.28607 0.005
“The per cent change represents the percentage change in the equilibrium quantities between the elimination of the sugar program and the reference case “Note that some of the sector titles in the table have been abbreviated. The complete designations are given in Table 1
amorphous simulation model, estimate that producer gains are in the neighbour- hood of $800 million and consumer costs are approximately $1.0 billion. The U.S. General Accounting Office (1993), using a partial equilibrium model, estimate that consumers costs to be $1.4 billion annually and that the majority of the programme benefits are accrued to a few sugar and HFCS producers. Using a partial equilibrium model that looks at the entire agricultural sector, Tanyeri-Abur et al. (1993) estimate that consumer welfare gains would be approximately $800 million with the elimination of the sugar programme. Finally, Rendelman (1985a, b) estimates that consumer costs are approximately $1.59 billion based on a general equilibrium model.
If producer benefits in this study are measured solely by the increased output of sugar and corn, then producer benefits are approximately $1.76 billion. This is somewhat larger than the estimate of most other studies. It captures not only the direct effects of the higher sugar prices but also the indirect effects associated with the higher relative price of sugar and the effects on the price of corn used in manufacturing of HFCS. In terms of consumer costs, this study estimates that consumer loses about $197 million due to sugar programmes in terms of reduced consumption of goods and services. This estimate is lower than that obtained by most of the other studies. As in the case of producer benefits, this value reflects not only the direct costs of the higher absolute prices of sugar and corn but also the indirect effects of relative price distortions.
Sensitivity analysis Simulations were conducted by changing the reference price elasticity of sugar demand from -0.5 to -0.25 and -0.75. In general, the effect of raising the absolute value of the own price elasticity is to magnify the influence of the sugar
454 Food Policy 1994 Volume 19 Number 5

Impact of the sugar programme on the US economy: N D Uri and R Boyd
programme. The effect, however, is minimal. Under the different assumptions concerning the own price elasticity of demand for sugar, neither output nor consumption is affected by more than $125 million, and in no case is there any change in the qualitative results discussed above.
These sensitivity results suggest that the magnitude of own price elasticity of demand for sugar is not so pivotal to the model. While the elasticity is important in the determination of the equilibrium prices and quantities and the policy implica- tions, the model appears reasonably robust with regard to the assumption of own price elasticity of demand for sugar. That is, an error in the estimated price elasticity does not necessarily lead to misleading and nonsensical results.
Conclusion
The foregoing analysis has examined the effect of the sugar tariff-rate import quota programme on the US economy. The analytical approach used a computable general equilibrium model which is composed of 14 producing sectors, 14 consum- ing sectors, six household categories classified by income and one government sector. The effects of abolishing the tariff-rate import quota sugar programme on prices and quantities are examined.
Results suggest that a complete elimination of the sugar programme will lower the total output of all producing sectors by about $2.85 billion. However, for producing sectors besides agriculture - programme crops, crude oil and petroleum refining sectors, output will actually increase by about $2.98 billion. For the agricultural sectors, output in the programme crops sector will fall by about $1.76 billion, and outputs in the livestock and all other agriculture commodities sectors will increase by $306 million and $63 million, respectively. The consumption of goods and services will increase by about $197 million, and consumers’ welfare will increase by about $121 million. The government also will realize a reduction in revenue of about $15 million.
The results from this study differ somewhat from most other studies of the sugar tariff-rate import quota programme. One possible explanation is that these other studies are typically partial equilibrium in nature. Consequently, the indirect effects of the sugar programme on the other producing sectors - including the other agricultural sectors - of the US economy are not captured in the partial equilibrium analysis.
As a consequence of this analysis, the implications of the sugar tariff-rate import quota have been clearly demonstrated. While some producing sectors benefit, most are adversely affected in terms of reduced output by the programme. The various consuming sectors would experience a total increase in the consumption of goods and services if the programme were abolished. These changes, however, are relatively modest.
Finally, the tariff-rate import quota has been the main element of US sugar policy in recent years. Without quotas, domestic sugar producers and sugar exporters to the United States would receive only the world market price. A straight tariff policy would be preferred to a quota, because the quota rents determined by the excess of the sugar import price over the world price would be transformed to revenues received by the US government while at the same time protecting domestic sugar cane and sugar beet producers from foreign competition.
The tariff-rate import quota, while maintaining domestic producer welfare without major government expense as shown by the reduction in revenue associ- ated with the elimination of the sugar programme, also yields quota rents to trade
Food Policy 1994 Volume 19 Number 5 455

Impact of the sugar programme on the US economy: N D 0-i and R Boyd
Table 5. Equilibrium utility levels (in hundreds of billions of dollars) by household categories
Category Reference case utility level
Sugar programme elimination utility level
Per cent change”
Ih 2.46325 11 5.03590
III 7.73044 IV 8.03518 V 6.36414
VI 16.71870
Total 46.34821
Government 7.71151 7.71136 -0.001
2.46292 5.03535 7.73051 8.03546 6.36518
16.72000
46.34942
-0.001 -0.001
0.001 0.001 0.001 0.001
0.001
“The per cent change represents the percentage change in the equilibrium quantities between the elimination of the sugar program and the reference case ‘Note that the household categories correspond to those defined in Table 2
partners. That is, the quotas can be interpreted as a subsidy to domestic and foreign producers. Criticism of the sugar programme from domestic sugar consumers is dampened due to the relatively small impact on them as suggested in the foregoing analysis.
The tariff-rate import quota policy has kept the price of sugar high relative to the domestic price of corn. This relationship contributed to the substantial growth in the corn sweetener consumption, and the related reduction in sugar demand. In response to the market changes, sugar import quotas have been cut over the years to support the domestic sugar price. Thus, sugar quotas have fallen from 2.65 million short tons in 1983 to the 1.25 million short tons specified in the Food, Agriculture, Conservation and Trade Act of 1990. This reduction in sugar import quotas has hurt sugar exporters and has generated competition among exporters to maintain their quota levels (Leu, Schmitz and Knutson, 1987; Sturgis, Field and Young, 1990). More importantly, if the trend continues it will eventually cut into the demand for domestic sugar, with the result that, rather than helping domestic producers, there will be a net reduction in income associated with the domestic production of sugar.
References Ballard, C L, Fullerton, D, Shaven, J B and Whalley, J (1985) A General Equilibrium Model for Tax
Policy Evaluation The University of Chicago Press Barry, R D, Angelo, L, Buzzanell, P J and Gray, F (1991) Sugar: Backgroundfor 1990 Farm Legislation
AGES 9006, U.S. Department of Agriculture, Economic Research Service, September Bohall, R, Angelo, L, Gray, F, Hulse, F, Larkin, L and Powe, C (1977) The Sugar Industry’s Structure,
Pricing and Performance U.S. Department of Agriculture, Economic Research Service, March Boyd, R (1988) The Direct and Indirect Effects of Tax Reform on Agriculture Technical Bulletin Number
1743, U.S. Department of Agriculture, Economic Research Service, February Bureau of Economic Analysis Survey of Current Business U.S. Department of Commerce, Washington,
DC Bureau of Labor Statistics (1986) Consumer Expenditure Survey: Interview Survey, IYN4 Washington,
DC Dardis, R and Young, C (1985) ‘The welfare loss from the new sugar program’ The Journal of Consumer
Affairs 19, pp 231-252
456 Food Policy 1994 Volume 19 Number 5

Impact of the sugar programme on the US economy: N D Uri and R Boyd
Economic Research Service (1992) Sugar and Sweetener: Situation and Outlook SSRV17N2, U.S. Department of Agriculture, Economic Research Service, June
Economic Research Service (1992) Sugar and Sweetener: Situation and Outlook SSRV17N2, U.S. Department of Agriculture, Economic Research Service, December
Economic Research Service (1993) Sugar and Sweetener: Situation and Outlook SSRV17N2, U.S. Department of Agriculture, Economic Research Service, September
Hertel, T W and Tsigas, M E (1987) ‘Tax policy and U.S. agriculture: a general equilibrium analysis’ Staff Paper #87-2, Department of Agricultural Economics, Purdue University
Hudson, E A and Jorgenson, D W (1974) ‘Energy policy and economic growth’ Bell Journal of Economics and Management Science 5, pp 461-514
Leu, G, Schmitz, A and Knutson, R (1987) ‘Gains and losses of sugar program policy options’ American Journal of Agricultural Economics 69, pp 591-602
Lichs, F 0 (1991) ‘The advance of sugar’s competitors in perspective’ International Sugar and Sweetener Report 123, July 12, pp 35.S358
Lin, W and Novick, A (1988) ‘Substitution of high fructose corn syrup for sugar: trends and outlook’ Sugar and Sweetener Outlook and Yearbook SSRV13NS. U.S. Deoartment of Agriculture. Economic Research Service, June
Lord, R and Barry, R (1991) The World Sugar Market-Government Intervention and Multilateral Policy Reform AGES 9062, U.S. Department of Agriculture, Economic Research Service, September
Maskus, K (1989) ‘Large costs and small benefits of the American sugar programme’ World Economy 12, pp 85-104
Mathiesen, L (1985a) ‘Computational experience in solving equilibrium models by a sequence of linear complementary problems’ Operations Research 33, pp 1225-1250
Mathiesen, L (1985b) ‘Computation of economic equilibrium by a sequence of linear complementary problems’ Mathematical Programming Study 23, pp l-54
Mixon, J W and Uri, N D (1985) Managerial Economics Macmillan Moore, W and Buzanell, P (1991) ‘Trends in U.S. soft drink consumption-demand implications for low
calorie and other sweeteners’ Sugar and Sweetener: Situation and Outlook Report U.S. Department of Agriculture, Economic Research Service, September, pp 33-39
Morris, C (1980) ‘New directions for basic commodities’ Food Engineering 32, pp 95-111 Nordlund, D (1977) ‘High fructose corn syrup - review, update, and outlook’ Lamborn Sweetener News
Lamborn and Company, Inc, New York, March 29 Page, L and Friend, B (1974) ‘Levels of use of sugars in the United States’ Sugars in Nutrition 12, pp
93-107 Rendelman, C M (1989) The Economy-Wide Impact of the U.S. Sugar Program Unpublished PhD
Dissertation, Purdue University Rendelman, C M and Hertel, T W (1993) ‘Do corn farmers have too much faith in the sugar program?’
Journal of Agricultural and Resource Economics 18, pp 8695 Scarf, H E (1967) ‘The approximation of fixed points of a continuous mapping’ SIAM Journal of
Applied Mathematics 15, pp 1328-1343 Schmitz, A, Allen, R and Leu, G J (1984) ‘The U.S. sugar program and its effects’ in Alternative
Agricultural and Food Policies and the 1985 Farm Bill G. Rausser and K Farrell, eds., Blaco Printers Shoven, J B and Whalley, J (f1972) ‘A general equilibrium calculation of the effects of differential
taxation of income from capital in the U.S.’ Journal of Public Economics 1, pp 281-322 Sturgis, R, Field, H and Young, L (1990) 1990 and Sugar Policy Reform Australian Bureau of
Agricultural and Resource Economics, Australian Government Publishing Service Tanyeri-Abur, A, McCarl, B, Chang, C, Knutson, R, Peterson, W and Coble, K (1993) ‘An analysis of
possible U.S. sugar import policy revisions’ Review of Agricultural Economics 15, ‘pp 255-268 Tarr, D and Morkre, M (1984) Aggregate Costs and Benefits to the United States of Tariffs and Ouotas on
Imports Federal Trade Corn&&, Washington, DC , ,I 1
U.S. General Accounting Office (1993) Sugar Program: Changing Domestic and International Condi- tions Require Program Changes RCED-93-84. U.S. Government Printing Office, Washington, DC, April
U.S. International Trade Commission (1992) Harmonized Tariff Schedule of the United States (1992) Presented in Industry and Trade Summary USITC Publication 2545, U.S. International Trade Commission, Washington, DC, November
Uri, N D (1984) ‘The impact of technical change on the aggregate production function’ Applied Economics 16, pp 555-567
Uri, N D (1994) ‘Estimating the demand for sugar in the presence of measurement error in the data’ Journal of Agricultural Economics Research (forthcoming)
Vuilleumier, S (1981) ‘Corn sweetener outlook’ Agriculfural Outlook Conference Washington, DC, November 18
Food Policy 1994 Volume 19 Number 5 457


