
Appendices-Municipal Water Quality Investigations Program 2013-14 Work Plan
6/21/13 Final
i
Table Of Contents Appendix 1. Program Element Costs FY13‐14 (MWQI and SWPCA funds) ............................................................................. 1
Table 1 Program Element Costs for FY13‐14 Work Plan Projects ....................................................................................... 1
Table 2 MWQI Program Staff Workload Assessments for FY13‐14 Work Plan Projects .................................................... 2
Table 2 MWQI Program Staff Workload Assessments for FY13‐14 Work Plan Projects (continued) ................................. 3
Explanation of Table 1 Program Element Costs for FY13‐14 Work Plan Projects ............................................................... 4
Specific Tasks to be Implemented using SWPCA Funds .................................................................................................. 4
MWQI contracts required for FY13‐14 Work Plan Elements .......................................................................................... 5
MWQI Operating Equipment and Expenses using the MWQI Program’s Planned Budgeted Funds ............................. 5
Appendix 2. Real‐Time Data and Forecasting Comprehensive Program (RTDF‐CP): Overview and Evolution ...................... 8
MWQI Program Background ............................................................................................................................................... 8
The Real‐time Data Forecasting Comprehensive Program Background ........................................................................... 10
Real‐time Monitoring ........................................................................................................................................................ 14
Water Quality Forecasting ................................................................................................................................................ 15
RTDF Information Management and Dissemination ........................................................................................................ 17
Appendix 3. Project Management Documentation .............................................................................................................. 20
Background ....................................................................................................................................................................... 20
DSM2 Nutrient Monitoring ........................................................................................................................................... 22
Cache/Yolo Complex Pre‐Restoration Baseline Monitoring ......................................................................................... 23
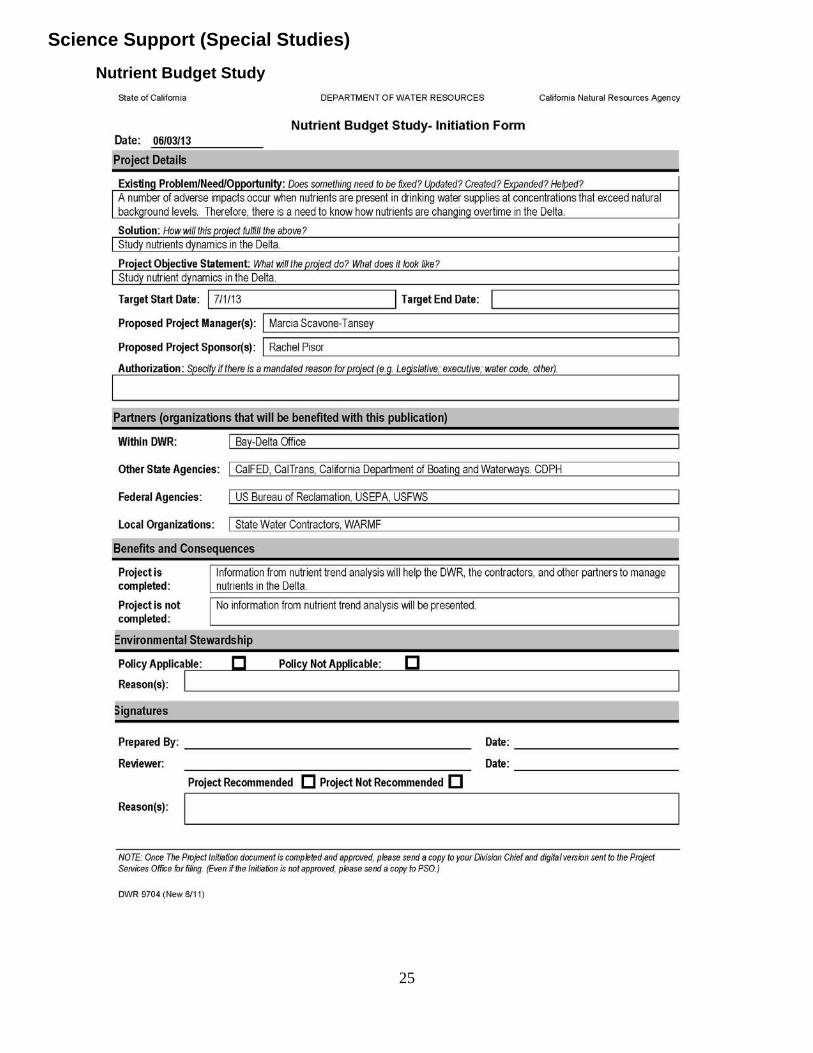
Science Support (Special Studies) ..................................................................................................................................... 25
Nutrient Budget Study .................................................................................................................................................. 25
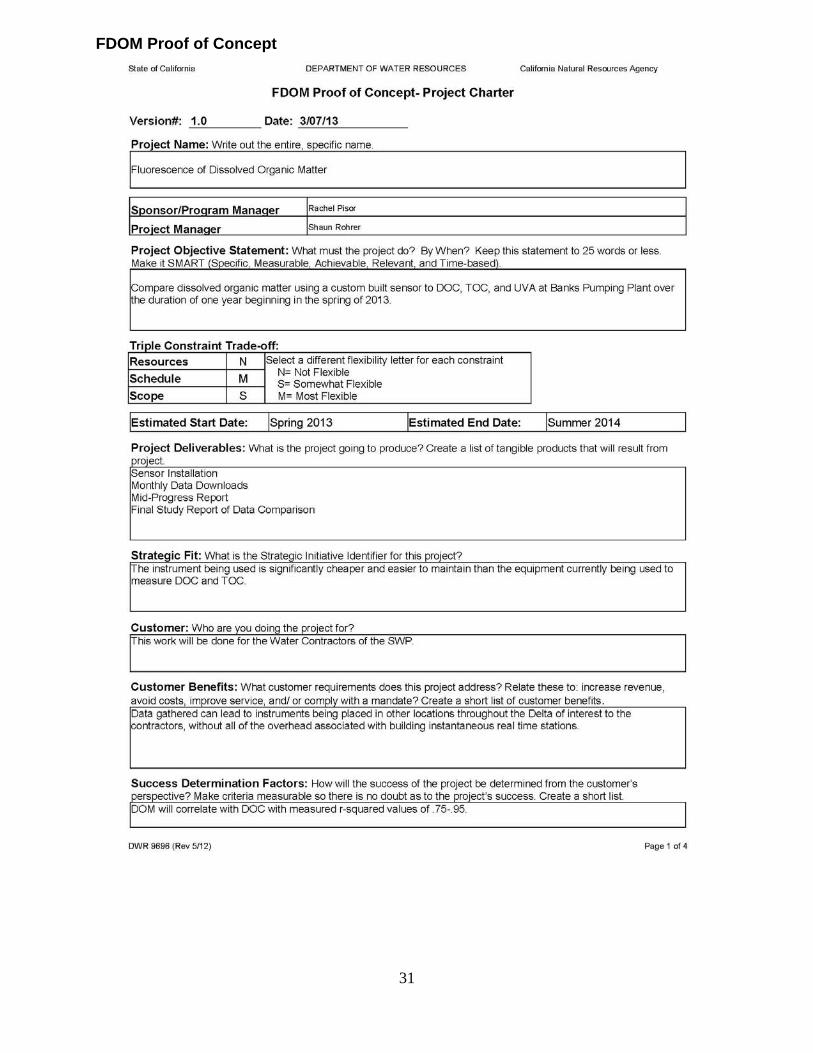
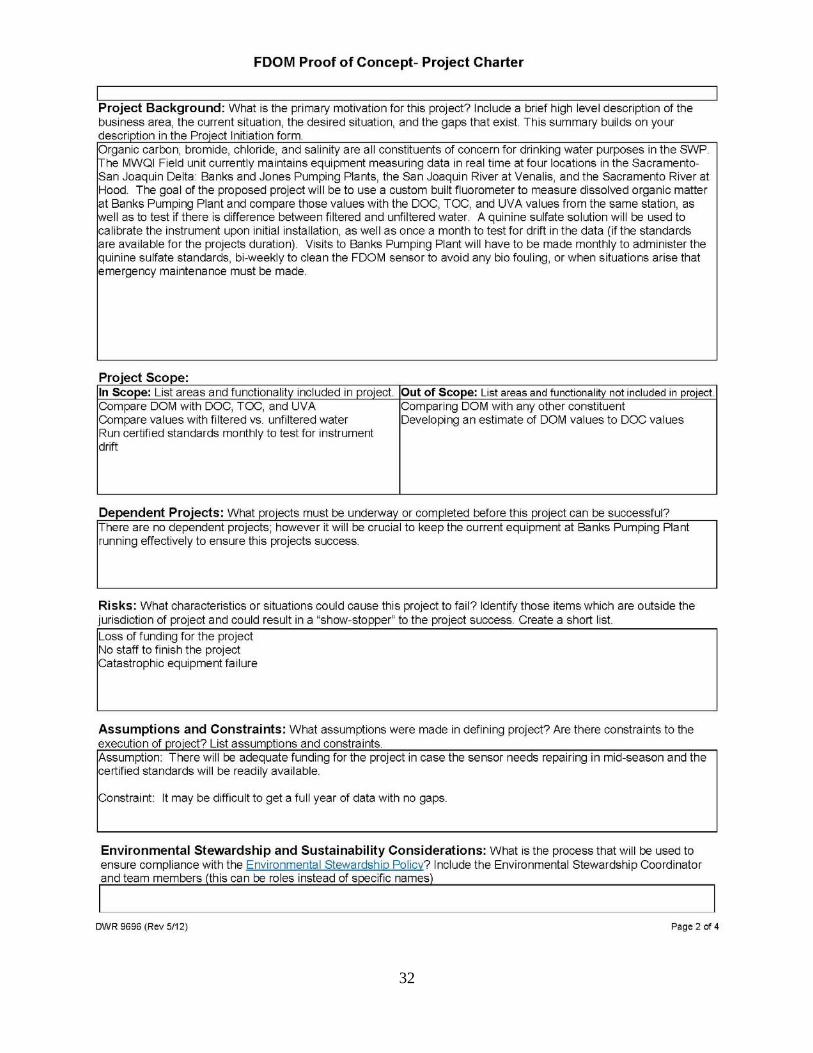
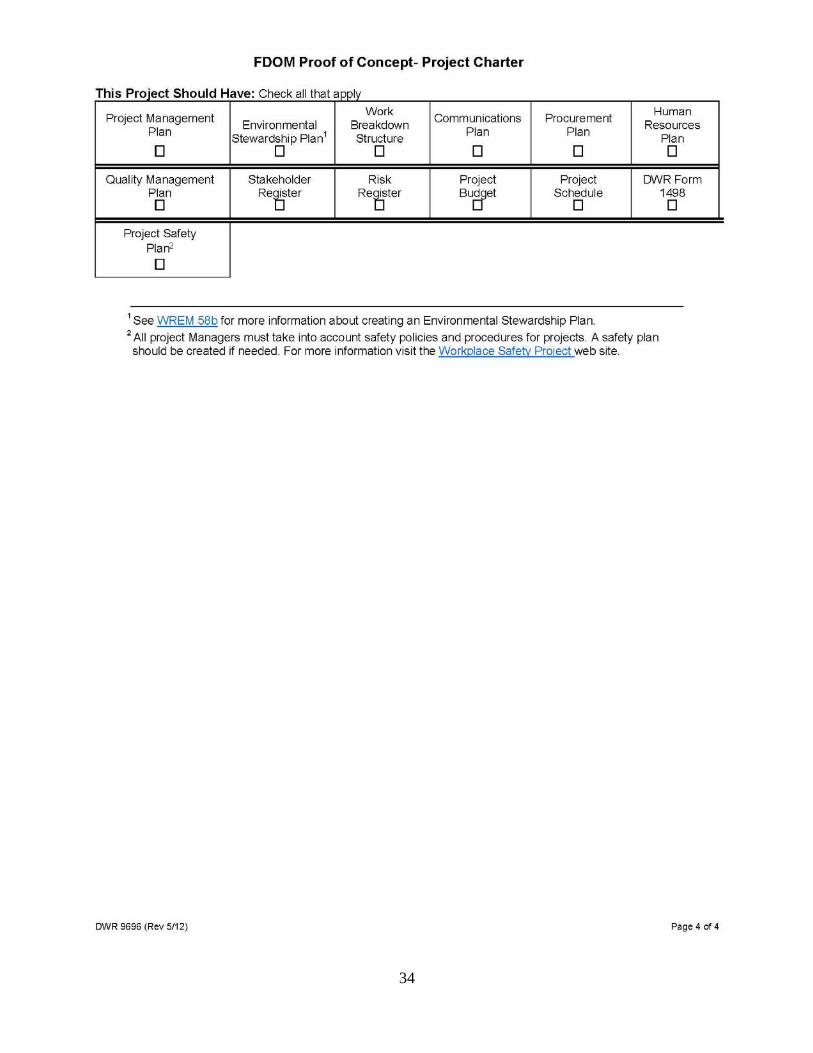
FDOM Proof of Concept ................................................................................................................................................ 31
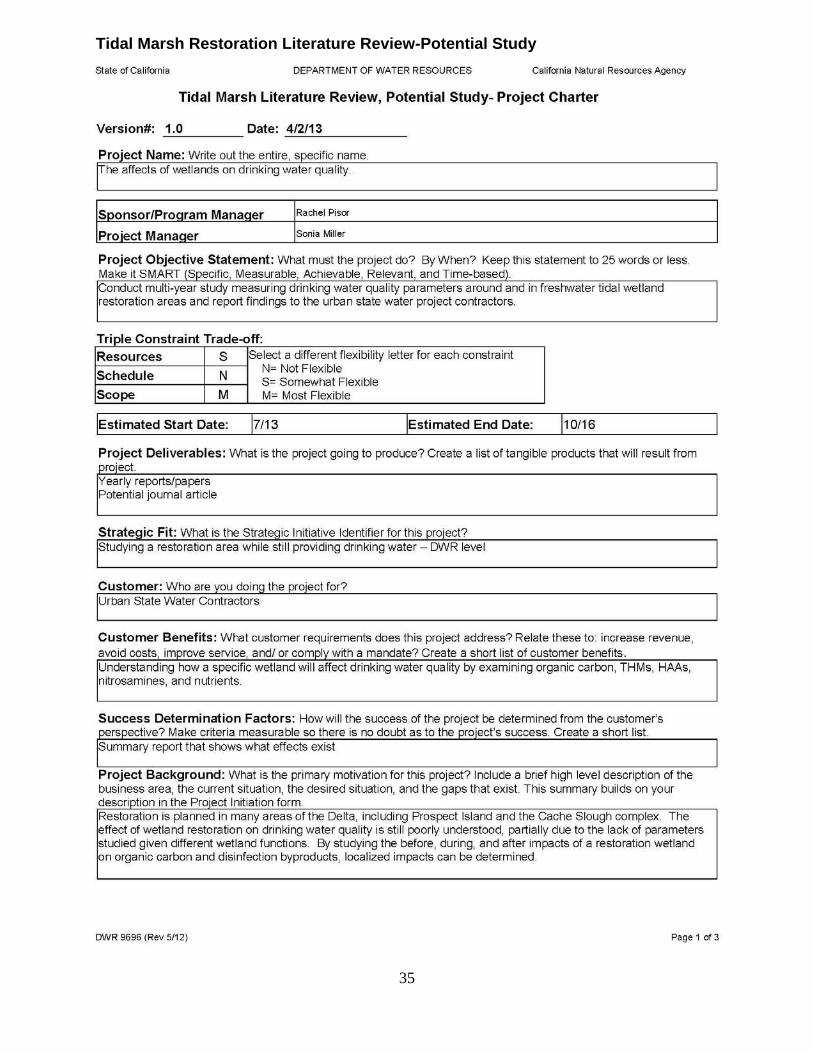
Tidal Marsh Restoration Literature Review‐Potential Study ........................................................................................ 35
California Integrated Water Quality System (CIWQS) Database Search ....................................................................... 38
Appendix 4. Sampling Sites ................................................................................................................................................... 42
Real Time Monitoring QC at Hood ........................................................................................................................................ 49
Real Time Monitoring QC at Banks, Jones, and Vernalis ...................................................................................................... 50
Real Time Monitoring QC at Gianelli ..................................................................................................................................... 51
Appendix 5. MWQI 5 Year Strategic Plan .............................................................................................................................. 54
Introduction ...................................................................................................................................................................... 54
MWQP Branch Mission Statement ................................................................................................................................... 54
MWQI Program Mission Statement .................................................................................................................................. 54
Organizational Structure, Coordination, and Funding .................................................................................................. 55
Development and Refinement of a SWP “Early Warning System” for Water Quality Concerns .................................. 55
ii
Water Quality Monitoring and Emerging concerns ...................................................................................................... 56
Information Management and Dissemination .............................................................................................................. 57
Water Quality Forecasting ............................................................................................................................................ 58
Scientific Support Studies ............................................................................................................................................. 58
Emergency Response .................................................................................................................................................... 59
Sanitary Survey.............................................................................................................................................................. 59
1
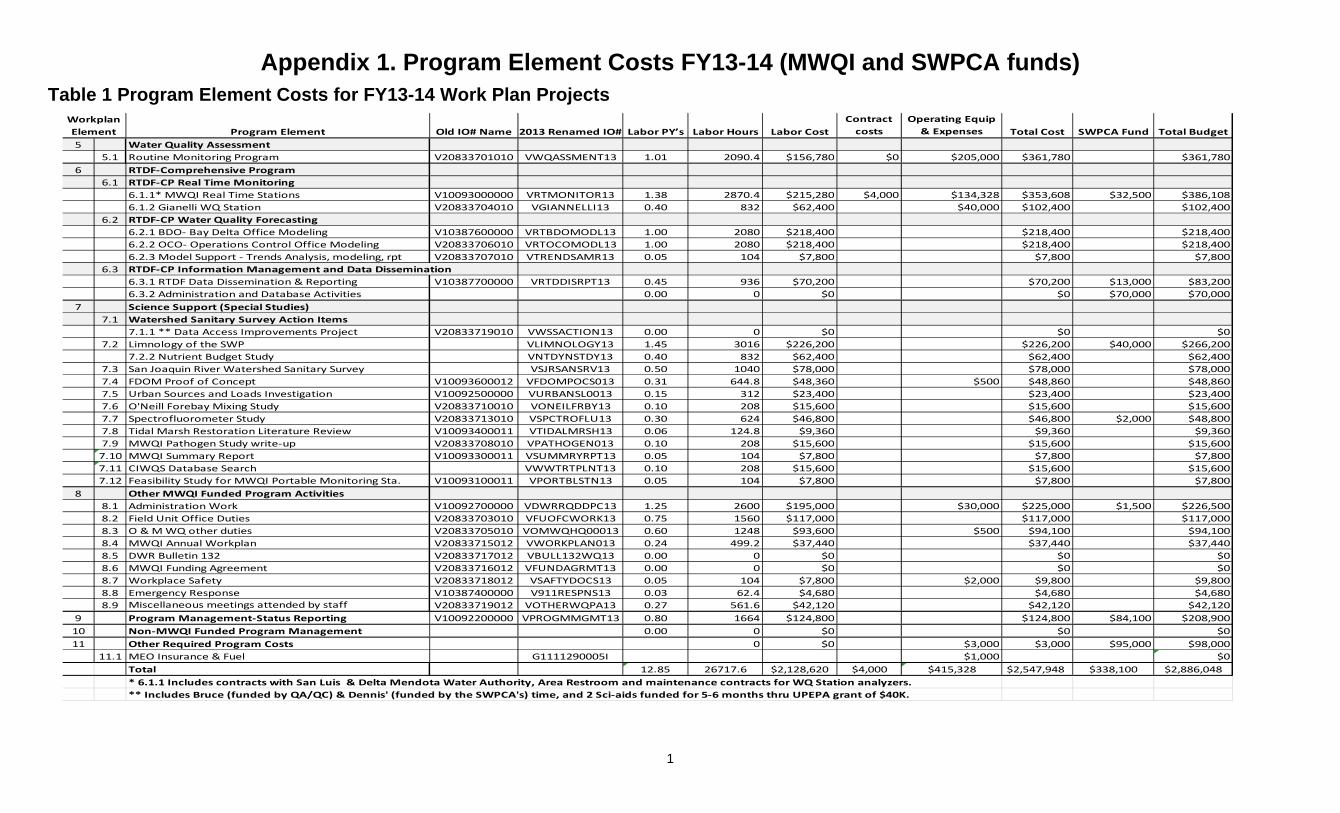
Appendix 1. Program Element Costs FY13-14 (MWQI and SWPCA funds) Table 1 Program Element Costs for FY13-14 Work Plan Projects
Program Element Old IO# Name 2013 Renamed IO# Labor PY’s Labor Hours Labor CostContract costs
Operating Equip & Expenses Total Cost SWPCA Fund Total Budget
5 Water Quality Assessment5.1 Routine Monitoring Program V20833701010 VWQASSMENT13 1.01 2090.4 $156,780 $0 $205,000 $361,780 $361,780
6 RTDF‐Comprehensive Program6.1 RTDF‐CP Real Time Monitoring
6.1.1* MWQI Real Time Stations V10093000000 VRTMONITOR13 1.38 2870.4 $215,280 $4,000 $134,328 $353,608 $32,500 $386,108
6.1.2 Gianelli WQ Station V20833704010 VGIANNELLI13 0.40 832 $62,400 $40,000 $102,400 $102,400
6.2 RTDF‐CP Water Quality Forecasting6.2.1 BDO‐ Bay Delta Office Modeling V10387600000 VRTBDOMODL13 1.00 2080 $218,400 $218,400 $218,400
6.2.2 OCO‐ Operations Control Office Modeling V20833706010 VRTOCOMODL13 1.00 2080 $218,400 $218,400 $218,400
6.2.3 Model Support ‐ Trends Analysis, modeling, rpt V20833707010 VTRENDSAMR13 0.05 104 $7,800 $7,800 $7,800
6.3 RTDF‐CP Information Management and Data Dissemination6.3.1 RTDF Data Dissemination & Reporting V10387700000 VRTDDISRPT13 0.45 936 $70,200 $70,200 $13,000 $83,200
6.3.2 Administration and Database Activities 0.00 0 $0 $0 $70,000 $70,000
7 Science Support (Special Studies)7.1 Watershed Sanitary Survey Action Items
7.1.1 ** Data Access Improvements Project V20833719010 VWSSACTION13 0.00 0 $0 $0 $0
7.2 Limnology of the SWP VLIMNOLOGY13 1.45 3016 $226,200 $226,200 $40,000 $266,200
7.2.2 Nutrient Budget Study VNTDYNSTDY13 0.40 832 $62,400 $62,400 $62,400
7.3 San Joaquin River Watershed Sanitary Survey VSJRSANSRV13 0.50 1040 $78,000 $78,000 $78,000
7.4 FDOM Proof of Concept V10093600012 VFDOMPOCS013 0.31 644.8 $48,360 $500 $48,860 $48,860
7.5 Urban Sources and Loads Investigation V10092500000 VURBANSL0013 0.15 312 $23,400 $23,400 $23,400
7.6 O'Neill Forebay Mixing Study V20833710010 VONEILFRBY13 0.10 208 $15,600 $15,600 $15,600
7.7 Spectrofluorometer Study V20833713010 VSPCTROFLU13 0.30 624 $46,800 $46,800 $2,000 $48,800
7.8 Tidal Marsh Restoration Literature Review V10093400011 VTIDALMRSH13 0.06 124.8 $9,360 $9,360 $9,360
7.9 MWQI Pathogen Study write‐up V20833708010 VPATHOGEN013 0.10 208 $15,600 $15,600 $15,600
7.10 MWQI Summary Report V10093300011 VSUMMRYRPT13 0.05 104 $7,800 $7,800 $7,800
7.11 CIWQS Database Search VWWTRTPLNT13 0.10 208 $15,600 $15,600 $15,600
7.12 Feasibility Study for MWQI Portable Monitoring Sta. V10093100011 VPORTBLSTN13 0.05 104 $7,800 $7,800 $7,800
8 Other MWQI Funded Program Activities8.1 Administration Work V10092700000 VDWRRQDDPC13 1.25 2600 $195,000 $30,000 $225,000 $1,500 $226,500
8.2 Field Unit Office Duties V20833703010 VFUOFCWORK13 0.75 1560 $117,000 $117,000 $117,000
8.3 O & M WQ other duties V20833705010 VOMWQHQ00013 0.60 1248 $93,600 $500 $94,100 $94,100
8.4 MWQI Annual Workplan V20833715012 VWORKPLAN013 0.24 499.2 $37,440 $37,440 $37,440
8.5 DWR Bulletin 132 V20833717012 VBULL132WQ13 0.00 0 $0 $0 $0
8.6 MWQI Funding Agreement V20833716012 VFUNDAGRMT13 0.00 0 $0 $0 $0
8.7 Workplace Safety V20833718012 VSAFTYDOCS13 0.05 104 $7,800 $2,000 $9,800 $9,800
8.8 Emergency Response V10387400000 V911RESPNS13 0.03 62.4 $4,680 $4,680 $4,680
8.9 Miscellaneous meetings attended by staff V20833719012 VOTHERWQPA13 0.27 561.6 $42,120 $42,120 $42,120
9 Program Management‐Status Reporting V10092200000 VPROGMMGMT13 0.80 1664 $124,800 $124,800 $84,100 $208,900
10 Non‐MWQI Funded Program Management 0.00 0 $0 $0 $0
11 Other Required Program Costs 0 $0 $3,000 $3,000 $95,000 $98,000
11.1 MEO Insurance & Fuel G1111290005I $1,000 $0
Total 12.85 26717.6 $2,128,620 $4,000 $415,328 $2,547,948 $338,100 $2,886,048
* 6.1.1 Includes contracts with San Luis & Delta Mendota Water Authority, Area Restroom and maintenance contracts for WQ Station analyzers.** Includes Bruce (funded by QA/QC) & Dennis' (funded by the SWPCA's) time, and 2 Sci‐aids funded for 5‐6 months thru UPEPA grant of $40K.
Workplan Element
2
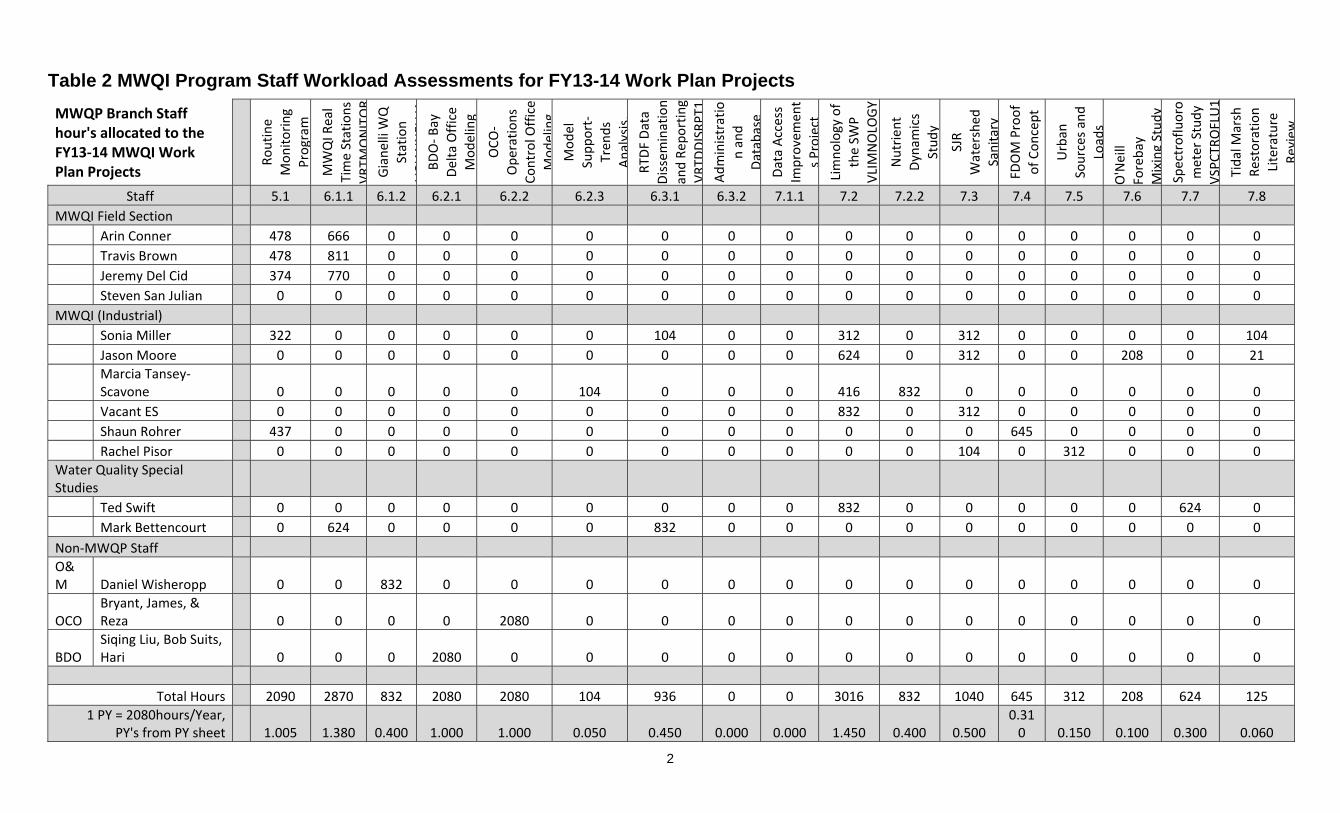
Table 2 MWQI Program Staff Workload Assessments for FY13-14 Work Plan Projects
MWQP Branch Staff hour's allocated to the FY13‐14 MWQI Work Plan Projects
Routine
Monitoring
Program
MWQI R
eal
Time Stations
VRTM
ONITOR
Gianelli WQ
Station
VGIANNELLI1
BDO‐ Bay
Delta Office
Modeling
OCO‐
Operations
Control O
ffice
Modeling
Model
Support‐
Tren
ds
Analysis,
RTD
F Data
Dissemination
and Rep
orting
VRTD
DISRPT1
Administratio
n and
Database
Data Access
Improvement
sProject
Limnology of
the SW
P
VLIMNOLO
GY
Nutrient
Dynam
ics
Study
SJR
Watershed
Sanitary
FDOM Proof
of Concept
Urban
Sources and
Loads
O'Neill
Forebay
MixingStudy
Spectrofluoro
meter Study
VSPCTR
OFLU1
Tidal M
arsh
Restoration
Literature
Review
Staff 5.1 6.1.1 6.1.2 6.2.1 6.2.2 6.2.3 6.3.1 6.3.2 7.1.1 7.2 7.2.2 7.3 7.4 7.5 7.6 7.7 7.8 MWQI Field Section Arin Conner 478 666 0 0 0 0 0 0 0 0 0 0 0 0 0 0 0 Travis Brown 478 811 0 0 0 0 0 0 0 0 0 0 0 0 0 0 0 Jeremy Del Cid 374 770 0 0 0 0 0 0 0 0 0 0 0 0 0 0 0 Steven San Julian 0 0 0 0 0 0 0 0 0 0 0 0 0 0 0 0 0 MWQI (Industrial) Sonia Miller 322 0 0 0 0 0 104 0 0 312 0 312 0 0 0 0 104 Jason Moore 0 0 0 0 0 0 0 0 0 624 0 312 0 0 208 0 21
Marcia Tansey‐Scavone 0 0 0 0 0 104 0 0 0 416 832 0 0 0 0 0 0
Vacant ES 0 0 0 0 0 0 0 0 0 832 0 312 0 0 0 0 0 Shaun Rohrer 437 0 0 0 0 0 0 0 0 0 0 0 645 0 0 0 0 Rachel Pisor 0 0 0 0 0 0 0 0 0 0 0 104 0 312 0 0 0 Water Quality Special Studies Ted Swift 0 0 0 0 0 0 0 0 0 832 0 0 0 0 0 624 0 Mark Bettencourt 0 624 0 0 0 0 832 0 0 0 0 0 0 0 0 0 0
Non‐MWQP Staff O&M Daniel Wisheropp 0 0 832 0 0 0 0 0 0 0 0 0 0 0 0 0 0
OCO Bryant, James, & Reza 0 0 0 0 2080 0 0 0 0 0 0 0 0 0 0 0 0
BDO Siqing Liu, Bob Suits, Hari 0 0 0 2080 0 0 0 0 0 0 0 0 0 0 0 0 0
Total Hours 2090 2870 832 2080 2080 104 936 0 0 3016 832 1040 645 312 208 624 125 1 PY = 2080hours/Year,
PY's from PY sheet 1.005 1.380 0.400 1.000 1.000 0.050 0.450 0.000 0.000 1.450 0.400 0.5000.310 0.150 0.100 0.300 0.060
3
Table 2 MWQI Program Staff Workload Assessments for FY13-14 Work Plan Projects (continued)
MWQP Branch Staff hour's allocated to the FY13‐14 MWQI Work
Plan Projects
MWQI
Pathogen
StudyWrite‐
MWQI
Summary
Rep
ort
CIW
QS
Database
Search
Feasibility
Study for
MWQI
Administration
Work
Field Unit
Office Duties
VFU
OFCWORK
O&M W
Q
Other Duties
MWQI A
nnual
Work Plan
VWORKPLAN0
DWR Bulletin
132
VBULL132WQ
MWQI
Funding
Agreement
Workplace
Safety
Emergency
Response
Miscellaneo
us
Meetings
Atten
ded
By
Staff
Program
Managemen
t‐
Status
Non‐M
WQI
Funded
Program
Other
Req
uired
Staff Hours
Hours per Year
PY
Percentages
Staff 7.9 7.10 7.11 7.12 8.1 8.2 8.3 8.4 8.5 8.6 8.7 8.8 8.9 9 10 11 Total Total Total MWQI Field Section Arin Conner 0 0 0 104 104 437 0 0 0 0 0 0 0 0 0 0 1789 2080 86% Travis Brown 0 0 0 0 104 374 0 0 0 0 0 0 0 0 0 0 1768 2080 85% Jeremy Del Cid 0 0 0 0 208 374 0 0 0 0 0 0 0 0 0 0 1726 2080 83% Steven San Julian 0 0 0 0 208 374 0 104 0 0 83 0 52 832 0 0 1654 2080 80% MWQI (Industrial) Sonia Miller 0 104 0 0 312 0 0 42 0 0 0 0 42 0 0 0 1654 2080 80% Jason Moore 208 0 0 0 208 0 0 42 0 0 21 62 42 0 0 0 1747 2080 84%
Marcia Tansey‐Scavone 0 0 0 0 208 0 0 42 0 0 0 0 52 0 0 0 1654 2080 80%
Vacant ES 0 0 0 0 312 0 0 42 0 0 0 0 166 0 0 0 1664 2080 80% Shaun Rohrer 0 0 208 0 312 0 0 42 0 0 0 0 52 0 0 0 1695 2080 81% Rachel Pisor 0 0 0 0 312 0 0 104 0 0 0 0 52 832 0 0 1716 2080 83% Water Quality Special Studies Ted Swift 0 0 0 0 104 0 0 42 0 0 0 0 52 0 0 0 1654 2080 80% Mark Bettencourt 0 0 0 0 208 0 0 42 0 0 0 0 52 0 0 0 1758 2080 85%
Non‐MWQP Staff O&M Daniel Wisheropp 0 0 0 0 0 0 1248 0 0 0 0 0 0 0 0 0 2080 2080 100%
OCO Bryant, James, & Reza 0 0 0 0 0 0 0 0 0 0 0 0 0 0 0 0 2080 2080 100%
BDO Siqing Liu, Bob Suits, Hari 0 0 0 0 0 0 0 0 0 0 0 0 0 0 0 0 2080 2080 100%
Total Hours 208 104 208 104 2600 1560 1248 499 0 0 104 62 562 1664 0 0 26719
31200 86%
1 PY = 2080hours/Year, PY's from PY sheet 0.100 0.050 0.100 0.050
1.250 0.750
0.600 0.240 0.000 0.000
0.050
0.030 0.270 0.800 0.000
0.000
12.845
15.000 86%

4
Explanation of Table 1 Program Element Costs for FY13-14 Work Plan Projects
Specific Tasks to be Implemented using SWPCA Funds
The SWPCA will provide funding to provide technical support on program tasks associated
with the MWQI Program:
Program Element 6.1.1 MWQI Real Time Stations
$32,500 allocated, if needed, for real time station and special study equipment and/or
rental needs
Program Element 6.3.1 RTDF Data Dissemination & Reporting
Consultant to provide technical expertise on the RTDF-CP Program up to $13,000.
Program Element 6.3.2 Administration and Database Activities
Consultant to provide technical and managerial expertise with RTDF-CP administration,
database activities, and data management support up to $70,000.
Program Element 7.2 Limnology of SWP
Consultant will act as the Project Manager to provide technical and managerial
expertise for the Limnology of SWP Study up to $40,000.
Program Element 7.7 Spectrofluorometry Study
Consultant to provide technical expertise on the MWQI Spectrofluorometry Study up to
$2,000.
Program Element 8.1 Administration Work/Training/TEC/MWQI
$1,500 allocated for staff travel costs for conferences, subject to approval by DWR
management staff.
Program Element 9 Program Management/Status Reporting
Consultant to administer SWPCA managed fund and serve as a liaison between MWQI
and the SWP Urban Water Contractors up to $75,000. The SWPCA-MWQI Consultant
will provide technical and managerial expertise on program tasks associated with the

5
MWQI Program. The consultant serves as a member of the MWQI-TAC, administers
the SWPCA fund, and serves as a liaison between SWPCA and the MWQI Program.
Program Management expenses including SWC staff services, legal, administration
expenses, and Annual Meeting costs up to $9,100.
Program Element 11 Unassigned Funds
Consultant to develop artificial neural network model, up to $95,000.
MWQI contracts required for FY13-14 Work Plan Elements
The MWQI Program maintains a planned budget of $8,250 to cover the total expenses of the
following contracts:
1. The contract has been extended with the San Luis Delta Mendota Water Authority
that covers the cost of phone service at the Jones Pumping Plant where MWQI
maintains a RTDF water quality station. The service is necessary for safety reasons
since staff may be working for extended periods of time in the lower level of this
working plan where their cell phones may not have service, and in case of
emergency staff would need access to a working landline phone.
2. The MWQI Program maintains the contract with Area Restroom services that
provides a portable toilet at the Hood RTDF WQ Station. This service is necessary
since staff may be on-site for extended periods of time while calibrating the
instruments and there are no other similar facilities in the local vicinity.
MWQI Operating Equipment and Expenses using the MWQI Program’s Planned
Budgeted Funds
Program Element 5.1 Grab Samples Collections
$205,000, of which $105,000 is allotted for bi-weekly contract lab analyses, $90,000 for
the van replacement, and the remaining $10,000 allocated for equipment and supplies
related to the discrete monitoring program.

6
Program Element 6.1.1: MWQI Real Time Stations
$134,328 allocated for the purchase of replacement filters, miscellaneous station
supplies, and analyzer specific components and service agreements.
Program Element 6.1.2: Gianelli WQ station
$40,000 allocated for the purchase of replacement filters, miscellaneous station
supplies, and analyzer specific components and service agreements.
Program Element 7.4: FDOM Proof of Concept Study
$500 allocated for the purchase of quantitative standards for instrument calibrations.
Program Element 8.1: Administration Work
$30,000 allocated for training classes, registration fees, travel related expense, and the
cost for the annual or offsite meetings. The Annual Meeting costs may include rental
fees for a facility, AV equipment and technical assistance, refreshments, deposit for
reserving dates and other miscellaneous meeting package elements. This budget
covers the additional training expenses for new staff and promoted staff in the MWQI
Program.
Program Element 8.3: O&M WQ Other Duties
$500 allocated for the purchase of quantitative standards for instrument calibrations.
Program Element 8.7: Workplace Safety
$2,000 allocated for the purchase of miscellaneous safety equipment for example,
vehicle fire extinguishers and first aid kits, personal flotation devices, earplugs, safety
glasses, etc.
Program Element 11. Other Required Program Costs
$3,000 allocated for the expenses incurred if the DWR Project Services Office staff
review any MWQI project reports prior to publication. Recall that as of July 1, 2013 the
Project Services Office will no longer be covered by overhead expenses and will begin
charging their document review services.
7
$1,000 allocated for the expenses associated with insurance and fuel for the MWQI
Program’s field support sampling vehicles. Currently the Field Support Section has four
vehicles in its service fleet, two vans and two trucks that are necessary to maintain the
MWQI Program’s continuous monitoring and support to various special studies.
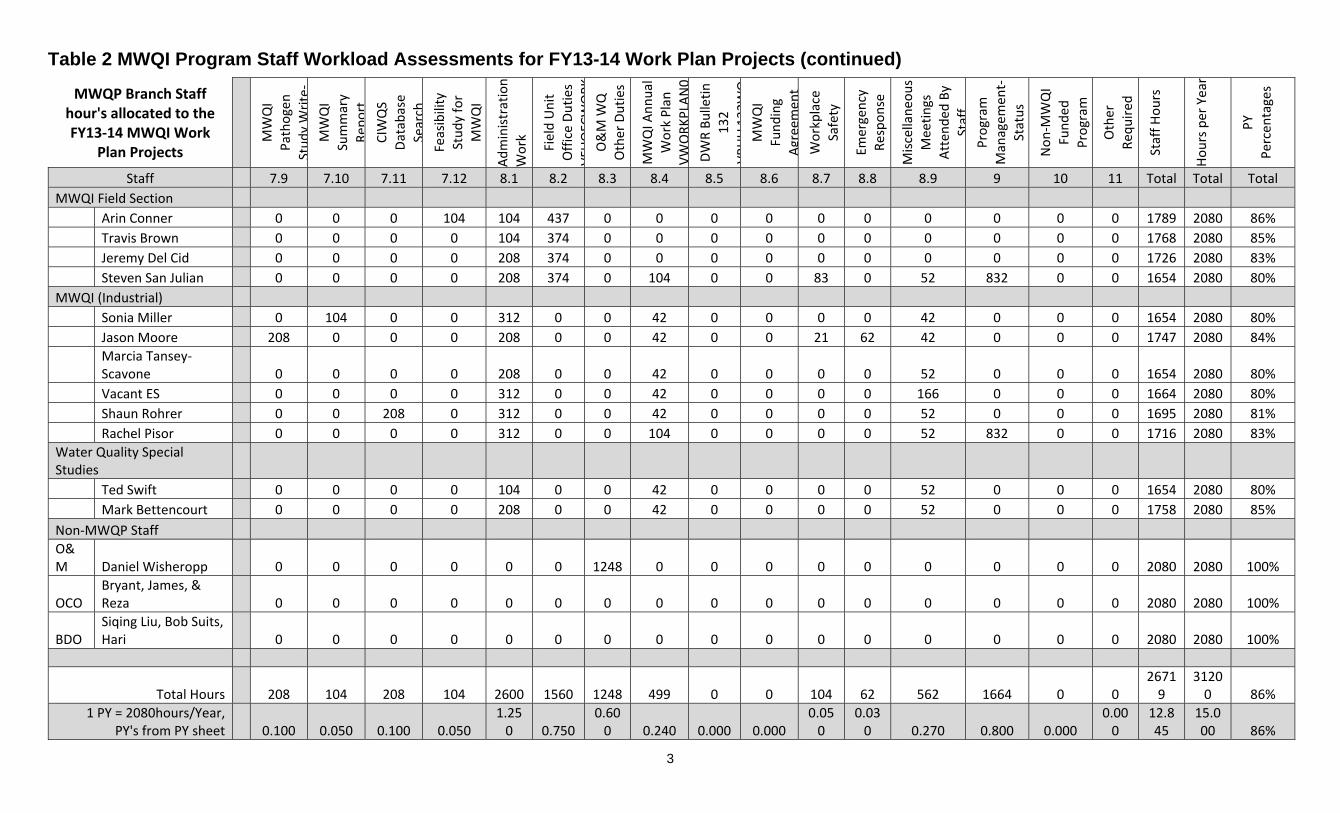
Further explanation of the table 2 MWQI Program Staff Workload Assessments for FY13-
14 Work Plan Projects:
The MWQI Program’s staff workload assessments have gone through several revisions since
their inception in late 2012. The original staff workload assessment was conducted in
December 2012 to gain an understanding of how much time staff members were spending on
their current assignments and special study projects. The second staff workload assessment
was conducted in early 2013 to gain an understanding of how much time staff had for any new
assignments or special study projects. The most recent workload assessment is a refinement
of both previous staff workload assessments and is included as Table 2 of this FY13-14 MWQI
Work Plan. The Table 2 staff workload assessment includes all 15 staff members that make
up the MWQI Program including its program partners in the Division of Operations and
Maintenance, Operations Control Office, and the Bay Delta Office.
Table 2 includes both labor hours and the PY’s (1 Person Year = 2080 hours/year), per project
as listed in this work plan cycle including totals and percentages, and coincides with the PY’s
shown in Table 1. A target of 80% of the PY percentages is due to the fact that 2080
hours/year includes time-off for annual leave, vacations, sick leave, holidays, and furlough
days, and on-average a staff member is usually out-of- the-office approximately 20% per year.
The project partner managers planned 1 PY knowing that their staff would only be using about
0.6PY of their time this work plan cycle which adds additional flexibility to the plan. As staff’s
projects progress to completion and if furloughs are not extended through this work plan cycle,
this plan may require adjustments.
8
Appendix 2. Real-Time Data and Forecasting Comprehensive Program (RTDF-CP): Overview and
Evolution MWQI Program Background
In the early 1960’s, the U.S. Public Health Service published drinking water criteria that
consisted of only a few water quality parameters. These criteria remained largely unchanged
for years, as the conventional wisdom of the day held that treatment of surface waters by
filtration, and natural filtering of ground water by soils, along with disinfection, rendered these
supplies safe for drinking. In the 1970’s, improvements in scientific measurement techniques
led to discovery of trihalomethanes (THMs) in U.S. drinking waters. Subsequent investigation
indicated a possible link with increased incidence of cancer among exposed populations. In
1979, the Environmental Protection Agency established a drinking water standard of 100
micrograms per liter for THMs.
In anticipation of the new regulation, the Department of Water Resources (DWR) undertook a
three-month investigation of organic carbon and bromide sources in Delta drinking water
supplies. This study resulted in a preliminary finding that discharges from wastewater
treatment plants and drainage from land surfaces contained elevated concentrations of organic
carbon precursors of THMs, and that bromide was present in the system in concentrations
sufficient to create bromine-containing THMs in treated drinking water. This finding led to the
formation of a panel of recognized independent water quality and health scientists who were
asked to evaluate information and make recommendations for further action as needed.
The panel report, published in 1981, found that most Delta water quality data then in existence
was produced in support of ecological, rather than human health, concerns. The panel
recommended institution of a monitoring program for constituents of human health
significance, namely THM precursors, sodium, and synthetic organic pollutants such as
pesticides. In 1982, DWR implemented the Interagency Delta Health Monitoring Program
(IDHAMP) in satisfaction of the panel’s recommendations. The IDHAMP was created as an
interagency effort, and its successor remains so today. Participants have included the U.S.
Bureau of Reclamation, City of Stockton, City of Sacramento, Contra Costa Water District, and
9
California Department of Health Services, along with State Water contractor (SWC) agencies
that purvey drinking water.
Early information from the IDHAMP indicated drainage from Delta island peat soils is rich in
organic carbon, therefore a separate study; the Delta Island Drainage Investigation (DIDI) was
instituted. The DIDI was established to develop detailed information on the nature of this
carbon source and to identify potential means of mitigating its impact on Delta drinking water
supplies.
Meanwhile, advancements in analytical methodology continued, and as these were applied to
environmental analysis, new Delta water quality concerns emerged. Among these were the
presence of dichloro-diphenyl-trichloroethane (DDT) and polychlorinated biphenyl (PCB) in
fish and sediments, selenium pollution in the San Joaquin River watershed, arsenic in the
watersheds of the Delta and the State Water Project (SWP), pesticide pollution by molinate
and thiobencarb (rice herbicides) and diazinon (insecticide), and waterborne pathogenic
protozoa (Giardia, Cryptosporidium) that resist disinfection. Advancements in the analytical
sciences have also led to discovery of previously unidentified disinfection by-products in
drinking water supplies. Scientific data on all these and other potential water quality challenges
were collected through the IDHAMP Program.
As scientific discoveries were made, there was a greater appreciation of the need for water
quality information upon which to base management decisions affecting Delta water supplies.
Accordingly, in 1985, the SWC requested DWR to propose a broad-based program that would
provide information on known and emerging threats to drinking water quality. In 1986, DWR
responded by implementing the Municipal Water Quality Investigations (MWQI) Program, that
unified the IDHAMP and DIDI programs. The MWQI Program was founded on the principle that
water quality concerns will continue to evolve as scientific understanding progresses, and that
the program must be flexible and proactive in order to address the new water quality
challenges that will continually arise.
In search of practical means of eliminating or mitigating sources of undesirable constituents,
the MWQI Program has supported numerous scientific investigations into underlying
mechanisms of pollution. Years of monitoring effort have established a high quality, long-term
base of data documenting the drinking water quality status of the Delta, and the phenomena
10
that cause changes in Delta water quality. MWQI has also mobilized to monitor sudden events,
such as the June 2004 Jones Tract levee breach, with subsequent analysis providing guidance
for policy decisions. Data from the program have been, and continue to be used extensively in
water quality and water supply studies and planning. The continually evolving integration of
MWQI’s data with forecasting and information dissemination tools have made possible a future
in which we will be able to not only better understand the consequences of changes that occur
in the Delta and SWP, but also to anticipate, communicate and, in some measure, control
water quality conditions. The MWQI program is focused towards this future.
The Real-time Data Forecasting Comprehensive Program Background
MWQI water quality assessments concentrated on periodic collection of discrete (“grab”)
samples followed by their laboratory analysis and retrospective data interpretation. The early
years of the program were primarily devoted to surveying the status of THM precursors and
other water quality constituents and identifying their sources. Information derived from this
work was used for water supply planning. Today, new technology allows remote, near
continuous monitoring of water quality parameters such as organic carbon, bromide and other
ions, along with instantaneous transmission of the data. Remote monitoring of organic carbon
began at the Hood station in February, 1999, followed by the Banks station in October 2001
and the Vernalis station in January 2005. The first RTDF Water Quality Weekly Report was
sent out by email in January 2004. An EC forecast for Banks Pumping Plant was added to the
report in July 2004.
With these advances, the MWQI Program and the SWC realized that the tools were available
to coordinate real-time data acquisition and water quality forecasting via modeling to provide
water agencies and municipal operators with the information needed to make operational
decisions based on imminent changes in water quality.
Up to this point, model information products were simply borrowed from other purposes.
However, there was a lack of a coordination mechanism between organizations to fully realize
this potential. On June 7 and 8, 2006, representatives from SWC agencies who are
participants of the MWQI Program, DWR management and staff, and select outside agencies,
met to discuss the concept of a RTDF-CP. The meeting focused on identifying the required
11
program elements, possible collaboration and the resource sharing opportunities that would
allow the RTDF-CP to become reality. It was determined that if MWQI and the SWC were to
effectively harness the tools to improve the efficiency of water project operations while
protecting and improving drinking water quality, then the RTDF-CP must address the following
considerations:
The Delta and SWP must be more thoroughly instrumented to assure that real-time
water quality data are available at all critical locations.
A forecasting system must be created that was capable of producing water quality
simulations and providing early warning and notification on a daily production basis
using the existing SWP water quality forecasting model. Primarily, this would entail
developing the software mechanisms to efficiently provide the necessary input data to
the model, and produce a report output suitable for easy use by water managers.
Improvement in the coordination among DWR and SWC organizations to enable
smooth information flow and timely, appropriate action.
To address these needs the RTDF-CP was developed by the MWQI Program. A five-year
strategic plan was developed to guide the RTDF-CP (see Appendix 5 for a copy of the 5 year
strategic plan). The objectives of the 5-year strategic plan included:
Coordinate and collaborate MWQP activities with those of other DWR Divisions under
the RTDF-CP to enhance productivity, minimize duplication and overlap, and ensure
effective coordination and communication to enable joint implementation of water quality
assessment and forecasting activities affecting the Delta and SWP.
Develop and refine a SWP Early Warning System that will alert MWQP participants of
drinking water quality issues in a timely manner to enable preventative or corrective
actions. Components of the 5 year strategic plan that support this effort include:
o Water quality monitoring,
o Information Management and Dissemination,
o Water Quality Forecasting,
o Scientific Support, and
o Emergency Response
12
As envisioned, water quality sensors in the Delta tributaries (mainly Sacramento and San
Joaquin rivers) provide early warning of elevated concentrations of organic carbon, bromide,
turbidity, algal growth, and other water quality constituents of concern to drinking water
purveyors. Movement and concentrations of these constituents would be predicted using
computer forecasting models, and their actual movements tracked through other monitoring
stations in the Delta. The RTDF-CP would alert water operations managers of the conditions
enabling them to make operations decisions designed to mitigate water quality problems while
maintaining water deliveries. Agencies using the Delta as a source of drinking water would be
notified and status of the situation communicated on an ongoing basis. If elevated
concentrations of constituents entered the SWP system, they could be tracked using computer
forecasting and perhaps remote sensing tools, and drinking water agencies along the system
could be notified when and in what concentrations the constituents were expected to appear at
their intakes. Drinking water purveyors could alert water treatment plant managers who, in
turn, would prepare for chemical addition or other process changes as warranted. Drinking
water agencies would provide feedback to SWP operators and water quality managers to
enable the full consequences of operations decisions to be understood, and this information
would be acted upon to improve the early warning and operational control processes.
The geographic scope of the MWQI Program has historically been confined to the Delta,
guided by the sources of constituents of concern. However, the scope of real-time monitoring
and forecasting effort must, by necessity, encompass the watersheds of the Delta, the SWP,
and portions of the federal Central Valley Project that are interconnected to the Delta and
SWP. Implementing many of the RTDF-CP goals required coordination with staff outside of the
MWQI program. Within DWR, several units have expertise and responsibilities that are
necessary to operate an extensive real-time early warning and response system, including:
Division of Environmental Services (Office of Water Quality, MWQI Program, Environmental
Real-time Monitoring and Support), Division of Operations and Maintenance (SWP
Environmental Assessment Branch, Operations Control Office, SWP Field Divisions), and Bay
Delta Office (Delta Modeling Section). Therefore, in 2006, the SWC began working with the
Department to create additional staff positions needed to ensure that the goals of the RTDF-
CP were accomplished. In FY 2007-08 seven new positions were created within the
Department and were filled by February 2008. The FY 2008-09 work plan represented the first
13
year where all RTDF-CP positions were filled and priority tasks associated with the RTDF-CP
could be fully addressed. Currently, task coordination and oversight are being provided by an
RTDF Steering Committee with participation from each involved contractor of the SWP and
DWR staff members from the various participating groups.
A major, but necessary, challenge has been to develop mechanisms to integrate and
coordinate among DWR programs and other agencies to achieve effective communications,
standardized information formats, provide continued funding for positions in the Bay Delta
Office (BDO) and Operations and Control Office (OCO) for modeling and forecasting activities,
and periodically review and update programs to meet needs. The DWR Office of Water Quality
was established in recognition of the need for greater linkage among existing DWR water
quality programs. Expansion of the Real-time Data and Forecasting program is an example of
the need and provides a mechanism to realize this coordination and integration. However, to
further ensure a robust real-time water quality data and forecasting capability, long-term
management commitment and funding from DWR and the SWC is essential. Eventually the
RTDF-CP will need to reside organizationally where the integration of functions and resources
can be best realized.
Today the MWQI RTDF-CP Program entails the following elements:
1. Coordination and collaboration between DWR monitoring and forecasting groups.
2. Real-time data acquisition for the Delta and SWP through remote, high-frequency
monitoring.
3. Enhancement of forecasting and fingerprinting of drinking water quality through use
of computer models.
4. Centralized information management and dissemination.
5. Scientific support studies.
6. Emergency response preparedness as related to drinking water quality.
7. Coordination and collaboration within DWR and with outside agencies to enhance
real-time monitoring activities.
Besides the water quality monitoring, forecasting and data dissemination that makes up the
basic components of a real-time early warning system, scientific special studies and
14
emergency response elements are also necessary for an early warning system. In the case of
special studies, the information collected and knowledge gained are an integral part of the real-
time data collection and forecasting. Special studies are conducted to investigate the origins,
fate and transport, and in some cases, loads of current and emerging contaminants of
concern. Such studies help to determine where new instruments should be located or guide
model improvement. Special studies may also investigate seasonal patterns and trends of
constituents or examine contaminant circulation patterns. These studies can also be used to
refine modeling assumptions and design. Special studies can also assess the impacts of
increasing urbanization on levels of water quality constituents of concern. In addition, ensuring
that Departmental emergency response mechanisms include consideration of drinking water
constituents is vital to an early warning system. A mechanism that can quickly notify water
purveyors and operators of emergency spills and analytes that aren’t modeled or analyzed in
real-time will always be necessary.
The RTDF-CP consists of three interacting and complementary activities, often characterized
as the three legs of a tripod: Real-time Water Quality Monitoring, Water Quality Forecasting,
and Information Management and Dissemination. These three efforts are discussed below.
Current objectives for the Real-time Monitoring Program include:
Determining baseline concentrations of organic carbon, anions, nutrients and other
drinking water quality constituents in Delta and SWP waters.
Providing water quality data relevant to SWP contractors and other users of Delta water
supplies in a timely manner for decision making.
Providing water quality forecasts that assist SWP and other utilities in advanced
planning efforts to optimize management of their water supplies while meeting
increasingly stringent drinking water regulations.
Real-time Monitoring
Real-time monitoring or in-situ monitoring consists of high frequency (e.g., several
measurements per hour) of water quality and flow by remote, often unattended, equipment
installed in locations within the Delta, its tributaries, and the SWP. Communication equipment
transmits the resulting data to headquarters to be used shortly after measurements are made.
15
Real-time monitoring consists of two parts; a) field operations which ensure the operation and
maintenance of all automated sampling equipment, timely transmission of real-time data to
users and implementation and documentation of QA-QC of this data, and b) the synthesis of
real-time data from a variety of federal, State and local agency water quality monitoring
programs, rapid data quality control, analysis, and dissemination of results. These results are
currently provided as part of the RTDF-CP via electronic reports and the MWQP website.
Real-time results are used to: a) inform operational decisions affecting the Delta and SWP, b)
support development of water quality forecasting tools to help better manage SWP water
supplies, and c) for water quality and water supply planning studies. In addition to DWR and
the SWC, this information is used by many federal, state, and local agencies, and the public.
Today, real-time equipment is installed and maintained by MWQI at four critical Delta locations
(Hood, Vernalis, Banks PP and Jones PP). A fifth station was added near Gianelli Pumping
Plant in late 2011, providing carbon, anion, and other measurements in the channel between
Gianelli PP and O’Neill Forebay. As water management has become more complex due to
health regulations, environmental restrictions on water operations, and other factors, it has
become necessary to manage the Delta and SWP with increasing precision and knowledge.
This new water quality sensing technology offers a tool for better and quicker “tuning” of water
operations. High frequency real-time water quality data from multiple remote locations also
provides the needed information to develop and populate computer tools for fingerprinting and
forecasting drinking water quality conditions in the Delta and SWP.
Within the RTDF-CP, real-time monitoring activities receive technical advice and guidance
from the RTDF Steering Committee, a group of technical experts composed of staff from
participating agencies. The RTDF Steering Committee serves as a subcommittee of the MWQI
Technical Advisory Committee (TAC), to which the Steering Committee reports.
Water Quality Forecasting
Although water quality monitoring enables a snapshot of current and past water quality
conditions, and may aid understanding of the underlying causes, it is generally inadequate to
forecast and assess the water quality effects of future, or proposed, changes in the Delta and
SWP. To enable future conditions to be forecasted and analyzed, the forecasting component
16
of the RTDF-CP uses monitoring data in conjunction with mathematical modeling techniques to
develop and refine forecast data products. These efforts include providing feedback to better
tailor water quality monitoring to modeling needs and to maximize the use of modeling results
by water quality managers.
Models in use include DWR’s Delta Simulation Model (DSM2) and the DSM2- Extension model
(Aqueduct model). The RTDF-CP is also sponsoring improvements to three WARMF
watershed models, which offer the potential of linking watershed hydrology to Delta tributary
inputs. The geographic domain of DSM2 has been extended beyond the legal Delta to include
Aqueduct model. This model includes the SWP California and South Bay Aqueducts and the
Federal Central Valley Project (CVP) Delta Mendota Canal (DMC). With these tools, water
quality consequences of Delta and SWP-CVP operations can be forecasted, with the objective
of incorporating this information into water operations decisions for the export facilities as well
as downstream purveyor’s facilities. The models are being used to produce water quality
forecasts on short-term (three-week) and seasonal (calendar year), as well as source water
fingerprints for water volume, EC and organic carbon.
To achieve the tasks associated with modeling and forecasting requires the continued
collaboration between the various DWR groups within the RTDF-CP. These groups include the
MWQI Program, O&M’s OCO Delta Compliance and Modeling Section, and the Bay Delta
Office’s Delta Modeling Section. The MWQI Program collaborates with the OCO and the BDO
to accomplish forecasting tasks by developing data for simulation of historical condition and
WARMF model development for the Delta and Aqueduct water quality models. This involves
assembling, synthesizing, and refining the flows, EC, DOC, and bromide data necessary to
define boundary conditions and simulate historical conditions. These groups meet monthly in
the RTDF Steering Committee meeting and communicate as needed by phone and email.
The multiple development tasks involved in the WARMF, DSM2, and Aqueduct models are
tracked using a sophisticated MS Project Gantt chart and summary task complete table. The
production of the Gantt chart involves monthly updates of projects accomplishment to reach
our goals. Each project has numerous predecessors, and depending on the accomplishment of
these predecessors, the Gantt chart recalculates the schedule and the dates so we can see
the effect of each one of the projects on the final goal. The Gantt chart generates a visual
17
report that builds a diagram and presents a concise report for the project management (Figure
1).
The Steering Committee also provides coordination with other efforts that have the potential for
improving model accuracy. These include a study to develop improved regression
relationships between EC and dissolved ions of interest such as bromide, chloride, and others.
RTDF Information Management and Dissemination
The information management and dissemination component of the RTDF-CP integrates and
delivers results of the real-time monitoring, fingerprinting and forecasting elements of RTDF-
CP to a wide audience of water users, scientists, and the general public. This is generally
accomplished through water quality reports distributed via the RTDF web site and an E-mail
subscription list to staff of agencies participating in the MWQI Program and to other interested
parties. Both current and archived reports are available on the MWQI website. However, as
additional needs arise that require real-time data and forecasting tools, this information will
also be disseminated to stakeholders through e-mail, reports, and meetings. The goals of this
program element are:
To continue to provide meaningful and easy-to-use real-time water quality data and
forecasting information to stakeholders and utilities for source water management
decisions;
To continue to develop a program for acquisition, storage, assessment, and transfer of
water quality data and processed information in a near-real-time mode;
To provide continuous, real-time postings of relevant hydrologic data, sensor data,
operations, and water quality forecasts to stakeholders and utilities via the Internet in a
“user friendly” format; and
To continue to refine the format of real-time information based on stakeholder and utility
needs.
Within this component, there are information management and data dissemination tasks
associated with grab sample data and with real-time data. Grab sample data –collected by the
18
MWQI programs are stored in the California Water Data Library (WDL) which includes data
from DWR programs beyond MWQI. Real-time data from MWQI’s RTDF monitoring stations
are stored on a MWQI server and posted on DWR’s California Data Exchange Center (CDEC)
and the RTDF web site. There are plans to post quality-controlled results of the real-time data
to the WDL, as well.
The database management associated with this component has gone through several
evolutionary steps. These have tended towards greater information content while reducing the
amount of manual attention needed from MWQI staff. Initially the data management system
was an MS Access database used to generate weekly reports. The RTDF program’s organic
carbon data were combined with data retrieved from the California Data Exchange Center
(CDEC) to produce the reports. MWQI staff then reviewed the data for accuracy, and
summarized the data in graphical and text forms in the weekly reports. In FY 2007-08, the data
management system was replaced by a database platform that automatically received data
from real-time stations and/or CDEC as necessary. The latest phase of data management links
the database with the Internet using automated graph and data table generation and
presentation on a daily-updated web page, and automated email summaries. Plans are in
place to develop an “on demand” capacity for users to query RTDF data such as TOC, DOC,
EC, anions, and other water quality parameters from the WDL.
Changes and improvements to the data dissemination effort are decided upon by the RTDF
Steering Committee. This committee provides advice and recommendations on the
appearance, format, and function of web pages, reports and related media that provide access
to the information produced through the project.

19
Figure 1. RTDF Gantt Chart
20
Appendix 3. Project Management Documentation Background
The purpose of this appendix is to provide additional information on new studies that were described
in the work plan. To keep the work plan clear and concise, only short summary descriptions and
tables of deliverables and due dates were provided in the 2013-2014 work plan. This appendix
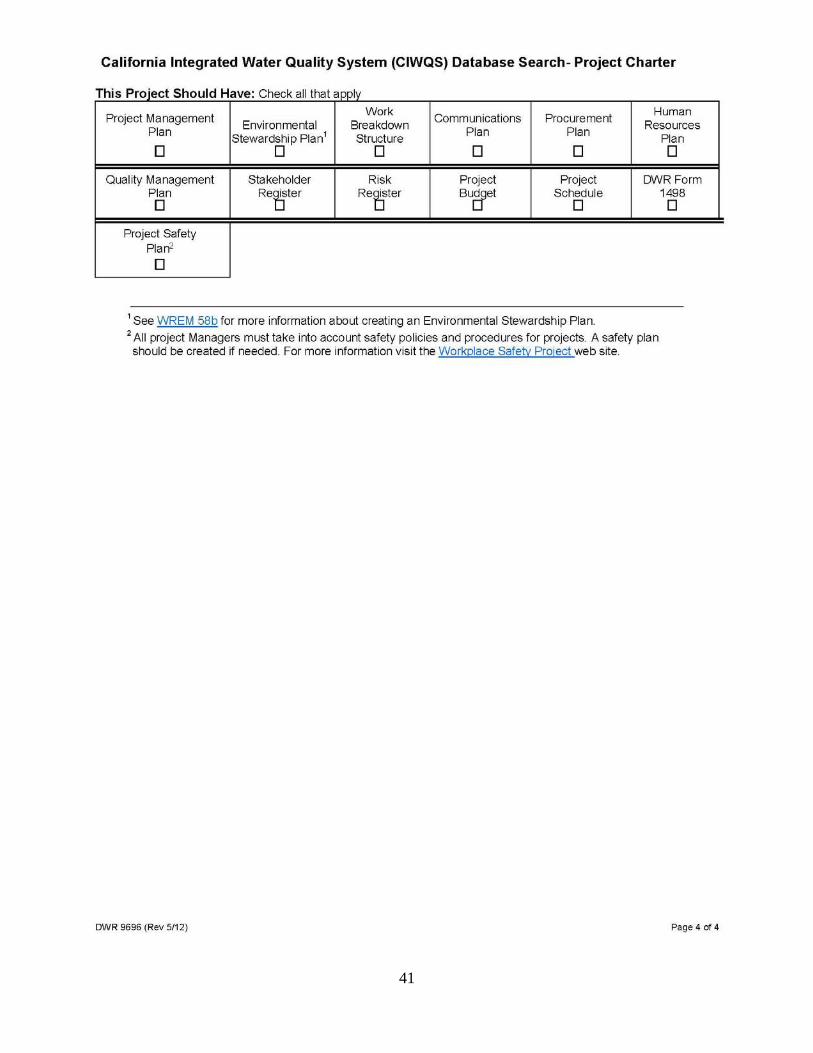
contains the full project charters for the studies that appear in the work plan. Additionally, this work
plan marks the beginning of using the Project Management body of Knowledge (PMBOK) standard of
developing projects.
The PMBOK standard of designing and implementing projects is the method that DWR is now using,
and MWQI lead staff will be adapting for new studies. PMBOK includes processes for initiating,
planning, executing, monitoring and controlling, and closing out a project. Each stage of project
development incorporates the elements of project integration, management, scope, time, cost,
quality, resources, communication, risk, procurement, and stakeholder management. Utilizing the
PMBOK standard will enable staff to effectively manage projects while efficiently producing
deliverables within scope, schedule, and budget.
Previously, ideas for new studies used straw-man proposals that were submitted by MWQI staff and
SWPCA members. These proposals were a general outline of the study idea, how the study met the
needs of the MWQI mission, what resources and timeline the study would require, and the outcome
or data gap that the study would fill. After these study ideas were approved by the MWQI Technical
Advisory committee (TAC), the details of the study would be investigated and the study would be
incorporated into the MWQI Work plan. Although the approval process for studies being incorporated
into the Work plan remains the same, the format in which studies are proposed, developed,
implemented and completed will change.
The new process for developing studies begins with project initiation forms, which are replacing the
“straw man” proposals. These forms are shared and discussed with the TAC to determine if the study
meets all of the MWQI objectives, and if there is available staff time and resources. Studies that meet
the requirements will be included in the new Work plan. For studies that have a simpler study design,
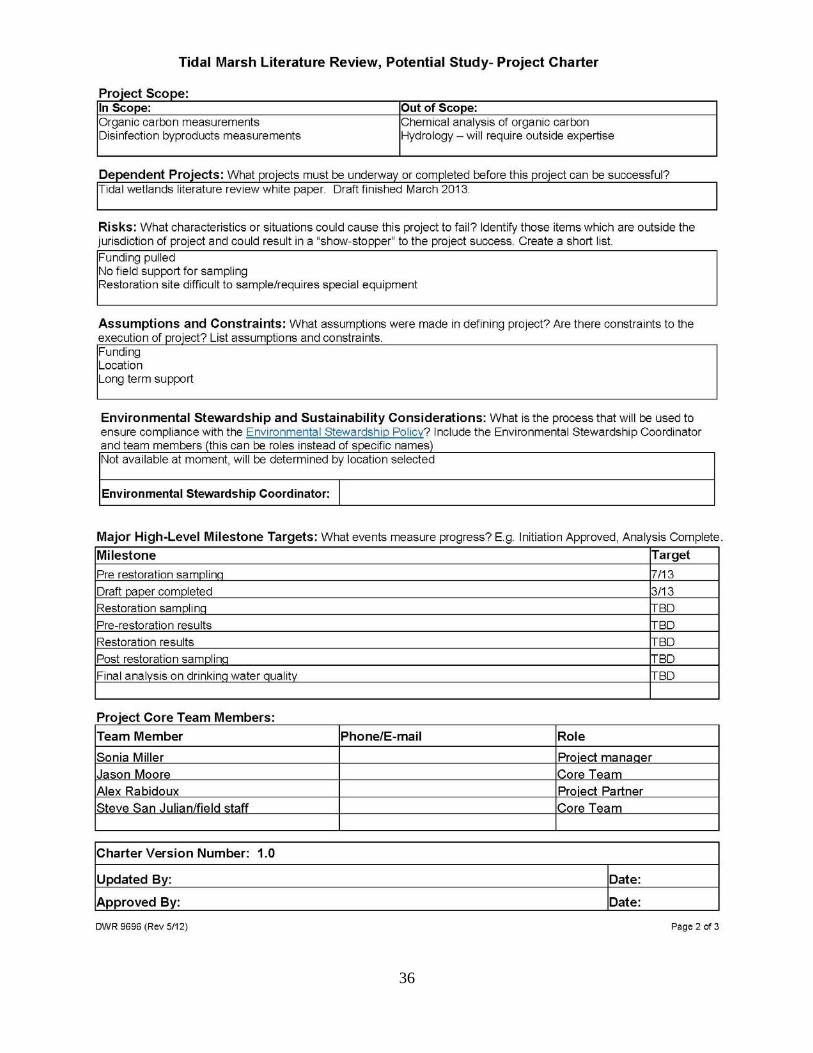
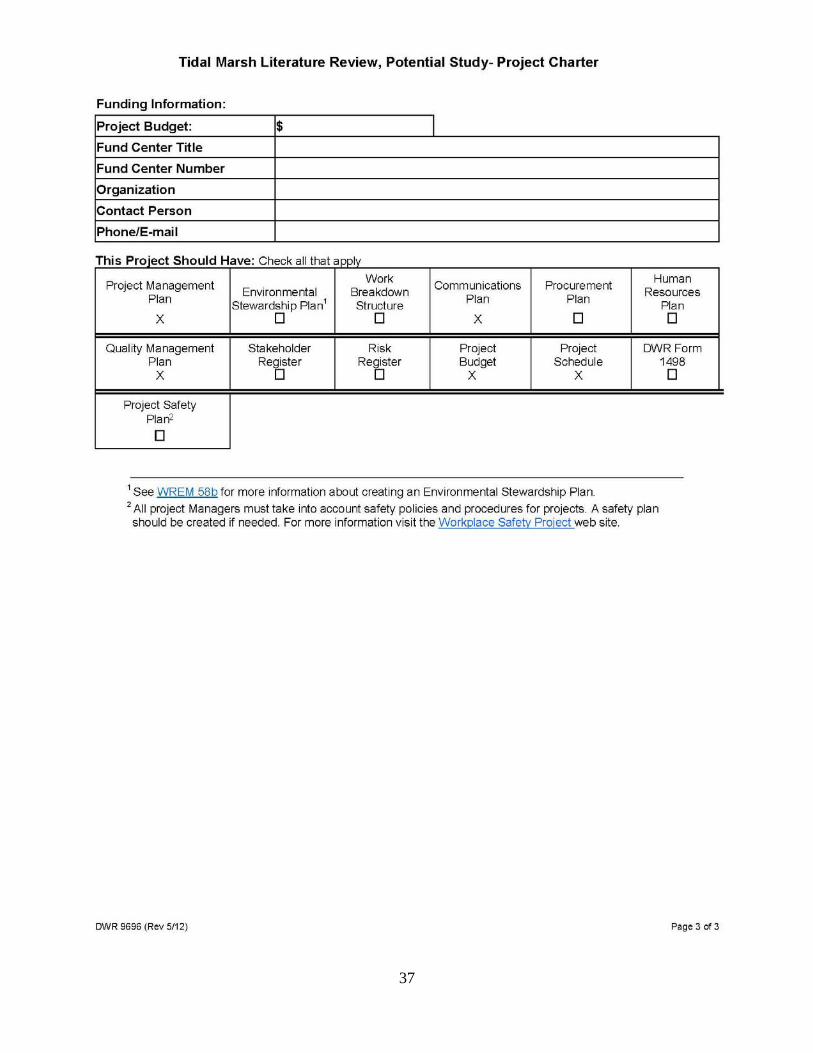
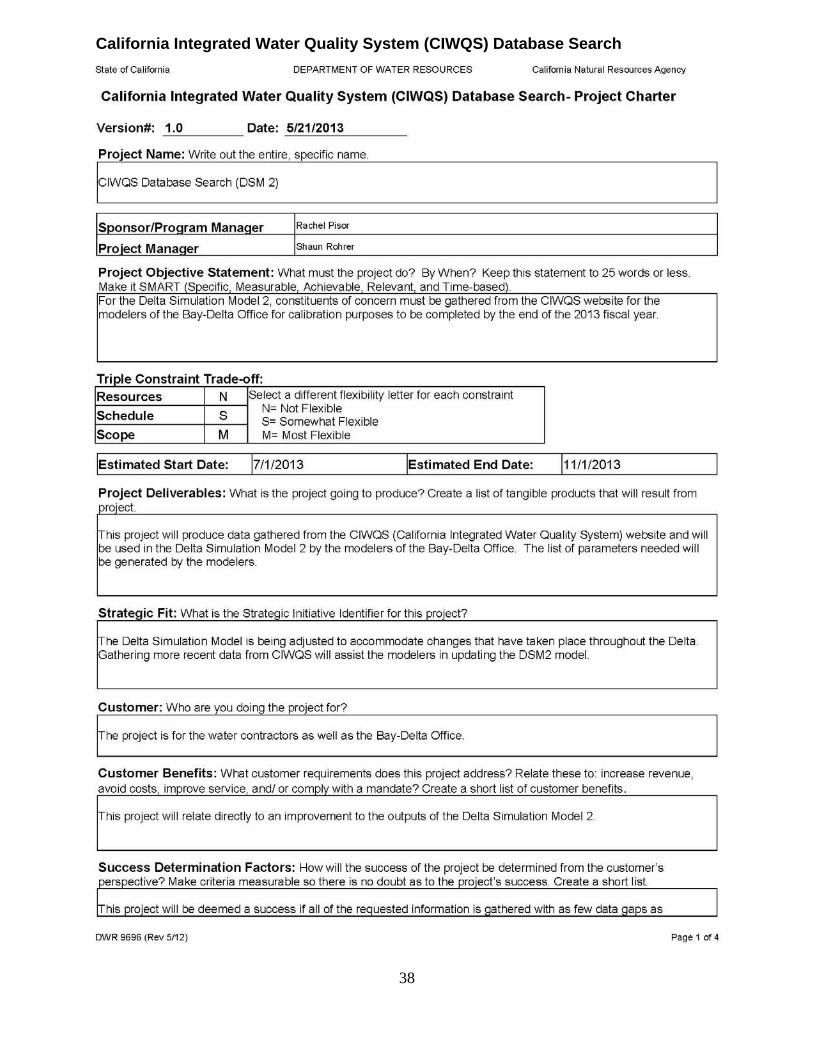
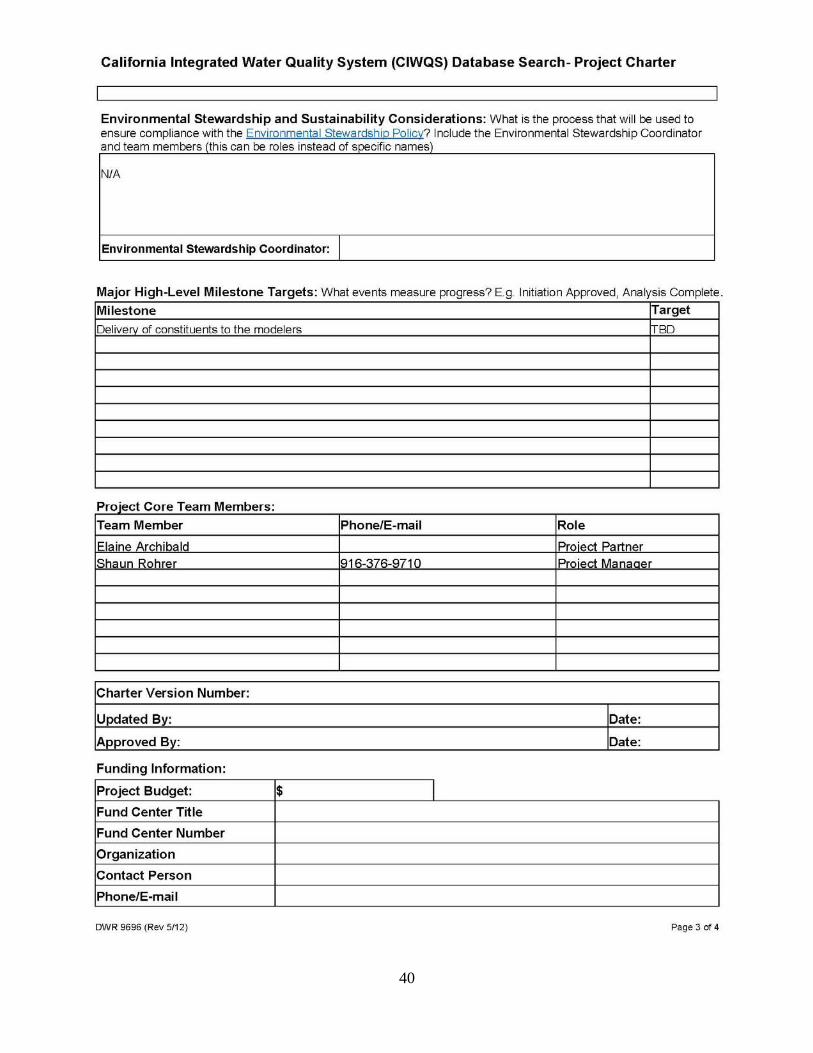
project charters will be created. The project charter is a document that clarifies the reason for the
project, the project’s background, its scope, risks, assumptions and constraints, milestones, core
team members, and budget. In cases where the project plan is not yet fully developed and that will
require significant time to develop the study plan, a project initiation form will be included instead.

21
Studies that are ongoing from prior Work plans will not include project initiation forms or project
charters. These projects will not be included in this appendix.
For continuity between this appendix and the Work plan, the sections of this appendix are broken
down by Work plan section. The project management documents for this Work plan fall into
“Program Elements Water Quality Assessment” and “Science Support (Special Studies)”. The
initiation forms and charters are in the same order as those studies appear in the Work Plan.
22
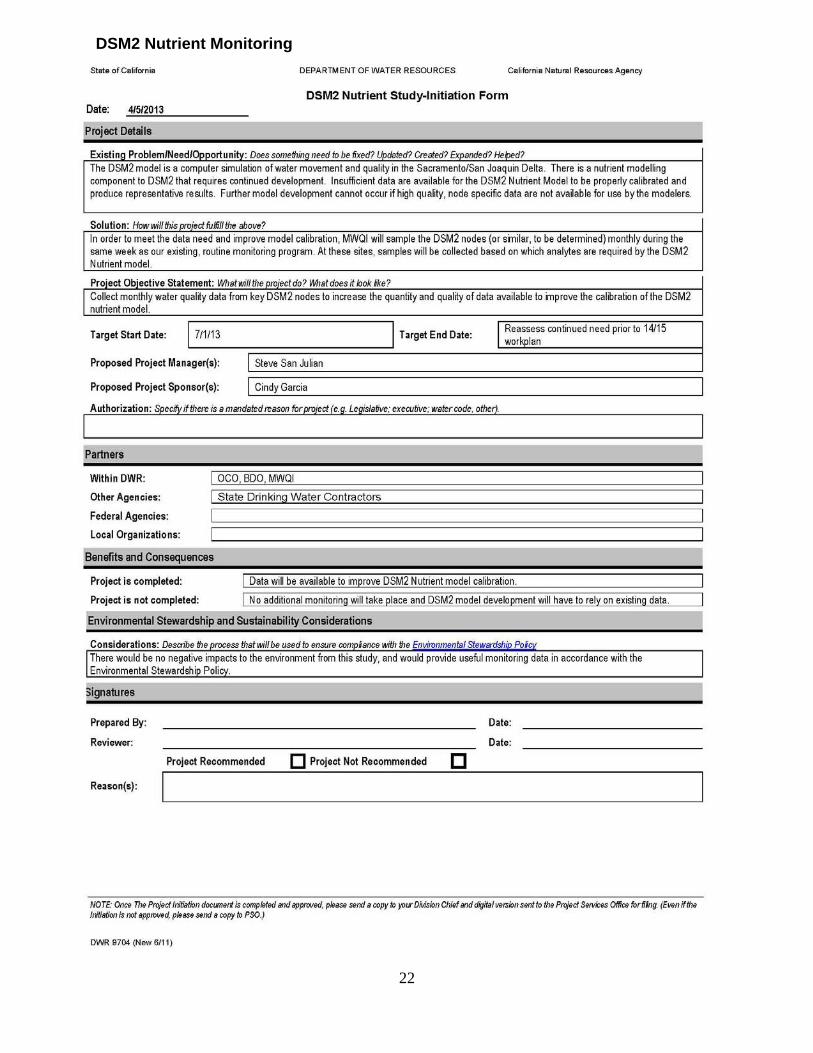
DSM2 Nutrient Monitoring

23
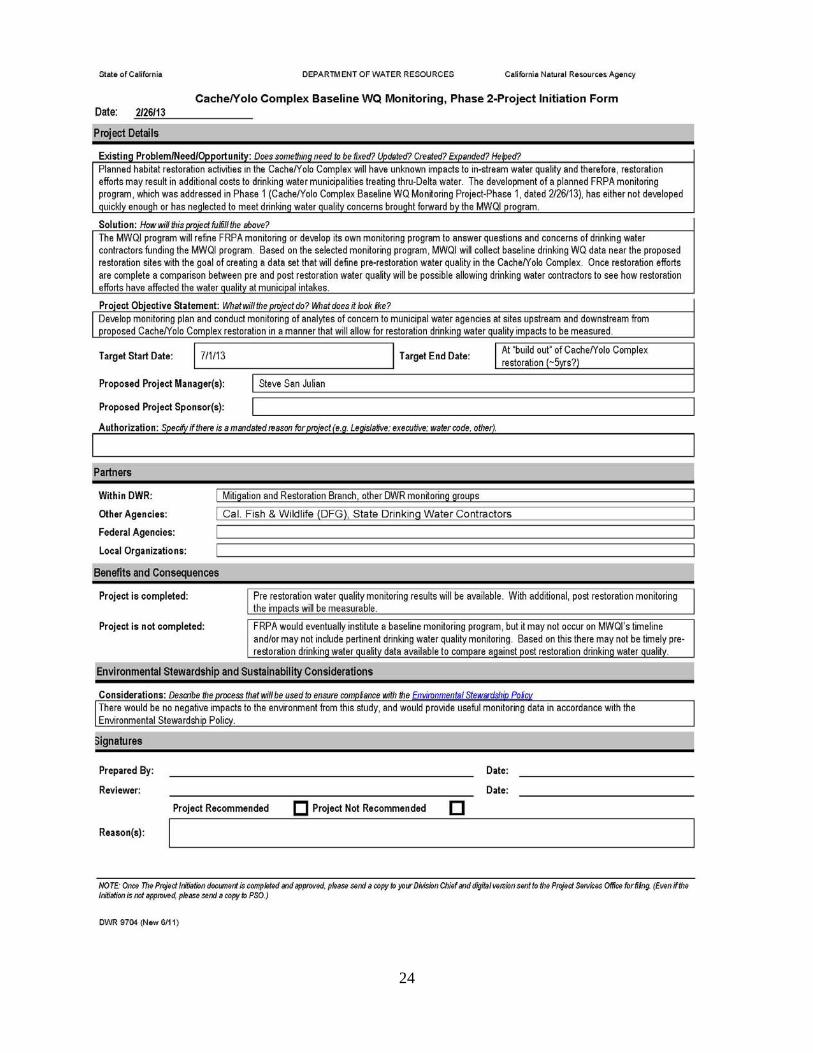
Cache/Yolo Complex Pre-Restoration Baseline Monitoring
24
25
Science Support (Special Studies)
Nutrient Budget Study
26
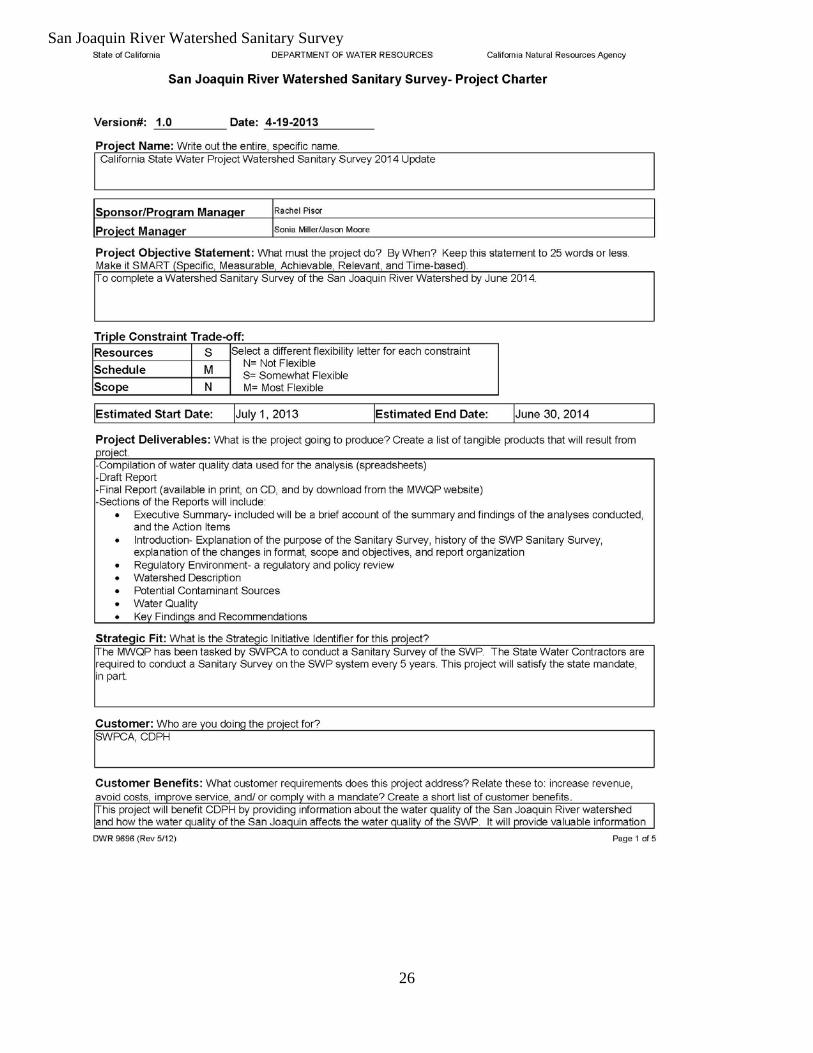
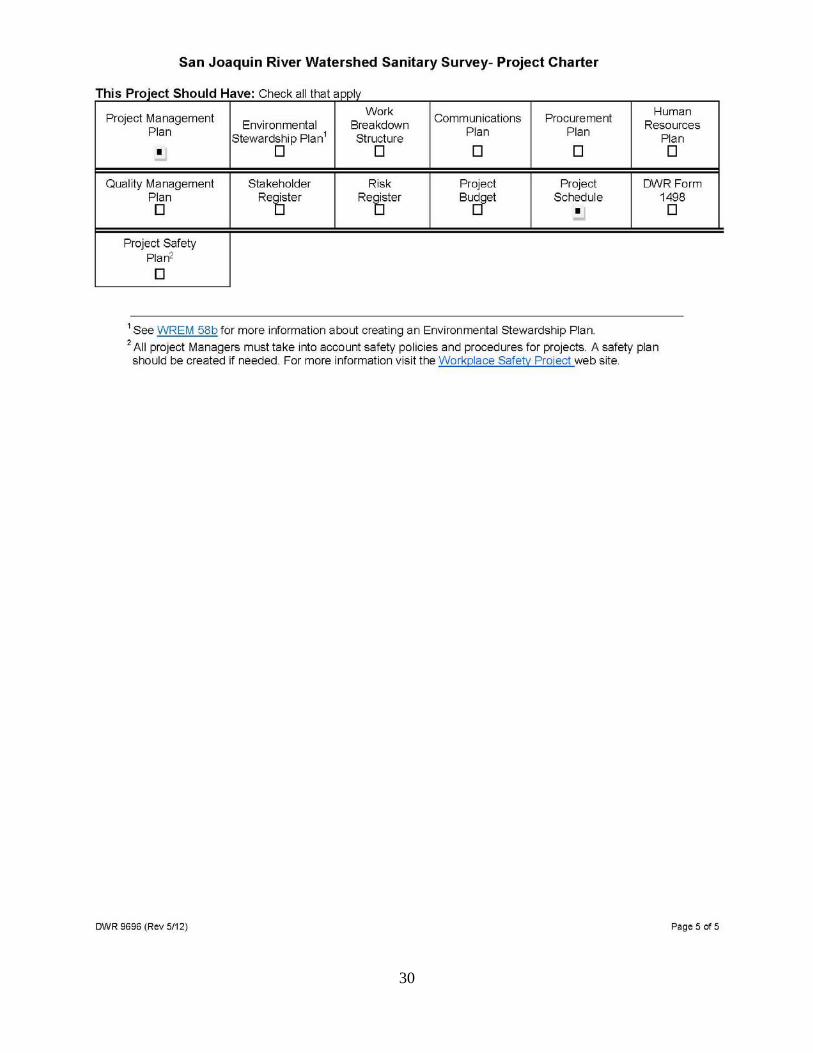
San Joaquin River Watershed Sanitary Survey
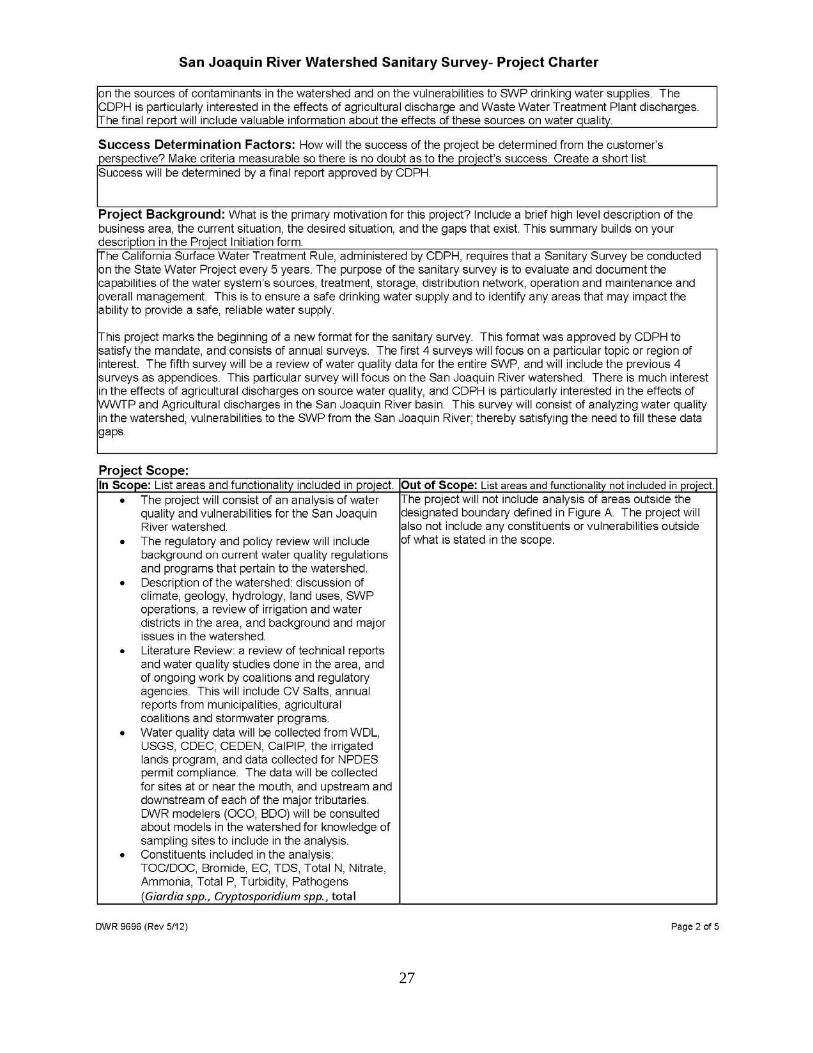
27

28

29
30
31
FDOM Proof of Concept
32

33
34
35
Tidal Marsh Restoration Literature Review-Potential Study
36
37
38
California Integrated Water Quality System (CIWQS) Database Search

39
40
41
42
Appendix 4. Sampling Sites
FY13/14
Sampling Sites and Corresponding Analyses for Municipal Water Quality Investigations
(SSCA)
Revised 6/21/13
Division of Environmental Services
Municipal Water Quality Investigations
Field Section
43
Special Study Monitoring Schedule for 2013/14 and beyond
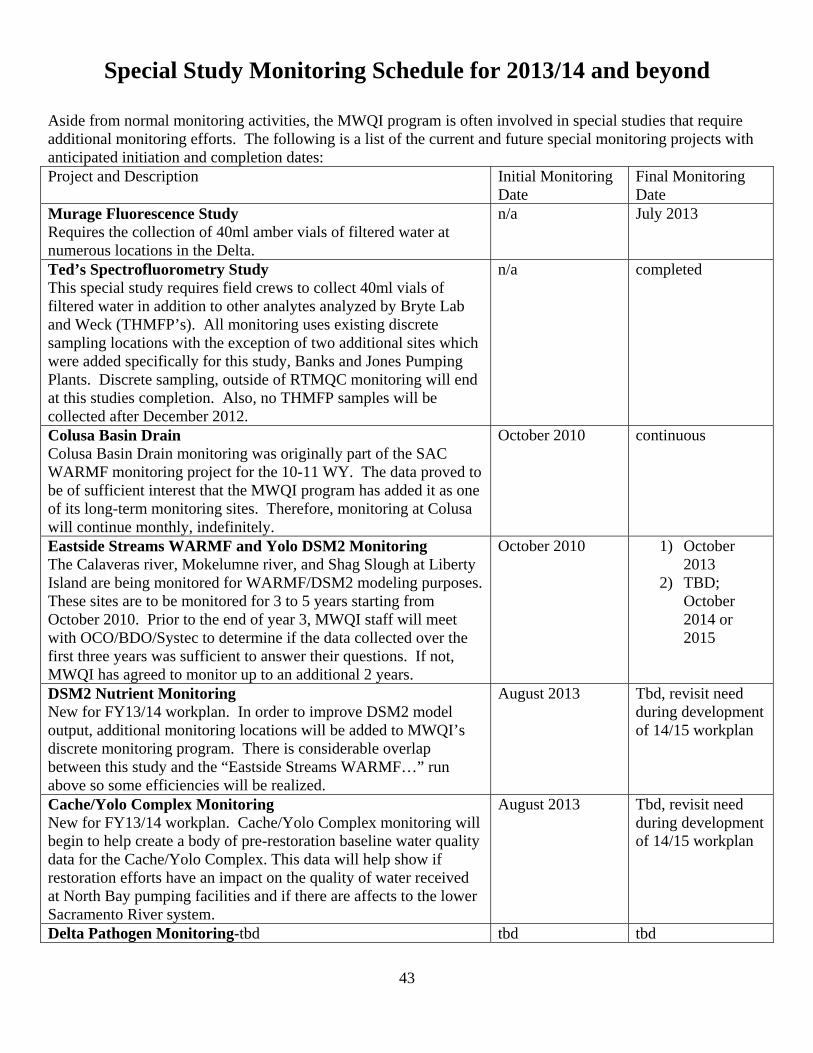
Aside from normal monitoring activities, the MWQI program is often involved in special studies that require additional monitoring efforts. The following is a list of the current and future special monitoring projects with anticipated initiation and completion dates: Project and Description Initial Monitoring
Date Final Monitoring Date
Murage Fluorescence Study Requires the collection of 40ml amber vials of filtered water at numerous locations in the Delta.
n/a July 2013
Ted’s Spectrofluorometry Study This special study requires field crews to collect 40ml vials of filtered water in addition to other analytes analyzed by Bryte Lab and Weck (THMFP’s). All monitoring uses existing discrete sampling locations with the exception of two additional sites which were added specifically for this study, Banks and Jones Pumping Plants. Discrete sampling, outside of RTMQC monitoring will end at this studies completion. Also, no THMFP samples will be collected after December 2012.
n/a completed
Colusa Basin Drain Colusa Basin Drain monitoring was originally part of the SAC WARMF monitoring project for the 10-11 WY. The data proved to be of sufficient interest that the MWQI program has added it as one of its long-term monitoring sites. Therefore, monitoring at Colusa will continue monthly, indefinitely.
October 2010 continuous
Eastside Streams WARMF and Yolo DSM2 Monitoring The Calaveras river, Mokelumne river, and Shag Slough at Liberty Island are being monitored for WARMF/DSM2 modeling purposes. These sites are to be monitored for 3 to 5 years starting from October 2010. Prior to the end of year 3, MWQI staff will meet with OCO/BDO/Systec to determine if the data collected over the first three years was sufficient to answer their questions. If not, MWQI has agreed to monitor up to an additional 2 years.
October 2010 1) October 2013
2) TBD; October 2014 or 2015
DSM2 Nutrient Monitoring New for FY13/14 workplan. In order to improve DSM2 model output, additional monitoring locations will be added to MWQI’s discrete monitoring program. There is considerable overlap between this study and the “Eastside Streams WARMF…” run above so some efficiencies will be realized.
August 2013 Tbd, revisit need during development of 14/15 workplan
Cache/Yolo Complex Monitoring New for FY13/14 workplan. Cache/Yolo Complex monitoring will begin to help create a body of pre-restoration baseline water quality data for the Cache/Yolo Complex. This data will help show if restoration efforts have an impact on the quality of water received at North Bay pumping facilities and if there are affects to the lower Sacramento River system.
August 2013 Tbd, revisit need during development of 14/15 workplan
Delta Pathogen Monitoring-tbd tbd tbd
44
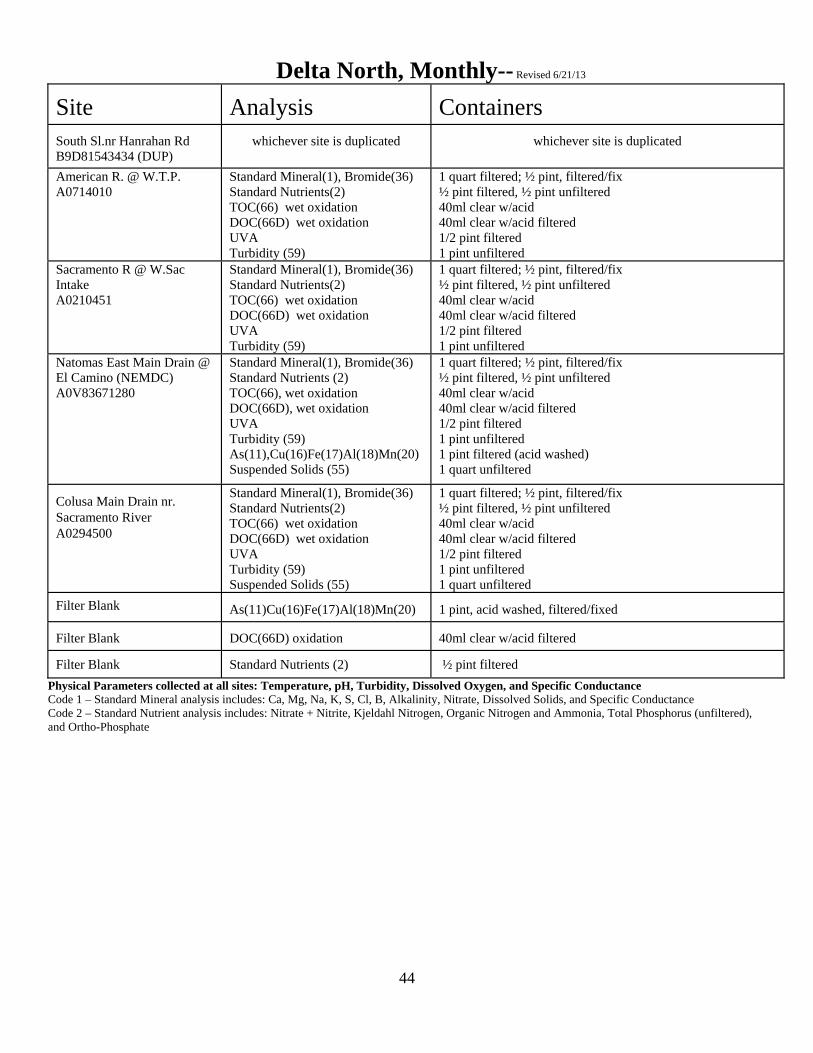
Delta North, Monthly-- Revised 6/21/13
Site Analysis Containers
South Sl.nr Hanrahan Rd B9D81543434 (DUP)
whichever site is duplicated whichever site is duplicated
American R. @ W.T.P. A0714010
Standard Mineral(1), Bromide(36) Standard Nutrients(2) TOC(66) wet oxidation DOC(66D) wet oxidation UVA Turbidity (59)
1 quart filtered; ½ pint, filtered/fix ½ pint filtered, ½ pint unfiltered 40ml clear w/acid 40ml clear w/acid filtered 1/2 pint filtered 1 pint unfiltered
Sacramento R @ W.Sac Intake A0210451
Standard Mineral(1), Bromide(36) Standard Nutrients(2) TOC(66) wet oxidation DOC(66D) wet oxidation UVA Turbidity (59)
1 quart filtered; ½ pint, filtered/fix ½ pint filtered, ½ pint unfiltered 40ml clear w/acid 40ml clear w/acid filtered 1/2 pint filtered 1 pint unfiltered
Natomas East Main Drain @ El Camino (NEMDC) A0V83671280
Standard Mineral(1), Bromide(36) Standard Nutrients (2) TOC(66), wet oxidation DOC(66D), wet oxidation UVA Turbidity (59) As(11),Cu(16)Fe(17)Al(18)Mn(20) Suspended Solids (55)
1 quart filtered; ½ pint, filtered/fix ½ pint filtered, ½ pint unfiltered 40ml clear w/acid 40ml clear w/acid filtered 1/2 pint filtered 1 pint unfiltered 1 pint filtered (acid washed) 1 quart unfiltered
Colusa Main Drain nr. Sacramento River A0294500
Standard Mineral(1), Bromide(36) Standard Nutrients(2) TOC(66) wet oxidation DOC(66D) wet oxidation UVA Turbidity (59) Suspended Solids (55)
1 quart filtered; ½ pint, filtered/fix ½ pint filtered, ½ pint unfiltered 40ml clear w/acid 40ml clear w/acid filtered 1/2 pint filtered 1 pint unfiltered 1 quart unfiltered
Filter Blank As(11)Cu(16)Fe(17)Al(18)Mn(20) 1 pint, acid washed, filtered/fixed
Filter Blank DOC(66D) oxidation 40ml clear w/acid filtered
Filter Blank Standard Nutrients (2) ½ pint filtered
Physical Parameters collected at all sites: Temperature, pH, Turbidity, Dissolved Oxygen, and Specific Conductance Code 1 – Standard Mineral analysis includes: Ca, Mg, Na, K, S, Cl, B, Alkalinity, Nitrate, Dissolved Solids, and Specific Conductance Code 2 – Standard Nutrient analysis includes: Nitrate + Nitrite, Kjeldahl Nitrogen, Organic Nitrogen and Ammonia, Total Phosphorus (unfiltered), and Ortho-Phosphate
45
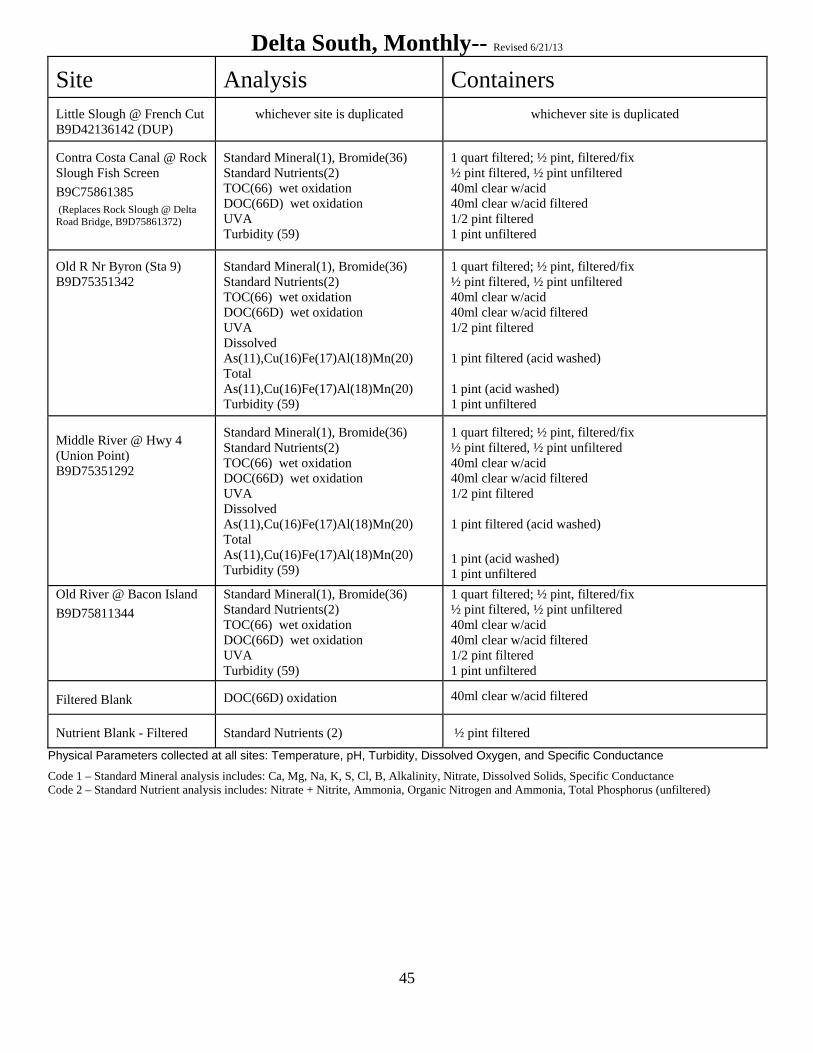
Delta South, Monthly-- Revised 6/21/13 Site
Analysis Containers
Little Slough @ French Cut B9D42136142 (DUP)
whichever site is duplicated whichever site is duplicated
Contra Costa Canal @ Rock Slough Fish Screen
B9C75861385 (Replaces Rock Slough @ Delta Road Bridge, B9D75861372)
Standard Mineral(1), Bromide(36) Standard Nutrients(2) TOC(66) wet oxidation DOC(66D) wet oxidation UVA Turbidity (59)
1 quart filtered; ½ pint, filtered/fix ½ pint filtered, ½ pint unfiltered 40ml clear w/acid 40ml clear w/acid filtered 1/2 pint filtered 1 pint unfiltered
Old R Nr Byron (Sta 9) B9D75351342
Standard Mineral(1), Bromide(36) Standard Nutrients(2) TOC(66) wet oxidation DOC(66D) wet oxidation UVA Dissolved As(11),Cu(16)Fe(17)Al(18)Mn(20) Total As(11),Cu(16)Fe(17)Al(18)Mn(20) Turbidity (59)
1 quart filtered; ½ pint, filtered/fix ½ pint filtered, ½ pint unfiltered 40ml clear w/acid 40ml clear w/acid filtered 1/2 pint filtered 1 pint filtered (acid washed) 1 pint (acid washed) 1 pint unfiltered
Middle River @ Hwy 4 (Union Point) B9D75351292
Standard Mineral(1), Bromide(36) Standard Nutrients(2) TOC(66) wet oxidation DOC(66D) wet oxidation UVA Dissolved As(11),Cu(16)Fe(17)Al(18)Mn(20) Total As(11),Cu(16)Fe(17)Al(18)Mn(20) Turbidity (59)
1 quart filtered; ½ pint, filtered/fix ½ pint filtered, ½ pint unfiltered 40ml clear w/acid 40ml clear w/acid filtered 1/2 pint filtered 1 pint filtered (acid washed)
1 pint (acid washed) 1 pint unfiltered
Old River @ Bacon Island
B9D75811344
Standard Mineral(1), Bromide(36) Standard Nutrients(2) TOC(66) wet oxidation DOC(66D) wet oxidation UVA Turbidity (59)
1 quart filtered; ½ pint, filtered/fix ½ pint filtered, ½ pint unfiltered 40ml clear w/acid 40ml clear w/acid filtered 1/2 pint filtered 1 pint unfiltered
Filtered Blank DOC(66D) oxidation 40ml clear w/acid filtered
Nutrient Blank - Filtered
Standard Nutrients (2) ½ pint filtered
Physical Parameters collected at all sites: Temperature, pH, Turbidity, Dissolved Oxygen, and Specific Conductance
Code 1 – Standard Mineral analysis includes: Ca, Mg, Na, K, S, Cl, B, Alkalinity, Nitrate, Dissolved Solids, Specific Conductance Code 2 – Standard Nutrient analysis includes: Nitrate + Nitrite, Ammonia, Organic Nitrogen and Ammonia, Total Phosphorus (unfiltered)

46
I5 Corridor, Bi-Weekly-- Revised 6/21/13 Site
Analysis Containers
Johnson Sl. @ Robinson B9D75732454 (DUP)
whichever site is duplicated whichever site is duplicated
Calaveras River @ UOP footbridge B9D75851188
Standard Mineral(1), Bromide(36) Standard Nutrients(2) TOC(66) wet oxidation DOC(66D) wet oxidation UVA Turbidity (59) Suspended Solids (55) Chlorophyll CBOD (to contract lab) BOD (to contract lab)
1 quart filtered; ½ pint, filtered/fix ½ pint filtered, ½ pint unfiltered 40ml clear w/acid 40ml clear w/acid filtered 1/2 pint filtered 1 pint unfiltered 1 quart unfiltered 1 glass fiber filter in envelope
Cosumnes River @ Franklin Blvd? Standard Mineral(1) Standard Nutrients(2) Chlorophyll CBOD (to contract lab) BOD (to contract lab)
1 quart filtered; ½ pint, filtered/fix ½ pint filtered, ½ pint unfiltered 1 glass fiber filter in envelope
North Fork Mokelumne River @ Wimpy's Marina B9D81371295 (this site might be changing to an upstream site above the confluence with the Cosumnes)
Standard Mineral(1), Bromide(36) Standard Nutrients(2) TOC(66) DOC(66D) UVA Turbidity (59) Suspended Solids (55) Chlorophyll CBOD (to contract lab) BOD (to contract lab)
1 quart filtered; ½ pint, filtered/fix ½ pint filtered, ½ pint unfiltered 40ml clear w/acid 40ml clear w/acid filtered 1/2 pint filtered 1 pint unfiltered 1 quart unfiltered 1 glass fiber filter in envelope
San Joaquin River @ Vernalis B0702000
Standard Mineral(1), Bromide(36) Standard Nutrients(2) TOC(66) DOC(66D) UVA Turbidity (59) Chlorophyll Dissolved As(11),Cu(16)Fe(17)Al(18)Mn(20) Total As(11),Cu(16)Fe(17)Al(18)Mn(20) CBOD (to contract lab) BOD (to contract lab)
1 quart filtered; ½ pint, filtered/fix ½ pint filtered, ½ pint unfiltered 40ml clear w/acid 40ml clear w/acid filtered 1/2 pint filtered 1 pint unfiltered 1 glass fiber filter in envelope 1 pint filtered (acid washed) 1 pint (acid washed)
Sacramento River @ Miller Park Standard Mineral(1) Standard Nutrients(2) Chlorophyll CBOD (to contract lab) BOD (to contract lab)
1 quart filtered; ½ pint, filtered/fix ½ pint filtered, ½ pint unfiltered 1 glass fiber filter in envelope
Filtered Blank DOC(66D) oxidation 40ml Clear w/acid, filtered Nutrient Blank - Filtered
Standard Nutrients (2) ½ pint filtered
Physical Parameters collected at all sites: Temperature, pH, Turbidity, Dissolved Oxygen, and Specific Conductance
Code 1 – Standard Mineral analysis includes: Ca, Mg, Na, K, S, Cl, B, Alkalinity, Nitrate, Dissolved Solids, and Specific Conductance Code 2 – Standard Nutrient analysis includes: Nitrate + Nitrite, Kjeldahl Nitrogen, Organic Nitrogen and Ammonia, Total Phosphorus (unfiltered), and Ortho-Phosphate Chlorophyll – Chlorophyll a and Pheophytin a
47
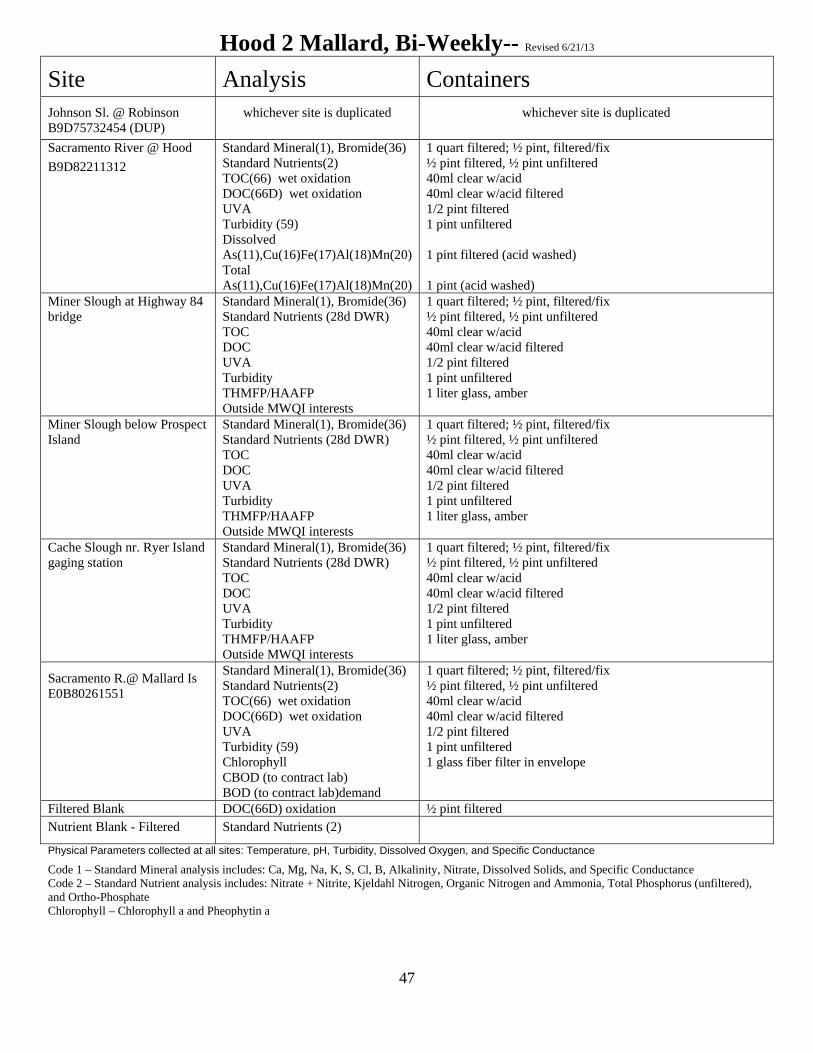
Hood 2 Mallard, Bi-Weekly-- Revised 6/21/13 Site
Analysis Containers
Johnson Sl. @ Robinson B9D75732454 (DUP)
whichever site is duplicated whichever site is duplicated
Sacramento River @ Hood
B9D82211312
Standard Mineral(1), Bromide(36) Standard Nutrients(2) TOC(66) wet oxidation DOC(66D) wet oxidation UVA Turbidity (59) Dissolved As(11),Cu(16)Fe(17)Al(18)Mn(20) Total As(11),Cu(16)Fe(17)Al(18)Mn(20)
1 quart filtered; ½ pint, filtered/fix ½ pint filtered, ½ pint unfiltered 40ml clear w/acid 40ml clear w/acid filtered 1/2 pint filtered 1 pint unfiltered 1 pint filtered (acid washed) 1 pint (acid washed)
Miner Slough at Highway 84 bridge
Standard Mineral(1), Bromide(36) Standard Nutrients (28d DWR) TOC DOC UVA Turbidity THMFP/HAAFP Outside MWQI interests
1 quart filtered; ½ pint, filtered/fix ½ pint filtered, ½ pint unfiltered 40ml clear w/acid 40ml clear w/acid filtered 1/2 pint filtered 1 pint unfiltered 1 liter glass, amber
Miner Slough below Prospect Island
Standard Mineral(1), Bromide(36) Standard Nutrients (28d DWR) TOC DOC UVA Turbidity THMFP/HAAFP Outside MWQI interests
1 quart filtered; ½ pint, filtered/fix ½ pint filtered, ½ pint unfiltered 40ml clear w/acid 40ml clear w/acid filtered 1/2 pint filtered 1 pint unfiltered 1 liter glass, amber
Cache Slough nr. Ryer Island gaging station
Standard Mineral(1), Bromide(36) Standard Nutrients (28d DWR) TOC DOC UVA Turbidity THMFP/HAAFP Outside MWQI interests
1 quart filtered; ½ pint, filtered/fix ½ pint filtered, ½ pint unfiltered 40ml clear w/acid 40ml clear w/acid filtered 1/2 pint filtered 1 pint unfiltered 1 liter glass, amber
Sacramento R.@ Mallard Is E0B80261551
Standard Mineral(1), Bromide(36) Standard Nutrients(2) TOC(66) wet oxidation DOC(66D) wet oxidation UVA Turbidity (59) Chlorophyll CBOD (to contract lab) BOD (to contract lab)demand
1 quart filtered; ½ pint, filtered/fix ½ pint filtered, ½ pint unfiltered 40ml clear w/acid 40ml clear w/acid filtered 1/2 pint filtered 1 pint unfiltered 1 glass fiber filter in envelope
Filtered Blank DOC(66D) oxidation ½ pint filtered Nutrient Blank - Filtered Standard Nutrients (2)
Physical Parameters collected at all sites: Temperature, pH, Turbidity, Dissolved Oxygen, and Specific Conductance
Code 1 – Standard Mineral analysis includes: Ca, Mg, Na, K, S, Cl, B, Alkalinity, Nitrate, Dissolved Solids, and Specific Conductance Code 2 – Standard Nutrient analysis includes: Nitrate + Nitrite, Kjeldahl Nitrogen, Organic Nitrogen and Ammonia, Total Phosphorus (unfiltered), and Ortho-Phosphate Chlorophyll – Chlorophyll a and Pheophytin a

48
Cache/Yolo Complex, Bi-Weekly—Revised 6/21/13 Site
Analysis Containers
Little Slough @ French Cut B9D42136142 (DUP)
whichever site is duplicated whichever site is duplicated
Shag Sl. @ LibertyIslBr
(west toe drain)
B9S81841416
Standard Mineral(1), Bromide(36) Standard Nutrients(2) TOC(66) DOC(66D) UVA Turbidity (59) Suspended Solids (55) Chlorophyll CBOD (to contract lab) BOD (to contract lab) THMFP/HAAFP (to contract lab)
1 quart filtered; ½ pint, filtered/fix ½ pint filtered, ½ pint unfiltered 40ml clear w/acid 40ml clear w/acid filtered 1/2 pint filtered 1 pint unfiltered 1 quart unfiltered 1 glass fiber filter in envelope
Lindsey Slough at Hastings Bridge
Standard Mineral(1), Bromide(36) Standard Nutrients (28d DWR Method) TOC DOC UVA Turbidity THMFP/HAAFP Outside MWQI interests
1 quart filtered; ½ pint, filtered/fix ½ pint filtered, ½ pint unfiltered 40ml clear w/acid 40ml clear w/acid filtered 1/2 pint filtered 1 pint unfiltered 1 liter glass, amber
Cache Slough at Ulatis Creek
Standard Mineral(1), Bromide(36) Standard Nutrients (28d DWR Method) TOC DOC UVA Turbidity THMFP/HAAFP Outside MWQI interests
1 quart filtered; ½ pint, filtered/fix ½ pint filtered, ½ pint unfiltered 40ml clear w/acid 40ml clear w/acid filtered 1/2 pint filtered 1 pint unfiltered 1 liter glass, amber
Sacramento Deep Water Channel (SDWC)
Standard Mineral(1), Bromide(36) Standard Nutrients (28d DWR Method) TOC DOC UVA Turbidity THMFP/HAAFP Outside MWQI interests
1 quart filtered; ½ pint, filtered/fix ½ pint filtered, ½ pint unfiltered 40ml clear w/acid 40ml clear w/acid filtered 1/2 pint filtered 1 pint unfiltered 1 liter glass, amber
Lisbon Weir (east toe drain) Standard Mineral(1), Bromide(36) Standard Nutrients (28d DWR Method) TOC DOC UVA Turbidity THMFP/HAAFP Outside MWQI interests
1 quart filtered; ½ pint, filtered/fix ½ pint filtered, ½ pint unfiltered 40ml clear w/acid 40ml clear w/acid filtered 1/2 pint filtered 1 pint unfiltered 1 liter glass, amber
Filtered Blank DOC(66D) oxidation 40ml clear w/acid filtered Nutrient Blank - Filtered
Standard Nutrients (2) ½ pint filtered
Physical Parameters collected at all sites: Temperature, pH, Turbidity, Dissolved Oxygen, and Specific Conductance
Code 1 – Standard Mineral analysis includes: Ca, Mg, Na, K, S, Cl, B, Alkalinity, Nitrate, Dissolved Solids, and Specific Conductance Code 2 – Standard Nutrient analysis includes: Nitrate + Nitrite, Kjeldahl Nitrogen, Organic Nitrogen and Ammonia, Total Phosphorus (unfiltered), and Ortho-Phosphate Chlorophyll – Chlorophyll a and Pheophytin a

49
Real Time Monitoring QC at Hood (Bi-Weekly)
Revised 10/10/2012
Sample Description Analysis Containers
Pre-maintenance Online TOC (66) Field DOC (66D) Field
None None
River Grab
TOC (66) Bryte Lab TOC (66) Field DOC (66D) Bryte Lab DOC (66D) Field
40 mL clear vial w/acid 40 mL amber vial, 60um filtered 40 mL clear vial w/acid, filtered 40 mL amber vial, filtered
Post-maintenance Online TOC (66) Field DOC (66D) Field
None None
CCV 5.0 mg/L Check Standard TOC (66) Field
40ml amber vial
Filter Blank DOC (66D) Bryte 40 ml clear vial w/acid
Three samples are manually analyzed on the Sievers field instrument on each run. These are the river grab samples, TOC and DOC; and the check standard. TOC and DOC Online values that precede maintenance are recorded as ‘Pre-Maintenance Online.’ The first set of post-maintenance, stable TOC and DOC data, are recorded as ‘Post-Maintenance Online.’ The results from all 7 are recorded on the field run data sheet. Physical Parameters collected at site: Turbidity
50
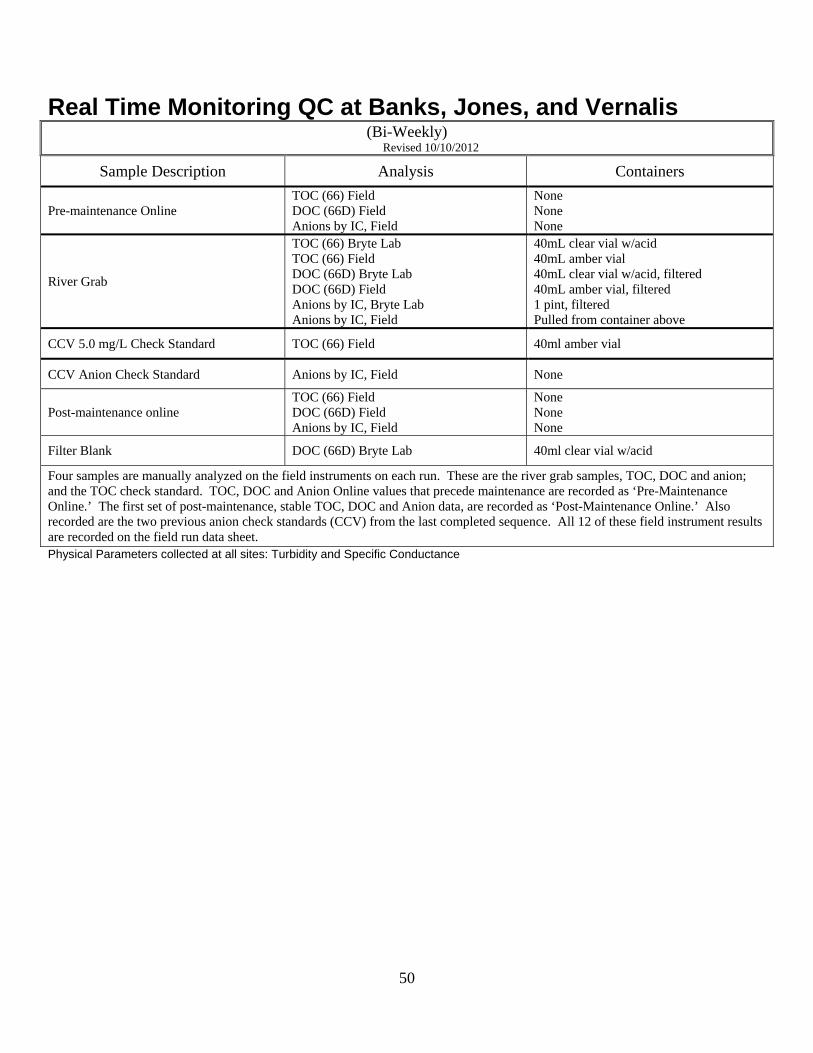
Real Time Monitoring QC at Banks, Jones, and Vernalis (Bi-Weekly)
Revised 10/10/2012
Sample Description Analysis Containers
Pre-maintenance Online TOC (66) Field DOC (66D) Field Anions by IC, Field
None None None
River Grab
TOC (66) Bryte Lab TOC (66) Field DOC (66D) Bryte Lab DOC (66D) Field Anions by IC, Bryte Lab Anions by IC, Field
40mL clear vial w/acid 40mL amber vial 40mL clear vial w/acid, filtered 40mL amber vial, filtered 1 pint, filtered Pulled from container above
CCV 5.0 mg/L Check Standard TOC (66) Field 40ml amber vial
CCV Anion Check Standard Anions by IC, Field None
Post-maintenance online TOC (66) Field DOC (66D) Field Anions by IC, Field
None None None
Filter Blank DOC (66D) Bryte Lab 40ml clear vial w/acid
Four samples are manually analyzed on the field instruments on each run. These are the river grab samples, TOC, DOC and anion; and the TOC check standard. TOC, DOC and Anion Online values that precede maintenance are recorded as ‘Pre-Maintenance Online.’ The first set of post-maintenance, stable TOC, DOC and Anion data, are recorded as ‘Post-Maintenance Online.’ Also recorded are the two previous anion check standards (CCV) from the last completed sequence. All 12 of these field instrument results are recorded on the field run data sheet. Physical Parameters collected at all sites: Turbidity and Specific Conductance

51
Real Time Monitoring QC at Gianelli (Bi-Weekly)
Revised 10/10/2012
Sample Description Analysis Containers
Pre-maintenance Online TOC (66) Field DOC (66D) Field Anions by IC, Field
None None None
River Grab
TOC (66) Bryte Lab TOC (66) Field DOC (66D) Bryte Lab DOC (66D) Field Anions by IC, Bryte Lab Anions by IC, Field
40mL clear vial w/acid 40mL amber vial 40mL clear vial w/acid, filtered 40mL amber vial, filtered 1 pint, filtered Pulled from container above
CCV 5.0 mg/L Check Standard TOC (66) Field 40ml amber vial
CCV Anion Check Standard Anions by IC, Field None
Post-maintenance online TOC (66) Field DOC (66D) Field Anions by IC, Field
None None None
Filter Blank DOC (66D) Bryte Lab 40ml clear vial w/acid
Four samples are manually analyzed on the field instruments on each run. These are the river grab samples, TOC, DOC and anion; and the TOC check standard. TOC, DOC and Anion Online values that precede maintenance are recorded as ‘Pre-Maintenance Online.’ The first set of post-maintenance, stable TOC, DOC and Anion data, are recorded as ‘Post-Maintenance Online.’ Also recorded are the two previous anion check standards (CCV) from the last completed sequence. All 12 of these field instrument results are recorded on the field run data sheet. (Add something about SONDE QC.) Physical Parameters collected at all sites: EC, TEMP, DO, Turbidity and Specific Conductance
Colusa Basin Rice Drainage-- Revised 9/23/11
(To be samples weekly during ~Aug-Oct rice drainage period, a few weeks before peak drainage and a few weeks after.)
Site Analysis Containers
South Sl.nr Hanrahan Rd B9D81543434 (DUP)
whichever site is duplicated whichever site is duplicated
Colusa Main Drain nr. Sacramento River
A0294500
Standard Mineral(1), Bromide(36) Standard Nutrients(2) TOC(66) wet oxidation DOC(66D) wet oxidation UVA Turbidity (59) Suspended Solids (55)
1 quart filtered; ½ pint, filtered/fix ½ pint filtered, ½ pint unfiltered 40ml clear w/acid 40ml clear w/acid filtered 1/2 pint filtered 1 pint unfiltered 1 quart unfiltered
Filtered Blank
DOC(66D) oxidation 40ml Clear w/acid, filtered
Nutrient Blank - Filtered
Standard Nutrients (2) ½ pint filtered
Physical Parameters collected at all sites: Temperature, pH, Turbidity, Dissolved Oxygen, and Specific Conductance
Code 1 – Standard Mineral analysis includes: Ca, Mg, Na, K, S, Cl, B, Alkalinity, Nitrate, Dissolved Solids, and Specific Conductance Code 2 – Standard Nutrient analysis includes: Nitrate + Nitrite, Kjeldahl Nitrogen, Organic Nitrogen and Ammonia, Total Phosphorus (unfiltered), and Ortho-Phosphate
52
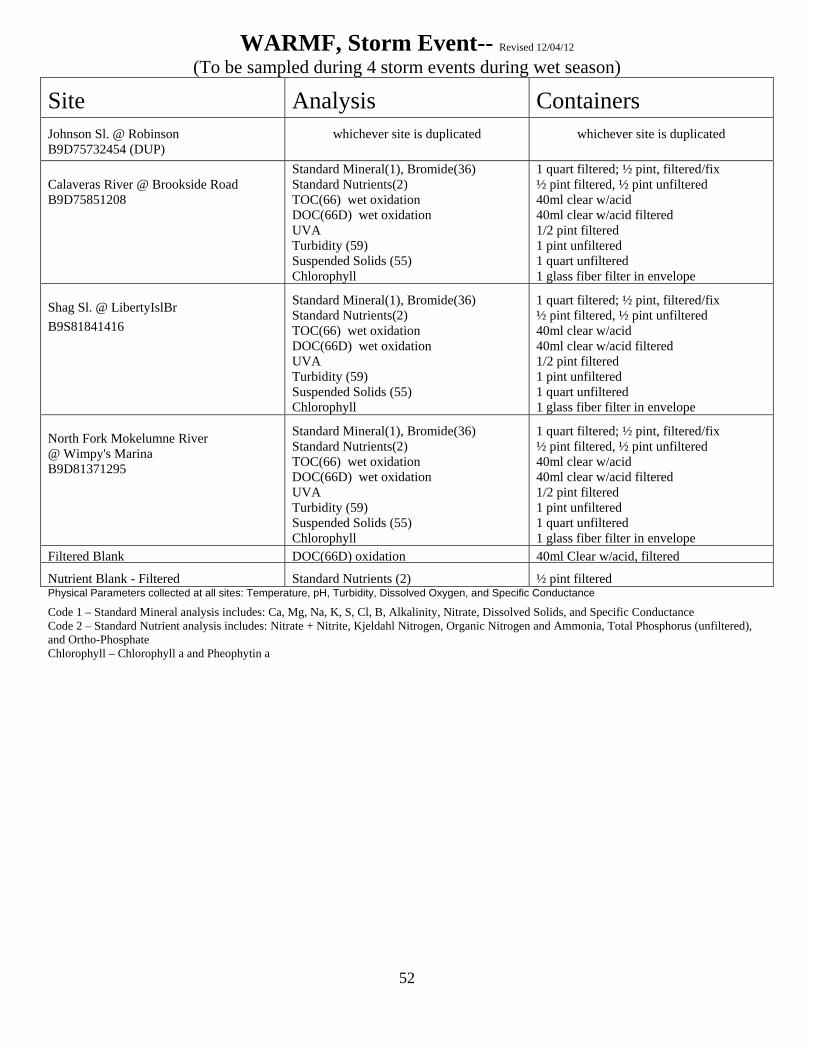
WARMF, Storm Event-- Revised 12/04/12
(To be sampled during 4 storm events during wet season) Site
Analysis Containers
Johnson Sl. @ Robinson B9D75732454 (DUP)
whichever site is duplicated whichever site is duplicated
Calaveras River @ Brookside Road B9D75851208
Standard Mineral(1), Bromide(36) Standard Nutrients(2) TOC(66) wet oxidation DOC(66D) wet oxidation UVA Turbidity (59) Suspended Solids (55) Chlorophyll
1 quart filtered; ½ pint, filtered/fix ½ pint filtered, ½ pint unfiltered 40ml clear w/acid 40ml clear w/acid filtered 1/2 pint filtered 1 pint unfiltered 1 quart unfiltered 1 glass fiber filter in envelope
Shag Sl. @ LibertyIslBr
B9S81841416
Standard Mineral(1), Bromide(36) Standard Nutrients(2) TOC(66) wet oxidation DOC(66D) wet oxidation UVA Turbidity (59) Suspended Solids (55) Chlorophyll
1 quart filtered; ½ pint, filtered/fix ½ pint filtered, ½ pint unfiltered 40ml clear w/acid 40ml clear w/acid filtered 1/2 pint filtered 1 pint unfiltered 1 quart unfiltered 1 glass fiber filter in envelope
North Fork Mokelumne River @ Wimpy's Marina B9D81371295
Standard Mineral(1), Bromide(36) Standard Nutrients(2) TOC(66) wet oxidation DOC(66D) wet oxidation UVA Turbidity (59) Suspended Solids (55) Chlorophyll
1 quart filtered; ½ pint, filtered/fix ½ pint filtered, ½ pint unfiltered 40ml clear w/acid 40ml clear w/acid filtered 1/2 pint filtered 1 pint unfiltered 1 quart unfiltered 1 glass fiber filter in envelope
Filtered Blank DOC(66D) oxidation 40ml Clear w/acid, filtered Nutrient Blank - Filtered
Standard Nutrients (2) ½ pint filtered
Physical Parameters collected at all sites: Temperature, pH, Turbidity, Dissolved Oxygen, and Specific Conductance
Code 1 – Standard Mineral analysis includes: Ca, Mg, Na, K, S, Cl, B, Alkalinity, Nitrate, Dissolved Solids, and Specific Conductance Code 2 – Standard Nutrient analysis includes: Nitrate + Nitrite, Kjeldahl Nitrogen, Organic Nitrogen and Ammonia, Total Phosphorus (unfiltered), and Ortho-Phosphate Chlorophyll – Chlorophyll a and Pheophytin a
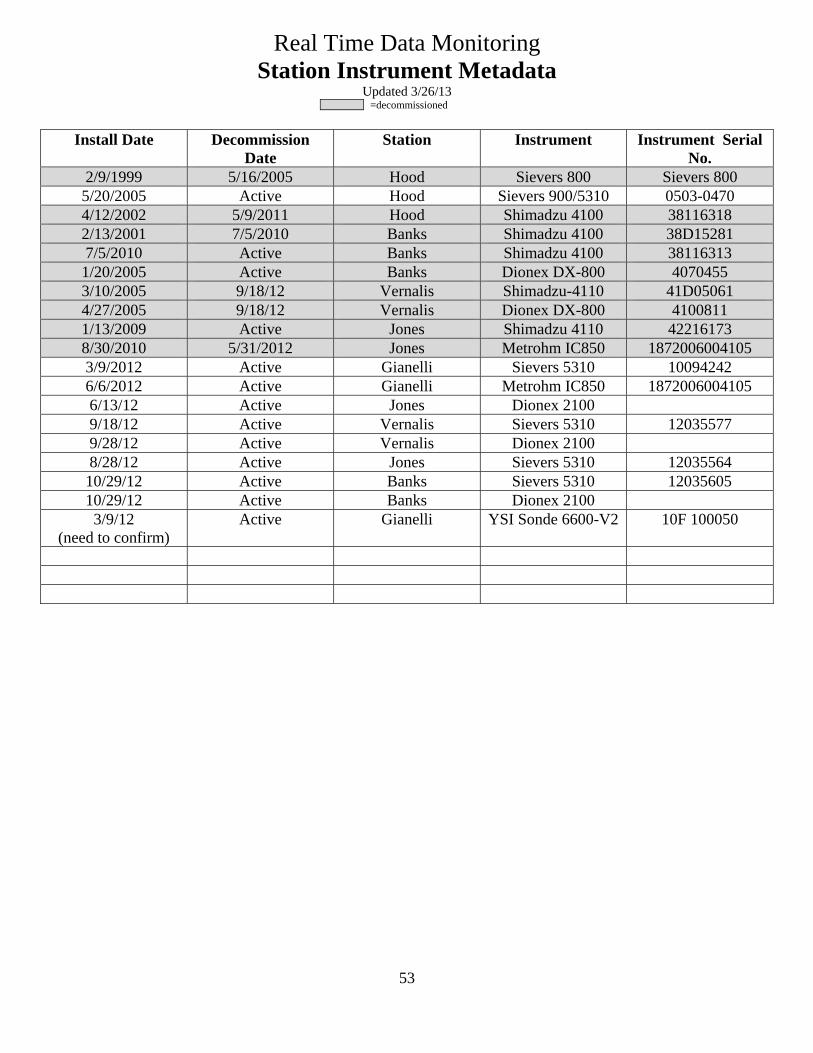
53
Real Time Data Monitoring Station Instrument Metadata
Updated 3/26/13 =decommissioned
Install Date Decommission
Date Station Instrument Instrument Serial
No. 2/9/1999 5/16/2005 Hood Sievers 800 Sievers 800 5/20/2005 Active Hood Sievers 900/5310 0503-0470 4/12/2002 5/9/2011 Hood Shimadzu 4100 38116318 2/13/2001 7/5/2010 Banks Shimadzu 4100 38D15281 7/5/2010 Active Banks Shimadzu 4100 38116313 1/20/2005 Active Banks Dionex DX-800 4070455 3/10/2005 9/18/12 Vernalis Shimadzu-4110 41D05061 4/27/2005 9/18/12 Vernalis Dionex DX-800 4100811 1/13/2009 Active Jones Shimadzu 4110 42216173 8/30/2010 5/31/2012 Jones Metrohm IC850 1872006004105 3/9/2012 Active Gianelli Sievers 5310 10094242 6/6/2012 Active Gianelli Metrohm IC850 1872006004105 6/13/12 Active Jones Dionex 2100 9/18/12 Active Vernalis Sievers 5310 12035577 9/28/12 Active Vernalis Dionex 2100 8/28/12 Active Jones Sievers 5310 12035564 10/29/12 Active Banks Sievers 5310 12035605 10/29/12 Active Banks Dionex 2100 3/9/12
(need to confirm) Active Gianelli YSI Sonde 6600-V2 10F 100050
54
Appendix 5. MWQI 5 Year Strategic Plan During the 2012-2013 fiscal year, the five-year strategic plan for the MWQI Program was updated,
approved and adopted by the MWQI Technical Advisory Committee. This strategic plan will serve as
the basis for the MWQI Program for completing development of program work plans for 2012-2013,
and subsequent years. The plan that was approved is reproduced below.
Introduction
The Municipal Water Quality Program (MWQP) Branch consists of four sections: Municipal Water
Quality Investigations (MWQI), Water Quality Special Studies, Field Support, and Quality
Assurance/Quality Control (QA/QC) sections. Three of these sections, the MWQI, Water Quality
Special Studies, and Field Support sections, constitute the MWQI Program funded by the State Water
Project Contractors Authority MWQI Specific Project Committee (MWQI-SPC) with an annual budget
of $3.1 million. The QA/QC Section is funded by SWP funds with an annual budget of $607,000. The
five-year strategic plan for the MWQI Program covers the sections included in the MWQI Program
and the QA/QC Section.
MWQP Branch Mission Statement
To enhance the Department’s mission of managing the water resources of California by supporting
the efforts of the Department's Divisions and outside agencies to benefit the State’s people through
water quality monitoring for drinking water purposes in an economic, reliable and environmentally
sound manner while taking steps to protect, restore, enhance, and sustain the Delta's natural
environments.
MWQI Program Mission Statement
The mission of the MWQI Program is to: a) support the effective and efficient use of the Sacramento-
San Joaquin Delta (Delta) and the State Water Project (SWP) as a source water supply for municipal
purposes through monitoring, forecasting, and reporting water quality; b) provide early warning of
changing conditions in source water quality used for municipal purposes; c) provide data and
knowledge based support for operational decision-making on the SWP; d) conduct scientific studies
of drinking water importance; and e) provide scientific support to DWR, the State Water Project
Contractors Authority MWQI-SPC, and other governmental entities.
55
Organizational Structure, Coordination, and Funding
Work within DWR to develop an organizational structure that ensures staffing requirements for
the MWQI Program are met on a timely basis through the retention of highly qualified
personnel that have the expertise to meet MWQI Program objectives.
Continue developing and implementing the Real Time Data and Forecasting-Comprehensive
Program (RTDF-CP) which encompasses tasks identified by the MWQI-SPC, MWQP staff,
and DWR management, as high priority and achievable through cooperative effort.
Work with the MWQI-SPC to identify tasks that can most efficiently be performed through
cooperative agreement, and participate in cooperative implementation of such tasks. These
tasks will be described in detail and planned for on an annual fiscal year basis in the MWQP
Work plan.
Work with the MWQI-SPC to identify funding needs that will enable the MWQP to be
adequately implemented, and to participate in acquiring, allocating, and accounting for, funds
to accomplish needed work as stated in the annual work plans.
Coordinate and collaborate MWQP activities with those of other DWR Divisions under the
RTDF-CP to enhance productivity, minimize duplication and overlap, and ensure effective
coordination and communication to enable joint implementation of water quality assessment
and forecasting activities affecting the Delta and the SWP.
Development and Refinement of a SWP “Early Warning System” for Water Quality
Concerns
As they pertain to the responsibilities of the MWQP Branch, and in conjunction with the
Division of Operations and Maintenance (O&M), and as one of the primary objectives of the
RTDF-CP, develop and refine a “SWP Water Quality Early Warning” system that will alert
MWQI Program participants of likely drinking water quality problems in a timely manner to
enable preventative or corrective actions to be taken to avoid consumer impacts.
Work collaboratively with other DWR Divisions to develop efficient communications among
DWR Divisions and MWQI Program participants to ensure early warning information is
transmitted, received, and acted upon as they pertain to the responsibilities of the MWQP
Branch.
Tasks identified under the “Water Quality Monitoring”, “Information Management and
Dissemination”, “Water Quality Forecasting”, “Scientific Support” and “Emergency Response”
56
program elements support the development of this early warning system as they pertain to the
responsibilities of the MWQP Branch.
Water Quality Monitoring and Emerging concerns
Monitor water quality parameters relevant to drinking water at key locations in the Delta
through periodic collection of discrete samples and their analysis by field and laboratory
instruments, according to accepted methods.
Monitor upcoming plans for habitat restorations required under current and future Biological
Opinions and any projects developed as part of the proposed Bay Delta Comprehensive Plan.
Develop and implement all necessary monitoring programs to establish baseline information
prior to the construction of any restoration projects, during construction of the projects and
during the implementation of those projects.
Maintain existing in-situ multi-parameter water quality monitoring stations on the Sacramento
River at Hood, H.O. Banks Delta Pumping Plant Headworks, Jones Pumping Plant, San
Joaquin River near Vernalis, and on inlet to Gianelli Pump/Generation Plant.
As part of RTDF-CP work cooperatively with the MWQI-SPC, other DWR units, and other
agencies, to identify additional key locations in the Delta, its tributaries, and the SWP where
additional in-situ water quality assessment equipment is needed. Work cooperatively with
others to acquire needed permits, plan for and perform construction, acquire monitoring and
communications equipment, bring new stations into operation, and assure the quality of data
produced.
Perform water quality assessments and evaluations to identify drinking water quality
consequences of physical or operational changes in the Delta, its watersheds, and the SWP.
With participation of the MWQI-SPC, other MWQI Program participants, and DWR modelers,
produce annual re-evaluations of the discrete and in-situ monitoring programs to identify and
recommend needed changes to eliminate critical data gaps, provide valid data for the DSM2
model, improve program efficiency and minimize monitoring costs.
Ensure timely and appropriate QA/QC of water quality and related information produced by the
MWQI Program. Take timely and effective action to identify and correct QA/QC problems.
Include equipment/instrument maintenance and calibration as part of the annual QA/QC
process.
As part of the RTDF-CP work with QA/QC Section staff to standardize the QA/QC procedures,
especially for new stations.
57
Continue to explore new and improved technologies for acquiring real time water quality data.
Utilize new technology where possible to minimize monitoring costs and data gaps and to
move towards standardization of monitoring methodology.
Work collaboratively with O&M to plan for emerging constituents of concern such as “Taste
and Odor” issues that have been increasing with time. Respond to these emerging concerns in
a timely manner as part of the RTDF-CP.
As part of the RTDF-CP, work collaboratively with O&M to develop a comprehensive program
of monitoring, early warning, and management for algal growths in the Delta and SWP having
the potential for causing taste and odor in treated drinking water taken through the SWP.
Governance of this program will be through a steering committee composed of DWR staff from
relevant organizational units, and MWQI-SPC representatives of affected agencies.
Information Management and Dissemination
Provide timely analysis, interpretation, and dissemination of monitoring information to MWQI
Program participants and other identified stakeholders on key constituents of concern.
Analyze and present monitoring results to program participants and in public proceedings.
Continue to develop and refine capability for MWQI Program participants to rapidly acquire
real-time and other drinking water quality data and supporting information through the internet
in user-friendly formats.
Produce annual data and/or interpretative reports documenting program findings, as shall be
determined by the MWQI Technical Advisory Committee (TAC).
Continue production of weekly water quality reports, with continuing improvements, as may be
directed by the MWQI TAC.
Provide technical assistance to MWQI Program participants in acquiring needed water quality
data and supporting information.
Research and develop new and innovative means of communicating MWQI Program work
products to program participants and other interested parties.
Encourage and promote actions by regulatory agencies necessary to ensure a high-quality and
reliable water supply by disseminating information derived from the MWQI Program.
Advocate drinking water quality protection by tracking new projects in the Central Valley,
including operational planning activities, by alerting MWQI Program participants to projects
having the potential to affect the quality of drinking water supplies taken through the Delta,

58
reviewing and commenting on environmental documents, and participating in public hearings
and workshops.
Maintain awareness of findings from international, national, and regional research activities
that have a bearing on the ability to meet future drinking water regulations, factor these
findings into analyses of Delta water quality conditions and facilities options as appropriate,
and communicate these findings to MWQI Program participants.
Water Quality Forecasting
Produce timely water quality forecasts for MWQI-SPC members. MWQI Program staff will
support DWR modeling efforts by providing water quality expertise needed to improve Delta
models, coordinating closely with modelers to collect data to support model development and
to improve the ability to interpret and apply model outputs.
The Bay-Delta Office (BDO) will continue development of the WARMF models for the Delta
watersheds. The Operations Control Office (OCO) will be responsible for modeling water
quality forecasts.
MWQI staff should endeavor to become experts at interpreting how Delta watersheds influence
Delta drinking water quality. We encourage staff to develop a scientific understanding of the
Delta watersheds by becoming proficient with the Watershed Analysis Risk Management
Framework (WARMF) model as this will help to develop such an expertise.
Scientific Support Studies
In cooperation with MWQI Program participants and as part of the RTDF-CP, identify the need
for, and implement detailed studies to examine specific phenomena that affect, or may in the
future affect, Delta drinking water quality. These studies may be generally classified as
follows:
o Detailed evaluations of problem areas or conditions identified as a result of monitoring
activities.
o Evaluations of drinking water quality consequences of proposed physical or operational
modifications in the Delta and its tributaries, its inflows, internal flow patterns, or
outflows.
o Prediction of the drinking water quality consequences of population growth patterns.
o Detailed evaluations of natural processes that have the potential to affect the quality of
Delta drinking water sources.
59
Detailed evaluations of point and non-point pollutant discharges to the Delta (including tributaries to
the Delta). Studies will be selected for implementation based on their significance to the quality of
drinking water supplies taken through the Delta, likelihood of being able to apply the information to
attain higher quality of Delta drinking water sources, cost and availability of MWQI staff resources.
Outside expertise will be enlisted where necessary and feasible to conduct or collaborate on scientific
studies.
Emergency Response
Identify, to the extent possible, ahead of time specific concerns regarding these events and
what constituents would need to be assessed.
Develop scenarios for different emergency events using models to determine which areas in
the Delta pose most significant drinking water quality issues.
Develop emergency response plans ahead of time (follow SIMS template), identifying funding
and staffing needs, all participating groups and their roles.
Work with other DWR units (i.e. O&M and Flood Management) to develop emergency
response plans.
Encourage DWR Executive to treat these events similar to flood events.
Perform water quality assessments and evaluations in response to emergency situations, such
as Delta levee breaks, supplying timely water quality information to emergency decision
makers and public health authorities.
During emergency circumstances, work cooperatively with emergency managers and rapidly
communicate results of emergency water quality assessments the MWQI Program may be
tasked to perform.
Sanitary Survey
Follow-up and resolve items identified in the Action Plan for the Watershed Sanitary Survey,
2011 Update.
Coordinate efforts of the California Department of Public Health, MWQI staff and the MWQI-
SPC to implement procedures to produce annual Sanitary Survey reports that would provide a
more manageable and productive means of meeting the intent of the Sanitary Survey
regulatory requirements. The annual Sanitary Survey reports would be combined into a 5-year
update as required in the regulations.


