1
Annual Deer Population Report & 2018-19 Antlerless License
Allocations
April 16, 2018
Pennsylvania Game Commission
Bureau of Wildlife Management
Deer and Elk Section
2
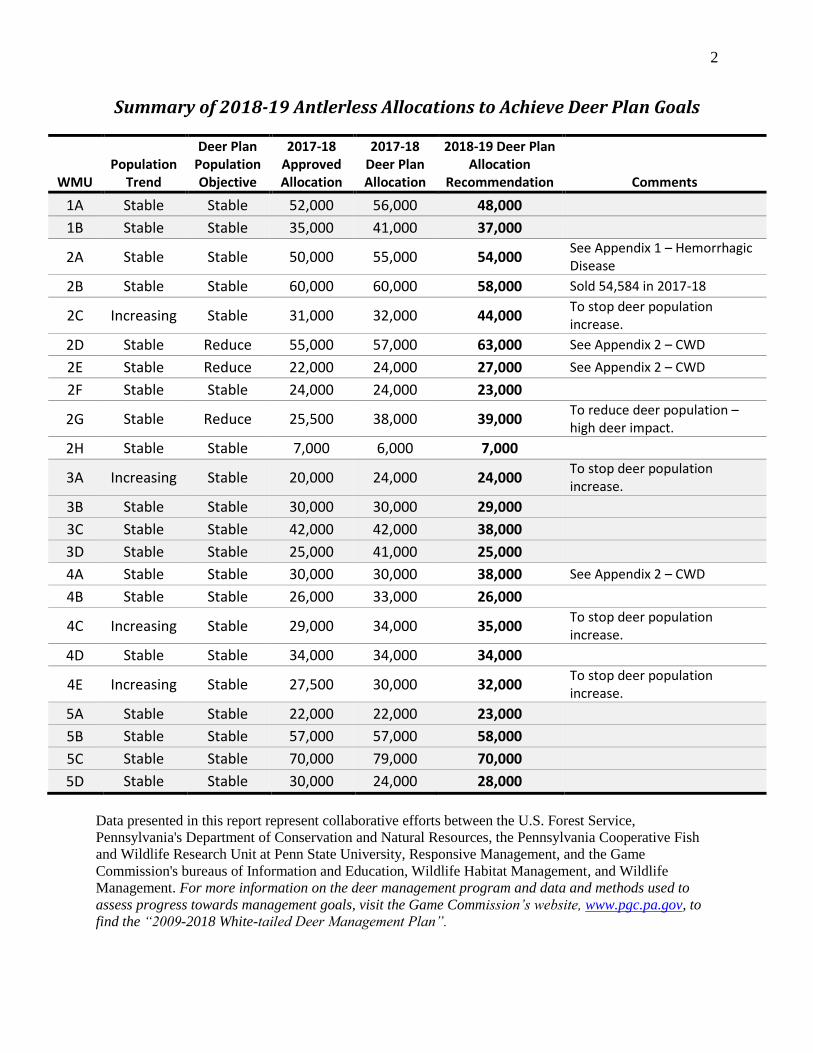
Summary of 2018-19 Antlerless Allocations to Achieve Deer Plan Goals
WMU Population
Trend
Deer Plan Population Objective
2017-18 Approved Allocation
2017-18 Deer Plan Allocation
2018-19 Deer Plan Allocation
Recommendation Comments
1A Stable Stable 52,000 56,000 48,000
1B Stable Stable 35,000 41,000 37,000
2A Stable Stable 50,000 55,000 54,000 See Appendix 1 – Hemorrhagic Disease
2B Stable Stable 60,000 60,000 58,000 Sold 54,584 in 2017-18
2C Increasing Stable 31,000 32,000 44,000 To stop deer population increase.
2D Stable Reduce 55,000 57,000 63,000 See Appendix 2 – CWD
2E Stable Reduce 22,000 24,000 27,000 See Appendix 2 – CWD
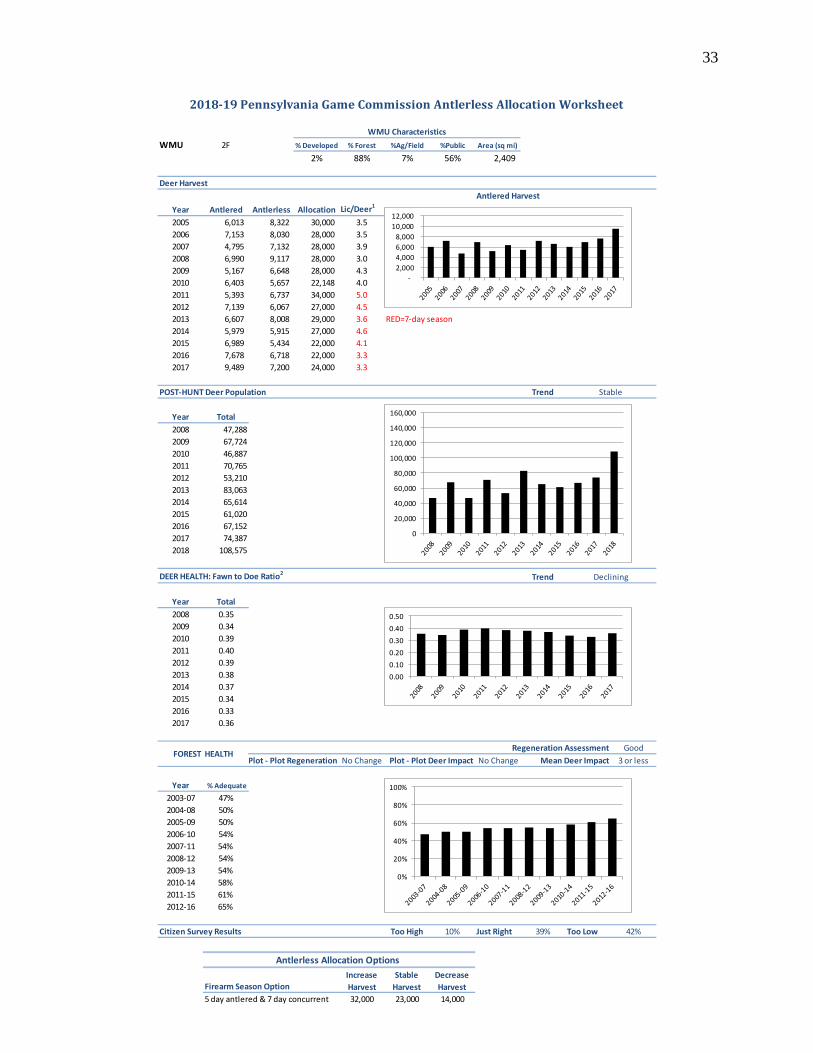
2F Stable Stable 24,000 24,000 23,000
2G Stable Reduce 25,500 38,000 39,000 To reduce deer population – high deer impact.
2H Stable Stable 7,000 6,000 7,000
3A Increasing Stable 20,000 24,000 24,000 To stop deer population increase.
3B Stable Stable 30,000 30,000 29,000
3C Stable Stable 42,000 42,000 38,000
3D Stable Stable 25,000 41,000 25,000
4A Stable Stable 30,000 30,000 38,000 See Appendix 2 – CWD
4B Stable Stable 26,000 33,000 26,000
4C Increasing Stable 29,000 34,000 35,000 To stop deer population increase.
4D Stable Stable 34,000 34,000 34,000
4E Increasing Stable 27,500 30,000 32,000 To stop deer population increase.
5A Stable Stable 22,000 22,000 23,000
5B Stable Stable 57,000 57,000 58,000
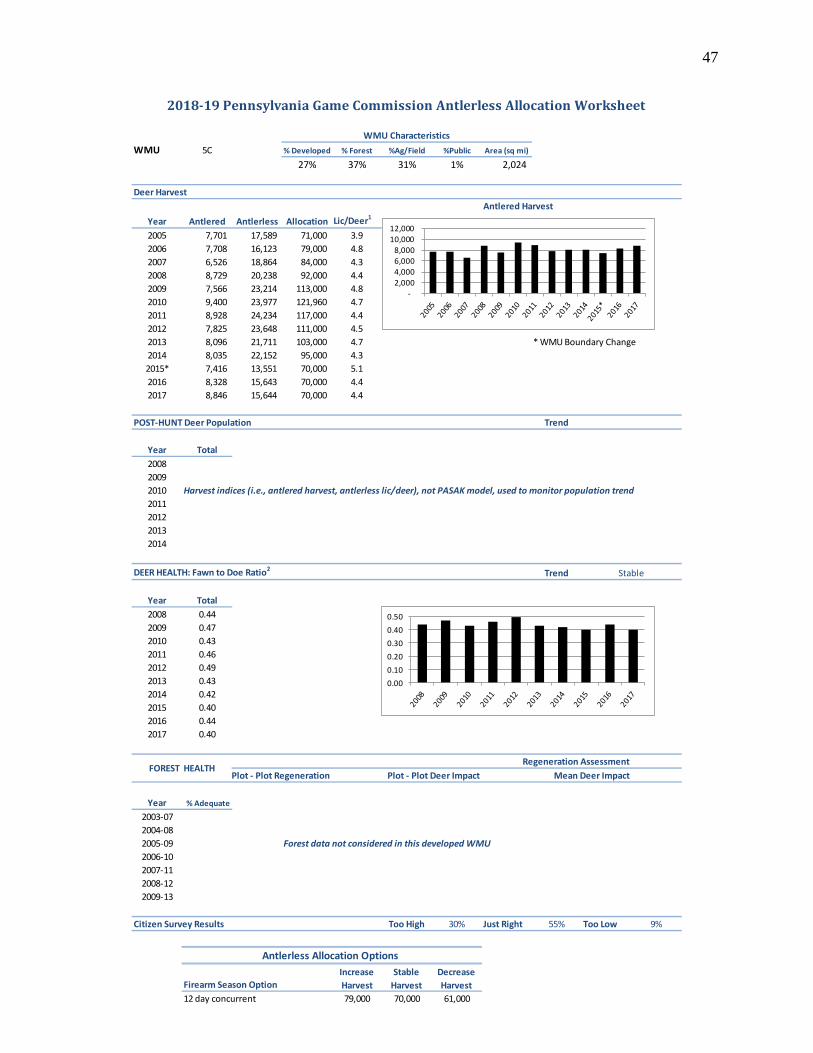
5C Stable Stable 70,000 79,000 70,000
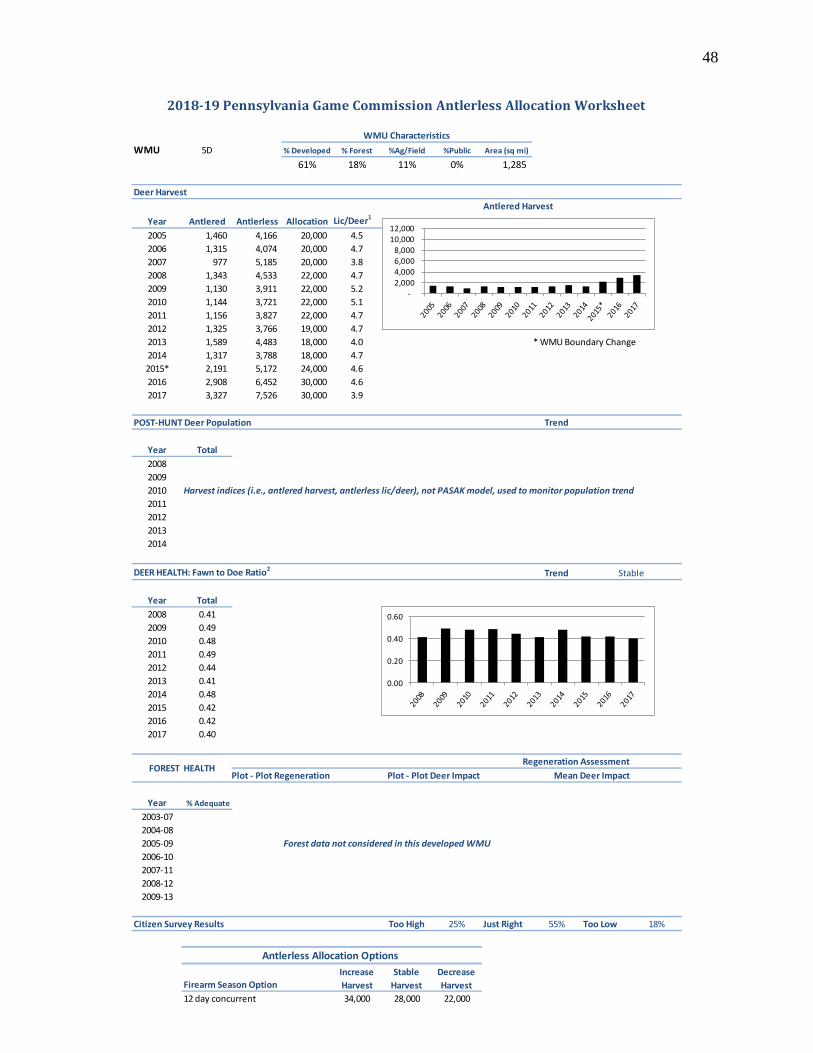
5D Stable Stable 30,000 24,000 28,000
Data presented in this report represent collaborative efforts between the U.S. Forest Service,
Pennsylvania's Department of Conservation and Natural Resources, the Pennsylvania Cooperative Fish
and Wildlife Research Unit at Penn State University, Responsive Management, and the Game
Commission's bureaus of Information and Education, Wildlife Habitat Management, and Wildlife
Management. For more information on the deer management program and data and methods used to
assess progress towards management goals, visit the Game Commission’s website, www.pgc.pa.gov, to
find the “2009-2018 White-tailed Deer Management Plan”.
3
Deer Management Goals
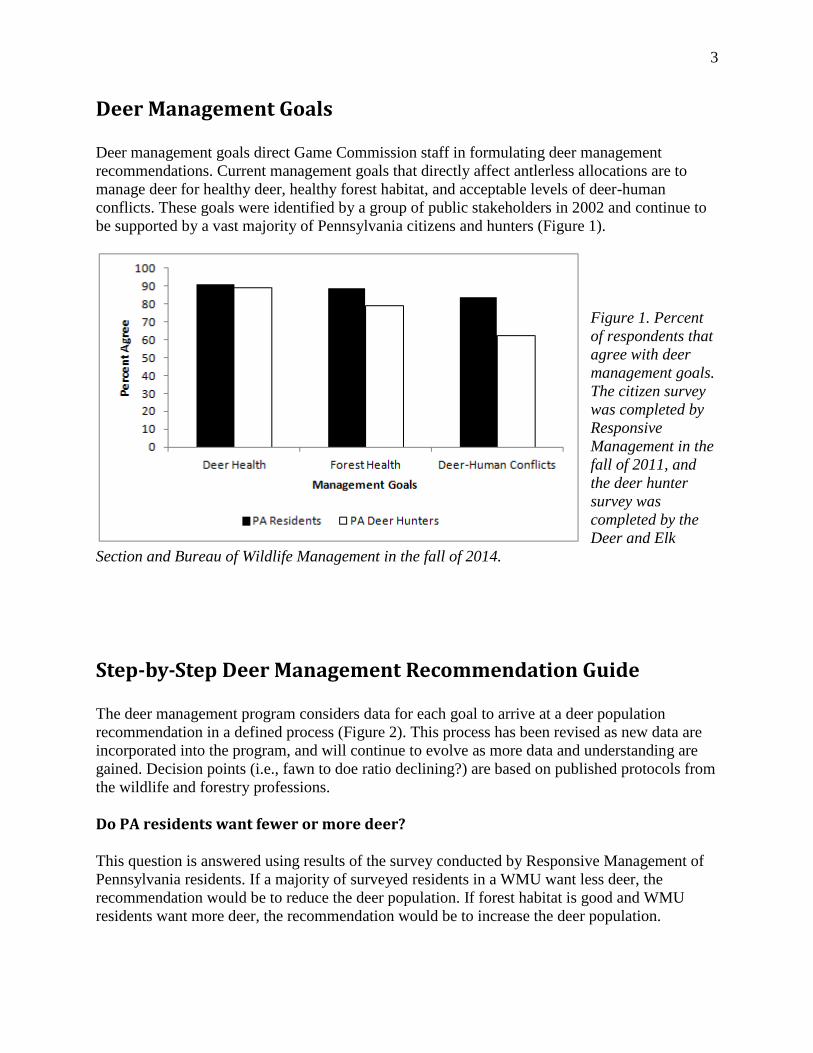
Deer management goals direct Game Commission staff in formulating deer management
recommendations. Current management goals that directly affect antlerless allocations are to
manage deer for healthy deer, healthy forest habitat, and acceptable levels of deer-human
conflicts. These goals were identified by a group of public stakeholders in 2002 and continue to
be supported by a vast majority of Pennsylvania citizens and hunters (Figure 1).
Figure 1. Percent
of respondents that
agree with deer
management goals.
The citizen survey
was completed by
Responsive
Management in the
fall of 2011, and
the deer hunter
survey was
completed by the
Deer and Elk
Section and Bureau of Wildlife Management in the fall of 2014.
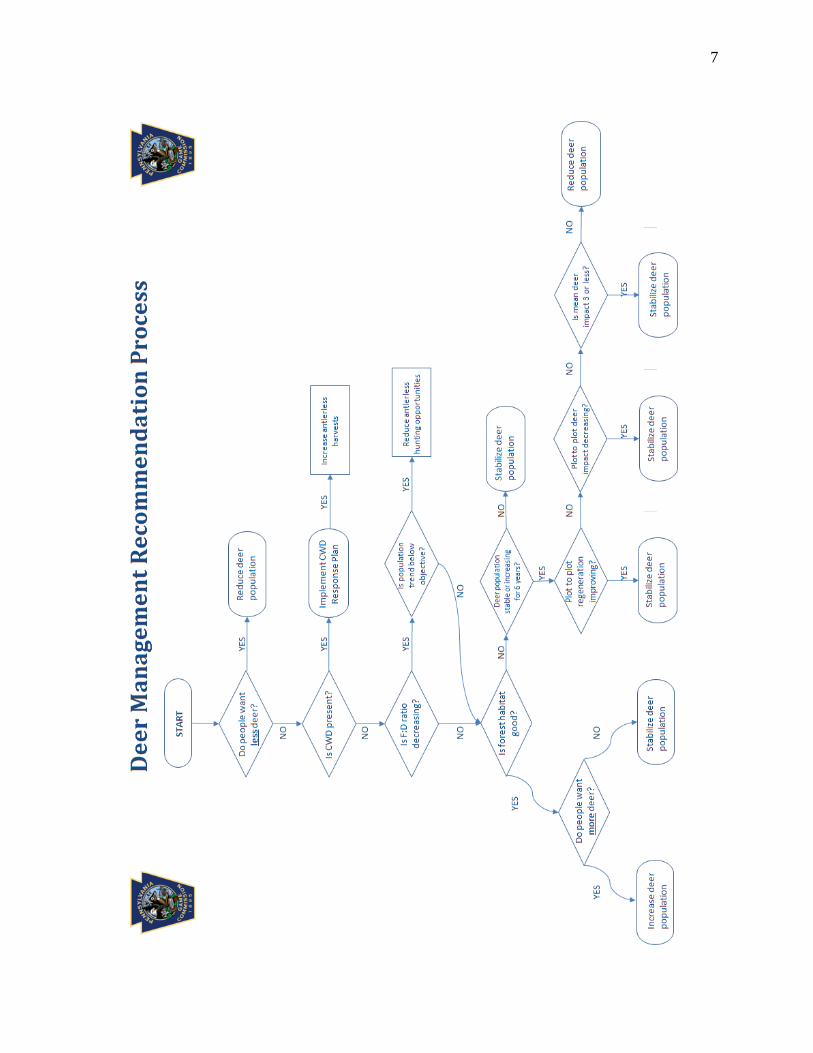
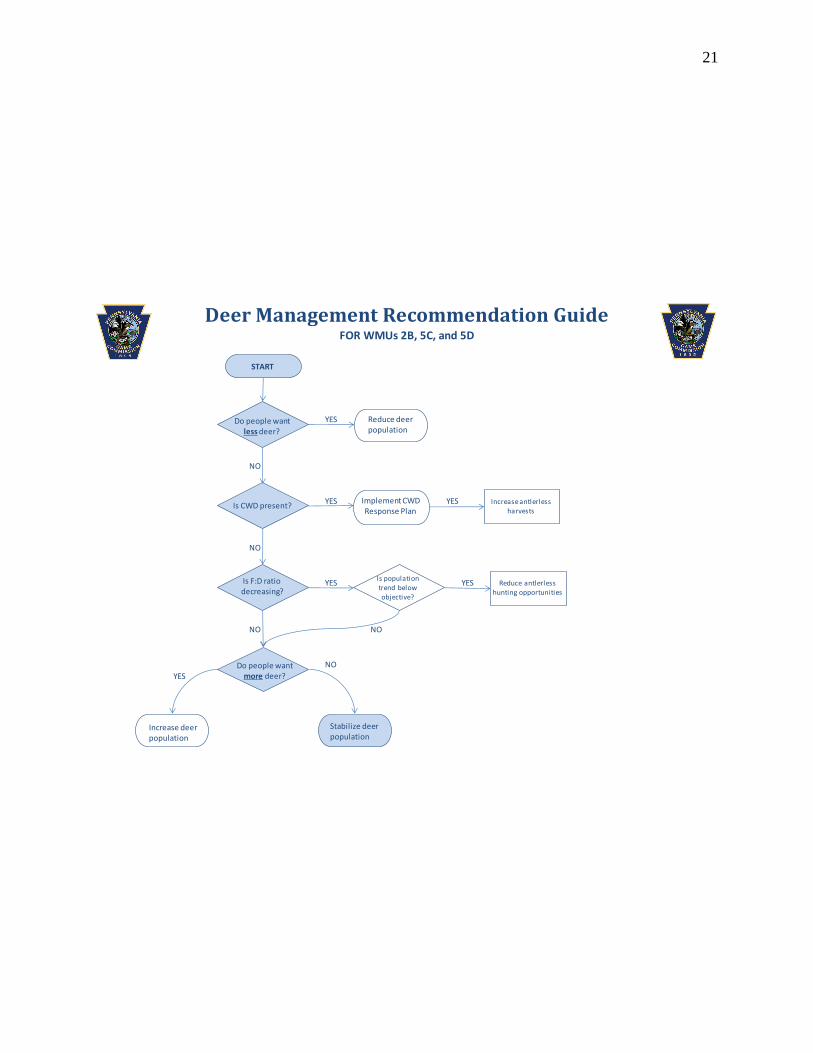
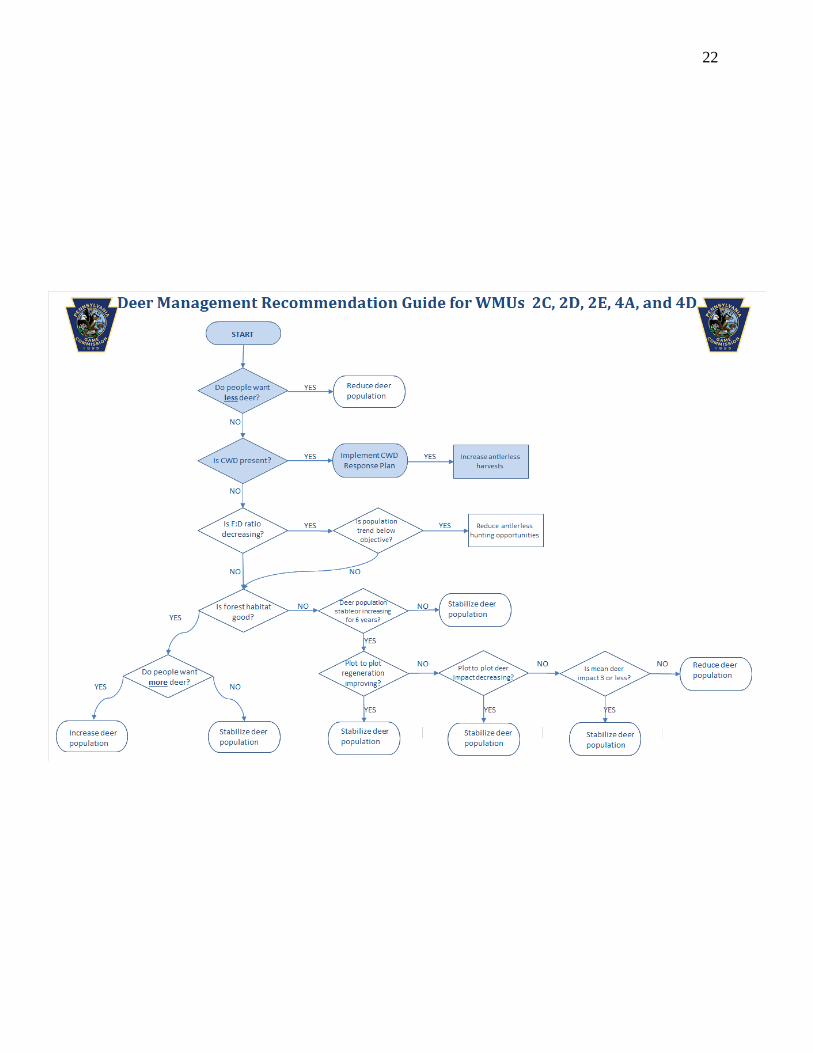
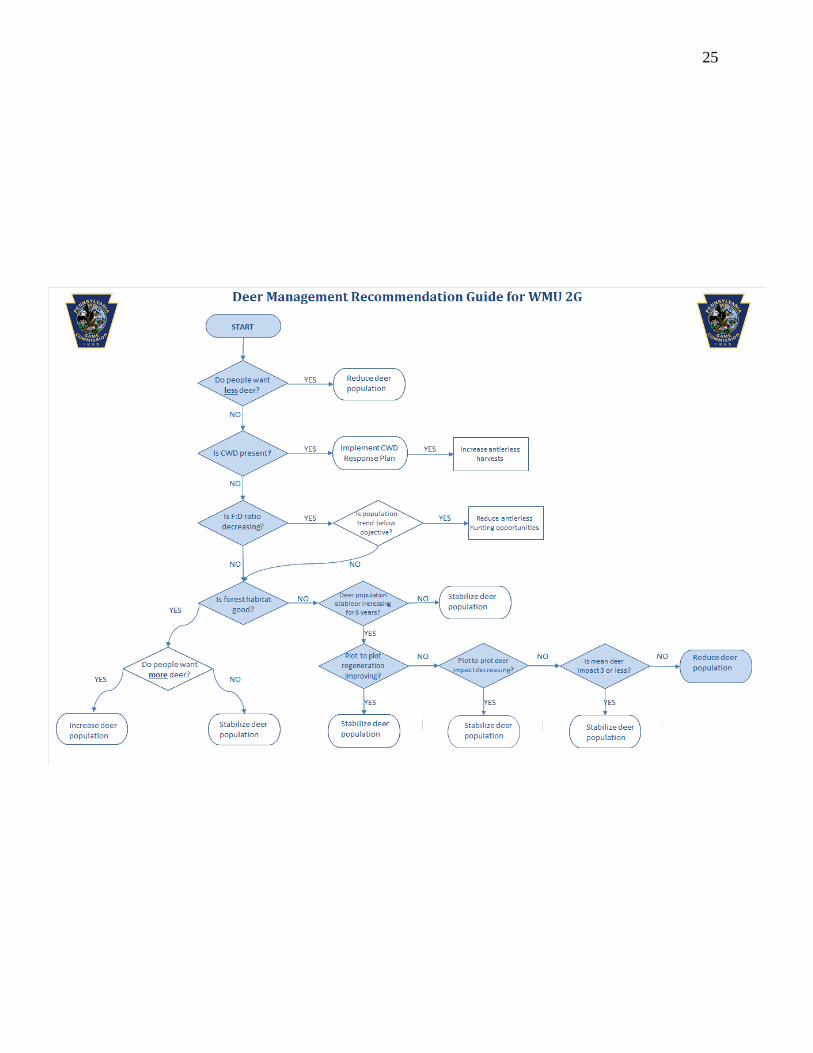
Step-by-Step Deer Management Recommendation Guide
The deer management program considers data for each goal to arrive at a deer population
recommendation in a defined process (Figure 2). This process has been revised as new data are
incorporated into the program, and will continue to evolve as more data and understanding are
gained. Decision points (i.e., fawn to doe ratio declining?) are based on published protocols from
the wildlife and forestry professions.
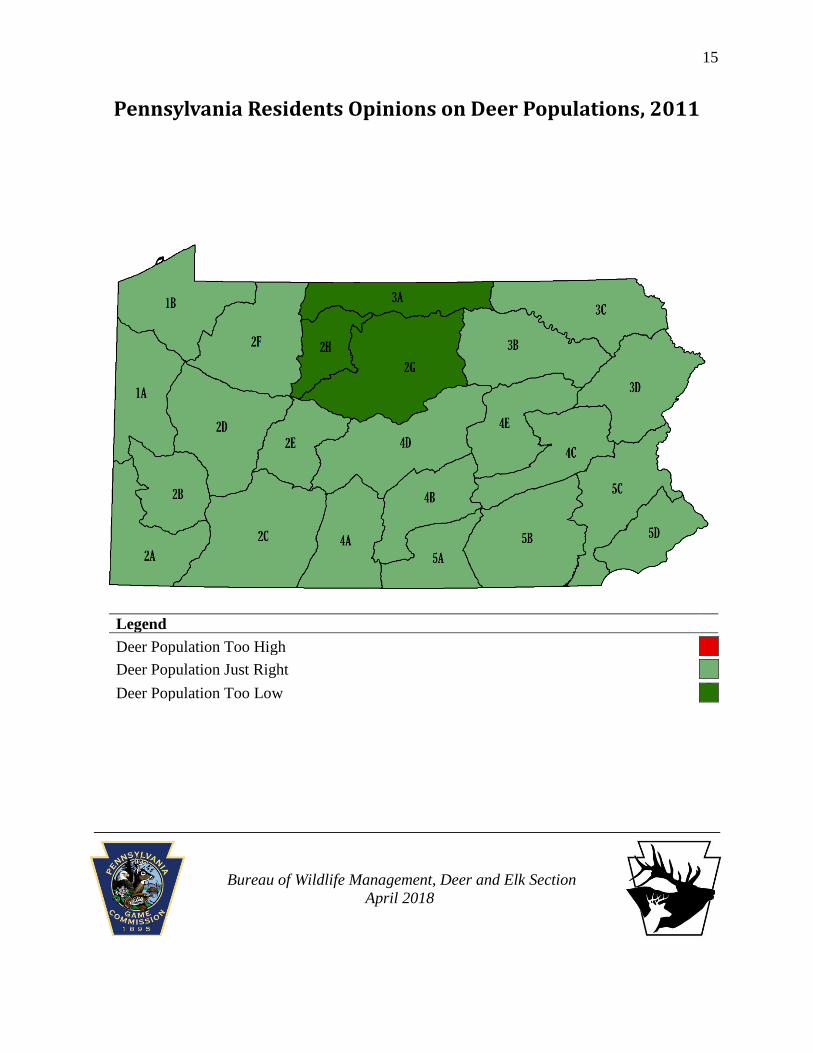
Do PA residents want fewer or more deer?
This question is answered using results of the survey conducted by Responsive Management of
Pennsylvania residents. If a majority of surveyed residents in a WMU want less deer, the
recommendation would be to reduce the deer population. If forest habitat is good and WMU
residents want more deer, the recommendation would be to increase the deer population.
4
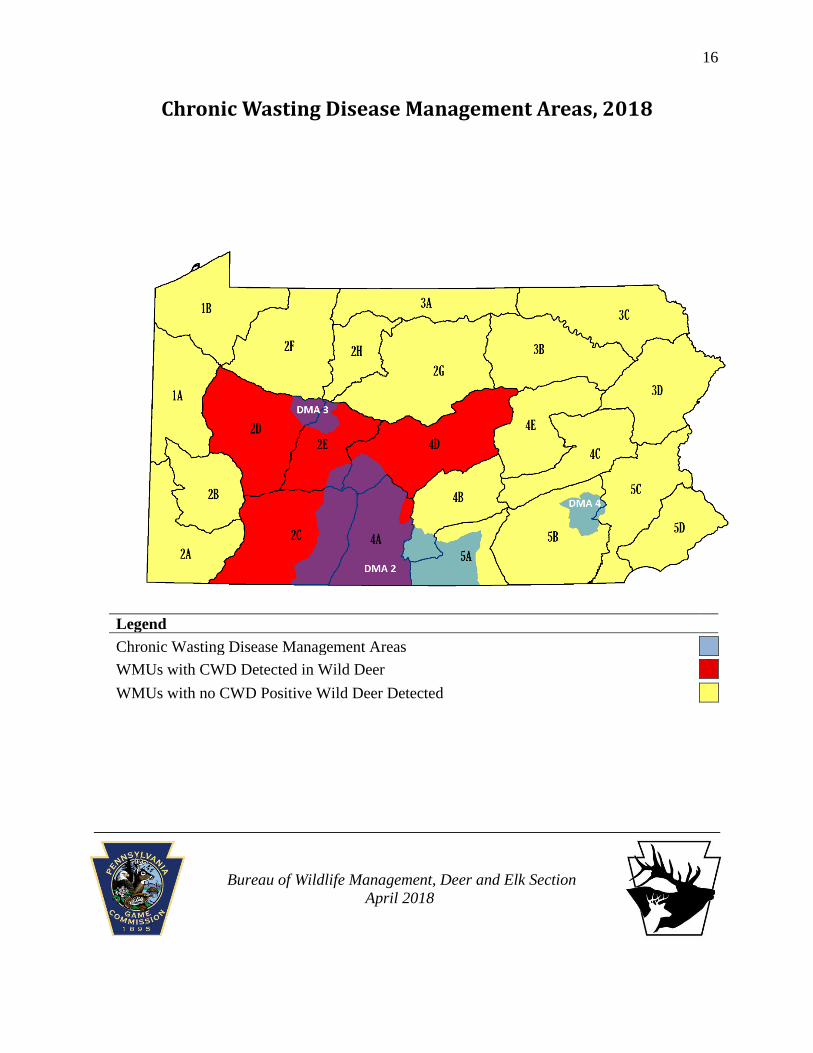
Is CWD present in wild deer?
This question is answered using results from the thousands of deer tested annually for chronic
wasting disease (CWD). If CWD is present in wild deer, then management recommendations are
to stabilize or reduce WMU populations. Additional antlerless deer should be removed within the
defined Disease Management Area using Deer Management Assistance Program permits.
Increasing the antlerless harvest serves 2 purposes that are important to efforts to contain CWD;
(1) increased antlerless harvest removes more deer from the population and allows the Game
Commission to test more deer in our efforts to obtain the best information on the occurrence and
location of the disease, and (2) increased antlerless harvest may help limit occurrence and spread
of CWD.
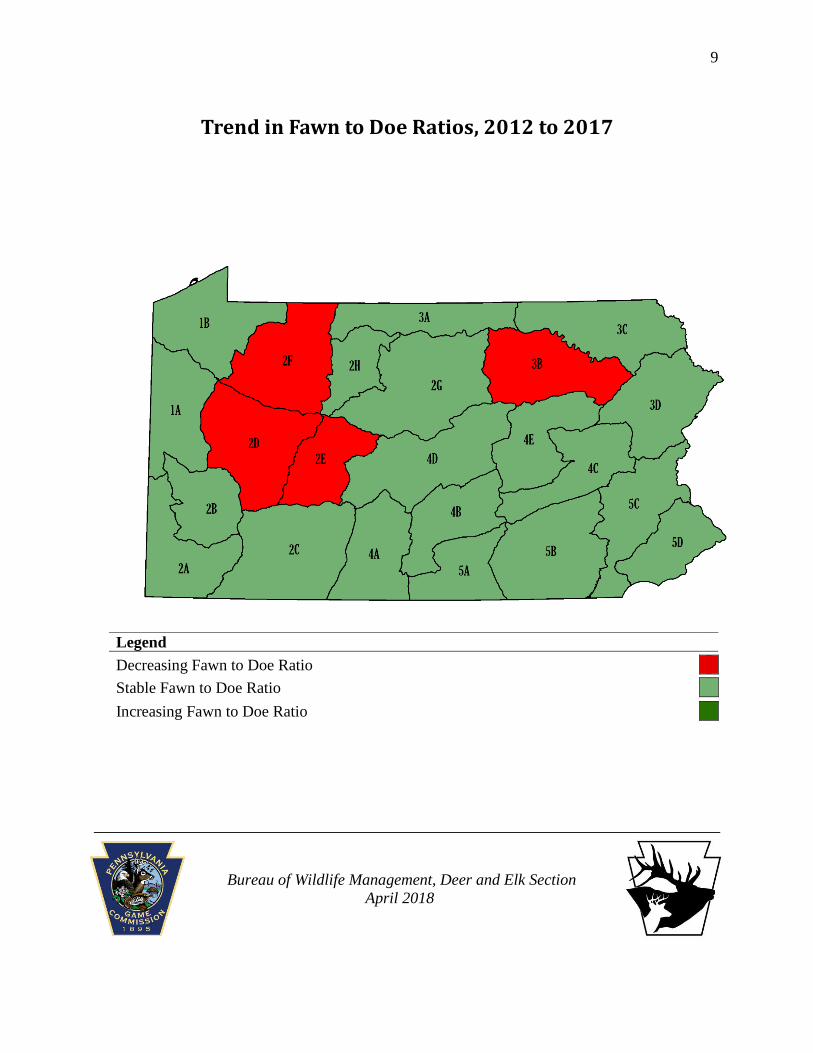
Is fawn to doe ratio declining?
This question is answered using results from the age structure of the antlerless harvest. These
data are collected each year by trained Game Commission deer agers from across the state. If the
proportion of fawns in the antlerless harvest (hereafter referred to as fawn to doe ratio) is
declining and the population is not achieving its objective (i.e., population is declining and
objective is to maintain a stable deer population), then the antlerless allocation would be reduced
to stop the population decline. The antlerless harvest will have the greatest influence on the
population because hunting accounts for the majority of deer mortalities in Pennsylvania. If the
fawn to doe ratio is stable or if the population is meeting its objective (i.e., population is stable
and objective is stable), no management action is taken.
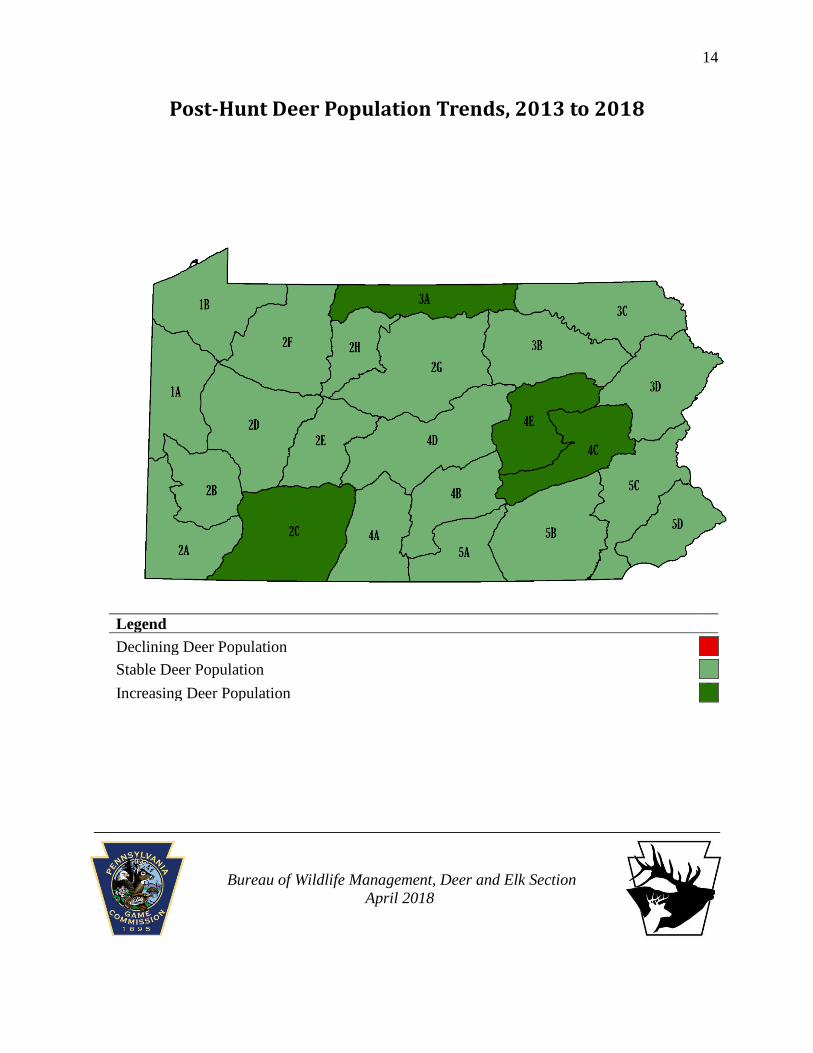
Has deer population been stable or increasing for 6 years?
This question is answered using results from the Pennsylvania Sex-Age-Kill deer population
model. The 6 year time period is necessary because of the 5-year time period necessary to collect
the forest data. The sixth year is added because only 2nd year seedlings are counted in the forest
data. As a result, a complete forest data set includes effects of deer from the previous 6 years.
If the deer population is decreasing the recommendation is to stabilize the population at the
lower level to see if forest habitat improves given the lower deer population. If the deer
population is stable or increasing, the process continues to the next step.
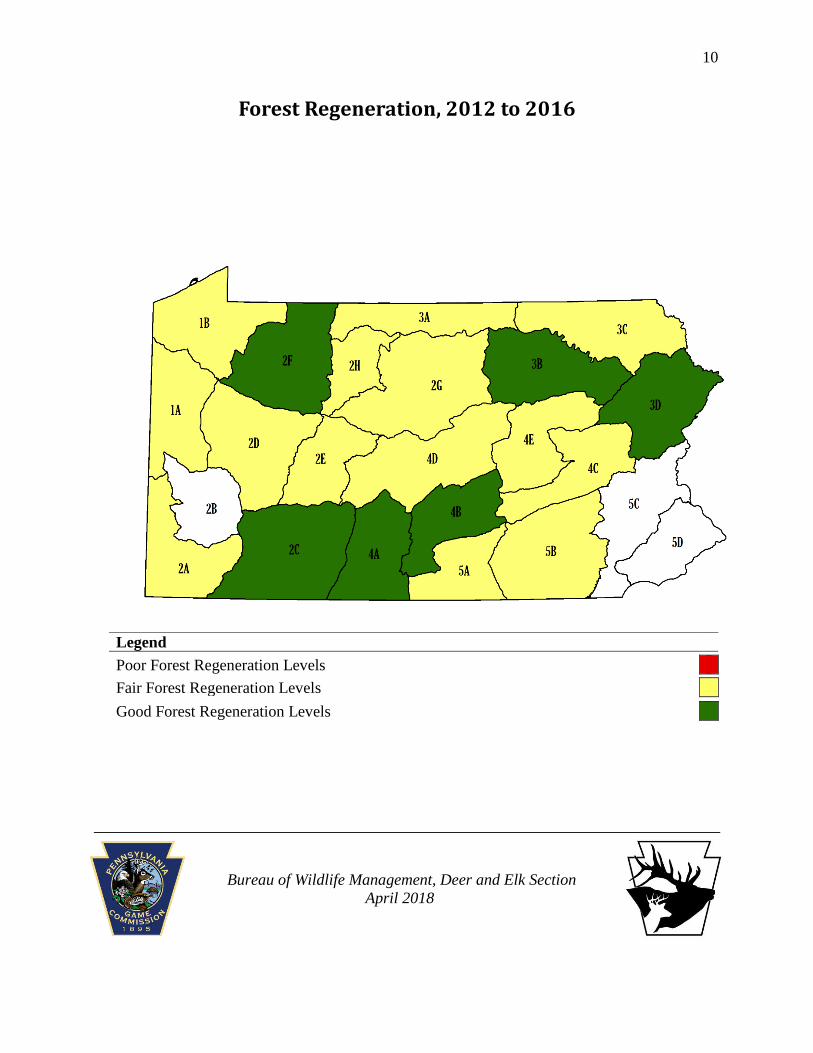
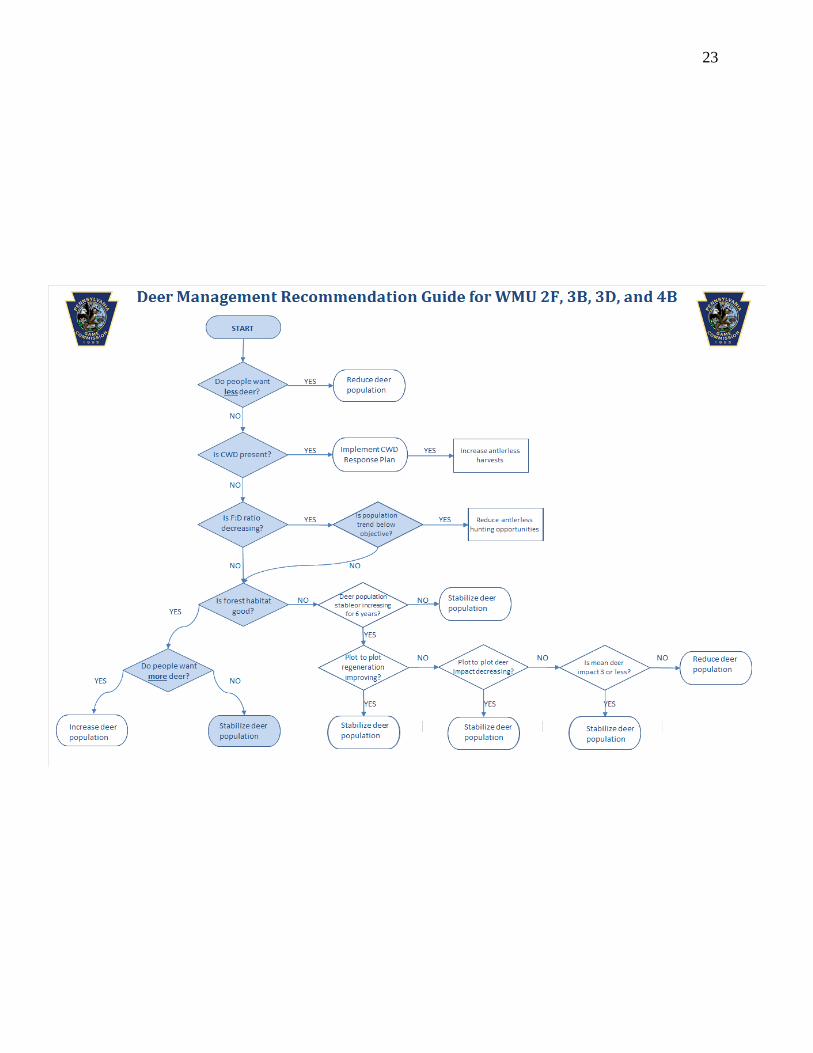
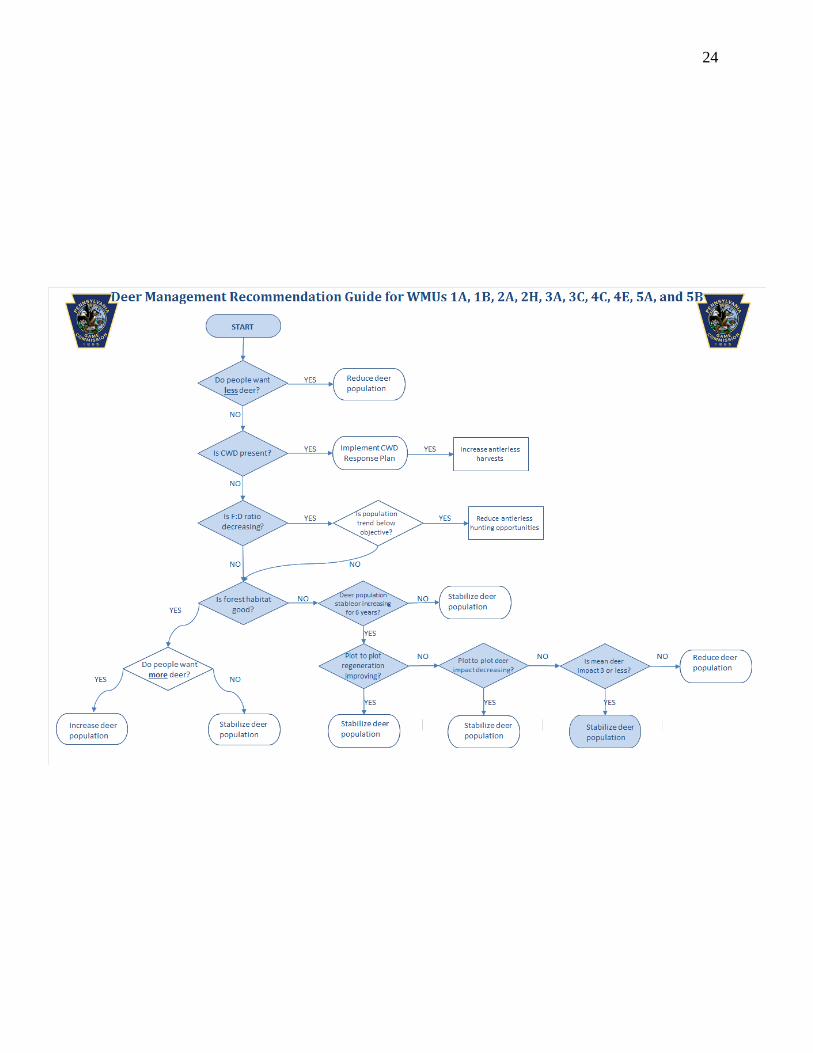
Is forest habitat good?
This question is answered using results from the Pennsylvania Regeneration Study. If 70% of
forested plots have adequate regeneration, forest habitat is considered good. If less than 50% of
forested plots have adequate regeneration, forest habitat is considered poor. If 50% to 70% of
forested plots have adequate regeneration, forest habitat is considered fair.
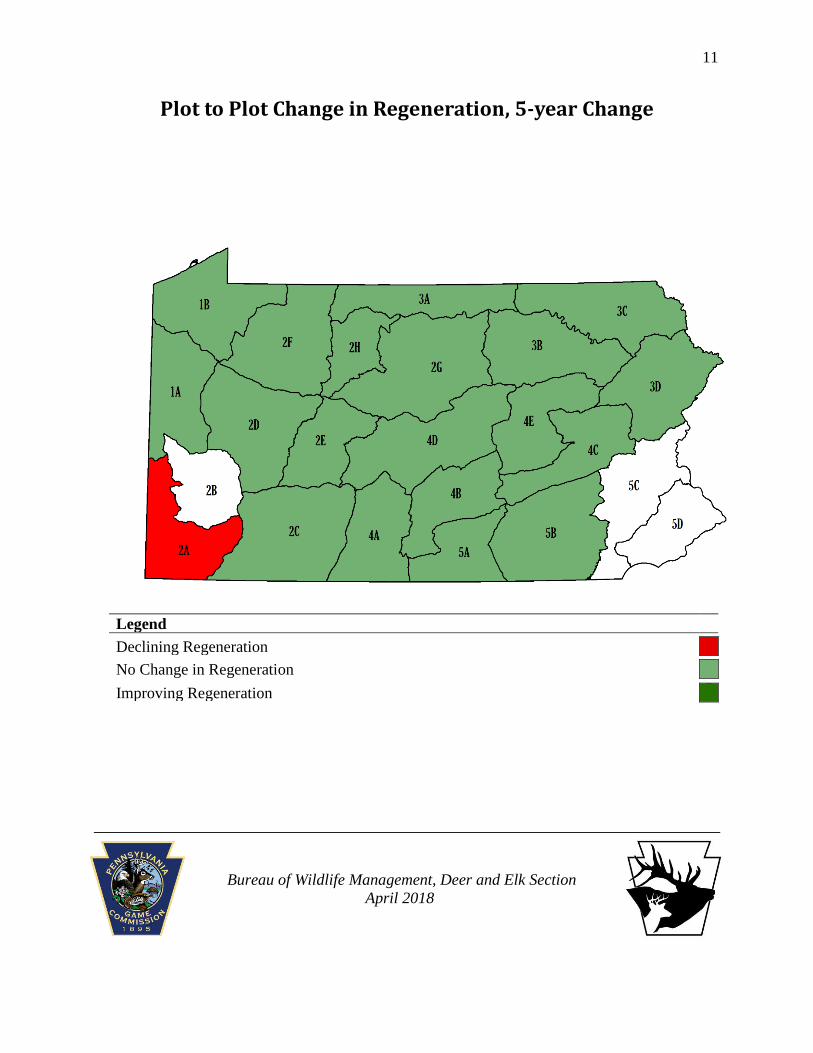
Is plot to plot regeneration improving?
This question is answered using results from the Pennsylvania Regeneration Study. In this step,
results from individual plots are compared in a paired analysis. For example, plot measurements
5
from 2005 are compared to their remeasured results in 2010 to see if regeneration has improved
on this plot. All plots with 2 measures are included in this analysis. If regeneration is improving,
then the deer population trend can be stabilized. If regeneration is not improving, the process
continues to the next step.
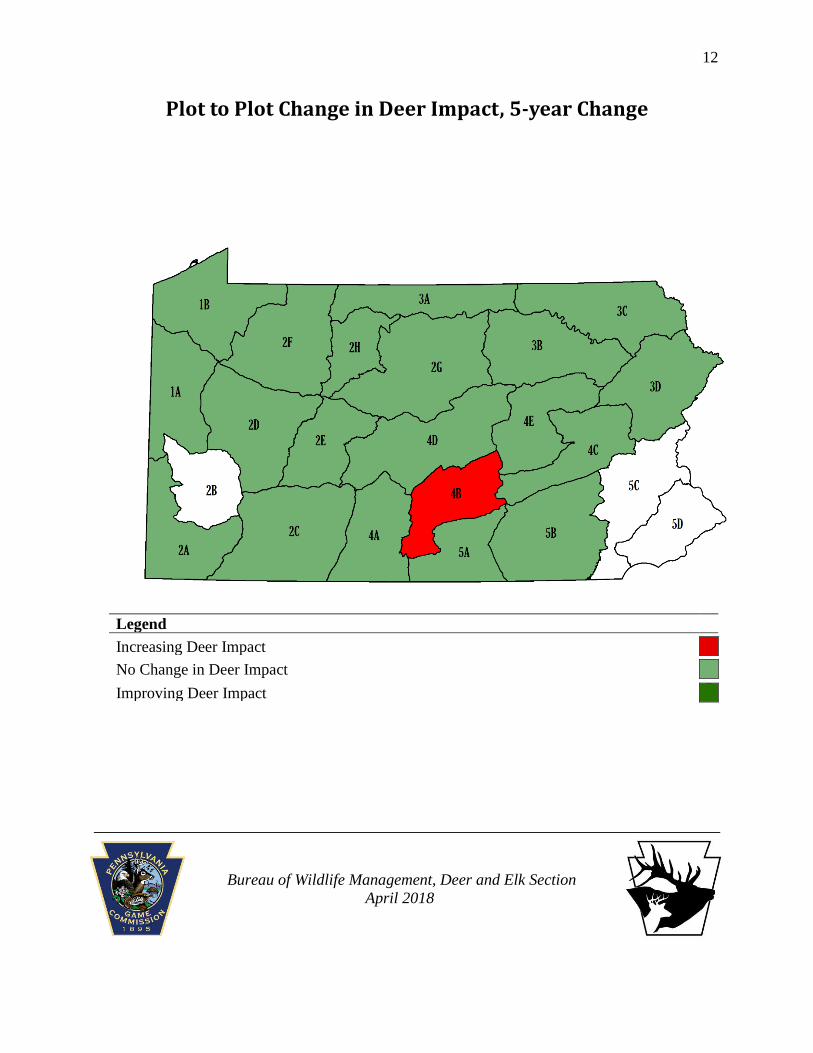
Is plot to plot deer impact improving?
This question is answered using results from the Pennsylvania Regeneration Study. In this step,
results from assessments of deer impact on a scale from 1 (very low) to 5 (very high) are
compared in the same way as the plot to plot regeneration analysis. If deer impact is improving
(i.e., going from a 4 [high] to 3 [moderate]) on enough plots, then the deer population trend can
be stabilized. If deer impact is not improving, the process continues to the next step.
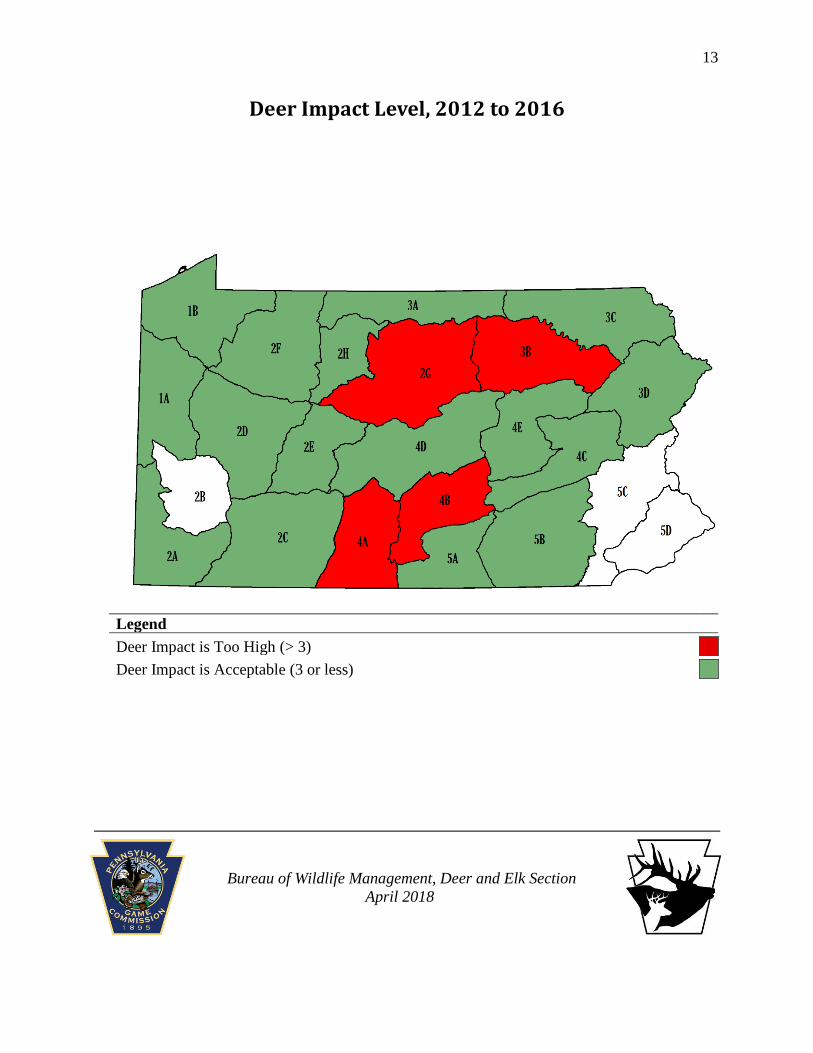
Is mean deer impact 3 or less?
This question is answered from the Pennsylvania Regeneration Study. In this step, the mean deer
impact for all plots measured in the most recent 5-year period is statistically compared to an
objective of 3 (i.e., moderate impact). If deer impact is significantly greater than 3 (moderate),
then the deer impact is too high and the deer population should be reduced. If deer impact is less
than or not different from 3 (moderate) then the deer population trend can be stabilized.
6
Figure 2. Guide used to develop deer population recommendations based on goals and
objectives of 2008-2019 deer management plan.
7
8
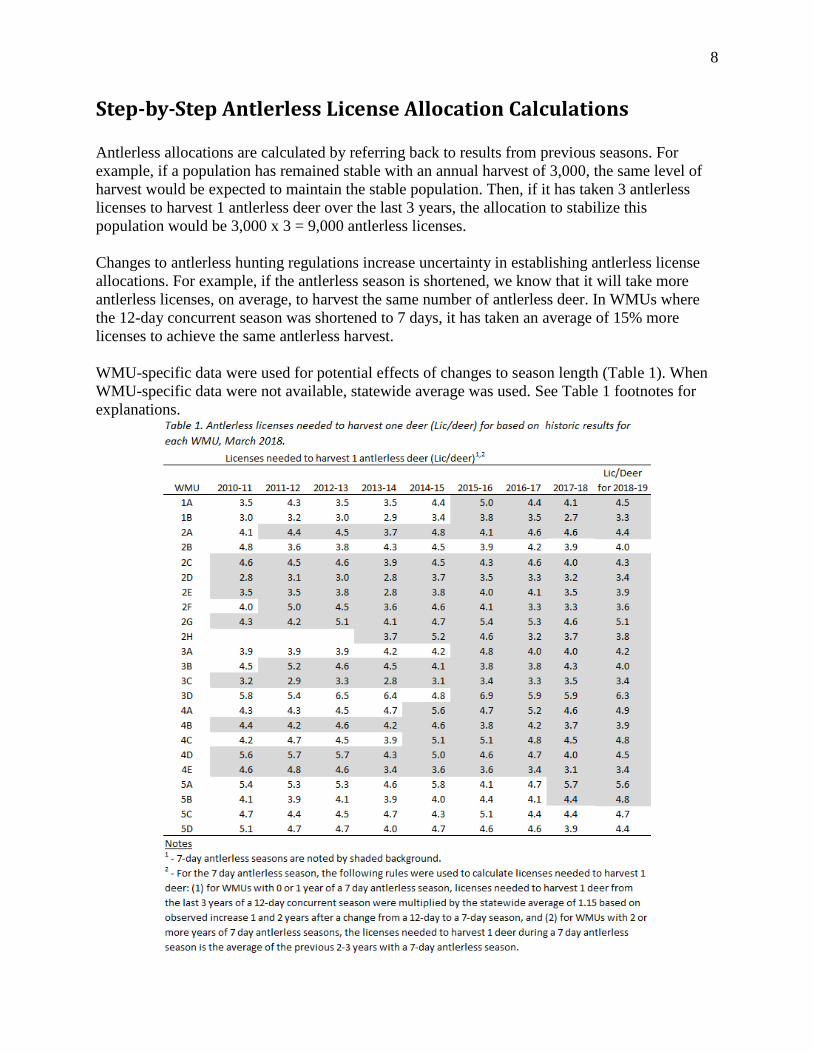
Step-by-Step Antlerless License Allocation Calculations
Antlerless allocations are calculated by referring back to results from previous seasons. For
example, if a population has remained stable with an annual harvest of 3,000, the same level of
harvest would be expected to maintain the stable population. Then, if it has taken 3 antlerless
licenses to harvest 1 antlerless deer over the last 3 years, the allocation to stabilize this
population would be 3,000 x 3 = 9,000 antlerless licenses.
Changes to antlerless hunting regulations increase uncertainty in establishing antlerless license
allocations. For example, if the antlerless season is shortened, we know that it will take more
antlerless licenses, on average, to harvest the same number of antlerless deer. In WMUs where
the 12-day concurrent season was shortened to 7 days, it has taken an average of 15% more
licenses to achieve the same antlerless harvest.
WMU-specific data were used for potential effects of changes to season length (Table 1). When
WMU-specific data were not available, statewide average was used. See Table 1 footnotes for
explanations.
9
Trend in Fawn to Doe Ratios, 2012 to 2017
Legend
Decreasing Fawn to Doe Ratio
Stable Fawn to Doe Ratio
Increasing Fawn to Doe Ratio
Bureau of Wildlife Management, Deer and Elk Section
April 2018
10
Forest Regeneration, 2012 to 2016
Legend
Poor Forest Regeneration Levels
Fair Forest Regeneration Levels
Good Forest Regeneration Levels
Bureau of Wildlife Management, Deer and Elk Section
April 2018
11
Plot to Plot Change in Regeneration, 5-year Change
Legend
Declining Regeneration
No Change in Regeneration
Improving Regeneration
Bureau of Wildlife Management, Deer and Elk Section
April 2018
12
Plot to Plot Change in Deer Impact, 5-year Change
Legend
Increasing Deer Impact
No Change in Deer Impact
Improving Deer Impact
Bureau of Wildlife Management, Deer and Elk Section
April 2018
13
Deer Impact Level, 2012 to 2016
Legend
Deer Impact is Too High (> 3)
Deer Impact is Acceptable (3 or less)
Bureau of Wildlife Management, Deer and Elk Section
April 2018
14
Post-Hunt Deer Population Trends, 2013 to 2018
Legend
Declining Deer Population
Stable Deer Population
Increasing Deer Population
Bureau of Wildlife Management, Deer and Elk Section
April 2018
15
Pennsylvania Residents Opinions on Deer Populations, 2011
Legend
Deer Population Too High
Deer Population Just Right
Deer Population Too Low
Bureau of Wildlife Management, Deer and Elk Section
April 2018
16
Chronic Wasting Disease Management Areas, 2018
Legend
Chronic Wasting Disease Management Areas
WMUs with CWD Detected in Wild Deer
WMUs with no CWD Positive Wild Deer Detected
Bureau of Wildlife Management, Deer and Elk Section
April 2018
17
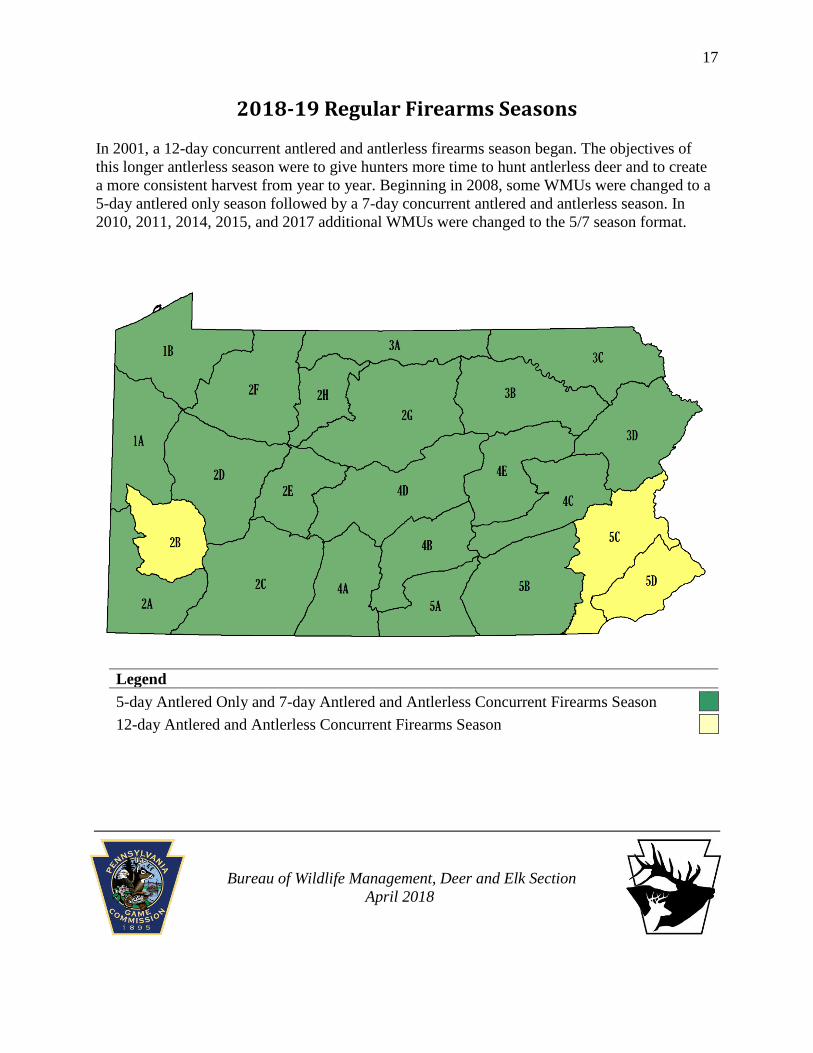
2018-19 Regular Firearms Seasons
In 2001, a 12-day concurrent antlered and antlerless firearms season began. The objectives of
this longer antlerless season were to give hunters more time to hunt antlerless deer and to create
a more consistent harvest from year to year. Beginning in 2008, some WMUs were changed to a
5-day antlered only season followed by a 7-day concurrent antlered and antlerless season. In
2010, 2011, 2014, 2015, and 2017 additional WMUs were changed to the 5/7 season format.
Legend
5-day Antlered Only and 7-day Antlered and Antlerless Concurrent Firearms Season
12-day Antlered and Antlerless Concurrent Firearms Season
Bureau of Wildlife Management, Deer and Elk Section
April 2018
18
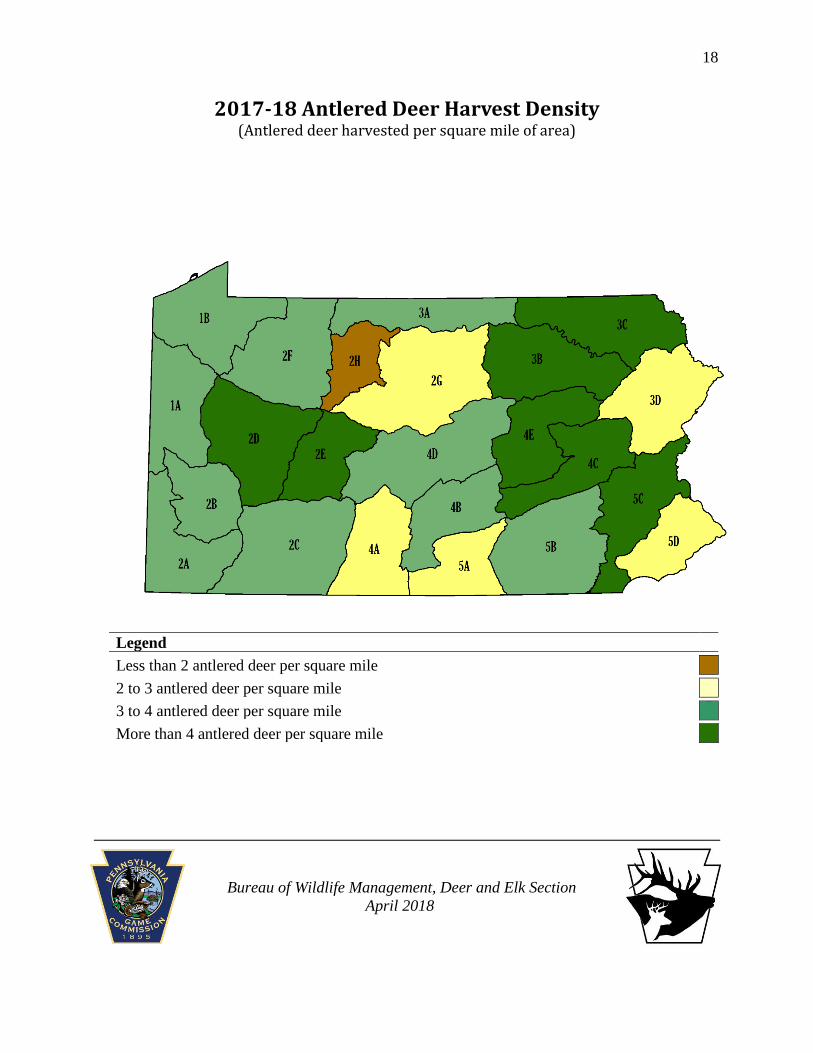
2017-18 Antlered Deer Harvest Density (Antlered deer harvested per square mile of area)
Legend
Less than 2 antlered deer per square mile
2 to 3 antlered deer per square mile
3 to 4 antlered deer per square mile
More than 4 antlered deer per square mile
Bureau of Wildlife Management, Deer and Elk Section
April 2018
19
Recommendation Guides and
Deer Population Datasheets These recommendation guides provide a step-by-step progression through the deer plan
goals and measurable objectives to arrive at a deer population recommendation. WMUs
with similar results are grouped into a common guide.
Supporting data for these guides are found in the individual WMU datasheets that follow.
20
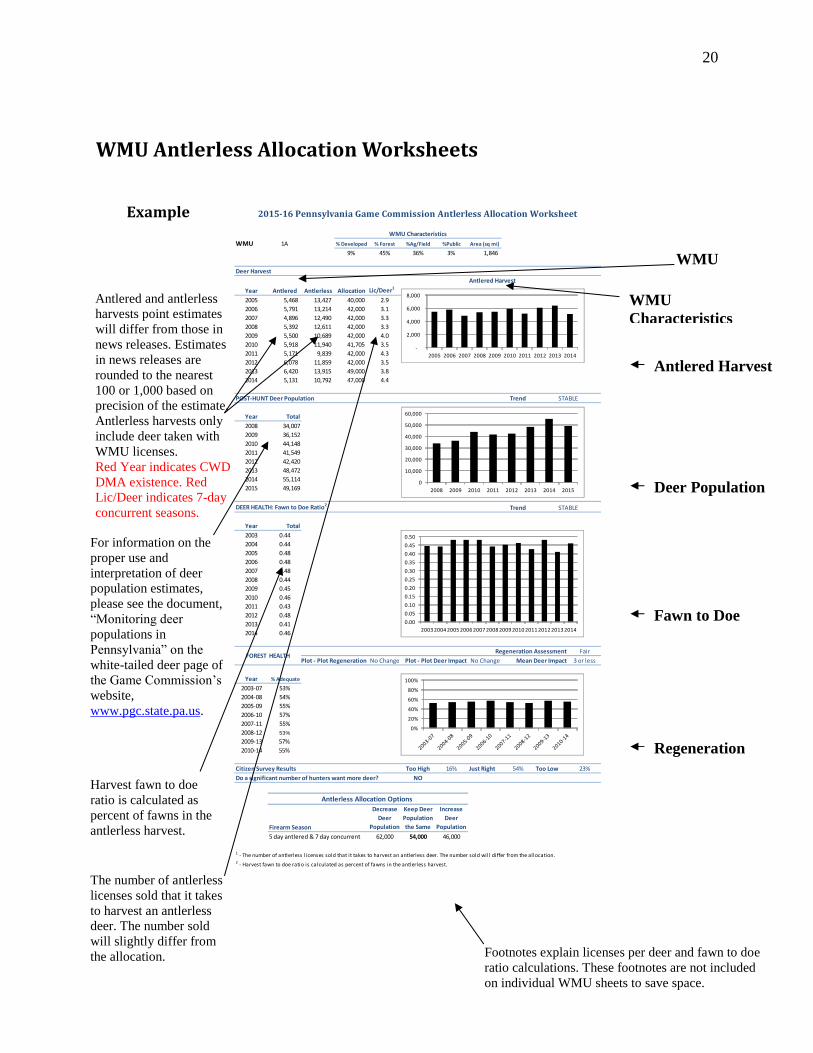
WMU Antlerless Allocation Worksheets
Example
Footnotes explain licenses per deer and fawn to doe
ratio calculations. These footnotes are not included
on individual WMU sheets to save space.
WMU 1A % Developed % Forest %Ag/Field %Public Area (sq mi)
9% 45% 36% 3% 1,846
Deer Harvest
Antlered Harvest
Year Antlered Antlerless Allocation Lic/Deer1
2005 5,468 13,427 40,000 2.9
2006 5,791 13,214 42,000 3.1
2007 4,896 12,490 42,000 3.3
2008 5,392 12,611 42,000 3.3
2009 5,500 10,689 42,000 4.0
2010 5,918 11,940 41,705 3.5
2011 5,171 9,839 42,000 4.3
2012 6,078 11,859 42,000 3.5
2013 6,420 13,915 49,000 3.8
2014 5,131 10,792 47,000 4.4
POST-HUNT Deer Population Trend
Year Total
2008 34,007
2009 36,152
2010 44,148
2011 41,549
2012 42,420
2013 48,472
2014 55,114
2015 49,169
DEER HEALTH: Fawn to Doe Ratio2Trend
Year Total
2003 0.44
2004 0.44
2005 0.48
2006 0.48
2007 0.48
2008 0.44
2009 0.45
2010 0.46
2011 0.43
2012 0.48
2013 0.41
2014 0.46
Regeneration Assessment Fair
Plot - Plot Regeneration No Change Plot - Plot Deer Impact No Change Mean Deer Impact 3 or less
Year % Adequate
2003-07 53%
2004-08 54%
2005-09 55%
2006-10 57%
2007-11 55%
2008-12 53%
2009-13 57%
2010-14 55%
Citizen Survey Results Too High 16% Just Right 54% Too Low 23%
Do a significant number of hunters want more deer? NO
Firearm Season
Decrease
Deer
Population
Keep Deer
Population
the Same
Increase
Deer
Population
5 day antlered & 7 day concurrent 62,000 54,000 46,000
1 - The number of antlerless l icenses sold that it takes to harvest an antlerless deer. The number sold will differ from the allocation.2 - Harvest fawn to doe ratio is calculated as percent of fawns in the antlerless harvest.
Antlerless Allocation Options
2015-16 Pennsylvania Game Commission Antlerless Allocation Worksheet
WMU Characteristics
STABLE
STABLE
FOREST HEALTH
0
10,000
20,000
30,000
40,000
50,000
60,000
2008 2009 2010 2011 2012 2013 2014 2015
-
2,000
4,000
6,000
8,000
2005 2006 2007 2008 2009 2010 2011 2012 2013 2014
0.00
0.05
0.10
0.15
0.20
0.25
0.30
0.35
0.40
0.45
0.50
2003 2004 2005 2006 2007 2008 2009 2010 2011 2012 2013 2014
0%
20%
40%
60%
80%
100%
Antlered Harvest
Graph
Deer Population
Graph
Fawn to Doe
Regeneration
Harvest fawn to doe
ratio is calculated as
percent of fawns in the
antlerless harvest.
The number of antlerless
licenses sold that it takes
to harvest an antlerless
deer. The number sold
will slightly differ from
the allocation.
For information on the
proper use and
interpretation of deer
population estimates,
please see the document,
“Monitoring deer
populations in
Pennsylvania” on the
white-tailed deer page of
the Game Commission’s
website,
www.pgc.state.pa.us.
WMU
Characteristics
WMU
Antlered and antlerless
harvests point estimates
will differ from those in
news releases. Estimates
in news releases are
rounded to the nearest
100 or 1,000 based on
precision of the estimate.
Antlerless harvests only
include deer taken with
WMU licenses.
Red Year indicates CWD
DMA existence. Red
Lic/Deer indicates 7-day
concurrent seasons.
21
YES
NO
YES YES
NO
YES YES
NO NO
NO
YES
Deer Management Recommendation GuideFOR WMUs 2B, 5C, and 5D
START
Is CWD present?Implement CWDResponse Plan
Is F:D ratio decreasing?
Is populationtrend below objective?
Reduce antlerlesshunting opportunities
Do people wantmore deer?
Increase deer population
Stabilize deer population
Reduce deer population
Do people wantless deer?
Increase antlerlessharvests
22
23
24
25
26
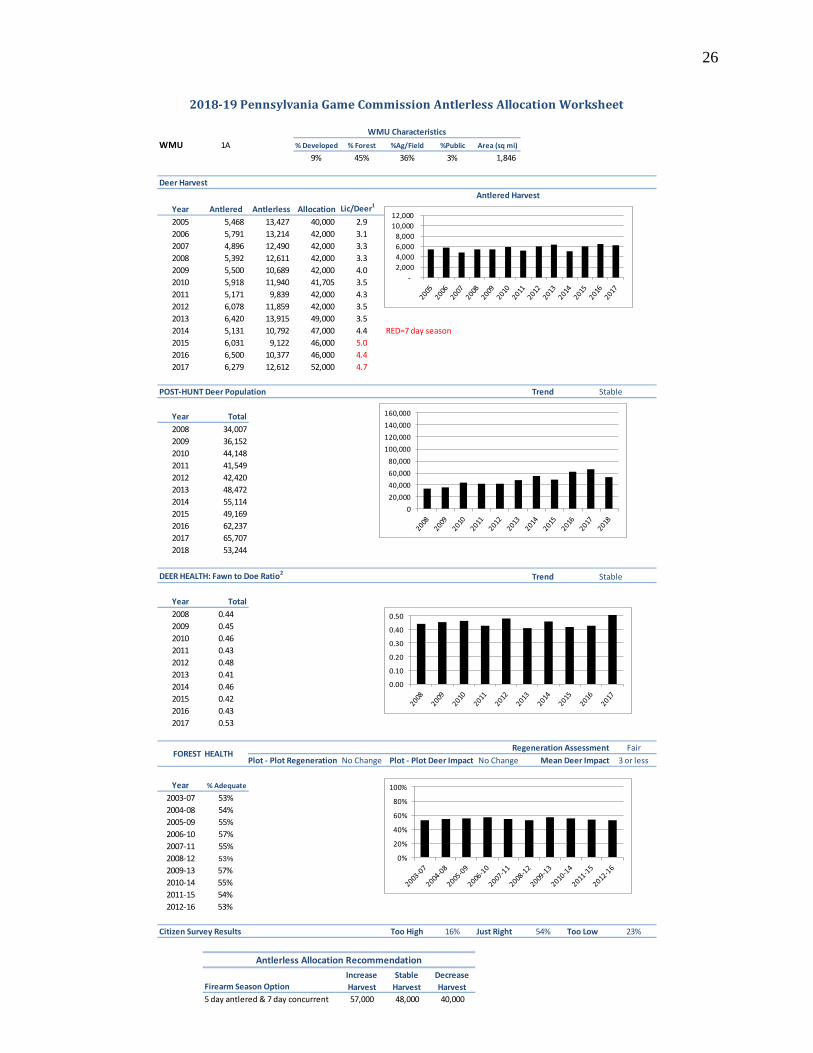
WMU 1A % Developed % Forest %Ag/Field %Public Area (sq mi)
9% 45% 36% 3% 1,846
Deer Harvest
Antlered Harvest
Year Antlered Antlerless Allocation Lic/Deer1
2005 5,468 13,427 40,000 2.9
2006 5,791 13,214 42,000 3.1
2007 4,896 12,490 42,000 3.3
2008 5,392 12,611 42,000 3.3
2009 5,500 10,689 42,000 4.0
2010 5,918 11,940 41,705 3.5
2011 5,171 9,839 42,000 4.3
2012 6,078 11,859 42,000 3.5
2013 6,420 13,915 49,000 3.5
2014 5,131 10,792 47,000 4.4 RED=7 day season
2015 6,031 9,122 46,000 5.0
2016 6,500 10,377 46,000 4.4
2017 6,279 12,612 52,000 4.7
POST-HUNT Deer Population Trend
Year Total
2008 34,007
2009 36,152
2010 44,148
2011 41,549
2012 42,420
2013 48,472
2014 55,114
2015 49,169
2016 62,237
2017 65,707
2018 53,244
DEER HEALTH: Fawn to Doe Ratio2Trend
Year Total
2008 0.44
2009 0.45
2010 0.46
2011 0.43
2012 0.48
2013 0.41
2014 0.46
2015 0.42
2016 0.43
2017 0.53
Regeneration Assessment Fair
Plot - Plot Regeneration No Change Plot - Plot Deer Impact No Change Mean Deer Impact 3 or less
Year % Adequate
2003-07 53%
2004-08 54%
2005-09 55%
2006-10 57%
2007-11 55%
2008-12 53%
2009-13 57%
2010-14 55%
2011-15 54%
2012-16 53%
Citizen Survey Results Too High 16% Just Right 54% Too Low 23%
Firearm Season Option
5 day antlered & 7 day concurrent 57,000 48,000 40,000
Antlerless Allocation Recommendation
2018-19 Pennsylvania Game Commission Antlerless Allocation Worksheet
WMU Characteristics
Stable
Stable
FOREST HEALTH
Increase
Harvest
Stable
Harvest
Decrease
Harvest
0
20,000
40,000
60,000
80,000
100,000
120,000
140,000
160,000
-
2,000
4,000
6,000
8,000
10,000
12,000
0.00
0.10
0.20
0.30
0.40
0.50
0%
20%
40%
60%
80%
100%
27
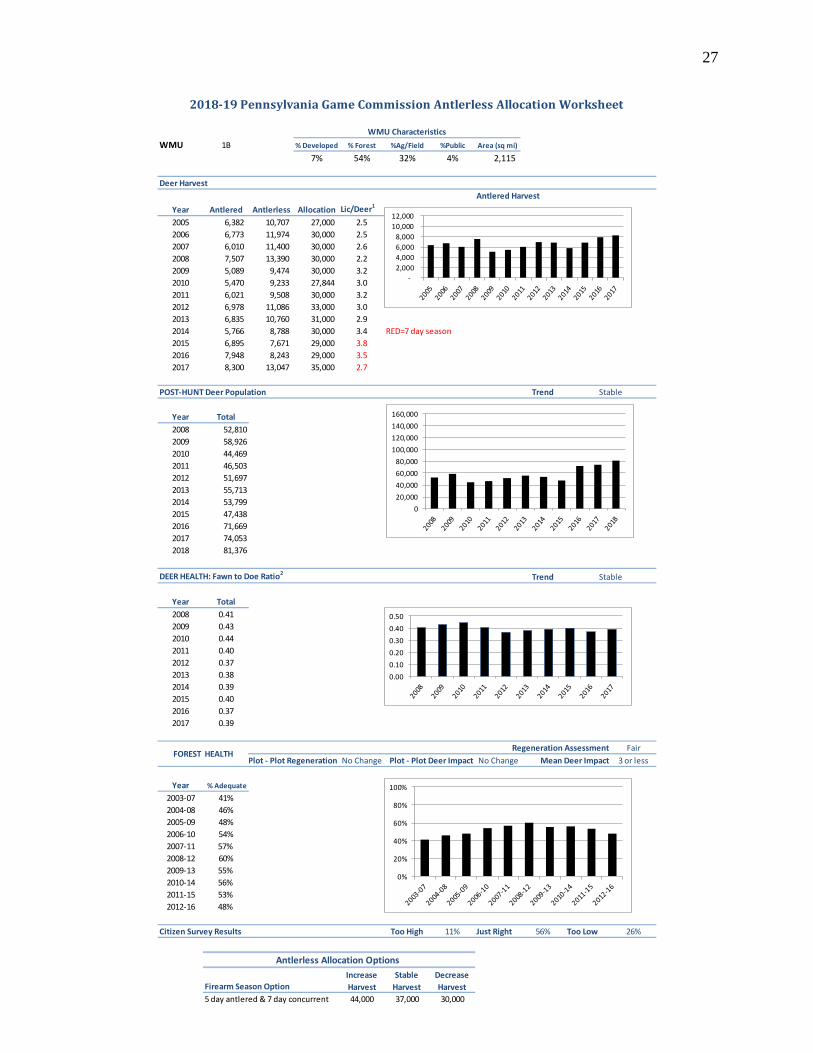
WMU 1B % Developed % Forest %Ag/Field %Public Area (sq mi)
7% 54% 32% 4% 2,115
Deer Harvest
Antlered Harvest
Year Antlered Antlerless Allocation Lic/Deer1
2005 6,382 10,707 27,000 2.5
2006 6,773 11,974 30,000 2.5
2007 6,010 11,400 30,000 2.6
2008 7,507 13,390 30,000 2.2
2009 5,089 9,474 30,000 3.2
2010 5,470 9,233 27,844 3.0
2011 6,021 9,508 30,000 3.2
2012 6,978 11,086 33,000 3.0
2013 6,835 10,760 31,000 2.9
2014 5,766 8,788 30,000 3.4 RED=7 day season
2015 6,895 7,671 29,000 3.8
2016 7,948 8,243 29,000 3.5
2017 8,300 13,047 35,000 2.7
POST-HUNT Deer Population Trend
Year Total
2008 52,810
2009 58,926
2010 44,469
2011 46,503
2012 51,697
2013 55,713
2014 53,799
2015 47,438
2016 71,669
2017 74,053
2018 81,376
DEER HEALTH: Fawn to Doe Ratio2Trend
Year Total
2008 0.41
2009 0.43
2010 0.44
2011 0.40
2012 0.37
2013 0.38
2014 0.39
2015 0.40
2016 0.37
2017 0.39
Regeneration Assessment Fair
Plot - Plot Regeneration No Change Plot - Plot Deer Impact No Change Mean Deer Impact 3 or less
Year % Adequate
2003-07 41%
2004-08 46%
2005-09 48%
2006-10 54%
2007-11 57%
2008-12 60%
2009-13 55%
2010-14 56%
2011-15 53%
2012-16 48%
Citizen Survey Results Too High 11% Just Right 56% Too Low 26%
Firearm Season Option
5 day antlered & 7 day concurrent 44,000 37,000 30,000
Antlerless Allocation Options
2018-19 Pennsylvania Game Commission Antlerless Allocation Worksheet
WMU Characteristics
Stable
Stable
FOREST HEALTH
Increase
Harvest
Stable
Harvest
Decrease
Harvest
0
20,000
40,000
60,000
80,000
100,000
120,000
140,000
160,000
-
2,000
4,000
6,000
8,000
10,000
12,000
0.00
0.10
0.20
0.30
0.40
0.50
0%
20%
40%
60%
80%
100%
28
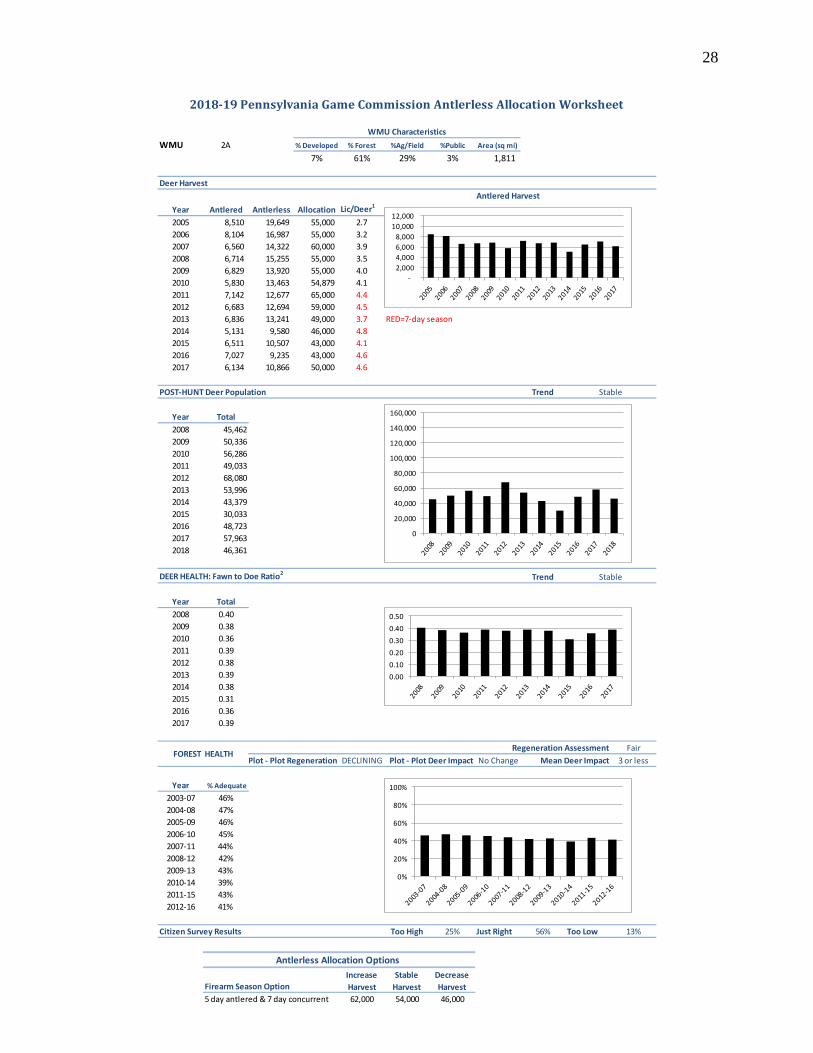
WMU 2A % Developed % Forest %Ag/Field %Public Area (sq mi)
7% 61% 29% 3% 1,811
Deer Harvest
Antlered Harvest
Year Antlered Antlerless Allocation Lic/Deer1
2005 8,510 19,649 55,000 2.7
2006 8,104 16,987 55,000 3.2
2007 6,560 14,322 60,000 3.9
2008 6,714 15,255 55,000 3.5
2009 6,829 13,920 55,000 4.0
2010 5,830 13,463 54,879 4.1
2011 7,142 12,677 65,000 4.4
2012 6,683 12,694 59,000 4.5
2013 6,836 13,241 49,000 3.7 RED=7-day season
2014 5,131 9,580 46,000 4.8
2015 6,511 10,507 43,000 4.1
2016 7,027 9,235 43,000 4.6
2017 6,134 10,866 50,000 4.6
POST-HUNT Deer Population Trend
Year Total
2008 45,462
2009 50,336
2010 56,286
2011 49,033
2012 68,080
2013 53,996
2014 43,379
2015 30,033
2016 48,723
2017 57,963
2018 46,361
DEER HEALTH: Fawn to Doe Ratio2Trend
Year Total
2008 0.40
2009 0.38
2010 0.36
2011 0.39
2012 0.38
2013 0.39
2014 0.38
2015 0.31
2016 0.36
2017 0.39
Regeneration Assessment Fair
Plot - Plot Regeneration DECLINING Plot - Plot Deer Impact No Change Mean Deer Impact 3 or less
Year % Adequate
2003-07 46%
2004-08 47%
2005-09 46%
2006-10 45%
2007-11 44%
2008-12 42%
2009-13 43%
2010-14 39%
2011-15 43%
2012-16 41%
Citizen Survey Results Too High 25% Just Right 56% Too Low 13%
Firearm Season Option
5 day antlered & 7 day concurrent 62,000 54,000 46,000
Antlerless Allocation Options
2018-19 Pennsylvania Game Commission Antlerless Allocation Worksheet
WMU Characteristics
Stable
Stable
FOREST HEALTH
Increase
Harvest
Stable
Harvest
Decrease
Harvest
0
20,000
40,000
60,000
80,000
100,000
120,000
140,000
160,000
-
2,000
4,000
6,000
8,000
10,000
12,000
0.00
0.10
0.20
0.30
0.40
0.50
0%
20%
40%
60%
80%
100%
29
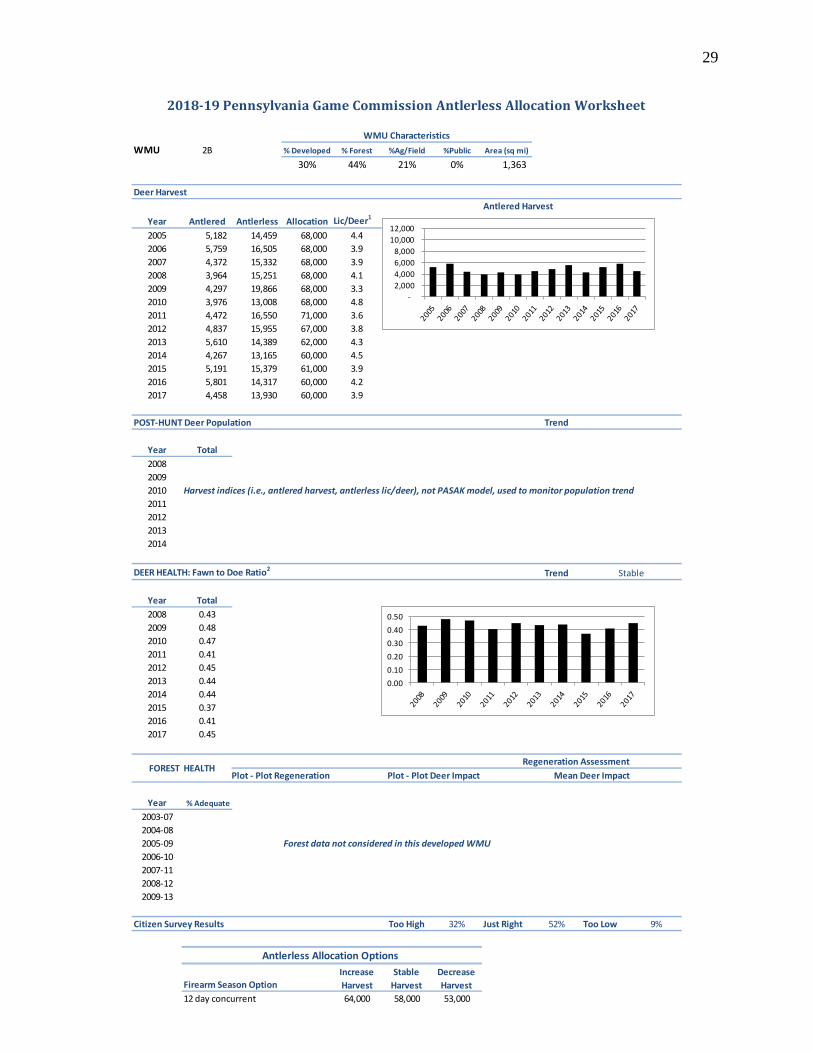
WMU 2B % Developed % Forest %Ag/Field %Public Area (sq mi)
30% 44% 21% 0% 1,363
Deer Harvest
Antlered Harvest
Year Antlered Antlerless Allocation Lic/Deer1
2005 5,182 14,459 68,000 4.4
2006 5,759 16,505 68,000 3.9
2007 4,372 15,332 68,000 3.9
2008 3,964 15,251 68,000 4.1
2009 4,297 19,866 68,000 3.3
2010 3,976 13,008 68,000 4.8
2011 4,472 16,550 71,000 3.6
2012 4,837 15,955 67,000 3.8
2013 5,610 14,389 62,000 4.3
2014 4,267 13,165 60,000 4.5
2015 5,191 15,379 61,000 3.9
2016 5,801 14,317 60,000 4.2
2017 4,458 13,930 60,000 3.9
POST-HUNT Deer Population Trend
Year Total
2008
2009
2010 Harvest indices (i.e., antlered harvest, antlerless lic/deer), not PASAK model, used to monitor population trend
2011
2012
2013
2014
DEER HEALTH: Fawn to Doe Ratio2Trend
Year Total
2008 0.43
2009 0.48
2010 0.47
2011 0.41
2012 0.45
2013 0.44
2014 0.44
2015 0.37
2016 0.41
2017 0.45
Regeneration Assessment
Plot - Plot Regeneration Plot - Plot Deer Impact Mean Deer Impact
Year % Adequate
2003-07
2004-08
2005-09 Forest data not considered in this developed WMU
2006-10
2007-11
2008-12
2009-13
Citizen Survey Results Too High 32% Just Right 52% Too Low 9%
Firearm Season Option
12 day concurrent 64,000 58,000 53,000
Antlerless Allocation Options
2018-19 Pennsylvania Game Commission Antlerless Allocation Worksheet
WMU Characteristics
Stable
FOREST HEALTH
Increase
Harvest
Stable
Harvest
Decrease
Harvest
-
2,000
4,000
6,000
8,000
10,000
12,000
0.00
0.10
0.20
0.30
0.40
0.50
30
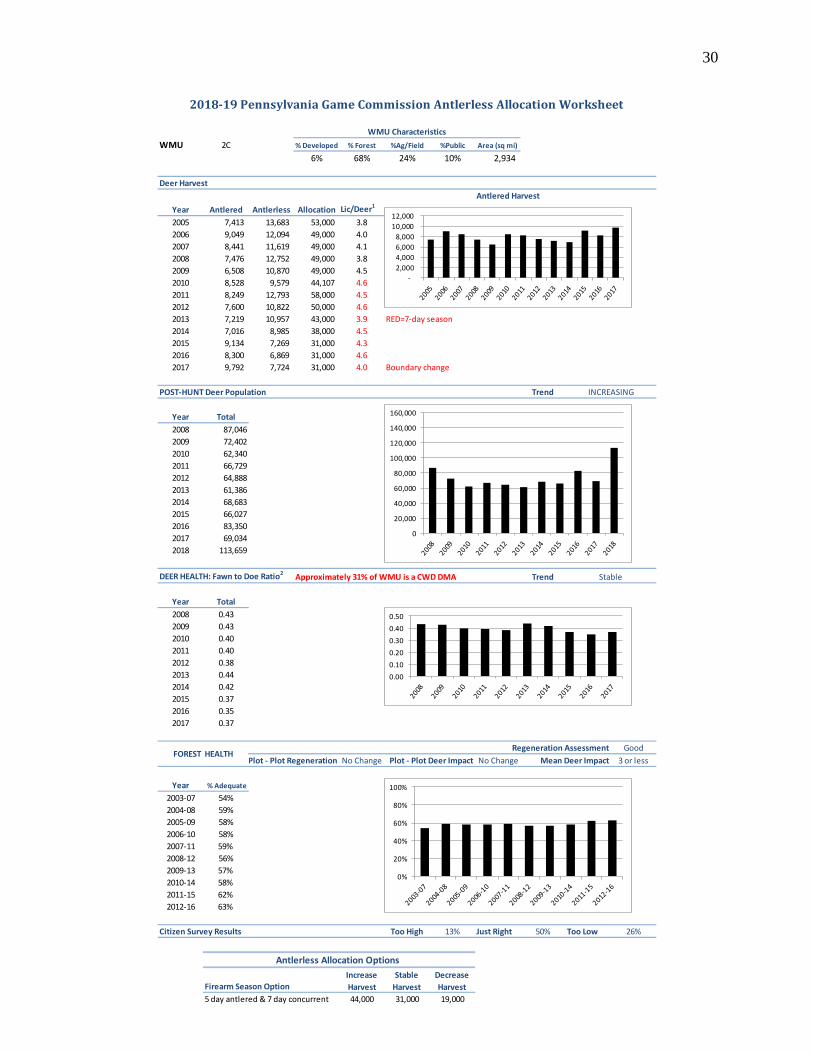
WMU 2C % Developed % Forest %Ag/Field %Public Area (sq mi)
6% 68% 24% 10% 2,934
Deer Harvest
Antlered Harvest
Year Antlered Antlerless Allocation Lic/Deer1
2005 7,413 13,683 53,000 3.8
2006 9,049 12,094 49,000 4.0
2007 8,441 11,619 49,000 4.1
2008 7,476 12,752 49,000 3.8
2009 6,508 10,870 49,000 4.5
2010 8,528 9,579 44,107 4.6
2011 8,249 12,793 58,000 4.5
2012 7,600 10,822 50,000 4.6
2013 7,219 10,957 43,000 3.9 RED=7-day season
2014 7,016 8,985 38,000 4.5
2015 9,134 7,269 31,000 4.3
2016 8,300 6,869 31,000 4.6
2017 9,792 7,724 31,000 4.0 Boundary change
POST-HUNT Deer Population Trend
Year Total
2008 87,046
2009 72,402
2010 62,340
2011 66,729
2012 64,888
2013 61,386
2014 68,683
2015 66,027
2016 83,350
2017 69,034
2018 113,659
DEER HEALTH: Fawn to Doe Ratio2Approximately 31% of WMU is a CWD DMA Trend
Year Total
2008 0.43
2009 0.43
2010 0.40
2011 0.40
2012 0.38
2013 0.44
2014 0.42
2015 0.37
2016 0.35
2017 0.37
Regeneration Assessment Good
Plot - Plot Regeneration No Change Plot - Plot Deer Impact No Change Mean Deer Impact 3 or less
Year % Adequate
2003-07 54%
2004-08 59%
2005-09 58%
2006-10 58%
2007-11 59%
2008-12 56%
2009-13 57%
2010-14 58%
2011-15 62%
2012-16 63%
Citizen Survey Results Too High 13% Just Right 50% Too Low 26%
Firearm Season Option
5 day antlered & 7 day concurrent 44,000 31,000 19,000
Antlerless Allocation Options
2018-19 Pennsylvania Game Commission Antlerless Allocation Worksheet
WMU Characteristics
INCREASING
Stable
FOREST HEALTH
Increase
Harvest
Stable
Harvest
Decrease
Harvest
0
20,000
40,000
60,000
80,000
100,000
120,000
140,000
160,000
-
2,000
4,000
6,000
8,000
10,000
12,000
0.00
0.10
0.20
0.30
0.40
0.50
0%
20%
40%
60%
80%
100%

31
WMU 2D % Developed % Forest %Ag/Field %Public Area (sq mi)
5% 60% 31% 2% 2,486
Deer Harvest
Antlered Harvest
Year Antlered Antlerless Allocation Lic/Deer1
2005 9,975 22,054 56,000 2.5
2006 10,896 20,437 56,000 2.7
2007 9,118 18,099 56,000 3.1
2008 9,508 15,591 56,000 3.5
2009 9,977 15,962 56,000 3.5
2010 11,540 18,046 50,123 2.8
2011 11,130 19,257 60,000 3.1
2012 13,660 20,839 62,000 3.0
2013 13,704 21,614 61,000 2.8
2014 11,417 16,441 61,000 3.7 RED=7-day season
2015 12,292 15,728 55,000 3.5
2016 12,843 16,447 55,000 3.3
2017 14,716 17,033 55,000 3.2
POST-HUNT Deer Population Trend
Year Total
2008 69,732
2009 88,666
2010 86,493
2011 101,182
2012 102,440
2013 113,774
2014 144,084
2015 110,214
2016 117,823
2017 112,499
2018 140,281
DEER HEALTH: Fawn to Doe Ratio2Trend
Year Total
2008 0.44
2009 0.39
2010 0.42
2011 0.44
2012 0.42
2013 0.42
2014 0.40
2015 0.37
2016 0.36
2017 0.37
Regeneration Assessment Fair
Plot - Plot Regeneration No Change Plot - Plot Deer Impact No Change Mean Deer Impact 3 or less
Year % Adequate
2003-07 52%
2004-08 54%
2005-09 51%
2006-10 52%
2007-11 49%
2008-12 46%
2009-13 50%
2010-14 45%
2011-15 44%
2012-16 50%
Citizen Survey Results Too High 23% Just Right 52% Too Low 19%
Firearm Season Option
5 day antlered & 7 day concurrent 63,000 55,000 47,000
Antlerless Allocation Options
2018-19 Pennsylvania Game Commission Antlerless Allocation Worksheet
WMU Characteristics
Stable
Declining
FOREST HEALTH
Increase
Harvest
Stable
Harvest
Decrease
Harvest
0
20,000
40,000
60,000
80,000
100,000
120,000
140,000
160,000
2,000
4,000
6,000
8,000
10,000
12,000
14,000
0.00
0.10
0.20
0.30
0.40
0.50
0%
20%
40%
60%
80%
100%
32
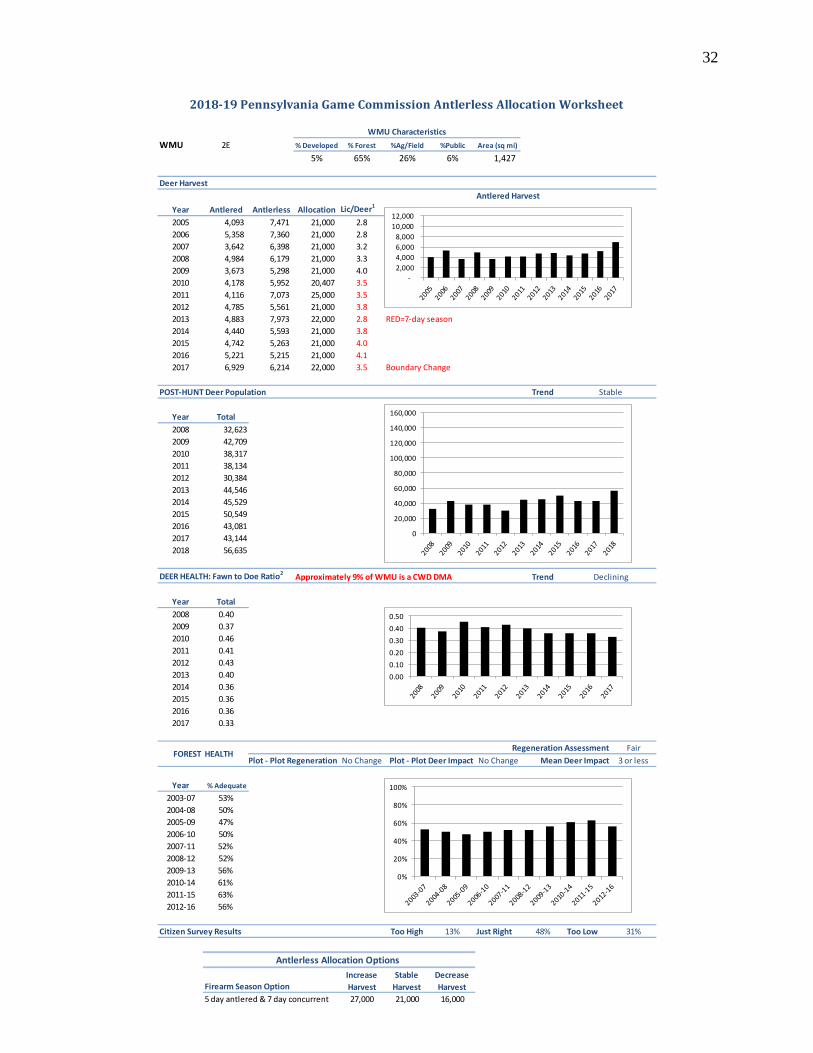
WMU 2E % Developed % Forest %Ag/Field %Public Area (sq mi)
5% 65% 26% 6% 1,427
Deer Harvest
Antlered Harvest
Year Antlered Antlerless Allocation Lic/Deer1
2005 4,093 7,471 21,000 2.8
2006 5,358 7,360 21,000 2.8
2007 3,642 6,398 21,000 3.2
2008 4,984 6,179 21,000 3.3
2009 3,673 5,298 21,000 4.0
2010 4,178 5,952 20,407 3.5
2011 4,116 7,073 25,000 3.5
2012 4,785 5,561 21,000 3.8
2013 4,883 7,973 22,000 2.8 RED=7-day season
2014 4,440 5,593 21,000 3.8
2015 4,742 5,263 21,000 4.0
2016 5,221 5,215 21,000 4.1
2017 6,929 6,214 22,000 3.5 Boundary Change
POST-HUNT Deer Population Trend
Year Total
2008 32,623
2009 42,709
2010 38,317
2011 38,134
2012 30,384
2013 44,546
2014 45,529
2015 50,549
2016 43,081
2017 43,144
2018 56,635
DEER HEALTH: Fawn to Doe Ratio2Approximately 9% of WMU is a CWD DMA Trend
Year Total
2008 0.40
2009 0.37
2010 0.46
2011 0.41
2012 0.43
2013 0.40
2014 0.36
2015 0.36
2016 0.36
2017 0.33
Regeneration Assessment Fair
Plot - Plot Regeneration No Change Plot - Plot Deer Impact No Change Mean Deer Impact 3 or less
Year % Adequate
2003-07 53%
2004-08 50%
2005-09 47%
2006-10 50%
2007-11 52%
2008-12 52%
2009-13 56%
2010-14 61%
2011-15 63%
2012-16 56%
Citizen Survey Results Too High 13% Just Right 48% Too Low 31%
Firearm Season Option
5 day antlered & 7 day concurrent 27,000 21,000 16,000
Antlerless Allocation Options
2018-19 Pennsylvania Game Commission Antlerless Allocation Worksheet
WMU Characteristics
Stable
Declining
FOREST HEALTH
Increase
Harvest
Stable
Harvest
Decrease
Harvest
0
20,000
40,000
60,000
80,000
100,000
120,000
140,000
160,000
-
2,000
4,000
6,000
8,000
10,000
12,000
0.00
0.10
0.20
0.30
0.40
0.50
0%
20%
40%
60%
80%
100%
33
WMU 2F % Developed % Forest %Ag/Field %Public Area (sq mi)
2% 88% 7% 56% 2,409
Deer Harvest
Antlered Harvest
Year Antlered Antlerless Allocation Lic/Deer1
2005 6,013 8,322 30,000 3.5
2006 7,153 8,030 28,000 3.5
2007 4,795 7,132 28,000 3.9
2008 6,990 9,117 28,000 3.0
2009 5,167 6,648 28,000 4.3
2010 6,403 5,657 22,148 4.0
2011 5,393 6,737 34,000 5.0
2012 7,139 6,067 27,000 4.5
2013 6,607 8,008 29,000 3.6 RED=7-day season
2014 5,979 5,915 27,000 4.6
2015 6,989 5,434 22,000 4.1
2016 7,678 6,718 22,000 3.3
2017 9,489 7,200 24,000 3.3
POST-HUNT Deer Population Trend
Year Total
2008 47,288
2009 67,724
2010 46,887
2011 70,765
2012 53,210
2013 83,063
2014 65,614
2015 61,020
2016 67,152
2017 74,387
2018 108,575
DEER HEALTH: Fawn to Doe Ratio2Trend
Year Total
2008 0.35
2009 0.34
2010 0.39
2011 0.40
2012 0.39
2013 0.38
2014 0.37
2015 0.34
2016 0.33
2017 0.36
Regeneration Assessment Good
Plot - Plot Regeneration No Change Plot - Plot Deer Impact No Change Mean Deer Impact 3 or less
Year % Adequate
2003-07 47%
2004-08 50%
2005-09 50%
2006-10 54%
2007-11 54%
2008-12 54%
2009-13 54%
2010-14 58%
2011-15 61%
2012-16 65%
Citizen Survey Results Too High 10% Just Right 39% Too Low 42%
Firearm Season Option
5 day antlered & 7 day concurrent 32,000 23,000 14,000
Antlerless Allocation Options
2018-19 Pennsylvania Game Commission Antlerless Allocation Worksheet
WMU Characteristics
Stable
Declining
FOREST HEALTH
Increase
Harvest
Stable
Harvest
Decrease
Harvest
0
20,000
40,000
60,000
80,000
100,000
120,000
140,000
160,000
-
2,000
4,000
6,000
8,000
10,000
12,000
0.00
0.10
0.20
0.30
0.40
0.50
0%
20%
40%
60%
80%
100%
34
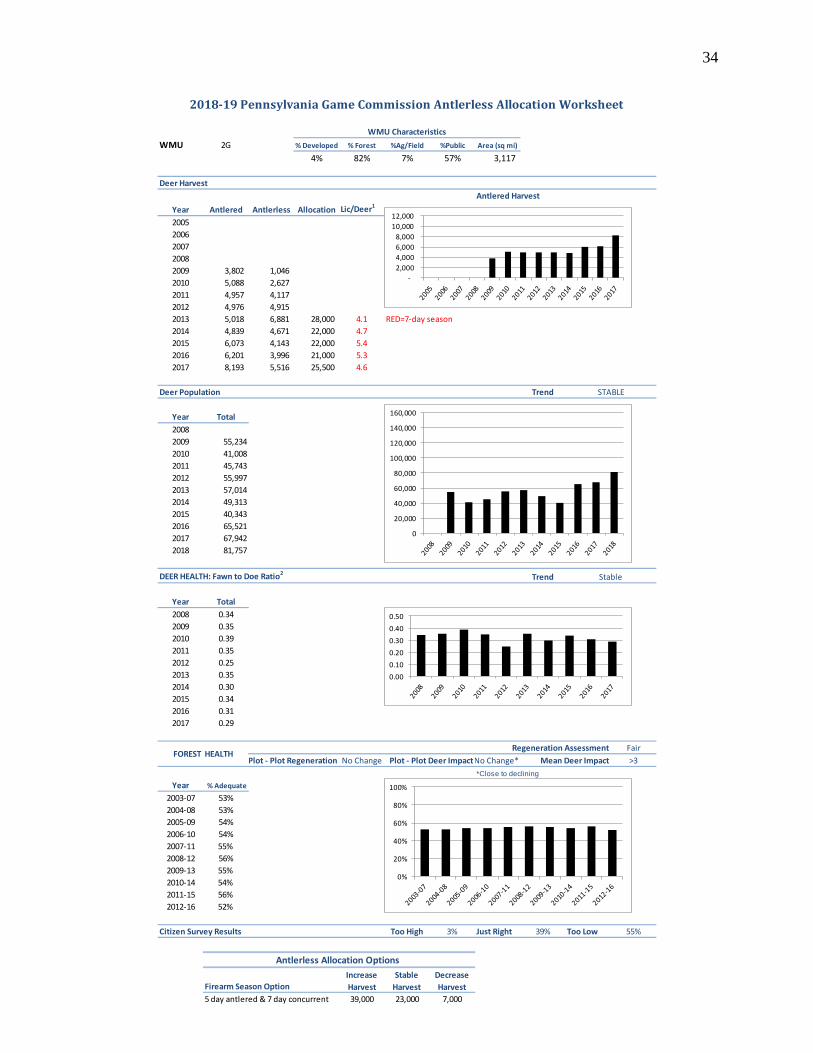
WMU 2G % Developed % Forest %Ag/Field %Public Area (sq mi)
4% 82% 7% 57% 3,117
Deer Harvest
Antlered Harvest
Year Antlered Antlerless Allocation Lic/Deer1
2005
2006
2007
2008
2009 3,802 1,046
2010 5,088 2,627
2011 4,957 4,117
2012 4,976 4,915
2013 5,018 6,881 28,000 4.1 RED=7-day season
2014 4,839 4,671 22,000 4.7
2015 6,073 4,143 22,000 5.4
2016 6,201 3,996 21,000 5.3
2017 8,193 5,516 25,500 4.6
Deer Population Trend
Year Total
2008
2009 55,234
2010 41,008
2011 45,743
2012 55,997
2013 57,014
2014 49,313
2015 40,343
2016 65,521
2017 67,942
2018 81,757
DEER HEALTH: Fawn to Doe Ratio2Trend
Year Total
2008 0.34
2009 0.35
2010 0.39
2011 0.35
2012 0.25
2013 0.35
2014 0.30
2015 0.34
2016 0.31
2017 0.29
Regeneration Assessment Fair
Plot - Plot Regeneration No Change Plot - Plot Deer ImpactNo Change* Mean Deer Impact >3
*Close to declining
Year % Adequate
2003-07 53%
2004-08 53%
2005-09 54%
2006-10 54%
2007-11 55%
2008-12 56%
2009-13 55%
2010-14 54%
2011-15 56%
2012-16 52%
Citizen Survey Results Too High 3% Just Right 39% Too Low 55%
Firearm Season Option
5 day antlered & 7 day concurrent 39,000 23,000 7,000
FOREST HEALTH
Antlerless Allocation Options
2018-19 Pennsylvania Game Commission Antlerless Allocation Worksheet
WMU Characteristics
STABLE
Stable
Increase
Harvest
Stable
Harvest
Decrease
Harvest
0
20,000
40,000
60,000
80,000
100,000
120,000
140,000
160,000
-
2,000
4,000
6,000
8,000
10,000
12,000
0.00
0.10
0.20
0.30
0.40
0.50
0%
20%
40%
60%
80%
100%
35
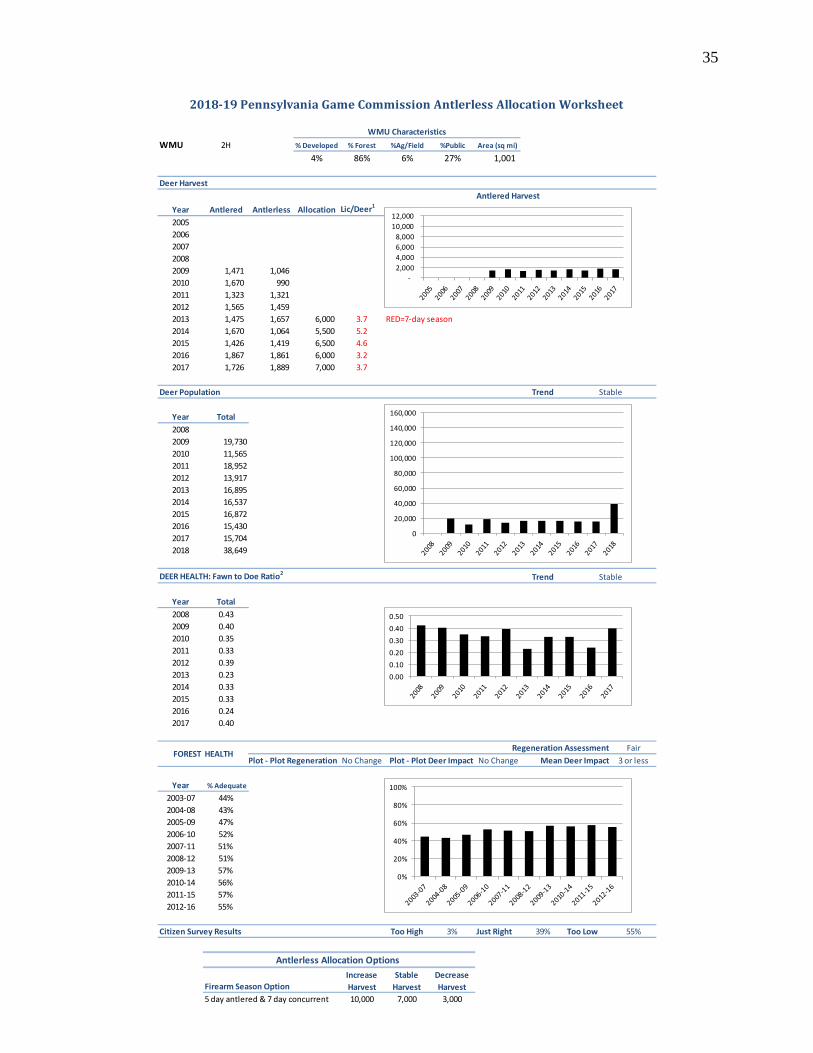
WMU 2H % Developed % Forest %Ag/Field %Public Area (sq mi)
4% 86% 6% 27% 1,001
Deer Harvest
Antlered Harvest
Year Antlered Antlerless Allocation Lic/Deer1
2005
2006
2007
2008
2009 1,471 1,046
2010 1,670 990
2011 1,323 1,321
2012 1,565 1,459
2013 1,475 1,657 6,000 3.7 RED=7-day season
2014 1,670 1,064 5,500 5.2
2015 1,426 1,419 6,500 4.6
2016 1,867 1,861 6,000 3.2
2017 1,726 1,889 7,000 3.7
Deer Population Trend
Year Total
2008
2009 19,730
2010 11,565
2011 18,952
2012 13,917
2013 16,895
2014 16,537
2015 16,872
2016 15,430
2017 15,704
2018 38,649
DEER HEALTH: Fawn to Doe Ratio2Trend
Year Total
2008 0.43
2009 0.40
2010 0.35
2011 0.33
2012 0.39
2013 0.23
2014 0.33
2015 0.33
2016 0.24
2017 0.40
Regeneration Assessment Fair
Plot - Plot Regeneration No Change Plot - Plot Deer Impact No Change Mean Deer Impact 3 or less
Year % Adequate
2003-07 44%
2004-08 43%
2005-09 47%
2006-10 52%
2007-11 51%
2008-12 51%
2009-13 57%
2010-14 56%
2011-15 57%
2012-16 55%
Citizen Survey Results Too High 3% Just Right 39% Too Low 55%
Firearm Season Option
5 day antlered & 7 day concurrent 10,000 7,000 3,000
FOREST HEALTH
Antlerless Allocation Options
2018-19 Pennsylvania Game Commission Antlerless Allocation Worksheet
WMU Characteristics
Stable
Stable
Increase
Harvest
Stable
Harvest
Decrease
Harvest
0
20,000
40,000
60,000
80,000
100,000
120,000
140,000
160,000
-
2,000
4,000
6,000
8,000
10,000
12,000
0.00
0.10
0.20
0.30
0.40
0.50
0%
20%
40%
60%
80%
100%
36
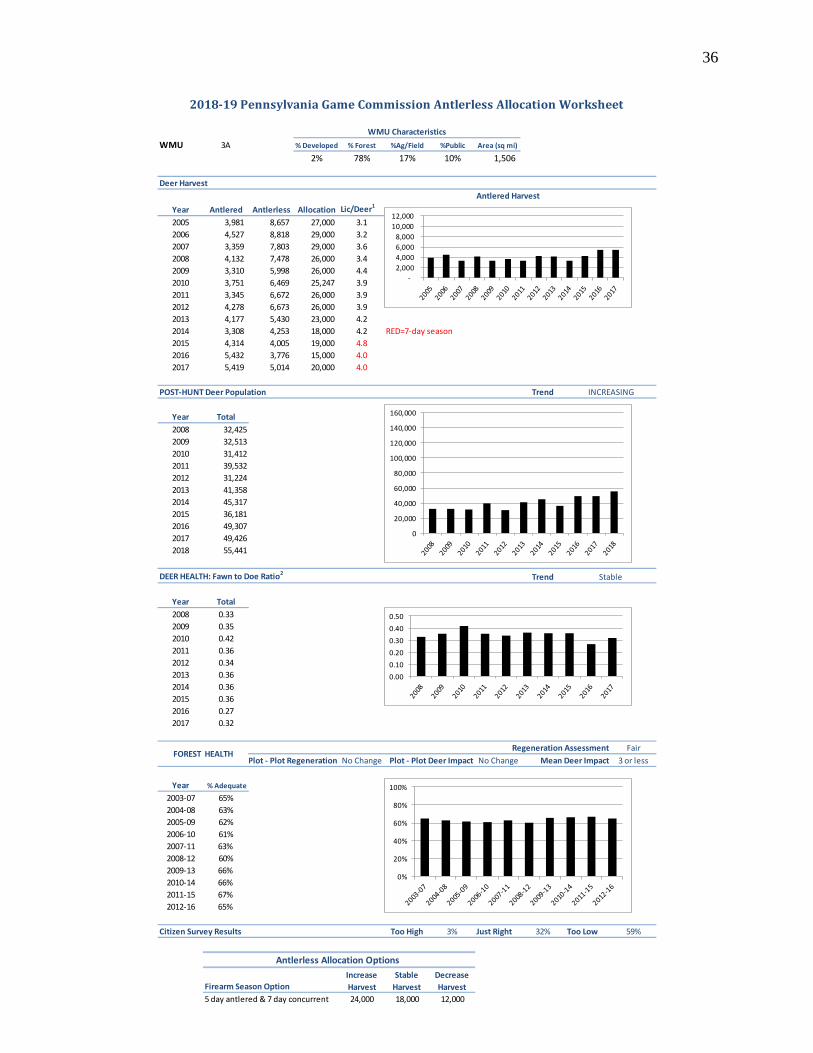
WMU 3A % Developed % Forest %Ag/Field %Public Area (sq mi)
2% 78% 17% 10% 1,506
Deer Harvest
Antlered Harvest
Year Antlered Antlerless Allocation Lic/Deer1
2005 3,981 8,657 27,000 3.1
2006 4,527 8,818 29,000 3.2
2007 3,359 7,803 29,000 3.6
2008 4,132 7,478 26,000 3.4
2009 3,310 5,998 26,000 4.4
2010 3,751 6,469 25,247 3.9
2011 3,345 6,672 26,000 3.9
2012 4,278 6,673 26,000 3.9
2013 4,177 5,430 23,000 4.2
2014 3,308 4,253 18,000 4.2 RED=7-day season
2015 4,314 4,005 19,000 4.8
2016 5,432 3,776 15,000 4.0
2017 5,419 5,014 20,000 4.0
POST-HUNT Deer Population Trend
Year Total
2008 32,425
2009 32,513
2010 31,412
2011 39,532
2012 31,224
2013 41,358
2014 45,317
2015 36,181
2016 49,307
2017 49,426
2018 55,441
DEER HEALTH: Fawn to Doe Ratio2Trend
Year Total
2008 0.33
2009 0.35
2010 0.42
2011 0.36
2012 0.34
2013 0.36
2014 0.36
2015 0.36
2016 0.27
2017 0.32
Regeneration Assessment Fair
Plot - Plot Regeneration No Change Plot - Plot Deer Impact No Change Mean Deer Impact 3 or less
Year % Adequate
2003-07 65%
2004-08 63%
2005-09 62%
2006-10 61%
2007-11 63%
2008-12 60%
2009-13 66%
2010-14 66%
2011-15 67%
2012-16 65%
Citizen Survey Results Too High 3% Just Right 32% Too Low 59%
Firearm Season Option
5 day antlered & 7 day concurrent 24,000 18,000 12,000
Antlerless Allocation Options
2018-19 Pennsylvania Game Commission Antlerless Allocation Worksheet
WMU Characteristics
INCREASING
Stable
FOREST HEALTH
Increase
Harvest
Stable
Harvest
Decrease
Harvest
0
20,000
40,000
60,000
80,000
100,000
120,000
140,000
160,000
-
2,000
4,000
6,000
8,000
10,000
12,000
0.00
0.10
0.20
0.30
0.40
0.50
0%
20%
40%
60%
80%
100%
37
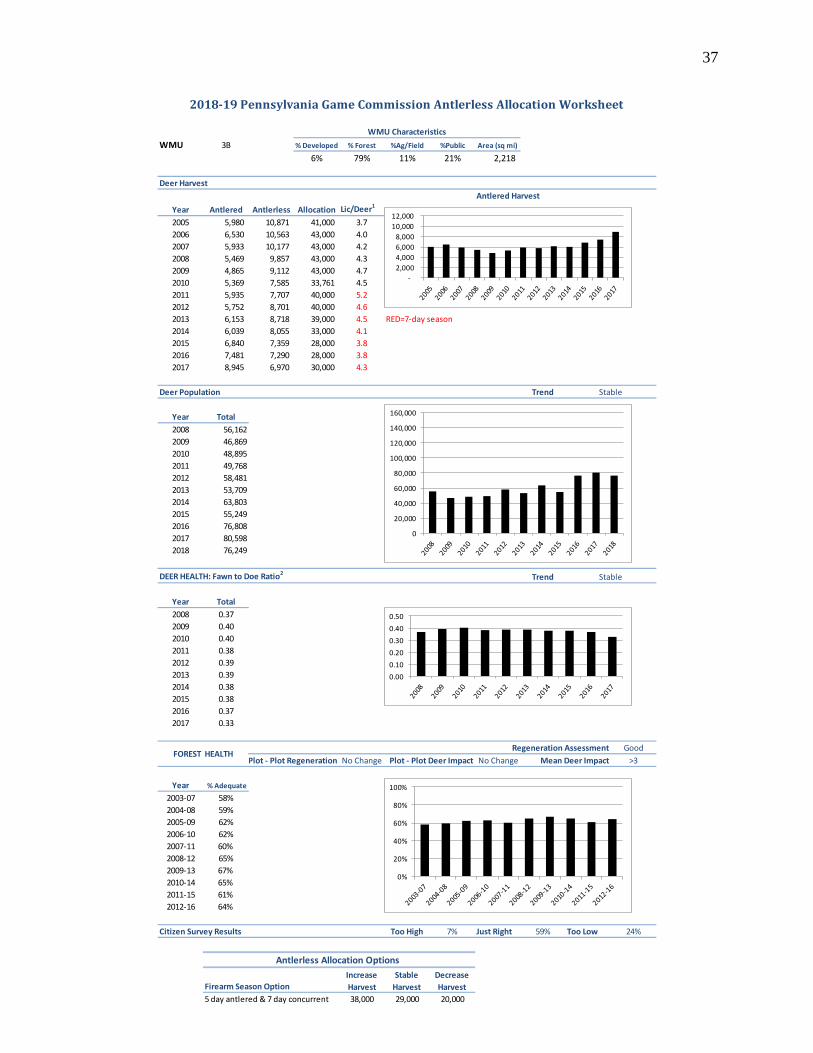
WMU 3B % Developed % Forest %Ag/Field %Public Area (sq mi)
6% 79% 11% 21% 2,218
Deer Harvest
Antlered Harvest
Year Antlered Antlerless Allocation Lic/Deer1
2005 5,980 10,871 41,000 3.7
2006 6,530 10,563 43,000 4.0
2007 5,933 10,177 43,000 4.2
2008 5,469 9,857 43,000 4.3
2009 4,865 9,112 43,000 4.7
2010 5,369 7,585 33,761 4.5
2011 5,935 7,707 40,000 5.2
2012 5,752 8,701 40,000 4.6
2013 6,153 8,718 39,000 4.5 RED=7-day season
2014 6,039 8,055 33,000 4.1
2015 6,840 7,359 28,000 3.8
2016 7,481 7,290 28,000 3.8
2017 8,945 6,970 30,000 4.3
Deer Population Trend
Year Total
2008 56,162
2009 46,869
2010 48,895
2011 49,768
2012 58,481
2013 53,709
2014 63,803
2015 55,249
2016 76,808
2017 80,598
2018 76,249
DEER HEALTH: Fawn to Doe Ratio2Trend
Year Total
2008 0.37
2009 0.40
2010 0.40
2011 0.38
2012 0.39
2013 0.39
2014 0.38
2015 0.38
2016 0.37
2017 0.33
Regeneration Assessment Good
Plot - Plot Regeneration No Change Plot - Plot Deer Impact No Change Mean Deer Impact >3
Year % Adequate
2003-07 58%
2004-08 59%
2005-09 62%
2006-10 62%
2007-11 60%
2008-12 65%
2009-13 67%
2010-14 65%
2011-15 61%
2012-16 64%
Citizen Survey Results Too High 7% Just Right 59% Too Low 24%
Firearm Season Option
5 day antlered & 7 day concurrent 38,000 29,000 20,000
Antlerless Allocation Options
2018-19 Pennsylvania Game Commission Antlerless Allocation Worksheet
WMU Characteristics
Stable
Stable
FOREST HEALTH
Increase
Harvest
Stable
Harvest
Decrease
Harvest
0
20,000
40,000
60,000
80,000
100,000
120,000
140,000
160,000
-
2,000
4,000
6,000
8,000
10,000
12,000
0.00
0.10
0.20
0.30
0.40
0.50
0%
20%
40%
60%
80%
100%
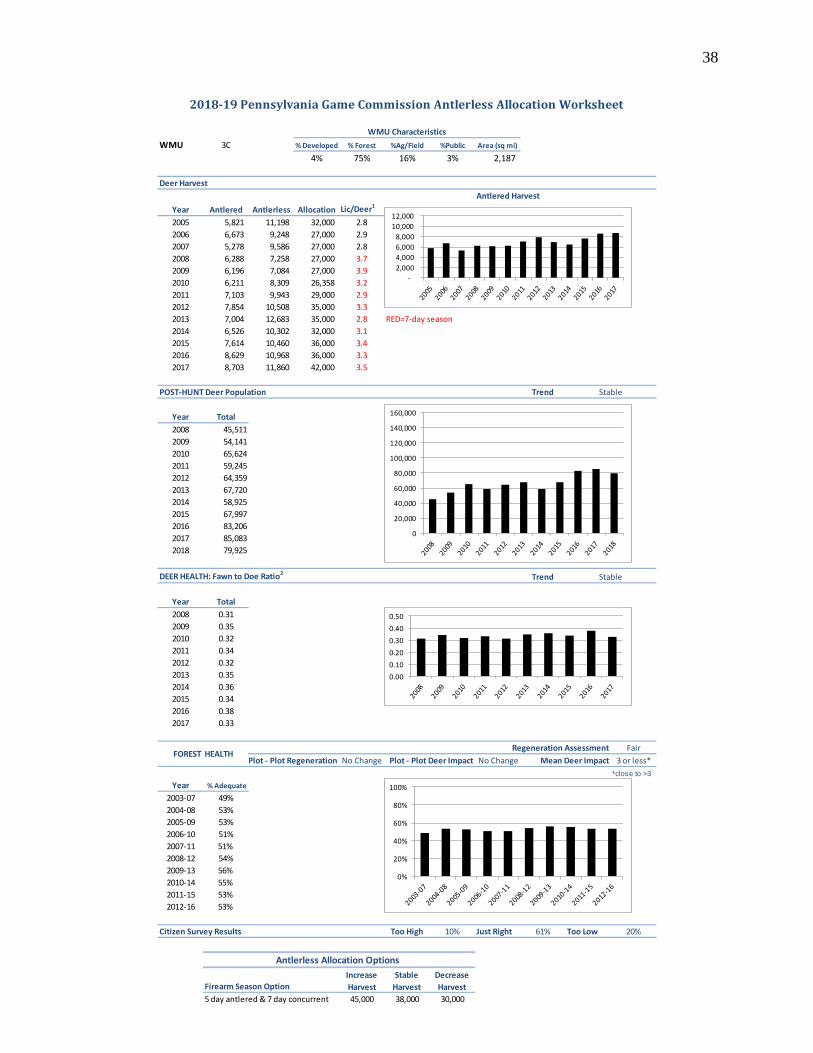
38
WMU 3C % Developed % Forest %Ag/Field %Public Area (sq mi)
4% 75% 16% 3% 2,187
Deer Harvest
Antlered Harvest
Year Antlered Antlerless Allocation Lic/Deer1
2005 5,821 11,198 32,000 2.8
2006 6,673 9,248 27,000 2.9
2007 5,278 9,586 27,000 2.8
2008 6,288 7,258 27,000 3.7
2009 6,196 7,084 27,000 3.9
2010 6,211 8,309 26,358 3.2
2011 7,103 9,943 29,000 2.9
2012 7,854 10,508 35,000 3.3
2013 7,004 12,683 35,000 2.8 RED=7-day season
2014 6,526 10,302 32,000 3.1
2015 7,614 10,460 36,000 3.4
2016 8,629 10,968 36,000 3.3
2017 8,703 11,860 42,000 3.5
POST-HUNT Deer Population Trend
Year Total
2008 45,511
2009 54,141
2010 65,624
2011 59,245
2012 64,359
2013 67,720
2014 58,925
2015 67,997
2016 83,206
2017 85,083
2018 79,925
DEER HEALTH: Fawn to Doe Ratio2Trend
Year Total
2008 0.31
2009 0.35
2010 0.32
2011 0.34
2012 0.32
2013 0.35
2014 0.36
2015 0.34
2016 0.38
2017 0.33
Regeneration Assessment Fair
Plot - Plot Regeneration No Change Plot - Plot Deer Impact No Change Mean Deer Impact 3 or less*
*close to >3
Year % Adequate
2003-07 49%
2004-08 53%
2005-09 53%
2006-10 51%
2007-11 51%
2008-12 54%
2009-13 56%
2010-14 55%
2011-15 53%
2012-16 53%
Citizen Survey Results Too High 10% Just Right 61% Too Low 20%
Firearm Season Option
5 day antlered & 7 day concurrent 45,000 38,000 30,000
Antlerless Allocation Options
2018-19 Pennsylvania Game Commission Antlerless Allocation Worksheet
WMU Characteristics
Stable
Stable
FOREST HEALTH
Increase
Harvest
Stable
Harvest
Decrease
Harvest
0
20,000
40,000
60,000
80,000
100,000
120,000
140,000
160,000
-
2,000
4,000
6,000
8,000
10,000
12,000
0.00
0.10
0.20
0.30
0.40
0.50
0%
20%
40%
60%
80%
100%

39
WMU 3D % Developed % Forest %Ag/Field %Public Area (sq mi)
11% 74% 6% 16% 2,101
Deer Harvest
Antlered Harvest
Year Antlered Antlerless Allocation Lic/Deer1
2005 3,865 7,254 38,000 5.1
2006 4,969 7,445 38,000 5.0
2007 3,647 7,017 38,000 5.3
2008 3,899 6,925 37,000 5.3
2009 3,096 6,265 37,000 5.9
2010 3,884 5,509 31,622 5.8
2011 4,509 7,163 39,000 5.4
2012 4,039 6,010 39,000 6.5
2013 3,446 4,986 32,000 6.4
2014 4,155 5,203 25,000 4.8 RED=7-day season
2015 3,500 3,655 25,000 6.9
2016 4,272 4,235 25,000 5.9
2017 4,656 4,187 25,000 5.9
POST-HUNT Deer Population Trend
Year Total
2008 31,623
2009 37,563
2010 25,378
2011 30,250
2012 31,299
2013 29,225
2014 25,127
2015 33,778
2016 28,957
2017 33,302
2018 30,727
DEER HEALTH: Fawn to Doe Ratio2Trend
Year Total
2008 0.32
2009 0.35
2010 0.31
2011 0.34
2012 0.34
2013 0.30
2014 0.29
2015 0.27
2016 0.31
2017 0.24
Regeneration Assessment Good
Plot - Plot Regeneration No Change Plot - Plot Deer ImpactNo Change* Mean Deer Impact 3 or less
*Close to improving
Year % Adequate
2003-07 56%
2004-08 54%
2005-09 55%
2006-10 58%
2007-11 57%
2008-12 59%
2009-13 61%
2010-14 61%
2011-15 57%
2012-16 63%
Citizen Survey Results Too High 13% Just Right 57% Too Low 24%
Firearm Season Option
5 day antlered & 7 day concurrent 38,000 25,000 12,000
Antlerless Allocation Options
2018-19 Pennsylvania Game Commission Antlerless Allocation Worksheet
WMU Characteristics
Stable
Stable
FOREST HEALTH
Increase
Harvest
Stable
Harvest
Decrease
Harvest
0
20,000
40,000
60,000
80,000
100,000
120,000
140,000
160,000
-
2,000
4,000
6,000
8,000
10,000
12,000
0.00
0.10
0.20
0.30
0.40
0.50
0%
20%
40%
60%
80%
100%
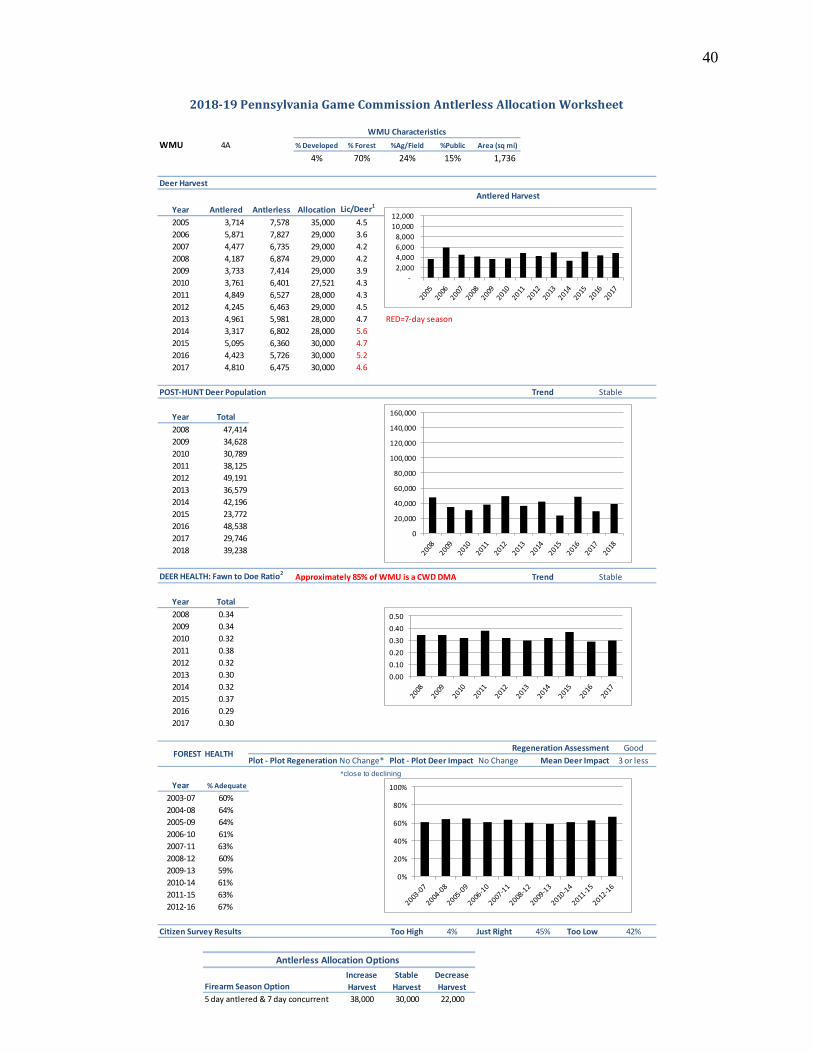
40
WMU 4A % Developed % Forest %Ag/Field %Public Area (sq mi)
4% 70% 24% 15% 1,736
Deer Harvest
Antlered Harvest
Year Antlered Antlerless Allocation Lic/Deer1
2005 3,714 7,578 35,000 4.5
2006 5,871 7,827 29,000 3.6
2007 4,477 6,735 29,000 4.2
2008 4,187 6,874 29,000 4.2
2009 3,733 7,414 29,000 3.9
2010 3,761 6,401 27,521 4.3
2011 4,849 6,527 28,000 4.3
2012 4,245 6,463 29,000 4.5
2013 4,961 5,981 28,000 4.7 RED=7-day season
2014 3,317 6,802 28,000 5.6
2015 5,095 6,360 30,000 4.7
2016 4,423 5,726 30,000 5.2
2017 4,810 6,475 30,000 4.6
POST-HUNT Deer Population Trend
Year Total
2008 47,414
2009 34,628
2010 30,789
2011 38,125
2012 49,191
2013 36,579
2014 42,196
2015 23,772
2016 48,538
2017 29,746
2018 39,238
DEER HEALTH: Fawn to Doe Ratio2Trend
Year Total
2008 0.34
2009 0.34
2010 0.32
2011 0.38
2012 0.32
2013 0.30
2014 0.32
2015 0.37
2016 0.29
2017 0.30
Regeneration Assessment Good
Plot - Plot Regeneration No Change* Plot - Plot Deer Impact No Change Mean Deer Impact 3 or less
*close to declining
Year % Adequate
2003-07 60%
2004-08 64%
2005-09 64%
2006-10 61%
2007-11 63%
2008-12 60%
2009-13 59%
2010-14 61%
2011-15 63%
2012-16 67%
Citizen Survey Results Too High 4% Just Right 45% Too Low 42%
Firearm Season Option
5 day antlered & 7 day concurrent 38,000 30,000 22,000
Antlerless Allocation Options
2018-19 Pennsylvania Game Commission Antlerless Allocation Worksheet
WMU Characteristics
Stable
Stable
FOREST HEALTH
Approximately 85% of WMU is a CWD DMA
Increase
Harvest
Stable
Harvest
Decrease
Harvest
0
20,000
40,000
60,000
80,000
100,000
120,000
140,000
160,000
-
2,000
4,000
6,000
8,000
10,000
12,000
0.00
0.10
0.20
0.30
0.40
0.50
0%
20%
40%
60%
80%
100%
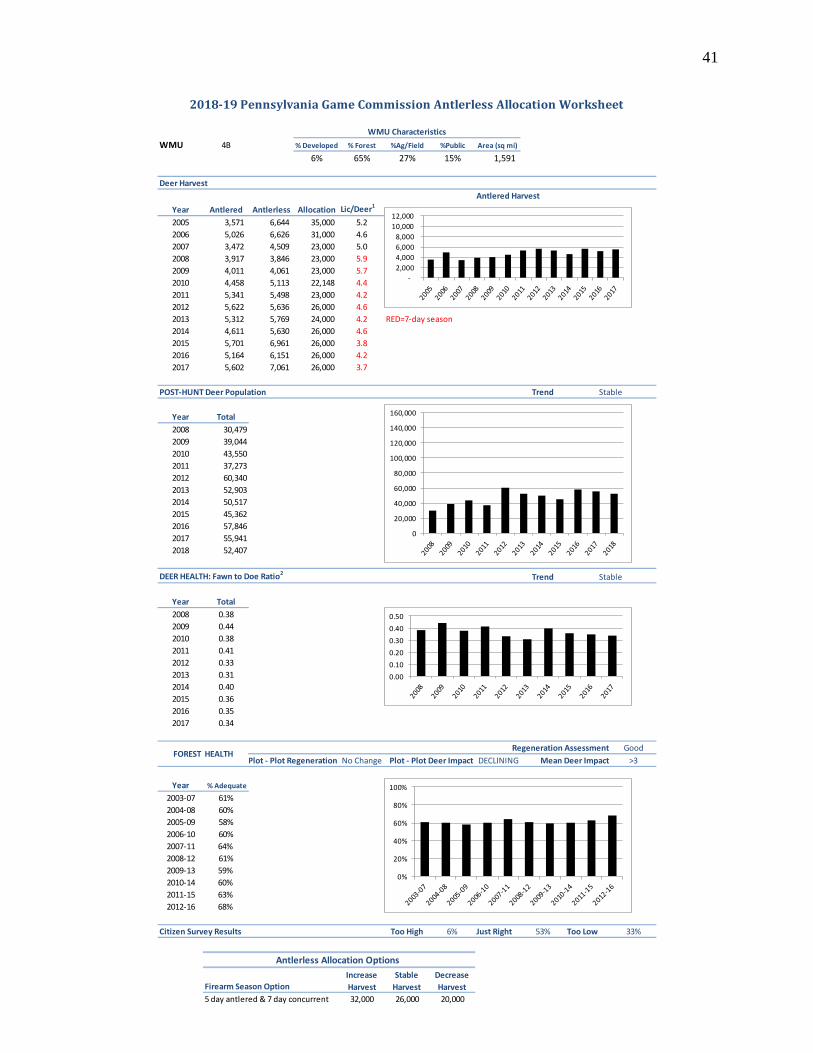
41
WMU 4B % Developed % Forest %Ag/Field %Public Area (sq mi)
6% 65% 27% 15% 1,591
Deer Harvest
Antlered Harvest
Year Antlered Antlerless Allocation Lic/Deer1
2005 3,571 6,644 35,000 5.2
2006 5,026 6,626 31,000 4.6
2007 3,472 4,509 23,000 5.0
2008 3,917 3,846 23,000 5.9
2009 4,011 4,061 23,000 5.7
2010 4,458 5,113 22,148 4.4
2011 5,341 5,498 23,000 4.2
2012 5,622 5,636 26,000 4.6
2013 5,312 5,769 24,000 4.2 RED=7-day season
2014 4,611 5,630 26,000 4.6
2015 5,701 6,961 26,000 3.8
2016 5,164 6,151 26,000 4.2
2017 5,602 7,061 26,000 3.7
POST-HUNT Deer Population Trend
Year Total
2008 30,479
2009 39,044
2010 43,550
2011 37,273
2012 60,340
2013 52,903
2014 50,517
2015 45,362
2016 57,846
2017 55,941
2018 52,407
DEER HEALTH: Fawn to Doe Ratio2Trend
Year Total
2008 0.38
2009 0.44
2010 0.38
2011 0.41
2012 0.33
2013 0.31
2014 0.40
2015 0.36
2016 0.35
2017 0.34
Regeneration Assessment Good
Plot - Plot Regeneration No Change Plot - Plot Deer Impact DECLINING Mean Deer Impact >3
Year % Adequate
2003-07 61%
2004-08 60%
2005-09 58%
2006-10 60%
2007-11 64%
2008-12 61%
2009-13 59%
2010-14 60%
2011-15 63%
2012-16 68%
Citizen Survey Results Too High 6% Just Right 53% Too Low 33%
Firearm Season Option
5 day antlered & 7 day concurrent 32,000 26,000 20,000
Antlerless Allocation Options
2018-19 Pennsylvania Game Commission Antlerless Allocation Worksheet
WMU Characteristics
Stable
Stable
FOREST HEALTH
Increase
Harvest
Stable
Harvest
Decrease
Harvest
0
20,000
40,000
60,000
80,000
100,000
120,000
140,000
160,000
-
2,000
4,000
6,000
8,000
10,000
12,000
0.00
0.10
0.20
0.30
0.40
0.50
0%
20%
40%
60%
80%
100%
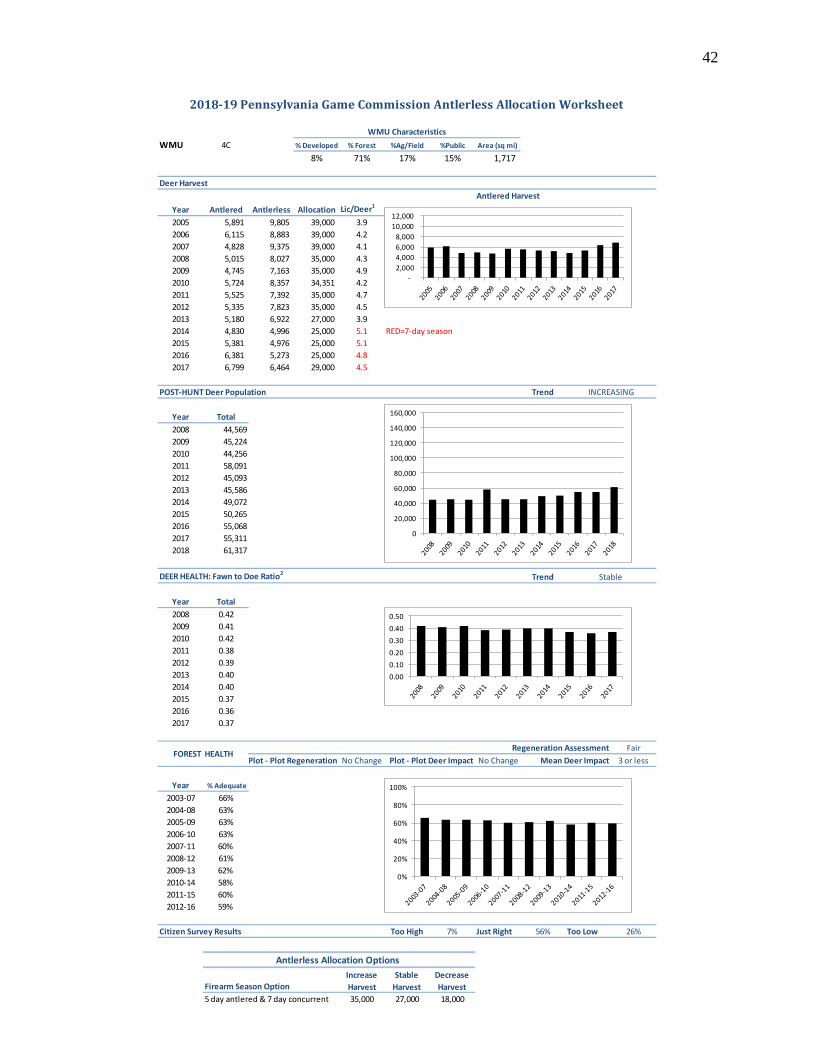
42
WMU 4C % Developed % Forest %Ag/Field %Public Area (sq mi)
8% 71% 17% 15% 1,717
Deer Harvest
Antlered Harvest
Year Antlered Antlerless Allocation Lic/Deer1
2005 5,891 9,805 39,000 3.9
2006 6,115 8,883 39,000 4.2
2007 4,828 9,375 39,000 4.1
2008 5,015 8,027 35,000 4.3
2009 4,745 7,163 35,000 4.9
2010 5,724 8,357 34,351 4.2
2011 5,525 7,392 35,000 4.7
2012 5,335 7,823 35,000 4.5
2013 5,180 6,922 27,000 3.9
2014 4,830 4,996 25,000 5.1 RED=7-day season
2015 5,381 4,976 25,000 5.1
2016 6,381 5,273 25,000 4.8
2017 6,799 6,464 29,000 4.5
POST-HUNT Deer Population Trend
Year Total
2008 44,569
2009 45,224
2010 44,256
2011 58,091
2012 45,093
2013 45,586
2014 49,072
2015 50,265
2016 55,068
2017 55,311
2018 61,317
DEER HEALTH: Fawn to Doe Ratio2Trend
Year Total
2008 0.42
2009 0.41
2010 0.42
2011 0.38
2012 0.39
2013 0.40
2014 0.40
2015 0.37
2016 0.36
2017 0.37
Regeneration Assessment Fair
Plot - Plot Regeneration No Change Plot - Plot Deer Impact No Change Mean Deer Impact 3 or less
Year % Adequate
2003-07 66%
2004-08 63%
2005-09 63%
2006-10 63%
2007-11 60%
2008-12 61%
2009-13 62%
2010-14 58%
2011-15 60%
2012-16 59%
Citizen Survey Results Too High 7% Just Right 56% Too Low 26%
Firearm Season Option
5 day antlered & 7 day concurrent 35,000 27,000 18,000
Antlerless Allocation Options
2018-19 Pennsylvania Game Commission Antlerless Allocation Worksheet
WMU Characteristics
INCREASING
Stable
FOREST HEALTH
Increase
Harvest
Stable
Harvest
Decrease
Harvest
0
20,000
40,000
60,000
80,000
100,000
120,000
140,000
160,000
-
2,000
4,000
6,000
8,000
10,000
12,000
0.00
0.10
0.20
0.30
0.40
0.50
0%
20%
40%
60%
80%
100%
43
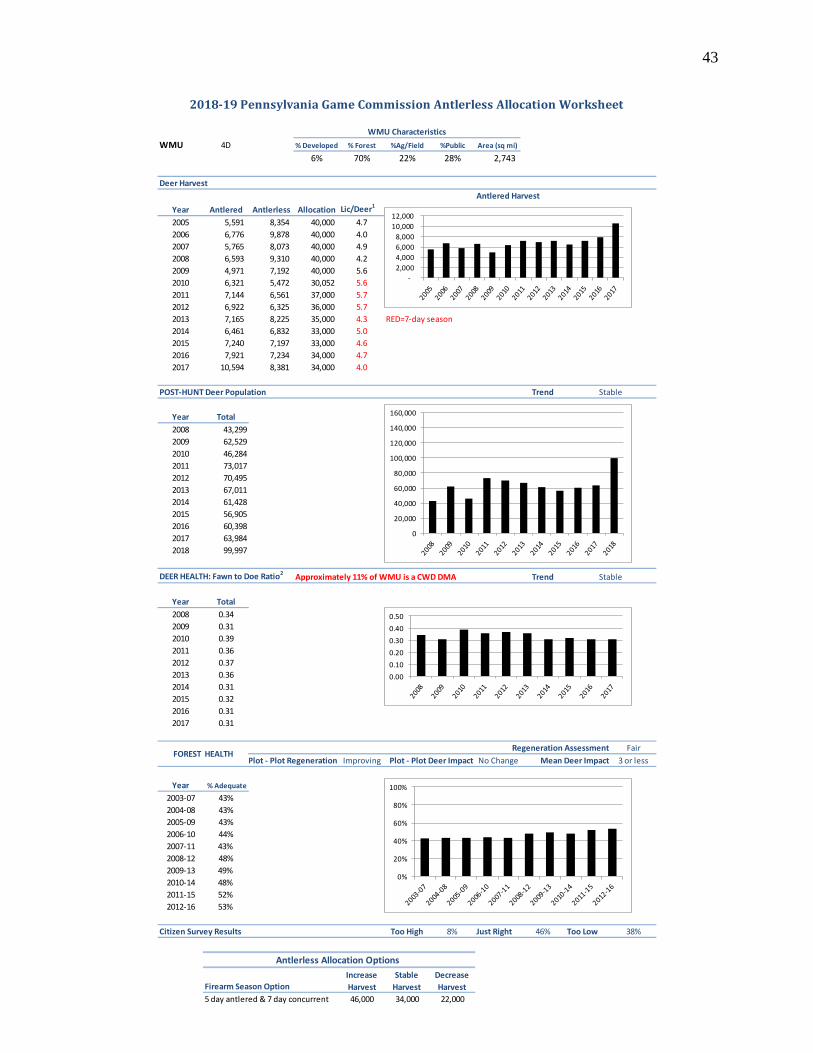
WMU 4D % Developed % Forest %Ag/Field %Public Area (sq mi)
6% 70% 22% 28% 2,743
Deer Harvest
Antlered Harvest
Year Antlered Antlerless Allocation Lic/Deer1
2005 5,591 8,354 40,000 4.7
2006 6,776 9,878 40,000 4.0
2007 5,765 8,073 40,000 4.9
2008 6,593 9,310 40,000 4.2
2009 4,971 7,192 40,000 5.6
2010 6,321 5,472 30,052 5.6
2011 7,144 6,561 37,000 5.7
2012 6,922 6,325 36,000 5.7
2013 7,165 8,225 35,000 4.3 RED=7-day season
2014 6,461 6,832 33,000 5.0
2015 7,240 7,197 33,000 4.6
2016 7,921 7,234 34,000 4.7
2017 10,594 8,381 34,000 4.0
POST-HUNT Deer Population Trend
Year Total
2008 43,299
2009 62,529
2010 46,284
2011 73,017
2012 70,495
2013 67,011
2014 61,428
2015 56,905
2016 60,398
2017 63,984
2018 99,997
DEER HEALTH: Fawn to Doe Ratio2Approximately 11% of WMU is a CWD DMA Trend
Year Total
2008 0.34
2009 0.31
2010 0.39
2011 0.36
2012 0.37
2013 0.36
2014 0.31
2015 0.32
2016 0.31
2017 0.31
Regeneration Assessment Fair
Plot - Plot Regeneration Improving Plot - Plot Deer Impact No Change Mean Deer Impact 3 or less
Year % Adequate
2003-07 43%
2004-08 43%
2005-09 43%
2006-10 44%
2007-11 43%
2008-12 48%
2009-13 49%
2010-14 48%
2011-15 52%
2012-16 53%
Citizen Survey Results Too High 8% Just Right 46% Too Low 38%
Firearm Season Option
5 day antlered & 7 day concurrent 46,000 34,000 22,000
Antlerless Allocation Options
2018-19 Pennsylvania Game Commission Antlerless Allocation Worksheet
WMU Characteristics
Stable
Stable
FOREST HEALTH
Increase
Harvest
Stable
Harvest
Decrease
Harvest
0
20,000
40,000
60,000
80,000
100,000
120,000
140,000
160,000
-
2,000
4,000
6,000
8,000
10,000
12,000
0.00
0.10
0.20
0.30
0.40
0.50
0%
20%
40%
60%
80%
100%
44
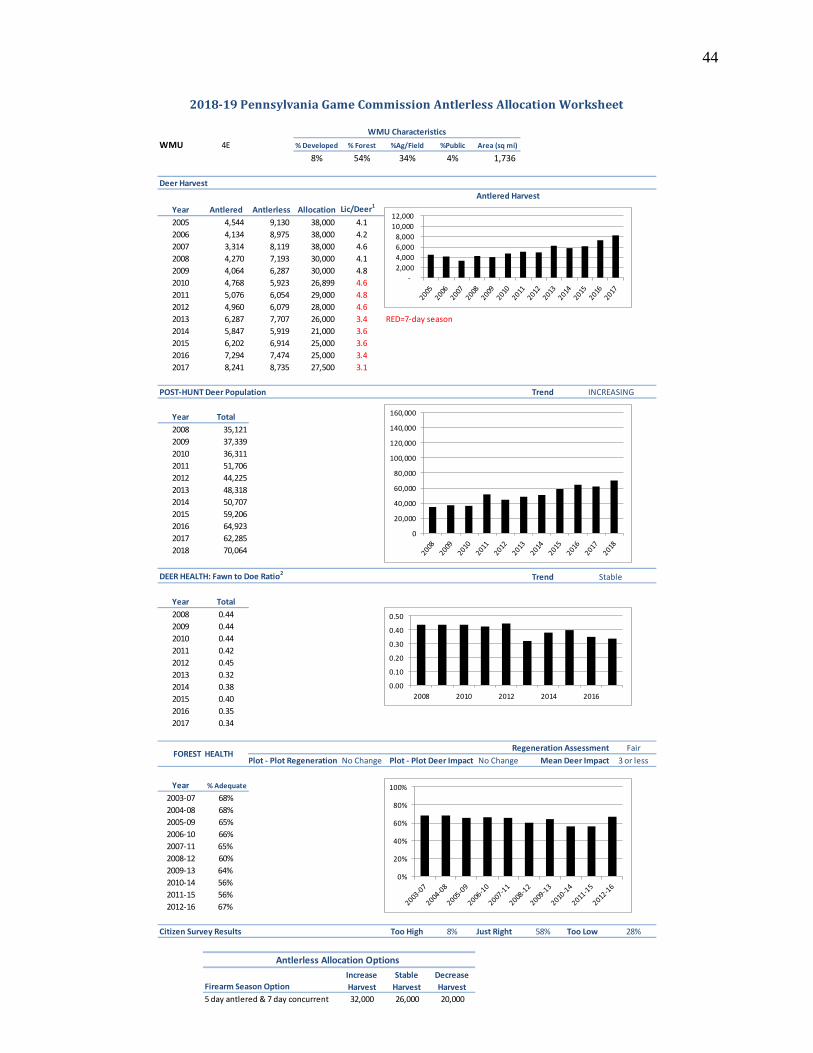
WMU 4E % Developed % Forest %Ag/Field %Public Area (sq mi)
8% 54% 34% 4% 1,736
Deer Harvest
Antlered Harvest
Year Antlered Antlerless Allocation Lic/Deer1
2005 4,544 9,130 38,000 4.1
2006 4,134 8,975 38,000 4.2
2007 3,314 8,119 38,000 4.6
2008 4,270 7,193 30,000 4.1
2009 4,064 6,287 30,000 4.8
2010 4,768 5,923 26,899 4.6
2011 5,076 6,054 29,000 4.8
2012 4,960 6,079 28,000 4.6
2013 6,287 7,707 26,000 3.4 RED=7-day season
2014 5,847 5,919 21,000 3.6
2015 6,202 6,914 25,000 3.6
2016 7,294 7,474 25,000 3.4
2017 8,241 8,735 27,500 3.1
POST-HUNT Deer Population Trend
Year Total
2008 35,121
2009 37,339
2010 36,311
2011 51,706
2012 44,225
2013 48,318
2014 50,707
2015 59,206
2016 64,923
2017 62,285
2018 70,064
DEER HEALTH: Fawn to Doe Ratio2Trend
Year Total
2008 0.44
2009 0.44
2010 0.44
2011 0.42
2012 0.45
2013 0.32
2014 0.38
2015 0.40
2016 0.35
2017 0.34
Regeneration Assessment Fair
Plot - Plot Regeneration No Change Plot - Plot Deer Impact No Change Mean Deer Impact 3 or less
Year % Adequate
2003-07 68%
2004-08 68%
2005-09 65%
2006-10 66%
2007-11 65%
2008-12 60%
2009-13 64%
2010-14 56%
2011-15 56%
2012-16 67%
Citizen Survey Results Too High 8% Just Right 58% Too Low 28%
Firearm Season Option
5 day antlered & 7 day concurrent 32,000 26,000 20,000
Antlerless Allocation Options
2018-19 Pennsylvania Game Commission Antlerless Allocation Worksheet
WMU Characteristics
INCREASING
Stable
FOREST HEALTH
Increase
Harvest
Stable
Harvest
Decrease
Harvest
0
20,000
40,000
60,000
80,000
100,000
120,000
140,000
160,000
-
2,000
4,000
6,000
8,000
10,000
12,000
0.00
0.10
0.20
0.30
0.40
0.50
2008 2010 2012 2014 2016
0%
20%
40%
60%
80%
100%
45
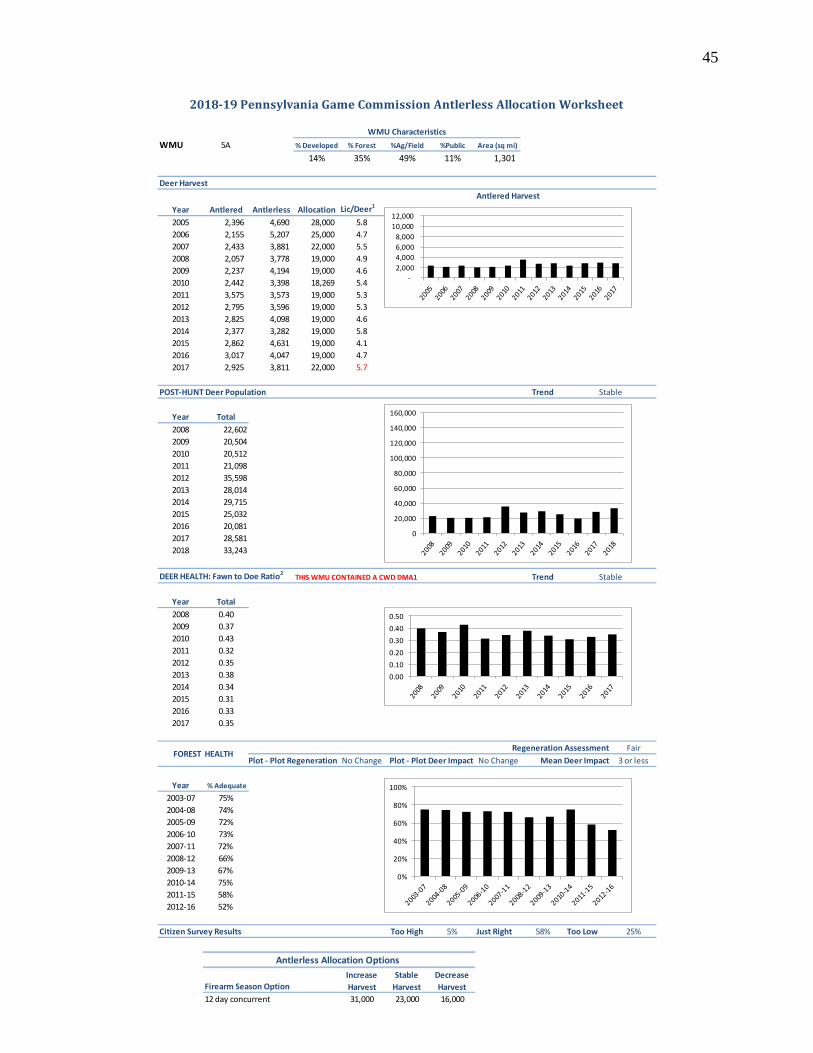
WMU 5A % Developed % Forest %Ag/Field %Public Area (sq mi)
14% 35% 49% 11% 1,301
Deer Harvest
Antlered Harvest
Year Antlered Antlerless Allocation Lic/Deer1
2005 2,396 4,690 28,000 5.8
2006 2,155 5,207 25,000 4.7
2007 2,433 3,881 22,000 5.5
2008 2,057 3,778 19,000 4.9
2009 2,237 4,194 19,000 4.6
2010 2,442 3,398 18,269 5.4
2011 3,575 3,573 19,000 5.3
2012 2,795 3,596 19,000 5.3
2013 2,825 4,098 19,000 4.6
2014 2,377 3,282 19,000 5.8
2015 2,862 4,631 19,000 4.1
2016 3,017 4,047 19,000 4.7
2017 2,925 3,811 22,000 5.7
POST-HUNT Deer Population Trend
Year Total
2008 22,602
2009 20,504
2010 20,512
2011 21,098
2012 35,598
2013 28,014
2014 29,715
2015 25,032
2016 20,081
2017 28,581
2018 33,243
DEER HEALTH: Fawn to Doe Ratio2THIS WMU CONTAINED A CWD DMA1 Trend
Year Total
2008 0.40
2009 0.37
2010 0.43
2011 0.32
2012 0.35
2013 0.38
2014 0.34
2015 0.31
2016 0.33
2017 0.35
Regeneration Assessment Fair
Plot - Plot Regeneration No Change Plot - Plot Deer Impact No Change Mean Deer Impact 3 or less
Year % Adequate
2003-07 75%
2004-08 74%
2005-09 72%
2006-10 73%
2007-11 72%
2008-12 66%
2009-13 67%
2010-14 75%
2011-15 58%
2012-16 52%
Citizen Survey Results Too High 5% Just Right 58% Too Low 25%
Firearm Season Option
12 day concurrent 31,000 23,000 16,000
Antlerless Allocation Options
2018-19 Pennsylvania Game Commission Antlerless Allocation Worksheet
WMU Characteristics
Stable
Stable
FOREST HEALTH
Increase
Harvest
Stable
Harvest
Decrease
Harvest
0
20,000
40,000
60,000
80,000
100,000
120,000
140,000
160,000
-
2,000
4,000
6,000
8,000
10,000
12,000
0.00
0.10
0.20
0.30
0.40
0.50
0%
20%
40%
60%
80%
100%
46
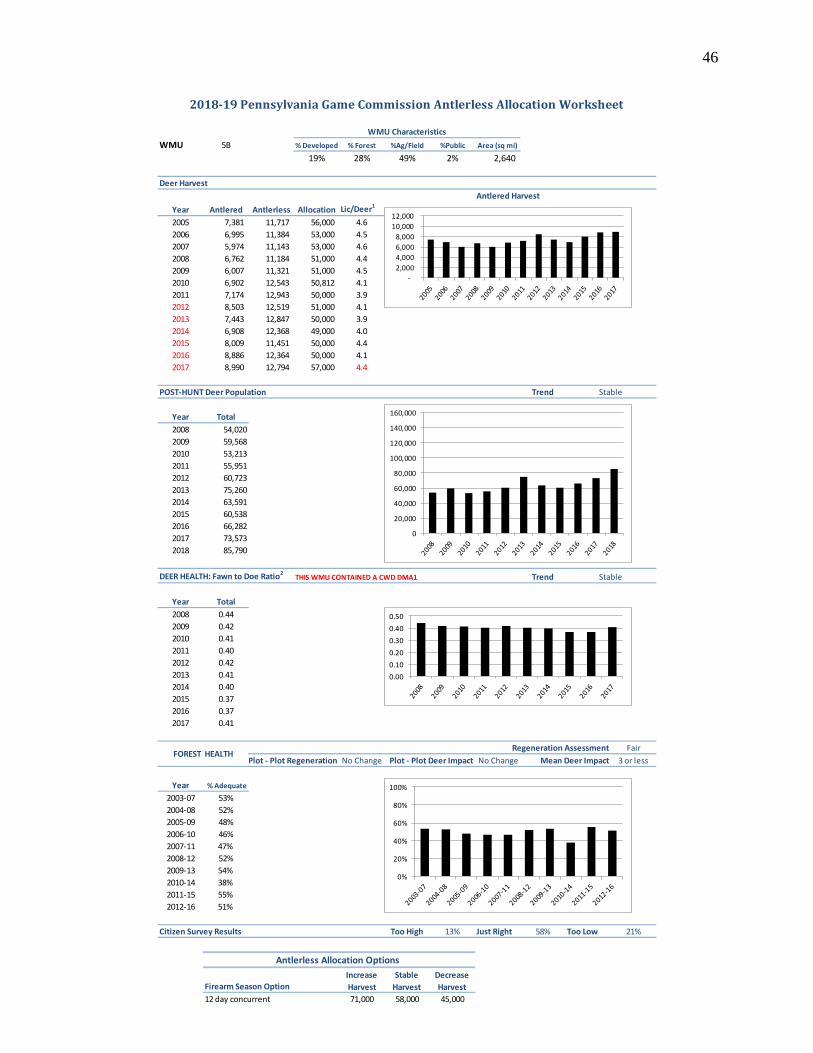
WMU 5B % Developed % Forest %Ag/Field %Public Area (sq mi)
19% 28% 49% 2% 2,640
Deer Harvest
Antlered Harvest
Year Antlered Antlerless Allocation Lic/Deer1
2005 7,381 11,717 56,000 4.6
2006 6,995 11,384 53,000 4.5
2007 5,974 11,143 53,000 4.6
2008 6,762 11,184 51,000 4.4
2009 6,007 11,321 51,000 4.5
2010 6,902 12,543 50,812 4.1
2011 7,174 12,943 50,000 3.9
2012 8,503 12,519 51,000 4.1
2013 7,443 12,847 50,000 3.9
2014 6,908 12,368 49,000 4.0
2015 8,009 11,451 50,000 4.4
2016 8,886 12,364 50,000 4.1
2017 8,990 12,794 57,000 4.4
POST-HUNT Deer Population Trend
Year Total
2008 54,020
2009 59,568
2010 53,213
2011 55,951
2012 60,723
2013 75,260
2014 63,591
2015 60,538
2016 66,282
2017 73,573
2018 85,790
DEER HEALTH: Fawn to Doe Ratio2THIS WMU CONTAINED A CWD DMA1 Trend
Year Total
2008 0.44
2009 0.42
2010 0.41
2011 0.40
2012 0.42
2013 0.41
2014 0.40
2015 0.37
2016 0.37
2017 0.41
Regeneration Assessment Fair
Plot - Plot Regeneration No Change Plot - Plot Deer Impact No Change Mean Deer Impact 3 or less
Year % Adequate
2003-07 53%
2004-08 52%
2005-09 48%
2006-10 46%
2007-11 47%
2008-12 52%
2009-13 54%
2010-14 38%
2011-15 55%
2012-16 51%
Citizen Survey Results Too High 13% Just Right 58% Too Low 21%
Firearm Season Option
12 day concurrent 71,000 58,000 45,000
Antlerless Allocation Options
2018-19 Pennsylvania Game Commission Antlerless Allocation Worksheet
WMU Characteristics
Stable
Stable
FOREST HEALTH
Increase
Harvest
Stable
Harvest
Decrease
Harvest
0
20,000
40,000
60,000
80,000
100,000
120,000
140,000
160,000
-
2,000
4,000
6,000
8,000
10,000
12,000
0.00
0.10
0.20
0.30
0.40
0.50
0%
20%
40%
60%
80%
100%
47
WMU 5C % Developed % Forest %Ag/Field %Public Area (sq mi)
27% 37% 31% 1% 2,024
Deer Harvest
Antlered Harvest
Year Antlered Antlerless Allocation Lic/Deer1
2005 7,701 17,589 71,000 3.9
2006 7,708 16,123 79,000 4.8
2007 6,526 18,864 84,000 4.3
2008 8,729 20,238 92,000 4.4
2009 7,566 23,214 113,000 4.8
2010 9,400 23,977 121,960 4.7
2011 8,928 24,234 117,000 4.4
2012 7,825 23,648 111,000 4.5
2013 8,096 21,711 103,000 4.7 * WMU Boundary Change
2014 8,035 22,152 95,000 4.3
2015* 7,416 13,551 70,000 5.1
2016 8,328 15,643 70,000 4.4
2017 8,846 15,644 70,000 4.4
POST-HUNT Deer Population Trend
Year Total
2008
2009
2010 Harvest indices (i.e., antlered harvest, antlerless lic/deer), not PASAK model, used to monitor population trend
2011
2012
2013
2014
DEER HEALTH: Fawn to Doe Ratio2Trend
Year Total
2008 0.44
2009 0.47
2010 0.43
2011 0.46
2012 0.49
2013 0.43
2014 0.42
2015 0.40
2016 0.44
2017 0.40
Regeneration Assessment
Plot - Plot Regeneration Plot - Plot Deer Impact Mean Deer Impact
Year % Adequate
2003-07
2004-08
2005-09 Forest data not considered in this developed WMU
2006-10
2007-11
2008-12
2009-13
Citizen Survey Results Too High 30% Just Right 55% Too Low 9%
Firearm Season Option
12 day concurrent 79,000 70,000 61,000
Antlerless Allocation Options
2018-19 Pennsylvania Game Commission Antlerless Allocation Worksheet
WMU Characteristics
Stable
FOREST HEALTH
Increase
Harvest
Stable
Harvest
Decrease
Harvest
-
2,000
4,000
6,000
8,000
10,000
12,000
0.00
0.10
0.20
0.30
0.40
0.50
48
WMU 5D % Developed % Forest %Ag/Field %Public Area (sq mi)
61% 18% 11% 0% 1,285
Deer Harvest
Antlered Harvest
Year Antlered Antlerless Allocation Lic/Deer1
2005 1,460 4,166 20,000 4.5
2006 1,315 4,074 20,000 4.7
2007 977 5,185 20,000 3.8
2008 1,343 4,533 22,000 4.7
2009 1,130 3,911 22,000 5.2
2010 1,144 3,721 22,000 5.1
2011 1,156 3,827 22,000 4.7
2012 1,325 3,766 19,000 4.7
2013 1,589 4,483 18,000 4.0 * WMU Boundary Change
2014 1,317 3,788 18,000 4.7
2015* 2,191 5,172 24,000 4.6
2016 2,908 6,452 30,000 4.6
2017 3,327 7,526 30,000 3.9
POST-HUNT Deer Population Trend
Year Total
2008
2009
2010 Harvest indices (i.e., antlered harvest, antlerless lic/deer), not PASAK model, used to monitor population trend
2011
2012
2013
2014
DEER HEALTH: Fawn to Doe Ratio2Trend
Year Total
2008 0.41
2009 0.49
2010 0.48
2011 0.49
2012 0.44
2013 0.41
2014 0.48
2015 0.42
2016 0.42
2017 0.40
Regeneration Assessment
Plot - Plot Regeneration Plot - Plot Deer Impact Mean Deer Impact
Year % Adequate
2003-07
2004-08
2005-09 Forest data not considered in this developed WMU
2006-10
2007-11
2008-12
2009-13
Citizen Survey Results Too High 25% Just Right 55% Too Low 18%
Firearm Season Option
12 day concurrent 34,000 28,000 22,000
Antlerless Allocation Options
2018-19 Pennsylvania Game Commission Antlerless Allocation Worksheet
WMU Characteristics
Stable
FOREST HEALTH
Increase
Harvest
Stable
Harvest
Decrease
Harvest
-
2,000
4,000
6,000
8,000
10,000
12,000
0.00
0.20
0.40
0.60
49
APPENDIX 1
WMU 2A Antlerless Allocations & Hemorrhagic Disease
BACKGROUND In 2017, Hemorrhagic Disease (HD) and associated deer mortality was detected throughout Pennsylvania. Pennsylvania typically experiences HD outbreaks about every 5 years. As a result, HD has not historically affected Pennsylvania deer populations in back-to-back years. The Game Commission’s Southwest Region, recorded 478 HD-related deer mortalities. Most HD-related deaths occurred in and around WMU 2A. The actual number of deer mortalities is not known. As a result of the HD-related deer deaths, concerns regarding the 2018-19 antlerless allocation recommendation for WMU 2A have been expressed. In general, the concern is HD reduced WMU 2A’s deer population, and the antlerless allocation should be reduced in response to a lower deer population.
EVALUATION If HD negatively impacted the WMU 2A deer population, the following should have occurred:
1. Antlered harvest would decline because there were fewer deer in the population.
2. Antlerless harvest success rate would decline because there were fewer deer in the population
and hunters would not be as successful. Because antlerless license allocations vary by year,
antlerless success rate is more appropriate than antlerless harvest for comparisons.
3. Deer population would be lower because there were fewer deer in the population.
To determine the effect of HD on the deer population in WMU 2A, we looked at antlered deer harvest, antlerless success rates, and deer population trends. Because of inherent variability in large-scale datasets, deer management recommendations are based on multi-year trends. One-year changes do not affect deer management recommendations.
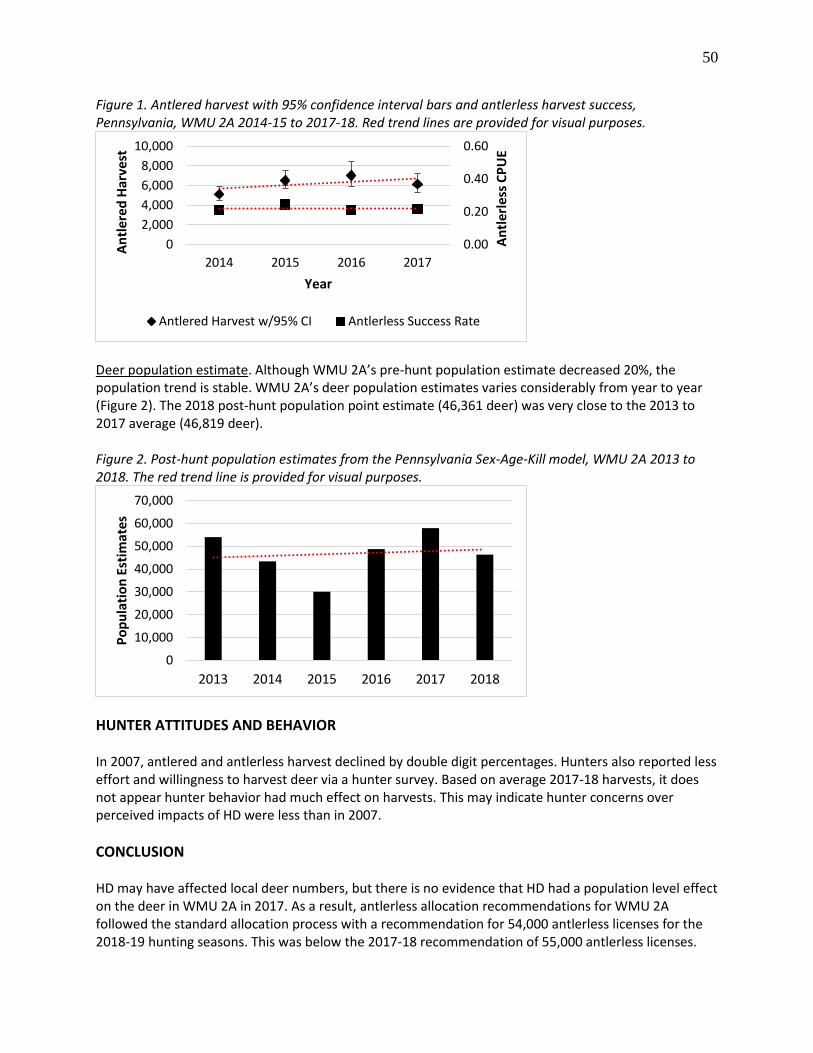
RESULTS Antlered harvest. Although WMU 2A’s antlered harvest decreased 13% from 2016-17 to 2017-18, the antlered deer harvest trend is stable (Figure 1). The 2017-18 antlered harvest (6,134 antlered deer; 5,275 – 7,217 95% confidence interval) was not different from the average antlered harvest from 2012-13 to 2016-17 (6,438 antlered deer). Antlerless success rate. Although WMU 2A’s antlerless success rate (antlerless deer harvested per antlerless license) increased 2% from 2016-17 to 2017-18, the antlerless success rate trend is stable (Figure 1). The 2017-18 antlerless success rate (22%) was nearly identical to the average antlerless success rate from 2012-13 to 2016-17 (23%).
50
Figure 1. Antlered harvest with 95% confidence interval bars and antlerless harvest success, Pennsylvania, WMU 2A 2014-15 to 2017-18. Red trend lines are provided for visual purposes.
Deer population estimate. Although WMU 2A’s pre-hunt population estimate decreased 20%, the population trend is stable. WMU 2A’s deer population estimates varies considerably from year to year (Figure 2). The 2018 post-hunt population point estimate (46,361 deer) was very close to the 2013 to 2017 average (46,819 deer). Figure 2. Post-hunt population estimates from the Pennsylvania Sex-Age-Kill model, WMU 2A 2013 to 2018. The red trend line is provided for visual purposes.
HUNTER ATTITUDES AND BEHAVIOR In 2007, antlered and antlerless harvest declined by double digit percentages. Hunters also reported less effort and willingness to harvest deer via a hunter survey. Based on average 2017-18 harvests, it does not appear hunter behavior had much effect on harvests. This may indicate hunter concerns over perceived impacts of HD were less than in 2007.
CONCLUSION HD may have affected local deer numbers, but there is no evidence that HD had a population level effect on the deer in WMU 2A in 2017. As a result, antlerless allocation recommendations for WMU 2A followed the standard allocation process with a recommendation for 54,000 antlerless licenses for the 2018-19 hunting seasons. This was below the 2017-18 recommendation of 55,000 antlerless licenses.
0.00
0.20
0.40
0.60
0
2,000
4,000
6,000
8,000
10,000
2014 2015 2016 2017
An
tler
less
CP
UE
An
tler
ed H
arve
st
Year
Antlered Harvest w/95% CI Antlerless Success Rate
0
10,000
20,000
30,000
40,000
50,000
60,000
70,000
2013 2014 2015 2016 2017 2018
Po
pu
lati
on
Est
imat
es
51
APPENDIX 2
Chronic Wasting Disease (CWD) and the 2018-19 Antlerless Allocation Recommendations
BACKGROUND
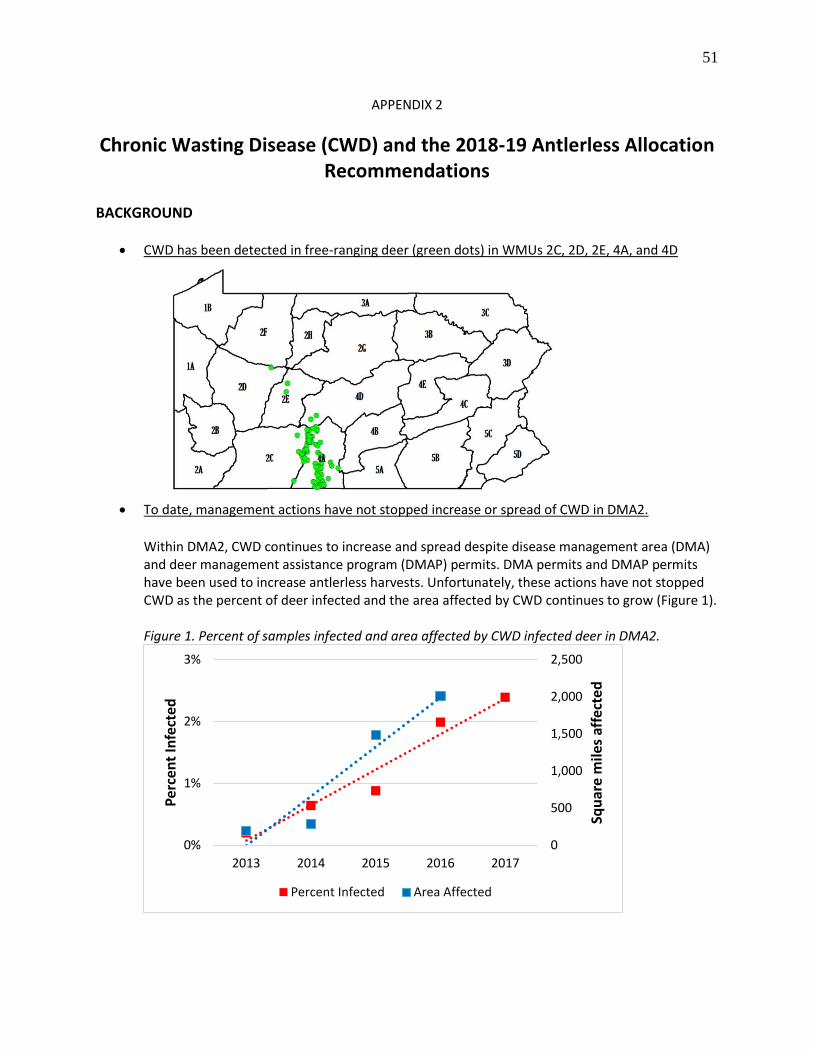
• CWD has been detected in free-ranging deer (green dots) in WMUs 2C, 2D, 2E, 4A, and 4D
• To date, management actions have not stopped increase or spread of CWD in DMA2.
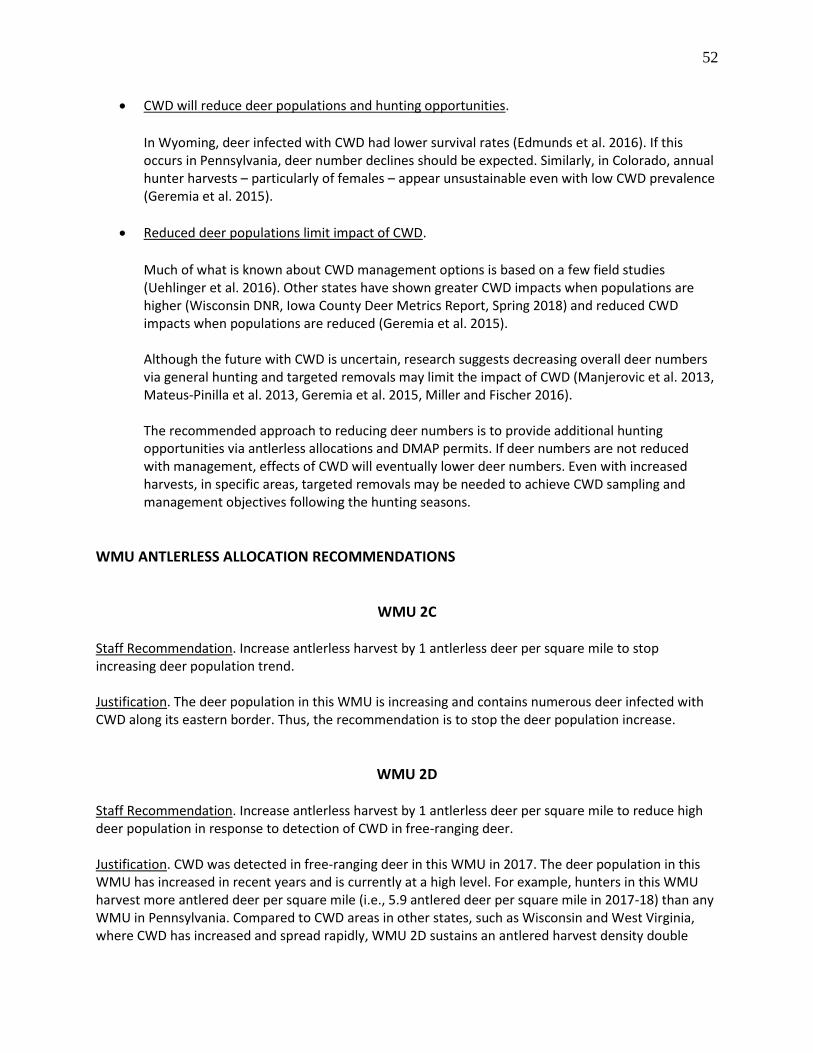
Within DMA2, CWD continues to increase and spread despite disease management area (DMA) and deer management assistance program (DMAP) permits. DMA permits and DMAP permits have been used to increase antlerless harvests. Unfortunately, these actions have not stopped CWD as the percent of deer infected and the area affected by CWD continues to grow (Figure 1). Figure 1. Percent of samples infected and area affected by CWD infected deer in DMA2.
0
500
1,000
1,500
2,000
2,500
0%
1%
2%
3%
2013 2014 2015 2016 2017
Squ
are
mile
s af
fect
ed
Per
cen
t In
fect
ed
Percent Infected Area Affected
52
• CWD will reduce deer populations and hunting opportunities.
In Wyoming, deer infected with CWD had lower survival rates (Edmunds et al. 2016). If this occurs in Pennsylvania, deer number declines should be expected. Similarly, in Colorado, annual hunter harvests – particularly of females – appear unsustainable even with low CWD prevalence (Geremia et al. 2015).
• Reduced deer populations limit impact of CWD.
Much of what is known about CWD management options is based on a few field studies (Uehlinger et al. 2016). Other states have shown greater CWD impacts when populations are higher (Wisconsin DNR, Iowa County Deer Metrics Report, Spring 2018) and reduced CWD impacts when populations are reduced (Geremia et al. 2015). Although the future with CWD is uncertain, research suggests decreasing overall deer numbers via general hunting and targeted removals may limit the impact of CWD (Manjerovic et al. 2013, Mateus-Pinilla et al. 2013, Geremia et al. 2015, Miller and Fischer 2016). The recommended approach to reducing deer numbers is to provide additional hunting opportunities via antlerless allocations and DMAP permits. If deer numbers are not reduced with management, effects of CWD will eventually lower deer numbers. Even with increased harvests, in specific areas, targeted removals may be needed to achieve CWD sampling and management objectives following the hunting seasons.
WMU ANTLERLESS ALLOCATION RECOMMENDATIONS
WMU 2C Staff Recommendation. Increase antlerless harvest by 1 antlerless deer per square mile to stop increasing deer population trend. Justification. The deer population in this WMU is increasing and contains numerous deer infected with CWD along its eastern border. Thus, the recommendation is to stop the deer population increase.
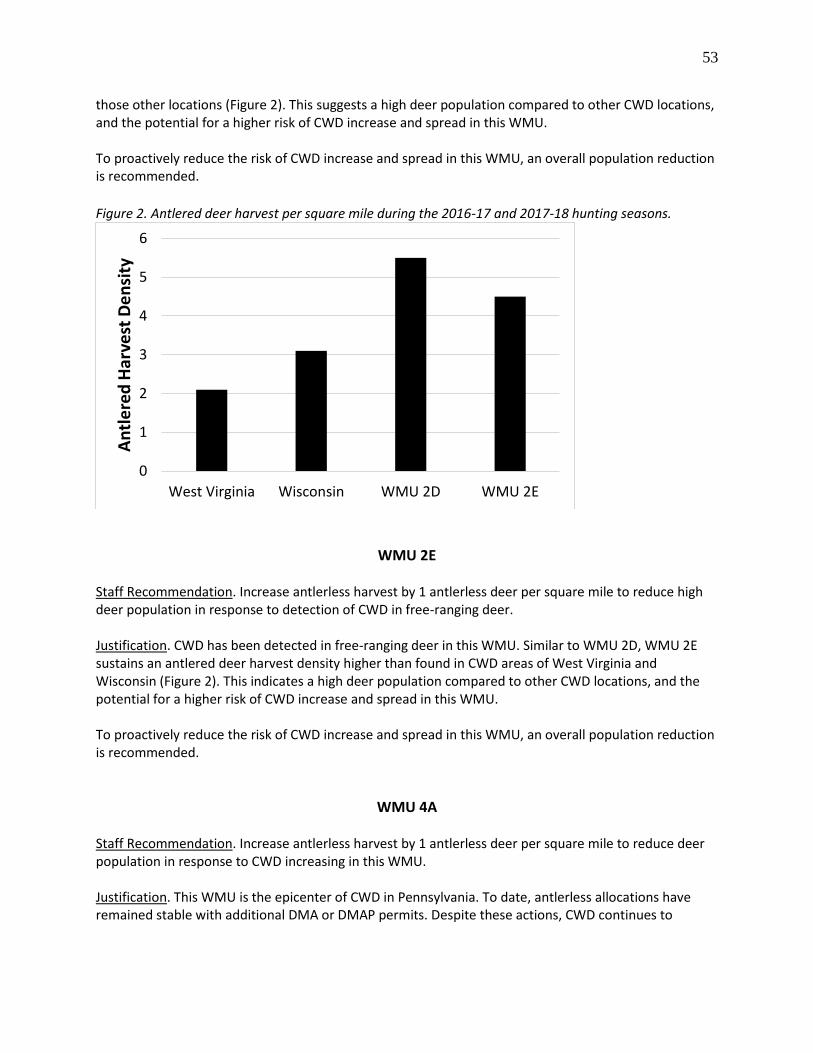
WMU 2D Staff Recommendation. Increase antlerless harvest by 1 antlerless deer per square mile to reduce high deer population in response to detection of CWD in free-ranging deer. Justification. CWD was detected in free-ranging deer in this WMU in 2017. The deer population in this WMU has increased in recent years and is currently at a high level. For example, hunters in this WMU harvest more antlered deer per square mile (i.e., 5.9 antlered deer per square mile in 2017-18) than any WMU in Pennsylvania. Compared to CWD areas in other states, such as Wisconsin and West Virginia, where CWD has increased and spread rapidly, WMU 2D sustains an antlered harvest density double
53
those other locations (Figure 2). This suggests a high deer population compared to other CWD locations, and the potential for a higher risk of CWD increase and spread in this WMU. To proactively reduce the risk of CWD increase and spread in this WMU, an overall population reduction is recommended.
Figure 2. Antlered deer harvest per square mile during the 2016-17 and 2017-18 hunting seasons.
WMU 2E Staff Recommendation. Increase antlerless harvest by 1 antlerless deer per square mile to reduce high deer population in response to detection of CWD in free-ranging deer. Justification. CWD has been detected in free-ranging deer in this WMU. Similar to WMU 2D, WMU 2E sustains an antlered deer harvest density higher than found in CWD areas of West Virginia and Wisconsin (Figure 2). This indicates a high deer population compared to other CWD locations, and the potential for a higher risk of CWD increase and spread in this WMU. To proactively reduce the risk of CWD increase and spread in this WMU, an overall population reduction is recommended.
WMU 4A Staff Recommendation. Increase antlerless harvest by 1 antlerless deer per square mile to reduce deer population in response to CWD increasing in this WMU. Justification. This WMU is the epicenter of CWD in Pennsylvania. To date, antlerless allocations have remained stable with additional DMA or DMAP permits. Despite these actions, CWD continues to
0
1
2
3
4
5
6
West Virginia Wisconsin WMU 2D WMU 2E
An
tle
red
Har
vest
De
nsi
ty
54
increase in this WMU. To further engage hunters in efforts to reduce the effect of CWD, an increase in the antlerless allocation is recommended across the entire WMU.
WMU 4D Staff Recommendation. Stabilize deer population. Justification. Although CWD has been detected in free-ranging deer in this WMU, WMU 4D has a lower antlered harvest density, that suggests a lower deer population, than WMUs 2D and 2E.
CONCLUSIONS
• CWD is a serious and demonstrated threat to deer and deer hunting. No action likely will lead to
CWD spreading and eventually lowering deer populations across larger areas.
• Despite uncertainty, intentional reductions in deer numbers appear to be the best option to
reduce the effect and extent of CWD.
• Based on current knowledge and experiences from other states, deer population reduction is
inevitable with CWD. The choice is whether the reduction is controlled via management actions
or the reduction happens due to CWD infections in more deer across larger areas.
LITERATURE CITED Edmunds D. R., Kauffman M.J., Schumaker, B.A., Lindzey, F.G., Cook, W.E., and Kreeger, T.J. 2016. Chronic wasting
disease drives population decline of white-tailed deer. PLoS ONE 11(8): e0161127.doi:10.1371/ journal.pone.0161127
Geremia C, Miller, M.W., Hoeting, J.A., Antolin, M.F., and Hobbs, N.T. 2015. Bayesian modeling of prion disease
dynamics in mule deer using population ponitoring and capture-recapture data. PLoS ONE 10(10): e0140687. doi:10.1371/journal.pone.0140687
Manjerovic, M. B., M. L. Green, N. Mateus-Pinilla, and J. Novakofski. 2013. The importance of localized culling in
stabilizing chronic wasting disease prevalence in white-tailed deer populations. Preventative Veterinary Medicine 113:139-145.
Mateus-Pinilla, N., H. Y. Weng, M. O. Ruiz, P. Shelton, and J. Novakofski. 2013. Evaluation of a wild white-tailed
deer population management program for controlling chronic wasting disease in Illinois, 2003-2008. Preventative Veterinary Medicine 110:541-548.
Miller, M. W. and J. R. Fischer. 2016. The first five (or more) decades of chronic wasting disease: lessons for the five
decades to come. Transactions of the North American Wildlife and Natural Resources Conference 81: in press.
Uehlinger, F. D., A. C. Johnston, T. K. Bollinger, and C. L. Waldner. 2016. Systematic review of management
strategies to control chronic wasting disease in wild deer populations in North America. BMC Veterinary Research 12:173 DOI 10.1186/s12917-016-0804-7


