
SAND REPORT
SAND2003-0703 Unlimited Release Printed May 2003 Analysis of the Massive Salt Fall in Big Hill Cavern 103
Darrell Munson, Stephen Bauer, Christopher Rautman, Brain Ehgartner, and Allan Sattler
Prepared by Sandia National Laboratories Albuquerque, New Mexico 87185 and Livermore, California 94550 Sandia is a multiprogram laboratory operated by Sandia Corporation, a Lockheed Martin Company, for the United States Department of Energy under Contract DE-AC04-94AL85000. Approved for public release; further dissemination unlimited.
Issued by Sandia National Laboratories, operated for the United States Department of Energy by Sandia Corporation.
NOTICE: This report was prepared as an account of work sponsored by an agency of the United States Government. Neither the United States Government, nor any agency thereof, nor any of their employees, nor any of their contractors, subcontractors, or their employees, make any warranty, express or implied, or assume any legal liability or responsibility for the accuracy, completeness, or usefulness of any information, apparatus, product, or process disclosed, or represent that its use would not infringe privately owned rights. Reference herein to any specific commercial product, process, or service by trade name, trademark, manufacturer, or otherwise, does not necessarily constitute or imply its endorsement, recommendation, or favoring by the United States Government, any agency thereof, or any of their contractors or subcontractors. The views and opinions expressed herein do not necessarily state or reflect those of the United States Government, any agency thereof, or any of their contractors. Printed in the United States of America. This report has been reproduced directly from the best available copy. Available to DOE and DOE contractors from
U.S. Department of Energy Office of Scientific and Technical Information P.O. Box 62 Oak Ridge, TN 37831 Telephone: (865)576-8401 Facsimile: (865)576-5728 E-Mail: [email protected] Online ordering: http://www.doe.gov/bridge
Available to the public from
U.S. Department of Commerce National Technical Information Service 5285 Port Royal Rd Springfield, VA 22161 Telephone: (800)553-6847 Facsimile: (703)605-6900 E-Mail: [email protected] Online order: http://www.ntis.gov/ordering.htm
2

3
SAND2003-0703 Unlimited Release Printed May 2003
ANALYSIS OF THE MASSIVE SALT FALL IN BIG HILL CAVERN 103
Darrell Munson, Stephen Bauer, Christopher Rautman, Brian Ehgartner, and Allan Sattler Underground Storage Technology Department
Sandia National Laboratories P.O. Box 5800
Albuquerque, NM 87185-0706
ABSTRACT This report summarizes recent reviews, observations, and analyses believed to be imperative to our understanding of the recent two million cubic feet salt fall event in Big Hill Cavern 103, one of the caverns of the Strategic Petroleum Reserve (SPR). The fall was the result of one or more stress driven mechanical instabilities, the origins of which are discussed in the report. The work has lead to important conclusions concerning the engineering and operations of the caverns at Big Hill. Specifically, Big Hill, being the youngest SPR site, was subjected to state-of-the-art solutioning methods to develop nominally well-formed, right-circular cylindrical caverns. Examination of the pressure history records indicate that operationally all Big Hill SPR caverns have been treated similarly. Significantly, new three-dimensional (3-D) imaging methods, applied to old (original) and more recent sonar survey data, have provided much more detailed views of cavern walls, roofs, and floors. This has made possible documentation of the presence of localized deviations from “smooth” cylindrical cavern walls. These deviations are now recognized as isolated, linear and/or planar features in the original sonar data (circa early 1990s), which persist to the present time. These elements represent either sites of preferential leaching, localized spalling, or a combination of the two. Understanding the precise origin of these phenomena remains a challenge, especially considering, in a historical sense, the domal salt at Big Hill was believed to be well-
4
characterized. However, significant inhomogeneities in the domal salt that may imply abnormalities in leaching were not noted. Indeed, any inhomogeneities were judged inconsequential to the solution-engineering methods at the time, and, by the same token, to the approaches to modeling the rock mass geomechanical response. The rock mass was treated as isotropic and homogeneous, which in retrospect, appears to have been an over simplification. This analysis shows there are possible new opportunities regarding completing an appropriate site characterization for existing operating cavern fields in the SPR, as well as expansion of current sites or development of new sites. Such characterization should first be consistent with needs identified by this report. Secondly, the characterization needs to satisfy the input requirements of the 3-D solutioning calculational methods being developed, together with 3-D geomechanical analyses techniques which address deformation of a salt rock mass that contains inhomogeneities. It seems apparent that focusing on these important areas could preclude occurrence of unexpected events that would adversely impact the operations of SPR.

5
ACKNOWLEDGEMENTS The authors are indebted to the DynMcDermott personnel, J. A. Farquhar and A. L. Piechochi, who kindly made available the wireline and sonar survey data from Cavern 103, as well as the recent history relating to the cavern and the salt fall. As part of a continuing process, they also provided the sonar survey data for the Big Hill site. The continued support and encouragement of W. S. Elias and R. E. Myers of the DOE/SPR Project Office is greatly appreciated. The authors wish to thank N. S. Brodsky and D. J. Holcomb for their thoughtful reviews. Critical comments and technical suggestions by R. E. Finley and T. E. Hinkebein concerning the analysis and report also proved extremely important.

6
TABLE OF CONTENTS ABSTRACT . . . . . . . . . . . . . . . . . . . . . . . . . . . . . . . . . . . . . . . . . . . . . . . . . . . . . . . . . . 3 ACKNOWLEDGEMENT . . . . . . . . . . . . . . . . . . . . . . . . . . . . . . . . . . . . . . . . . . . . . . . 5 TABLE OF CONTENTS . . . . . . . . . . . . . . . . . . . . . . . . . . . . . . . . . . . . . . . . . . . . . . . . 6 LIST OF FIGURES . . . . . . . . . . . . . . . . . . . . . . . . . . . . . . . . . . . . . . . . . . . . . . . . . . . . 7 1.0 INTRODUCTION . . . . . . . . . . . . . . . . . . . . . . . . . . . . . . . . . . . . . . . . . . . . . . . . . 8 2.0 BACKGROUND . . . . . . . . . . . . . . . . . . . . . . . . . . . . . . . . . . . . . . . . . . . . . . . . . . 9 3.0 SALT FALL EVENT IN BIG HILL CAVERN 103 . . . . . . . . . . . . . . . . . . . . . . . 12 3.1 Cavern Pressure Response. . . . . . . . . . . . . . . . . . . . . . . . . . . . . . . . . . . . . . . 12 3.2 Wireline Measures of Cavern Bottom Elevations. . . . . . . . . . . . . . . . . . . . . . 13 3.3 Sonar Survey Data. . . . . . . . . . . . . . . . . . . . . . . . . . . . . . . . . . . . . . . . . . . . . 14 4.0 EXTENDED ANALYSES OF CAVERN FIELD CONDITIONS. . . . . . . . . . . . . 19 4.1 Comparison of Historic Sonar Data on Big Hill Caverns. . . . . . . . . . . . . . . 19 4.2 Correlation of Relative Creep Closures and Material Properties. . . . . . . . . 25 4.3 Evaluation of Floor Elevation Data for Big Hill Caverns. . . . . . . . . . . . . . . 27 5.0 SUMMMARY AND CONCLUSIONS . . . . . . . . . . . . . . . . . . . . . . . . . . . . . . . . . 30 . REFERENCES . . . . . . . . . . . . . . . . . . . . . . . . . . . . . . . . . . . . . . . . . . . . . . . . . . . . . . . 32 DISTRIBUTION . . . . . . . . . . . . . . . . . . . . . . . . . . . . . . . . . . . . . . . . . . . . . . . . . . . . . . 33

7
LIST OF FIGURES Figure 1. Big Hill Dome and SPR Cavern Locations [Magorian and Neal, 1988]. . . . . 10 Figure 2. Pressure History of Cavern 103 up to March 2002. . . . . . . . . . . . . . . . . . . . . 12 Figure 3. Bottom Elevations of Cavern 103. . . . . . . . . . . . . . . . . . . . . . . . . . . . . . . . . . 13 Figure 4. Sonar Determination of Cavern 103 Bottom Profile and Hanging String. . . 15 Figure 5. Evolution of the Salt Fall in Cavern 103. . . . . . . . . . . . . . . . . . . . . . . . . . . . 16 (a) 1990 View from 285o (b) 2000 View from 285o (c) 2002 View from 285o Figure 6. Schematic Cross-Section of Cavern 103 near Top of Salt Fall. . . . . . . . . . . . 17 Figure 7. Caverns Exhibiting Lineaments and Solutioning Diameter Changes. . . . . . . 20
(a) Cavern 106, 45o, 2000. (b) Cavern 104, 86o, 2000. Figure 8. Top View of Cavern 108 Sonar Contours, Exhibiting Wings. . . . . . . . . . . . . 21 Figure 9. Distinctive “Dog Leg” in Cavern 114. . . . . . . . . . . . . . . . . . . . . . . . . . . . . . . 22
(a) Cavern 114, 165o, 2000. (b) Cavern 114, 334o, 2000. Figure 10. Cavern with Solutioning Pits and Cavern with Mechanical Salt Fall Pits. . 23
(a) Cavern 110, 109o, 2000. (b) Cavern 101, 210o, 2000. Figure 11. Schematic Big Hill Dome, Caverns, Closure Rates, and Cavern Features. . 26 Figure 12. Bottom Elevations in Cavern 102 during Operation. . . . . . . . . . . . . . . . . . . 28 Figure 13. Bottom Elevation in Cavern 104 during Operation, with Recent Increase. . 29

8
1.0 INTRODUCTION Even though the salt domes of the Gulf Coast have been utilized for cavern storage, chemical brine stock production, and salt mining for decades, their very size and location tends to limit our ability to fully gain fundamental knowledge of their geologic and material characteristics. While some insight is gained through deep coring into the dome and from within salt mines at modest depths, these methods sample only an infinitesimal portion of the salt dome. Consequently, these can give a fragmentary picture of the detailed geology and material characteristics of the dome, at best. Over the last few years, additional information about the interior conditions of the domes has been generated from examination of indirect data obtained in salt caverns used for storage. Principally this information has come from measurements and event analysis in the 62 large caverns of the Strategic Petroleum Reserve (SPR). It is the nature of this project that measurements have been routinely made in these caverns throughout their construction and operation. Moreover, the caverns have largely been operated in a quiescent mode, with infrequent movement of fluids into or out of the caverns. Such a comprehensive database is unusual for operational facilities. At Big Hill, a major event occurred in one of the caverns. A preliminary analysis determined that the event was the result of a massive salt fall. For Cavern 103, the analysis involved examination of the sonar surveys taken in 1990, 2000, and 2002, which indicated significant changes in cavern conditions with time. The accumulation of debris on the cavern bottom was noted, as was the response of the cavern pressure, over time. Through these means the details and consequences of the salt fall were established. The intent was to determine, so far as possible, what was observed and what should have been observed, to understand the nature of the event, and to evaluate the potential for future similar events. In general this report summarizes the results of the analysis and quantifies the extent of the salt fall. Further, the analysis of Cavern 103 prompted an intensive effort to review and analyze in detail the information from all SPR caverns at the Big Hill site. The several areas of analysis included extensive examination of the sonar survey data from the caverns of the site, evaluation of rate of accumulation of material on the cavern bottoms, evaluation of the cavern creep closure rates, and the relative comparison of the material deformation properties. It draws together conclusions on the possible origin, extent, and disposition of salt falls in an attempt to understand the interior cavern conditions leading up to and culminating in salt fall. Finally, a summary of the apparent conditions of the Big Hill SPR caverns is given which categorizes important characteristic features in the caverns based on sonar survey data. These are resolved into dissolution features and salt fall features related to peculiar salt dome stratigraphy. Visualization of these features is made possible through a new graphics technology utilizing a modern three-dimensional graphics system [Rautman, 1999]. Understanding of these features, while not yet fully achieved, is probably the key to predicting long-term storage cavern behavior. However, the report concludes that while many cavern features may suggest potential problem

9
situations, prediction of future events at the caverns of Big Hill is not possible, at this time.

10
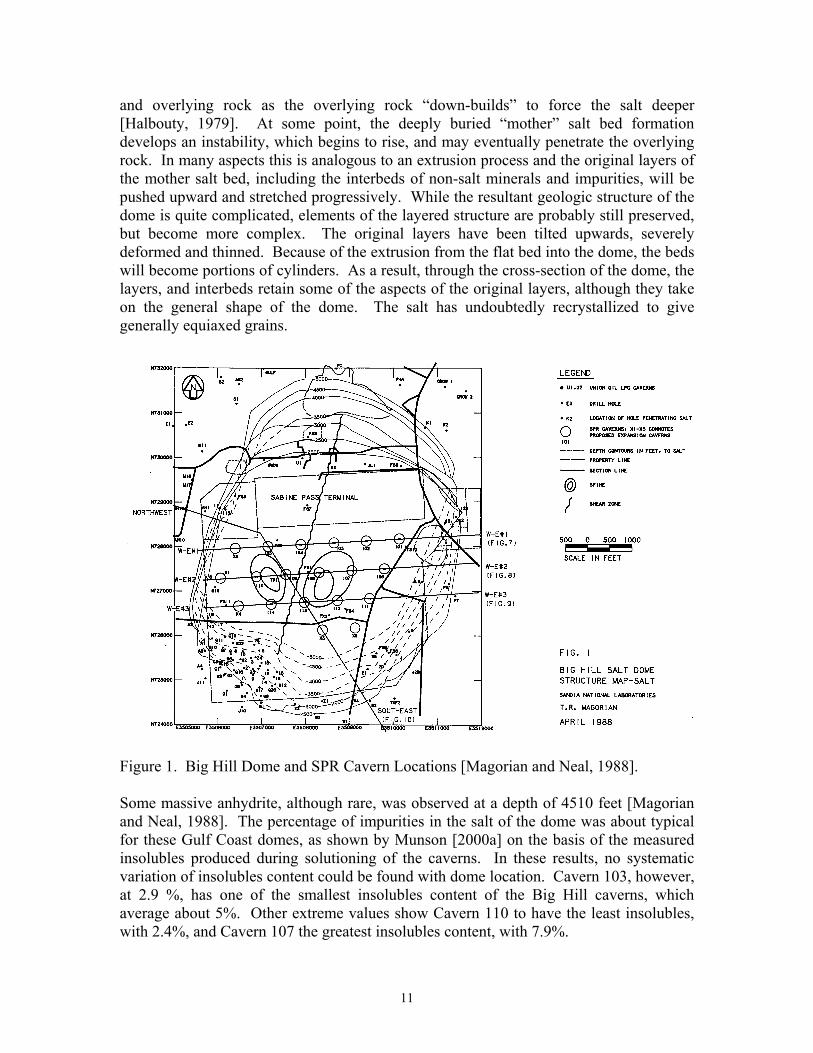
2.0 BACKGROUND There are 14 SPR caverns at the Big Hill facility, which occupy a portion of the Big Hill salt dome. These caverns were part of the Phase II cavern construction by the SPR Project using a two-well method of solution mining of the caverns [DOE, 1991]. Because the solutioning technology was well developed by the time these caverns were constructed in the late 1980’s, they are all of nearly the same dimensions and have a nearly uniform geometric shape of regular cylinders. Caverns are roughly 200 feet in diameter and 2000 feet high. Typically, the cylinders taper slightly inward at the bottom to give a smaller diameter. Because of their geometry the caverns were thought to be quite stable. In fact, only one identifiable event of damage to a brine hanging string, attributed to a salt fall, had previously occurred at the Big Hill site, this in 1990 in Cavern 114 [Munson, et al., 1998]. However, as we shall show, there are some significant irregularities in the solutioning of some caverns. Geological characterization of the Big Hill dome [Magorian and Neal, 1988] indicates there is 100 to 200 feet of unconsolidated overburden on top of a rather thick caprock, which is composed of approximately an 800 to 1000 foot thick layer of gypsum and limestone mix, underlain by 500 to 700 feet of anhydrite. The top of the salt is about 1700 feet below the ground surface. The cavern roofs are about 2300 feet below the ground surface, or nearly 600 feet below top of salt. The caverns extend to the current cavern bottoms at roughly a depth of 4300 feet below the ground surface. The SPR caverns are arranged in the dome as shown in Figure 1. Based on the observed fault on the surface of the caprock, Magorian and Neal [1988] suggest this fault extends into the salt dome. This feature is shown in Figure 1 as the wavy line in the caprock running south-southwest to north-northeast, between Caverns 104 and 103. The nature of any extension of this discontinuity into the salt is unknown, although they suggest some form of anomalous zone in the salt below the fault trace. The contours of the salt surface (dome flank) with depth are also shown in the figure. These show a distinct overhang toward the south-southeast. Only limited core samples were obtained during the drilling of the SPR wells at Big Hill. These samples obtained by coring indicated that the salt was extremely coarse grained, some with crystals as much as five feet in diameter, and very pure [Magorian and Neal, 1988]. Such large and clear crystals of salt, as found in Big Hill, are thought to be unique. Anhydrite bands or concentrations of anhydrite crystals are also found in the core. The collections of anhydrite particles were generally localized. Small quantities of finely disseminated sylvite also occur, increasingly toward the edges of the dome. The general amount of insolubles apparently increases toward the edges of the dome. Bands of insoluble anhydrite appear to parallel the edges of the dome, so the bands are steeply inclined, or nearly vertical in the drill holes. These configurations of insolubles, according to some theories of diapir formation represent mineralogic segregation during deformation and metamorphosis of the rock mass, but here they probably also represent deformed and elongated beds or interbeds of the original layered salt. Diapirs are thought to be the result of the buoyant forces caused by the density contrast of deeply buried salt
11
and overlying rock as the overlying rock “down-builds” to force the salt deeper [Halbouty, 1979]. At some point, the deeply buried “mother” salt bed formation develops an instability, which begins to rise, and may eventually penetrate the overlying rock. In many aspects this is analogous to an extrusion process and the original layers of the mother salt bed, including the interbeds of non-salt minerals and impurities, will be pushed upward and stretched progressively. While the resultant geologic structure of the dome is quite complicated, elements of the layered structure are probably still preserved, but become more complex. The original layers have been tilted upwards, severely deformed and thinned. Because of the extrusion from the flat bed into the dome, the beds will become portions of cylinders. As a result, through the cross-section of the dome, the layers, and interbeds retain some of the aspects of the original layers, although they take on the general shape of the dome. The salt has undoubtedly recrystallized to give generally equiaxed grains.
Figure 1. Big Hill Dome and SPR Cavern Locations [Magorian and Neal, 1988]. Some massive anhydrite, although rare, was observed at a depth of 4510 feet [Magorian and Neal, 1988]. The percentage of impurities in the salt of the dome was about typical for these Gulf Coast domes, as shown by Munson [2000a] on the basis of the measured insolubles produced during solutioning of the caverns. In these results, no systematic variation of insolubles content could be found with dome location. Cavern 103, however, at 2.9 %, has one of the smallest insolubles content of the Big Hill caverns, which average about 5%. Other extreme values show Cavern 110 to have the least insolubles, with 2.4%, and Cavern 107 the greatest insolubles content, with 7.9%.

12
As shown in Figure 1, Cavern 103 is located nearly in the center of the dome. The cavern has two wells. Cavern solutioning was from Well A, which is the central well of the cavern. When the cavern became operational, this well configuration was converted to a slick hole. Well B, which now contains the hanging string, is slightly to the east of Well A. At the time of completion of construction, November 1990, the cavern roof was about 2250 feet below ground surface, and the cavern bottom was roughly 4095 feet below ground surface. Thus, the cavern height was approximately 1845 feet, at that time.

13
3.0 SALT FALL EVENT IN BIG HILL CAVERN 103 During March of 2002, the Project became aware of some abnormal events in the Big Hill Cavern 103, primarily because of a marked increase in bottom elevation obtained from a wireline log taken March 7, 2002. While the event is thought to have occurred in the March 2002 time frame, the precise date is unknown, but it must have been between July 26, 2001 when an earlier wireline probe gave the expected, or normal, cavern bottom reading and March 7, 2002 when a similar wireline probe recorded the marked increase in bottom elevation. Another interesting aspect of the March 7, 2002 wireline survey was the deduction that the bottom of the brine hanging string was displaced toward the southeast by nearly 30 feet. However, there was no evidence of damage to the hanging string. 3.1 Cavern Pressure Response The immediate question as whether or not the cavern pressure responded to the possible salt fall event. One would expect that a massive salt fall would produce a pressure wave in the fluids. As a result, the pressure history data from Cavern 103 has been extensively examined in light of any potential effect on cavern deformation and salt fall potential. Prior to March 2002 the cavern had been depressurized for a workover in April 2001, and partially depressurized during January and February 2002 while being refilled with oil, as seen in Figure 2. Both of these operations appeared “normal.” Throughout the period of concern, Cavern 103 was treated in an operational manner similar to the other SPR caverns. While there were spikes in the minute-to-minute
0
200
400
600
800
1000
1200
Dec-00 Feb-01 Apr-01 Jun-01 Aug-01 Oct-01 Dec-01 Feb-02
Pres
sure
(psi
)
Workover
MIT
Low Cavern Pressures
Oil Fill
Figure 2. Pressure History of Cavern 103 up to March 2002.
14
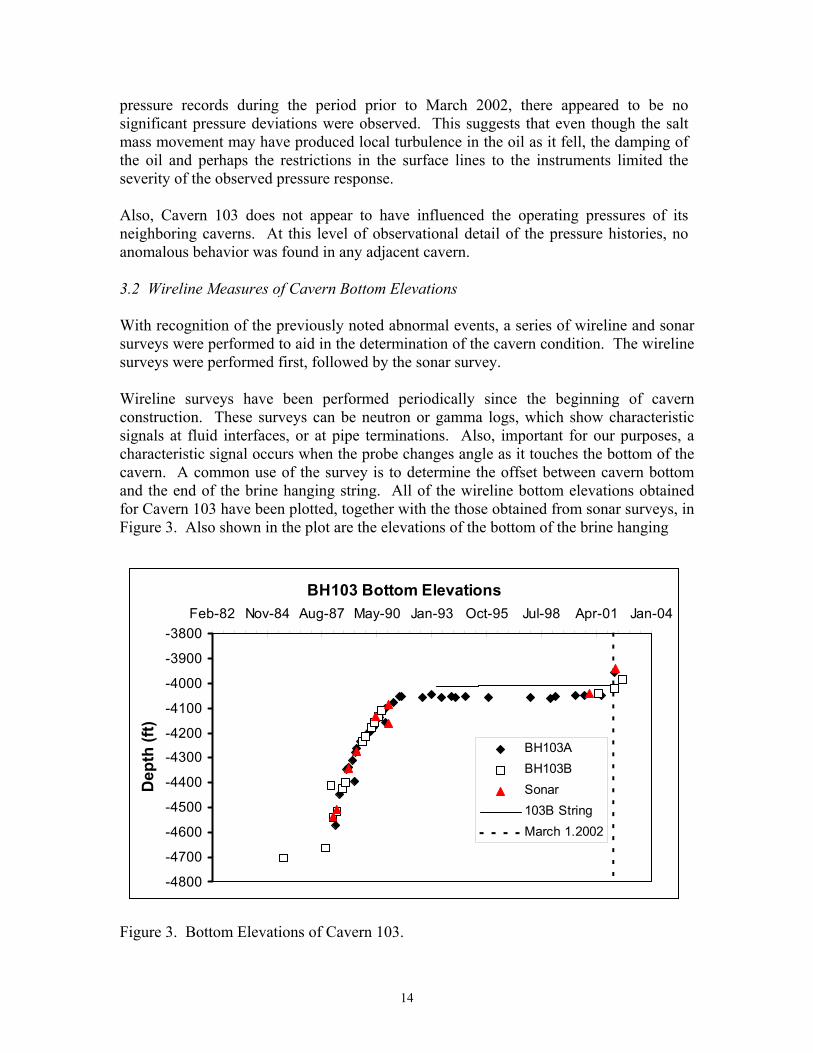
pressure records during the period prior to March 2002, there appeared to be no significant pressure deviations were observed. This suggests that even though the salt mass movement may have produced local turbulence in the oil as it fell, the damping of the oil and perhaps the restrictions in the surface lines to the instruments limited the severity of the observed pressure response. Also, Cavern 103 does not appear to have influenced the operating pressures of its neighboring caverns. At this level of observational detail of the pressure histories, no anomalous behavior was found in any adjacent cavern. 3.2 Wireline Measures of Cavern Bottom Elevations With recognition of the previously noted abnormal events, a series of wireline and sonar surveys were performed to aid in the determination of the cavern condition. The wireline surveys were performed first, followed by the sonar survey. Wireline surveys have been performed periodically since the beginning of cavern construction. These surveys can be neutron or gamma logs, which show characteristic signals at fluid interfaces, or at pipe terminations. Also, important for our purposes, a characteristic signal occurs when the probe changes angle as it touches the bottom of the cavern. A common use of the survey is to determine the offset between cavern bottom and the end of the brine hanging string. All of the wireline bottom elevations obtained for Cavern 103 have been plotted, together with the those obtained from sonar surveys, in Figure 3. Also shown in the plot are the elevations of the bottom of the brine hanging
Figure 3. Bottom Elevations of Cavern 103.
BH103 Bottom Elevations
-4800
-4700
-4600
-4500
-4400
-4300
-4200
-4100
-4000
-3900
-3800Feb-82 Nov-84 Aug-87 May-90 Jan-93 Oct-95 Jul-98 Apr-01 Jan-04
Dep
th (f
t)
BH103ABH103BSonar103B StringMarch 1.2002

15
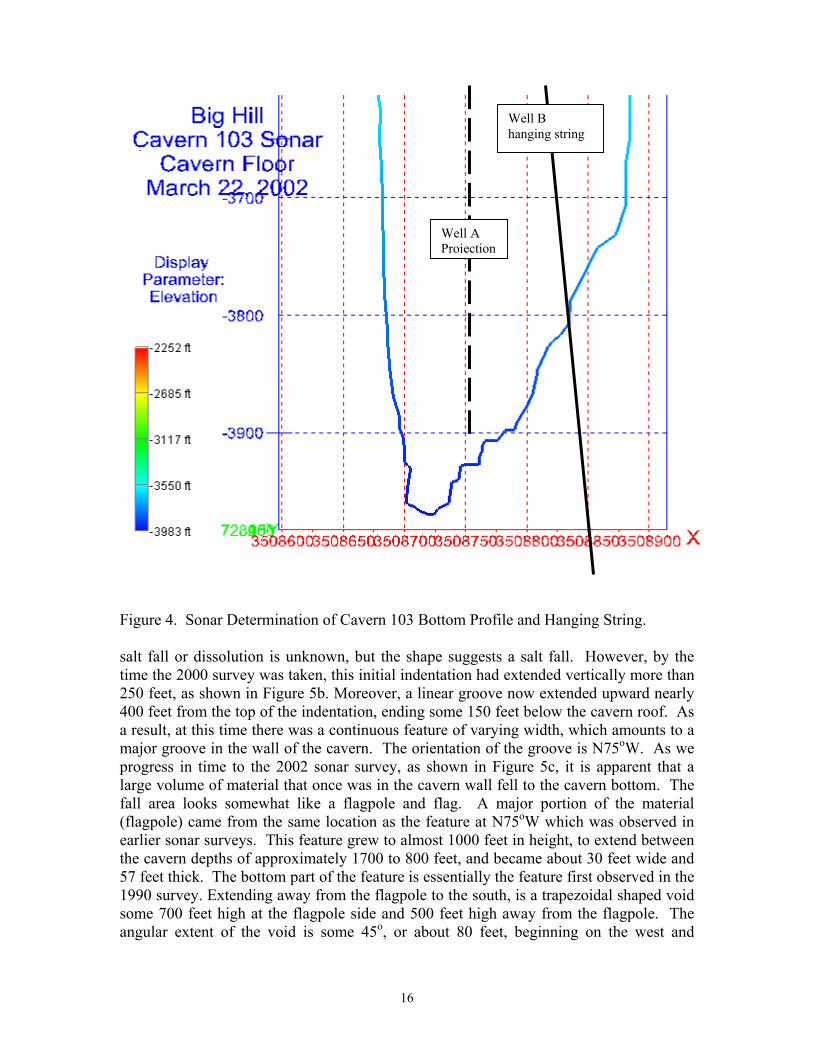
string and the March 1, 2001 date marker. Prior to the March event, the cavern conditions are much as would be expected. During construction, the bottom elevation rises sharply because of the deposition of insolubles released from the dissolved salt, thereafter, during routine cavern operation, the bottom rises slowly because of the sloughing of salt from the cavern walls with time. In fact there was a gradual increase in bottom elevation between January 1992 and May 2000 of about 7 ft. For the diameter of the cavern bottom, this is an accumulation of approximately 212,000 cubic ft of material, or nearly 15,000 tons of salt. More significantly, however, the most recent wireline measurements in Cavern 103, taken after the March event, show a very marked increase in cavern bottom elevations. This is precisely as would be expected. Again, this rise in bottom elevation does not appear to be a precursor to the salt fall, and thus, not a useful harbinger of salt fall activity. 3.3 Sonar Survey Data Sonar surveys were taken during construction after each stage of cavern solutioning, and infrequently since that time. After completion of construction, a sonar survey was taken in December of 1990. Further sonar surveys were not obtained until September of 2000. This was followed by the sonar survey obtained in March of 2002. Because the sonar probe can touch the cavern bottom, the cavern bottom elevation was also measured in the sonar surveys obtained up to September 2000. These cavern bottom measurements essentially substantiate the wireline bottom elevations during that same period of time, as shown in Figure 3. However, post March, this agreement changed in that the most recent sonar survey indicates a significant discrepancy between the sonar and wireline measurements. The discrepancy between the wireline and the sonar bottom elevations post March indicates suggests that the wireline measurement is not the elevation of the cavern bottom. This, when taken in conjunction with the deflection of the bottom of the brine string, conclusively shows that the brine string is buried in debris from the event. As, will be shown, this situation is confirmed by the cavern bottom profile as determined from the sonar survey data, as shown in Figure 4. Here the hanging string appears to buried in more than 100 ft of debris. The sonar results convey much more explicit information than just the bottom elevations of the cavern. In fact, the Cavern 103 configuration can be clearly traced through the successive surveys of 1990, 2000, and 2002. Application of a modern three-dimensional graphics method permits gray-scale images of the sonar survey data that is exceptional, displaying a resolution of features not possible with earlier methods. The views in Figure 5 are all from the compass direction of 285o, or from the west-northwest toward the east-southeast. These images are of special interest because they show the progressive formation of the conditions leading to a very massive salt fall. In Figure 5a, a “small” feature (actually some 100 feet plus in length) appears at a nominal vertical cavern depth location of 1300 feet. The feature is an indentation in the cavern wall, in the form of a wedge with the apex pointed downward. Whether this was the result of a
16
Figure 4. Sonar Determination of Cavern 103 Bottom Profile and Hanging String. salt fall or dissolution is unknown, but the shape suggests a salt fall. However, by the time the 2000 survey was taken, this initial indentation had extended vertically more than 250 feet, as shown in Figure 5b. Moreover, a linear groove now extended upward nearly 400 feet from the top of the indentation, ending some 150 feet below the cavern roof. As a result, at this time there was a continuous feature of varying width, which amounts to a major groove in the wall of the cavern. The orientation of the groove is N75oW. As we progress in time to the 2002 sonar survey, as shown in Figure 5c, it is apparent that a large volume of material that once was in the cavern wall fell to the cavern bottom. The fall area looks somewhat like a flagpole and flag. A major portion of the material (flagpole) came from the same location as the feature at N75oW which was observed in earlier sonar surveys. This feature grew to almost 1000 feet in height, to extend between the cavern depths of approximately 1700 to 800 feet, and became about 30 feet wide and 57 feet thick. The bottom part of the feature is essentially the feature first observed in the 1990 survey. Extending away from the flagpole to the south, is a trapezoidal shaped void some 700 feet high at the flagpole side and 500 feet high away from the flagpole. The angular extent of the void is some 45o, or about 80 feet, beginning on the west and
Well A Projection
Well B hanging string

17
extending around toward the south to the angle of about S45oW. The debris from the fall resulted in the marked increase in cavern bottom elevation, and produced the marked slope in the bottom, as illustrated in Figure 4. There have been two different calculations of the volume of the salt fall. Myers [2002] used the differences in the cavern volume between the 2000 and 2002 surveys, applied over the area of the salt fall, to obtain the apparent volume of the salt fall mass. This was determined to be approximately 0.3505 MMB or 1.969 million cubic feet of material. Certainly, the size of this single salt fall far exceeds any previously identified in the SPR. In another calculation with the new three-dimensional graphics method, the direct output of a sonar survey used the distance-azimuth results for a stepwise integration to give the cavern volume over the entire cavern height. Thus, the differences in the images shown in Figures 5b and 5c can be integrated, and the results subtracted, with the result that gives the apparent salt fall volume of about 2.182 million cubic feet, in general agreement with the Myers calculation. It is impossible to ignore another major feature that appears in all of the sonar surveys, and seems to be growing with time. This is an extremely pronounced vertical trench that
(a) 1990 View from 285o (b) 2000 View from 285o (c) 2002 View from 285o Figure 5. Evolution of the Salt Fall in Cavern 103.

18
extends from a cavern depth of about 1400 feet upwards to approximately 300 feet at an orientation of about N15oW. While not linked to the salt fall, this feature is certainly of some significance, with a depth of between 20 and 50 feet and a width of as much as 50 feet. Figure 6. Schematic Cross-Section of Cavern 103 near Top of Salt Fall. Although the shaded views in Figure 5 of the cavern are very instructive, in order to give an idea of how these features are oriented, a schematic cross-section at roughly cavern midheight is given in Figure 6. The schematic is relatively crude and should not be used in place of the sonar data to determine the actual size of the salt fall. The view direction of the sonar representations of Figure 5 is from west-southwest (285o) in Figure 6. Interestingly, the linear features (lineaments) observed in Cavern 103 are essentially
Feature at N15oW
Feature at N75oW 1990 and 2000
Salt Fall Found 2002
N
Big Hill 103
19
vertical, even though the traces of these features at the cavern wall are slightly distorted because of the curvature in the cavern walls. It seems apparent that linear features are related to the geology of the salt dome, perhaps to segregated material of a different mineral or impurity content, such as an interbed. The geologic structure is a sheet that has its own curvature which appears to be on the scale of the cavern height. This sheet interacts with the surface sheet of the cavern wall and the trace is formed from the intersection of the two sheets. Unfortunately, there is insufficient information to resolve the directions of the geologic sheet from the trace. Even though these cannot be established from the limited data and understanding at this time, perhaps future data will aid in understanding the nature of the sheets that produce the observed intersection traces. The question involves the evolution of the dome and the possible forms that the bedding layers can assume. The widths of the features as they have developed appear to be larger than one would expect from interbeds. In fact, the widths would be more compatible with a given layer of the original mother bed. However, on the basis of Cavern 103, there appears to be only individual intersection traces, without evidence of complementary intersection traces. In other words, there does not appear to be evidence of mutual concave arcs of a bedding layer contained in the cavern walls Clearly there is the possibility that examination of all of the SPR Caverns at the Big Hill site, together with other aspects of the dome geology and material characteristics, may provide more understanding of the dome structure and subsequent leaching and deformation dynamics, and hence, may shed light on not only the reasons behind the Cavern 103 salt fall but also the behavior of the remainder of the caverns at Big Hill. As a result, the initial analysis has been extended to include relevant information involving the entire SPR cavern field and the known salt dome conditions.

20
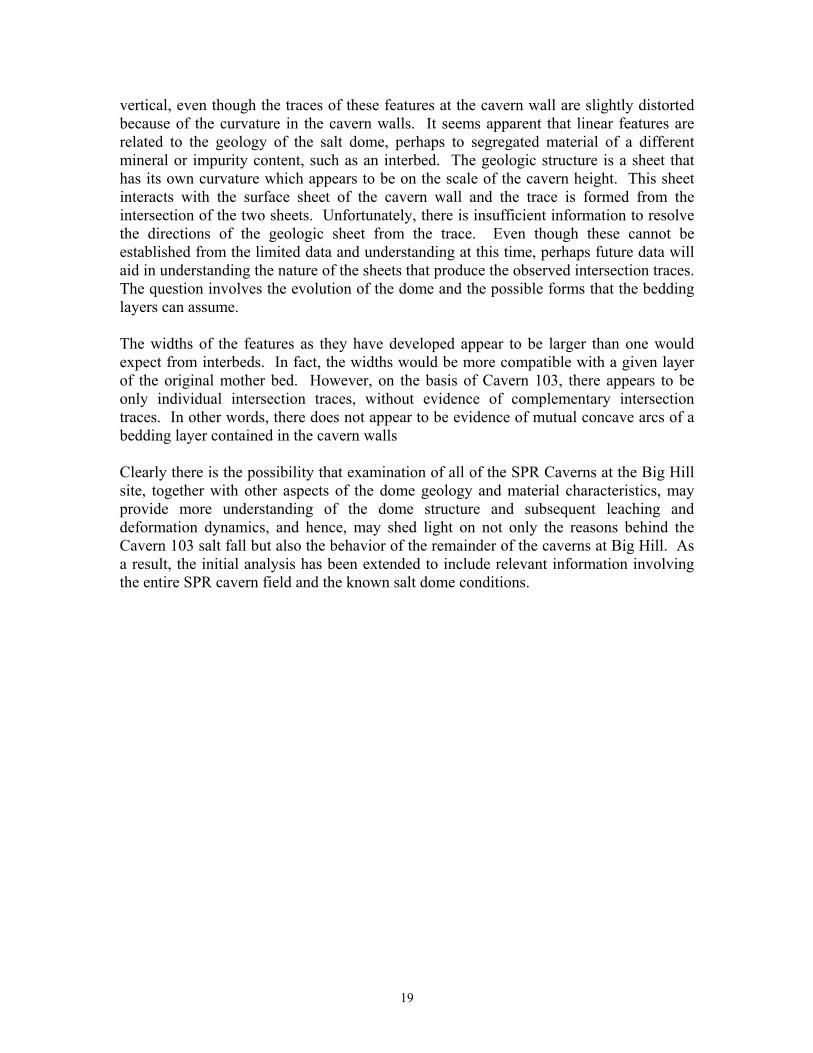
4.0 EXTENDED ANALYSES OF CAVERN FIELD CONDITIONS Rather than consider just the single cavern involved in the salt fall event, it is possible to extend the analysis to include several types of information collected from the entire SPR cavern field and the Big Hill dome. Specifically, the information types are the sonar surveys of the other SPR caverns of Big Hill, the accumulation of material on the cavern bottoms with time, the correlation of creep closure properties across the SPR facility, and the possible correlation of material properties to cavern response. Each of the individual analyses will be developed independently, and then a final summary presented. 4.1 Comparison of Historic Sonar Data on Big Hill Caverns Periodically, beginning with the cavern construction process, sonar surveys have been taken of the Big Hill caverns, essentially from 1990 to 2002. We are interested in using the sonar surveys to trace the changes in the completed caverns, ignoring the sonar surveys taken during cavern construction. Initially, the surveys were presented in hard-copy formats, and more recently, in electronic formats. Consequently, the analysis of the of the historical sonar survey data required examining all of these data, adapting them to a modern graphics electronic database, and displaying the results using modern graphical presentation methods. It is worth mentioning the graphics system because it has proven to be a powerful tool. The images of Figure 5 were made using the three-dimensional graphics system. In these gray-scale images, there is incredible detail. Significant features, such as the lineaments that extend for several hundreds of feet along the cavern surface can be easily traced through a succession of sonar survey data taken over time. This astounding resolution was apparently always available in the database, but was not realized because of the very crude graphical representations used previously. Through the use of three-dimensional images, the major features present in the cavern walls can be categorized. Since it is not possible to present all of the caverns in this report, we will use examples to demonstrate the features of interest. In the first category, a number of the Big Hill caverns are very nearly right circular cylinders, as envisioned to result from ideal solutioning. Because of the discrete stages of solutioning, however, there may be steps in the diameter. An example of a nearly uniform tapered cylinder is Cavern 106, as shown in Figure 7a. Cavern 104, which is nearly uniform, except for diameter changes indicative of the solution stages, especially that decrease in diameter at a cavern depth of about 3700 feet, is shown in Figure 7b. Both of these caverns exhibit the extensive vertical lineaments that persist over time. The lineaments can be the boundaries of a relatively wide (several 10’s of feet) region, or relatively narrow (perhaps 10 feet) region, where perhaps the solutioning has been preferentially somewhat greater. Cavern 106 has both of these of features, with the former on the left and the latter on the right side of Figure 7a. As noted previously, the lineament features are probably associated with the original layers of the “mother” salt, but now deformed and extruded so that they are vertical, and conform to the cylindrical shape of the dome. Although not shown, one other cavern which approaches the ideal solutioning shape is Cavern 109. Caverns with lineaments, where the solutioning
21
(a) Cavern 106, 45o, 2000. (b) Cavern 104, 86o, 2000.
Figure 7. Caverns Exhibiting Lineaments and Solutioning Diameter Changes. differential is slight, would appear to have a stable geometry if the salt mass is assumed isotropic and homogeneous. However, recent wireline evidence suggests that Cavern 104 may have experienced a salt fall, and therefore, this assumption may represent an over simplification. A number of caverns are in the second category. While all of the caverns exhibit lineaments, which form apparently due to very slight preferential solutioning, other caverns exhibit features that can be attributed only to a decidedly more marked preferential solutioning, possibly combined with local sloughing. There are perhaps two subcategories of marked preferential solutioning, differing in degree but not kind. There is general preferential solutioning, which we discuss first, and a more limited preferential solutioning, which we discuss later. An example of a general preferential solutioning feature is illustrated best by Cavern 108. The gray-scale image in Figure 8 shows the contours of the cavern looking directly downward onto the top of the cavern. There are marked “wings” or lobes extending from the cavern in both the northeasterly and the southwesterly directions. Interestingly, these wings have existed in essentially the same shape since the completion of solutioning of the cavern in 1990. Changes since that time have been minimal. Consequently, these are solutioning features caused by very significant preferential solutioning. Because the sonic survey gives only straight ray lines, the extent of the lobes may be masked and they

22
may have undetectable recumbent portions. Generalizations are difficult, but one would suppose that for Cavern 108 a more easily dissolved layer cuts across the cavern. The layer is apparently a sheet that contains the cavern axis.
Figure 8. Top View of Cavern 108 Sonar Contours, Exhibiting Wings. The marked preferential solutioning can take different forms, for example, in Cavern 113 the preferential solutioning has resulted in an oval cross-section. The major axis of the oval is, again, interestingly, in the northeasternly-southwesternly direction. This theme is carried further with a variation to Cavern 112, which appears in cross-section to be composed of two cylinders, one of larger diameter than the other, indicating differences in the solutioning rates of the salt in these two volumes. The plane, which separates the two cylinders, also trends diametrically northeasternly-southwesternly through the cavern. Cavern 107 also has preferential solutioning in the same orientation as the caverns noted above. Cavern 102 has what might be described as a very deep lineament oriented to the north. While this may be evidence of a marked preferential solutioning, it is very restricted. In fact it appears to be similar to the lineament found in Cavern 103 in the N15oW orientation. A rather unusual form of preferential solutioning is found in Caverns 105, 111, 112, and 113, where a “foot” shaped lobe occurs at the very bottom of the cavern. This must have taken place during the sump development stage of the cavern construction. Even though most sump preferential solution features have similar northeasternly-southwesternly
23
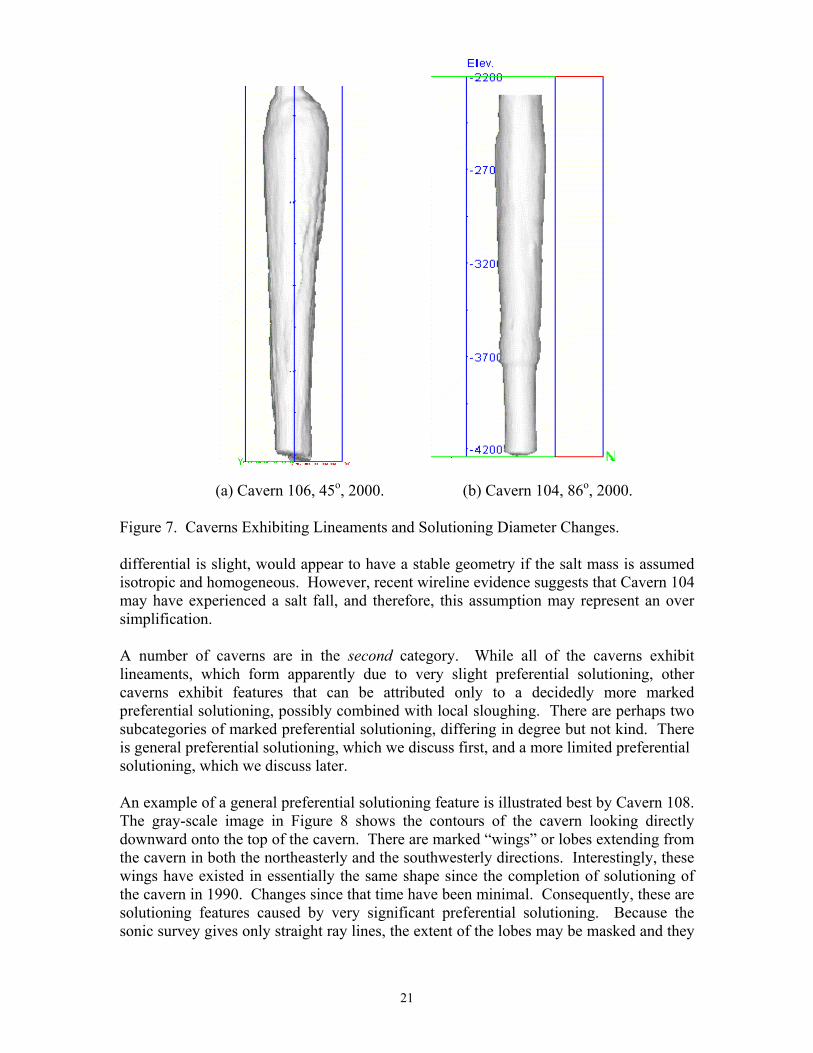
orientations directions, this differs in Cavern 105 where the “foot” solution feature takes a northerly direction. Whether or not the formation of a solution feature in the cavern sump region is some operational peculiarity of that stage of construction or a real material effect is unknown. Perhaps a more detailed review of the leaching history of these caverns would provide greater understanding. Cavern 114 seems to be a special case because it is miss-shaped in a manner that potentially suggests preferential solutioning, but in a manner different than that observed in the other caverns. As the two views in Figure 9 indicate, the cavern appears crooked, with a “dog leg” at about midheight. The top part of the cavern crook curves slightly west while the bottom part curves slightly east. At this time, there is no explanation for this observation. Although general preferential solutioning may be of operational concern, especially for multiple drawdowns where the solutioning could markedly enlarge the lobes of a cavern, it is not in itself necessarily a structural problem. However, with the lobes such as those found in Cavern 108, the sharp recumbent ridges certainly could be areas of stress concentrations and therefore subject to failure.
(a) Cavern 114, 165o, 2000. (b) Cavern 114, 334o, 2000. Figure 9. Distinctive “Dog Leg” in Cavern 114.
24
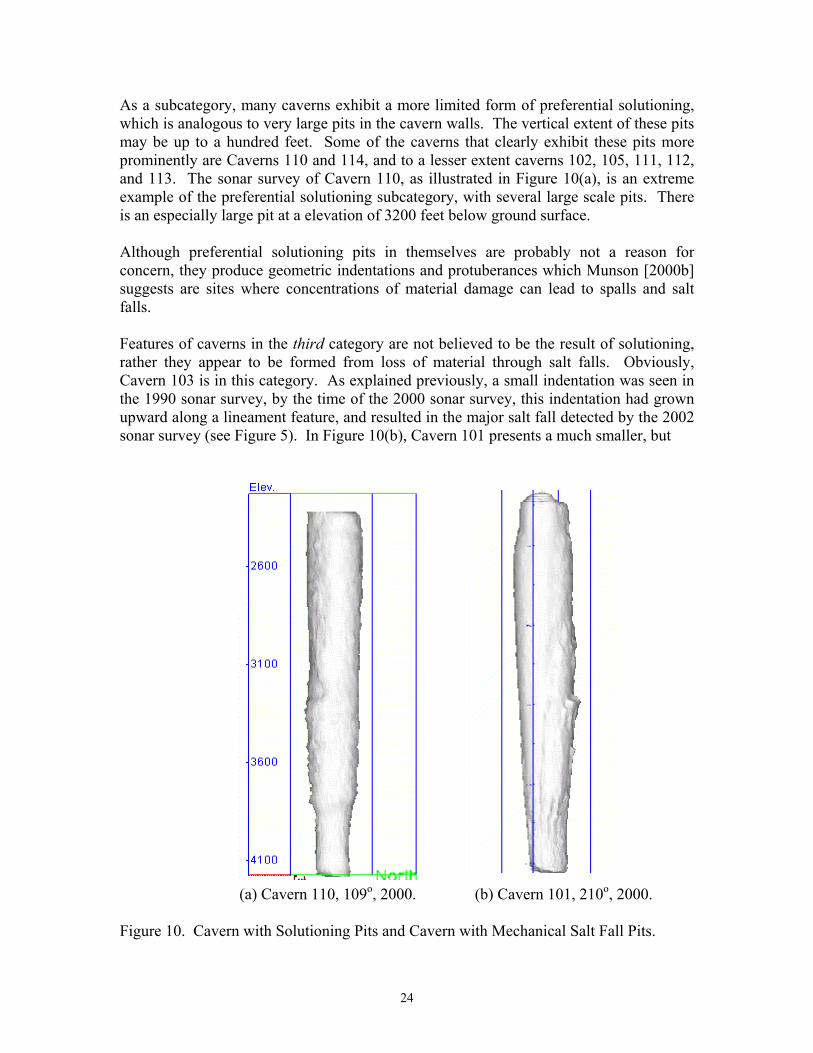
As a subcategory, many caverns exhibit a more limited form of preferential solutioning, which is analogous to very large pits in the cavern walls. The vertical extent of these pits may be up to a hundred feet. Some of the caverns that clearly exhibit these pits more prominently are Caverns 110 and 114, and to a lesser extent caverns 102, 105, 111, 112, and 113. The sonar survey of Cavern 110, as illustrated in Figure 10(a), is an extreme example of the preferential solutioning subcategory, with several large scale pits. There is an especially large pit at a elevation of 3200 feet below ground surface. Although preferential solutioning pits in themselves are probably not a reason for concern, they produce geometric indentations and protuberances which Munson [2000b] suggests are sites where concentrations of material damage can lead to spalls and salt falls. Features of caverns in the third category are not believed to be the result of solutioning, rather they appear to be formed from loss of material through salt falls. Obviously, Cavern 103 is in this category. As explained previously, a small indentation was seen in the 1990 sonar survey, by the time of the 2000 sonar survey, this indentation had grown upward along a lineament feature, and resulted in the major salt fall detected by the 2002 sonar survey (see Figure 5). In Figure 10(b), Cavern 101 presents a much smaller, but
(a) Cavern 110, 109o, 2000. (b) Cavern 101, 210o, 2000. Figure 10. Cavern with Solutioning Pits and Cavern with Mechanical Salt Fall Pits.

25
perhaps more characteristic feature at an elevation of about 3200 feet below ground surface. Here the edges of the indentation appear sharp such as a material fracture would produce, rather than rounded edges typical of preferential solutioning. Features in this category are always of concern. In summarizing the results of the analysis of the sonar surveys taken over time at Big Hill, perhaps one of the first observations that must be emphasized is how the modern three-dimensional graphic package shows the remarkable resolution in the survey data. This is true of the old, as well as the new, survey data. Such clear presentations have not been previously available. Furthermore, in general, because of the resolution of the graphical presentation of the sonar surveys, it is possible to distinguish three categories of cavern features. (1) First, extensive lineaments that are nearly vertical which must reflect slight preferential solutioning giving manifestations of the extruded layers and interbeds of the “mother” salt formation into the dome. The vertical extent of these lineaments may be up to a thousand feet and sometimes even more. Traces of the intersection of these layers with the cavern wall may appear curved, or scale shaped, if the cavern is tapered or the bed is tilted from vertical. The width of the region of preferential solutioning can vary from a few feet to a hundred feet. In themselves, lineaments should not present a structural problem, however, when combined with other features, as with Cavern 103, they produce a situation of concern. (2) Marked preferential solutioning has two subcategories: generalized and localized solutioning. Generalized preferential solutioning can lead to pronounced “wings” or lobes extending away from the main cavern body, an extreme case of which is Cavern 108. Less extreme cases can appear as an elliptical cavern cross-section or cross-sections with differing diameters. The directional trend of these solutioning features appear to involve several caverns, perhaps indicating that the salt dome itself has some major internal structure with a directional tend. The sump areas of a few caverns developed small areas of preferential solutioning in the sump development stage during construction. Except for the logical operational concerns for uncontrolled preferential cavern growth during drawdowns and structural integrity of recumbent edges, generalized preferential solutioning does not appear to present a stability problem. Localized preferential solutioning produces marked large scale pits in the cavern walls, with features of several tens of feet, or larger. A few caverns exhibit a number of these pits. Pits, in themselves, do not appear to represent a problem, however, the protuberances can produce stress conditions conducive to the formation of material damage and spalling. (3) The third category represent cavern wall indentations from spalls or salt falls. Caverns 103 and 101 of Big Hill have shown irregular indentations that have resulted from salt falls. As in Cavern 103, these indentations can grow through additional failures and can be considered a significant problem. It now seems that the recent event in Cavern 104 has produced indentations characteristic of a salt fall. Using the three-dimensional images to calculate the difference in the integrated volumes of both the area of the cavern suspected of the salt fall and the rise in

26
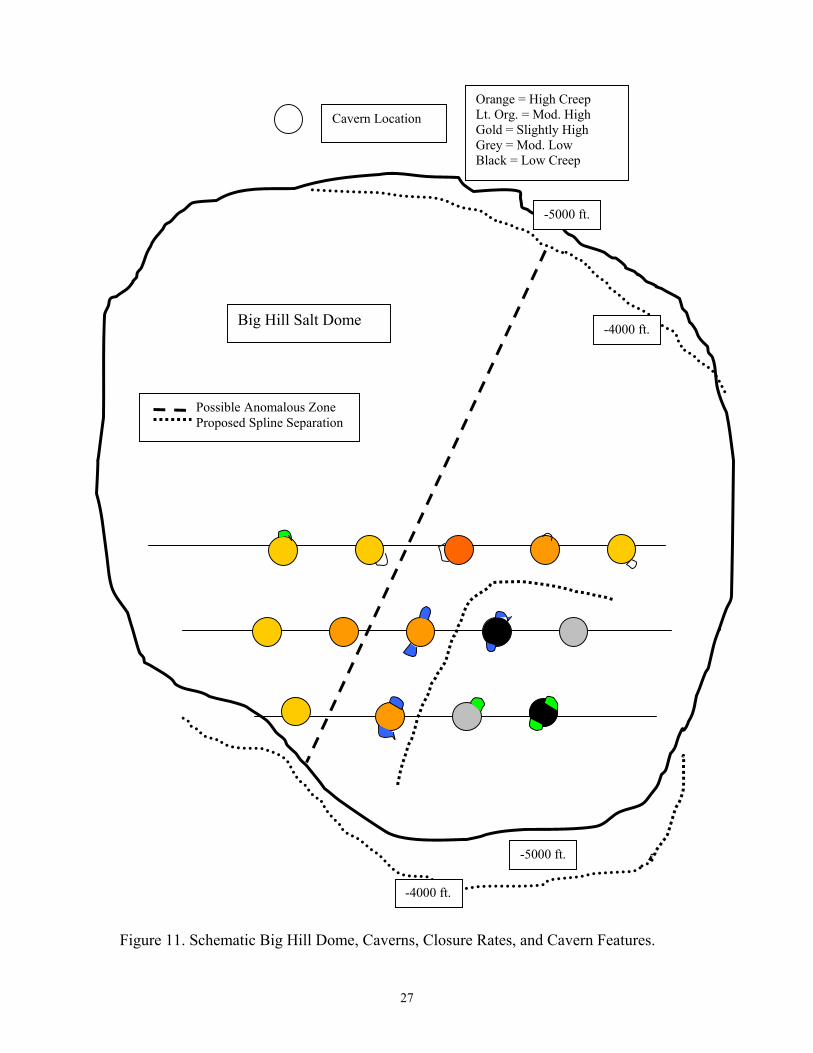
the cavern bottom elevation [Rautman, 2002c]. These volumes, although subject to large uncertainties, are in surprising agreement. Figure 11 attempts to show, in a crude sense, a composite of some of these features found in the individual caverns. The figure is a schematic plat of the Big Hill salt dome with the caverns of the SPR sketched in roughly, as shown. Details of principal preferential solutioning and of the salt fall regions are also crudely sketched onto the plat, but not to scale. Blue represents general preferential solutioning, green represents preferential solutioning of cavern “feet,” while white represents areas of salt fall. The straight anomalous zone line proposed by Magorian and Neal [1988] and, based on the conjecture that the overhang is evidence of a spline, the curved spline separation line are both also plotted. Of particular interest is the directional trend of the solutioning features with the proposed separation line. Caverns to the north and west of this line do not display the trend. However, at this time there is no theoretical interpretation of the trends relevant to the figure. 4.2 Correlation of Relative Creep Closures and Material Properties As a part of the investigation of the Cavern 103 event, the relative cavern creep closure rates of SPR caverns in the Big Hill facility were examined. This investigation made use of the earlier work of Ehgartner [1997]. In this work the effective cavern volume creep closure rates were determined from the pressure build-up histories of the caverns. While this analysis does not yield material creep rates directly, the method does give a very sensitive determination of the apparent creep rate of the salt surrounding a cavern. While the salt creep rates are relatively quite small, there is never the less a significant variation among caverns in a given salt dome facility and between caverns of different salt dome facilities. Big Hill caverns exhibit some of the largest volume creep closure rates within the SPR, between 0.075 and 0.19 %/year. These are comparable to the rates observed in the West Hackberry caverns of between 0.10 and 0.22 %/year, and four of the Bryan Mound caverns at between 0.1 and 0.15 %/year. The remainder of the Bryan Mound caverns and the Bayou Choctaw cavern exhibit volume creep closure rates of less than 0.05 %/year. Our main interest is in the closure rates of the Big Hill caverns. Here the range in creep rates is from 0.075 to 0.19 %/year, with an average of 0.13 %/year. When these caverns are positioned on the plat of the Big Hill salt dome, and broken into relative creep closure rates, the relationships are as in Figure 11, which as previously noted is a schematic representation of the Big Hill dome and SPR caverns. An anomalous zone as proposed by Magorian and Neal [1988] is shown progressing across the dome in a southwestern-northeastern line, and passes between Cavern 103 and Cavern 104. The anomalous zone placement is based in part on the faulting in the cap rock, and was considered as potentially an anomalous zone between two salt splines. However, based on the arguments associated with the overhang, there has been proposed a different arrangement of the splines. Interestingly, those caverns with the lowest closure rates are all grouped together in the south-southeastern portion of the dome. The caverns with the higher
27
Figure 11. Schematic Big Hill Dome, Caverns, Closure Rates, and Cavern Features.
101 102 103 104 105
110 109 108 107 106
114 113 112 111
Orange = High Creep Lt. Org. = Mod. High Gold = Slightly High Grey = Mod. Low Black = Low Creep
Cavern Location
Big Hill Salt Dome
Possible Anomalous Zone Proposed Spline Separation
-5000 ft.
-5000 ft.
-4000 ft.
-4000 ft.

28
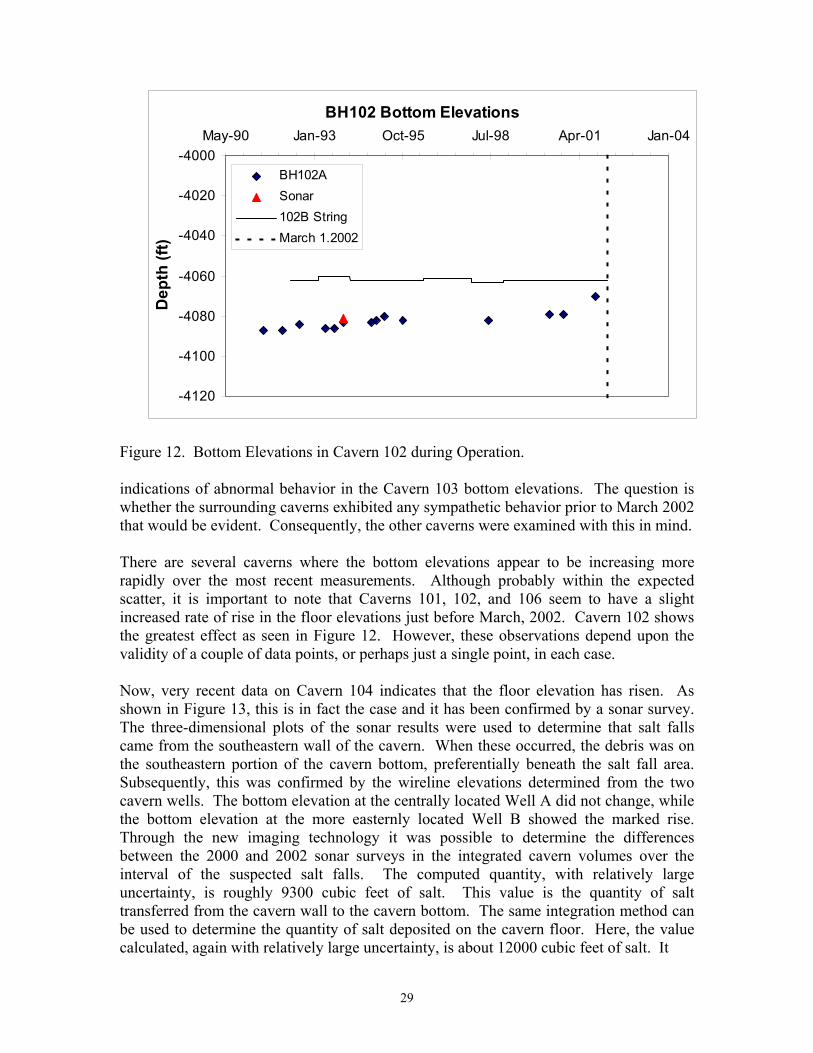
creep closure rates form a crescent around the caverns with the lower rates. Thus, a possible boundary between the high creep rate caverns and the low creep rate caverns is also shown as a crescent line. The cavern with the highest closure rate, Cavern 103, is juxtaposed directly to the cavern with the lowest closure rate, Cavern 107. The possibility of a similar boundary delineating salts masses with different creep characteristics and cavern creep closure rates was also proposed by Munson [1999] for the Bryan Mound dome. Prior to the salt fall in Cavern 103, only one event of casing damage, possibly the result of a salt fall, was reported [Munson, et al., 1998]. This was in 1990 in Cavern 114 at the completion of construction. In fact, the history of Big Hill caverns is one which indicates the caverns are structurally stable, or at least structurally stable for some very extended period of time. Unfortunately, while the possibility of different splines in the Big Hill salt dome is interesting, it cannot be related to the potential for fracture. So at this time, the fact that Cavern 103 produced a massive salt fall, has the highest creep rate of Big Hill caverns, and appears to be at the boundary of two splines, does not clarify the issue of the cause of the salt fall. Moreover, it is not possible at this time to use the creep properties of the salt around a given cavern to suggest that it will be susceptible to salt falls. 4.3 Evaluation of Floor Elevation Data for Big Hill Caverns As previously noted, there are considerable data available on measurements of the bottom elevations of the caverns. This is the result of the periodic wireline interface surveys and sonar surveys performed in the caverns. When the survey probe touches the cavern bottom, an elevation reading is taken. Such surveys were taken throughout the phases of construction and operation of the Big Hill caverns. To some extent, it should be possible from these records to determine if there were abnormal rates of rise in the floor elevations, primarily as an indication of salt fall activity and cavern instability. Typically, the bottom elevation initially rises quickly during construction because of the deposition of insolubles released by the solutioning process, but then decreases as the sump area increases. At the completion of construction, the bottom elevation becomes essentially stable, in some cases rising very slightly with time because of the steady sloughing of the cavern walls or accumulation of salt fall material. However, if the amount of salt fall material begins to increase, either gradually or abruptly, the effect would be observed in an abnormal rise of the cavern bottom elevation. Bottom elevations of all of the Big Hill SPR caverns have been analyzed using graphs similar to the one for Cavern 103, shown in Figure 3. While most of these showed what is considered a normal response, a few indicated recent changes. As is reasonably clear, the salt fall event in Cavern 103 produced a distinct effect on the bottom elevation, illustrating the accumulation of the salt fall material in the bottom of the cavern. This event was relatively sudden, occurring sometime between the apparently normal measurement in July 26, 2001 and the measurement of March 7, 2002. There are no prior
29
Figure 12. Bottom Elevations in Cavern 102 during Operation. indications of abnormal behavior in the Cavern 103 bottom elevations. The question is whether the surrounding caverns exhibited any sympathetic behavior prior to March 2002 that would be evident. Consequently, the other caverns were examined with this in mind. There are several caverns where the bottom elevations appear to be increasing more rapidly over the most recent measurements. Although probably within the expected scatter, it is important to note that Caverns 101, 102, and 106 seem to have a slight increased rate of rise in the floor elevations just before March, 2002. Cavern 102 shows the greatest effect as seen in Figure 12. However, these observations depend upon the validity of a couple of data points, or perhaps just a single point, in each case. Now, very recent data on Cavern 104 indicates that the floor elevation has risen. As shown in Figure 13, this is in fact the case and it has been confirmed by a sonar survey. The three-dimensional plots of the sonar results were used to determine that salt falls came from the southeastern wall of the cavern. When these occurred, the debris was on the southeastern portion of the cavern bottom, preferentially beneath the salt fall area. Subsequently, this was confirmed by the wireline elevations determined from the two cavern wells. The bottom elevation at the centrally located Well A did not change, while the bottom elevation at the more easternly located Well B showed the marked rise. Through the new imaging technology it was possible to determine the differences between the 2000 and 2002 sonar surveys in the integrated cavern volumes over the interval of the suspected salt falls. The computed quantity, with relatively large uncertainty, is roughly 9300 cubic feet of salt. This value is the quantity of salt transferred from the cavern wall to the cavern bottom. The same integration method can be used to determine the quantity of salt deposited on the cavern floor. Here, the value calculated, again with relatively large uncertainty, is about 12000 cubic feet of salt. It
BH102 Bottom Elevations
-4120
-4100
-4080
-4060
-4040
-4020
-4000May-90 Jan-93 Oct-95 Jul-98 Apr-01 Jan-04
Dep
th (f
t)BH102ASonar102B StringMarch 1.2002

30
Figure 13. Bottom Elevations in Cavern 104 during Operation, with Recent Increase. appears that the quantity of material lost from the cavern walls is in reasonable agreement with the quantity that accumulated on the cavern bottom. In general, the remaining Big Hill caverns show the expected, or typical, behavior during construction and operation. Clearly, a marked rise in cavern bottom elevation does indicate the occurrence of a salt fall, as one would expect. However, monitoring of the cavern bottom elevations cannot give early indications of the possibility or size of a salt fall occurrence. The bottom elevation merely records the event. Perhaps it is coincidental, but Caverns 101 and 102, together with Cavern 103, are along the arc proposed for the separation of the two material splines in the Big Hill dome, as shown in Figure 11. In addition, according to the sonar survey categories, Cavern 102 may have the potential for salt falls. Again, however, there is too little evidence to correlate this with a cause for salt falls in the Big Hill caverns.
BH104 Bottom Elevations
-4260
-4250
-4240
-4230
-4220
-4210
-4200May-90 Jan-93 Oct-95 Jul-98 Apr-01 Jan-04
Dep
th (f
t)
BH104ABH104B104B StringLeast Squares Fit

31
5.0 SUMMARY AND CONCLUSIONS The salt fall in Cavern 103 was the result of one or more mechanical instabilities. In fact the cavern wall began to develop the potential for instability with the inhomogeneous salt dissolution during initial leaching of the cavern which resulted in a vertical lineament and a small pit from fallen material. This initial situation is evidenced in the sonar images (Figure 5a). Localized dissolution continued after the first sonar, along planar elements in the salt mass (which are near vertical), coupled with salt spall from the cavern walls. While the cause of localized, focused dissolution is presently undetermined, its occurrence is clearly demonstrated in the 2000 sonar data of Cavern 103 (after viewing the same cavern in 1990). It has been speculated that the dissolution possibly occurred because of differences in materials (the presence of more soluble mineral species or one that remains unsaturated in the brine). As this dissolution occurred, localized damage probably also developed due to stress redistribution and deformation damage, further contributing to mechanical instability. The fact that the linear and planar dissolution features are near vertical is consistent with the alignment of the salt mass fabric elements (mineral segregation, relic bedding, grain boundaries, grain size distributions, etc.) sub parallel to the flow direction of the rock salt mass. The possible contribution of these fabric elements were not considered in the leaching analyses performed to develop the caverns. In some of the caverns discussed above, ignoring this shortcoming undoubtedly had minimal effect and the caverns are nearly perfect cylinders. It has been shown that in some caverns besides Cavern 103, this localized dissolution phenomenon can have a marked effect on cavern geometry (for example Cavern 108), as evidenced by the formation of wings. Exactly how the features observed in the caverns act or interact to is still unknown. However, it is clear changes in these features progressive over time and may be an indication of the stability of a cavern. The progression over time could be either one which leads to a more stable configuration, or to a less stable configuration. In either situation, the knowledge would be invaluable to the cavern engineer. Also, the understanding of the progression of a feature over time may eventually show that there is some systematic characteristic feature of the caverns that will lead to continued salt falls, or that the fall is the result of a unique and unlikely feature in the cavern. Moreover, the distribution of these features throughout the cavern field may be the key to understanding the complex behavior of the dome. While these issues may not, today, have a satisfactory understanding, assessments such as the analysis of Big Hill, and especially Cavern 103 have markedly increased our understanding of storage caverns in salt domes. For example, one can begin to identify areas of unsupported salt in some of the cavern walls. There is a possibility that some portions of this salt could fall. If, as was the case in Cavern 103, the cavern operation was basically unaffected and the hanging string was not detrimentally damaged, then there is no consequence. However, not all instability situations would lead to this outcome. A more reasonable proactive solution would suggest development of a geomechanical and fluid dynamics analysis programs, based on the types of analyses reported here, to systematically investigate and evaluate potential instabilities.

32
The success of the foregoing analysis is, in major part, the revelation of two substantive analysis tools: sonar imaging graphics and three-dimensional solutioning methods. It is essential to recognize the incredible value of three-dimensional imaging of caverns used in this study, revealing previously unseen features. Categorization of these features according to origin is the initial step in the identification of potential precursors to unstable conditions. The resolution contained in sonar surveys represents evidence of graphics-dependent improvements in our technology. Certainly, the full benefits of such graphics tools has yet to be realized, and clearly warrants continued development. Clearly, the analyses of the SPR Big Hill cavern field illustrates the need to address three-dimensional solutioning methods. The solutioning irregularities identified in the caverns of Big Hill can only be resolved through incorporation of dome stratigraphy, material dependent solutioning coefficients, and the appropriate fluid dynamics. These new tools, coupled with current geomechanical analysis methods which address deformation of a salt rock mass that contains potential inhomogeneities will provide the basis for resolving and forecasting geomechanics and solutioning analysis uncertainties. Such forecasts or predictions are essential for expansion and operation of existing and new underground storage facilities.

33
REFERENCES 2002. Myers, R.E. Private Communication, Department of Energy, Strategic
Petroleum Reserve, New Orleans, LA. 2001. Ehgartner, B.L. Ullage Study 2000, Memo to R.E. Myers, SPR/DOE, January
18, 2001, Sandia National Laboratories, Albuquerque, NM. 2000a. Munson, D.E. Relative Evaluation of the Independent Volume Measurements of
Caverns, SAND2000-2041, Sandia National Laboratories, Albuquerque, NM. 2000b. Munson, D.E. Spall Formation in Solution Mined Storage Caverns Based on
Creep and Fracture Analysis, Proc. 4th N. Am. Rock Mech. Symp., A.A. Balkema, Rotterdam, Netherlands. pp. 901-908.
1999. Munson, D. E. Multimechanism-Deformation Parameters of Domal Salts using
Transient Creep Analysis, SAND99-2104, Sandia National Laboratories, Albuquerque, NM.
1998. Munson, D.E., M.A. Molecke, J.T. Neal, A.R. Sattler, and R.E. Myers. Strategic
Petroleum Reserve Caverns Casing Damage Update 1997, SAND98-0090, Sandia National Laboratories, Albuquerque, NM.
1997. Ehgartner, B.L. SPR Ullage Study, in Memo J.K. Linn to R.E. Myers,
SPR/DOE, November, 25, 1997, Sandia National Laboratories, Albuquerque, NM.
1991. DOE. DOE SPR Constructed Cavern History, D506-01644-09 (Rev.2), Depart-
ment of Energy, Strategic Petroleum Reserve, New Orleans, LA. 1988. Magorian, T.R, and J.T. Neal. Strategic Petroleum Reserve (SPR) Additional
Geological Site Characterization Studies Big Hill Salt Dome, Texas, SAND88-2267, Sandia National Laboratories, Albuquerque, NM.
1979. Halbouty, M.T. Salt Domes, Gulf Region, United States and Mexico, 2nd Edition,
Gulf Publishing Co., Houston, TX.

34
DISTRIBUTION: U.S. DOE SPR PMO (12) 900 Commerce Road East New Orleans, LA 70123 Attn: W. C. Gibson, FE-44 J. C. Kilroy, FE-442 J. Culbert, FE-443 W. Poarch, FE-4442 G. B. Berndsen, FE-443.1 R. E. Myers, FE-4422 (5) TDCS (2) U.S DOE SPR PMO (4) 900 Commerce Road East New Orleans, LA 70123 Attn: J. Aguinaga, FE-4421.1, SPR BM A. Fruge, FE-4421.2, SPR BH R. Francoeur, FE-4421.3, SPR WH S. Sevak, FE 4421.5, SPR BC U.S. Department of Energy (2) Strategic Petroleum Reserve 1000 Independence Avenue SW Washington, D. C. 20585 (2) Attn: D. Johnson, FE-421 D. Buck, FE-421 DynMcDermott (9) 850 South Clearview Parkway New Orleans, LA 7023 Attn: L.L. Eldredge, DM-30 J. A. Farquhar, DM-21 K. D. Wynn, DM-21 A. E. Piechocki, DM-21 J. M. McHenry, DM-21 H. Bakhtiari, DM-BM J. Perry, DM-BH J. Sanner, BM-WH F. Tablada, BM-BC
Sandia National Laboratories MS 0701 P. J. Davies, 6100 MS 0341 S. G. Varnado, 6200 MS 0706 R. E. Finley, 6113 MS 0706 S. J. Bauer, 6113 MS 0706 B. L. Ehgartner, 6113 MS 0706 T. E. Hinkebein, 6113 MS 0706 B. L. Levin, 6113 MS 0706 M. A. Molecke, 6113 MS 0706 D. E. Munson, 6113 (10) MS 0706 C. A. Rautman, 6113 MS 0706 A. R. Sattler, 6113 MS 9018 Central Tech. Files, 8945-1 MS 0899 Technical Library, 9616 (2) MS 0612 Review and Approval Desk,
9612, for DOE/OSTI

35


