at SciVerse ScienceDirect
Radiation Measurements 49 (2013) 95e102
Contents lists available
Radiation Measurements
journal homepage: www.elsevier .com/locate/radmeas
Analysis of radiation dose variations measured by passive dosimeters onboard theInternational Space Station during the solar quiet period (2007e2008)
Satoshi Kodaira a,*, Hajime Kawashima a, Hisashi Kitamura a, Mieko Kurano a, Yukio Uchihori a,Nakahiro Yasuda a, Koichi Ogura b, Ikuo Kobayashi c, Akifumi Suzuki c, Yasuhiro Koguchi d, Yury A. Akatov e,Vyacheslav A. Shurshakov e, Raisa V. Tolochek e, Tatiana K. Krasheninnikova f, Anatoliy D. Ukraintsev f,Elena A. Gureeva g, Vladimir N. Kuznetsov g, Eric R. Benton h
aNational Institute of Radiological Sciences, Chiba, JapanbNihon University, Chiba, JapancNagase Landauer Ltd., Ibaraki, JapandChiyoda Technol Corporation, Ibaraki, Japane Institute of Biomedical Problems at Russian Academy of Sciences, Moscow, RussiafOAO Biochimmash, Moscow, Russiag Space Rocket Corporation Energia, Moscow Region, RussiahOklahoma State University, Stillwater, United States
h i g h l i g h t s
< We demonstrate the long-term dose variation by using passive detectors.< Observed dose increase was due to the incremental increase in the altitude of the ISS.< Trapped proton flux increase by the encounter during passage of the ISS through the SAA.< Dose equivalent was increased due to the contribution of high LET components.< A significant fraction was due to short-range recoil nuclei produced in target fragmentation reactions.
a r t i c l e i n f o
Article history:Received 14 November 2011Received in revised form17 August 2012Accepted 22 November 2012
Keywords:Space radiation dosimetryPassive detectorsPlastic nuclear track detectorThermoluminescence detectorLong-term variationSecondary particlesHigh LET particlesTarget fragments
* Corresponding author. Radiation MeasurementInstitute of Radiological Sciences, 4-9-1 Anagawa, InTel.: þ81 43 206 3479; fax: þ81 43 206 3514.
E-mail address: [email protected] (S. Kodaira).
1350-4487/$ e see front matter � 2012 Elsevier Ltd.http://dx.doi.org/10.1016/j.radmeas.2012.11.020
a b s t r a c t
The average absorbed dose and dose equivalent rates from space radiation were observed using passivedosimeters with same material and configuration at the same location onboard the International SpaceStation (ISS) over four different occasions (IeIV) between 2007 and 2008. The passive dosimeters con-sisted of a combination of thermoluminescent detectors (TLDs) and plastic nuclear track detectors(PNTDs). Total average absorbed dose rate increased by 68 � 9% over two years. The observed increasewas due to the incremental increase in the altitude of the ISS over the course of the experiment and thecorresponding increase in trapped proton flux encountered during passage of the ISS through the SAA(South Atlantic Anomaly), which was confirmed with the results monitored by DB-8 active dosimeter onthe ISS. The PNTD data showed that the average absorbed dose and dose equivalent rates from particlesof LETNH2O � 100 keV/mmwere 28 � 2% and 51 � 3% of �10 keV/mm during Periods IeIII, while the dosecontributions of particles �100 keV/mm during Period IV were 36 � 5% and 59 � 10%, respectively. Theintegral dose equivalent distribution during Period IV shows significant enhancement from particles�100 keV/mm. These facts suggest that a significant fraction of the high LET component is due to short-range recoil nuclei produced in target fragmentation reactions between primary protons and the nucleiof the passive dosimeters and surrounding materials.
� 2012 Elsevier Ltd. All rights reserved.
Research Section, Nationalage, Chiba 263-8555, Japan.
All rights reserved.
1. Introduction
The measurement of absorbed dose and dose equivalent duringmanned space missions on the International Space Station (ISS) inlow earth orbit (LEO) are important for evaluating the risk to
Table 1Exposure durations of the four sessions (#1�#4).
Duration Exposure days
Session #1 January 19, 2007eApril 21, 2007 92Session #2 January 19, 2007eOctober 22, 2007 276Session #3 October 10, 2007eApril 19, 2008 191Session #4 October 10, 2007eOctober 24, 2008 380
S. Kodaira et al. / Radiation Measurements 49 (2013) 95e10296
astronaut health and safety. The radiation environment encoun-tered during spaceflight is composed of a variety of differentparticles covering a wide range of energies. The principal contri-butions to radiation dose come from galactic cosmic rays (GCR)consisting mainly of protons and heavy ions up to iron with a peakenergy of around 1 GeV/n, as well as lower energy protons andelectrons in the Earth’s radiation belts, and solar energetic particles(SEP) with energies up to several hundred MeV associated withcoronal mass ejections (CME). The linear energy transfer, LETNH2O,of such particles ranges from w0.1 to w1000 keV/mm. The doserates are constantly changing and depend mainly on the level ofsolar activity and on various spacecraft- and orbit-dependentparameters as the shielding distribution surrounding the detec-tors, location of the spacecraft within its orbit relative to the Earth,the attitude (orientation) and altitude changes. Consequently,continuous monitoring of dose rates is required to record andevaluate the personal radiation dose for crew members duringspaceflight (Benton and Benton, 2001).
The radiation dose inside the ISS is continuously monitoredusing active detectors such as the NASA Johnson Space Center’sTissue Equivalent Proportional Counter (JSC-TEPC) (Badhwaret al., 1994) and the DB-8 dosimeters of the Russian Institutefor Biomedical Problems (IBMP) (Markov et al., 2001). The DB-8dosimeters are silicon detectors that operate independently atfour locations within the ISS Russian Service Module. In additionto these active monitors, passive dosimeters consisting of ther-moluminescent detectors (TLDs) and plastic nuclear track detec-tors (PNTDs) are used to measure integral absorbed dose anddose equivalent over periods on the order of 3e6 months andtheir results are combined to provide the primary dose of recordfor each ISS crew member (Nagamatsu et al., 2006; Zhou et al.,2007).
The combination method of radiation dose data measured byboth TLD and PNTD permits easy and precisemeasurement of spaceradiation exposure aboard spacecraft (Doke et al., 1995). Thepassive dosimeters have the advantage of being small, lightweight,low cost and require no electric power, but are incapable of beingread out in real time and provide no information on time variationsin dose and dose equivalent rates in the dynamically changingspace radiation environment. Analysis of several data sets obtainedby passive dosimeters exposed for different durations makes itpossible to estimate long-term variations of dosimetric quantitiesas a function of time. The analysis for obtaining time variations wascarried out by means of the different types of passive detector atdifferent locations inside ISS for over-lapping or discontinuousperiods of time (Benton et al., 2002a; Ambrozova et al., 2011). Thedata set obtained by the same detector configuration at the samelocation over the long-term period allow us to observe the spaceradiation variation without any change in systematic parameterssuch as differences in detector type, location and orientation insidethe spacecraft.
In this paper, we present variations in space radiation absorbeddose and dose equivalent rates measured by using passive dosim-eters of the same type and configuration and at the same locationover a two year period from 2007 to 2008.
2. Passive dosimeters
A combination of TLD-100 thermoluminescence detector (TLD)and HARZLAS TD-1 plastic nuclear track detector (PNTD) providesabsorbed dose and dose equivalent measurements from allimportant space radiation sources and covers the whole energyrange relevant to radiation protection in spaceflight. TLDs measureabsorbed dose from energetic photons and charged particles overthe whole LET spectrum, but register the dose from charged
particles of LETNH2O � 10 keV/mm with less than 100% efficiency.PNTDs provide measurement of the LET spectrum, absorbed dose,and dose equivalent from charged particles of LETNH2O � 10 keV/mm. The data from the two types of detector were combined to yieldvalues of total absorbed dose and total dose equivalent accumu-lated over the duration of the exposure (Benton et al., 2002a; Hajeket al., 2008; Tawara et al., 2011).
The TLD-100 (LiF:Mg,Ti), provided by Nagase Landauer Inc.,Japan, was employed and analyzed by the standard processingprotocol including annealing, read-out luminescence and qualitycontrol established by Nagase Landauer Inc. for personal dosimetry(NIRS report, 2009). The TLD-100 was calibrated by means ofa standard 137Cs g-ray source and heavy ion beams from HIMAC(Heavy IonMedical Accelerator in Chiba) at NIRS (National Instituteof Radiological Sciences).
The PADC (poly allyl diglycol carbonate), so-called CR-39, HAR-ZLAS TD-1, manufactured by Fukuvi Chemical Industry, Japan, wasemployed as the PNTD and was analyzed using a high speedimaging microscope (HSP-100) and nuclear track analysis software(PitFit) (Yasuda et al., 2005) after chemical etching for 8 h in 7 NNaOH solution at 70 �C. The amount of bulk etch was 13e15 mm.The area analyzed on each layer was 4e27 mm2. The HARZLASTD-1 detector can register nuclear tracks of charged particles withLETNH2O� 5 keV/mm (Ogura et al., 2001). HARZLAS TD-1 PNTDwascalibrated by means of heavy ion beams of known LET obtained atthe NIRS HIMAC. LET spectra, dose, and dose equivalent �10 keV/mm were obtained from the HARZLAS TD-1 PNTDs (NIRS report,2009).
3. Experiment
3.1. Passive dosimeters onboard ISS
The multiple sets of TLD and PNTD were exposed in foursessions of varying duration between January 19, 2007 and October24, 2008 in the Pirs-1 module attached to the Russian ServiceModule of the ISS. The details of the four exposure sessions(#1�#4) are summarized in Table 1. The same configuration ofpassive dosimeters was carried out in each session. Each detectorset was installed at the same location in the Pirs-1module such thatthe shielding distribution surrounding the detector sets was fairlyconstant over the duration of the experiment. The analysis of thefour detector sets permitted us to determine the variation inabsorbed dose and dose equivalent rates as a function of time. Theupper panel in Fig. 1 shows the four sessions throughout the twoyear period. By subtracting the overlapping periods during the foursessions, the exposure durations were divided into four periods(I�IV) as shown in the lower panel of Fig. 1. Details of the divisionfrom four sessions to four periods are summarized in Table 2. Here,DOY (day of year) means the number of days since January 1, 2007.For example, DOY ¼ 111 corresponds to April 21, 2007. There is anoverlap of about two weeks between periods II and III. However itdoes not introduce significant error in dosimetric results for thisanalysis because the ratio of overlapping period to the total periodis only about 7%.
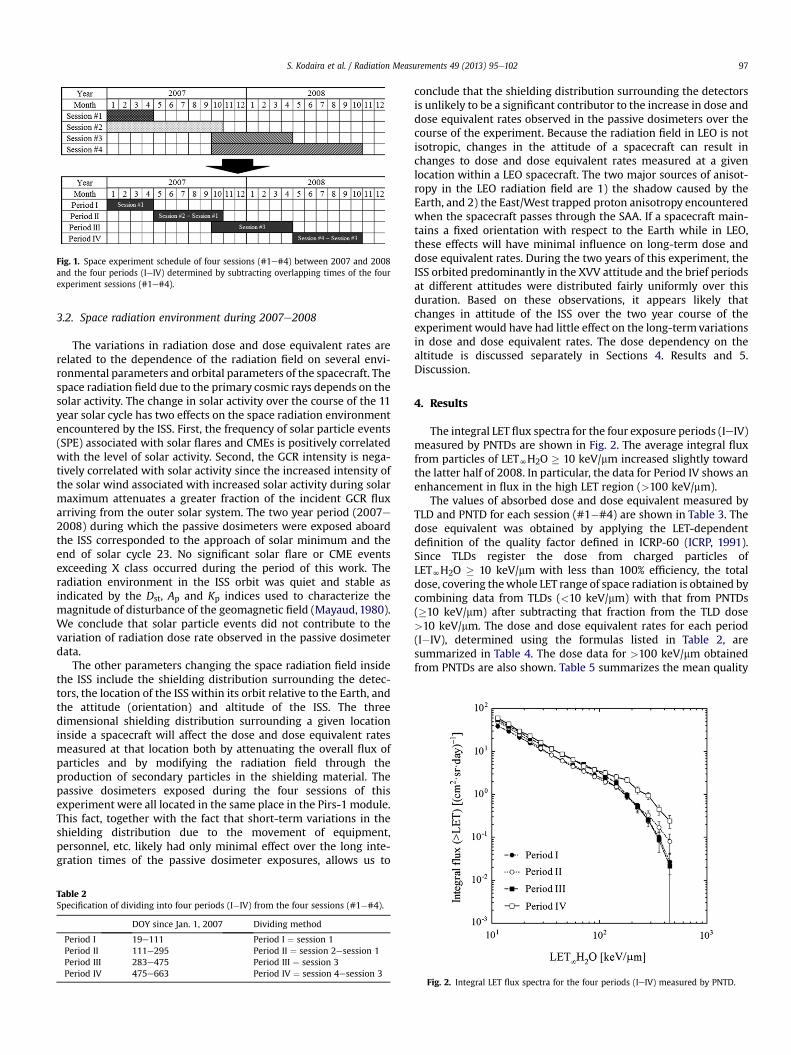
Fig. 1. Space experiment schedule of four sessions (#1e#4) between 2007 and 2008and the four periods (IeIV) determined by subtracting overlapping times of the fourexperiment sessions (#1e#4).
S. Kodaira et al. / Radiation Measurements 49 (2013) 95e102 97
3.2. Space radiation environment during 2007e2008
The variations in radiation dose and dose equivalent rates arerelated to the dependence of the radiation field on several envi-ronmental parameters and orbital parameters of the spacecraft. Thespace radiation field due to the primary cosmic rays depends on thesolar activity. The change in solar activity over the course of the 11year solar cycle has two effects on the space radiation environmentencountered by the ISS. First, the frequency of solar particle events(SPE) associated with solar flares and CMEs is positively correlatedwith the level of solar activity. Second, the GCR intensity is nega-tively correlated with solar activity since the increased intensity ofthe solar wind associated with increased solar activity during solarmaximum attenuates a greater fraction of the incident GCR fluxarriving from the outer solar system. The two year period (2007e2008) during which the passive dosimeters were exposed aboardthe ISS corresponded to the approach of solar minimum and theend of solar cycle 23. No significant solar flare or CME eventsexceeding X class occurred during the period of this work. Theradiation environment in the ISS orbit was quiet and stable asindicated by the Dst, Ap and Kp indices used to characterize themagnitude of disturbance of the geomagnetic field (Mayaud, 1980).We conclude that solar particle events did not contribute to thevariation of radiation dose rate observed in the passive dosimeterdata.
The other parameters changing the space radiation field insidethe ISS include the shielding distribution surrounding the detec-tors, the location of the ISS within its orbit relative to the Earth, andthe attitude (orientation) and altitude of the ISS. The threedimensional shielding distribution surrounding a given locationinside a spacecraft will affect the dose and dose equivalent ratesmeasured at that location both by attenuating the overall flux ofparticles and by modifying the radiation field through theproduction of secondary particles in the shielding material. Thepassive dosimeters exposed during the four sessions of thisexperiment were all located in the same place in the Pirs-1 module.This fact, together with the fact that short-term variations in theshielding distribution due to the movement of equipment,personnel, etc. likely had only minimal effect over the long inte-gration times of the passive dosimeter exposures, allows us to
Table 2Specification of dividing into four periods (I�IV) from the four sessions (#1�#4).
DOY since Jan. 1, 2007 Dividing method
Period I 19e111 Period I ¼ session 1Period II 111e295 Period II ¼ session 2esession 1Period III 283e475 Period III ¼ session 3Period IV 475e663 Period IV ¼ session 4esession 3
conclude that the shielding distribution surrounding the detectorsis unlikely to be a significant contributor to the increase in dose anddose equivalent rates observed in the passive dosimeters over thecourse of the experiment. Because the radiation field in LEO is notisotropic, changes in the attitude of a spacecraft can result inchanges to dose and dose equivalent rates measured at a givenlocation within a LEO spacecraft. The two major sources of anisot-ropy in the LEO radiation field are 1) the shadow caused by theEarth, and 2) the East/West trapped proton anisotropy encounteredwhen the spacecraft passes through the SAA. If a spacecraft main-tains a fixed orientation with respect to the Earth while in LEO,these effects will have minimal influence on long-term dose anddose equivalent rates. During the two years of this experiment, theISS orbited predominantly in the XVV attitude and the brief periodsat different attitudes were distributed fairly uniformly over thisduration. Based on these observations, it appears likely thatchanges in attitude of the ISS over the two year course of theexperiment would have had little effect on the long-termvariationsin dose and dose equivalent rates. The dose dependency on thealtitude is discussed separately in Sections 4. Results and 5.Discussion.
4. Results
The integral LET flux spectra for the four exposure periods (IeIV)measured by PNTDs are shown in Fig. 2. The average integral fluxfrom particles of LETNH2O � 10 keV/mm increased slightly towardthe latter half of 2008. In particular, the data for Period IV shows anenhancement in flux in the high LET region (>100 keV/mm).
The values of absorbed dose and dose equivalent measured byTLD and PNTD for each session (#1�#4) are shown in Table 3. Thedose equivalent was obtained by applying the LET-dependentdefinition of the quality factor defined in ICRP-60 (ICRP, 1991).Since TLDs register the dose from charged particles ofLETNH2O � 10 keV/mm with less than 100% efficiency, the totaldose, covering thewhole LET range of space radiation is obtained bycombining data from TLDs (<10 keV/mm) with that from PNTDs(�10 keV/mm) after subtracting that fraction from the TLD dose>10 keV/mm. The dose and dose equivalent rates for each period(I�IV), determined using the formulas listed in Table 2, aresummarized in Table 4. The dose data for >100 keV/mm obtainedfrom PNTDs are also shown. Table 5 summarizes the mean quality
Fig. 2. Integral LET flux spectra for the four periods (IeIV) measured by PNTD.
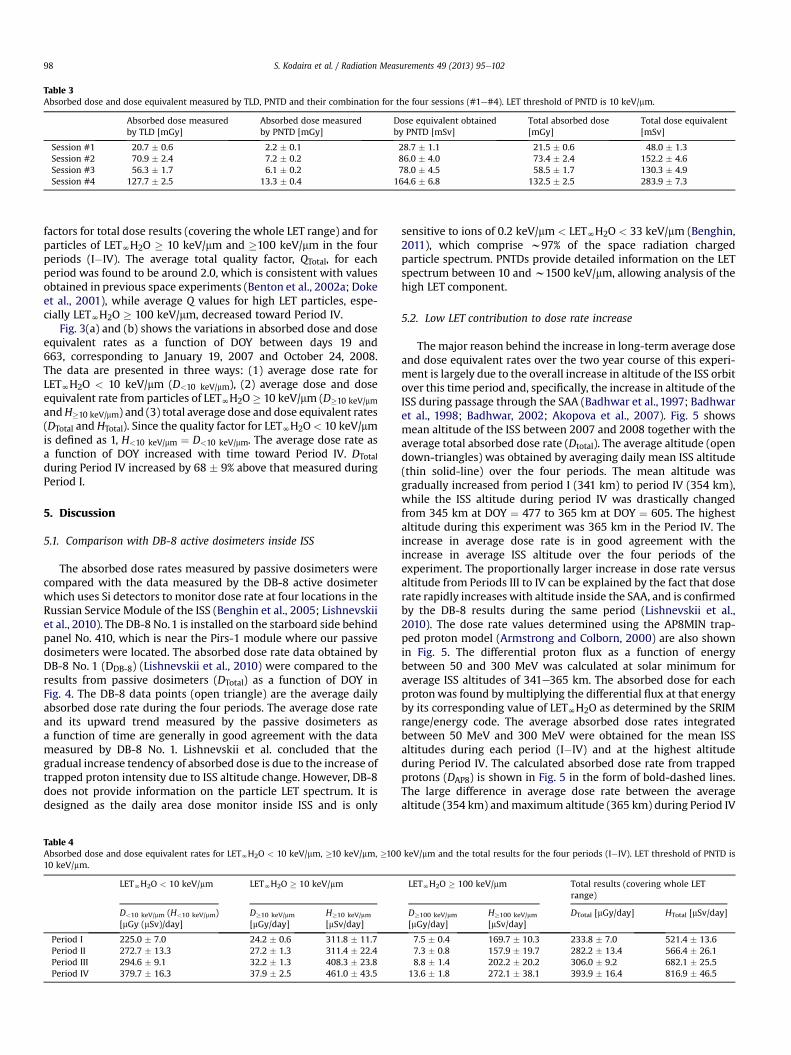
Table 3Absorbed dose and dose equivalent measured by TLD, PNTD and their combination for the four sessions (#1e#4). LET threshold of PNTD is 10 keV/mm.
Absorbed dose measuredby TLD [mGy]
Absorbed dose measuredby PNTD [mGy]
Dose equivalent obtainedby PNTD [mSv]
Total absorbed dose[mGy]
Total dose equivalent[mSv]
Session #1 20.7 � 0.6 2.2 � 0.1 28.7 � 1.1 21.5 � 0.6 48.0 � 1.3Session #2 70.9 � 2.4 7.2 � 0.2 86.0 � 4.0 73.4 � 2.4 152.2 � 4.6Session #3 56.3 � 1.7 6.1 � 0.2 78.0 � 4.5 58.5 � 1.7 130.3 � 4.9Session #4 127.7 � 2.5 13.3 � 0.4 164.6 � 6.8 132.5 � 2.5 283.9 � 7.3
S. Kodaira et al. / Radiation Measurements 49 (2013) 95e10298
factors for total dose results (covering the whole LET range) and forparticles of LETNH2O � 10 keV/mm and �100 keV/mm in the fourperiods (I�IV). The average total quality factor, QTotal, for eachperiod was found to be around 2.0, which is consistent with valuesobtained in previous space experiments (Benton et al., 2002a; Dokeet al., 2001), while average Q values for high LET particles, espe-cially LETNH2O � 100 keV/mm, decreased toward Period IV.
Fig. 3(a) and (b) shows the variations in absorbed dose and doseequivalent rates as a function of DOY between days 19 and663, corresponding to January 19, 2007 and October 24, 2008.The data are presented in three ways: (1) average dose rate forLETNH2O < 10 keV/mm (D<10 keV/mm), (2) average dose and doseequivalent rate from particles of LETNH2O� 10 keV/mm (D�10 keV/mmandH�10 keV/mm) and (3) total average dose and dose equivalent rates(DTotal and HTotal). Since the quality factor for LETNH2O< 10 keV/mmis defined as 1, H<10 keV/mm ¼ D<10 keV/mm. The average dose rate asa function of DOY increased with time toward Period IV. DTotalduring Period IV increased by 68 � 9% above that measured duringPeriod I.
5. Discussion
5.1. Comparison with DB-8 active dosimeters inside ISS
The absorbed dose rates measured by passive dosimeters werecompared with the data measured by the DB-8 active dosimeterwhich uses Si detectors to monitor dose rate at four locations in theRussian Service Module of the ISS (Benghin et al., 2005; Lishnevskiiet al., 2010). The DB-8 No.1 is installed on the starboard side behindpanel No. 410, which is near the Pirs-1 module where our passivedosimeters were located. The absorbed dose rate data obtained byDB-8 No. 1 (DDB-8) (Lishnevskii et al., 2010) were compared to theresults from passive dosimeters (DTotal) as a function of DOY inFig. 4. The DB-8 data points (open triangle) are the average dailyabsorbed dose rate during the four periods. The average dose rateand its upward trend measured by the passive dosimeters asa function of time are generally in good agreement with the datameasured by DB-8 No. 1. Lishnevskii et al. concluded that thegradual increase tendency of absorbed dose is due to the increase oftrapped proton intensity due to ISS altitude change. However, DB-8does not provide information on the particle LET spectrum. It isdesigned as the daily area dose monitor inside ISS and is only
Table 4Absorbed dose and dose equivalent rates for LETNH2O < 10 keV/mm, �10 keV/mm, �10010 keV/mm.
LETNH2O < 10 keV/mm LETNH2O � 10 keV/mm
D<10 keV/mm (H<10 keV/mm)[mGy (mSv)/day]
D�10 keV/mm
[mGy/day]H�10 keV/mm
[mSv/day]
Period I 225.0 � 7.0 24.2 � 0.6 311.8 � 11.7Period II 272.7 � 13.3 27.2 � 1.3 311.4 � 22.4Period III 294.6 � 9.1 32.2 � 1.3 408.3 � 23.8Period IV 379.7 � 16.3 37.9 � 2.5 461.0 � 43.5
sensitive to ions of 0.2 keV/mm < LETNH2O < 33 keV/mm (Benghin,2011), which comprise w97% of the space radiation chargedparticle spectrum. PNTDs provide detailed information on the LETspectrum between 10 and w1500 keV/mm, allowing analysis of thehigh LET component.
5.2. Low LET contribution to dose rate increase
Themajor reason behind the increase in long-term average doseand dose equivalent rates over the two year course of this experi-ment is largely due to the overall increase in altitude of the ISS orbitover this time period and, specifically, the increase in altitude of theISS during passage through the SAA (Badhwar et al., 1997; Badhwaret al., 1998; Badhwar, 2002; Akopova et al., 2007). Fig. 5 showsmean altitude of the ISS between 2007 and 2008 together with theaverage total absorbed dose rate (Dtotal). The average altitude (opendown-triangles) was obtained by averaging daily mean ISS altitude(thin solid-line) over the four periods. The mean altitude wasgradually increased from period I (341 km) to period IV (354 km),while the ISS altitude during period IV was drastically changedfrom 345 km at DOY ¼ 477 to 365 km at DOY ¼ 605. The highestaltitude during this experiment was 365 km in the Period IV. Theincrease in average dose rate is in good agreement with theincrease in average ISS altitude over the four periods of theexperiment. The proportionally larger increase in dose rate versusaltitude from Periods III to IV can be explained by the fact that doserate rapidly increases with altitude inside the SAA, and is confirmedby the DB-8 results during the same period (Lishnevskii et al.,2010). The dose rate values determined using the AP8MIN trap-ped proton model (Armstrong and Colborn, 2000) are also shownin Fig. 5. The differential proton flux as a function of energybetween 50 and 300 MeV was calculated at solar minimum foraverage ISS altitudes of 341e365 km. The absorbed dose for eachprotonwas found bymultiplying the differential flux at that energyby its corresponding value of LETNH2O as determined by the SRIMrange/energy code. The average absorbed dose rates integratedbetween 50 MeV and 300 MeV were obtained for the mean ISSaltitudes during each period (I�IV) and at the highest altitudeduring Period IV. The calculated absorbed dose rate from trappedprotons (DAP8) is shown in Fig. 5 in the form of bold-dashed lines.The large difference in average dose rate between the averagealtitude (354 km) andmaximum altitude (365 km) during Period IV
keV/mm and the total results for the four periods (I�IV). LET threshold of PNTD is
LETNH2O � 100 keV/mm Total results (covering whole LETrange)
D�100 keV/mm
[mGy/day]H�100 keV/mm
[mSv/day]DTotal [mGy/day] HTotal [mSv/day]
7.5 � 0.4 169.7 � 10.3 233.8 � 7.0 521.4 � 13.67.3 � 0.8 157.9 � 19.7 282.2 � 13.4 566.4 � 26.18.8 � 1.4 202.2 � 20.2 306.0 � 9.2 682.1 � 25.5
13.6 � 1.8 272.1 � 38.1 393.9 � 16.4 816.9 � 46.5
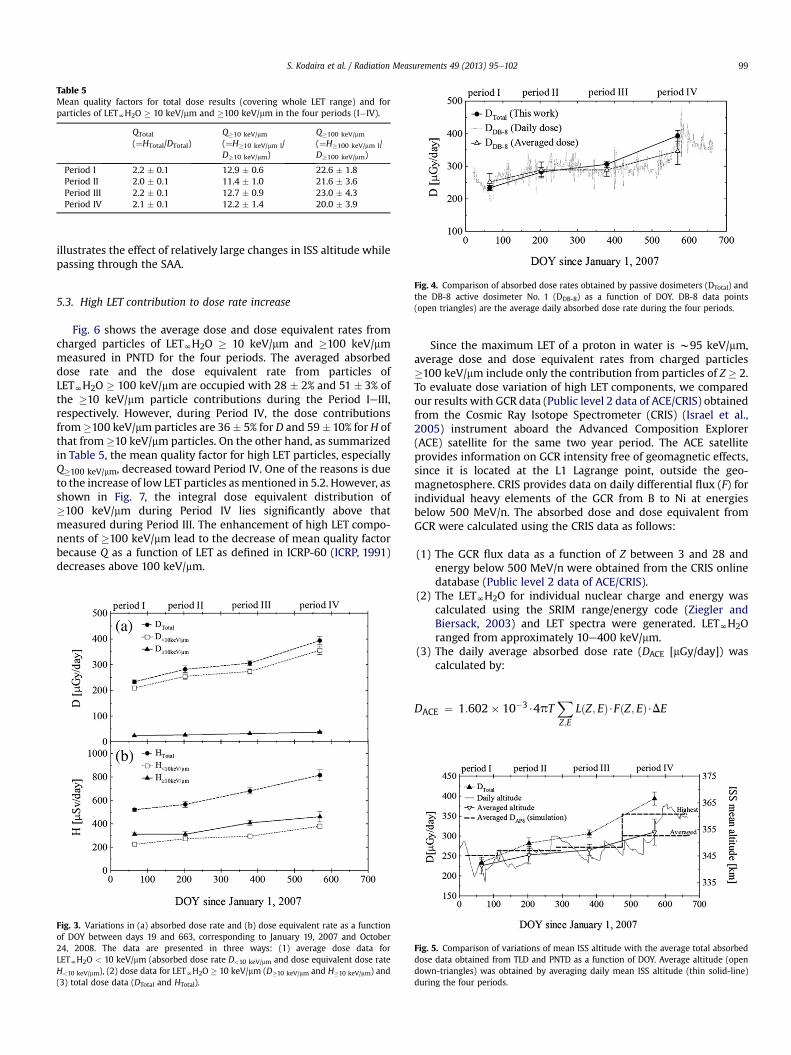
Table 5Mean quality factors for total dose results (covering whole LET range) and forparticles of LETNH2O � 10 keV/mm and �100 keV/mm in the four periods (I�IV).
QTotal
(¼HTotal/DTotal)Q�10 keV/mm
(¼H�10 keV/mm l/D�10 keV/mm)
Q�100 keV/mm
(¼H�100 keV/mm l/D�100 keV/mm)
Period I 2.2 � 0.1 12.9 � 0.6 22.6 � 1.8Period II 2.0 � 0.1 11.4 � 1.0 21.6 � 3.6Period III 2.2 � 0.1 12.7 � 0.9 23.0 � 4.3Period IV 2.1 � 0.1 12.2 � 1.4 20.0 � 3.9
S. Kodaira et al. / Radiation Measurements 49 (2013) 95e102 99
illustrates the effect of relatively large changes in ISS altitude whilepassing through the SAA.
Fig. 4. Comparison of absorbed dose rates obtained by passive dosimeters (DTotal) andthe DB-8 active dosimeter No. 1 (DDB-8) as a function of DOY. DB-8 data points(open triangles) are the average daily absorbed dose rate during the four periods.
5.3. High LET contribution to dose rate increase
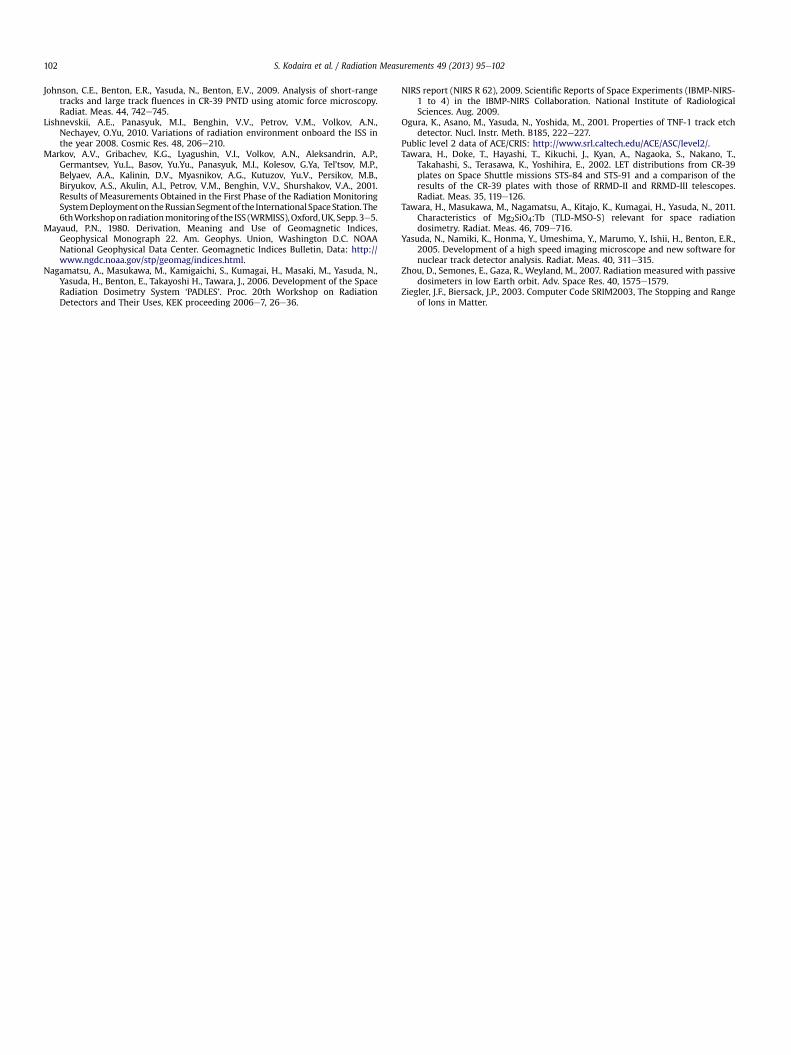
Fig. 6 shows the average dose and dose equivalent rates fromcharged particles of LETNH2O � 10 keV/mm and �100 keV/mmmeasured in PNTD for the four periods. The averaged absorbeddose rate and the dose equivalent rate from particles ofLETNH2O � 100 keV/mm are occupied with 28 � 2% and 51 � 3% ofthe �10 keV/mm particle contributions during the Period IeIII,respectively. However, during Period IV, the dose contributionsfrom�100 keV/mmparticles are 36� 5% for D and 59� 10% for H ofthat from�10 keV/mm particles. On the other hand, as summarizedin Table 5, the mean quality factor for high LET particles, especiallyQ�100 keV/mm, decreased toward Period IV. One of the reasons is dueto the increase of low LET particles asmentioned in 5.2. However, asshown in Fig. 7, the integral dose equivalent distribution of�100 keV/mm during Period IV lies significantly above thatmeasured during Period III. The enhancement of high LET compo-nents of �100 keV/mm lead to the decrease of mean quality factorbecause Q as a function of LET as defined in ICRP-60 (ICRP, 1991)decreases above 100 keV/mm.
Fig. 3. Variations in (a) absorbed dose rate and (b) dose equivalent rate as a functionof DOY between days 19 and 663, corresponding to January 19, 2007 and October24, 2008. The data are presented in three ways: (1) average dose data forLETNH2O < 10 keV/mm (absorbed dose rate D<10 keV/mm and dose equivalent dose rateH<10 keV/mm), (2) dose data for LETNH2O � 10 keV/mm (D�10 keV/mm and H�10 keV/mm) and(3) total dose data (DTotal and HTotal).
Since the maximum LET of a proton in water is w95 keV/mm,average dose and dose equivalent rates from charged particles�100 keV/mm include only the contribution from particles of Z � 2.To evaluate dose variation of high LET components, we comparedour results with GCR data (Public level 2 data of ACE/CRIS) obtainedfrom the Cosmic Ray Isotope Spectrometer (CRIS) (Israel et al.,2005) instrument aboard the Advanced Composition Explorer(ACE) satellite for the same two year period. The ACE satelliteprovides information on GCR intensity free of geomagnetic effects,since it is located at the L1 Lagrange point, outside the geo-magnetosphere. CRIS provides data on daily differential flux (F) forindividual heavy elements of the GCR from B to Ni at energiesbelow 500 MeV/n. The absorbed dose and dose equivalent fromGCR were calculated using the CRIS data as follows:
(1) The GCR flux data as a function of Z between 3 and 28 andenergy below 500 MeV/n were obtained from the CRIS onlinedatabase (Public level 2 data of ACE/CRIS).
(2) The LETNH2O for individual nuclear charge and energy wascalculated using the SRIM range/energy code (Ziegler andBiersack, 2003) and LET spectra were generated. LETNH2Oranged from approximately 10e400 keV/mm.
(3) The daily average absorbed dose rate (DACE [mGy/day]) wascalculated by:
DACE ¼ 1:602� 10�3$4pTX
LðZ; EÞ$FðZ; EÞ$DE
Z;EFig. 5. Comparison of variations of mean ISS altitude with the average total absorbeddose data obtained from TLD and PNTD as a function of DOY. Average altitude (opendown-triangles) was obtained by averaging daily mean ISS altitude (thin solid-line)during the four periods.
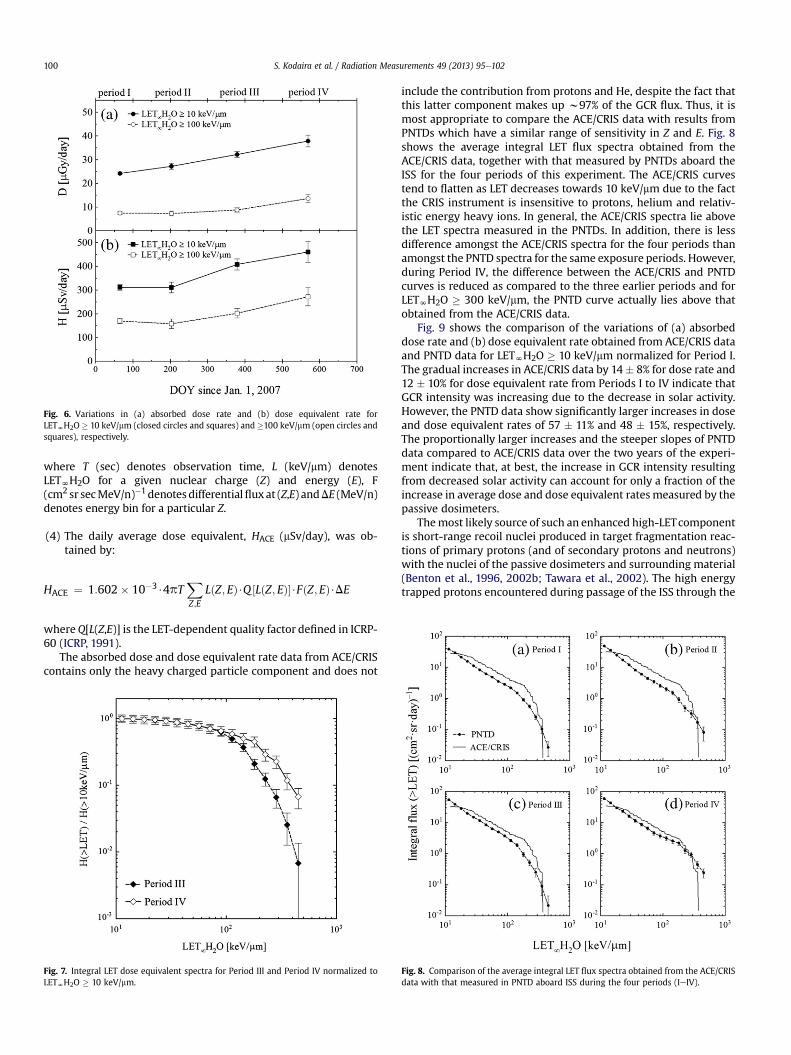
Fig. 6. Variations in (a) absorbed dose rate and (b) dose equivalent rate forLETNH2O � 10 keV/mm (closed circles and squares) and �100 keV/mm (open circles andsquares), respectively.
S. Kodaira et al. / Radiation Measurements 49 (2013) 95e102100
where T (sec) denotes observation time, L (keV/mm) denotesLETNH2O for a given nuclear charge (Z) and energy (E), F(cm2 sr secMeV/n)�1 denotesdifferentialfluxat (Z,E) andDE (MeV/n)denotes energy bin for a particular Z.
(4) The daily average dose equivalent, HACE (mSv/day), was ob-tained by:
HACE ¼ 1:602� 10�3$4pTX
Z;E
LðZ; EÞ$Q ½LðZ; EÞ�$FðZ; EÞ$DE
whereQ[L(Z,E)] is the LET-dependent quality factor defined in ICRP-60 (ICRP, 1991).
The absorbed dose and dose equivalent rate data from ACE/CRIScontains only the heavy charged particle component and does not
Fig. 7. Integral LET dose equivalent spectra for Period III and Period IV normalized toLETNH2O � 10 keV/mm.
include the contribution from protons and He, despite the fact thatthis latter component makes up w97% of the GCR flux. Thus, it ismost appropriate to compare the ACE/CRIS data with results fromPNTDs which have a similar range of sensitivity in Z and E. Fig. 8shows the average integral LET flux spectra obtained from theACE/CRIS data, together with that measured by PNTDs aboard theISS for the four periods of this experiment. The ACE/CRIS curvestend to flatten as LET decreases towards 10 keV/mm due to the factthe CRIS instrument is insensitive to protons, helium and relativ-istic energy heavy ions. In general, the ACE/CRIS spectra lie abovethe LET spectra measured in the PNTDs. In addition, there is lessdifference amongst the ACE/CRIS spectra for the four periods thanamongst the PNTD spectra for the same exposure periods. However,during Period IV, the difference between the ACE/CRIS and PNTDcurves is reduced as compared to the three earlier periods and forLETNH2O � 300 keV/mm, the PNTD curve actually lies above thatobtained from the ACE/CRIS data.
Fig. 9 shows the comparison of the variations of (a) absorbeddose rate and (b) dose equivalent rate obtained from ACE/CRIS dataand PNTD data for LETNH2O � 10 keV/mm normalized for Period I.The gradual increases in ACE/CRIS data by 14� 8% for dose rate and12 � 10% for dose equivalent rate from Periods I to IV indicate thatGCR intensity was increasing due to the decrease in solar activity.However, the PNTD data show significantly larger increases in doseand dose equivalent rates of 57 � 11% and 48 � 15%, respectively.The proportionally larger increases and the steeper slopes of PNTDdata compared to ACE/CRIS data over the two years of the experi-ment indicate that, at best, the increase in GCR intensity resultingfrom decreased solar activity can account for only a fraction of theincrease in average dose and dose equivalent rates measured by thepassive dosimeters.
Themost likely source of such an enhanced high-LETcomponentis short-range recoil nuclei produced in target fragmentation reac-tions of primary protons (and of secondary protons and neutrons)with the nuclei of the passive dosimeters and surrounding material(Benton et al., 1996, 2002b; Tawara et al., 2002). The high energytrapped protons encountered during passage of the ISS through the
Fig. 8. Comparison of the average integral LET flux spectra obtained from the ACE/CRISdata with that measured in PNTD aboard ISS during the four periods (IeIV).
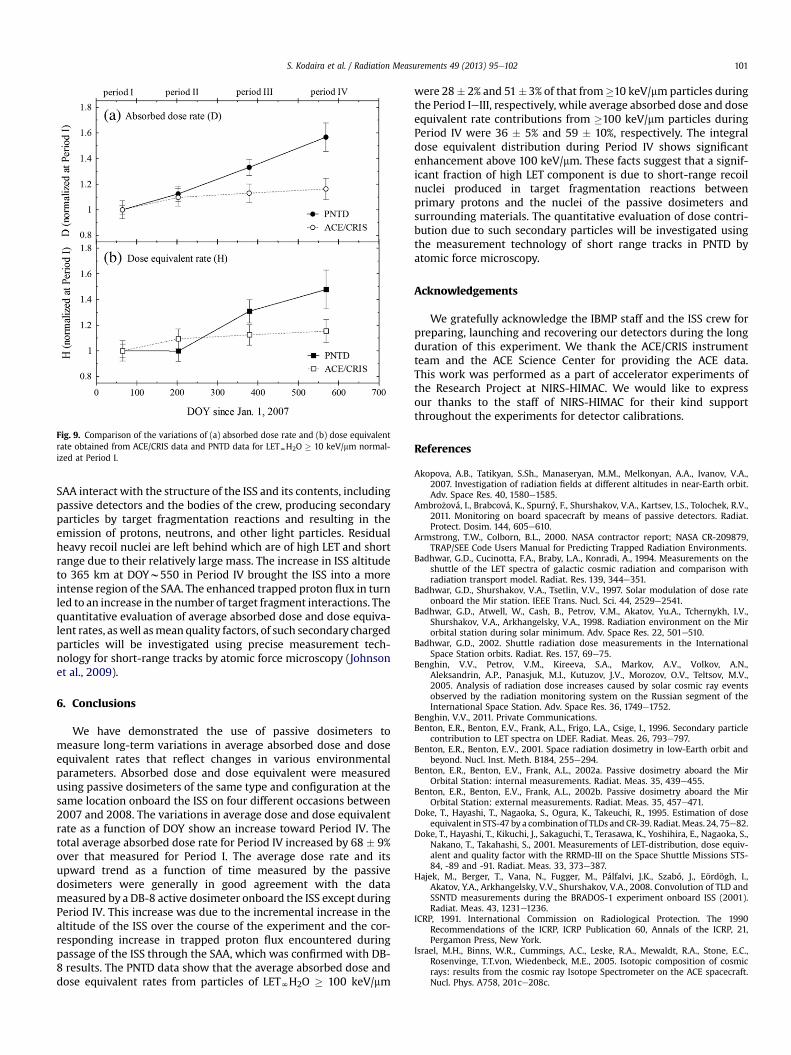
Fig. 9. Comparison of the variations of (a) absorbed dose rate and (b) dose equivalentrate obtained from ACE/CRIS data and PNTD data for LETNH2O � 10 keV/mm normal-ized at Period I.
S. Kodaira et al. / Radiation Measurements 49 (2013) 95e102 101
SAA interact with the structure of the ISS and its contents, includingpassive detectors and the bodies of the crew, producing secondaryparticles by target fragmentation reactions and resulting in theemission of protons, neutrons, and other light particles. Residualheavy recoil nuclei are left behind which are of high LET and shortrange due to their relatively large mass. The increase in ISS altitudeto 365 km at DOYw550 in Period IV brought the ISS into a moreintense region of the SAA. The enhanced trapped proton flux in turnled to an increase in the number of target fragment interactions. Thequantitative evaluation of average absorbed dose and dose equiva-lent rates, aswell asmean quality factors, of such secondary chargedparticles will be investigated using precise measurement tech-nology for short-range tracks by atomic force microscopy (Johnsonet al., 2009).
6. Conclusions
We have demonstrated the use of passive dosimeters tomeasure long-term variations in average absorbed dose and doseequivalent rates that reflect changes in various environmentalparameters. Absorbed dose and dose equivalent were measuredusing passive dosimeters of the same type and configuration at thesame location onboard the ISS on four different occasions between2007 and 2008. The variations in average dose and dose equivalentrate as a function of DOY show an increase toward Period IV. Thetotal average absorbed dose rate for Period IV increased by 68 � 9%over that measured for Period I. The average dose rate and itsupward trend as a function of time measured by the passivedosimeters were generally in good agreement with the datameasured by a DB-8 active dosimeter onboard the ISS except duringPeriod IV. This increase was due to the incremental increase in thealtitude of the ISS over the course of the experiment and the cor-responding increase in trapped proton flux encountered duringpassage of the ISS through the SAA, which was confirmed with DB-8 results. The PNTD data show that the average absorbed dose anddose equivalent rates from particles of LETNH2O � 100 keV/mm
were 28� 2% and 51�3% of that from�10 keV/mmparticles duringthe Period IeIII, respectively, while average absorbed dose and doseequivalent rate contributions from �100 keV/mm particles duringPeriod IV were 36 � 5% and 59 � 10%, respectively. The integraldose equivalent distribution during Period IV shows significantenhancement above 100 keV/mm. These facts suggest that a signif-icant fraction of high LET component is due to short-range recoilnuclei produced in target fragmentation reactions betweenprimary protons and the nuclei of the passive dosimeters andsurrounding materials. The quantitative evaluation of dose contri-bution due to such secondary particles will be investigated usingthe measurement technology of short range tracks in PNTD byatomic force microscopy.
Acknowledgements
We gratefully acknowledge the IBMP staff and the ISS crew forpreparing, launching and recovering our detectors during the longduration of this experiment. We thank the ACE/CRIS instrumentteam and the ACE Science Center for providing the ACE data.This work was performed as a part of accelerator experiments ofthe Research Project at NIRS-HIMAC. We would like to expressour thanks to the staff of NIRS-HIMAC for their kind supportthroughout the experiments for detector calibrations.
References
Akopova, A.B., Tatikyan, S.Sh., Manaseryan, M.M., Melkonyan, A.A., Ivanov, V.A.,2007. Investigation of radiation fields at different altitudes in near-Earth orbit.Adv. Space Res. 40, 1580e1585.
Ambro�zová, I., Brabcová, K., Spurný, F., Shurshakov, V.A., Kartsev, I.S., Tolochek, R.V.,2011. Monitoring on board spacecraft by means of passive detectors. Radiat.Protect. Dosim. 144, 605e610.
Armstrong, T.W., Colborn, B.L., 2000. NASA contractor report; NASA CR-209879,TRAP/SEE Code Users Manual for Predicting Trapped Radiation Environments.
Badhwar, G.D., Cucinotta, F.A., Braby, L.A., Konradi, A., 1994. Measurements on theshuttle of the LET spectra of galactic cosmic radiation and comparison withradiation transport model. Radiat. Res. 139, 344e351.
Badhwar, G.D., Shurshakov, V.A., Tsetlin, V.V., 1997. Solar modulation of dose rateonboard the Mir station. IEEE Trans. Nucl. Sci. 44, 2529e2541.
Badhwar, G.D., Atwell, W., Cash, B., Petrov, V.M., Akatov, Yu.A., Tchernykh, I.V.,Shurshakov, V.A., Arkhangelsky, V.A., 1998. Radiation environment on the Mirorbital station during solar minimum. Adv. Space Res. 22, 501e510.
Badhwar, G.D., 2002. Shuttle radiation dose measurements in the InternationalSpace Station orbits. Radiat. Res. 157, 69e75.
Benghin, V.V., Petrov, V.M., Kireeva, S.A., Markov, A.V., Volkov, A.N.,Aleksandrin, A.P., Panasjuk, M.I., Kutuzov, J.V., Morozov, O.V., Teltsov, M.V.,2005. Analysis of radiation dose increases caused by solar cosmic ray eventsobserved by the radiation monitoring system on the Russian segment of theInternational Space Station. Adv. Space Res. 36, 1749e1752.
Benghin, V.V., 2011. Private Communications.Benton, E.R., Benton, E.V., Frank, A.L., Frigo, L.A., Csige, I., 1996. Secondary particle
contribution to LET spectra on LDEF. Radiat. Meas. 26, 793e797.Benton, E.R., Benton, E.V., 2001. Space radiation dosimetry in low-Earth orbit and
beyond. Nucl. Inst. Meth. B184, 255e294.Benton, E.R., Benton, E.V., Frank, A.L., 2002a. Passive dosimetry aboard the Mir
Orbital Station: internal measurements. Radiat. Meas. 35, 439e455.Benton, E.R., Benton, E.V., Frank, A.L., 2002b. Passive dosimetry aboard the Mir
Orbital Station: external measurements. Radiat. Meas. 35, 457e471.Doke, T., Hayashi, T., Nagaoka, S., Ogura, K., Takeuchi, R., 1995. Estimation of dose
equivalent in STS-47 by a combination of TLDs and CR-39. Radiat.Meas. 24, 75e82.Doke, T., Hayashi, T., Kikuchi, J., Sakaguchi, T., Terasawa, K., Yoshihira, E., Nagaoka, S.,
Nakano, T., Takahashi, S., 2001. Measurements of LET-distribution, dose equiv-alent and quality factor with the RRMD-III on the Space Shuttle Missions STS-84, -89 and -91. Radiat. Meas. 33, 373e387.
Hajek, M., Berger, T., Vana, N., Fugger, M., Pálfalvi, J.K., Szabó, J., Eördögh, I.,Akatov, Y.A., Arkhangelsky, V.V., Shurshakov, V.A., 2008. Convolution of TLD andSSNTD measurements during the BRADOS-1 experiment onboard ISS (2001).Radiat. Meas. 43, 1231e1236.
ICRP, 1991. International Commission on Radiological Protection. The 1990Recommendations of the ICRP, ICRP Publication 60, Annals of the ICRP, 21,Pergamon Press, New York.
Israel, M.H., Binns, W.R., Cummings, A.C., Leske, R.A., Mewaldt, R.A., Stone, E.C.,Rosenvinge, T.T.von, Wiedenbeck, M.E., 2005. Isotopic composition of cosmicrays: results from the cosmic ray Isotope Spectrometer on the ACE spacecraft.Nucl. Phys. A758, 201ce208c.
S. Kodaira et al. / Radiation Measurements 49 (2013) 95e102102
Johnson, C.E., Benton, E.R., Yasuda, N., Benton, E.V., 2009. Analysis of short-rangetracks and large track fluences in CR-39 PNTD using atomic force microscopy.Radiat. Meas. 44, 742e745.
Lishnevskii, A.E., Panasyuk, M.I., Benghin, V.V., Petrov, V.M., Volkov, A.N.,Nechayev, O.Yu, 2010. Variations of radiation environment onboard the ISS inthe year 2008. Cosmic Res. 48, 206e210.
Markov, A.V., Gribachev, K.G., Lyagushin, V.I., Volkov, A.N., Aleksandrin, A.P.,Germantsev, Yu.L., Basov, Yu.Yu., Panasyuk, M.I., Kolesov, G.Ya, Tel’tsov, M.P.,Belyaev, A.A., Kalinin, D.V., Myasnikov, A.G., Kutuzov, Yu.V., Persikov, M.B.,Biryukov, A.S., Akulin, A.I., Petrov, V.M., Benghin, V.V., Shurshakov, V.A., 2001.Results of Measurements Obtained in the First Phase of the Radiation MonitoringSystemDeploymenton theRussianSegmentof the International SpaceStation. The6thWorkshoponradiationmonitoringof the ISS (WRMISS),Oxford,UK, Sepp.3e5.
Mayaud, P.N., 1980. Derivation, Meaning and Use of Geomagnetic Indices,Geophysical Monograph 22. Am. Geophys. Union, Washington D.C. NOAANational Geophysical Data Center. Geomagnetic Indices Bulletin, Data: http://www.ngdc.noaa.gov/stp/geomag/indices.html.
Nagamatsu, A., Masukawa, M., Kamigaichi, S., Kumagai, H., Masaki, M., Yasuda, N.,Yasuda, H., Benton, E., Takayoshi H., Tawara, J., 2006. Development of the SpaceRadiation Dosimetry System ‘PADLES’. Proc. 20th Workshop on RadiationDetectors and Their Uses, KEK proceeding 2006e7, 26e36.
NIRS report (NIRS R 62), 2009. Scientific Reports of Space Experiments (IBMP-NIRS-1 to 4) in the IBMP-NIRS Collaboration. National Institute of RadiologicalSciences. Aug. 2009.
Ogura, K., Asano, M., Yasuda, N., Yoshida, M., 2001. Properties of TNF-1 track etchdetector. Nucl. Instr. Meth. B185, 222e227.
Public level 2 data of ACE/CRIS: http://www.srl.caltech.edu/ACE/ASC/level2/.Tawara, H., Doke, T., Hayashi, T., Kikuchi, J., Kyan, A., Nagaoka, S., Nakano, T.,
Takahashi, S., Terasawa, K., Yoshihira, E., 2002. LET distributions from CR-39plates on Space Shuttle missions STS-84 and STS-91 and a comparison of theresults of the CR-39 plates with those of RRMD-II and RRMD-III telescopes.Radiat. Meas. 35, 119e126.
Tawara, H., Masukawa, M., Nagamatsu, A., Kitajo, K., Kumagai, H., Yasuda, N., 2011.Characteristics of Mg2SiO4:Tb (TLD-MSO-S) relevant for space radiationdosimetry. Radiat. Meas. 46, 709e716.
Yasuda, N., Namiki, K., Honma, Y., Umeshima, Y., Marumo, Y., Ishii, H., Benton, E.R.,2005. Development of a high speed imaging microscope and new software fornuclear track detector analysis. Radiat. Meas. 40, 311e315.
Zhou, D., Semones, E., Gaza, R., Weyland, M., 2007. Radiation measured with passivedosimeters in low Earth orbit. Adv. Space Res. 40, 1575e1579.
Ziegler, J.F., Biersack, J.P., 2003. Computer Code SRIM2003, The Stopping and Rangeof Ions in Matter.


