International Journal of Engineering Research and General Science Volume 3, Issue 3, Part-2 , May-June, 2015 ISSN 2091-2730
403 www.ijergs.org
Analysis and Optimization of parameters for casting ductile iron pipes
Mr. Karan Thacker, Prof. Himanshu Joshi, Prof. N.J. Patel
P.G. Scholar, HJD-ITR Kera-Kutch;[email protected]; 9428684039
Abstract—Ductile iron Pipes are casted by Horizontal centrifugal process in which liquid iron is filled through an open channel into a fast rotating
mould that is slightly tilted. The mould is water cooled from outside. In order to distribute the metal, the spinning mould including its cooling system
is shifted axially in a controlled movement. The quality of ductile iron pipe largely depends on microstructure as well as mechanical properties like
Ferrite %, Carbide %, Elongation % and Hardness. These can be improved by analyze and optimize the process parameters during the casting
process. In this research paper, Design of Experiment (DOE) based Taguchi Method is used to analyze and optimize the parameters like Pouring
molten metal Temperature, Inoculation Quantity and inlet cooling water flow rate. By using Taguchi Method L16 orthogonal array is generated in
MINITAB 17 and responses are analyzed by experimental work at different levels of factors. From S/N ratio the best combination of parameters are
analyzed by which the predicted Taguchi result is generated. The confirmation experimental test is done and predicted result is compared with actual
results. Also the Significance of factors and interactions of parameters are analyzed by Analysis of variance (ANOVA). By performing all this an
attempt has made to analyze and optimize the parameters to improve the pipe quality and its life by supplying optimized resources.
Keywords— Ductile iron pipes, Centrifugal casting , Mechanical properties, Microstructure, analysis and optimization of processing parameters,
Design of Experiments(DOE), Taguchi Method, Analysis of Variance(ANOVA).
INTRODUCTION
1.1 Ductile iron
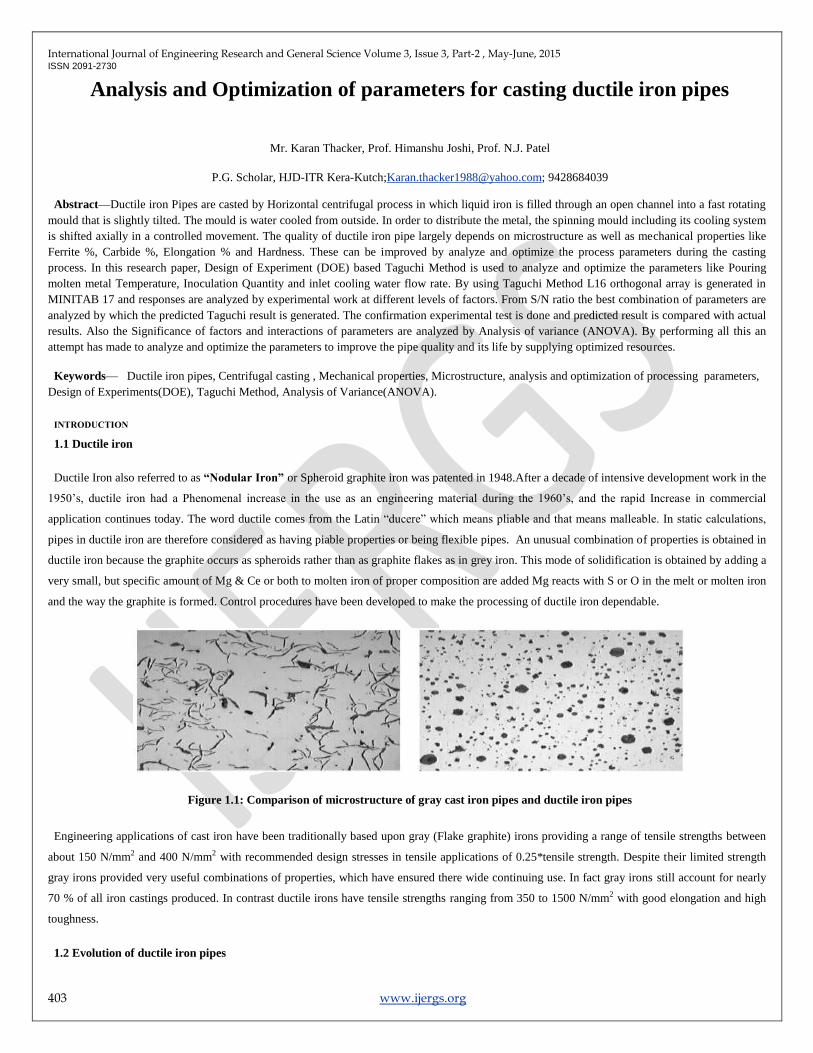
Ductile Iron also referred to as “Nodular Iron” or Spheroid graphite iron was patented in 1948.After a decade of intensive development work in the
1950’s, ductile iron had a Phenomenal increase in the use as an engineering material during the 1960’s, and the rapid Increase in commercial
application continues today. The word ductile comes from the Latin ―ducere‖ which means pliable and that means malleable. In static calculations,
pipes in ductile iron are therefore considered as having piable properties or being flexible pipes. An unusual combination of properties is obtained in
ductile iron because the graphite occurs as spheroids rather than as graphite flakes as in grey iron. This mode of solidification is obtained by adding a
very small, but specific amount of Mg & Ce or both to molten iron of proper composition are added Mg reacts with S or O in the melt or molten iron
and the way the graphite is formed. Control procedures have been developed to make the processing of ductile iron dependable.
Figure 1.1: Comparison of microstructure of gray cast iron pipes and ductile iron pipes
Engineering applications of cast iron have been traditionally based upon gray (Flake graphite) irons providing a range of tensile strengths between
about 150 N/mm2 and 400 N/mm2 with recommended design stresses in tensile applications of 0.25*tensile strength. Despite their limited strength
gray irons provided very useful combinations of properties, which have ensured there wide continuing use. In fact gray irons still account for nearly
70 % of all iron castings produced. In contrast ductile irons have tensile strengths ranging from 350 to 1500 N/mm2 with good elongation and high
toughness.
1.2 Evolution of ductile iron pipes
International Journal of Engineering Research and General Science Volume 3, Issue 3, Part-2 , May-June, 2015 ISSN 2091-2730
404 www.ijergs.org
In 1918 centrifugal casting process which revolutionised pipe production is introduced. The use of centrifugal force of rotating mould eliminated
need for centre core and water-cooled metal mould permitted repetitively casting at high production rate.
With the advances in metallurgy, melting controls, chemical composition and spectrometer laboratories gray iron pipe progressively improved and
its strength increased when discovery of ductile iron was announced. Some pipe producers suggest no need for it, since gray iron had served well and
was stronger that other competitive pipe materials. At the start some companies experimented with ductile iron and some trial orders were produced
for special applications and evaluations. The experiments were very much favourable.
After successful trials, number of experiments was done on ductile iron pipes for various improvements regarding the properties, thickness, pressure
analysis, weights etc. These tests verify the superior quality of ductile iron pipe which permitted reduction in thickness, reduction in cost etc. Thus
ductile iron pipe replace the grey cast iron pipes and its demand progressively increased.
1.3 Ductile iron pipes
Ductile iron pipe have been produced since 1951. It is spheroidal graphite formation which makes extreme malleability and stretching ability
possible with ductile iron pipes. With the improvement in metallurgy of cast iron, the condition is met for the use of ductile iron pipe systems in
nearly all areas of urban piping infrastructure.
Ductile iron pipes are made of ductile iron commonly used for water transmission and distribution. Ductile iron pipes are the direct development of
cast iron pipes which were used in earlier years for water transmission. The Ductile iron used to manufacture the ductile iron pipe is characterized by
spheroidal or nodular nature of graphite within it. Chemically Ductile iron pipe is same as gray cast iron pipe but the main difference between both of
them is in gray cast iron pipe the graphite is present in the form of graphite flakes while in ductile iron pipe the graphite is present in the form of
nodules which give it the tensile strength 350 N/mm2 to 1500 N/mm2 rather than 150 N/mm2 to 400 N/mm2 of the gray cast iron pipe with good
elongation and High Toughness. Also the cast iron or gray cast iron pipes are brittle because of the lack of Ductility. [4]
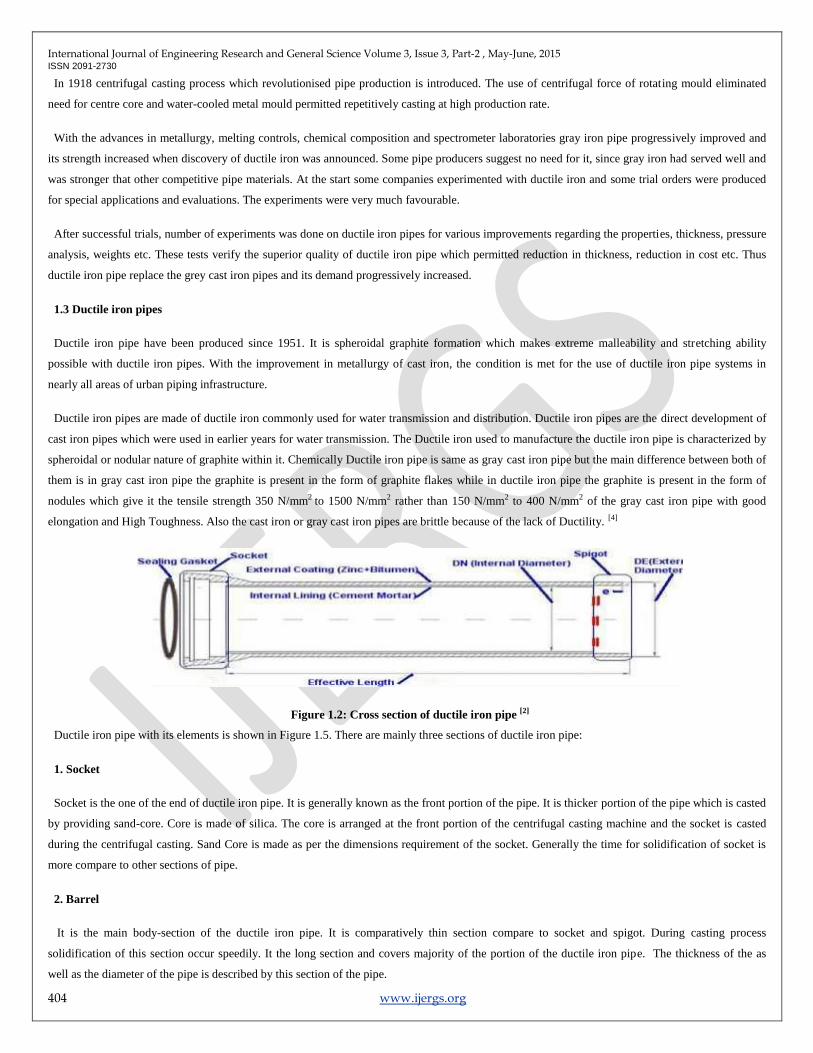
Figure 1.2: Cross section of ductile iron pipe [2]
Ductile iron pipe with its elements is shown in Figure 1.5. There are mainly three sections of ductile iron pipe:
1. Socket
Socket is the one of the end of ductile iron pipe. It is generally known as the front portion of the pipe. It is thicker portion of the pipe which is casted
by providing sand-core. Core is made of silica. The core is arranged at the front portion of the centrifugal casting machine and the socket is casted
during the centrifugal casting. Sand Core is made as per the dimensions requirement of the socket. Generally the time for solidification of socket is
more compare to other sections of pipe.
2. Barrel
It is the main body-section of the ductile iron pipe. It is comparatively thin section compare to socket and spigot. During casting process
solidification of this section occur speedily. It the long section and covers majority of the portion of the ductile iron pipe. The thickness of the as
well as the diameter of the pipe is described by this section of the pipe.
International Journal of Engineering Research and General Science Volume 3, Issue 3, Part-2 , May-June, 2015 ISSN 2091-2730
405 www.ijergs.org
3. Spigot
Spigot is the second end of ductile iron pipe which is casted lastly during the casting process. It is the smaller section of the pipe which solidifies
lastly during the centrifugal casting process. During the installation process of ductile iron pipe network for application each Spigot is jointed with
socket section.
Generally, Standard length of ductile iron pipe should be kept from 4.0 meter to 6.0 meters. When the installation of ductile iron pipe is done, they
are placed in series. So that number of pipes can be easily arranged and maintenance of pipe, in case, can be done easily. The diameter of pipe also
varies from 80mm to 1000mm. Also the weight of the pipes varies as per the diameter and class. Now a day’s also the pipe with 1200mm diameter
can be made as the requirement arises. In India as per the requirement of customers for different purposes, ductile iron pipe is mainly classified into
two categories. This classification is on the based on thickness and weight of the pipe. It is classified as K7 and K9 type of pipes. Between them K7
is thinner than K9. K7 type of pipe is used for generally low pressurised fluid where K9 is used for High pressurised fluid for transportation purpose.
1.4 Centrifugal casting
Centrifugal casting is one of the largest casting branches in the casting industry, accounting for 15% of the total casting output of the world in terms
of tonnage. The technique uses the centrifugal force generated by a rotating cylindrical mould to throw molten metal against a mould wall to form the
desired shape. Therefore, a centrifugal casting machine must be able to spin a mould, receive molten metal, and let the metal solidify and cool in the
mould in a carefully controlled manner. All metals that can be cast by static casting can be cast by the centrifugal casting process, including carbon
and alloy steels, high-alloy corrosion- and heat-resistant steels, gray iron, ductile and nodular iron, high-alloy irons, stainless steels, nickel steels,
aluminium alloys, copper alloys, magnesium alloys, nickel- and cobalt-base alloys, and titanium alloys. Non-metals can also be cast by centrifugal
casting, including ceramics, glasses, plastics, and virtually any material that can be made into liquid or pourable slurries. The centrifugal technique is
used primarily for the production of hollow components, but centrifugal casting is used to create solid parts. The centrifugal casting process is
generally preferred for producing a superior-quality tubular or cylindrical casting, because the process is economical with regard to casting yield,
cleaning room cost, and mould cost. The centrifugal force causes high pressures to develop in the metal, and it contributes to the feeding of the metal,
with separation from non-metallic inclusions and evolved gases. Centrifugal casting machines are categorized into three basic types based on the
direction of the spinning axis: horizontal, vertical, or inclined. Centrifugal casting processes also have three types:
1. True centrifugal casting (horizontal, vertical, or inclined)
2. Semi-centrifugal (centrifugal mould) casting
3. Centrifuge mould (centrifugal die) casting
Horizontal centrifugal casting is mainly used to cast pieces with a high length-to-diameter ratio or with a uniform internal diameter. Products
include pipe, tubes, bushings, cylinder sleeves (liners), and cylindrical or tubular castings that are simple in shape. When metal is poured into the
horizontally rotating mould, considerable slip occurs between the metal and the mould such that the metal does not move as fast as the rotating
mould. To overcome this inertia, the metal must be accelerated to reach the mould rotation speed. When metal is poured into the horizontally rotating
mould, considerable slip occurs between the metal and the mould such that the metal does not move as fast as the rotating mould. To overcome this
inertia, the metal must be accelerated to reach the mould rotation speed. [6]
1.5 Manufacturing process of ductile iron pipe
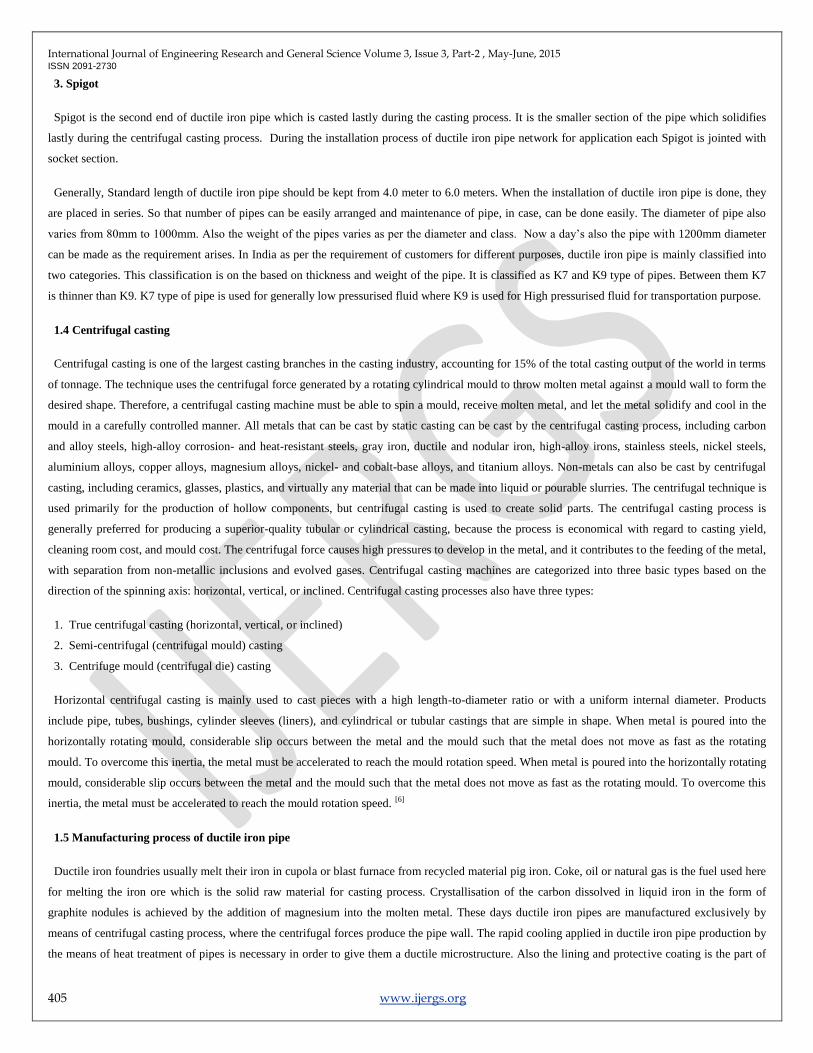
Ductile iron foundries usually melt their iron in cupola or blast furnace from recycled material pig iron. Coke, oil or natural gas is the fuel used here
for melting the iron ore which is the solid raw material for casting process. Crystallisation of the carbon dissolved in liquid iron in the form of
graphite nodules is achieved by the addition of magnesium into the molten metal. These days ductile iron pipes are manufactured exclusively by
means of centrifugal casting process, where the centrifugal forces produce the pipe wall. The rapid cooling applied in ductile iron pipe production by
the means of heat treatment of pipes is necessary in order to give them a ductile microstructure. Also the lining and protective coating is the part of
International Journal of Engineering Research and General Science Volume 3, Issue 3, Part-2 , May-June, 2015 ISSN 2091-2730
406 www.ijergs.org
production process. Throughout the entire production process there is defined control system of controls and tests to guarantee the specified
properties of the product. [2]
Figure 1.3: Process of manufacturing the ductile iron pipes
1.6 Effect of inlet cooling water flow rate
In ductile pipe casting machines, a measured amount of molten metal is poured into an elongated generally cylindrical metal mould progressively
from one end to the other while the mould is being rotated about its longitudinal axis at a rate to evenly distribute and retain the molten metal over the
interior wall of the mould.
During pouring of the molten iron and for a predetermined time thereafter, the external wall of the mould is cooled to prevent damage to the mould
and to extract heat of fusion from the molten metal. This cooling is accomplished either by directing a spray or multiple streams of water onto the
external surface of the mould or by submerging the mould in a cooling water bath. In either case, the mould must be cooled uniformly to avoid
damage to the pipe being cast and to prevent excessive distortion of the mould.
Centrifugal castings should be cooled unidirectional from outside to inside. Any two-way solidification will increase the chance of shrinkage
porosity and machining allowance, which should be avoided or minimized in thick-wall castings. Cooling rate can affect the microstructure, casting
hardness, circumferential and axial cracks, machine productivity, as well as mould life. In most cases, the early cooling rate of the castings is mainly
controlled by the coating thickness, coating texture, coating materials, as well as mould thickness and mould materials; however, the later cooling
rate is mainly controlled by water cooling (unless the mould is not cooled by water). Water-cooling methods include water submerge, water-jet spray,
and water sleeve. Ductile iron pipe production uses all three water-cooling methods For example the middle section of a long tube mould usually
needs more water for cooling.
1.7 Effect of metal pouring temperature
Before casting process of ductile iron pipe, liquid metal is poured into the Hopper from the ladle. This liquid metal should be at the required higher
temperature that the fluidity of the metal can be maintained during the casting process. During the pouring process metal temperature should be high
enough that can dissolve the inoculation and thoroughly mixed. The overall response to inoculation is dependent on melt condition- the poring
temperature.
The grain size of inoculation varies from 0.2 to 6.0 mm depends on quantity and temperature of metal. The grain structure of centrifugal castings
is concerned; the pour temperature or the variable spinning speed plays a much more important role in obtaining the equated grains than the water-
cooling rate or mould temperature.
International Journal of Engineering Research and General Science Volume 3, Issue 3, Part-2 , May-June, 2015 ISSN 2091-2730
407 www.ijergs.org
1.8 Effect of Inoculation
Inoculation is small amount of material which is added into the molten metal stream during the pouring process. Inoculation mainly contains silica
of about 45-75 % and some amount of calcium and aluminium as per the application required. There are various types of inoculants which are used in
casting process. Among them Zircobar is used for casting ductile iron pipes.
Zircobar is used for following purposes:
Increases nodule counts and hence better mechanical properties.
Consistent microstructure and mechanical properties.
Uniform properties in varying section thickness
Chill removal
Zircobar contains 60-70 % silica and 3-5 % Mn and Zr. This inoculation provides the better microstructure and mechanical properties in ductile iron
pipes. As the result, tensile strength, elongation hardness and machine-ability become more uniform from one section to another section in the same
casting
1.9 Effect of carbide in structure
Ductile iron castings are more prone to contain carbides than flake-graphite castings of similar section and size and carbon and silicon contents.
This occurs partly because the spherodizing process generally involves the addition of magnesium and/or cerium, which are both elements to
promote the formation of eutectic carbide; and partly because the sequence of solidification produced by the growth of nodular graphite tend to
promote under-cooling during solidification to temperatures at which white iron structure as likely to form. Carbides in ductile irons can occur in
three forms:
Eutectic carbide (or chill) results mainly from the rapid solidification and is most prevalent in corners and thin sections. Inadequate inoculation, low
carbon and in particular low silicon and the presence of carbide promoting elements increases the likelihood of carbides being present in the
structure. Inverse chill, which has fine acicular form, occurs at or near the heat centre of a casting section. The geometry of the casting and method of
running the casting are important variables and the problem is often only solved by re-positioning or altering the size of in gates to change the pattern
of solidification of casting.
The presence of carbide in ductile iron is undesirable for a number of reasons:
It increases the tendency to form shrinkage porosity and thus increases the feeding requirements during casting.
It increases the risk of cracking during knockout and fettling.
It decreases the ductility of the iron.
It drastically reduces the impact resistance.
It increases hardness and reduces machinability.
It requires heat treatment to 900-920oC to remove the carbide.

International Journal of Engineering Research and General Science Volume 3, Issue 3, Part-2 , May-June, 2015 ISSN 2091-2730
408 www.ijergs.org
1.10 Effect of Elongation
Elongation is defined as the permanent increase in length, expressed as a percentage of a specified gage length marked in a tensile test bar, which is
produced when the bar is tested to failure. Elongation is used widely as the primary indication of tensile ductility and is included in many Ductile
Iron specifications. Although shown as the uniform elongation in figure 4.4, elongation also includes the localized deformation that occurs prior to
fracture. However, because the localized deformation occurs in a very limited part of the gage length, its contribution to the total elongation of a
correctly proportioned bar is very small. Brittle materials such as Gray Iron can fail in tension without any significant elongation, but ferrite Ductile
Irons can exhibit elongation of over 10 %
1.11 Effect of Hardness
The hardness of Ductile Iron is usually and best measured by the Brinell test, in which a 10 mm diameter hardened steel or tungsten carbide ball is
pressed into a flat surface of the work piece. Hardness is expressed as a Brinell Indentation Diameter (BID) or a Brinell Hardness Number (BHN).
Hardness may also be described as BHN/3000 to indicate the force applied to the ball is 3000 kg, the normal value for ferrous materials. The sizes of
the Brinell indentation, and its related volume of plastic deformation, are large relative to the scale of the microstructure and as a result an average
hardness is obtained which exhibits good reproducibility for similar microstructures. Brinell hardness is included in many Ductile Iron specifications.
Brinell hardness should be used for production control and as an auxiliary property test.
1.12 Literature review
Study about the defects, their causes and remedies in casting process showed the root causes of casting defects which helped to quality department
of different industries for finding roots and remedies of different defects. Different research papers were studied and casting defects, causes and their
remedies were listed. [7]
Variation in tensile properties and fracture properties for ductile cast iron by experiments and numerical analysis was studied. By fractrographic
analysis it was possible to establish a relation between elongation at fracture and size of slag defects. Relative contribution to the loss of ductility,
size of slag defects, perlitic contents, nodularity and changing graphite were demonstrated by deterministic models. [8]
Solidification rate greatly affect on the microstructure, quality and mechanical property. The rotational speed effect the solidification of liquid metal
during the centrifugal casting process. It was found that setting 800 RPM. Of die in centrifugal casting machine the metal poured was directly lifted
and rapid solidification took place and finer grain size can be achieved compare to 400 and 600 RPM of the die which improved the microstructure of
casting. This helped to achieve the best quality pipe. [9]
The design of easy locking and un-locking arrangement by using electromagnet lock plate to avoid the excess metal fly-out was found. The
productivity also increased by using the electromagnetic plate which minimizes dwell time. [10]
Investigation about the effect of electromagnetic force on the centrifugal force in centrifugal casting was done. It was found that under 0.15T
electromagnetic field intensity both absolute pressure of metal flow to mould wall and metal flow velocity on same location had some differences
between electromagnetic centrifugal casting and centrifugal casting. [11]
This paper talks about the Using the Taguchi method in centrifugal casting of 5500 alloys which specifies that number of experiments can be
minimized by using orthogonal array and optimum set of parameters can be analyzed. Also the significance of the parameters on the result can be
checked [14]
Also the discussion about the effect of mould wall thickness on the rate of solidification of centrifugal casting was investigated. Result of this paper
was as mould thickness increases, due to chilling effect solidification time decreased. Rapid solidification showed well distributed fine grains and
slow solidification showed coarse grains. [18]
International Journal of Engineering Research and General Science Volume 3, Issue 3, Part-2 , May-June, 2015 ISSN 2091-2730
409 www.ijergs.org
This paper talks about the Taguchi method in the optimization of injection moulding parameters for manufacturing products. Parameters can be
analyzed and optimized by Taguchi method also the predicted results can be verified by confirmation test.[20]
Discussion about modes and causes of gray cast iron pipes failures was investigated. Various failure causes were found. Also the causes of remedies
were predicted as per the failure modes. Also it was observed that failure was always unexpected and produces emergencies which were mostly
shown in medium and large diameter pipes. [24]
1.13 Problem Definition
Ductile iron pipes are most widely used for transportation of drinking and sewerage water. So it is the prime responsibility of the Industries to make
the defect-less ductile iron pipe for smooth and continuous transportation of water. If the quality of pipe is not maintained properly it will affect the
service and life of the pipe. Also the rejections level increases due to poor control of parameters which can affect the quality of the pipe. Quality of
the ductile iron pipe largely depends on the microstructure as well as the mechanical properties of the pipe. During the casting process of ductile iron
pipe if the parameters like pouring metal temperature, inoculation quantity and inlet water flow rate are analyzed and optimized properly, a better
quality pipe can be manufactured.
Analysis and optimization of parameters for casting ductile iron pipe is the study about the analysis and optimization of parameters like pouring
metal temperature, inoculation quantity and inlet cooling water flow rate by which a better quality pipe with improved microstructure and enhanced
mechanical properties can be produced. In this study how the grouping of different parameters like temperature range, inoculation quantity and inlet
water flow rate will affect on the microstructure (ferrite % and carbide %) and mechanical properties (Elongation %, and Hardness) are analyzed and
optimized by Design of Experiment Method. Taguchi based L16 orthogonal array was used for experimental purpose and analysis was carried out by
using Minitab 17 software. Also the ANOVA method is used to analyze the variance, significance of factors and interactions on microstructure and
mechanical properties.
This method will be beneficial because it will reduce many shop-floor trials. Also the result can be achieved within minimum time period.
Resources can be effectively saved by using this method and optimized parameters can be implemented.
Experimental Set-up
2.1 Introduction
Research on the centrifugal casting can be done for various sizes (DN 100 to 1000 mm) and classes (K9 & K7) of ductile iron pipe but here ductile
iron pipes of DN 450 K9 are considered for experimental analysis. The DISP plant of JINDAL SAW LTD. was producing casting of these pipes
during the time of dissertation work hence this size and class of the pipe was selected for convenience.
2.2 Experimental Set-up
International Journal of Engineering Research and General Science Volume 3, Issue 3, Part-2 , May-June, 2015 ISSN 2091-2730
410 www.ijergs.org
Figure 2.1: Experimental Set-up
As shown in figure 2.1, centrifugal casting machine is casting ductile iron pipe of DN 450 K9. The mould of DN 450 pipe is inserted inside the
CCM. Surrounding that mould rollers at 1200 are employed to provide the rotation motion of the mould during the casting process. Runners are
aligned properly before casting the pipe. Hopper is filled with liquid metal by pouring ladle and the pyrometer is used to measure the pouring metal
temperature. The rail-track is provided to move casting machine the casting machine longitudinally. Inlet and outlet cooling water pipes are provided
to cool the mould and solidify the pipe on the casing of the centrifugal casting. By using PLC (programmable logic control) most of the parameters
can be adjusted as per the requirement from operator’s Desk.
Table 2.1 Specification of parameters of centrifugal casting machine
Pipe Size
(in mm) Traverse Down Time
( in Seconds) Hopper Up-time
(in Seconds) Motor RPM
(Reference)
Minimum
Mould RPM
DN Min. Max. Min. Max. Min. Max.
100 14 18 45 75 800 950 700
150 15 20 45 75 800 900 650
200 16 20 45 75 800 850 525
250 17 21 45 75 800 925 425
300 17 21 45 75 750 900 375
350 18 22 45 75 700 850 300
400 18 22 45 75 700 850 300
450 19 25 35 65 550 750 225
500 20 26 35 65 500 700 200
600 22 28 50 80 500 700 200
700 23 29 30 50 500 700 175
750 24 30 30 50 550 750 150
800 25 31 30 50 550 750 140
900 26 32 30 50 700 900 125
1000 27 33 35 55 700 900 125
2.3 Experimental procedure
In the experimental procedure, first the diameter and class of the pipe is selected by using PLC from Operator’s Desk. All the other fixed parameters
are set which would not vary during the experiments. Liquid metal as per the required quantity which depends on the size and class of the pipe was
filled into the hopper. The temperature of the Poring liquid metal is measured by pyrometer.
Figure: 2.2 Temperature measurements by pyrometer
International Journal of Engineering Research and General Science Volume 3, Issue 3, Part-2 , May-June, 2015 ISSN 2091-2730
411 www.ijergs.org
Now the CCM was moved longitudinally to the hopper end by operating. Mould was rotated at full RPM before starting throe casting process.
Hopper is tilted as per the require amount from where the liquid metal gets inside the open section of runner and from runner to the socket end of the
rotating mould. Inoculation is added by inoculants pipe on the metal stream by controlling the flow rate of inoculation from operator’s desk. Cooling
water is continuously supplied from inlet cooling water pipe to the surrounding of the rotating.
Figure: 2.3 casting of pipe
After casting the pipe it was passing through the annealing furnace for heat treatment process. In this section the speed of annealing is maintained
constant that it will not affect the quality of the pipe. After heat treatment a part of the pipe is analyzed from different equipments like microscope,
Brinell hardness machine for examine the microstructure as well as the mechanical properties of the pipe.
2.4 Experimental Results
Table 2.2: Analysis of Microstructure from orthogonal array
Exp. No. Pouring
Temp. (0C)
Inoculation
quantity (%)
Inlet water flow
rate (m³/Hr)
Ferrite
(%)
Carbide
(%)
1 1280-1310 0.15 100 85 13
2 1280-1310 0.20 120 90 10
3 1280-1310 0.25 140 92 8
4 1280-1310 0.30 160 94 6
5 1310-1340 0.15 120 89 11
6 1310-1340 0.20 100 92 8
7 1310-1340 0.25 160 94 6
8 1310-1340 0.30 140 96 4
9 1340-1370 0.15 140 90 10
10 1340-1370 0.20 160 94 6
11 1340-1370 0.25 100 96 4
12 1340-1370 0.30 120 98 2
13 1370-1400 0.15 160 85 13
14 1370-1400 0.20 140 90 10
15 1370-1400 0.25 120 94 6
16 1370-1400 0.30 100 96 4
International Journal of Engineering Research and General Science Volume 3, Issue 3, Part-2 , May-June, 2015 ISSN 2091-2730
412 www.ijergs.org
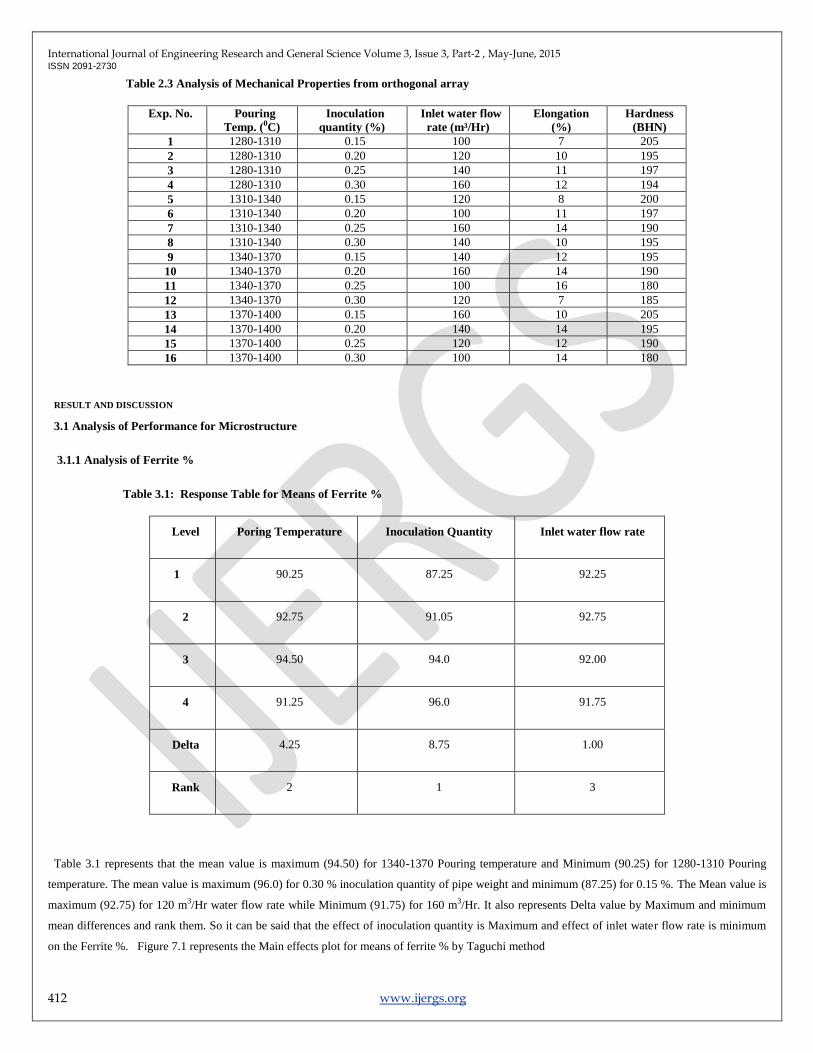
Table 2.3 Analysis of Mechanical Properties from orthogonal array
Exp. No. Pouring
Temp. (0C)
Inoculation
quantity (%)
Inlet water flow
rate (m³/Hr)
Elongation
(%)
Hardness
(BHN)
1 1280-1310 0.15 100 7 205
2 1280-1310 0.20 120 10 195
3 1280-1310 0.25 140 11 197
4 1280-1310 0.30 160 12 194
5 1310-1340 0.15 120 8 200
6 1310-1340 0.20 100 11 197
7 1310-1340 0.25 160 14 190
8 1310-1340 0.30 140 10 195
9 1340-1370 0.15 140 12 195
10 1340-1370 0.20 160 14 190
11 1340-1370 0.25 100 16 180
12 1340-1370 0.30 120 7 185
13 1370-1400 0.15 160 10 205
14 1370-1400 0.20 140 14 195
15 1370-1400 0.25 120 12 190
16 1370-1400 0.30 100 14 180
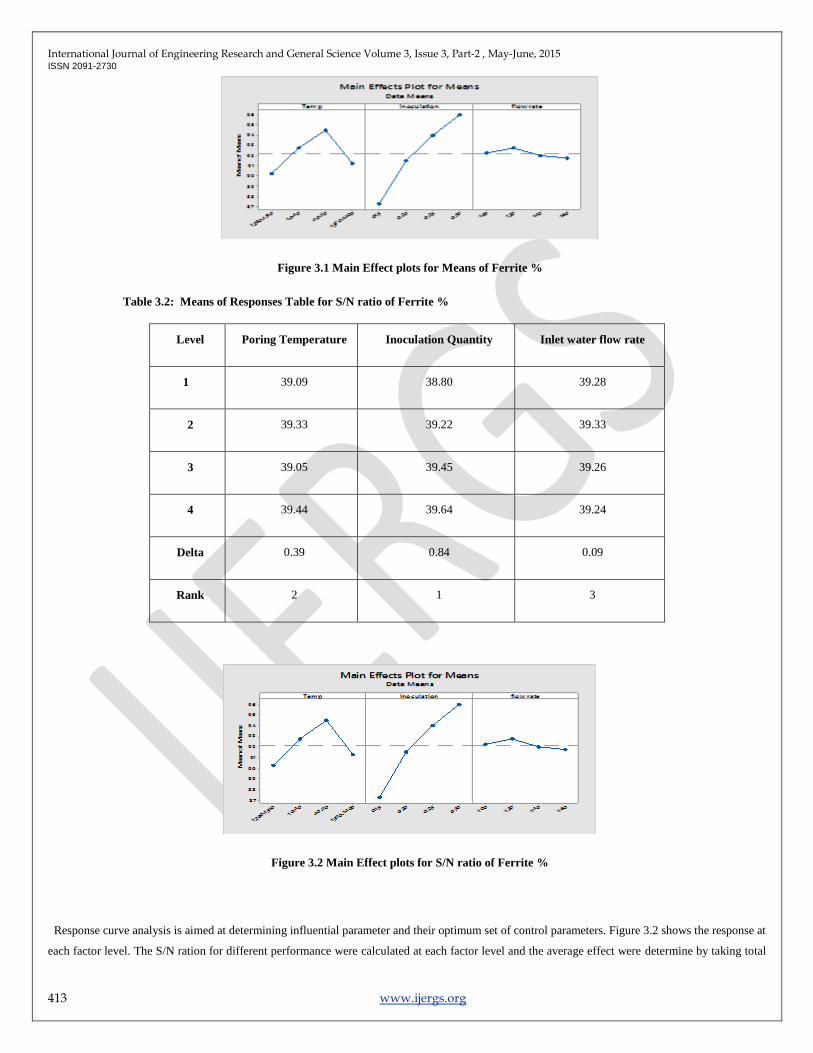
RESULT AND DISCUSSION
3.1 Analysis of Performance for Microstructure
3.1.1 Analysis of Ferrite %
Table 3.1: Response Table for Means of Ferrite %
Level Poring Temperature Inoculation Quantity Inlet water flow rate
1 90.25 87.25 92.25
2 92.75 91.05 92.75
3 94.50 94.0 92.00
4 91.25 96.0 91.75
Delta 4.25 8.75 1.00
Rank 2 1 3
Table 3.1 represents that the mean value is maximum (94.50) for 1340-1370 Pouring temperature and Minimum (90.25) for 1280-1310 Pouring
temperature. The mean value is maximum (96.0) for 0.30 % inoculation quantity of pipe weight and minimum (87.25) for 0.15 %. The Mean value is
maximum (92.75) for 120 m3/Hr water flow rate while Minimum (91.75) for 160 m3/Hr. It also represents Delta value by Maximum and minimum
mean differences and rank them. So it can be said that the effect of inoculation quantity is Maximum and effect of inlet water flow rate is minimum
on the Ferrite %. Figure 7.1 represents the Main effects plot for means of ferrite % by Taguchi method
International Journal of Engineering Research and General Science Volume 3, Issue 3, Part-2 , May-June, 2015 ISSN 2091-2730
413 www.ijergs.org
Figure 3.1 Main Effect plots for Means of Ferrite %
Table 3.2: Means of Responses Table for S/N ratio of Ferrite %
Level Poring Temperature Inoculation Quantity Inlet water flow rate
1 39.09 38.80 39.28
2 39.33 39.22 39.33
3 39.05 39.45 39.26
4 39.44 39.64 39.24
Delta 0.39 0.84 0.09
Rank 2 1 3
Figure 3.2 Main Effect plots for S/N ratio of Ferrite %
Response curve analysis is aimed at determining influential parameter and their optimum set of control parameters. Figure 3.2 shows the response at
each factor level. The S/N ration for different performance were calculated at each factor level and the average effect were determine by taking total
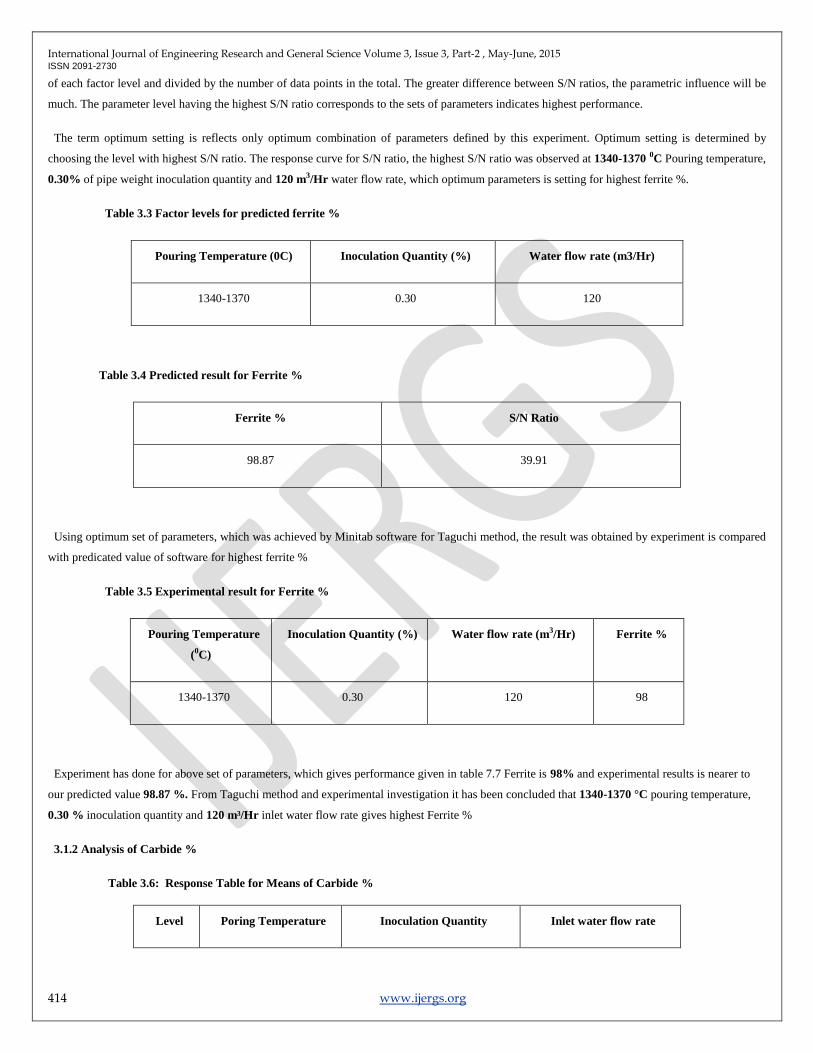
International Journal of Engineering Research and General Science Volume 3, Issue 3, Part-2 , May-June, 2015 ISSN 2091-2730
414 www.ijergs.org
of each factor level and divided by the number of data points in the total. The greater difference between S/N ratios, the parametric influence will be
much. The parameter level having the highest S/N ratio corresponds to the sets of parameters indicates highest performance.
The term optimum setting is reflects only optimum combination of parameters defined by this experiment. Optimum setting is determined by
choosing the level with highest S/N ratio. The response curve for S/N ratio, the highest S/N ratio was observed at 1340-1370 0C Pouring temperature,
0.30% of pipe weight inoculation quantity and 120 m3/Hr water flow rate, which optimum parameters is setting for highest ferrite %.
Table 3.3 Factor levels for predicted ferrite %
Pouring Temperature (0C) Inoculation Quantity (%) Water flow rate (m3/Hr)
1340-1370 0.30 120
Table 3.4 Predicted result for Ferrite %
Ferrite % S/N Ratio
98.87 39.91
Using optimum set of parameters, which was achieved by Minitab software for Taguchi method, the result was obtained by experiment is compared
with predicated value of software for highest ferrite %
Table 3.5 Experimental result for Ferrite %
Pouring Temperature
(0C)
Inoculation Quantity (%) Water flow rate (m3/Hr) Ferrite %
1340-1370 0.30 120 98
Experiment has done for above set of parameters, which gives performance given in table 7.7 Ferrite is 98% and experimental results is nearer to
our predicted value 98.87 %. From Taguchi method and experimental investigation it has been concluded that 1340-1370 °C pouring temperature,
0.30 % inoculation quantity and 120 m³/Hr inlet water flow rate gives highest Ferrite %
3.1.2 Analysis of Carbide %
Table 3.6: Response Table for Means of Carbide %
Level Poring Temperature Inoculation Quantity Inlet water flow rate
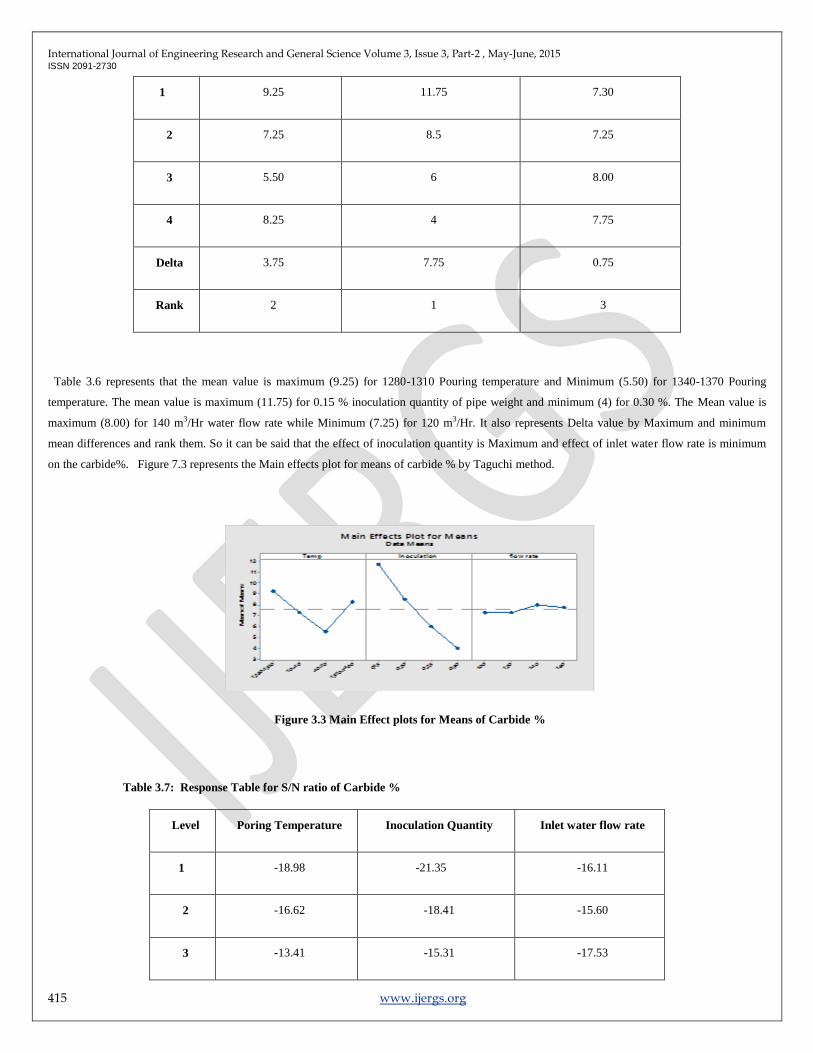
International Journal of Engineering Research and General Science Volume 3, Issue 3, Part-2 , May-June, 2015 ISSN 2091-2730
415 www.ijergs.org
1 9.25 11.75 7.30
2 7.25 8.5 7.25
3 5.50 6 8.00
4 8.25 4 7.75
Delta 3.75 7.75 0.75
Rank 2 1 3
Table 3.6 represents that the mean value is maximum (9.25) for 1280-1310 Pouring temperature and Minimum (5.50) for 1340-1370 Pouring
temperature. The mean value is maximum (11.75) for 0.15 % inoculation quantity of pipe weight and minimum (4) for 0.30 %. The Mean value is
maximum (8.00) for 140 m3/Hr water flow rate while Minimum (7.25) for 120 m3/Hr. It also represents Delta value by Maximum and minimum
mean differences and rank them. So it can be said that the effect of inoculation quantity is Maximum and effect of inlet water flow rate is minimum
on the carbide%. Figure 7.3 represents the Main effects plot for means of carbide % by Taguchi method.
Figure 3.3 Main Effect plots for Means of Carbide %
Table 3.7: Response Table for S/N ratio of Carbide %
Level Poring Temperature Inoculation Quantity Inlet water flow rate
1 -18.98 -21.35 -16.11
2 -16.62 -18.41 -15.60
3 -13.41 -15.31 -17.53
International Journal of Engineering Research and General Science Volume 3, Issue 3, Part-2 , May-June, 2015 ISSN 2091-2730
416 www.ijergs.org
4 -17.47 -11.42 -17.24
Delta 5.57 9.93 1.92
Rank 2 1 3
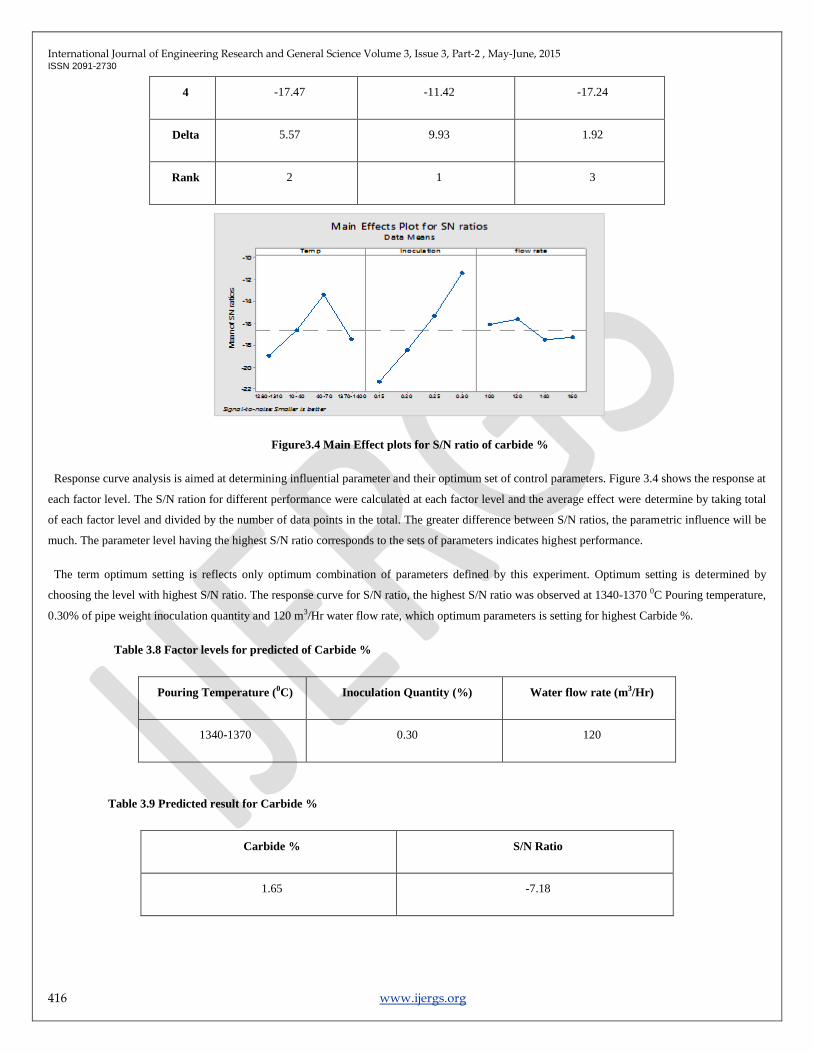
Figure3.4 Main Effect plots for S/N ratio of carbide %
Response curve analysis is aimed at determining influential parameter and their optimum set of control parameters. Figure 3.4 shows the response at
each factor level. The S/N ration for different performance were calculated at each factor level and the average effect were determine by taking total
of each factor level and divided by the number of data points in the total. The greater difference between S/N ratios, the parametric influence will be
much. The parameter level having the highest S/N ratio corresponds to the sets of parameters indicates highest performance.
The term optimum setting is reflects only optimum combination of parameters defined by this experiment. Optimum setting is determined by
choosing the level with highest S/N ratio. The response curve for S/N ratio, the highest S/N ratio was observed at 1340-1370 0C Pouring temperature,
0.30% of pipe weight inoculation quantity and 120 m3/Hr water flow rate, which optimum parameters is setting for highest Carbide %.
Table 3.8 Factor levels for predicted of Carbide %
Pouring Temperature (0C) Inoculation Quantity (%) Water flow rate (m3/Hr)
1340-1370 0.30 120
Table 3.9 Predicted result for Carbide %
Carbide % S/N Ratio
1.65 -7.18
International Journal of Engineering Research and General Science Volume 3, Issue 3, Part-2 , May-June, 2015 ISSN 2091-2730
417 www.ijergs.org
Using optimum set of parameters, which was achieved by Minitab software for Taguchi method, the result was obtained by experiment is compared
with predicated value of software for Lowest Carbide %
Table 3.10 Experimental result for Carbide %
Pouring
Temperature (0C)
Inoculation Quantity (%) Water flow rate (m3/Hr) Carbide %
1340-1370 0.30 120 2.0
Experiment has done for above set of parameters, which gives performance given in table 7.12 Carbide is 2.0 % and experimental results is nearer
to our predicted value 1.65 %. From Taguchi method and experimental investigation it has been concluded that 1340-1370 °C pouring temperature,
0.30 % inoculation quantity and 120 m³/Hr inlet water flow rate gives Lowest Carbide %
3.2 Analysis of Performance for Mechanical Properties
3.2.1 Analysis of Elongation %
Table 3.11: Response Table for Means of Elongation %
Level Poring Temperature Inoculation Quantity Inlet water flow rate
1 10.00 9.25 12.0
2 10.75 12.25 9.25
3 12.25 13.25 11.75
4 12.50 10.75 12.50
Delta 2.5 4.0 3.25
Rank 3 1 2
Table 3.11 represents that the mean value is maximum (12.50) for 1370-1400 Pouring temperature and Minimum (10.00) for 1280-1310 Pouring
temperature. The mean value is maximum (13.25) for 0.25 % inoculation quantity of pipe weight and minimum (9.25) for 0.15 %. The Mean value is
maximum (12.50) for 160 m3/Hr water flow rate while Minimum (9.25) for 120 m3/Hr. It also represents Delta value by Maximum and minimum
mean differences and rank them. So it can be said that the effect of inoculation quantity is Maximum and effect of pouring temperature is minimum
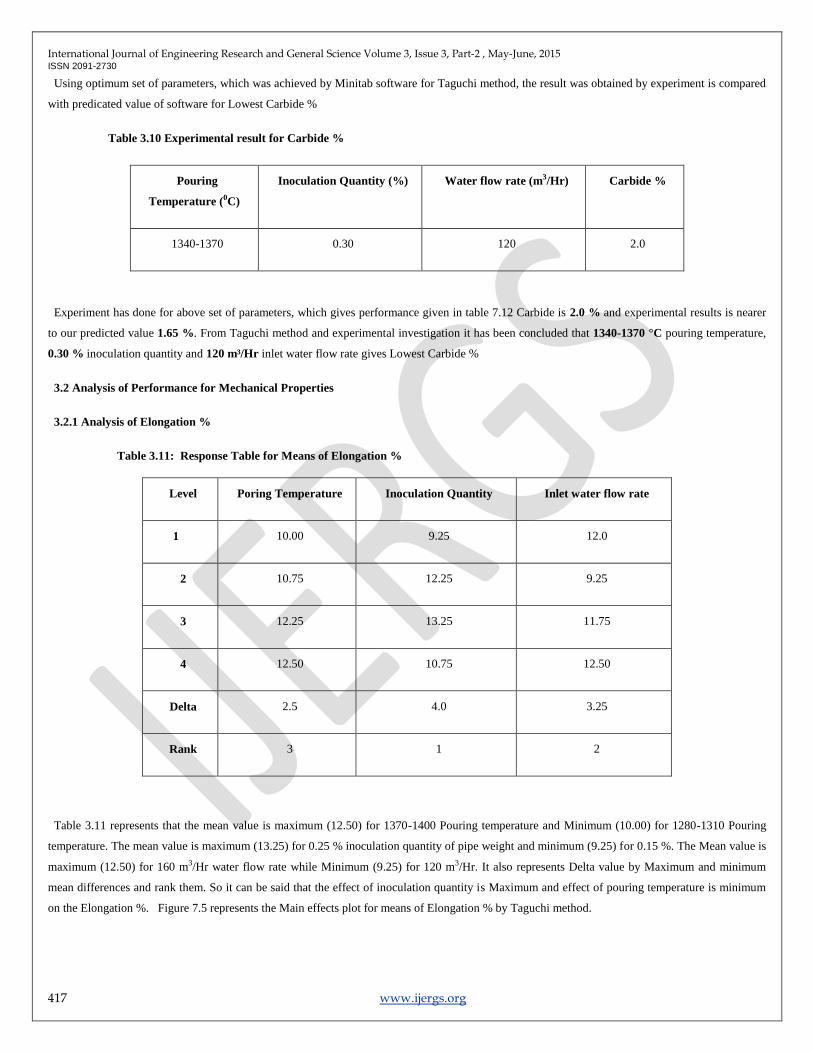
on the Elongation %. Figure 7.5 represents the Main effects plot for means of Elongation % by Taguchi method.
International Journal of Engineering Research and General Science Volume 3, Issue 3, Part-2 , May-June, 2015 ISSN 2091-2730
418 www.ijergs.org
Figure 3.5 Main Effect plots for Means of Elongation %
Table 3.12: Response Table for S/N ratio of Elongation %
Level Poring Temperature Inoculation Quantity Inlet water flow rate
1 19.83 19.14 21.18
2 20.45 21.67 19.14
3 21.37 22.35 21.33
4 21.86 20.35 21.86
Delta 2.03 3.22 2.72
Rank 2 1 3
Figure 3.6 Main Effect plots for S/N ratio of Elongation %
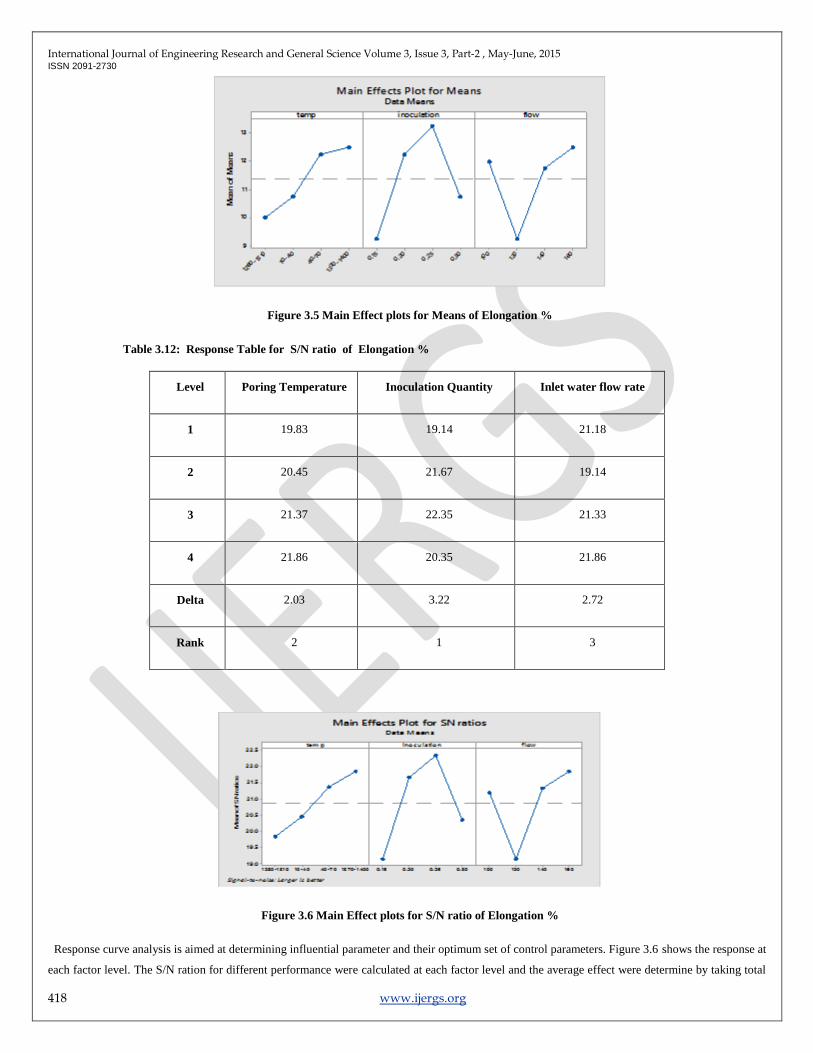
Response curve analysis is aimed at determining influential parameter and their optimum set of control parameters. Figure 3.6 shows the response at
each factor level. The S/N ration for different performance were calculated at each factor level and the average effect were determine by taking total
International Journal of Engineering Research and General Science Volume 3, Issue 3, Part-2 , May-June, 2015 ISSN 2091-2730
419 www.ijergs.org
of each factor level and divided by the number of data points in the total. The greater difference between S/N ratios, the parametric influence will be
much. The parameter level having the highest S/N ratio corresponds to the sets of parameters indicates highest performance.
The term optimum setting is reflects only optimum combination of parameters defined by this experiment. Optimum setting is determined by
choosing the level with highest S/N ratio. The response curve for S/N ratio, the highest S/N ratio was observed at 1370-1400 0C Pouring temperature,
0.25% of pipe weight inoculation quantity and 160 m3/Hr water flow rate, which optimum parameters is setting for highest Elongation %.
Table 3.13 Factor levels for predicted of Elongation %
Pouring Temperature (0C) Inoculation Quantity (%) Water flow rate (m3/Hr)
1370-1400 0.25 160
Table 3.14 Predicted result for Elongation %
Elongation % S/N Ratio
15.5 24.31
Using optimum set of parameters, which was achieved by Minitab software for Taguchi method, the result was obtained by experiment is compared
with predicated value of software for highest Elongation %
Table 3.15 Experimental result for Elongation %
Pouring
Temperature (0C)
Inoculation Quantity (%) Water flow rate (m3/Hr) Elongation %
1370-1400 0.25 160 15
Experiment has done for above set of parameters, which gives performance given in Table 3.15 Elongation is 15% and experimental results is
nearer to our predicted value 15.5 %. From Taguchi method and experimental investigation it has been concluded that 1370-1400 °C pouring
temperature, 0.25 % inoculation quantity and 160 m³/Hr inlet water flow rate gives highest Elongation %
3.2.2 Analysis of Hardness (BHN)
Table 3.16: Response Table for Means of Hardness
Level Poring Temperature Inoculation Quantity Inlet water flow rate
1 197.8 201.3 190.5
International Journal of Engineering Research and General Science Volume 3, Issue 3, Part-2 , May-June, 2015 ISSN 2091-2730
420 www.ijergs.org
2 195.5 194.3 192.5
3 187.5 189.3 195.5
4 192.5 188.5 194.8
Delta 10.3 12.8 5.0
Rank 2 1 3
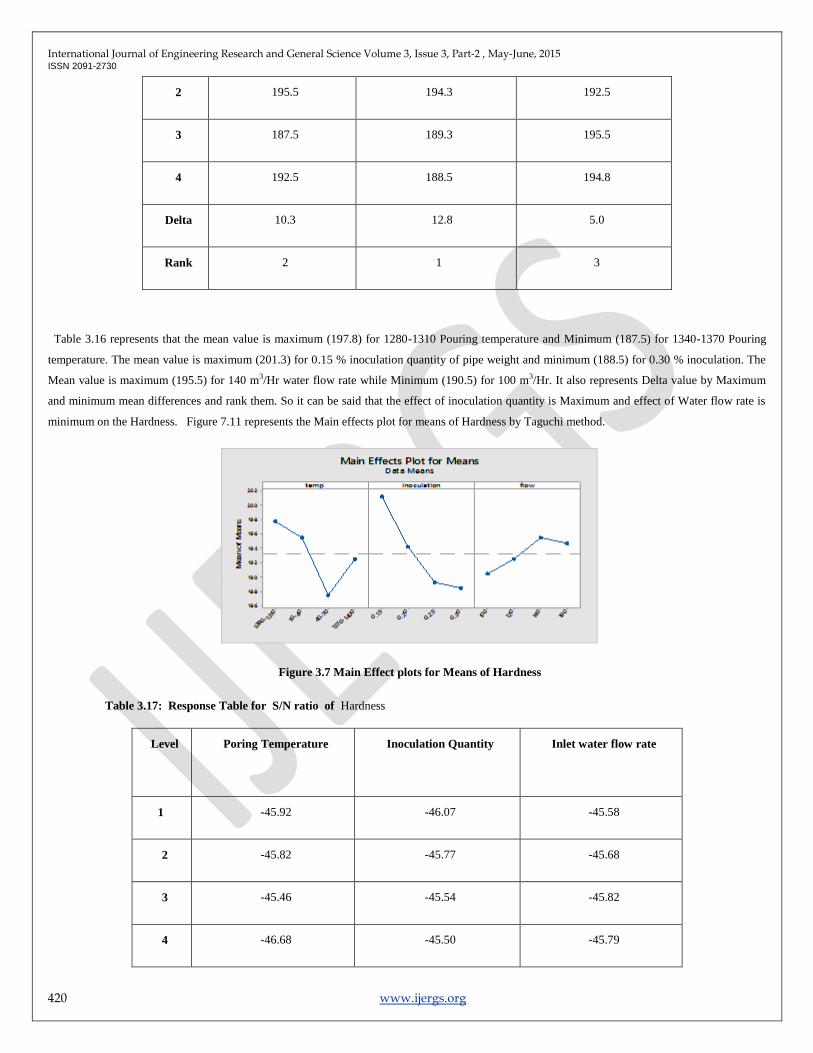
Table 3.16 represents that the mean value is maximum (197.8) for 1280-1310 Pouring temperature and Minimum (187.5) for 1340-1370 Pouring
temperature. The mean value is maximum (201.3) for 0.15 % inoculation quantity of pipe weight and minimum (188.5) for 0.30 % inoculation. The
Mean value is maximum (195.5) for 140 m3/Hr water flow rate while Minimum (190.5) for 100 m3/Hr. It also represents Delta value by Maximum
and minimum mean differences and rank them. So it can be said that the effect of inoculation quantity is Maximum and effect of Water flow rate is
minimum on the Hardness. Figure 7.11 represents the Main effects plot for means of Hardness by Taguchi method.
Figure 3.7 Main Effect plots for Means of Hardness
Table 3.17: Response Table for S/N ratio of Hardness
Level Poring Temperature Inoculation Quantity Inlet water flow rate
1 -45.92 -46.07 -45.58
2 -45.82 -45.77 -45.68
3 -45.46 -45.54 -45.82
4 -46.68 -45.50 -45.79

International Journal of Engineering Research and General Science Volume 3, Issue 3, Part-2 , May-June, 2015 ISSN 2091-2730
421 www.ijergs.org
Delta 0.46 0.57 0.24
Rank 2 1 3
Figure 3.8 Main Effect plots for S/N ratio of Hardness
Response curve analysis is aimed at determining influential parameter and their optimum set of control parameters. Figure 3.8 shows the response at
each factor level. The S/N ration for different performance were calculated at each factor level and the average effect were determine by taking total
of each factor level and divided by the number of data points in the total. The greater difference between S/N ratios, the parametric influence will be
much. The parameter level having the highest S/N ratio corresponds to the sets of parameters indicates highest performance.
The term optimum setting is reflects only optimum combination of parameters defined by this experiment. Optimum setting is determined by
choosing the level with highest S/N ratio. The response curve for S/N ratio, the highest S/N ratio was observed at 1340-13700C Pouring temperature,
0.30% of pipe weight inoculation quantity and 100 m3/Hr water flow rate, which optimum parameters is setting for Lowest Hardness.
Table 3.18 Factor levels for predicted of Hardness
Pouring Temperature (0C) Inoculation Quantity (%) Water flow rate (m3/Hr)
1340-1370 0.30 100
Table 3.19 Predicted result for Hardness
Hardness (BHN) S/N Ratio
International Journal of Engineering Research and General Science Volume 3, Issue 3, Part-2 , May-June, 2015 ISSN 2091-2730
422 www.ijergs.org
179.875 -45.10
Using optimum set of parameters, which was achieved by Minitab software for Taguchi method, the result was obtained by experiment is compared
with predicated value of software for Lowest Hardness
Table 3.20 Experimental result for Hardness
Pouring Temperature
(0C)
Inoculation Quantity
(%)
Water flow rate (m3/Hr) Hardness
(BHN)
1340-1370 0.30 100 180
Experiment has done for above set of parameters, which gives performance given in table 7.22 Hardness is 180 BHN and experimental results is
nearer to our predicted value 79.875 From Taguchi method and experimental investigation it has been concluded that 1340-1370 °C pouring
temperature, 0.30 % inoculation quantity and 100 m³/Hr inlet water flow rate gives Lowest Hardness
3.3 ANOVA Results for microstructure
Since as already stated ANOVA help us to identify which parameter is important for us after literature review following ANOVA table is obtained
for Ferrite % and Carbide %. Minitab 17 software is used for statistical calculation purpose
Table 3.21 ANOVA Results for Ferrite %
Parameters DF Adj SS Adj MS F Value P Value
Regression 7 207.86 29.694 22.45 0.000
Pouring Temperature(°C) 1 10.64 10.635 8.04 0.022
Inoculation (%) 1 10.85 10.850 8.20 0.021
Water flow rate (m³/Hr)
1 12.98 12.979 9.81 0.014
Temperature*Inoculation
1 10.48 10.477 7.92 0.023
Temperature*Flow Rate
1 12.80 12.804 9.68 0.014
Inoculation*Flow Rate
1 12022 12.217 9.24 0.016
Temp.*Inoculation*Flow rate
1 12.02 12.021 9.09 0.017
Error
8 10.58 1.323
Total
15 218.44
International Journal of Engineering Research and General Science Volume 3, Issue 3, Part-2 , May-June, 2015 ISSN 2091-2730
423 www.ijergs.org
Table 3.21 shows the Analysis of Variance (ANOVA) by Regression method for Ferrite % response. ANOVA table shows the amount of variation
in response data. The important information can be obtained here is the P- value which shows the significance level of the individual as well as
interactive parameters. P value less than 0.0500 indicate model terms are significant. P- Value for regression 0.000 indicating that regression model
is significant. The co-efficient of determination indicates the goodness of the fit for the model, so the percentage value of this regression model is
95.15 % which indicates the highly significance of the model.
Figure 3.9: Analysis of Main Effect on Ferrite % Figure3.10: Analysis of Interaction Effect on Ferrite %
Main effect plot is most useful when we have select more variables. We can compare the change in level means to see which categorical variable
influence the Response the most. A main effect is present when mean of the responses changes at different levels of variable. By comparing the graph
shows that Ferrite % is higher at 1240° C Temperature, 0.30 % inoculation quantity and 100 m³/Hr water flow rate. The Magnitude of the main
effect for inoculation quantity is higher than other variable.
In interaction effect if the lines are parallel than there is no interaction between factors. If the greater the lines depart from being parallel, the
greater the strength of interaction. Factorial plots do not use the data from the worksheet instead Minitab estimates the fitted means based on a stored
model. In the interaction graph the Temperature and inoculation, neither of both panels interact with each-other, while in Temperature and flow rate
and inoculation and flow rate both of these interactions indicates that variables interact with each other.
Table 3.22 ANOVA Results for Carbide %
Parameters DF Adj SS Adj MS F Value P Value
Regression 7 163.614 23.373 43.25 0.000
Pouring Temperature(°C) 1 10.604 10.604 19.62 0.002
Inoculation (%) 1 10.895 10.894 20.16 0.002
Water flow rate (m³/Hr)
1 11.862 11.8619 21.95 0.002
Temperature*Inoculation
1 10.555 10.5550 19.53 0.002
Temperature*Flow Rate
1 11.699 11.6991 21.65 0.002
Inoculation*Flow Rate
1 11.396 11.3958 21.09 0.002
Temp.*Inoculation*Flow rate
1 11.212 11.2125 20.75 0.002
Error
8 4.324 0.5404
Total
15 167.938
128012601240
97
96
95
94
93
92
91
90
89
88
0.320.240.16 150125100
Temp
Mea
n of
fer
rite
Inoculation Flow rate
Main Effects Plot for ferriteFitted Means
International Journal of Engineering Research and General Science Volume 3, Issue 3, Part-2 , May-June, 2015 ISSN 2091-2730
424 www.ijergs.org
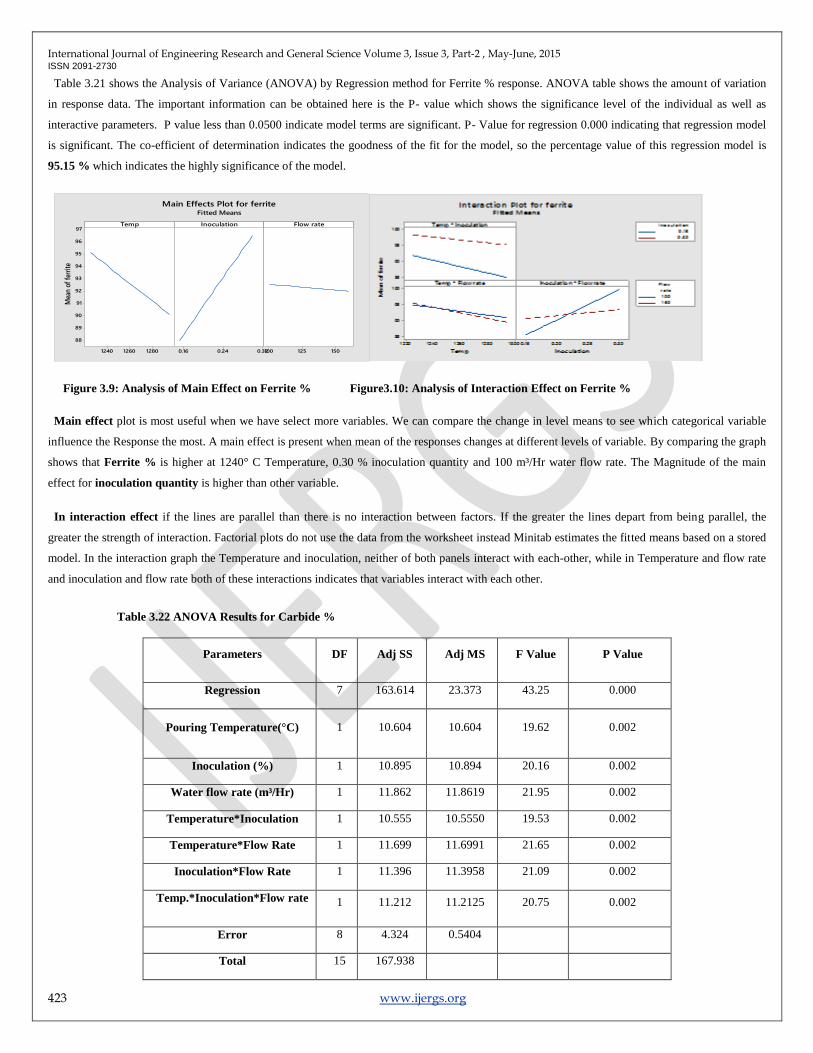
Table 3.22 shows the Analysis of Variance (ANOVA) by Regression method for Carbide % response. The important information can be obtained
here is the P- value which shows the significance level of the individual as well as interactive parameters. P value less than 0.0500 indicate
model terms are significant. P- Value for regression 0.000 indicating that regression model is significant. The co-efficient of determination indicates
the goodness of the fit for the model, so the percentage value of this regression model is 97.43 % which indicates the highly significance of the
model.
Figure 3.11: Analysis of Main Effect on Carbide % Figure 3.12: Analysis of Interaction Effect of on Carbide %
Main effect plot is most useful when we have select more variables. We can compare the change in level means to see which categorical variable
influence the Response the most. A main effect is present when mean of the responses changes at different levels of variable. By comparing the graph
shows that Carbide % is lower at 1240° C Temperature, 0.16 % inoculation quantity and 150 m³/Hr water flow rate. The Magnitude of the main
effect for inoculation quantity is higher than other variable.
In interaction Effect if the lines are parallel than there is no interaction between factors. If the greater the lines depart from being parallel, the
greater the strength of interaction. Factorial plots do not use the data from the worksheet instead Minitab estimates the fitted means based on a stored
model. In the interaction graph the Temperature and inoculation, neither of both panels interact with each-other, while in Temperature and flow rate
and inoculation and flow rate both of these interactions indicates that variables interact with each other.
3.4 ANOVA Results for Mechanical properties
ANOVA help us to identify which parameter is important for us after literature review following ANOVA table is obtained for Hardness and
Carbide %. Minitab 17 software is used for statistical calculation purpose.
Table 3.23 ANOVA Results for Hardness
Parameters DF Adj SS Adj MS F Value P Value
Regression 7 672.36 96.05 5.45 0.015
Pouring Temperature(°C) 1 52.96 52.96 3.00 0.121
Inoculation (%) 1 25.79 25.79 1.46 0.261
Water flow rate (m³/Hr)
1 74.44 74.44 4.22 0.049
Temperature*Inoculation
1 23.63 23.63 1.34 0.280
Temperature*Flow Rate
1 75.60 75.60 4.32 0.048
128012601240
12
11
10
9
8
7
6
5
4
3
0.320.240.16 150125100
Temp
Mea
n o
f ca
rbid
e
Inoculation Flow rate
Main Effects Plot for carbideFitted Means
International Journal of Engineering Research and General Science Volume 3, Issue 3, Part-2 , May-June, 2015 ISSN 2091-2730
425 www.ijergs.org
Inoculation*Flow Rate
1 40.87 40.87 2.32 0.166
Temp.*Inoculation*Flow rate
1 38.52 0.178 2.18 0.178
Error
8 141.08 17.63
Total
15 813.44
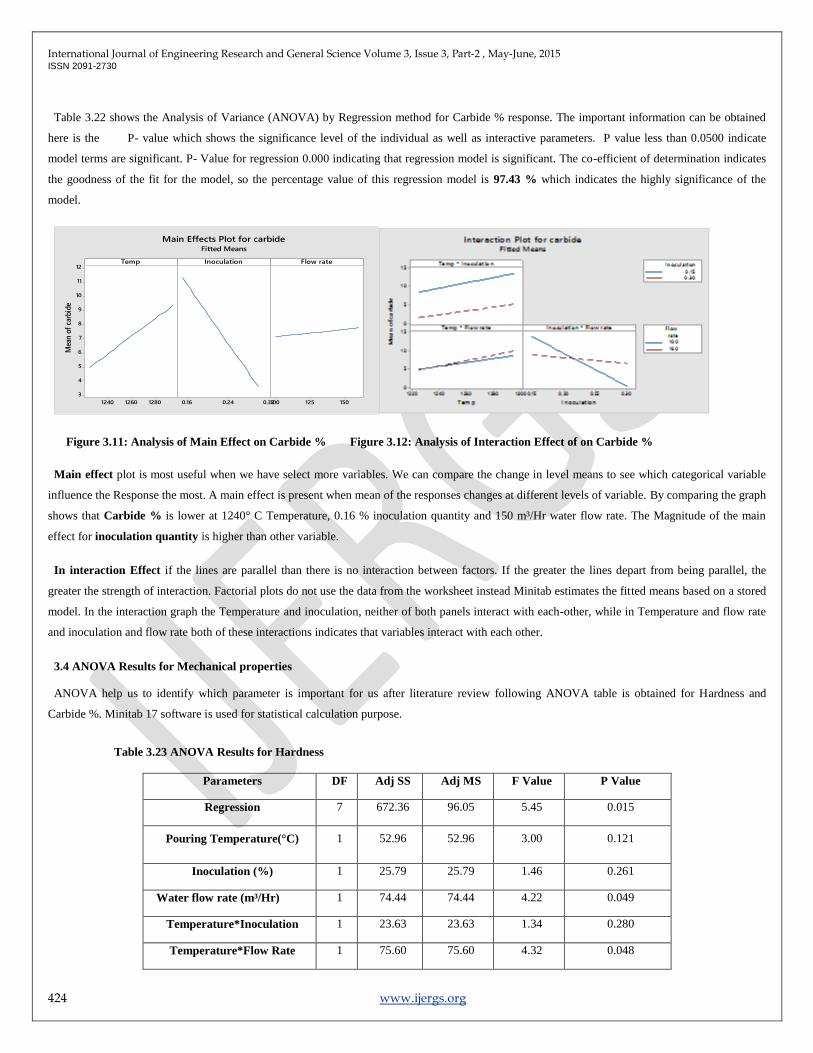
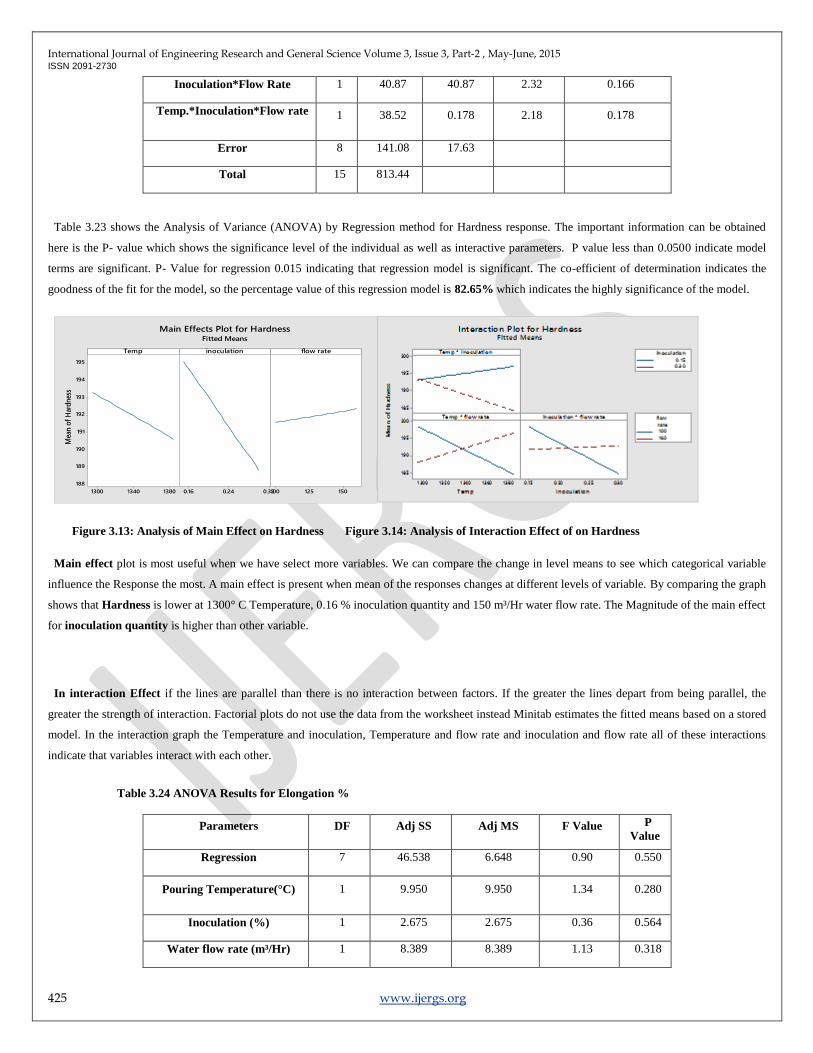
Table 3.23 shows the Analysis of Variance (ANOVA) by Regression method for Hardness response. The important information can be obtained
here is the P- value which shows the significance level of the individual as well as interactive parameters. P value less than 0.0500 indicate model
terms are significant. P- Value for regression 0.015 indicating that regression model is significant. The co-efficient of determination indicates the
goodness of the fit for the model, so the percentage value of this regression model is 82.65% which indicates the highly significance of the model.
Figure 3.13: Analysis of Main Effect on Hardness Figure 3.14: Analysis of Interaction Effect of on Hardness
Main effect plot is most useful when we have select more variables. We can compare the change in level means to see which categorical variable
influence the Response the most. A main effect is present when mean of the responses changes at different levels of variable. By comparing the graph
shows that Hardness is lower at 1300° C Temperature, 0.16 % inoculation quantity and 150 m³/Hr water flow rate. The Magnitude of the main effect
for inoculation quantity is higher than other variable.
In interaction Effect if the lines are parallel than there is no interaction between factors. If the greater the lines depart from being parallel, the
greater the strength of interaction. Factorial plots do not use the data from the worksheet instead Minitab estimates the fitted means based on a stored
model. In the interaction graph the Temperature and inoculation, Temperature and flow rate and inoculation and flow rate all of these interactions
indicate that variables interact with each other.
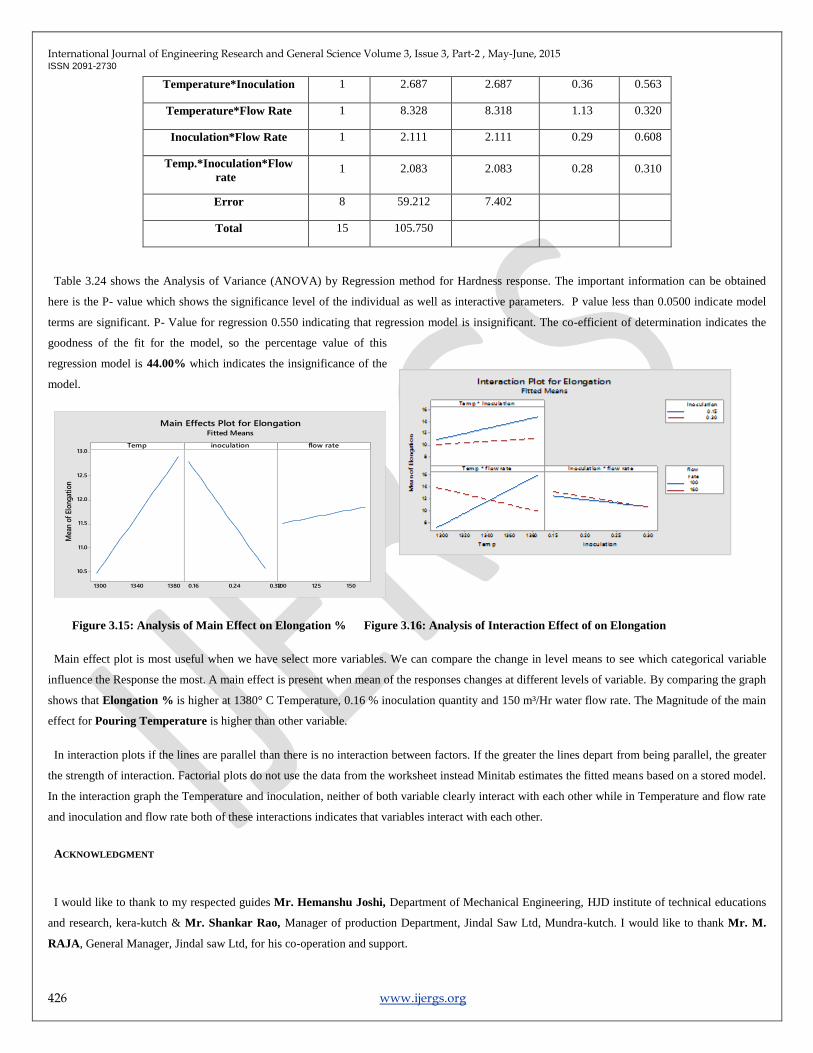
Table 3.24 ANOVA Results for Elongation %
Parameters DF Adj SS Adj MS F Value P
Value
Regression 7 46.538 6.648 0.90 0.550
Pouring Temperature(°C) 1 9.950 9.950 1.34 0.280
Inoculation (%) 1 2.675 2.675 0.36 0.564
Water flow rate (m³/Hr)
1 8.389 8.389 1.13 0.318
138013401300
195
194
193
192
191
190
189
188
0.320.240.16 150125100
Temp
Mea
n o
f H
ard
nes
s
inoculation flow rate
Main Effects Plot for HardnessFitted Means
International Journal of Engineering Research and General Science Volume 3, Issue 3, Part-2 , May-June, 2015 ISSN 2091-2730
426 www.ijergs.org
Temperature*Inoculation
1 2.687 2.687 0.36 0.563
Temperature*Flow Rate
1 8.328 8.318 1.13 0.320
Inoculation*Flow Rate
1 2.111 2.111 0.29 0.608
Temp.*Inoculation*Flow
rate
1 2.083 2.083 0.28 0.310
Error
8 59.212 7.402
Total
15 105.750
Table 3.24 shows the Analysis of Variance (ANOVA) by Regression method for Hardness response. The important information can be obtained
here is the P- value which shows the significance level of the individual as well as interactive parameters. P value less than 0.0500 indicate model
terms are significant. P- Value for regression 0.550 indicating that regression model is insignificant. The co-efficient of determination indicates the
goodness of the fit for the model, so the percentage value of this
regression model is 44.00% which indicates the insignificance of the
model.
Figure 3.15: Analysis of Main Effect on Elongation % Figure 3.16: Analysis of Interaction Effect of on Elongation
Main effect plot is most useful when we have select more variables. We can compare the change in level means to see which categorical variable
influence the Response the most. A main effect is present when mean of the responses changes at different levels of variable. By comparing the graph
shows that Elongation % is higher at 1380° C Temperature, 0.16 % inoculation quantity and 150 m³/Hr water flow rate. The Magnitude of the main
effect for Pouring Temperature is higher than other variable.
In interaction plots if the lines are parallel than there is no interaction between factors. If the greater the lines depart from being parallel, the greater
the strength of interaction. Factorial plots do not use the data from the worksheet instead Minitab estimates the fitted means based on a stored model.
In the interaction graph the Temperature and inoculation, neither of both variable clearly interact with each other while in Temperature and flow rate
and inoculation and flow rate both of these interactions indicates that variables interact with each other.
ACKNOWLEDGMENT
I would like to thank to my respected guides Mr. Hemanshu Joshi, Department of Mechanical Engineering, HJD institute of technical educations
and research, kera-kutch & Mr. Shankar Rao, Manager of production Department, Jindal Saw Ltd, Mundra-kutch. I would like to thank Mr. M.
RAJA, General Manager, Jindal saw Ltd, for his co-operation and support.
138013401300
13.0
12.5
12.0
11.5
11.0
10.5
0.320.240.16 150125100
Temp
Mea
n o
f El
on
gat
ion
inoculation flow rate
Main Effects Plot for ElongationFitted Means
International Journal of Engineering Research and General Science Volume 3, Issue 3, Part-2 , May-June, 2015 ISSN 2091-2730
427 www.ijergs.org
I would also like to thank Mr. N.J. Patel, Head of the Mechanical Engineering department who has always been ready to offer help at any time, in
spite of having his busy schedule. I am thankful to all the faculty members of Mechanical Engineering Department and all my friends who have
directly or indirectly helped me during this dissertation work.
I would like to thank my best friends and colleagues for their great support in dissertation work as well as in social life. Without them the research
work would not complete successfully.
The final thanks must to go to my parents who have provided me with every opportunity and encouragement from the life years. I could not and
would never wish for more.
CONCLUSION
The aim of this Research is to investigate the effect of Process Parameters like Pouring Temperature, Inoculation quantity and Inlet water flow rate
on the Quality (Microstructure and Mechanical properties) of the Ductile iron Pipe and to find the Optimum Combination of Parameters which give
the Best Performance at that Condition. The Conclusions derived from the Experimental investigation, Taguchi Method and Analysis of Variance
(ANOVA) are:
At 1340-1370 °C Pouring Temperature, 0.30 % Inoculation and 120 m³/Hr Cooling water flow rate the highest ferrite % (Which is the
major Part of Microstructure properties in ductile iron pipe) can be obtained. At given set of parameters highest Taguchi Predicted ferrite % are 98.87
% which is very nearer to the experimental result of 98.00%
At 1340-1370 °C Pouring Temperature, 0.30 % Inoculation and 120 m³/Hr Cooling water flow rate the Lowest Carbide % can be obtained.
At given set of parameters the Lowest Taguchi Predicted Carbide % is 1.65 % which is very nearer to the experimental result of 2.0 %
At 1370-1400 °C Pouring Temperature, 0.25 % Inoculation and 160 m³/Hr Cooling water flow rate the Highest Elongation % can be
obtained. At given set of parameters the highest Taguchi Predicted Elongation % is 15.50 % which is very nearer to the experimental result of 15.0 %
At 1340-1370 °C Pouring Temperature, 0.30 % Inoculation and 100 m³/Hr Cooling water flow rate the Lowest Hardness can be obtained.
At given set of parameters the Lowest Taguchi Predicted Hardness is 179.87 BHN which is very nearer to the experimental result of 180.0 BHN
By using Analysis of Variance in regression (As the Responses Vary Polynomialy) the Significance of the Factors as well as the
interactions of factors are analyzed and the most Significant parameter Or interaction can be find out.
ANOVA Results for Ferrite % Shows that all the factors as well as interactions are largely significance as their P-values are less than α
level.
ANOVA Results for Carbide % Shows that all the factors as well as interactions are largely significance as their P-values are less than α
level.
ANOVA Results for Hardness(BHN) Shows that all the factors as well as interactions are largely significance as their P-values are less
than α level.
REFERENCES:
[1] [1] M. Jagdishwar, ―Casing Feeder Design Optimization based on feed path and temperature analysis‖,2012
International Journal of Engineering Research and General Science Volume 3, Issue 3, Part-2 , May-June, 2015 ISSN 2091-2730
428 www.ijergs.org
[2] [2] Guss –Rohrsysteme, Griesheim,‖Ductile iron pipe system‖, European association for Ductile iron pipe systems, 2004
[3] [3] Anita Bisht, ―Effect of Heat treatment procedures on microstructure and Mechanical Properties of Nodular iron‖, 2009
[4] [4] Charles W. Mooney, Jr. Dies, ―The best of Ductile iron news‖, 2001, IL 60016-8399
[5] [5] Courtesy of Jindal saw Ltd.
[6] [6] Sufei Wei, Steve Lampman, ―Centrifugal casting‖, ASM Handbook, Volume 15: Casting, 2008, P 667-673
[7] [7] Rajesh Rajkhole, J.G. Khan,―Defects, causes and their Remidies in casting process‖, volume 2, 2014, E-ISSN: 2321-9637
[8] [8] Bishnu Prasad Mahto, ―Characterization of Ductile iron Through Fractographic study‖, 2014
[9] [9] Madhusudan, Narendranath, G C Kumar, ―properties of centrifugal casting at different rotational speeds of the die‖, International
Journal of Engineering Technology and advanced Engineering Vol. 3, January 2013 ISSN 2250-2459
[10] [10] Jitendra khare ―Design and Development of Locking arrangement for centrifugal casting machine‖,2013, international journal of pure
and applied research in engineering and technology, ISSN: 2319-507X
[11] [11] Minghu yunan, Leilei cao, Yaozeng Xu, Xuding Song,‖Numerical Simulation on effects of Electromagnetic force on centrifugal
casting process of high speed steel roll‖, Modelling and numerical simulation of material Science,2013
[12] [12] Yuwen Xuan-Xuan, Chen Ling, Han Yi-jie, ― Numerical Simulation of Casting Filling Process Based on FLUENT‖, international
conference on future Electrical power and Energy system, 2012, 1864-1871
[13] [13] Madhusudan, Narendra Nath S., G C Mohan, ―Experimental Study on Cooling Rate of centrifugal casting based on Grain Size‖,
International journal Scientific and engineering Research, Volume 3, Issue 1, January-2012 1 ISSN 2229-5518
[14] [14] P. Shailesh,‖ Experimental investigation on centrifugal casting of 5500 alloy‖, Science Research and essays, vol. 79(44), ISSN 1992-
2248, 12 November, 2012
[15]
[16]
[17] [15] Nan Nan Song, Shi Ping Wu, Xiu Homg Kang, Dian Zhong Li1, ― Hydraulic experiments of mould filling Process in Horizontal
centrifugal Casting, Advanced Materials Research Vols. 154-155, 2011, pp 314-320
[18] [16] Vivek Singh,‖Analysis of process parameters of plasma arc cutting using Design of experiments‖, NIT Rourlela, 2011.
[19] [17] R. Arbi Jeshvaghani, M. Shaminian, M. jaberzadeh, ―Enhancement of Wear Resistance of ductile iron surface by stellite 6‖ , material
and design 32,2011, 2028-2033
[20] [18] Madhusudan, Narendranath, Mohankumar G C 2, Mukunda P G, ―Effect of Mould wall Thickness on rate of Solidification of
centrifugal casting‖ , International Journal of Engineering Science and Technology, Vol. 2, 2010, 6092-6096
[21] [19] Shamanian, S.M.R. Mousavi Abarghouie,S.R. Mousavi Pour, ―Effect of surface alloying on microstructure and wear behavior of
ductile iron‖, Department of Materials Engineering, Isfahan University of Technology, Isfahan 84156-83111, Iran
[22] [20] S. Kamaruddin, Zahid Khan,S.H. foong,‖Application of Taguchi Method in the Optimization of injection Moulding parameters for
Manufacturing Products from Plastic Blend‖, IACSIT, Vol. 2, ISSN: 1793-8263, December 2010
[23] [21] Cai Qizhou, Wei Bokang, ―Recent Development of ductile cast iron production technology in china‖, 2008, 02-0082-10
[24] [22] Karl-Fredrik Nillson, darina Blagoeva, Pietro Moretto, ― An Experimental and numerical analysis to correlate variation in ductility to
defects and microstructure in ductile cast iron components‖, engineering fracture mechanics 73, 2006, 1133-1157
[25] [23] S. Konoplyuk T. Abe, T. Uchimonto T. Takagi, M. Kurosawa,― Characterization of ductile cast iron by eddy current method, Institute
of Fluid Science, Tohoku University, Katahira 2-1-1, NDT&E International 38 (2005) 623–626
International Journal of Engineering Research and General Science Volume 3, Issue 3, Part-2 , May-June, 2015 ISSN 2091-2730
429 www.ijergs.org
[26] [24] J.M. Makar, R. Desnoyears,S. E. McDonald, ―Failure Modes and Mechanism in gray cast iron pipe‖, National Research Council
Canada,2001, NRCC-44218
[27] [25] Ugur Sen, Saduman Sen, Fevzi Yilmaz, ― An Evaluation of some Properties borides deposited on boronized ductile iron‖, Journal of
Materials Processing Technology 148 (2004) 1–7
[28] [26] R. Zagorski, J. Oelezino, ― Pouring of Mould during Centrifugal casting process of high speed steel roll‖, Modeling and Numerical
Simulation of Material Science,2014
[29] [27] Uday A. Dabade, Rahul C. Bhedasgaonkar, ―Casting Defect analysis using Design of Experiments and Computer Aided Casting
Simulation Technique‖, CIRP Conference on Manufacturing Systems, 2013, 616- 621
[30] [28] Courtesy of Kastwel Foundries, Ahmedabad
[29] Susanta Kumar Swain; Sudipta Sen, ―Effect of Chemistry and Poring Variables on the Mechanical Properties of Thin-wall Ductile iron Casting‖,
NIT-Rourkela


