Agricultural Synergies: Sustainable Intensification
of Colombia's Livestock Sector
Dr. Amy M. Lerner Science, Technology & Environmental Policy (STEP)
Woodrow Wilson School, Princeton University Cali, Colombia, October 2014
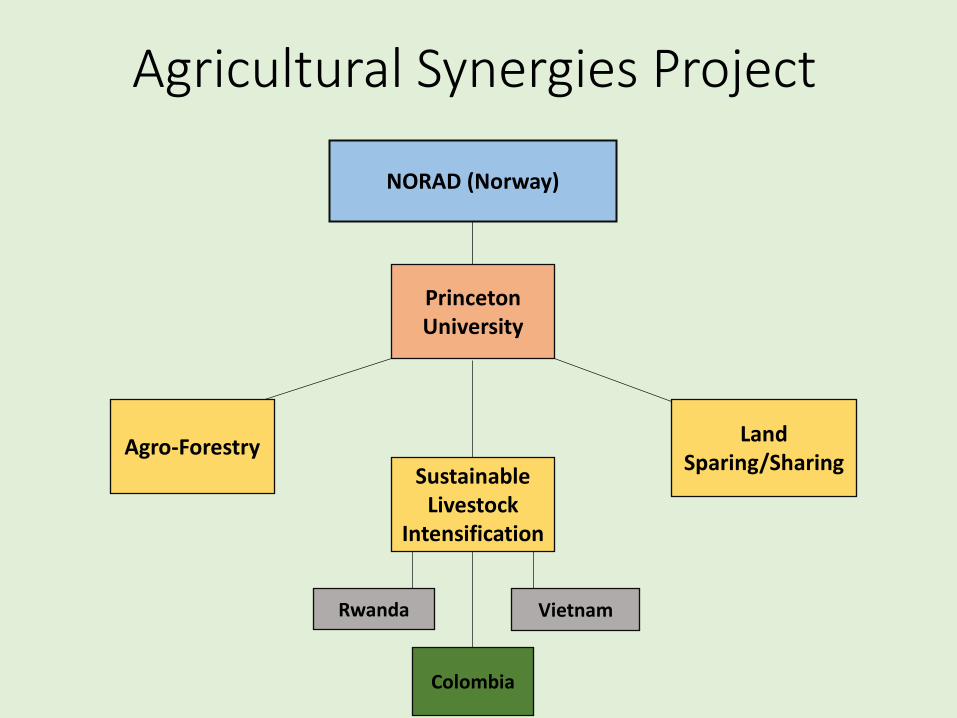
Agricultural Synergies Project
NORAD (Norway)
Princeton University
Agro-Forestry Sustainable
Livestock Intensification
Land Sparing/Sharing
Rwanda
Colombia
Vietnam
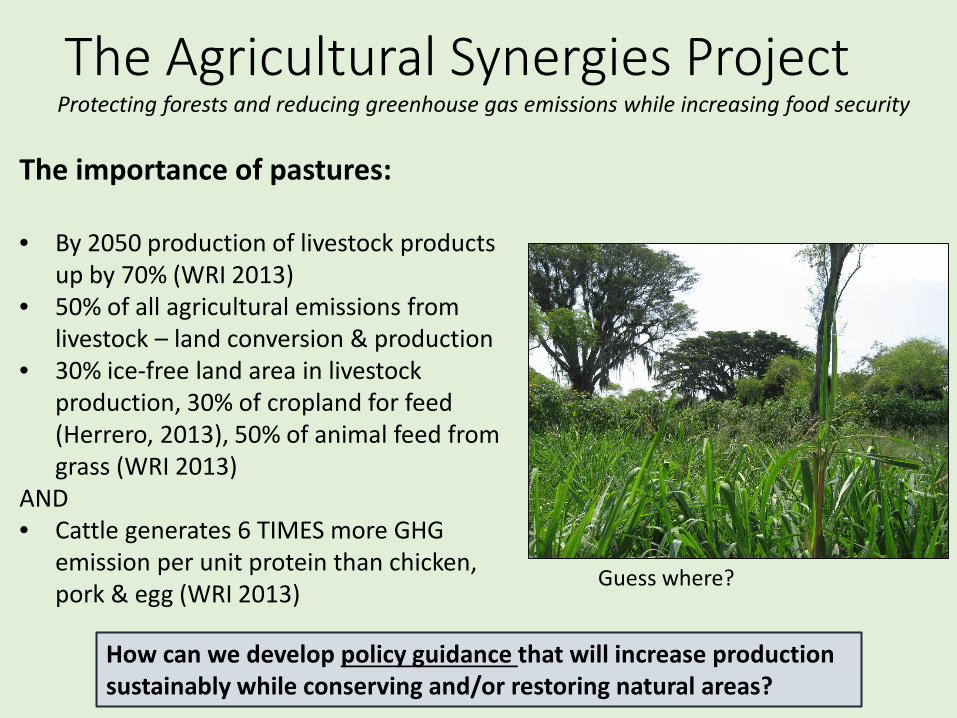
The Agricultural Synergies Project Protecting forests and reducing greenhouse gas emissions while increasing food security
The importance of pastures: • By 2050 production of livestock products
up by 70% (WRI 2013) • 50% of all agricultural emissions from
livestock – land conversion & production • 30% ice-free land area in livestock
production, 30% of cropland for feed (Herrero, 2013), 50% of animal feed from grass (WRI 2013)
AND • Cattle generates 6 TIMES more GHG
emission per unit protein than chicken, pork & egg (WRI 2013)
How can we develop policy guidance that will increase production sustainably while conserving and/or restoring natural areas?
Guess where?
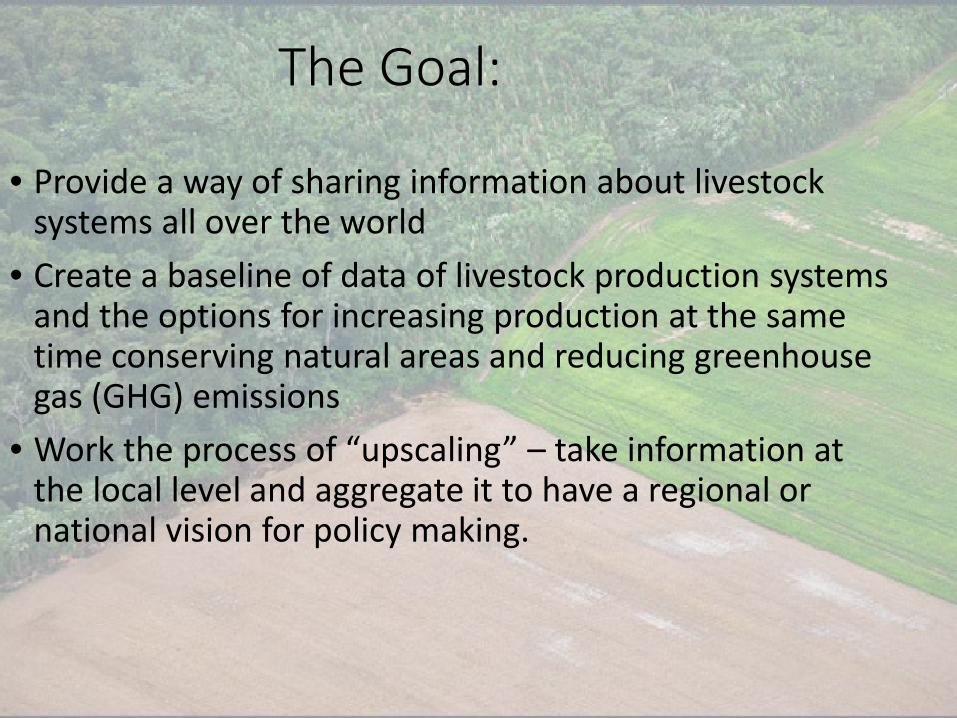
The Goal:
• Provide a way of sharing information about livestock systems all over the world
• Create a baseline of data of livestock production systems and the options for increasing production at the same time conserving natural areas and reducing greenhouse gas (GHG) emissions
• Work the process of “upscaling” – take information at the local level and aggregate it to have a regional or national vision for policy making.
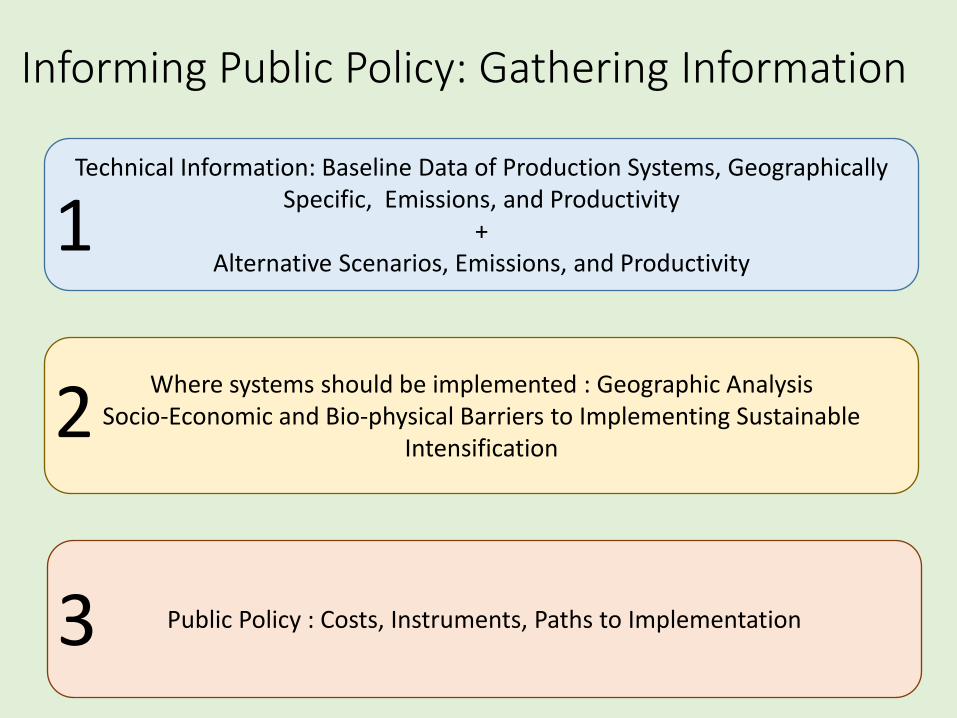
Informing Public Policy: Gathering Information
Technical Information: Baseline Data of Production Systems, Geographically Specific, Emissions, and Productivity
+ Alternative Scenarios, Emissions, and Productivity
Where systems should be implemented : Geographic Analysis Socio-Economic and Bio-physical Barriers to Implementing Sustainable
Intensification
Public Policy : Costs, Instruments, Paths to Implementation
1
2
3
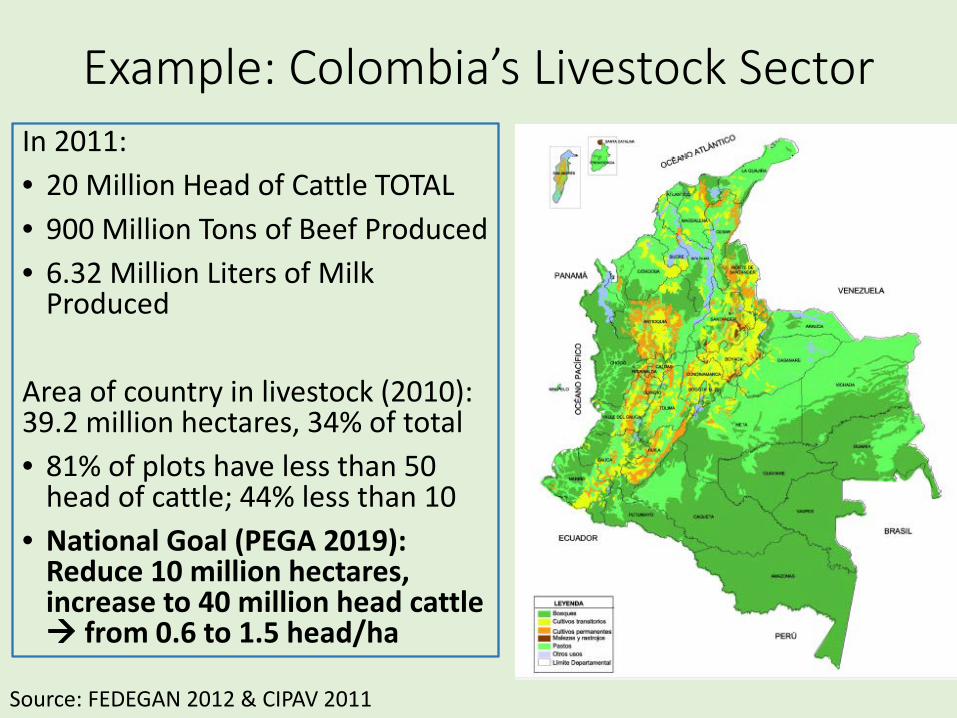
Example: Colombia’s Livestock Sector In 2011: • 20 Million Head of Cattle TOTAL • 900 Million Tons of Beef Produced • 6.32 Million Liters of Milk
Produced
Area of country in livestock (2010): 39.2 million hectares, 34% of total • 81% of plots have less than 50
head of cattle; 44% less than 10 • National Goal (PEGA 2019):
Reduce 10 million hectares, increase to 40 million head cattle from 0.6 to 1.5 head/ha
Source: FEDEGAN 2012 & CIPAV 2011
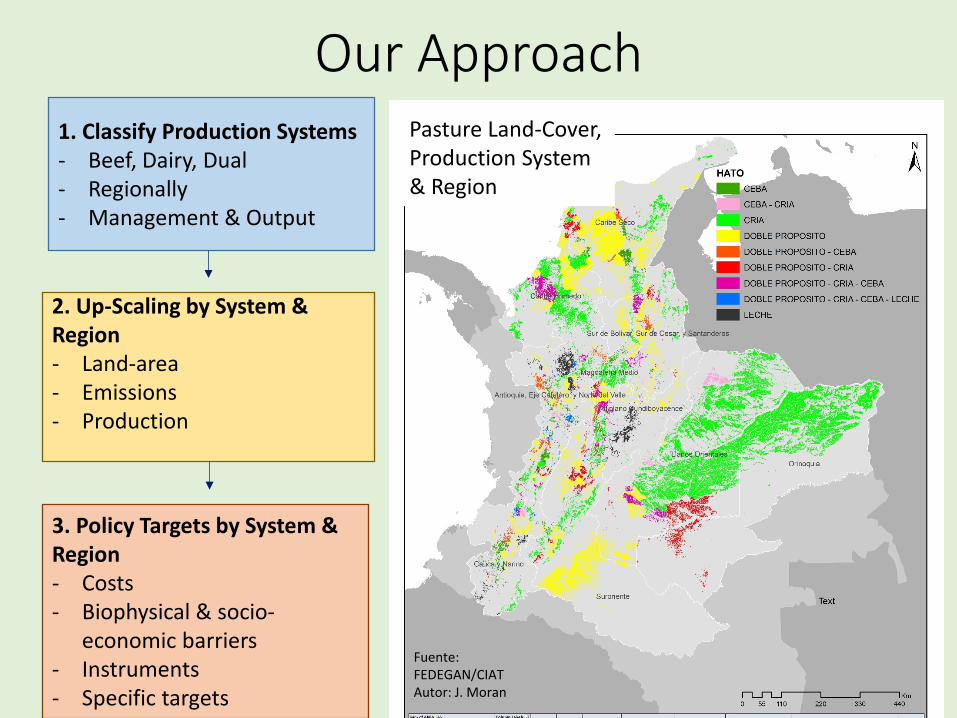
Our Approach 1. Classify Production Systems - Beef, Dairy, Dual - Regionally - Management & Output
2. Up-Scaling by System & Region - Land-area - Emissions - Production
3. Policy Targets by System & Region - Costs - Biophysical & socio-
economic barriers - Instruments - Specific targets
Pasture Land-Cover, Production System & Region
Fuente: FEDEGAN/CIAT Autor: J. Moran
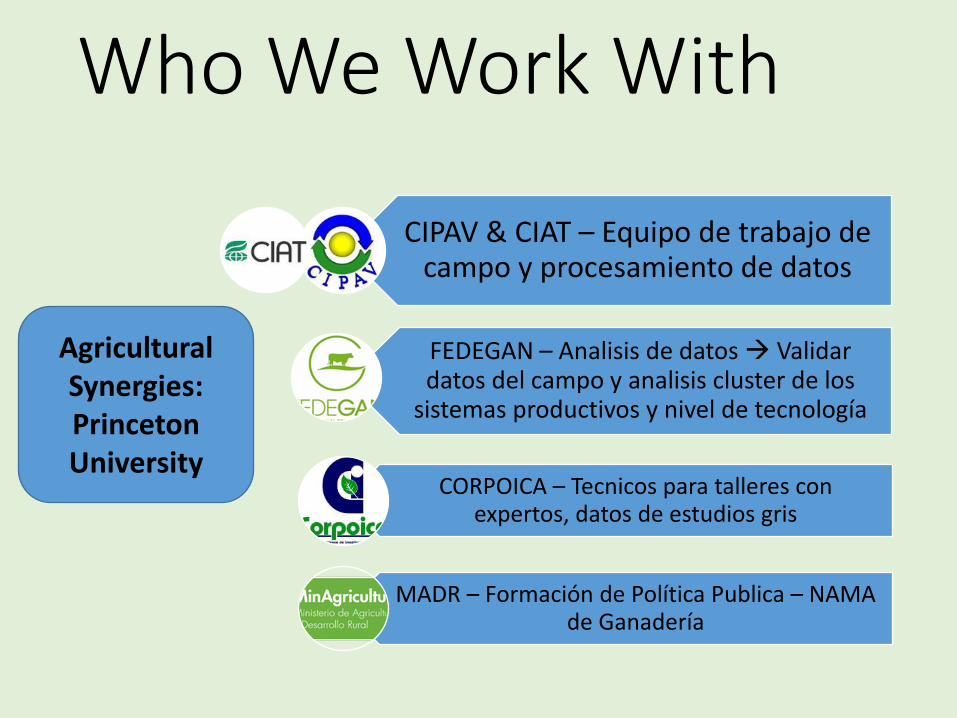
Who We Work With
CIPAV & CIAT – Equipo de trabajo de campo y procesamiento de datos
FEDEGAN – Analisis de datos Validar datos del campo y analisis cluster de los
sistemas productivos y nivel de tecnología
CORPOICA – Tecnicos para talleres con expertos, datos de estudios gris
MADR – Formación de Política Publica – NAMA de Ganadería
Agricultural Synergies: Princeton University
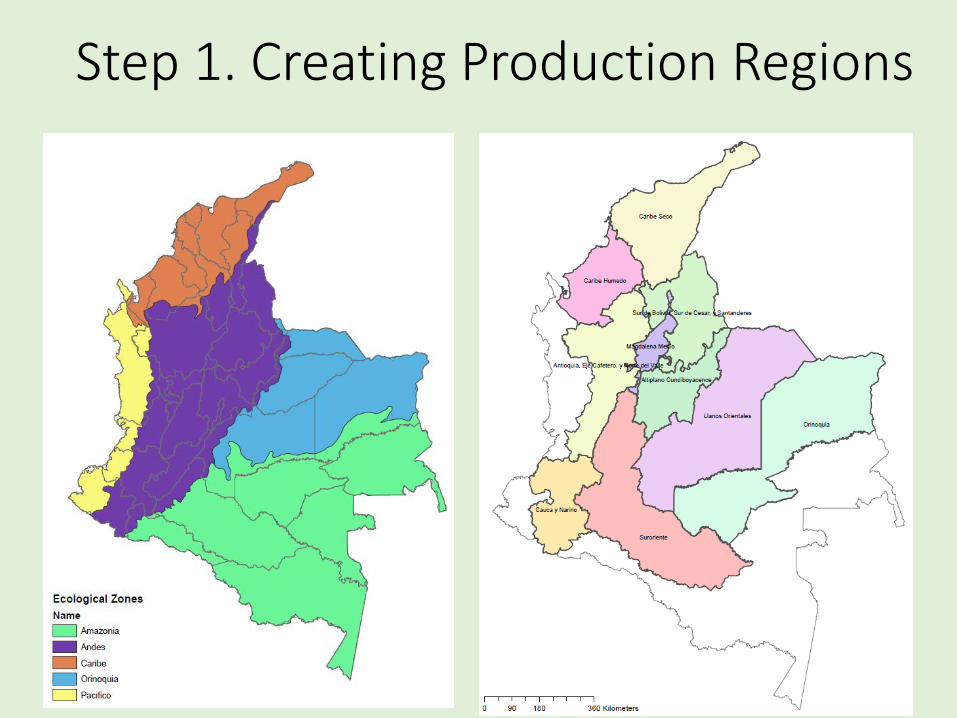
Step 1. Creating Production Regions
Methodology
We are developing a webtool that can capture data from various production systems There are three sources of information: 1) Individual Farms: The project will visit 30 farms in 5 regions
of the country (Dpto Cesar, Eje Cafetero, Cundinamarca, los Llanos, Valle de Patía)
2) Information from typical or representative farms at various productivity levels and production systems in various parts of the country (with regional experts).
3) Data from fieldwork already completed (published or unpublished)
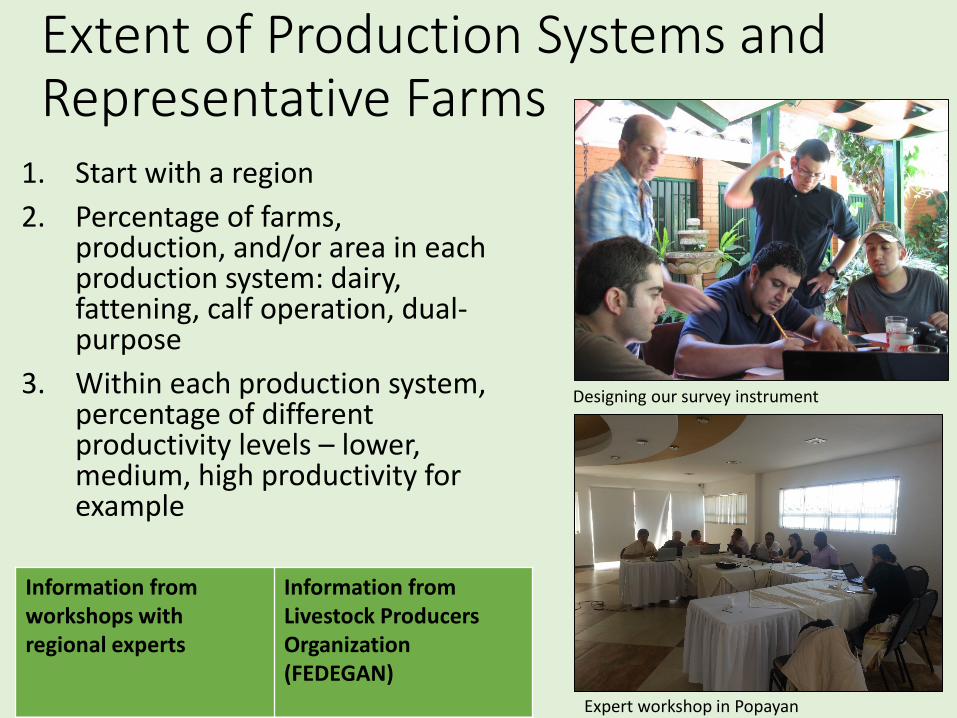
Extent of Production Systems and Representative Farms
1. Start with a region 2. Percentage of farms,
production, and/or area in each production system: dairy, fattening, calf operation, dual-purpose
3. Within each production system, percentage of different productivity levels – lower, medium, high productivity for example
Information from workshops with regional experts
Information from Livestock Producers Organization (FEDEGAN)
Designing our survey instrument
Expert workshop in Popayan
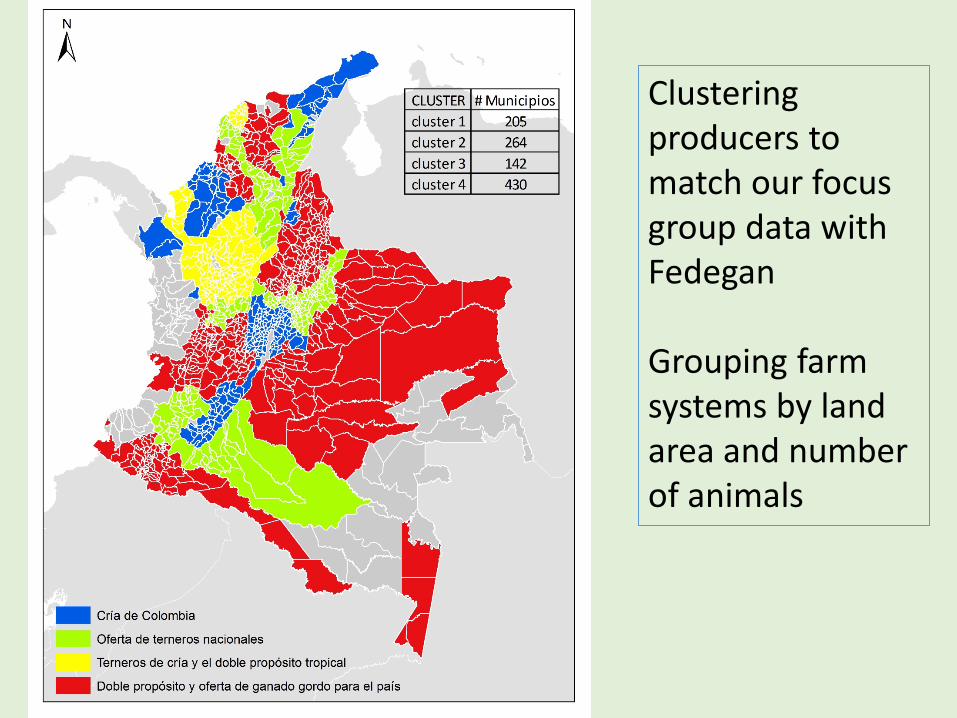
Clustering producers to match our focus group data with Fedegan Grouping farm systems by land area and number of animals
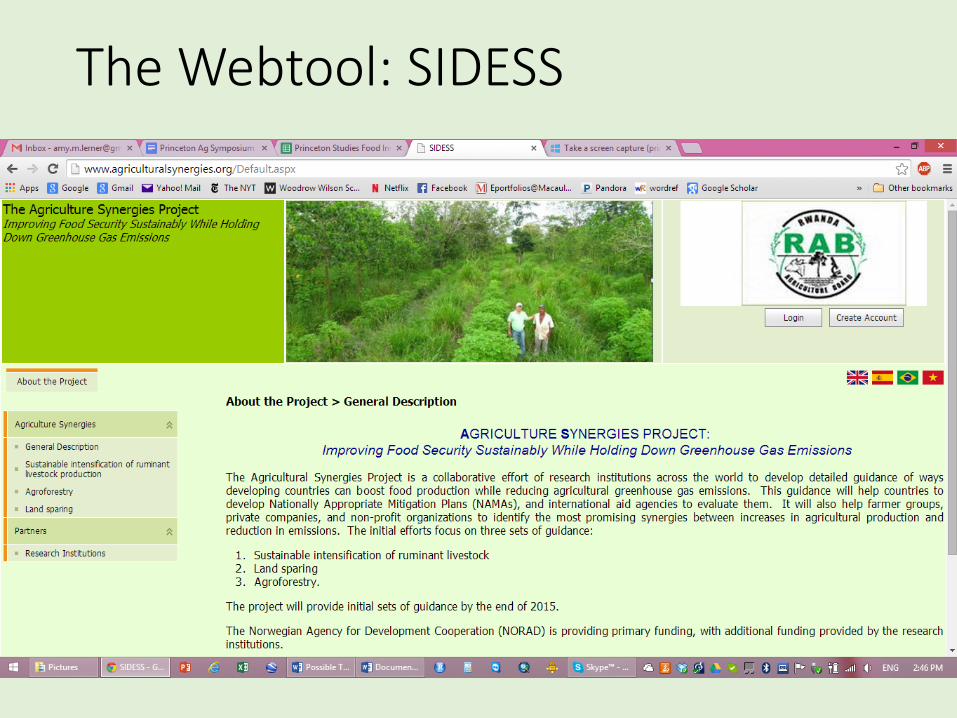
The Webtool: SIDESS
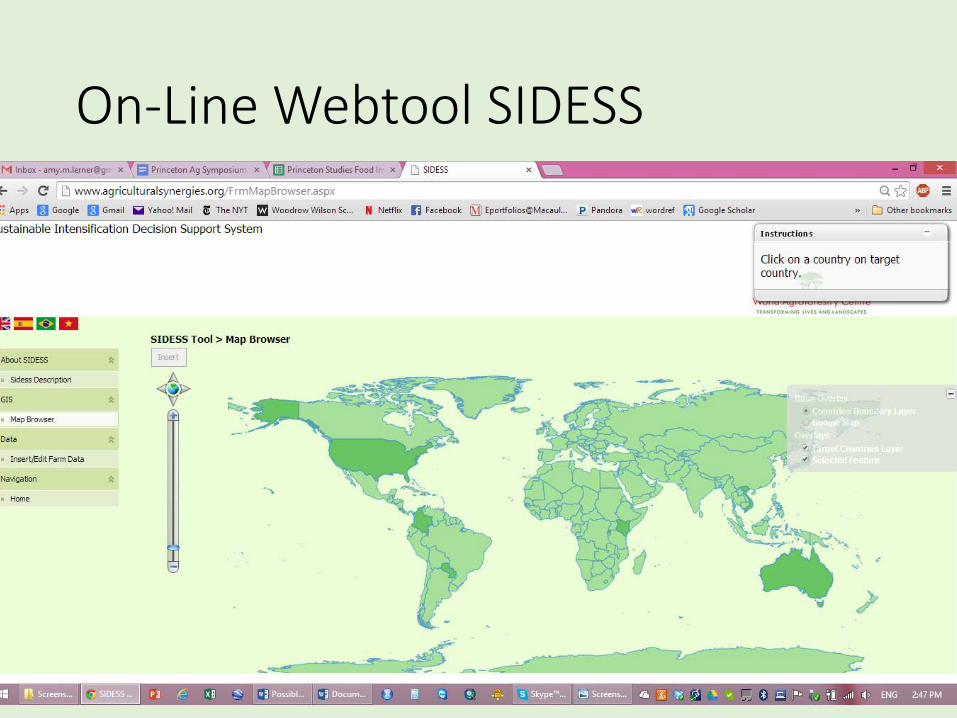
On-Line Webtool SIDESS


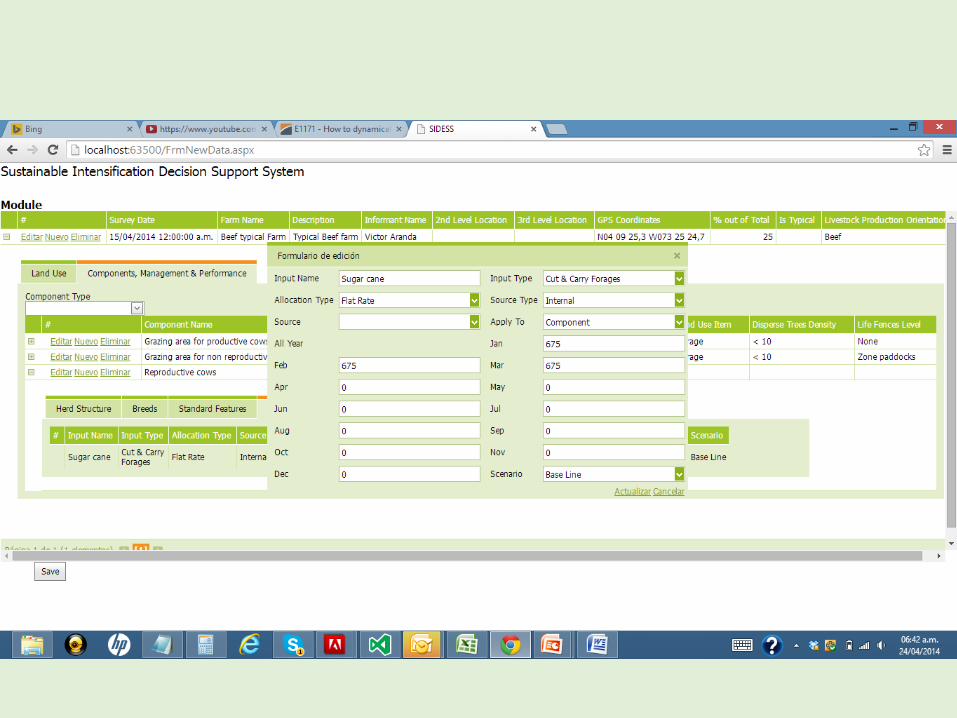
Entering Data Into SIDESS
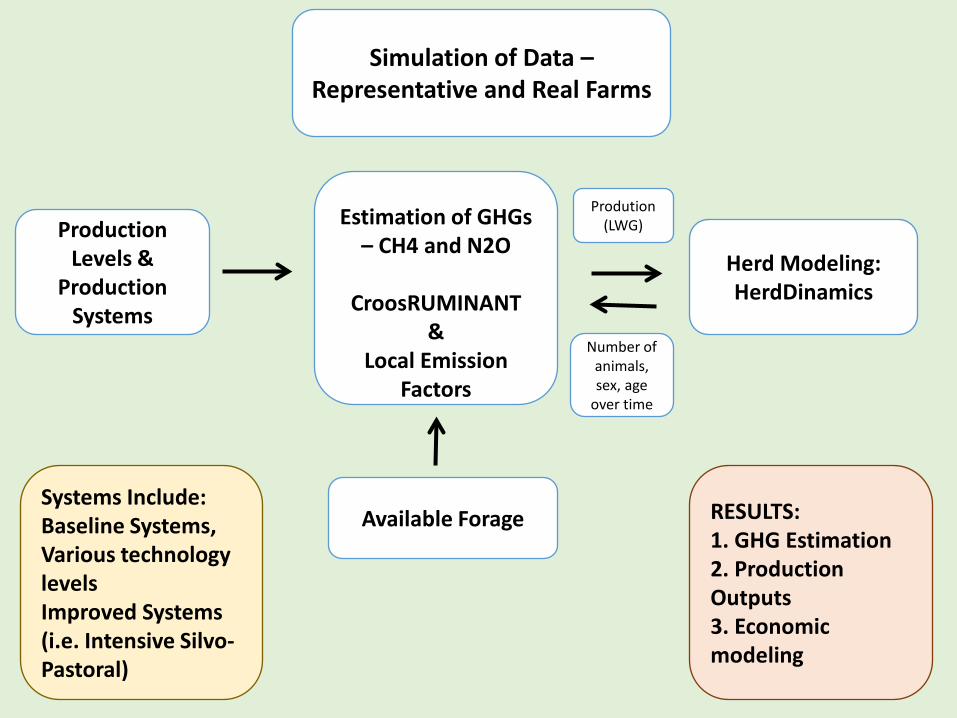
Prodution (LWG)
Estimation of GHGs
– CH4 and N2O
CroosRUMINANT &
Local Emission Factors
Herd Modeling: HerdDinamics
Production Levels &
Production Systems
Simulation of Data – Representative and Real Farms
Number of animals, sex, age
over time
Available Forage RESULTS: 1. GHG Estimation 2. Production Outputs 3. Economic modeling
Systems Include: Baseline Systems, Various technology levels Improved Systems (i.e. Intensive Silvo-Pastoral)
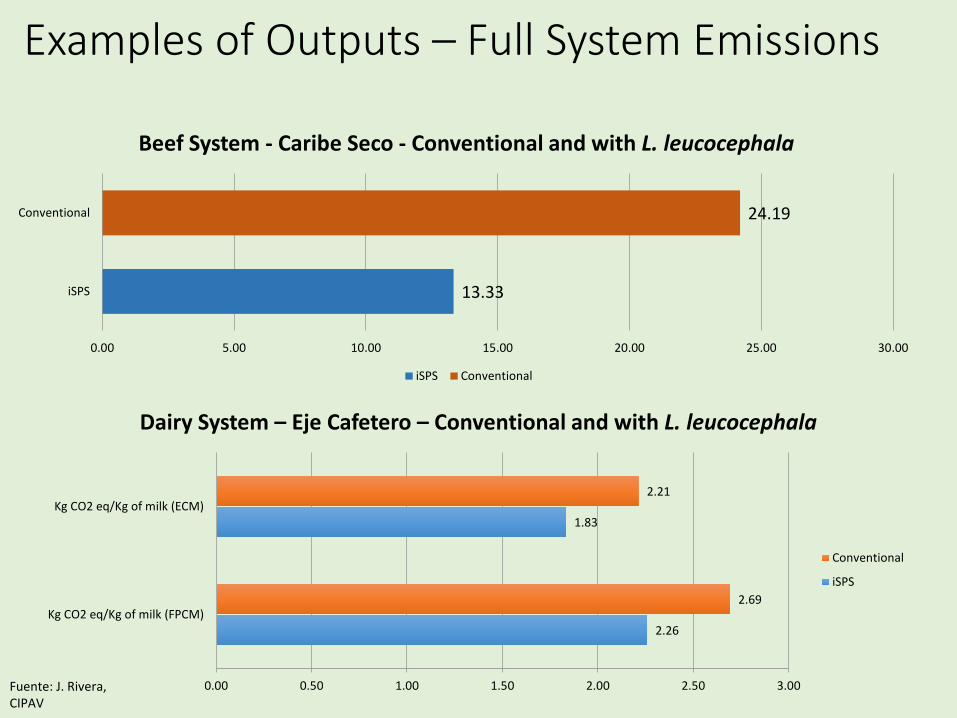
Examples of Outputs – Full System Emissions
13.33
24.19
0.00 5.00 10.00 15.00 20.00 25.00 30.00
iSPS
Conventional
Beef System - Caribe Seco - Conventional and with L. leucocephala
iSPS Conventional
2.26
1.83
2.69
2.21
0.00 0.50 1.00 1.50 2.00 2.50 3.00
Kg CO2 eq/Kg of milk (FPCM)
Kg CO2 eq/Kg of milk (ECM)
Dairy System – Eje Cafetero – Conventional and with L. leucocephala
Conventional
iSPS
Fuente: J. Rivera, CIPAV
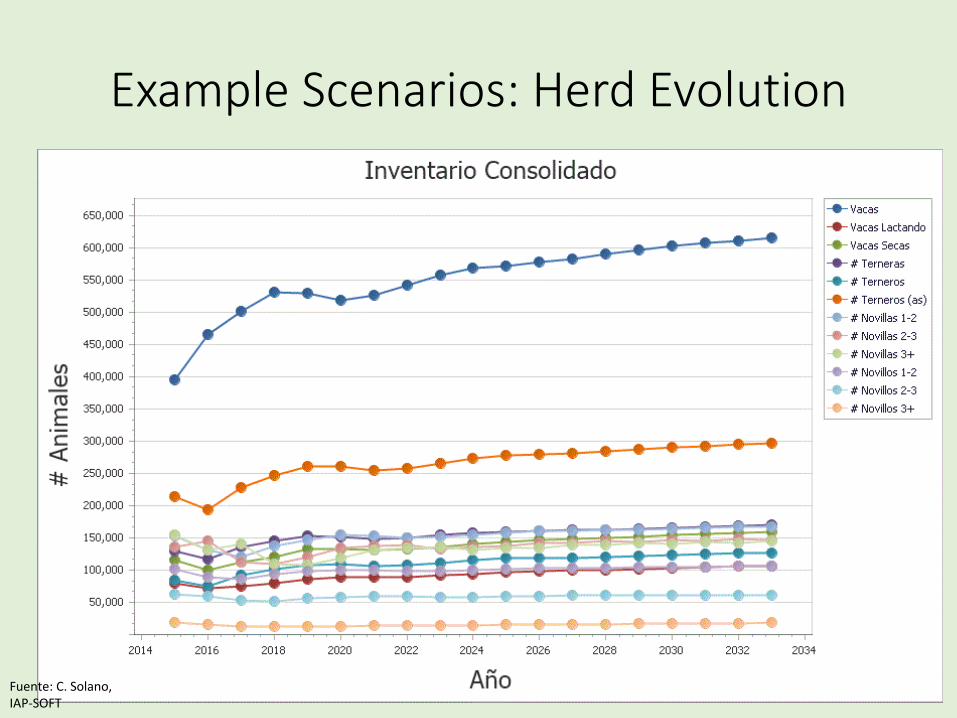
Example Scenarios: Herd Evolution
Fuente: C. Solano, IAP-SOFT
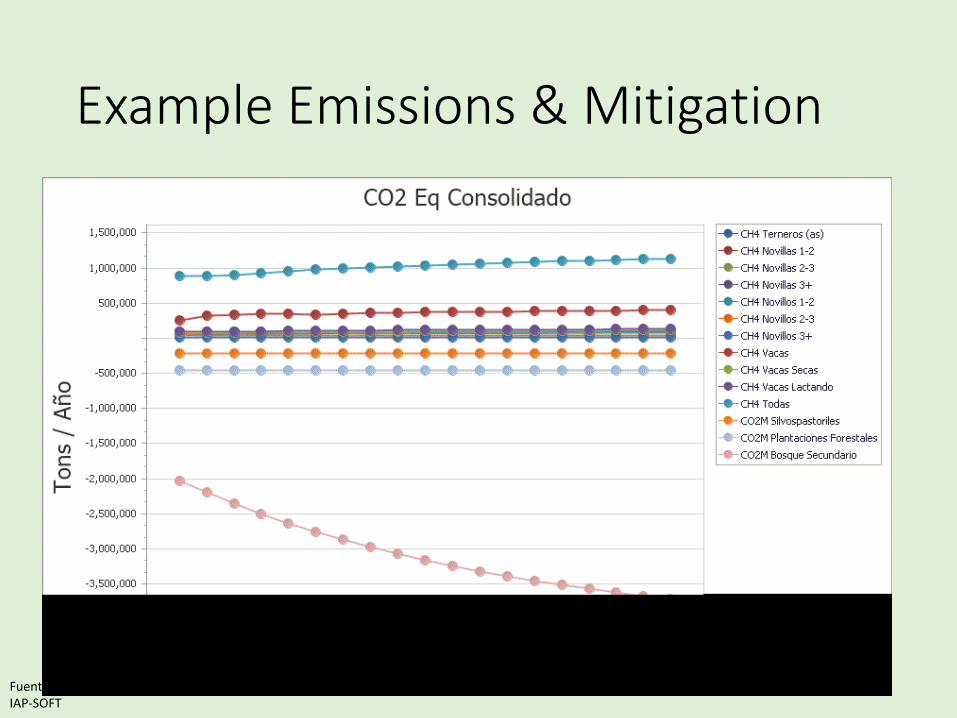
Example Emissions & Mitigation
Fuente: C. Solano, IAP-SOFT
Thank you!
Dr. Amy M. Lerner - [email protected] Post-doctoral Research Associate Woodrow Wilson School of Public and International Affairs, STEP www.agriculturalsynergies.org


Colombia as an example
Examples of Outputs
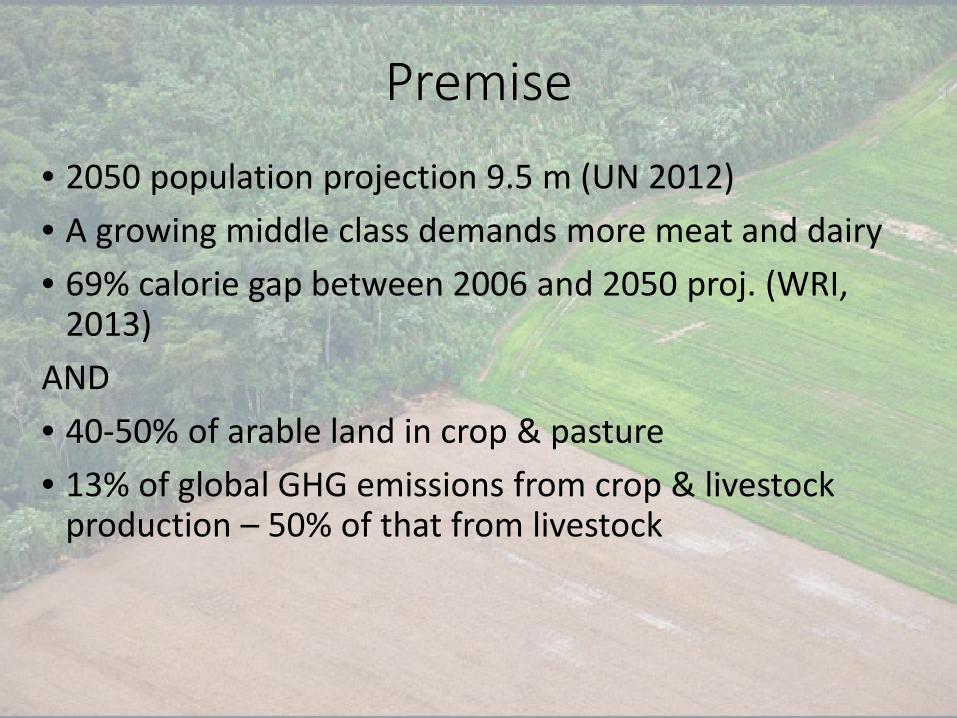
Premise • 2050 population projection 9.5 m (UN 2012) • A growing middle class demands more meat and dairy • 69% calorie gap between 2006 and 2050 proj. (WRI,
2013) AND • 40-50% of arable land in crop & pasture • 13% of global GHG emissions from crop & livestock
production – 50% of that from livestock
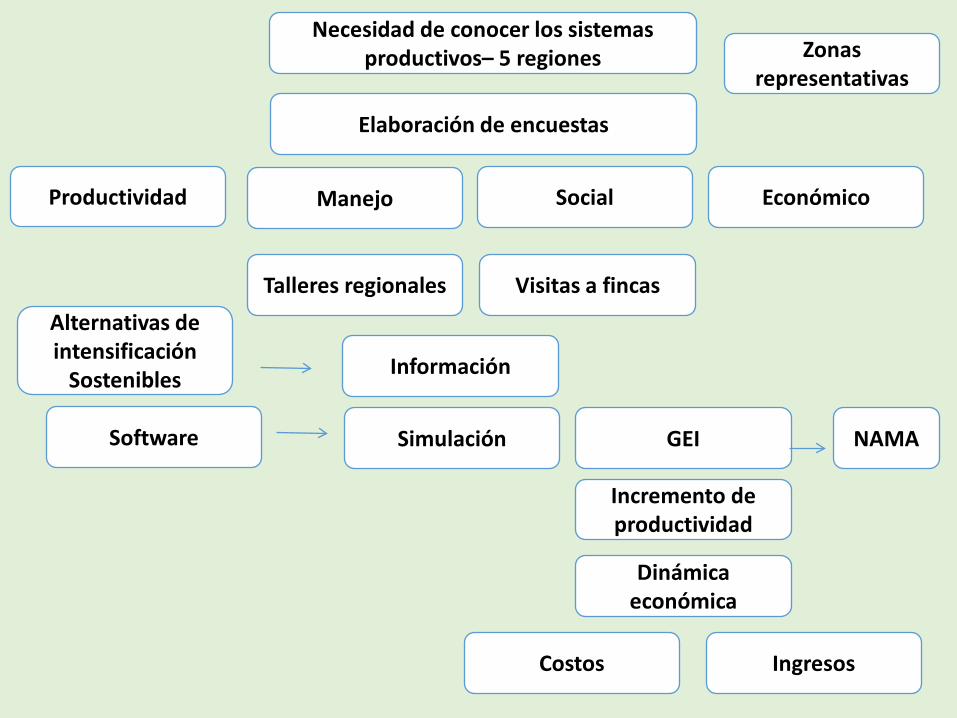
Elaboración de encuestas
Productividad Social Manejo Económico
Talleres regionales Visitas a fincas
Información
Necesidad de conocer los sistemas productivos– 5 regiones
Simulación
Alternativas de intensificación
Sostenibles
GEI
Incremento de productividad
Dinámica económica
Software
Costos Ingresos
NAMA
Zonas representativas
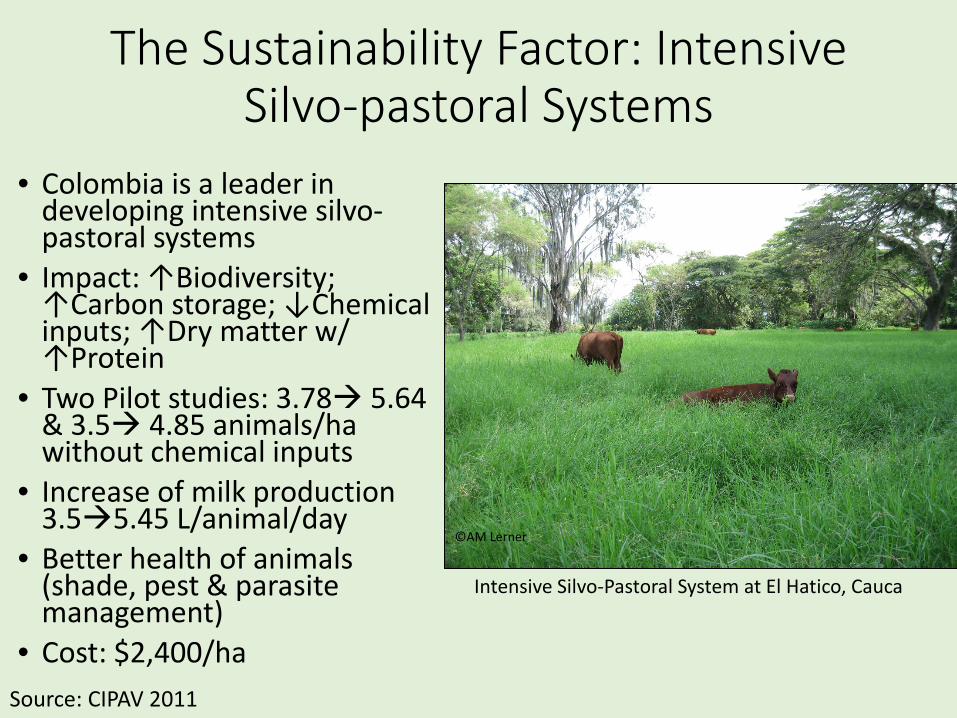
The Sustainability Factor: Intensive Silvo-pastoral Systems
• Colombia is a leader in developing intensive silvo-pastoral systems
• Impact: ↑Biodiversity; ↑Carbon storage; ↓Chemical inputs; ↑Dry matter w/ ↑Protein
• Two Pilot studies: 3.78 5.64 & 3.5 4.85 animals/ha without chemical inputs
• Increase of milk production 3.55.45 L/animal/day
• Better health of animals (shade, pest & parasite management)
• Cost: $2,400/ha
©AM Lerner
Intensive Silvo-Pastoral System at El Hatico, Cauca
Source: CIPAV 2011
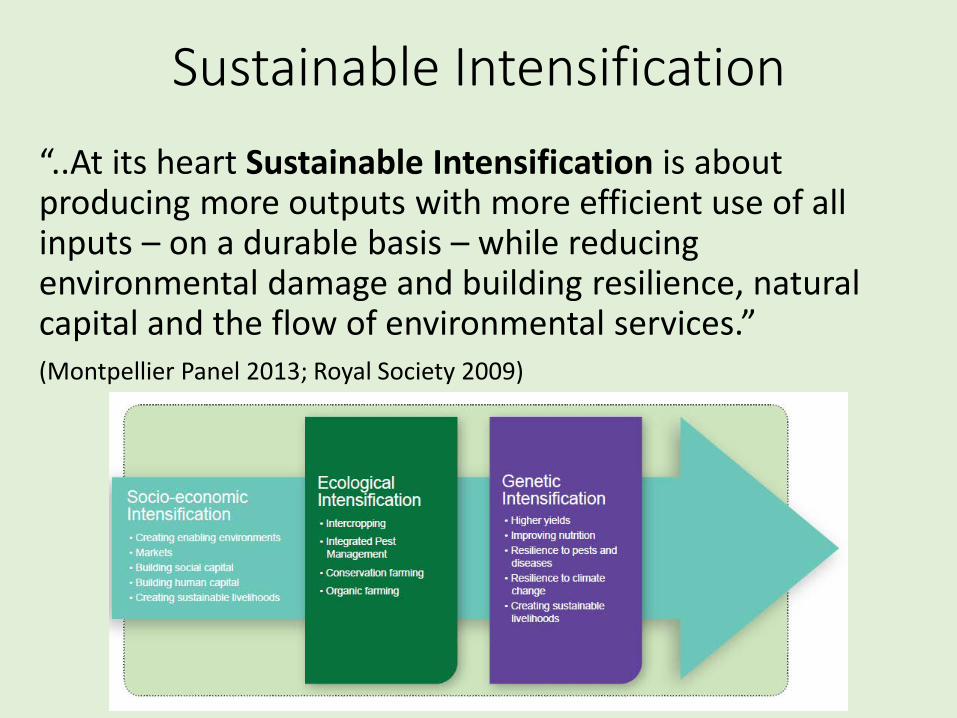
Sustainable Intensification “..At its heart Sustainable Intensification is about producing more outputs with more efficient use of all inputs – on a durable basis – while reducing environmental damage and building resilience, natural capital and the flow of environmental services.” (Montpellier Panel 2013; Royal Society 2009)
Geographic Analysis


