AERODYNAMIC EFFECTS OF HIGH SPEED TRAINS ON
PASSENGERS, TRACK WORKERS, AND OTHER PEOPLE
Paul Derkowski, PE Arup
10370 Richmond Ave., Suite 475 Houston, TX 77042 +1-713-783-2787
Steve Clark, PE Arup
10370 Richmond Ave., Suite 475 Houston, TX 77042 +1-713-783-2787
Richard Sturt Arup
Blythe Gate Blythe Valley Park Solihull, B90 8AE
+44 (0)121-213-3000 [email protected]
Word Count: 6,207
ABSTRACT
High-speed trains are being planned in the United States with operating speeds of up to 250 miles per hour (mph). Issues associated with this speed include the aerodynamic effects on the safety and comfort of both passengers, people waiting on platforms, and track workers adjacent to such passing trains.
The authors are researching and analyzing the international state of knowledge and how it is articulated in standards developed to-date for high speed train (HST) operations. This research is being partially funded by the Federal Railroad Administration, and will be used to develop a guidance manual for HST designers and operators in the US market.
There are many relevant aerodynamic issues for trains traveling at high speeds (up to 250 mph) in open and tunneled environments. The list is extensive, and the authors have selected four of the key issues to present in this paper. These include;
1. Slipstreams; 2. Open Air Considerations of Trains Meeting and Passing; 3. Pressure Wave Effects Inside Tunnels; and 4. Micro-Pressure Waves Emitted from Tunnels.
For each of these four relevant aerodynamic issues, the authors present an overview of the nature and characteristics, potential impacts to passengers (including those waiting on platforms) and track workers, current international standards and recommended best practices, and potential mitigation measures. The paper concludes with a recommendation for developing North American industry guidance.
INTRODUCTION
There are many relevant aerodynamic issues for high-speed trains (HST), and each of these could easily constitute an entire paper. The authors have selected four key ones for this paper. These are:
1. Slipstreams 2. Open Air Considerations of Trains Meeting and Passing 3. Pressure Wave Effects Inside Tunnels 4. Micro-Pressure Waves Emitted from Tunnels
Those interested are encouraged to pursue additional information through the list of references.
© AREMA 2014 1
SLIPSTREAMS
Nature and Key Characteristics
A moving train induces an air flow in the general direction of the train motion, consisting of several parts (1).
The nose region, where the pattern of pressure and air velocity remains steady and moves with the train
The boundary layer containing highly turbulent air alongside the train, for which the thickness is similar to the width and height of the train, and increases towards the back of the train.
The near wake, dominated by large-scale unsteady flow vortices spreading laterally behind the train.
The far wake, in which the velocities gradually decrease.
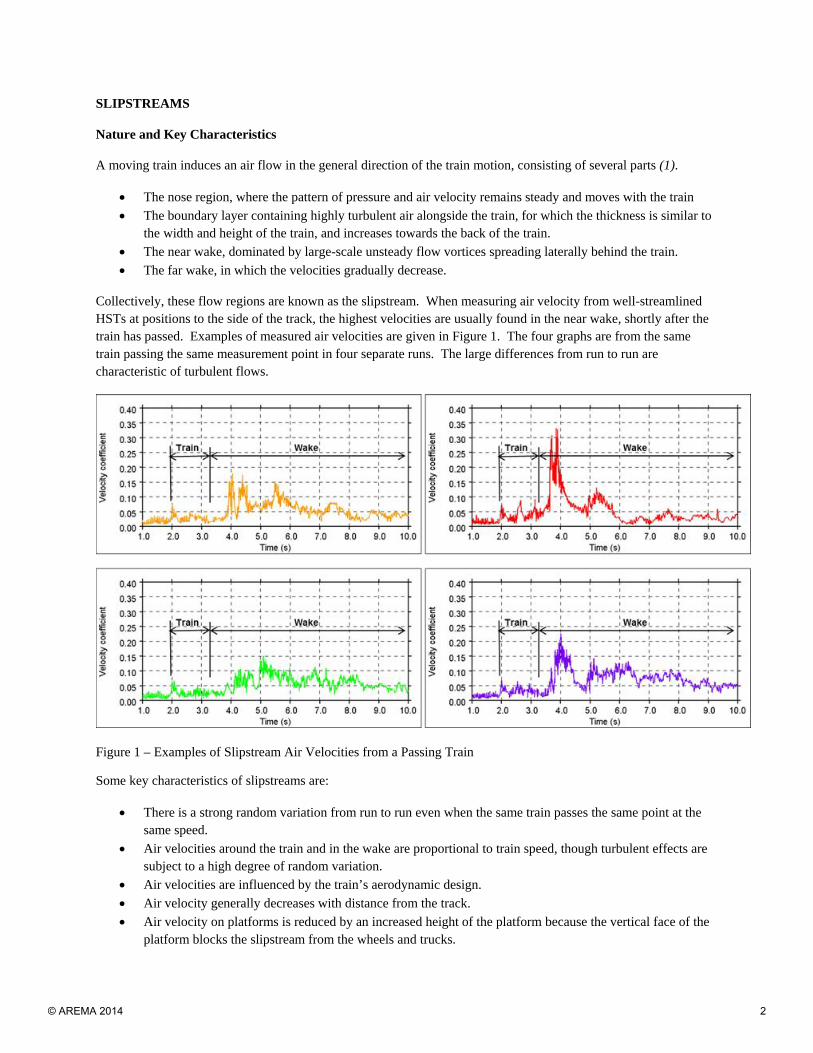
Collectively, these flow regions are known as the slipstream. When measuring air velocity from well-streamlined HSTs at positions to the side of the track, the highest velocities are usually found in the near wake, shortly after the train has passed. Examples of measured air velocities are given in Figure 1. The four graphs are from the same train passing the same measurement point in four separate runs. The large differences from run to run are characteristic of turbulent flows.
Figure 1 – Examples of Slipstream Air Velocities from a Passing Train
Some key characteristics of slipstreams are:
There is a strong random variation from run to run even when the same train passes the same point at the same speed.
Air velocities around the train and in the wake are proportional to train speed, though turbulent effects are subject to a high degree of random variation.
Air velocities are influenced by the train’s aerodynamic design.
Air velocity generally decreases with distance from the track.
Air velocity on platforms is reduced by an increased height of the platform because the vertical face of the platform blocks the slipstream from the wheels and trucks.
© AREMA 2014 2
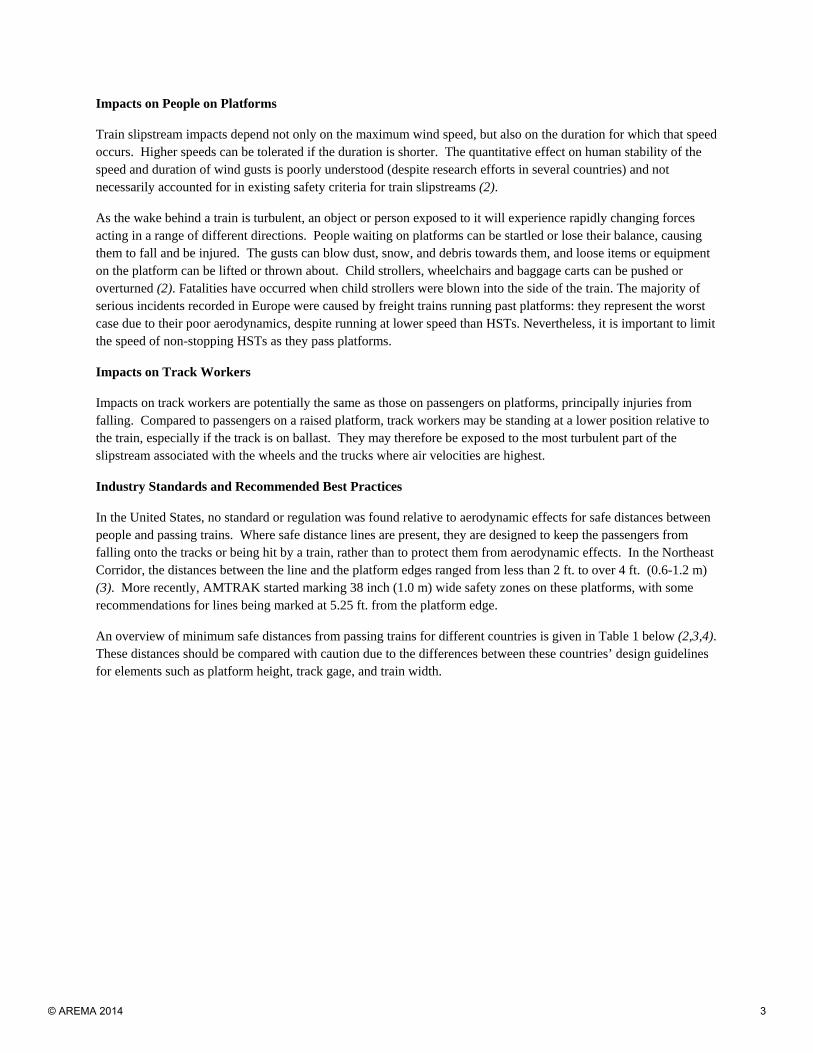
Impacts on People on Platforms
Train slipstream impacts depend not only on the maximum wind speed, but also on the duration for which that speed occurs. Higher speeds can be tolerated if the duration is shorter. The quantitative effect on human stability of the speed and duration of wind gusts is poorly understood (despite research efforts in several countries) and not necessarily accounted for in existing safety criteria for train slipstreams (2).
As the wake behind a train is turbulent, an object or person exposed to it will experience rapidly changing forces acting in a range of different directions. People waiting on platforms can be startled or lose their balance, causing them to fall and be injured. The gusts can blow dust, snow, and debris towards them, and loose items or equipment on the platform can be lifted or thrown about. Child strollers, wheelchairs and baggage carts can be pushed or overturned (2). Fatalities have occurred when child strollers were blown into the side of the train. The majority of serious incidents recorded in Europe were caused by freight trains running past platforms: they represent the worst case due to their poor aerodynamics, despite running at lower speed than HSTs. Nevertheless, it is important to limit the speed of non-stopping HSTs as they pass platforms.
Impacts on Track Workers
Impacts on track workers are potentially the same as those on passengers on platforms, principally injuries from falling. Compared to passengers on a raised platform, track workers may be standing at a lower position relative to the train, especially if the track is on ballast. They may therefore be exposed to the most turbulent part of the slipstream associated with the wheels and the trucks where air velocities are highest.
Industry Standards and Recommended Best Practices
In the United States, no standard or regulation was found relative to aerodynamic effects for safe distances between people and passing trains. Where safe distance lines are present, they are designed to keep the passengers from falling onto the tracks or being hit by a train, rather than to protect them from aerodynamic effects. In the Northeast Corridor, the distances between the line and the platform edges ranged from less than 2 ft. to over 4 ft. (0.6-1.2 m) (3). More recently, AMTRAK started marking 38 inch (1.0 m) wide safety zones on these platforms, with some recommendations for lines being marked at 5.25 ft. from the platform edge.
An overview of minimum safe distances from passing trains for different countries is given in Table 1 below (2,3,4). These distances should be compared with caution due to the differences between these countries’ design guidelines for elements such as platform height, track gage, and train width.
© AREMA 2014 3
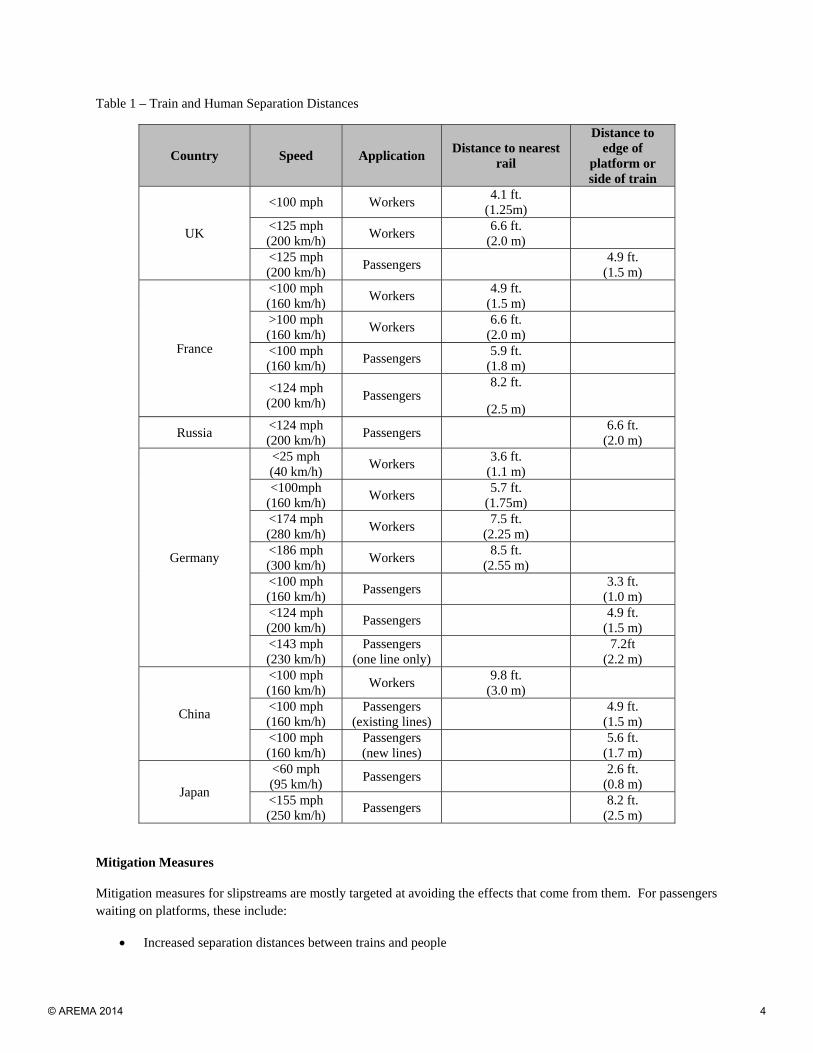
Table 1 – Train and Human Separation Distances
Country Speed Application Distance to nearest
rail
Distance to edge of
platform or side of train
UK
<100 mph Workers 4.1 ft.
(1.25m)
<125 mph (200 km/h)
Workers 6.6 ft.
(2.0 m)
<125 mph (200 km/h)
Passengers 4.9 ft.
(1.5 m)
France
<100 mph (160 km/h)
Workers 4.9 ft.
(1.5 m)
>100 mph (160 km/h)
Workers 6.6 ft.
(2.0 m)
<100 mph (160 km/h)
Passengers 5.9 ft.
(1.8 m)
<124 mph (200 km/h)
Passengers 8.2 ft.
(2.5 m)
Russia <124 mph (200 km/h)
Passengers 6.6 ft.
(2.0 m)
Germany
<25 mph (40 km/h)
Workers 3.6 ft.
(1.1 m)
<100mph (160 km/h)
Workers 5.7 ft.
(1.75m)
<174 mph (280 km/h)
Workers 7.5 ft.
(2.25 m)
<186 mph (300 km/h)
Workers 8.5 ft.
(2.55 m)
<100 mph (160 km/h)
Passengers 3.3 ft.
(1.0 m) <124 mph (200 km/h)
Passengers 4.9 ft.
(1.5 m) <143 mph (230 km/h)
Passengers (one line only)
7.2ft
(2.2 m)
China
<100 mph (160 km/h)
Workers 9.8 ft.
(3.0 m)
<100 mph (160 km/h)
Passengers (existing lines)
4.9 ft.
(1.5 m) <100 mph (160 km/h)
Passengers (new lines)
5.6 ft.
(1.7 m)
Japan
<60 mph (95 km/h)
Passengers 2.6 ft.
(0.8 m) <155 mph (250 km/h)
Passengers 8.2 ft.
(2.5 m)
Mitigation Measures
Mitigation measures for slipstreams are mostly targeted at avoiding the effects that come from them. For passengers waiting on platforms, these include:
Increased separation distances between trains and people
© AREMA 2014 4
Speed Limits for platform tracks
Safe marking distances on platforms
Warning devices for approaching trains
Securing loose items
Separate “Passage Tracks”
Train Screens
For track workers, the current United States Code of Federal Regulations Title 49 Part 214 Subpart C (Roadway Worker Protection) (5) states that upon notification of an approaching train, workers must cease work and move from the track occupied by the approaching train to a predetermined place of safety. Furthermore, workers working on a track adjacent to the track occupied by the approaching train must also move to a predetermined place of safety. But the regulations do not specify the minimum distance between the tracks and the place of safety.
In Europe and Asia the safety of track workers is achieved by specifying a minimum standard of aerodynamic performance of the train (6). A further essential component is to specify the “place of safety” in terms of minimum distance from the track at which track workers may stand. Specified “place of safety” distances for some of the European countries are shown in Table 1. These vary with line speed, and the existing rules do not cover speeds as high as 250 mph.
OPEN AIR CONSIDERATIONS OF TRAINS MEETING AND PASSING
Nature and Key Characteristics
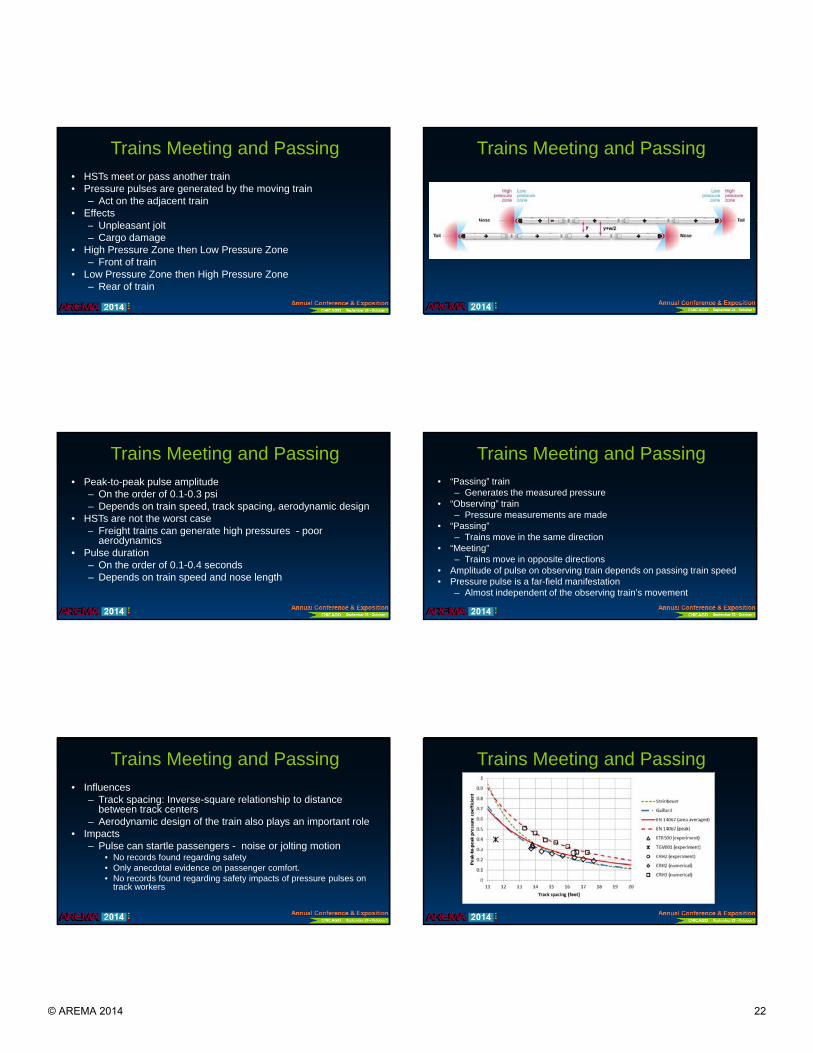
As an HST meets or passes another train, pressure pulses are generated by the moving train that act on the adjacent train. The magnitude of these pressures can cause effects ranging from an unpleasant jolting felt by a train passenger to the potential of cargo damage to the adjacent train.
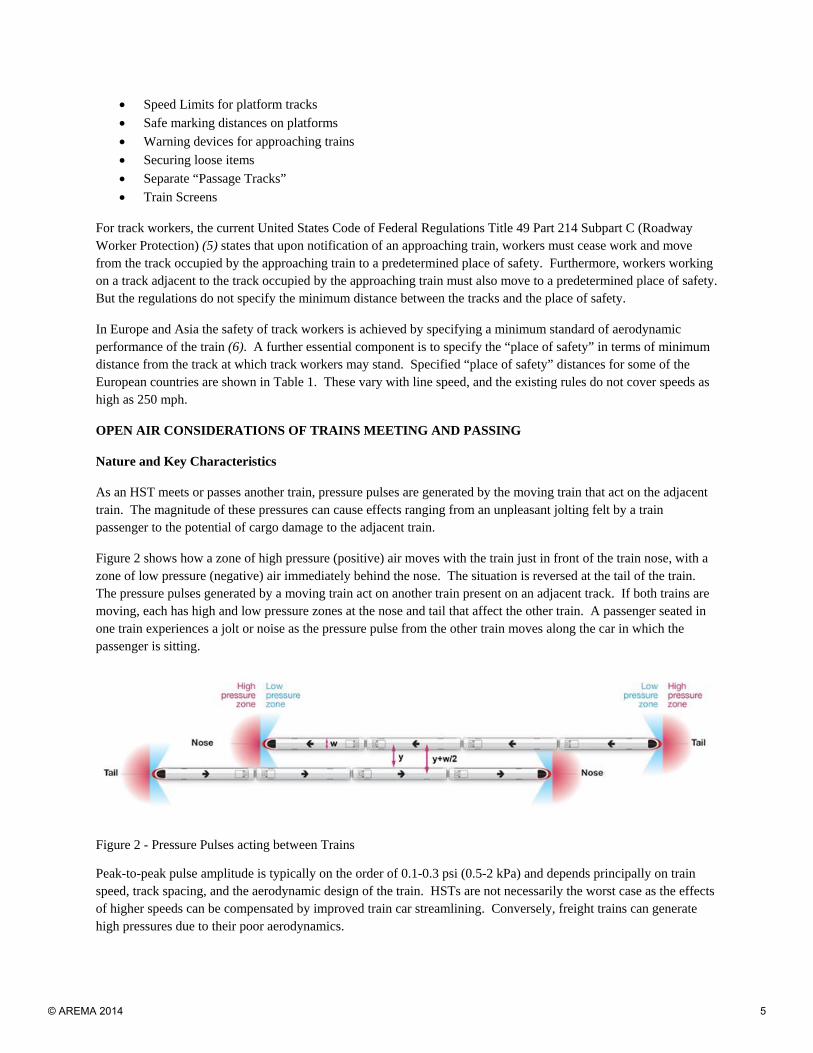
Figure 2 shows how a zone of high pressure (positive) air moves with the train just in front of the train nose, with a zone of low pressure (negative) air immediately behind the nose. The situation is reversed at the tail of the train. The pressure pulses generated by a moving train act on another train present on an adjacent track. If both trains are moving, each has high and low pressure zones at the nose and tail that affect the other train. A passenger seated in one train experiences a jolt or noise as the pressure pulse from the other train moves along the car in which the passenger is sitting.
Figure 2 - Pressure Pulses acting between Trains
Peak-to-peak pulse amplitude is typically on the order of 0.1-0.3 psi (0.5-2 kPa) and depends principally on train speed, track spacing, and the aerodynamic design of the train. HSTs are not necessarily the worst case as the effects of higher speeds can be compensated by improved train car streamlining. Conversely, freight trains can generate high pressures due to their poor aerodynamics.
© AREMA 2014 5
Pulse duration depends on a train’s speed and nose length and is on the order of 0.1-0.4 seconds (7,8,9,10,11,12,13). The pressure pulse associated with the train nose is greater than the pulse associated with the train tail and these pressure pulses depend heavily on train shape (14). Smaller pressure pulses may arise from the gaps between railcars, from the point where two train sets are joined into a multiple unit, or from pantograph cowls.
When describing measurements of pressure pulses, one train is described as the “passing” train (which generates the measured pressure) and the other train is the “observing” train (on which the pressure measurements are made). In the United States, the general practice is to use the term “passing” to describe a situation where trains move in the same direction at different speeds (or if one of the trains is stationary), and to use the term “meeting” if the two trains are moving in the opposite directions.
Train speed strongly influences the magnitude of a pressure pulse, with the magnitude of the pressure peak on an observing train being proportional to the square of the speed of the passing train. If both trains are moving, the amplitude of pressure change on the observing train’s surface depends mainly on the speed of the passing train, while the speed of the observing train has a lesser effect (15,16,17,18,19). This is because the pressure pulse is a far-field manifestation of the passing train’s nose surface pressure distribution, which is almost independent of the observing train’s movement.
Track spacing has a major influence on the magnitude of pressures experienced by trains passing/meeting. There is approximately an inverse-square law relating pressure on passing trains to the distance between the track center of the passing train and the surface of the observing train (20).
Aerodynamic design of the train also plays an important role in determining the pressures acting between passing/meeting trains (11,12).
Impacts on Passengers
The impact of a pressure pulse from a train is described in terms of passengers being startled by a noise or uncomfortable lateral acceleration (jolting motion) (21). Although one might imagine such dynamic disturbances leading to safety concerns, the authors found no records of such in the literature, and only anecdotal evidence of the effects noted previously on passenger comfort.
Impacts on Track Workers
As with the situation of people waiting on platforms, the authors found no records in the literature regarding safety impacts of pressure pulses (as distinct from slipstreams) on track workers. This may be related to the requirement for track workers to be away from the track and in place of safety during a train passage.
Industry Standards and Recommended Best Practices
Standards exist in the EU (Technical Standards for Interoperability (TSI)) (22), in China (TB10621-2009, section 6.2.3) (23), and in other countries relating to track spacing for HSTs as the mitigation measure for aerodynamic loads during train meeting (see Table 2). The spacings in Table 2 are based on maximum speeds no greater than 217 mph (350 km/h).
The track spacing criteria are based largely on experience of successful operation of high-speed railways, and are known to prevent potential aerodynamic impacts such as:
Adverse effects on passenger comfort and safety
Damage to train bodies, windows, and glazing failure
Excessive lateral acceleration of trains during passing and meeting
© AREMA 2014 6

Risk of derailment and rollover
While no regulations have yet been promulgated in the USA for this phenomenon, the Tier 2 situation in the United States is experienced on Acela with its current speeds, and has been studied extensively (9,10,24). It is anticipated that for Tier 3 operations in the United States there will be a large separation from conventional tracks. Where new Tier 3 trains will run on existing lines, such as approaches to city terminals, current speed limits will apply such that aerodynamic interactions are no worse than those currently experienced. Therefore, for Tier 3 trains the aerodynamic impacts with conventional passenger trains or freight trains can be assumed to be mitigated.
Mitigation Measures
Track Separation
The key standard mitigation measure to minimize the aerodynamic effects from train meeting/passing is to increase the minimum center-to-center distance between the adjacent tracks (see Table 2).
In the United States, regulations for track spacing for conventional rail lines (which do not consider aerodynamics) vary between jurisdictions. AREMA recommended best practices state a 14 ft (4.3 m) track spacing, but this recommendation is not based on high-speed operations. Many railroads have adopted 15 ft (4.6 m) minimum spacing, although some older lines have spacing as small as 13 ft (4.0 m) (25). In the Northeast Corridor, where high-speed trains are currently operated, minimum spacing on main lines is 13 ft (4.0 m) (17).
Table 2 – Track Separation Distances (center to center)
Country Railway line Design speed Max service
speed Min track
spacing
Japan Tokaido Shinkansen 167 mph
(270 km/h ) 13.8 ft (4.2 m)
Japan Sanyo Shinkansen 186 mph
(300 km/h ) 186 mph
(300 km/h) 14.1 ft (4.3 m)
Japan Tokyo Joetsu Shinkansen
171 mph
(275 km/h) 14.1 ft (4.3 m)
Korea KTX 217 mph
(350 km/h) 186 mph
(300 km/h) 16.4 ft (5.0 m)
Taiwan THSR 217 mph
(350 km/h) 186 mph
(300 km/h) 14.8 ft (4.5 m)
France SNCF TGV Southeast 186 mph
(300 km/h) 167 mph
(270 km/h) 13.8 ft (4.2 m)
France SNCF TGV
Mediterranean 217 mph
(350 km/h) 186 mph
(300 km/h) 15.7 ft (4.8 m)
Sweden BV Botniabanan 155 mph
(250 km/h) 155 mph
(250 km/h) 13.8 ft (4.2 m)
Germany ICE Frankfurt-Cologne 186 mph
(300 km/h) 186 mph
(300 km/h) 14.8 ft (4.5 m)
China Beijing-Shanghai 217 mph
(350 km/h)
16.4 ft (5.0 m)
China (regulations) 155 mph
(250 km/h)
15.1 ft (4.6 m)
China (regulations) 186 mph
(300 km/h)
15.7 ft (4.8 m)
China (regulations) 217 mph
(350 km/h)
16.4 ft (5.0 m)
USA Amtrak Acela 150 mph
(241 km/h) 13.0 ft (4.0 m)
© AREMA 2014 7
Country Railway line Design speed Max service
speed Min track
spacing
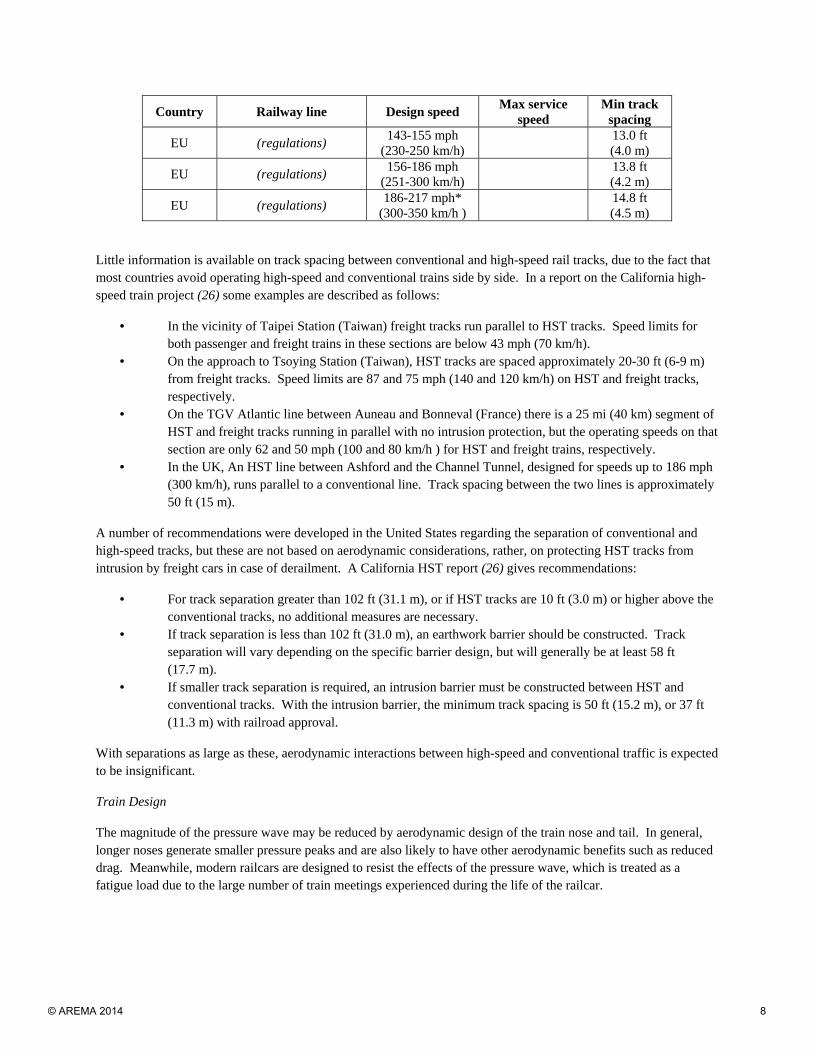
EU (regulations) 143-155 mph
(230-250 km/h)
13.0 ft (4.0 m)
EU (regulations) 156-186 mph
(251-300 km/h)
13.8 ft (4.2 m)
EU (regulations) 186-217 mph*
(300-350 km/h )
14.8 ft (4.5 m)
Little information is available on track spacing between conventional and high-speed rail tracks, due to the fact that most countries avoid operating high-speed and conventional trains side by side. In a report on the California high-speed train project (26) some examples are described as follows:
• In the vicinity of Taipei Station (Taiwan) freight tracks run parallel to HST tracks. Speed limits for both passenger and freight trains in these sections are below 43 mph (70 km/h).
• On the approach to Tsoying Station (Taiwan), HST tracks are spaced approximately 20-30 ft (6-9 m) from freight tracks. Speed limits are 87 and 75 mph (140 and 120 km/h) on HST and freight tracks, respectively.
• On the TGV Atlantic line between Auneau and Bonneval (France) there is a 25 mi (40 km) segment of HST and freight tracks running in parallel with no intrusion protection, but the operating speeds on that section are only 62 and 50 mph (100 and 80 km/h ) for HST and freight trains, respectively.
• In the UK, An HST line between Ashford and the Channel Tunnel, designed for speeds up to 186 mph (300 km/h), runs parallel to a conventional line. Track spacing between the two lines is approximately 50 ft (15 m).
A number of recommendations were developed in the United States regarding the separation of conventional and high-speed tracks, but these are not based on aerodynamic considerations, rather, on protecting HST tracks from intrusion by freight cars in case of derailment. A California HST report (26) gives recommendations:
• For track separation greater than 102 ft (31.1 m), or if HST tracks are 10 ft (3.0 m) or higher above the conventional tracks, no additional measures are necessary.
• If track separation is less than 102 ft (31.0 m), an earthwork barrier should be constructed. Track separation will vary depending on the specific barrier design, but will generally be at least 58 ft (17.7 m).
• If smaller track separation is required, an intrusion barrier must be constructed between HST and conventional tracks. With the intrusion barrier, the minimum track spacing is 50 ft (15.2 m), or 37 ft (11.3 m) with railroad approval.
With separations as large as these, aerodynamic interactions between high-speed and conventional traffic is expected to be insignificant.
Train Design
The magnitude of the pressure wave may be reduced by aerodynamic design of the train nose and tail. In general, longer noses generate smaller pressure peaks and are also likely to have other aerodynamic benefits such as reduced drag. Meanwhile, modern railcars are designed to resist the effects of the pressure wave, which is treated as a fatigue load due to the large number of train meetings experienced during the life of the railcar.
© AREMA 2014 8
Operating Speed
On some German high-speed lines that have mixed traffic, the HSTs are limited to 155 mph (250 km/h) in tunnels to avoid risk of damage to freight trains (27).
PRESSURE WAVE EFFECTS INSIDE TUNNELS
Nature and Key Characteristics
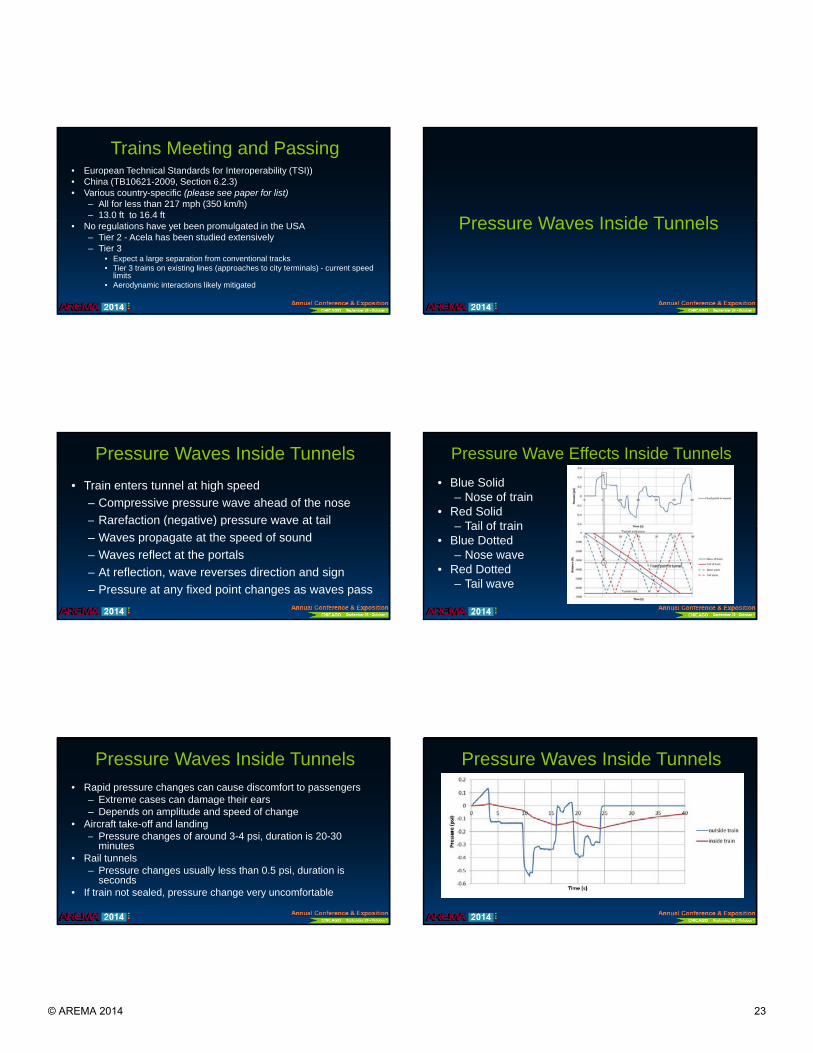
When a train enters a tunnel at high speed, it generates pressure waves in the air in the tunnel. A compressive pressure wave occurs ahead of the nose, and a rarefaction (negative) pressure wave is caused by entry of the tail of the train. The waves propagate along the tunnel at the speed of sound, reflecting at the portals. At each reflection, the sign of the pressure wave changes so that a compression wave becomes a rarefaction wave, and vice-versa. The pressure at any fixed point within the tunnel changes as the pressure waves (and the train) pass as illustrated in the upper graph of Figure 3.
The pressure time-histories may be understood using a wave diagram which tracks the movement of the train and the pressure waves through the tunnel. An example is given in the lower graph of Figure 3. The y-axis is distance along the tunnel, and the entrance and exit of the tunnel is shown at the top and bottom of the graph, respectively.
The blue and red continuous lines indicate the progress of the nose and tail of the train through the tunnel. The dashed lines show the motion of the pressure waves caused by entry of the nose and tail, and the reflections of those waves. As an example of how the diagrams may be read, the pressure drop that occurs shortly after 5 seconds (in the rectangle in the upper graph of Figure 3) is caused by the tail-entry wave passing the measurement point (ringed in the wave diagram).
Pressure waves in tunnels impact the aural comfort and safety of passengers and crew. Aural comfort and safety is frequently a major governing factor in determining the cross-sectional area of high speed rail tunnels, and therefore impacts significantly on the construction cost of new tunnels.
Impacts on Passengers
Rapid pressure changes can cause discomfort to passengers, and in extreme cases ear damage due to pressure differences between the air in the middle ear and the external environment causing a net force on the ear drum. Discomfort from pressure changes depends not only on the amplitude of the pressure change, but also on the speed at which the pressure change occurs and on the aural health of the subject.
As a comparison, in aircraft after take-off and before landing, passengers are subjected to pressure changes of around 3-4 psi (20-30 kPa), much greater than the pressure changes in rail tunnels, but the pressure changes are spread over about 20-30 minutes. In rail tunnels, the pressure changes experienced by passengers are usually less than 0.5 psi (3.4 kPa) but occur over seconds.
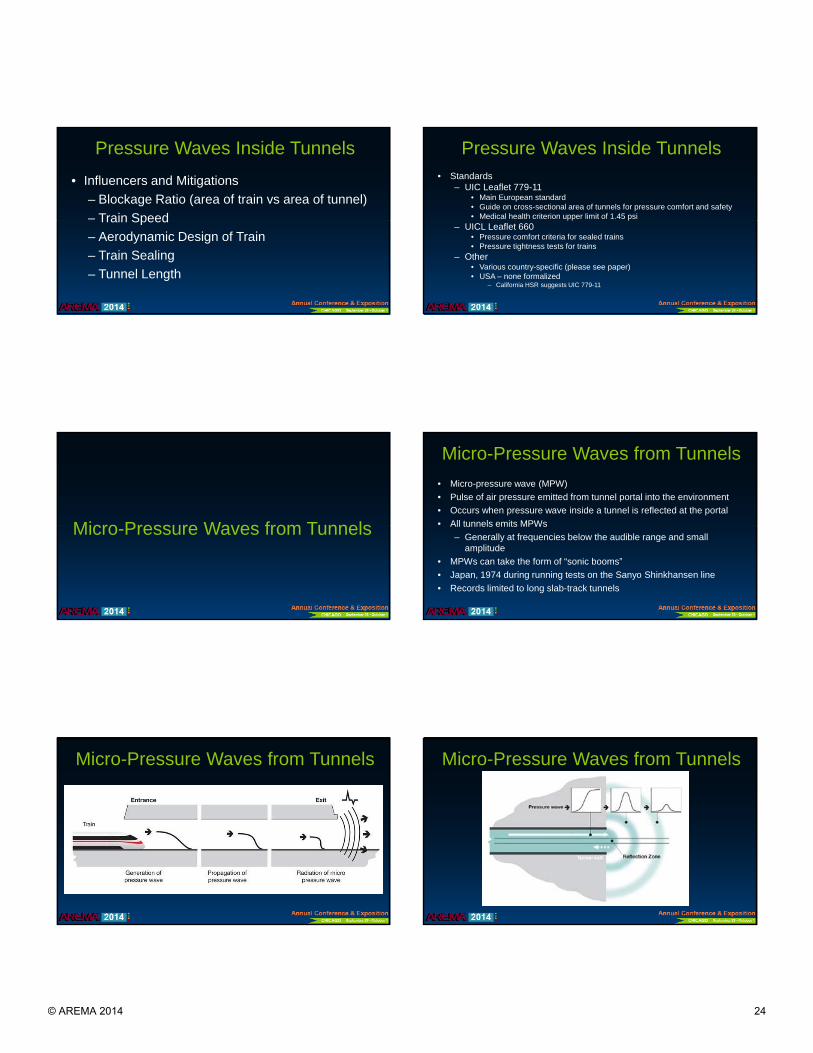
Modern HSTs are sealed to protect passengers from pressure changes but the sealing systems are not perfect. Air leaks into and out of the railcars causing pressure changes inside the railcars. But these are slower and often lower in amplitude than the pressure changes outside the train. This is illustrated in Figure 4.
Although the sealing system illustrated by the example in Figure 4 reduces the amplitudes and rates of pressure change experienced by passengers, it could still be insufficient to meet the desired level of comfort. If that were the case, a larger tunnel cross sectional area or other mitigation measures would be required. Consequently, pressure is a factor in determining the cross sectional area of high-speed rail tunnels.
© AREMA 2014 9

Figure 3 – Example Wave Diagram for Pressure at a Fixed Point Inside a Tunnel
Figure 4 – Effect of Train Sealing System on Pressure Experienced by Passengers
Impacts on Track Workers
Within the context and scope of this paper, it is assumed that in normal conditions no track workers would be present in a high-speed railway tunnel during HST operations. However, it is conceivable that a twin-track tunnel could have track workers present during the passage of trains. In such a case, the track workers could be exposed to
© AREMA 2014 10
pressure changes on a very regular basis and therefore might require lower pressure change limits than passengers who are exposed to pressure changes only occasionally. If protection of track workers became the governing case for design of tunnels, it might be concluded that track workers should not be present in the tunnels during operation of a high speed railway, or that substantially reduced speed limits should be imposed when workers were present.
Industry Standards and Recommended Best Practices
This phenomenon has a significant impact on humans, and is very well understood. Consequently, the standards relating to control of pressure waves in tunnels are well developed. The following list of standards is not exhaustive, but provides a sample and summary of the current most relevant standards.
Passengers in Train, Train Crew, and Workers Comfort and Safety
The European TSI for Infrastructure (22) mandates the “medical safety limit” on pressure changes in tunnels. The limit must be respected even in the extreme case of the train sealing system failing (for example, due to window breakage). At each point on the train, excluding any effect of the sealing system, the maximum variation of pressure (i.e., the difference between the maximum and minimum pressures occurring at any time during transit through the tunnel at that point on the train) must be less than 1.45 psi (10 kPa).
UIC Leaflet 779-11 (28) is the main European standard. It provides a guide to selecting the cross-sectional area of tunnels for pressure comfort and safety for certain cases. Included in the standard are:
• Guidance on calculating the train and tunnel cross-sectional areas. • Graphs from which the pressure changes in 1-second, 4-second and 10-second periods may be
estimated, excluding any effects of the train sealing system • Notes on the 1.45 psi (10 kPa) upper limit medical health criterion. • Curves for designing tunnels to the “Medical health limit”. • Notes on pressure tightness of trains and proposed “baseline” pressure comfort criteria for sealed
trains. • Discussion about pressure comfort criteria, lists of criteria used internationally, and ERRI’s
recommended “baseline pressure comfort criteria”.
UICL Leaflet 660 (29) sets out further pressure comfort criteria for sealed trains and describes pressure tightness tests for trains.
A range of different pressure comfort criteria are adopted internationally. None of these are mandatory, and are adopted as a commercial choice of the carrier. The criteria for unsealed trains generally pre-date the introduction of pressure-sealed rolling stock and represent a much lower standard of comfort than would be expected for high-speed rail passengers today.
In the United States, the Subway Environmental Design Handbook (30) recommends limiting the maximum pressure change rate in subway cars to 0.06 psi/sec (414 Pa/sec).
“Baseline comfort” criteria are given in UIC leaflet 779-11 for sealed trains. UIC have stipulated that these should be non-mandatory because it should be the prerogative of the operator to decide on matters of comfort, based on commercial considerations. The criteria are intended to form a lenient baseline to be applied in all cases, including rare events of trains meeting in tunnels. Many operators might choose to adopt more stringent criteria.
The UIC 660 criteria for sealed trains were developed first by Deutsche Bahn and have been used extensively in Europe to design tunnels, primarily single-tube tunnels containing two high-speed tracks.
© AREMA 2014 11
The authors found no formal criteria for pressure comfort in sealed trains in the United States. In 2009, California High-Speed Rail Authority recommended using the medical safety criterion from UIC 779-11 to design the tunnels for California HSR (31).
Influencing factors and Mitigation Measures
Mitigation measures for pressure waves inside tunnels are developed based on a number of influencing factors. The complex details of each of these factors are beyond the scope of this paper, but are well understood and can be researched by those interested. They are discussed briefly here.
Blockage Ratio
The blockage ratio is a fundamental property of the train/tunnel system, and is defined as the ratio of the cross-sectional area of the train relative to the cross-sectional area of the tunnel. The greater the blockage ratio, the larger the pressure waves in the tunnel. Increasing the tunnel cross-section reduces the pressure wave magnitudes inside the tunnel. Typical high-speed rail tunnels have blockage ratios in the range 0.1 to 0.2.
Train Speed
The pressure wave amplitude depends approximately on train speed squared. Due to the complex patterns of superposition of the pressure waves and the effects of train sealing, the pressure changes experienced by passengers and crew do not scale exactly with the amplitudes of the train entry and exit pressure waves, and therefore they do not scale exactly with train speed squared. However, slower speeds produce smaller pressures.
Aerodynamic Design of the Train
The amplitudes of the pressure waves depend to a small extent on the shapes of the nose and tail of the train. A bluff-nosed train creates a bigger pressure wave than a train of the same cross-sectional area with an elongated, streamlined nose. Similarly, the shape of the tail of the train affects the amplitude of the tail entry wave.
Friction on the sides of a train can add significantly to the amplitudes of the pressure changes in a tunnel. Reducing aerodynamic friction and making a train more streamlined will produce smaller pressures.
Train Sealing
Modern HSTs are designed to be fairly pressure-tight, but no train is perfectly sealed. When the pressure increases outside the train, air leaks in slowly, leading to a gradual increase of pressure inside the train. Train sealing performance is usually expressed as a time constant – the longer the time-constant, the better the sealing. The time constant is defined as the rate of change of pressure inside the train. The sealing of the train is beneficial to passenger comfort by slowing the pressure changes inside the train.
Tunnel Length
Pressure changes in tunnels occur due to pressure waves and their reflections. The length of the tunnel influences the pressure changes in three ways.
• Large pressure changes can occur when the reflected nose wave passes over the train. The timing of this event depends on the length of the tunnel.
• Coincidences of two waves (i.e., the tail entry wave and the reflected nose wave) reaching the train simultaneously can amplify the short term pressure change. The time of arrival of the reflected waves depends on the length of the tunnel.
© AREMA 2014 12
• As a pressure wave propagates along a tunnel, its amplitude reduces due to friction effects. Thus, in a long tunnel the reflected waves are smaller than they would be in a shorter tunnel.
Other Trains in the Tunnel
Where a tunnel contains more than one track, the pressure waves from two or more trains occupying the tunnel will be present in the tunnel simultaneously. The timing of entry of the two trains could be such that a coincidence of pressure waves occurs, leading to pressure changes that are especially severe, although such “worst-case” combinations occur only rarely. This has important consequences for the criteria used in the design of twin-track tunnels.
Air Shafts
Air shafts can have a significant influence on pressure comfort. The effect is beneficial in most cases, although the optimum cross-sectional area of a shaft for pressure comfort does not necessarily coincide with the optimum for other purposes, such as ventilation or emergency egress. Sizing must be coordinated with the various shaft functions.
MICRO-PRESSURE WAVES EMITTED FROM TUNNELS
Nature and Key Characteristics
A micro-pressure wave (MPW) is a pulse of air pressure that is emitted from a tunnel portal into the environment whenever any pressure wave inside a tunnel is reflected at the portal. Every railway tunnel in the world emits MPWs if a train is traveling through it. These are generally at frequencies below the audible range and of such small amplitude that they are not noticed. However, MPWs can take the form of “sonic booms” and can be very loud. These were first experienced in Japan in 1974 during running tests on the Okayama-Hakata extension of the Sanyo Shinkhansen line. Booming noises were heard at tunnel exits and residents complained of rattling windows and shutters. Records of audible MPWs have so far been limited to long slab-track tunnels, but as operating speeds increase towards 250 mph there is potential for all tunnels to generate them.
The phenomenon is well-understood, methods are available to assess it, and there are known mitigation measures to control it. However, the boundaries of acceptability for MPWs are not quantified and this presents uncertainty for the design of tunnels especially in the early phases. The phenomenon is extensively described in the literature (32).
When considering aerodynamic effects in tunnels, such as aural comfort of passengers, the property of the pressure wave that is of primary interest is its magnitude. However, for MPWs it is the pressure gradient that matters most. The amplitude of the MPW experienced outside the tunnel is proportional to the gradient of the pressure wave inside the tunnel as it approaches the tunnel exit. Pressure gradients greater than about 5.8 psi/sec (40 kPa/sec) at the tunnel exit may result in MPWs with strong audible frequency components (32).
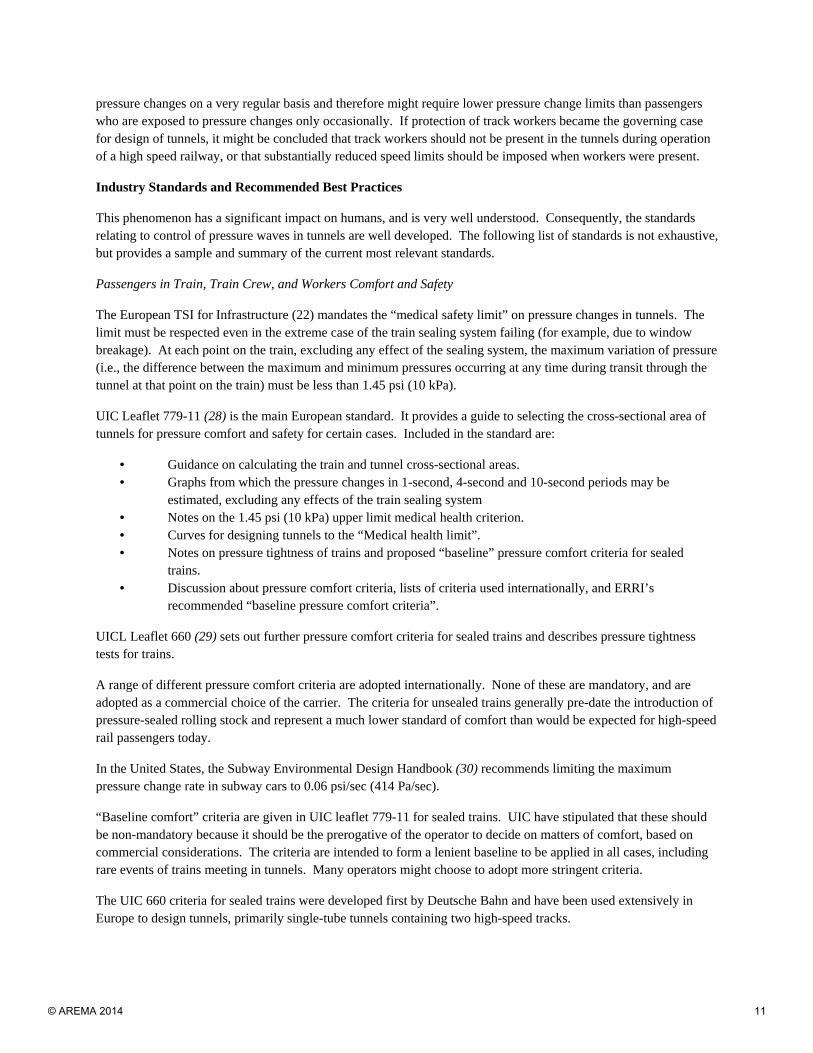
The generation and transmission of MPWs take place in four phases (see Figure 5):
1. Generation of a pressure wave inside a tunnel, typically caused by the nose of the train entering the tunnel.
2. As the pressure wave propagates down the tunnel at the speed of sound (approximately 762 mph) the gradient of the pressure wave may increase (“steepening”) especially in long slab-track tunnels.
3. When the wave reflects from the tunnel exit, a proportion of the energy is radiated into the surrounding environment as an MPW.
4. The MPW wave propagates through the air to receptors such as windows and human ears.
© AREMA 2014 13
Figure 5 – Propagation of Micro-Pressure Wave
Impacts on People
The impact is principally one of annoyance for people near the tunnel exit. When the tunnel is long, the impact may be increased by a “surprise” effect: the MPW is emitted before the approaching train can be heard, so there is no prior warning of the disturbance.
Doors and windows or other parts of buildings near the tunnel portals may rattle or vibrate, causing annoyance to residents, although the authors found no records of structural damage to buildings due to MPWs.
Impacts on Track Workers
Track maintenance staff working near a tunnel exit may hear an unpleasant or frightening noise, such as a loud bang or a low booming noise.
Industry Standards and Recommended Best Practices
Japan was the first country to experience MPW problems and to develop mitigation measures. In much of the literature found by the authors, it was assumed that the Japanese acceptability criterion is 0.003 psi (20 Pa) at 66 ft. (20 m) from the center of the portal. The empirical experience was that, when the MPW amplitude was reduced by mitigation measures to 0.003 psi at 66 ft., the adverse impacts disappeared (34).
In Korea, the 0.003 psi (20 Pa) limit is applied at the distance of the “nearest observer”, which could be interpreted as a building or highway or other point of public access. This results in MPW acceptability criteria being different for each tunnel. Higher MPW amplitudes could be tolerated from a tunnel portal that is several miles away from any buildings, highways, or towns, compared to a tunnel portal in a residential area.
Deutsche Bahn established noise-based MPW acceptability criteria as follows (35,36):
• At the nearest dwelling or sensitive building, the C-weighted Sound Exposure Level (SEL) should not exceed 70 dB(C). Higher limits apply to garden plots (85 dB(C)) and industrial areas (95 dB (C)).
• At 25 m (82 ft.) from the tunnel portal, the C-weighted Sound Peak Level should not exceed 115 dB(C).
• Independent of the acoustic assessment of MPWs, the A-weighted SEL must be in accordance with German traffic noise regulations.
© AREMA 2014 14
No clauses were found related to MPWs in the current versions of the European TSIs but it is thought that future versions of the Infrastructure TSI may set limits on the pressure gradient inside the tunnel. No standards or recommended best practices were found for MPWs in HST tunnels in North America.
Mitigation Measures
Mitigation measures are typically applied to attenuate the noise emitted from the tunnel portals.
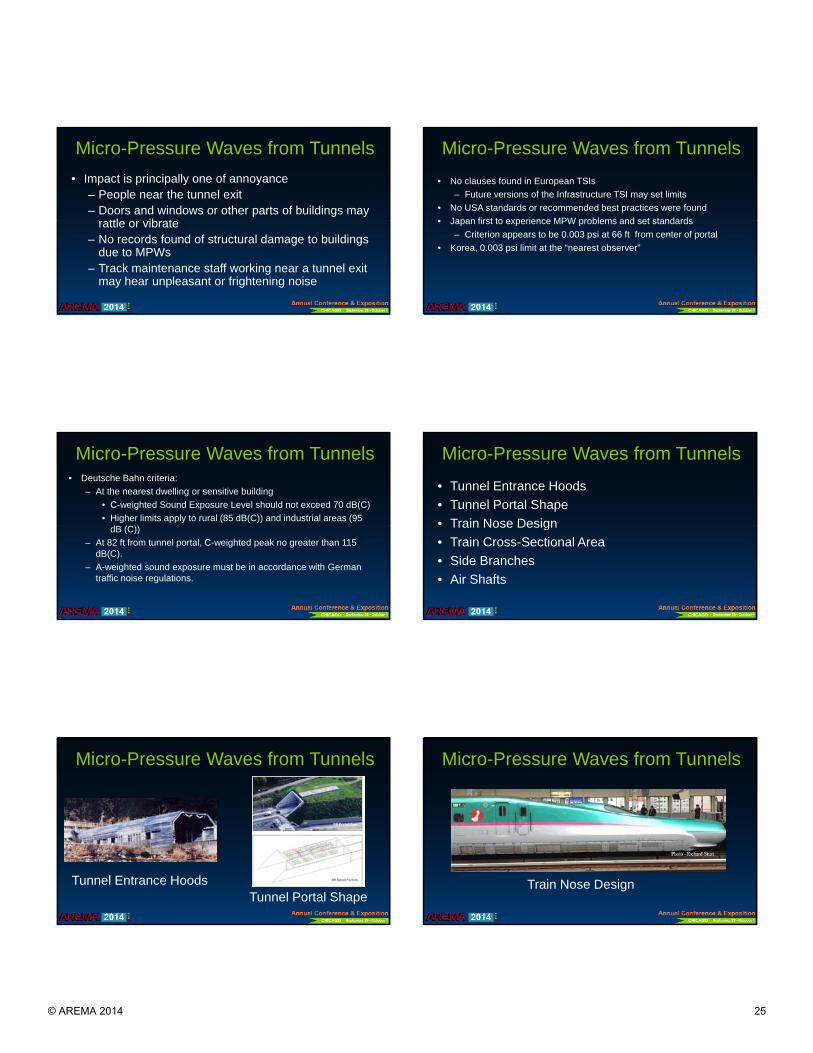
Tunnel Entrance Hoods
The most commonly adopted mitigation measure is to fit the tunnel with an entrance hood designed to reduce the gradient of the pressure wave generated when the train enters the tunnel. Designs vary, but typical hoods in use today are between 60 and 250 feet long, and have a uniform cross-sectional area between 1.3 and 1.5 times the cross-sectional area of the main tunnel. The required length of hood for a given tunnel increases strongly with train speed. The hoods contain holes through which air can escape.
Tunnel Portal Shape
A small reduction of pressure wave gradient may be obtained by sloping the entrance portal. This type of entrance is sometimes referred to as a scarfed portal with the portal plane inclined at 45 to 60 degrees to the vertical. Small reductions of pressure gradient are unlikely to suffice as the sole mitigation measure for unacceptable MPWs, but might form part of a package of mitigation measures.
Train Nose Design
The duration of the nose-entry period can alternatively (or additionally) be increased using a long tapering nose region on the train, thus reducing the pressure gradient. Some Japanese Shinkansen trains have tapering noses over 40 feet (12 m) long. The purpose of these is to allow trains to run at higher speeds without modifying the existing tunnels and without causing unacceptable MPWs.
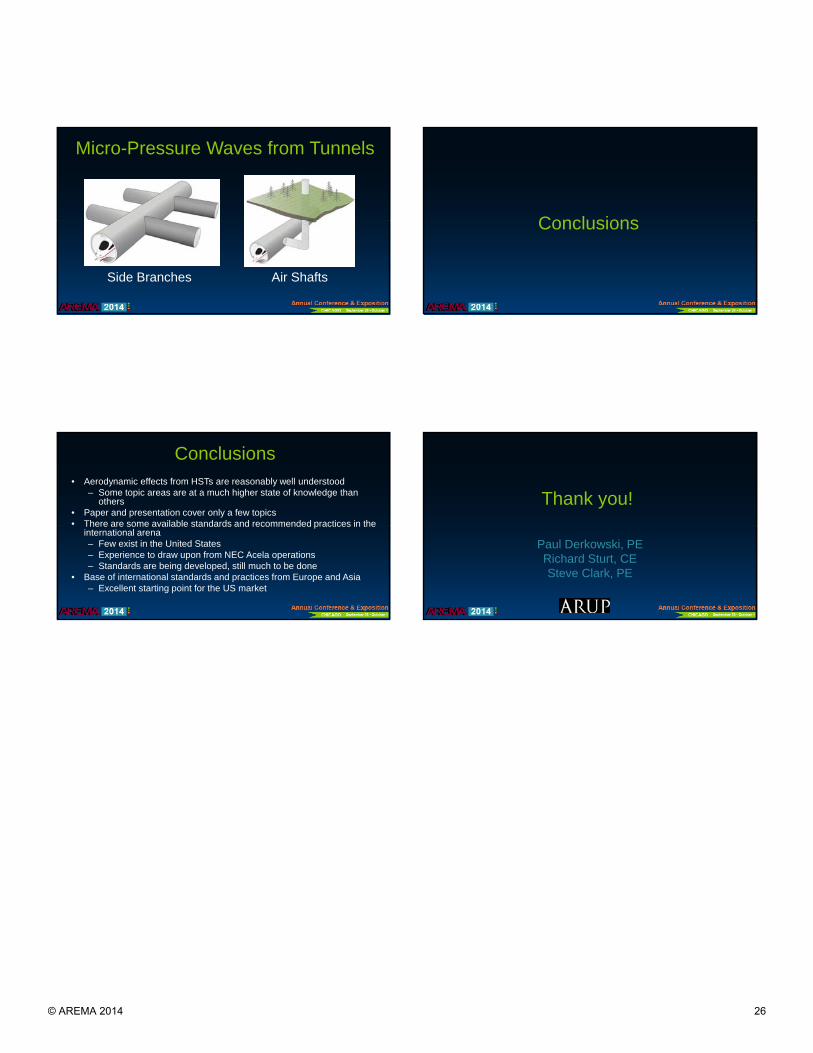
Closed Side Branches
Closed side branches are short blind tunnels perpendicular to the main tunnel. These help to reduce the gradient of the pressure wave as it propagates along the tunnel because some of the pressurized air at the front of the wave passes into the side branches, thus delaying the build-up of pressure downstream.
Air Shafts
Air shafts can attenuate pressure waves and thereby reduce both their gradient and their tendency to shorten. Shafts can therefore be an effective mitigation measure for the “classic” MPWs caused by the initial entry of the nose of the train into the tunnel. However, shafts themselves can cause unacceptable MPWs, if not properly designed.
Links Between Tunnel Bores
For twin-bore tunnels, it may be possible to use cross-passages or additional ducts between the bores to mitigate MPWs. Although the doors leading from the tunnel to the cross-passages would normally be closed, holes could be provided to allow a controlled flow of air from one bore to the other.
Acoustic Absorbers
Euerwang tunnel in Germany suffered sonic booms, and was retro-fitted with acoustical track absorbers (37). The absorbers are a commercial product designed to reduce vibration from trains, but also have the effect of attenuating the wave steepening within the tunnel. The absorbers consist of plates of porous expanded clay glued to the slab.
© AREMA 2014 15

Speed Restrictions
A very effective method of reducing MPWs is to reduce the speed of entry of the train into the tunnel. The speed could increase once the train is inside the tunnel. This mitigation measure has the obvious advantage of having no incremental construction cost, but the disadvantage of an impact on journey time.
CONCLUSIONS
The subject of aerodynamic effects from HSTs is reasonably well understood, with some topic areas at a much higher state of knowledge than others. For most high-speed railway issues there are available standards and recommended practices in the international arena, but few exist in the United States. There is some good experience to draw upon from the North East Corridor’s Acela operations, and some standards are being developed in support of projects in California, Florida, Texas, and the Mid-West. But there is still much to be done.
The authors suggest that the base of international standards and practices from Europe and Asia provide an excellent starting point as standards and guidelines are developed for the US market.
ACKNOWLEDGEMENTS
The authors wish to acknowledge that the foundation for this important work is being funded by the United States Federal Railroad Administration. The authors also wish to acknowledge the contributions from those whom without their work this paper would not have been possible: Jeffrey Gordon of the Federal Railroad Administration; Nicholas Wilson, Curtis Urban, and Alexander Keylin of the Transportation Technology Center, Inc.; Professor Chris Baker of Birmingham University (UK); and, Professor Alan Vardy of Dundee University (UK).
REFERENCES
1. C. Baker, A. Quinn, M. Sima, L. Hoefener, and R. Licciardello, "Full scale measurement and analysis of train slipstreams and wakes: Part 1 Ensemble averages," Proceedings of the Institute of Mechanical Engineers, Part F: Journal of Rail and Rapid Transit, 2013.
2. C. Pope, "Effective management of risk from slipstream effects at trackside and platforms," RSSB, Ed., ed, 2008.
3. H. Lee, "Assessment of potential aerodynamic effects on personnel and equipment in proximity to high-speed train operations," US Department of Transportation DOT/FRA/ORD-99/11, 1999.
4. J. Temple and T. Johnson, "Review of train slipstream effects on platforms," RSSB Report2004. 5. 49 CFR 214 C. Roadway Worker Protection, 2011. 6. "Commission decision of 21 February 2008 concerning a technical specification for interoperability
relating to the ‘rolling stock’ sub-system of the trans-European high-speed rail system," vol. L84, ed. Official Journal of the European Union: Commission of The European Communities, 2008, pp. 132-392.
7. K. Fujii and T. Ogawa, "Aerodynamics of high speed trains passing by each other," Computers & fluids, vol. 24, pp. 897-908, 1995.
8. Y. ZHAO, J. Zhang, T. Li, and W. ZHANG, "Aerodynamic performances and vehicle dynamic response of high-speed trains passing each other," Journal of Modern Transportation, vol. 20, pp. 36-43, 2012.
9. S. Holmes and M. Schroreder, "Aerodynamic Effects of High-Speed Passenger Trains on Other Trains," US Department of Transportation FTA-AL-26-7001.3, 2002.
10. R. A. MacNeill, S. Holmes, and H. S. Lee, "Measurement of the aerodynamic pressures produced by passing trains," in Railroad Conference, 2002 ASME/IEEE Joint, 2002, pp. 57-64.
11. J. A. Schetz, "Aerodynamics of high-speed trains," Annual Review of Fluid Mechanics, vol. 33, pp. 371-414, 2001.
© AREMA 2014 16

12. R. S. Raghunathan, H.-D. Kim, and T. Setoguchi, "Aerodynamics of high-speed railway train," Progress in Aerospace sciences, vol. 38, pp. 469-514, 2002.
13. R. Li, J. Liu, Z. Qi, and W. Zhang, "Air pressure pulse developing regularity of high-speed trains crossing in open air," Jixie Gongcheng Xuebao (Chinese Journal of Mechanical Engineering), vol. 47, pp. 125-130, 2011.
14. J. Liu, R. Li, and Z. Qi, "The Influence Factors and Developing Regularity of Air Pressure Pulse as Trains Passing through Each Other," in ICTE 2011, 2011.
15. R. Gawthorpe, "Aerodynamic problems of high speed trains running on conventional track," High Speed Ground Vehicles, vol. 1, 1972.
16. S. Ozawa, Aerodynamic forces on train. Tokyo: JSME, 1990. 17. H. Lee, "Assessment of potential aerodynamic effects on personnel and equipment in proximity to high-
speed train operations," US Department of Transportation DOT/FRA/ORD-99/11, 1999. 18. H.-q. TIAN, P. XU, X.-f. LIANG, and T.-h. LIU, "Correlation between pressure wave of train passing and
running speed," China Railway Science, vol. 27, pp. 64-67, 2006. 19. S.-w. Nam and H.-b. Kwon, "Experimental Study to Measure Aerodynamic Wind Effects of KTX for
Determining the Distance Between Track Centers," in JSME-SKME Thermal and Fluids Engineering Conference, 2008.
20. M. Gaillard, "Aerodynamics of Trains in Tunnels," in International Symposium of Aerodynamics and Tunnel Ventilation of Vehicle Tunnels, 1973.
21. T. Johnson, "Basis of the 1.44kPa criterion for the train passing pressure pulse," RSSB position paper2011. 22. "Commission decision of 20 December 2007 concerning a technical specification for interoperability
relating to the ‘infrastructure’ sub-system of the trans-European high-speed rail system " vol. L 77, ed. Official Journal of the European Union: Commission of The European Communities, 2008, pp. 1-105.
23. "Code for Design of High-speed Railway (TB10621-2009)," ed: Ministry of Railways of the People's Republic of China, 2010.
24. H. S.-H. Lee, "The Aerodynamic Effects of Passing Trains to Surrounding Objects and People," US Department of Transportation DOT-VNTSC-FRA-04-05, 2009.
25. "Close-clearance conditions near railroad tracks: A report to the Iowa Legislature as per Section 24, HF2614, Seventy-Ninth General Assembly," ed: Iowa Department of Transportation, 2002.
26. D. Rulens, "TM 2.1.7: Rolling Stock and Vehicle Intrusion Protection for High-Speed Rail and Adjacent Transportation Systems," Parsons Brinckerhoff for California High-Speed Train Project 2008.
27. G. Novak and J. Koinig, "Increasing the train speed on the new 'Westbahn' Line - aerodynamic loads in tunnels," in Proceedings of the 12th International Symposium on Aerodynamics and Ventilation of Tunnels, 2006, pp. 213-235.
28. "Determination of railway tunnel cross-sectional areas on the basis of aerodynamic considerations," in UIC leaflet 779-11, 2nd edition, UIC, Ed., ed, 2005.
29. UIC, "Measures to ensure the technical compatibility of high speed trains," in UIC leaflet 660, ed, 2002. 30. "Subway Environmental Design Handbook. Volume I. Principles and Applications. Second Edition,"
Transit Development Corporation, Inc. for US DOT Urban Mass Transit Administration, Washington, DC 1976.
31. J. Thompson, "TM 2.4.2: Basic High-Speed Train Tunnel Configuration," Parsons Brinckerhoff for California High-Speed Train Project 2009.
32. A. Vardy, "Generation and alleviation of sonic booms from rail tunnels," Proceedings of The ICE - Engineering and Computational Mechanics, vol. 161, pp. 107-119, 2008.
33. M. Hieke, H. Kaltenbach, and T. Tielkes, "Prediction of micro-pressure wave emissions from high-speed railway tunnels," in Proceedings of the 13th International Symposium on Aerodynamics and Ventilation of Tunnels 2009, 2009, pp. 487-503.
© AREMA 2014 17
34. S. Ozawa, T. Maeda, T. Matsumura, K. Uchida, H. Kajiyama, and K. Tanemoto, "Countermeasures to reduce micropressure waves radiating from exits of Shinkansen tunnels," in Proceedings of the 7th International Symposium on Aerodynamics and Ventilation of Tunnels, 1991, pp. 253-266.
35. C. Gerbig and M. Hieke, "Micro-pressure wave emissions from German high-speed railway tunnels. An approved method for prediction and acoustic assessment," in Proceedings of 11th International Workshop on Railway Noise, 2013.
36. M. Hieke, C. Gerbig, and T. Tielkes, "Mastering micro-pressure wave effects at the Katzenbergtunnel - Design of measures, prediction of efficiency and full-scale test verification," in Proceedings of 11th International Workshop on Railway Noise, 2013.
37. T. Tielkes, H. Kaltenbach, M. Hieke, P. Deeg, and M. Eisenlauer, "Measures to Counteract Micro-pressure Waves Radiating from Tunnel Exits of DB's New Nuremberg-Ingolstadt High-Speed Line," in Noise and Vibration Mitigation for Rail Transportation Systems: Proceedings of the 9th International Workshop on Railway Noise, 2007.
LIST OF TABLES AND FIGURES
Table 1 – Train and Human Separation Distances
Table 2 – Track Separation Distances
Figure 1 – Examples of Slipstream Air Velocities from a Passing Train
Figure 2 - Pressure Pulses acting between Trains
Figure 3 – Example Wave Diagram for Pressure at a Fixed Point Inside a Tunnel
Figure 4 – Effect of Train Sealing System on Pressure Experienced by Passengers
Figure 5 – Propagation of Micro-Pressure Wave
© AREMA 2014 18
AE
RO
DY
NA
MIC
EF
FE
CT
SO
FH
IGH
AE
RO
DY
NA
MIC
EF
FE
CT
S O
F H
IGH
S
PE
ED
TR
AIN
S O
N
PA
SS
EN
GE
RS
AN
D T
RA
CK
WO
RK
ER
S
Pau
l Der
kow
ski,
PE
Ric
hard
Stu
rtC
ER
icha
rd S
turt
, C
ES
teve
Cla
rk,
PE
© AREMA 2014 19

Introduction
• Research and analysis for HST operations
– International state of knowledge
– How it is articulated in standardsHow it is articulated in standards
• Funded by the Federal Railroad Administration
• Guidance manual for HST designers and operators
– US market specific
Introduction
• HSTs planned in the USA– 250 mph operating speeds
• Aerodynamic effects– Safety and comfort– Passengers– People waiting on platforms– Track workers
Introduction
• Extensive list of effects:– Slipstreams– Trains Meeting and Passing (open air)– Pressure Waves Inside Tunnels– Micro-Pressure Waves Emitted from Tunnels
– Wayside structures, crosswinds, drag effects, ballast flight….
Introduction
• Today’s Presentation
– General Nature of Each Phenomena
– Effects on Peoplep
– Overview of Standards, if any
– Mitigations
• Please look at the paper for more details, and watch for the report that will be published by the FRA
Acknowledgements
• Federal Railroad Administration– Jeffrey Gordon
• Transportation Technology Center, Inc.Nicholas Wilson Curtis Urban Alexander Keylin– Nicholas Wilson, Curtis Urban, Alexander Keylin
• Birmingham University (UK)– Professor Chris Baker
• Dundee University (UK)– Professor Alan Vardy (UK).
SlipstreamsSlipstreams
© AREMA 2014 20

Slipstreams• Nose region
– Large inviscid pressure and velocity transients• Thick boundary layer
– Highly turbulent air alongside the train– Thickness is similar to the width and height of the train– Increases towards the back of the train
• Near wake– Large-scale unsteady flow vortices
• Far wake– Velocities gradually decrease
Slipstreams
Slipstream• Depend on the maximum wind speed and duration
– Quantitative effect on human stability is poorly understood
• People waiting on platforms
– Startled or lose their balance
– Gusts blow dust, snow, debris, loose items, equipment
– Child strollers, wheelchairs and baggage carts can be pushed or overturned
• Impacts on Track Workers
– Same as those on passengers on platforms
– Track workers at a lower position relative to the train
– Exposure to most turbulent part of slipstream
Slipstream• United States
– No standard or regulation was found relating to slipstreams– Safe distance lines designed to prevent falling onto tracks or being
hit by a train• Distances range from less than 2 ft to over 4 ftg
• International– Wide range
• 3.3 ft to 9.8 ft (1.0 m to 3.0 m)– Differences in platform height, track gage, train width, train speed– Please see paper for list and details
Slipstream
• Target the effects that come from slipstreams– Increased separation distances between trains and
people– Speed Limits for platform tracks– Safe marking distances on platforms– Warning devices for approaching trains– Securing loose items – Separate “Passage Tracks”– Train Screens
Trains Meeting and PassingTrains Meeting and Passing
© AREMA 2014 21
Trains Meeting and Passing• HSTs meet or pass another train• Pressure pulses are generated by the moving train
– Act on the adjacent train• Effects
– Unpleasant jolt– Cargo damage
• High Pressure Zone then Low Pressure Zone– Front of train
• Low Pressure Zone then High Pressure Zone– Rear of train
Trains Meeting and Passing
Trains Meeting and Passing• Peak-to-peak pulse amplitude
– On the order of 0.1-0.3 psi– Depends on train speed, track spacing, aerodynamic design
• HSTs are not the worst case– Freight trains can generate high pressures - poor
aerodynamics• Pulse duration
– On the order of 0.1-0.4 seconds – Depends on train speed and nose length
Trains Meeting and Passing• “Passing” train
– Generates the measured pressure• “Observing” train
– Pressure measurements are made• “Passing”• Passing
– Trains move in the same direction• “Meeting”
– Trains move in opposite directions• Amplitude of pulse on observing train depends on passing train speed• Pressure pulse is a far-field manifestation
– Almost independent of the observing train’s movement
Trains Meeting and Passing• Influences
– Track spacing: Inverse-square relationship to distance between track centers
– Aerodynamic design of the train also plays an important roleI t• Impacts– Pulse can startle passengers - noise or jolting motion
• No records found regarding safety• Only anecdotal evidence on passenger comfort. • No records found regarding safety impacts of pressure pulses on
track workers
Trains Meeting and Passing
© AREMA 2014 22
Trains Meeting and Passing• European Technical Standards for Interoperability (TSI))• China (TB10621-2009, Section 6.2.3)• Various country-specific (please see paper for list)
– All for less than 217 mph (350 km/h)– 13.0 ft to 16.4 ft
• No regulations have yet been promulgated in the USA – Tier 2 - Acela has been studied extensively– Tier 3
• Expect a large separation from conventional tracks• Tier 3 trains on existing lines (approaches to city terminals) - current speed
limits• Aerodynamic interactions likely mitigated
Pressure Waves Inside TunnelsPressure Waves Inside Tunnels
Pressure Waves Inside Tunnels
• Train enters tunnel at high speed
– Compressive pressure wave ahead of the nose
– Rarefaction (negative) pressure wave at tail( g ) p
– Waves propagate at the speed of sound
– Waves reflect at the portals
– At reflection, wave reverses direction and sign
– Pressure at any fixed point changes as waves pass
Pressure Wave Effects Inside Tunnels
• Blue Solid– Nose of train
• Red SolidTail of train– Tail of train
• Blue Dotted– Nose wave
• Red Dotted– Tail wave
Pressure Waves Inside Tunnels• Rapid pressure changes can cause discomfort to passengers
– Extreme cases can damage their ears– Depends on amplitude and speed of change
• Aircraft take-off and landing– Pressure changes of around 3-4 psi, duration is 20-30
minutes• Rail tunnels
– Pressure changes usually less than 0.5 psi, duration is seconds
• If train not sealed, pressure change very uncomfortable
Pressure Waves Inside Tunnels
© AREMA 2014 23
Pressure Waves Inside Tunnels
• Influencers and Mitigations
– Blockage Ratio (area of train vs area of tunnel)
– Train SpeedTrain Speed
– Aerodynamic Design of Train
– Train Sealing
– Tunnel Length
Pressure Waves Inside Tunnels• Standards
– UIC Leaflet 779-11• Main European standard• Guide on cross-sectional area of tunnels for pressure comfort and safety• Medical health criterion upper limit of 1.45 psi
– UICL Leaflet 660• Pressure comfort criteria for sealed trains• Pressure tightness tests for trains
– Other• Various country-specific (please see paper)• USA – none formalized
– California HSR suggests UIC 779-11
Micro Pressure Waves from TunnelsMicro-Pressure Waves from Tunnels
Micro-Pressure Waves from Tunnels
• Micro-pressure wave (MPW)
• Pulse of air pressure emitted from tunnel portal into the environment
• Occurs when pressure wave inside a tunnel is reflected at the portal
• All tunnels emits MPWsAll tunnels emits MPWs
– Generally at frequencies below the audible range and small amplitude
• MPWs can take the form of “sonic booms”
• Japan, 1974 during running tests on the Sanyo Shinkhansen line
• Records limited to long slab-track tunnels
Micro-Pressure Waves from Tunnels Micro-Pressure Waves from Tunnels
© AREMA 2014 24
Micro-Pressure Waves from Tunnels
• Impact is principally one of annoyance– People near the tunnel exit– Doors and windows or other parts of buildings may
ttl ib trattle or vibrate– No records found of structural damage to buildings
due to MPWs– Track maintenance staff working near a tunnel exit
may hear unpleasant or frightening noise
Micro-Pressure Waves from Tunnels
• No clauses found in European TSIs
– Future versions of the Infrastructure TSI may set limits
• No USA standards or recommended best practices were found
• Japan first to experience MPW problems and set standards• Japan first to experience MPW problems and set standards
– Criterion appears to be 0.003 psi at 66 ft from center of portal
• Korea, 0.003 psi limit at the “nearest observer”
Micro-Pressure Waves from Tunnels• Deutsche Bahn criteria:
– At the nearest dwelling or sensitive building
• C-weighted Sound Exposure Level should not exceed 70 dB(C)
• Higher limits apply to rural (85 dB(C)) and industrial areas (95 dB (C))dB (C))
– At 82 ft from tunnel portal, C-weighted peak no greater than 115 dB(C).
– A-weighted sound exposure must be in accordance with German traffic noise regulations.
Micro-Pressure Waves from Tunnels
• Tunnel Entrance Hoods
• Tunnel Portal Shape
• Train Nose DesignTrain Nose Design
• Train Cross-Sectional Area
• Side Branches
• Air Shafts
Micro-Pressure Waves from Tunnels
Tunnel Entrance HoodsTunnel Portal Shape
Micro-Pressure Waves from Tunnels
Train Nose Design
© AREMA 2014 25
Micro-Pressure Waves from Tunnels
Side Branches Air Shafts
ConclusionsConclusions
Conclusions• Aerodynamic effects from HSTs are reasonably well understood
– Some topic areas are at a much higher state of knowledge than others
• Paper and presentation cover only a few topics• There are some available standards and recommended practices in theThere are some available standards and recommended practices in the
international arena– Few exist in the United States– Experience to draw upon from NEC Acela operations– Standards are being developed, still much to be done
• Base of international standards and practices from Europe and Asia– Excellent starting point for the US market
Thank you!
Paul Derkowski, PERichard Sturt, CESteve Clark, PE
© AREMA 2014 26


