Inrprnyrionul S i ~ r r s r ~ r u l Rrvr r l r ( 2 0 0 2 ) . 70. 1. 1-5 1. Printed 111 Thc Sethcrlmds @ International Statistical Lnstirute
Adults' Statistical Literacy: Meanings, Components, Responsibilities
Iddo Gal
University of Haifa, Israel
Summary
Statistical literacy is a key ability expected of citizens in information-laden societies, and is often touted as an expected outcome of schooling and as a necessary component of adults' numeracy and literacy. Yet, its meaning and building blocks have received little explicit attention. This paper proposes a conceptualization of statistical literacy and describes its key components. Statistical literacy is portrayed as the ability to interpret, critically evaluate, and communicate about statistical information and messages. It is argued that statistically literate behavior is predicated on the joint activation of five interrelated knowledge bases (literacy, statistical, mathematical, context, and critical), together with a cluster of supporting dispositions and enabling beliefs. Educational and research implications are discussed, and responsibilities facing educators, statisticians, and other stakeholders are outlined.
Key words: Statistics education; Numeracy; Adult education; Educational policy; Statistical reasoning.
1 Introduction and Need
Many curriculum frameworks and national and international educational initiatives, including but not limited to those focusing on the mathematical sciences, underscore the importance of enabling all people to function effectively in an information-laden society (e.g., UNESCO, 1990; Australian Education Council, 1991; American Association for the Advancement of Science (AAAS), 1995; European Commission, 1996; National Council of Teachers of Mathematics, 2000). The present paper focuses on statistical literacy, one critical but often neglected skill area that needs to be addressed if adults (or future adults) are to become more informed citizens and employees.
Statements regarding the importance of statistical reasoning or statistical knowledge in society have been eloquently made in the past. For example, Moore (1998), in his Presidential address to the American Statistical Association (ASA), claimed that it is difficult to think of policy questions that have no statistical component, and argued that statistics is a general and fundamental method because data, variation and chance are omnipresent in modern life. Wallman (1993), in a 1992 ASA Presidential address, emphasized the importance of strengthening understanding of statistics and statistical thinking among all sectors of the population, in part due to the various misunderstandings, misperceptions, mistrust, and misgivings that people have towards the value of statistics in public and private choices. Researchers interested in cognitive processes have emphasized the contribution of proper judgmental processes and probabilistic reasoning to people's ability to make effective decisions (Kahneman, Slovic & Tversky, 1982) and showed that training in statistics can aid in solving certain types of everyday problems (Kosonen & Whinne, 1995). Industry trainers and education planners have pointed to the important role of statistical understanding and mathematical competencies as a component of the skills needed by workers in diverse industries (e.g., Carnevale, Gainer & Meltzer, 1990; Packer, 1997).
While these and other sources have helped to highlight the centrality of statistical literacy in various life contexts, few attempts to describe the nature of adults' overall statistical literacy have been published to date. It is necessary to first grapple with definitional issues. In public discourse "literacy" is sometimes combined with terms denoting specific knowledge domains (e.g., "computer literacy"). In such cases the usage of "literacy" may conjure up an image of the minimal subset of "basic skills" expected of all citizens, as opposed to a more advanced set of skills and knowledge that only some people may achieve. Along these lines, statistical literacy may be understood by some to denote a minimal (perhaps formal) knowledge of basic statistical concepts and procedures. Yet increasingly the term literacy, when used as part of the description of people's capacity for goal-oriented behavior in a specific domain, suggests a broad cluster not only of factual knowledge and certain formal and informal skills, but also of desired beliefs, habits of mind, or attitudes, as well as general awareness and a critical perspective.
In line with the expanding conception of the term literacy, Wallman (1993) argued that statistical literacy is the ability to understand and critically evaluate statistical results that permeate daily life, coupled with the ability to appreciate the contributions that statistical thinking can make in public and private, professional and personal decisions. Watson (1997) presented a framework of statistical literacy comprised of three tiers with increasing sophistication: a basic understanding of probabilistic and statistical terminology; an understanding of statistical language and concepts when they are embedded in the context of wider social discussion; and a questioning attitude one can assume when applying concepts to contradict claims made without proper statistical foundation.
The complex and expanding meaning of domain-specific literacy can also be illustrated by ex- amining extant conceptions of "scientific literacy". Shamos (1995) reviews prior works on scientific literacy that suggest common building blocks: basic vocabulary, understanding of science process, and understanding of the impact of science and technology on society. Jenkins (1996) suggests that scientific literacy can be characterized as scientific knowledge and attitudes, coupled with some understanding of scientific methodology.
Shamos (1995) argues that it would be a simplification to assume that somebody is either literate or illiterate in science, and suggests a continuum along which scientific literacy can be described, comprised of three overlapping levels that build upon each other in sophistication. The most basic one, "cultural" scientific literacy, refers to a grasp of basic terms commonly used in the media to communicate about science matters. Next, "functional" scientific literacy adds some substance by requiring that "the individual not only have command of a science lexicon but also be able to converse, read and write coherently, using such science terms in perhaps a non-technical but nevertheless meaningful context" (p. 88). This level also requires that the person has access to simple everyday facts of nature, such as some knowledge of the solar system (e.g., that the earth revolves around the sun, how eclipses occur). Finally, "true" scientific literacy requires some understanding of the overall scientific enterprise (e.g., basic knowledge of key conceptual schemes or theories that form the foundation of science and how they were arrived at), coupled with understanding of scientific and investigative processes. Examples are (see also Rutherford, 1997): Appreciation of the relativity of "fact" and "theory", awareness of how knowledge accumulates and is verified, the role of experiments and mathematics in science, the ability to make sense of public communications about scientific matters, and the ability to understand and discuss how science and technology impinge on public life.
With the above broad usage of "literacy" and "statistical literacy" in mind, this paper develops a conception of statistical literacy that pertains to what is expected of adults (as opposed to students actively learning statistics), particularly those living in industrialized societies. It is proposed here that in this context, the term "statistical literacy" refers broadly to two interrelated components, primarily (a) people's ability to interpret and critically evaluare statistical information, data-related arguments, or stochastic phenomena, which they may encounter in diverse contexts, and when
Adults' Statistical Literacy 3
relevant (b) their ability to discuss or communicate their reactions to such statistical information, such as their understanding of the meaning of the information, their opinions about the implications of this information, or their concerns regarding the acceptability of given conclusions. These capabilities and behaviors do not stand on their own but are founded on several interrelated knowledge bases and dispositions which are discussed in this paper.
Statistical literacy can serve individuals and their communities in many ways. It is needed if adults are to be fully aware of trends and phenomena of social and personal importance: crime rates, population growth, spread of diseases, industrial production, educational achievement, or employment trends. It can contribute to people's ability to make choices when confronted with chance-based situations (e.g., buying lottery tickets or insurance policies, and comprehending medical advice). It can support informed participation in public debate or community action. The need for statistical literacy also arises in many workplaces, given growing demands that workers understand statistical information about quality of processes (Packer, 1997), and the contention that workers' understanding of data about the status of their organization can support employee empowerment (Bowen & Lawler, 1992).
The many examples of contexts where statistical literacy may be activated indicate that most adults are consumers (rather than producers) of statistical information. Yet, despite the centrality of statistical literacy in various life contexts, the nature of the skills and dispositions that comprise adults' statistical literacy have not received detailed discussion in the literature (Gal, 1994; Watson, 1997), and are thus the focus of this paper. Clarity on the characteristics of the building blocks of statistical literacy is needed before other questions can be addressed in earnest regarding assessment and instruction focused on statistical literacy.
2 A model
This paper concerns itself with people's ability to act as effective "data consumers" in diverse life contexts that for brevity are termed here Reading contexts. These contexts emerge, for example, when people are at home and watch TV or read a newspaper, when they look at advertisements while shopping, when they visit Internet sites, when they participate in community activities or attend a civic or political event, or when they read workplace materials or listen to reports at work. They include but are not limited to exposure to print and visual media, and represent the junctures where people encounter the much-heralded "information-laden" environments (European Commission, 1996). In such contexts, statistical information may be represented in three ways-through text (written or oral), numbers and symbols, and graphical or tabular displays, often in some combination. To simplify the presentation in this paper, the term readers will be used throughout to refer to people when they participate in reading contexts as actors, speakers, writers, readers, listeners, or viewers, in either passive or active roles.
Reading contexts should be distinguished from enquiry contexts, where people (e.g., students, statisticians) engage in empirical investigation of actual data (Wild & Pfannkuch, 1999). As part of this process such individuals serve as "data producers" or "data analyzers" and usually have to interpret their own data and results and report their findings and conclusions. Reading contexts may differ from enquiry contexts in important ways that have not been sufficiently acknowledged in the literature on statistical reasoning and are examined later.
This paper proposes a model, summarized in Table 1, of the knowledge bases and other enabling processes that should be available to adults, and by implication to learners graduating from schools or colleges, so that they can comprehend, interpret, critically evaluate, and react to statistical messages encountered in reading contexts. Based on earlier work such as cited above on statistical literacy and scientific literacy, the model assumes that people's statistical literacy involves both a knowledge component (comprised of five cognitive elements: literacy skills, statistical knowledge, mathematical
Statistical Literacy
Table 1 A model of statistical literacy.
knowledge, context knowledge, and critical questions) and a dispositional component (comprised of two elements: critical stance, and beliefs and attitudes).
As with people's overall numeracy (Gal, 2000), the components and elements in the proposed model should not be viewed as fixed and separate entities but as a context-dependent, dynamic set of knowledge and dispositions that together enable statistically literate behavior. Understanding and interpretatiorz of statistical information reqtiires not only statistical knowledge per se but also the availability of other knowledge bases: literacy skills, mathematical knowledge, and context knowledge. However, critical evaluatioiz of statistical information (after it has been understood and interpreted) depends on additional elements as well: the ability to access critical questions and to activate a critical stance, which in turn is supported by certain beliefs and attitudes.
The model's elements are described in subsequent sections, although some overlap with each other and do not stand in isolation. The final section of the paper discusses resulting educational and policy challenges and implications for needed research. The expected contribution of this paper is to facilitate further dialogue and action by educators, practicing statisticians, policy makers, and other professionals who are interested in how citizens can be empowered to make sense of real-world messages containing statistical elements or arguments.
Knowledge
elements
Literacy skills
Statistical knowledge
Mathematical knowledge
Context knowledge
3 Knowledge Elements of Statistical Literacy
Dispositional
elements
Beliefs and Attitudes
Critical stance
This section reviews the five elements listed in Table 1 as comprising the knowledge component of statistical literacy. It is proposed that these elements jointly contribute to people's ability to comprehend, interpret, critically evaluate, and if needed react to statistical messages.
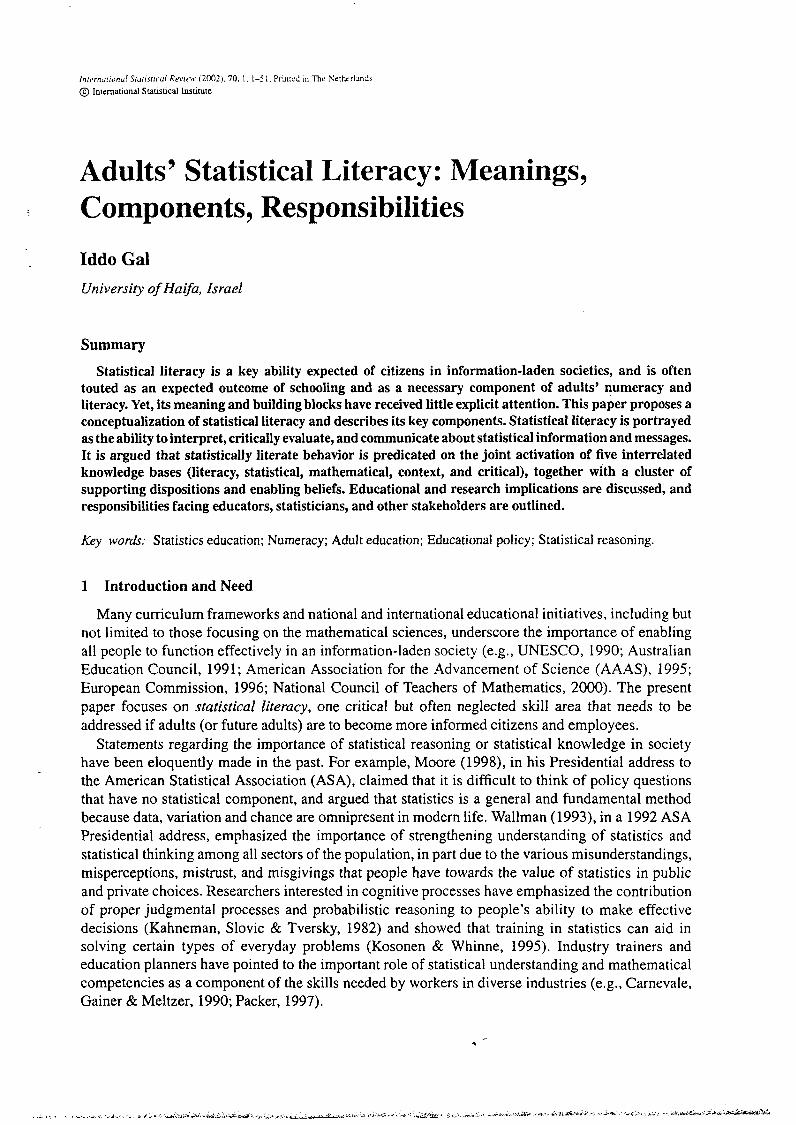
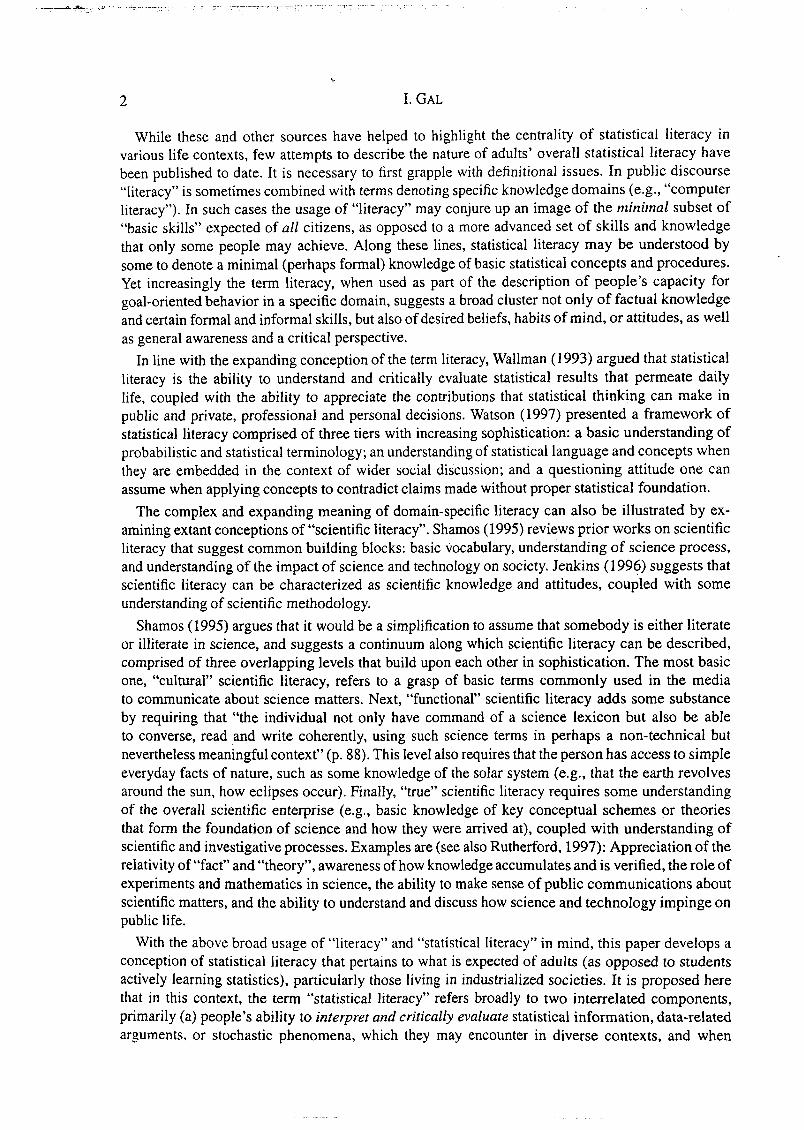
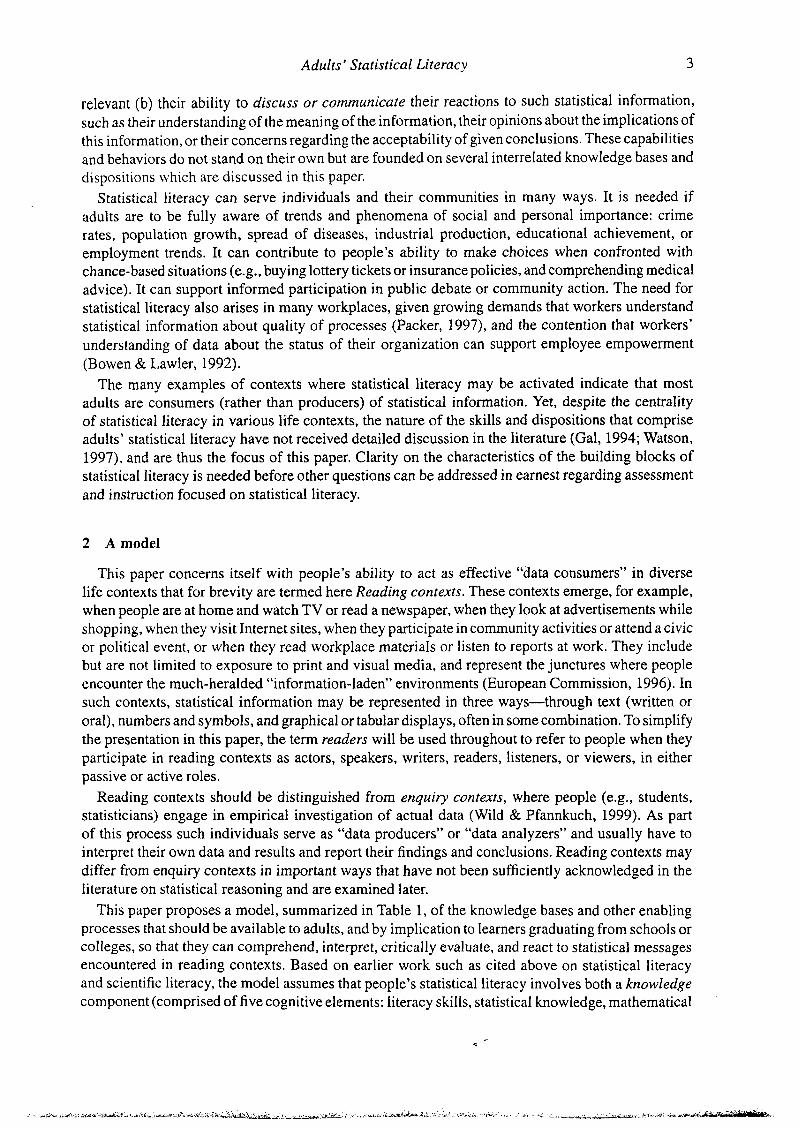
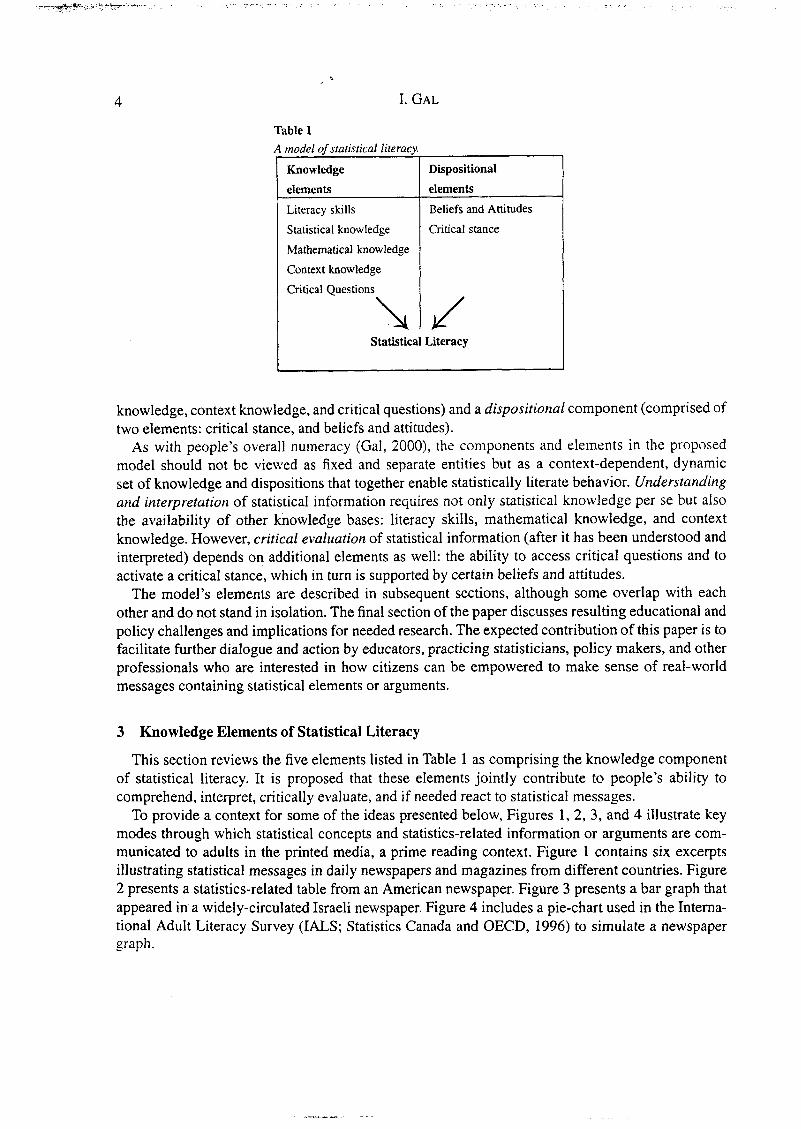
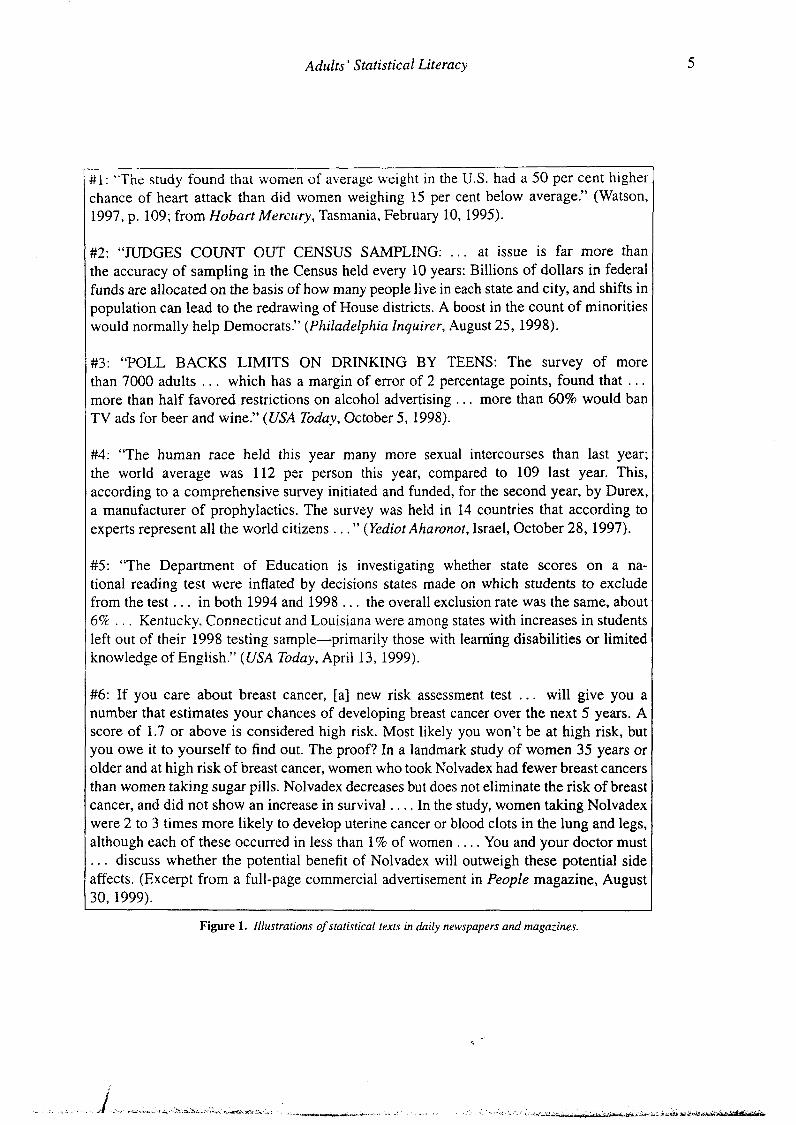
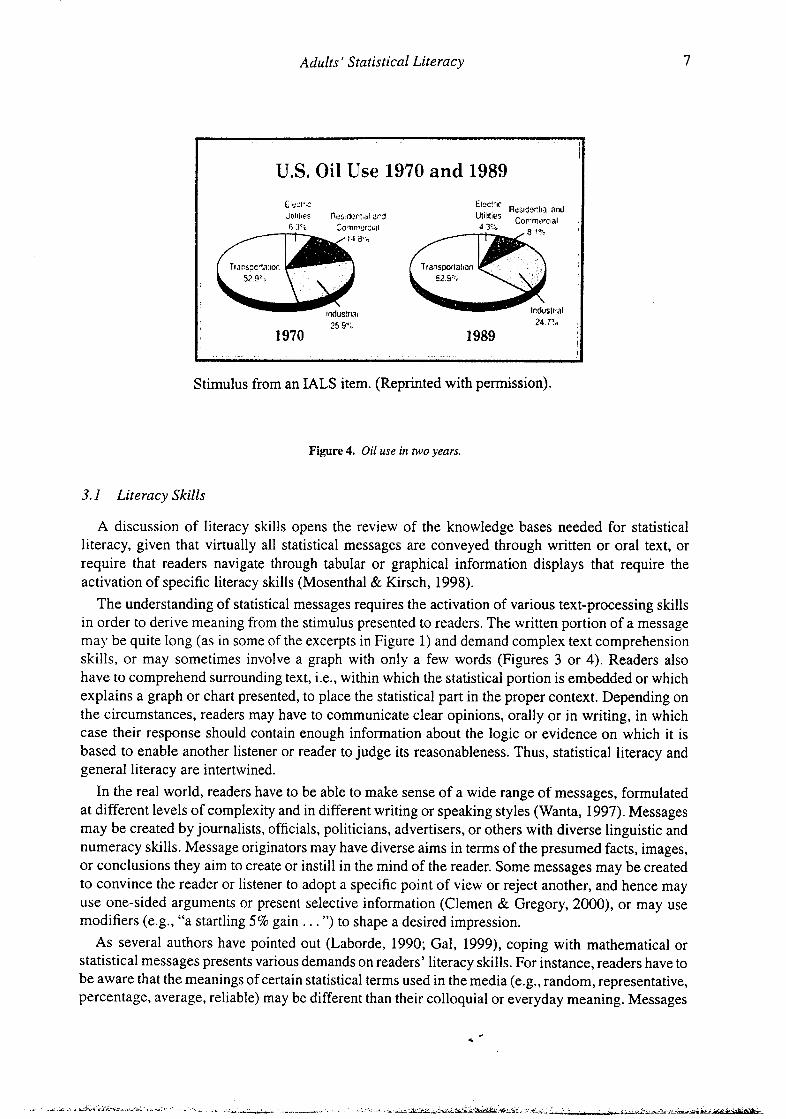
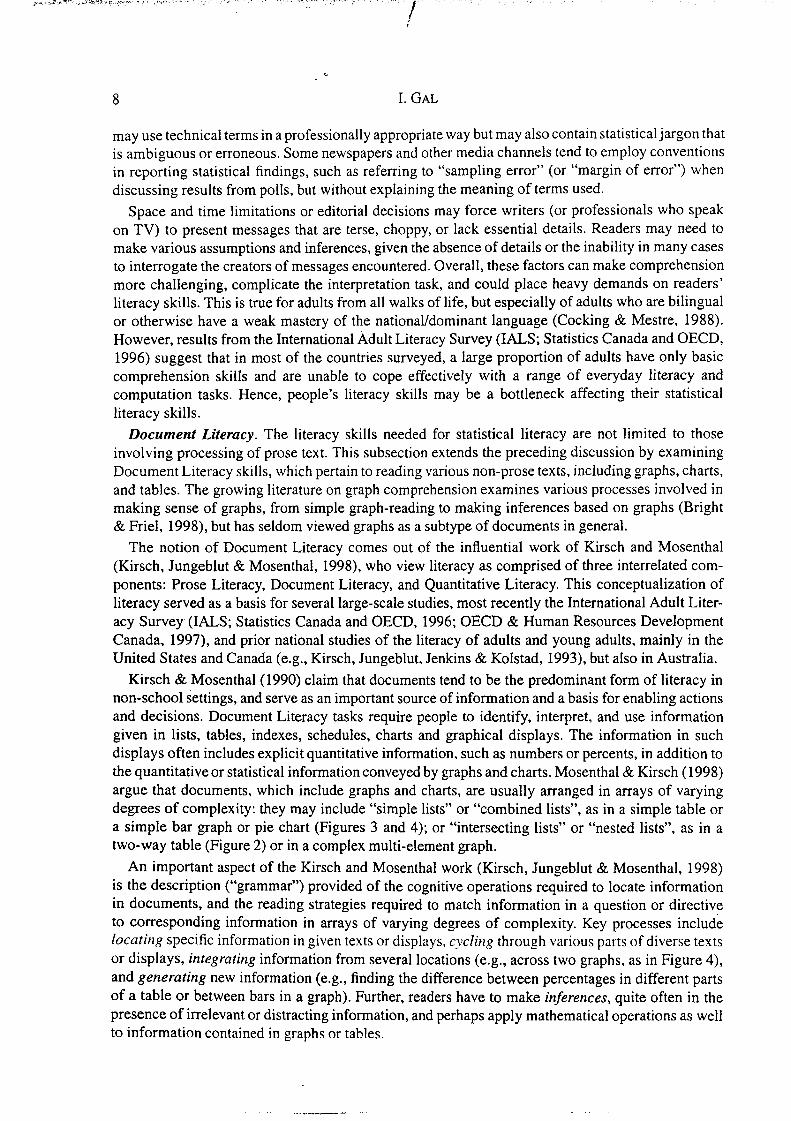
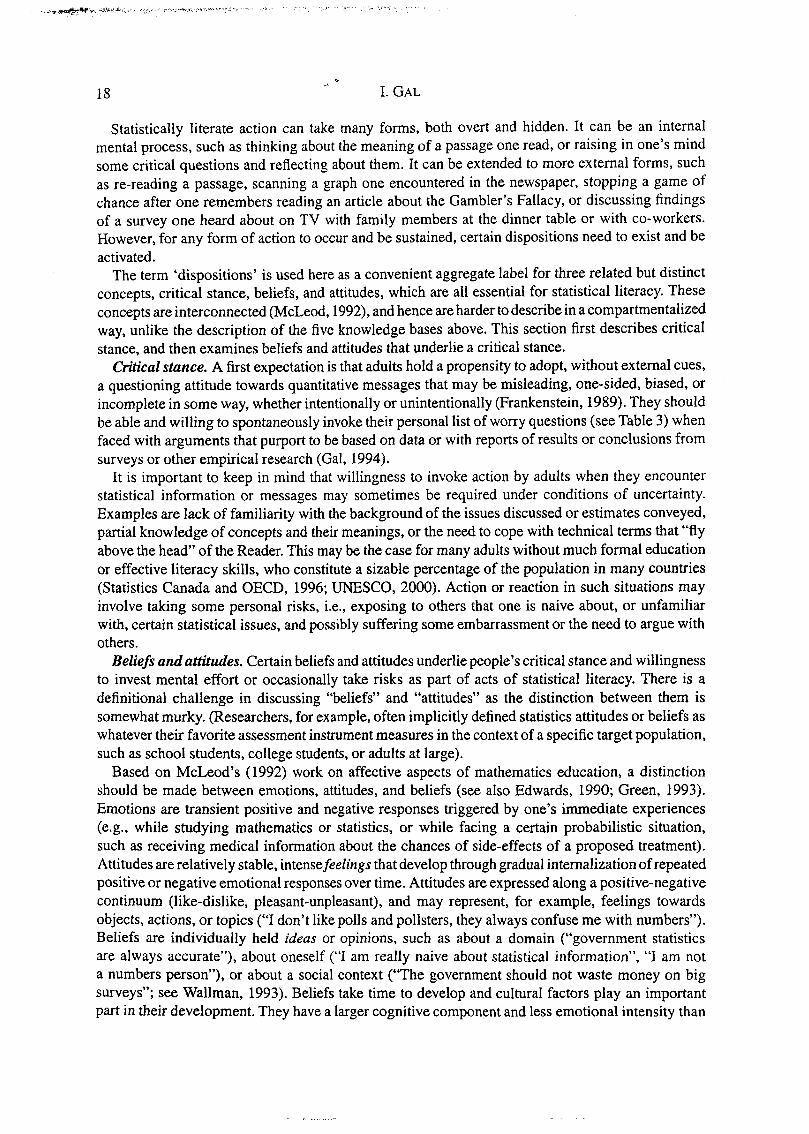
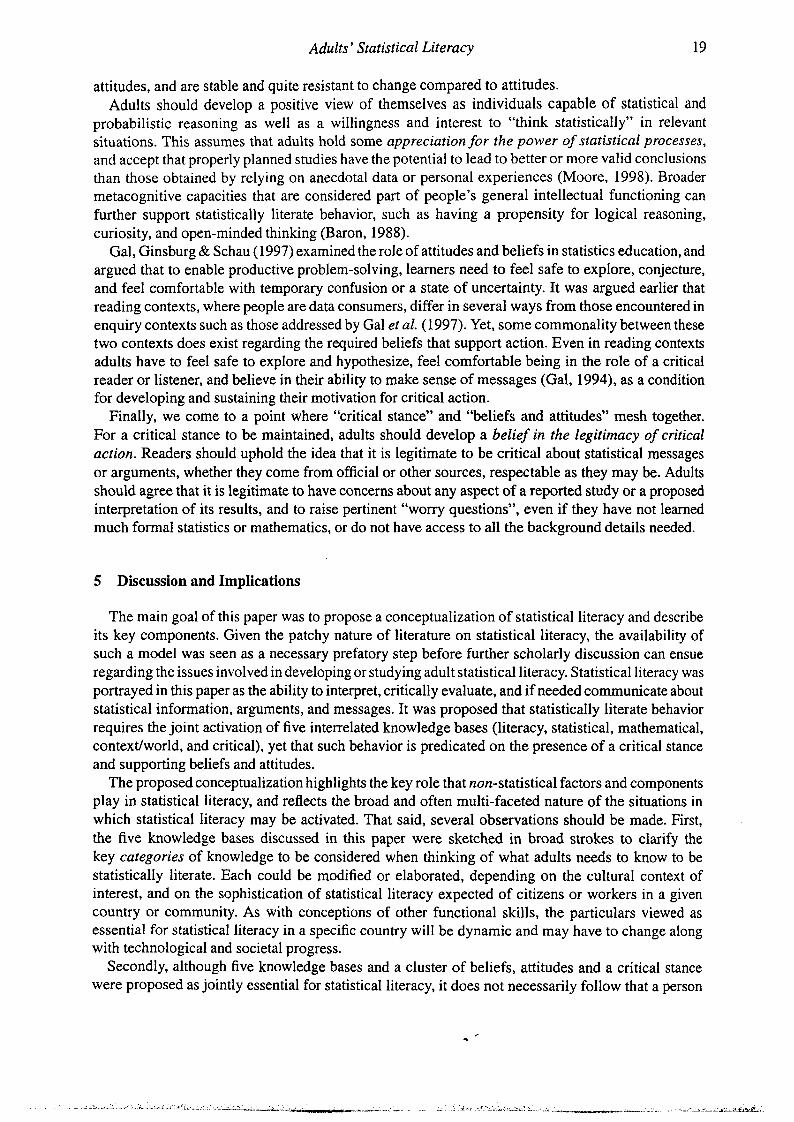
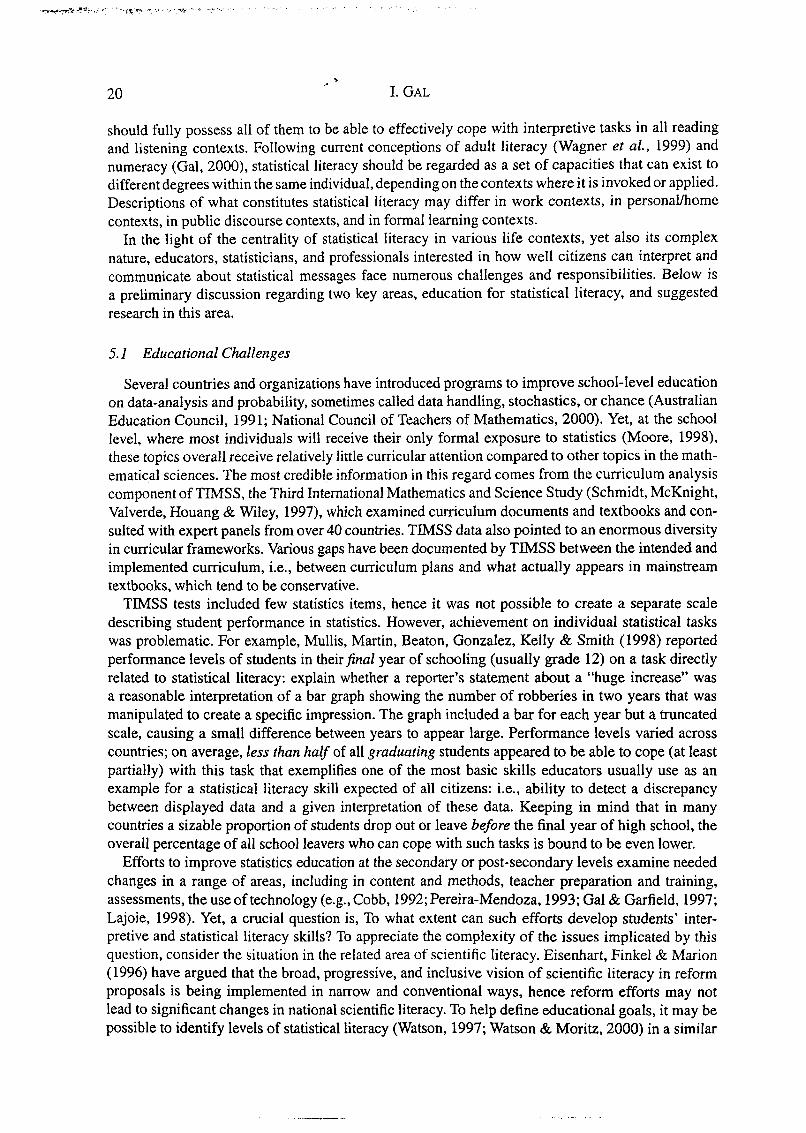
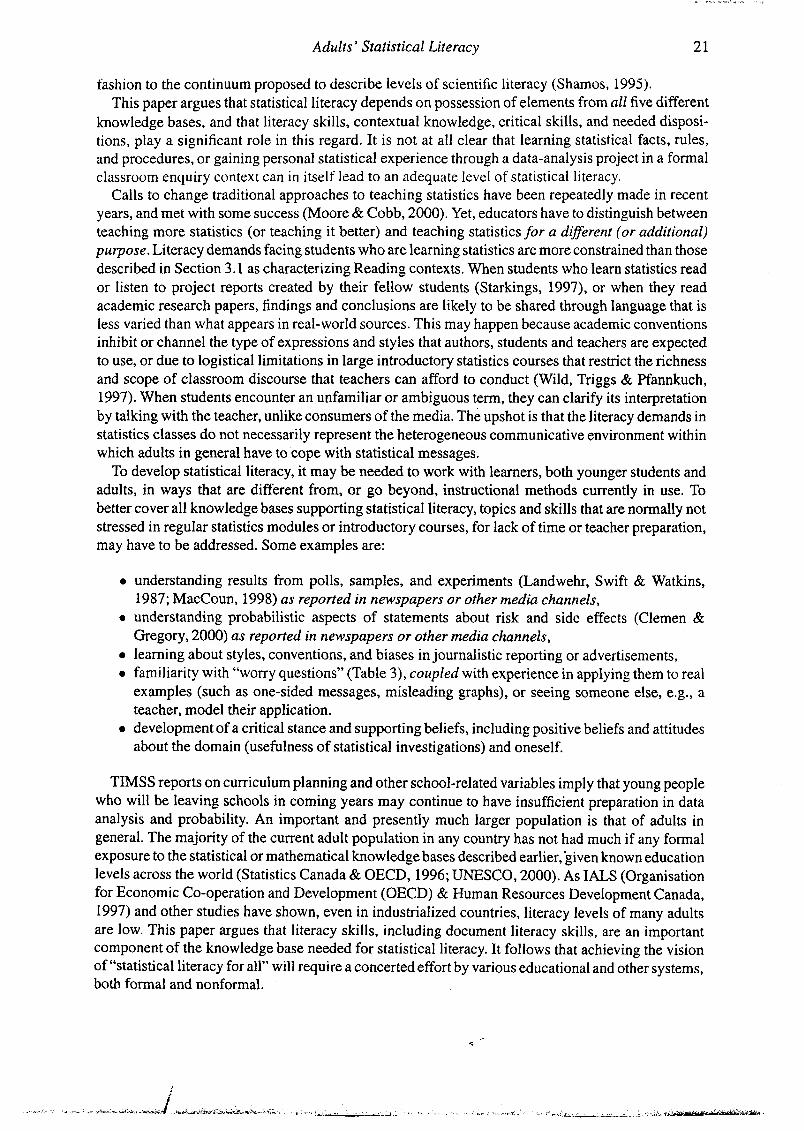
To provide a context for some of the ideas presented below, Figures 1,2, 3, and 4 illustrate key modes through which statistical concepts and statistics-related information or arguments are com- municated to adults in the printed media, a prime reading context. Figure 1 contains six excerpts illustrating statistical messages in daily newspapers and magazines from different countries. Figure 2 presents a statistics-related table from an American newspaper. Figure 3 presents a bar graph that appeared in a widely-circulated Israeli newspaper. Figure 4 includes a pie-chart used in the Interna- tional Adult Literacy Survey (IALS; Statistics Canada and OECD, 1996) to simulate a newspaper graph.
Adults ' Statistical Literacy
#1: "The study found that women of average weight in the U.S. had a 50 per cent highel chance of heart attack than did women weighing 15 per cent below average." (Watson. 1997, p. 109; from Eiubart Mercuv, Tasmania, February 10, 1995).
#2: "JUDGES COUNT OUT CENSUS SAMPLING: . . . at issue is far more thar the accuracy of sampling in the Census held every 10 years: Billions of dollars in federal funds are allocated on the basis of how many people live in each state and city, and shifts in population can lead to the redrawing of House districts. A boost in the count of minorities would normally help Democrats." (Philadelphia Inquirer, August 25, 1998).
#3: "POLL BACKS LIMITS ON DRINKING BY TEENS: The survey of more than 7000 adults . . . which has a margin of error of 2 percentage points, found that . . . more than half favored restrictions on alcohol advertising . . . more than 60% would ban TV ads for beer and wine." (USA Today, October 5, 1998).
#4: "The human race held this year many more sexual intercourses than last year: the world average was 112 per person this year, compared to 109 last year. This! according to a comprehensive survey initiated and f~nded, for the second year, by Durex. a manufacturer of prophylactics. Tne survey was held in 13 countries that according to experts represent all the world citizens . . . " (Yediot Aharonot, Israel, October 28, 1997).
#5: "The Department of Education is investigating whether state scores on a na- tional reading test were inflated by decisions states made on which students to exclude from the test . . . in both 1994 and 1998 . . . the overall exclusion rate was the same, aboul 6% . . . Kentucky, Connecticut and Louisiana were among states with increases in students left out of their 1998 testing sample-primarily those with learning disabilities or limited knowledge of English." (USA Today, April 13, 1999).
#6: If you care about breast cancer, [a] new risk assessment test . . . will give you a number that estimates your chances of developing breast cancer over the next 5 years. A score of 1.7 or above is considered high risk. Most likely you won't be at high risk, but you owe it to yourself to find out. The proof? In a landmark study of women 35 years or older and at high risk of breast cancer, women who took Nolvadex had fewer breast cancers than women taking sugar pills. Nolvadex decreases but does not eliminate the risk of breast cancer, and did not show an increase in silrvival . . . . In the study, women taking Nolvadex were 2 to 3 times more likely to develop uterine cancer or blood clots in the lung and legs, although each of these occurred in less than 1% of women . . . . You and your doctor must . . . discuss whether the potential benefit of Nolvadex will outweigh these potential side affects. (Excerpt from a full-page commercial advertisement in People magazine, August 30, 1999).
Figure 1. Illustrations of statistical texts in daily newspapers and magazines.

I 'Matrix' a virtual lock at No. 1 The Keanu Reeves sci-fi thriller The Matrix remained the box office champ for the second consecutive week. Newcomers had mixed results: The romantic comedy Never Been Kissed opened fairly strong at No. 2, . . . The top 10:
Box office (millions) Avg. Pct. Weeks Film Wkd. Total Per site Chg. Out
1 The Matrix $22.6 $73.3 $7,772 -19% 2 2 Never Been Kissed $11.8 New $4,821 1 3 10 Things I Hate $5.05 $20.4 $2,218 -39% 2
About You 4 The out-of- Towners $5.01 $16.2 $2,380 -39% 2 5 Analyze This $5.0 $85.8 $2,125 -21% 6
*Re-creation of a selected portion of a table from USA Today (April 13, 1999). Some details omitted to conserve space.
Figure 2. Illustration of a tabular display in a newspaper
Graph in Yediot Aharonot, the daily newspaper with the largest circulation in Israel, July 11, 2000. The title says: "Women in Israel are more educated. The subti- tle says: "Israel holds the world record in the percentage of women among students for Master and Doctoral de- grees". The bars represent percentages for (from top to bottom): Israel (55.4%), 'LJnited States, Australia, Den- mark, Great Britain, Finland, Sweden, Switzerland, and Japan (21.5%). (Reprinted with permission).
Figure 3. Women's education in d~fferent countries.
Adults ' Statistical Literacy
I U.S. Oil Use 1970 and 1989
C L-I-.C E12cv.r urllll es Res &n: ,$I J r d 6 3 2o*nn-~-rc1~,
25 9'. 24 7'"
1970 1989 I
*
Stimulus from an IALS item. (Reprinted with permission).
Figure 4. Oil use in two years.
3.1 Literacy Skills
A discussion of literacy skills opens the review of the knowledge bases needed for statistical literacy, given that virtually all statistical messages are conveyed through written or oral text, or require that readers navigate through tabular or graphical information displays that require the activation of specific literacy skills (Mosenthal & Kirsch, 1998).
The understanding of statistical messages requires the activation of various text-processing skills in order to derive meaning from the stimulus presented to readers. The written portion of a message may be quite long (as in some of the excerpts in Figure 1) and demand complex text comprehension skills, or may sometimes involve a graph with only a few words (Figures 3 or 4). Readers also have to comprehend surrounding text, i.e., within which the statistical portion is embedded or which explains a graph or chart presented, to place the statistical part in the proper context. Depending on the circumstances, readers may have to communicate clear opinions, orally or in writing, in which case their response should contain enough information about the logic or evidence on which it is based to enable another listener or reader to judge its reasonableness. Thus, statistical literacy and general literacy are intertwined.
In the real world, readers have to be able to make sense of a wide range of messages, formulated at different levels of complexity and in different writing or speaking styles (Wanta, 1997). Messages may be created by journalists, officials, politicians, advertisers, or others with diverse linguistic and numeracy skills. Message originators may have diverse aims in terms of the presumed facts, images, or conclusions they aim to create or instill in the mind of the reader. Some messages may be created to convince the reader or listener to adopt a specific point of view or reject another, and hence may use one-sided arguments or present selective information (Clemen & Gregory, 2000), or may use modifiers (e.g., "a startling 5% gain . . . ") to shape a desired impression.
As several authors have pointed out (Laborde, 1990; Gal, 1999), coping with mathematical or statistical messages presents various demands on readers' literacy skills. For instance, readers have to be aware that the meanings of certain statistical terms used in the media (e.g., random, representative, percentage, average, reliable) may be different than their colloquial or everyday meaning. Messages
may use technical terms in a professionally appropriate way but may also contain statistical jargon that is ambiguous or erroneous. Some newspapers and other media channels tend to employ conventions in reporting statistical findings, such as referring to "sampling error" (or "margin of error") when discussing results from polls, but without explaining the meaning of terms used.
Space and time limitations or editorial decisions may force writers (or professionals who speak on TV) to present messages that are terse, choppy, or lack essential details. Readers may need to make various assumptions and inferences, given the absence of details or the inability in many cases to interrogate the creators of messages encountered. Overall, these factors can make comprehension more challenging, complicate the interpretation task, and could place heavy demands on readers' literacy skills. This is true for adults from all walks of life, but especially of adults who are bilingual or otherwise have a weak mastery of the nationavdominant language (Cocking & Mestre, 1988). However, results from the International Adult Literacy Survey (IALS; Statistics Canada and OECD, 1996) suggest that in most of the countries surveyed, a large proportion of adults have only basic comprehension skills and are unable to cope effectively with a range of everyday literacy and computation tasks. Hence, people's literacy skills may be a bottleneck affecting their statistical literacy skills.
Document Literacy. The literacy skills needed for statistical literacy are not limited to those involving processing of prose text. This subsection extends the preceding discussion by examining Document Literacy skills, which pertain to reading various non-prose texts, including graphs, charts, and tables. The growing literature on graph comprehension examines various processes involved in making sense of graphs, from simple graph-reading to making inferences based on graphs (Bright & Friel, 1998), but has seldom viewed graphs as a subtype of documents in general.
The notion of Document Literacy comes out of the influential work of Kirsch and Mosenthal (Kirsch, Jungeblut & Mosenthal, 1998), who view literacy as comprised of three interreIated com- ponents: Prose Literacy, Document Literacy, and Quantitative Literacy. This conceptualization of literacy served as a basis for several large-scale studies, most recently the International Adult Liter- acy Survey (IALS; Statistics Canada and OECD, 1996; OECD & Human Resources Development Canada, 1997), and prior national studies of the literacy of adults and young adults, mainly in the United States and Canada (e.g., Kirsch, Jungeblut, Jenkins & Kolstad, 1993), but aIso in Australia.
Kirsch & Mosenthal (1990) claim that documents tend to be the predominant form of literacy in non-school settings, and serve as an important source of information and a basis for enabling actions and decisions. Document Literacy tasks require people to identify, interpret, and use information given in lists, tables, indexes, schedules, charts and graphical displays. The information in such displays often includes explicit quantitative information, such as numbers or percents, in addition to the quantitative or statistical information conveyed by graphs and charts. Mosenthal & Kirsch (1998) argue that documents, which include graphs and charts, are usually arranged in arrays of varying degrees of complexity: they may include "simple lists" or "combined lists", as in a simple table or a simple bar graph or pie chart (Figures 3 and 4); or "intersecting lists" or "nested lists", as in a two-way table (Figure 2) or in a complex multi-element graph.
An important aspect of the Kirsch and Mosenthal work (Kirsch, Jungeblut & Mosenthal, 1998) is the description ("grammar") provided of the cognitive operations required to locate information in documents, and the reading strategies required to match information in a question or directive to corresponding information in arrays of varying degrees of complexity. Key processes include locating specific information in given texts or displays, cycling through various parts of diverse texts or displays, integrating information from several locations (e.g., across two graphs, as in Figure 4), and generating new information (e.g., finding the difference between percentages in different parts of a table or between bars in a graph). Further, readers have to make inferences, quite often in the presence of irrelevant or distracting information, and perhaps apply mathematical operations as well to information contained in graphs or tables.
Adults ' Statistical Literacy 9
As Mosenthal & Kirsch (1998) argue, many types of common statistical information can be displayed in both graphs and tables, and one form is often a mere transformation of the other (e.g., when a table with a simple list is transformed into a simple bar chart). Hence, putting aside specialized aspects of graph comprehension (Tufte, 1997). their work provides a generalized way to understand literacy aspects of interpreting multiple types of documents and displays, and enables us to embed a discussion of statistical literacy within a broader framework of general literacy.
3.2 Statistical Knowledge Base
An obvious prerequisite for comprehending and interpreting statistical messages is knowledge of basic statistical and probabilistic concepts and procedures, and related mathematical concepts and issues. However, almost all authors who are concerned about the ability of adults or of school graduates to function in a statistics-rich society do not discuss what knowledge is needed to be statistically literate per se, but usually focus on what needs to be taught in schools and argue that all school (or college) graduates should master a range of statistical topics, assuming this will ensure learners' statistical literacy as adults. A recent example can be found in Scheaffer, Watkins & Landwehr (1998). Based on their extensive prior work in the area of teaching statistics and on reviewing various curriculum frameworks, these authors describe numerous areas as essential to include in a study of statistical topics in high-school:
Number sense. Understanding variables. Interpreting tables and graphs. Aspects of planning a survey or experiment, such as what constitutes a good sample, or methods of data collection and questionnaire design. Data analysis processes, such as detecting patterns in univariate or two-way frequency data, or summarizing key features with summary statistics. Relationships between probability and statistics, such as in determining characteristics of random samples, background for significance testing. Inferential reasoning, such as confidence intervals or testing hypotheses.
It is tempting to regard this list as a possible candidate for an "ideal" set of mathematical and statistical knowledge bases that can guarantee statistical literacy. (Indeed, this author would be happy if most adults possessed such knowledge.) However, what is "basic" knowledge cannot be discussed in absolute terms, but depends on the desired level of statistical literacy expected of citizens, on the functional demands of contexts of action (e.g., work, reading a newspaper), and on the characteristics of the larger societal context of living. Hence, the above list may not be appropriate for all cultural contexts, may be an overspecification in some cases, and other elements could be added to it.
Unfortunately, no comparative analysis has so far systematically mapped the types and relative prevalence of statistical and probabilistic concepts and topics across the full range of statistically- related messages or situations that adults may encounter and have to manage in any particular society. Hence, no consensus exists on a basis for determining the statistical demands of common media-based messages. To date, only a single comparative study (Joram, Resnick & Gabriele, 1995) addressed this complex issue, by analyzing the characteristics of rational numbers (especially fractions, percents, and averages) that appear in weekly or monthly magazines written for children, teenagers, and adults in the United States. This study was based on the assumption that it is useful to view literacy not only as a skill or ability but also as a set of cultural practices that people engage in, and hence that it is important to examine the characteristics of the texts that people may have to make sense of, and ask how these characteristics shape people's literacy practices.
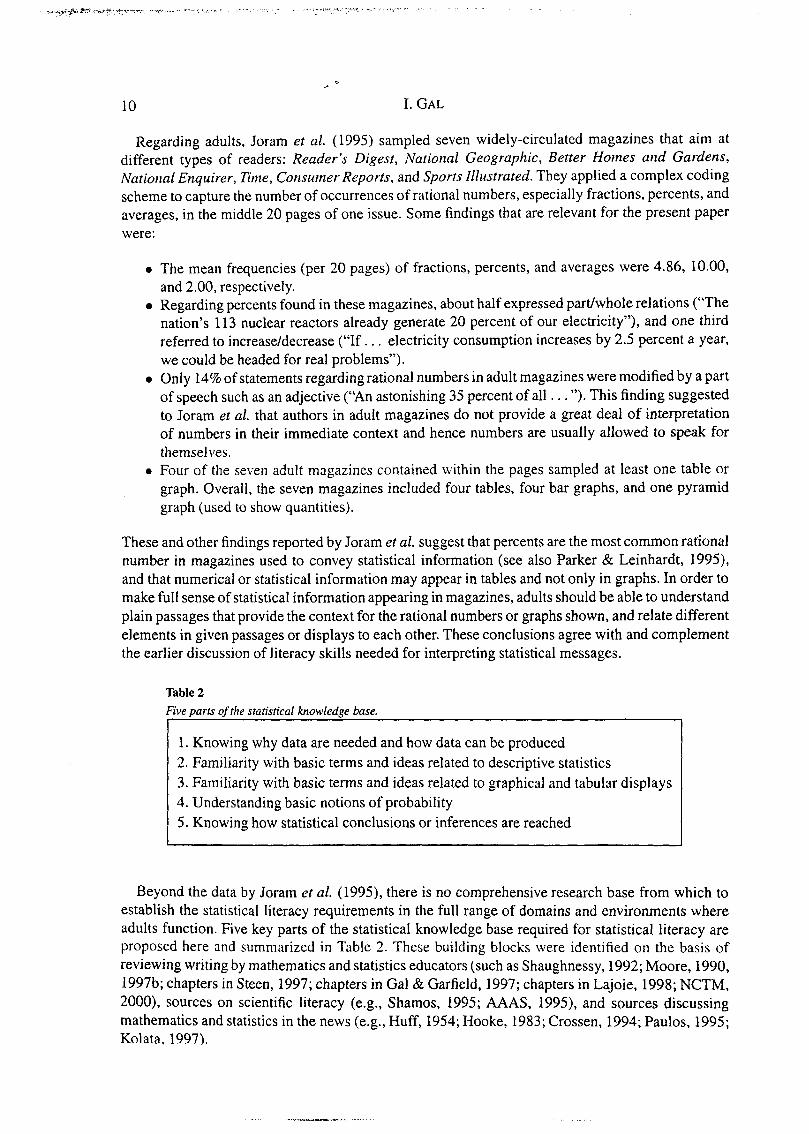
Regarding adults, Joram et al. (1995) sampled seven widely-circulated magazines that aim at different types of readers: Reader's Digest, National Geograplzic, Better Hornes and Gardens, National Enquirer, Tinte, Consuiner Reports, and Sports Illustrated. They applied a complex coding scheme to capture the number of occurrences of rational numbers, especially fractions, percents, and averages, in the middle 20 pages of one issue. Some findings that are relevant for the present paper were:
The mean frequencies (per 20 pages) of fractions, percents, and averages were 4.86, 10.00, and 2.00, respectively. Regarding percents found in these magazines, about half expressed pardwhole relations ("The nation's 113 nuclear reactors already generate 20 percent of our electricity"), and one third referred to increaseldecrease ("If. . . electricity consumption increases by 2.5 percent a year, we could be headed for real problems"). Only 14% of statements regarding rational numbers in adult magazines were modified by a part of speech such as an adjective ("An astonishing 35 percent of all . . . "). This finding suggested to Joram et al. that authors in adult magazines do not provide a great deal of interpretation of numbers in their immediate context and hence numbers are usually allowed to speak for themselves. Four of the seven adult magazines contained within the pages sampled at least one table or graph. Overall, the seven magazines included four tables, four bar graphs, and one pyramid graph (used to show quantities).
These and other findings reported by Joram et al. suggest that percents are the most common rational number in magazines used to convey statistical information (see also Parker & Leinhardt, 1995), and that numerical or statistical information may appear in tables and not only in graphs. In order to make full sense of statistical information appearing in magazines, adults should be able to understand plain passages that provide the context for the rational numbers or graphs shown, and relate different elements in given passages or displays to each other. These conclusions agree with and complement the earlier discussion of literacy skills needed for interpreting statistical messages.
Table 2 Five parts of the statistical knowledge base.
I 1. Knowing why data are needed and how data can be produced 2. Familiarity with basic terms and ideas related to descriptive statistics 3. Familiarity with basic terms and ideas related to graphical and tabular displays 4. Understanding basic notions of probability 5. Knowing how statistical conclusions or inferences are reached
Beyond the data by Joram et al. (1995), there is no comprehensive research base from which to establish the statistical literacy requirements in the full range of domains and environments where adults function. Five key parts of the statistical knowledge base required for statistical literacy are proposed here and summarized in Table 2. These building blocks were identified on the basis of reviewing writing by mathematics and statistics educators (such as Shaughnessy, 1992; Moore, 1990, 1997b; chapters in Steen, 1997; chapters in Gal & Garfield, 1997; chapters in Lajoie, 1998; NCTM, 2000), sources on scientific literacy (e.g., Shamos, 1995; AAAS, 1995), and sources discussing mathematics and statistics in the news (e.g., Huff, 1954; Hooke, 1983; Crossen, 1994; Paulos, 1995; Kolata, 1997).
Adults ' Statistical Literacy 11
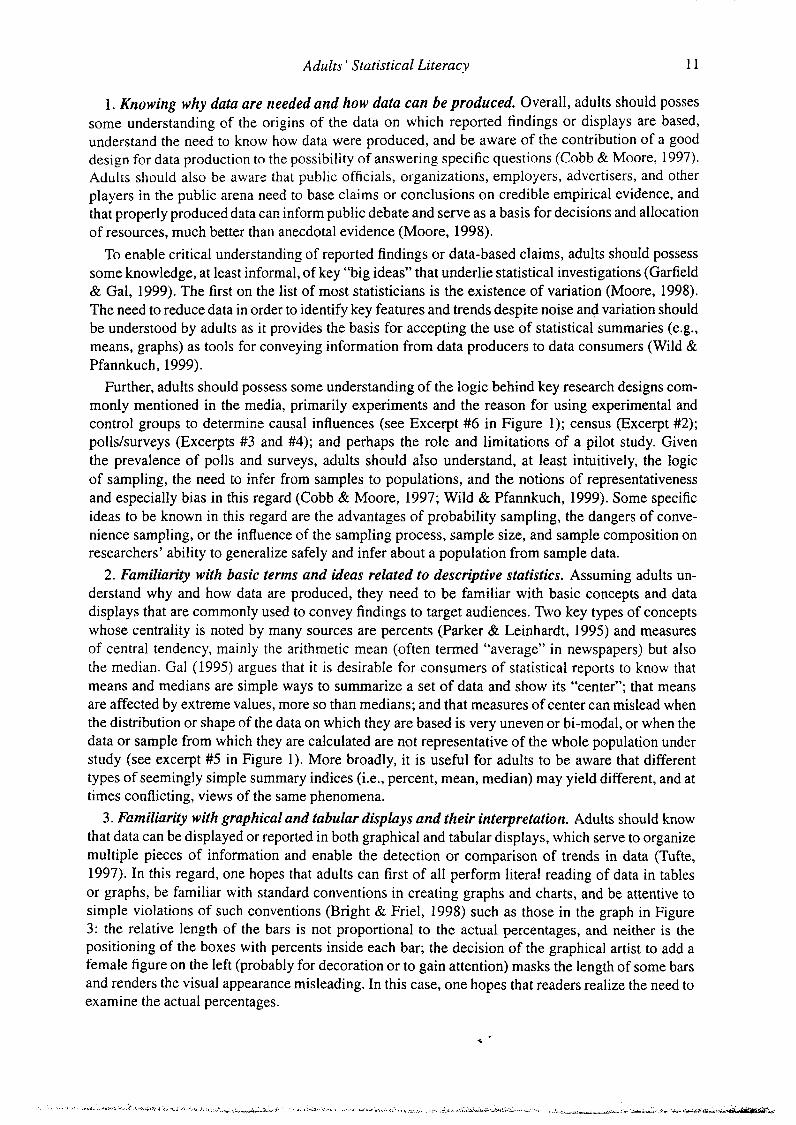
1. Knowing why data are needed and how data can be produced. Overall, adults should posses some understanding of the origins of the data on which reported findings or displays are based, understand the need to know how data were produced, and be aware of the contribution of a good design for data production to the possibility of answering specific questions (Cobb & Moore, 1997). Adults should also be aware that public officials, organizations, emplo;/ers, advertisers, and other players in the public arena need to base claims or conclusions on credible empirical evidence, and that properly prodxed data can inform public debate and serve as a basis for decisions and allocation of resources, much better than anecdotal evidence (Moore, 1998).
To enable critical understanding of reported findings or data-based claims, adults should possess some knowledge, at least informal, of key "big ideas" that underlie statistical investigations (Garfield & Gal, 1999). The first on the list of most statisticians is the existence of variation (Moore, 1998). The need to reduce data in order to identify key features and trends despite noise and variation should be understood by adults as it provides the basis for accepting the use of statistical summaries (e.g., means, graphs) as tools for conveying information from data producers to data consumers (Wild & Pfannkuch, 1999).
Further, adults should possess some understanding of the logic behind key research designs com- monly mentioned in the media, primarily experiments and the reason for using experimental and control groups to determine causal influences (see Excerpt #6 in Figure 1); census (Excerpt #2); polls/surveys (Excerpts #3 and #4); and perhaps the role and limitations of a pilot study. Given the prevalence of polls and surveys, adults should also understand, at least intuitively, the logic of sampling, the need to infer from samples to populations, and the notions of representativeness and especially bias in this regard (Cobb & Moore, 1997; Wild & Pfannkuch, 1999). Some specific ideas to be known in this regard are the advantages of probability sampling, the dangers of conve- nience sampling, or the influence of the sampling process, sample size, and sample composition on researchers' ability to generalize safely and infer about a population from sample data.
2. Familiarity with basic terms and ideas related to descriptive statistics. Assuming adults un- derstand why and how data are produced, they need to be familiar with basic concepts and data displays that are commonly used to convey findings to target audiences. Two key types of concepts whose centrality is noted by many sources are percents (Parker & Leinhardt, 1995) and measures of central tendency, mainly the arithmetic mean (often termed "average" in newspapers) but also the median. Gal (1995) argues that i t is desirable for consumers of statistical reports to know that means and medians are simple ways to summarize a set of data and show its "center"; that means are affected by extreme values, more so than medians; and that measures of center can mislead when the distribution or shape of the data on which they are based is very uneven or bi-modal, or when the data or sample from which they are calculated are not representative of the whole population under study (see excerpt #5 in Figure 1). More broadly, it is useful for adults to be aware that different types of seemingly simple summary indices (i.e., percent, mean, median) may yield different, and at times conflicting, views of the same phenomena.
3 . Fcmilirrrity with graphical and tabular displays and their interpretation. Adults should know that data can be displayed or reported in both graphical and tabular displays, which serve to organize multiple pieces of information and enable the detection or comparison of trends in data (Tufte, 1997). In this regard, one hopes that adults can first of all perform literal reading of data in tables or graphs, be familiar with standard conventions in creating graphs and charts, and be attentive to simple violations of such conventions (Bright & Friel, 1998) such as those in the graph in Figure 3: the relative length of the bars is not proportional to the actual percentages, and neither is the positioning of the boxes with percents inside each bar; the decision of the graphical artist to add a female figure on the left (probably for decoration or to gain attention) masks the length of some bars and renders the visual appearance misleading. In this case, one hopes that readers realize the need to examine the actual percentages.
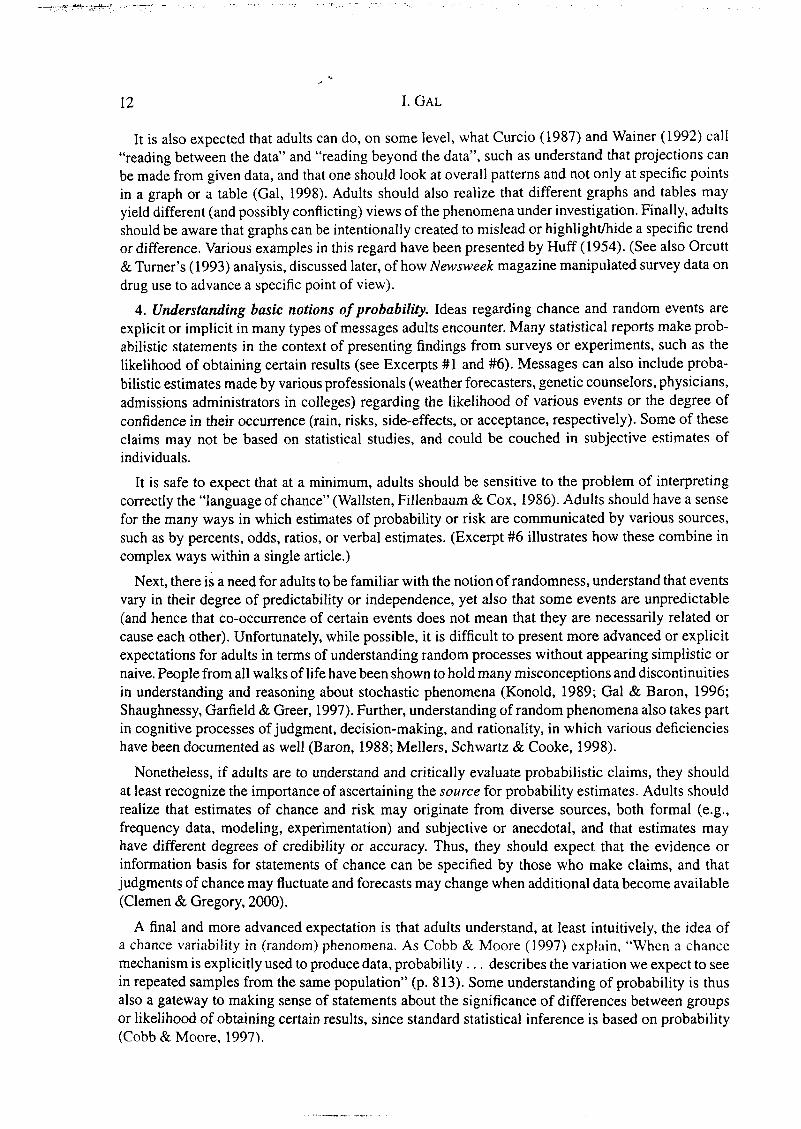
It is also expected that adults can do, on some level, what Curcio (1987) and Wainer (1992) call "reading between the data" and "reading beyond the data", such as understand that projections can be made from given data, and that one should look at overall patterns and not only at specific points in a graph or a table (Gal, 1998). Adults should also realize that different graphs and tables may yield different (and possibly conflicting) views of the phenomena under investigation. Finally, adults should be aware that graphs can be intentionally created to mislead or highlightlhide a specific trend or difference. Various examples in this regard have been presented by Huff (1954). (See also Orcutt & Turner's (1993) analysis, discussed later, of how Newsweek magazine manipulated survey data on drug use to advance a specific point of view).
4. Understanding basic notions of probability. Ideas regarding chance and random events are explicit or implicit in many types of messages adults encounter. Many statistical reports make prob- abilistic statements in the context of presenting findings from surveys or experiments, such as the likelihood of obtaining certain results (see Excerpts #1 and #6). Messages can also include proba- bilistic estimates made by various professionals (weather forecasters, genetic counselors, physicians, admissions administrators in colleges) regarding the likelihood of various events or the degree of confidence in their occurrence (rain, risks, side-effects, or acceptance, respectively). Some of these claims may not be based on statistical studies, and could be couched in subjective estimates of individuals.
It is safe to expect that at a minimum, adults should be sensitive to the problem of interpreting correctly the "language of chance" (Wallsten, Fillenbaurn & Cox, 1986). Adults should have a sense for the many ways in which estimates of probability or risk are communicated by vzrious sources, such as by percents, odds, ratios, or verbal estimates. (Excerpt #6 illustrates how these combine in complex ways within a single article.)
Next, there is a need for adults to be familiar with the notion of randomness, understand that events vary in their degree of predictability or independence, yet also that some events are unpredictable (and hence that co-occurrence of certain events does not mean that they are necessarily related or cause each other). Unfortunately, while possible, it is difficult to present more advanced or explicit expectations for adults in terms of understanding random processes without appearing simplistic or naive. People from all walks of life have been shown to hold many misconceptions and discontinuities in understanding and reasoning about stochastic phenomena (Konold, 1989; Gal & Baron, 1996; Shaughnessy, Garfield & Greer, 1997). Further, understanding of random phenomena also takes part in cognitive processes of judgment, decision-making, and rationality, in which various deficiencies have been documented as well (Baron, 1988; Mellers, Schwartz & Cooke, 1998).
Nonetheless, if adults are to understand and critically evaluate probabilistic claims, they should at least recognize the importance of ascertaining the source for probability estimates. Adults should realize that estimates of chance and risk may originate from diverse sources, both formal (e.g., frequency data, modeling, experimentation) and subjective or anecdotal, and that estimates may have different degrees of credibility or accuracy. Thus, they should expect that the evidence or information basis for statements of chance can be specified by those who make claims, and that judgments of chance may fluctuate and forecasts may change when additional data become available (Clemen & Gregory, 2000).
A final and more advanced expectation is that adults understand, at least intuitively, the idea of a chance variability in (random) phenomena. As Cobb & Moore (1997) explain, "When a chance mechanism is explicitly used to produce data, probability . . . describes the variation we expect to see in repeated samples from the same population" (p. 813). Some understanding of probability is thus also a gateway to making sense of statements about the significance of differences between groups or likelihood of obtaining certain results, since standard statistical inference is based on probability (Cobb & Moore, 1997).
Adults' Statistical Literacy
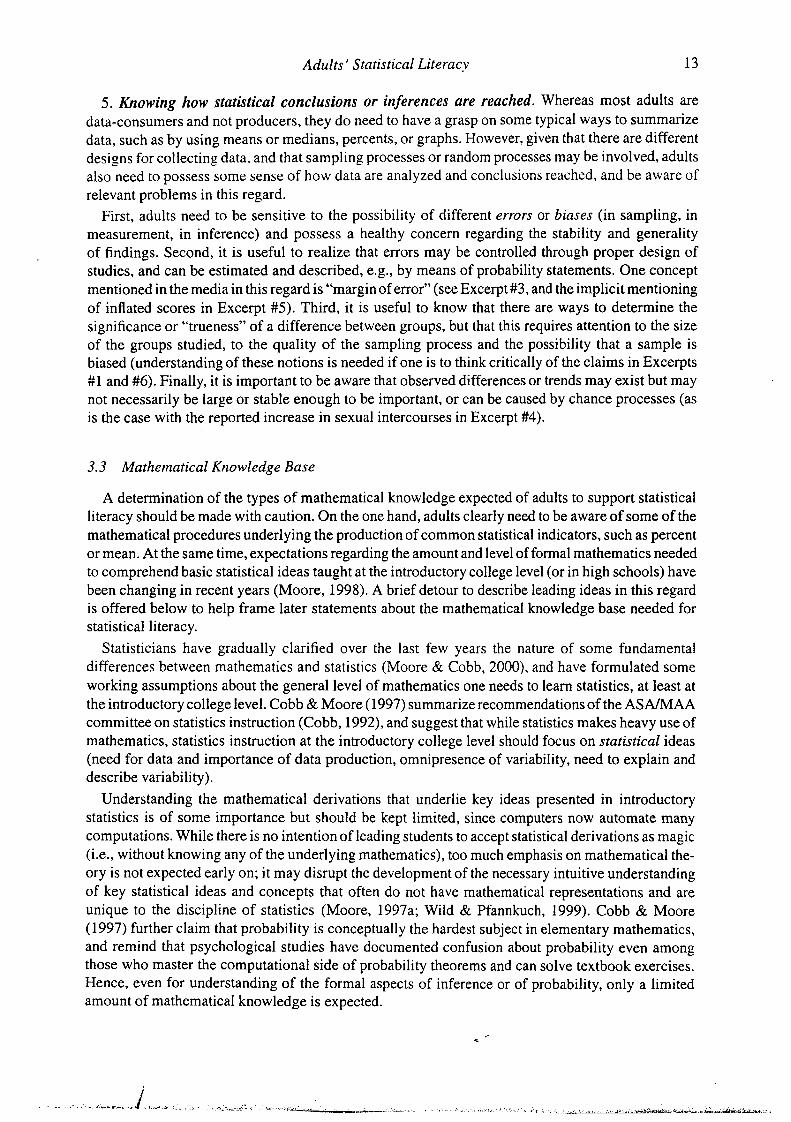
5 . Knowing how statistical conclusions or inferences are reached. Whereas most adults are data-consumers and not producers, they do need to have a grasp on some typical ways to summarize data, such as by using means or medians, percents, or graphs. However, given that there are different designs for collecting data, and that sampling processes or random processes may be involved, adults also need to possess some sense of how data are analyzed and conclusions reached, and be aware of relevant problems in this regard.
First, adults need to be sensitive to the possibility of different errors or biases (in sampling, in measurement, in inference) and possess a healthy concern regarding the stability and generality of findings. Second, it is useful to realize that errors may be controlled through proper design of studies, and can be estimated and described, e.g., by means of probability statements. One concept mentioned in the media in this regard is "margin of error" (see Excerpt #3, and the implicit mentioning of inflated scores in Excerpt #5). Third, it is useful to know that there are ways to determine the significance or "trueness" of a difference between groups, but that this requires attention to the size of the groups studied, to the quality of the sampling process and the possibility that a sample is biased (understanding of these notions is needed if one is to think critically of the claims in Excerpts #1 and #6). Finally, it is important to be aware that observed differences or trends may exist but may not necessarily be large or stable enough to be important, or can be caused by chance processes (as is the case with the reported increase in sexual intercourses in Excerpt #4).
3.3 Mathematical Knowledge Base
A determination of the types of mathematical knowledge expected of adults to support statistical literacy should be made with caution. On the one hand, adults clearly need to be aware of some of the mathematical procedures underlying the production of common statistical indicators, such as percent or mean. At the same time, expectations regarding the amount and level of formal mathematics needed to comprehend basic statistical ideas taught at the introductory college level (or in high schools) have been changing in recent years (Moore, 1998). A brief detour to describe leading ideas in this regard is offered below to help frame later statements about the mathematical knowledge base needed for statistical literacy.
Statisticians have gradually clarified over the last few years the nature of some fundamental differences between mathematics and statistics (Moore & Cobb, 2000), and have formulated some working assumptions about the general level of mathematics one needs to learn statistics, at least at the introductory college level. Cobb & Moore (1997) summarize recommendations of the ASA/MAA committee on statistics instruction (Cobb, 1992), and suggest that while statistics makes heavy use of mathematics, statistics instruction at the introductory college level should focus on statistical ideas (need for data and importance of data production, omnipresence of variability, need to explain and describe variability).
Understanding the mathematical derivations that underlie key ideas presented in introductory statistics is of some importance but should be kept limited, since computers now automate many computations. While there is no intention of leading students to accept statistical derivations as magic (i.e., without knowing any of the underlying mathematics), too much emphasis on mathematical the- ory is not expected early on; it may disrupt the development of the necessary intuitive understanding of key statistical ideas and concepts that often do not have mathematical representations and are unique to the discipline of statistics (Moore, 1997a; Wild & Pfannkuch, 1999). Cobb & Moore (1997) further claim that probability is conceptually the hardest subject in elementary mathematics, and remind that psychological studies have documented confusion about probability even among those who master the computational side of probability theorems and can solve textbook exercises. Hence, even for understanding of the formal aspects of inference or of probability, only a limited amount of mathematical knowledge is expected.
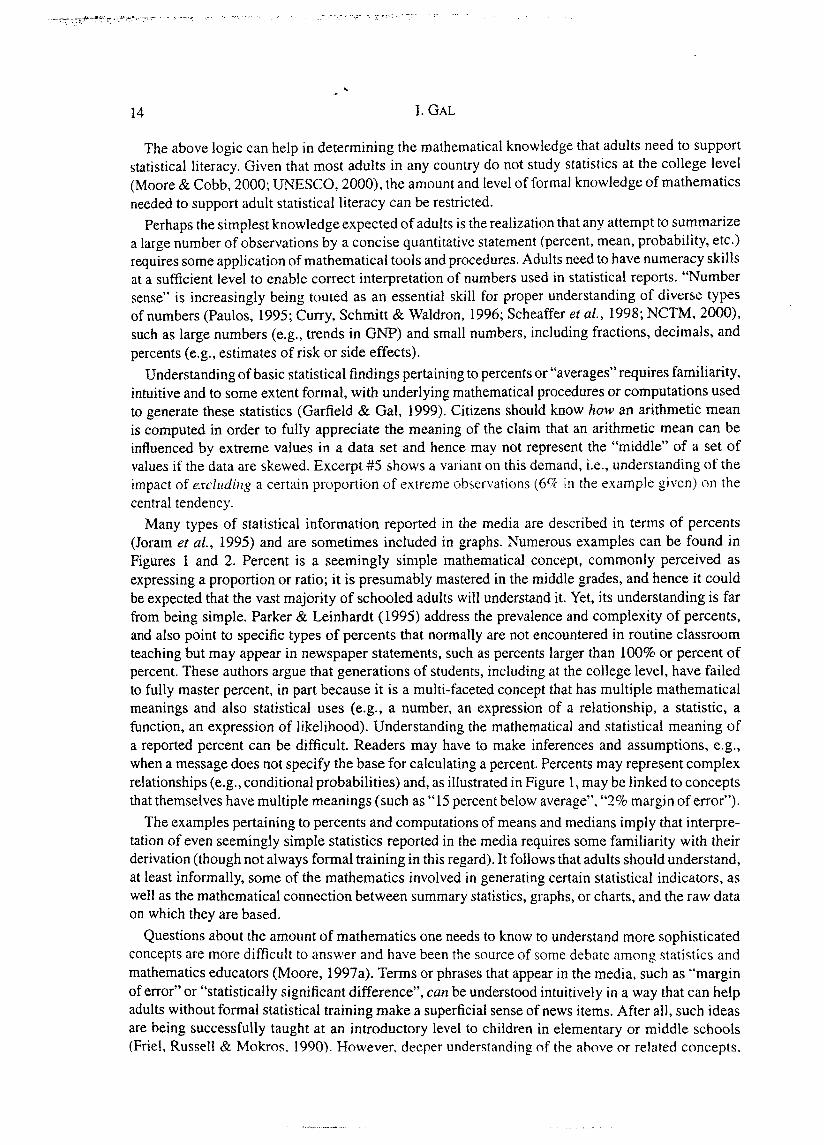
The above logic can help in determining the mathematical knowledge that adults need to support statistical literacy. Given that most adults in any country do not study statistics at the college level (Moore & Cobb, 2000; UNESCO, 2000), the amount and level of formal knowledge of mathematics needed to support adult statistical literacy can be restricted.
Perhaps the simplest knowledge expected of adults is the realization that any attempt to summarize a large number of observations by a concise quantitative statement (percent, mean, probability, etc.) requires some application of mathematical tools and procedures. Adults need to have numeracy skills at a sufficient level to enable correct interpretation of numbers used in statistical reports. "Number sense" is increasingly being touted as an essential skill for proper understanding of diverse types of numbers (Paulos, 1995; Curry, Schmitt & Waldron, 1996; Scheaffer et al., 1998; NCTM, 2000), such as large numbers (e.g., trends in GNP) and small numbers, including fractions, decimals, and percents (e.g., estimates of risk or side effects).
Understanding of basic statistical findings pertaining to percents or "averages" requires familiarity, intuitive and to some extent formal, with underlying mathematical procedures or computations used to generate these statistics (Garfield & Gal, 1999). Citizens should know how an arithmetic mean is computed in order to fully appreciate the meaning of the claim that an arithmetic mean can be influenced by extreme values in a data set and hence may not represent the "middle" of a set of values if the data are skewed. Excerpt #5 shows a variant on this demand, i.e., understanding of the impact of e-xclrtdir~g a certain proportion of extreme observations (6% in the example given) on the central tendency.
Many types of statistical information reported in the media are described in terms of percents (Joram et al., 1995) and are sometimes included in graphs. Numerous examples can be found in Figures 1 and 2. Percent is a seemingly simple mathematical concept, commonly perceived as expressing a proportion or ratio; it is presumably mastered in the middle grades, and hence it could be expected that the vast majority of schooled adults will understand it. Yet, its understanding is far from being simple. Parker & Leinhardt (1995) address the prevalence and complexity of percents, and also point to specific types of percents that normally are not encountered in routine classroom teaching but may appear in newspaper statements, such as percents larger than 100% or percent of percent. These authors argue that generations of students, including at the college level, have failed to fully master percent, in part because it is a multi-faceted concept that has multiple mathematical meanings and also statistical uses (e.g., a number, an expression of a relationship, a statistic, a function, an expression of likelihood). Understanding the mathematical and statistical meaning of a reported percent can be difficult. Readers may have to make inferences and assumptions, e.g., when a message does not specify the base for calculating a percent. Percents may represent complex relationships (e.g., conditional probabilities) and, as illustrated in Figure 1, may be linked to concepts that themselves have multiple meanings (such as "15 percent below average", "2% margin of error").
The examples pertaining to percents and computations of means and medians imply that interpre- tation of even seemingly simple statistics reported in the media requires some familiarity with their derivation (though not always formal training in this regard). It follows that adults should understand, at least informally, some of the mathematics involved in generating certain statistical indicators, as well as the mathematical connection between summary statistics, graphs, or charts, and the raw data on which they are based.
Questions about the amount of mathematics one needs to know to understand more sophisticated concepts are more difficult to answer and have been the source of some debate among statistics and mathematics educators (Moore, 1997a). Terms or phrases that appear in the media, such as "margin of error" or "statistically significant difference", can be understood intuitively in a way that can help adults without formal statistical training make a superficial sense of news items. After all, such ideas are being successfully taught at an introductory level to children in elementary or middle schools (Friel, Russell & Mokros. 1990). However, deeper understandin9 of the above or related concepts.
Adiilts ' Statistical Literacy 15
and proper interpretation of their exact meaning, require more solid understanding of underlying statistical ideas (quantification of variance, repeated sampling, sampling distributions, curves, logic of statistical inference, etc). These ideas are hard to grasp for college-bound students (Cobb & Moore, 1997; Watson & Moritz, 2000) even without the added complication of the need to understand their mathematical underpicnings.
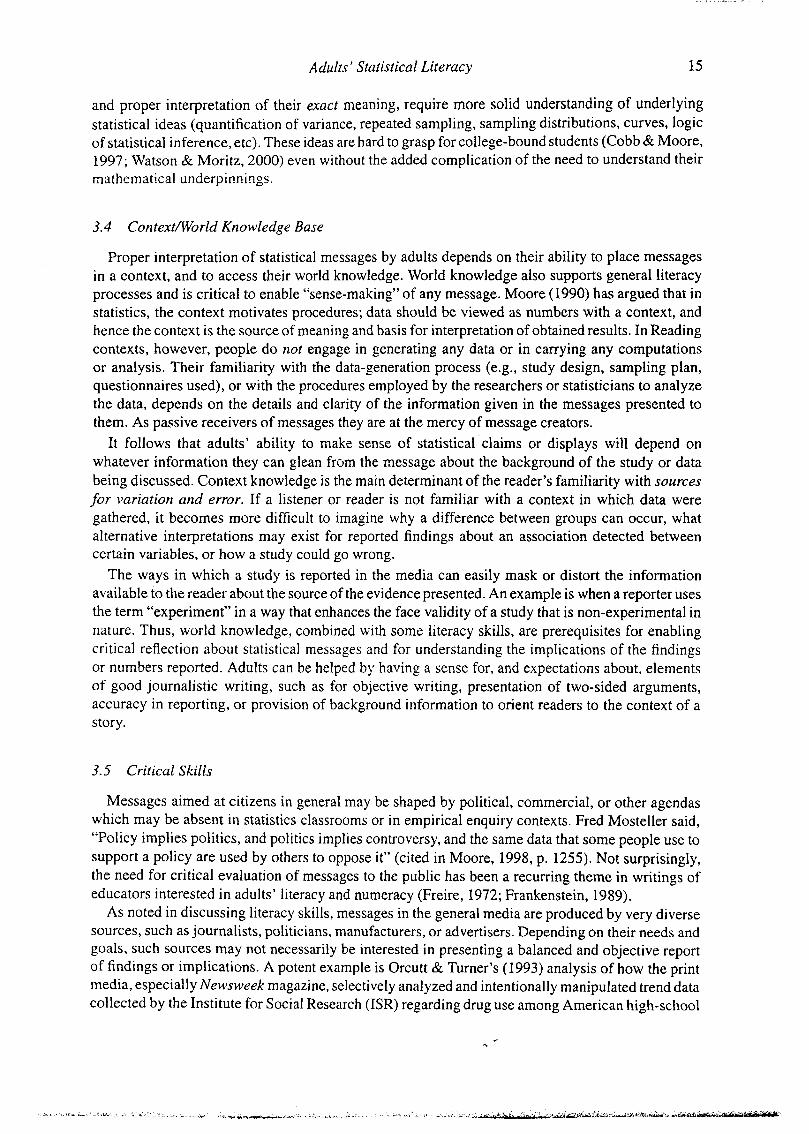
3.4 Context/World Knowledge Base
Proper interpretation of statistical messages by adults depends on their ability to place messages in a context, and to access their world knowledge. World knowledge also supports general literacy processes and is critical to enable "sense-making" of any message. Moore (1990) has argued that in statistics, the context motivates procedures; data should be viewed as numbers with a context, and hence the context is the source of meaning and basis for interpretation of obtained results. In Reading contexts, however, people do not engage in generating any data or in carrying any computations or analysis. Their familiarity with the data-generation process (e.g., study design, sampling plan, questionnaires used), or with the procedures employed by the researchers or statisticians to analyze the data, depends on the details and clarity of the information given in the messages presented to them. As passive receivers of messages they are at the mercy of message creators.
It follows that adults' ability to make sense of statistical'claims or displays will depend on whatever information they can glean from the message about the background of the study or data being discussed. Context knowledge is the main determinant of the reader's familiarity with sources for variation and error. If a listener or reader is not familiar with a context in which data were gathered, it becomes more difficult to imagine why a difference between groups can occur, what alternative interpretations may exist for reported findings about an association detected between certain variables, or how a study could go wrong.
The ways in which a study is reported in the media can easily mask or distort the information available to the reader about the source of the evidence presented. An example is when a reporter uses the term "experiment" in a way that enhances the face validity of a study that is non-experimental in nature. Thus, world knowledge, combined with some literacy skills, are prerequisites for enabling critical reflection about statistical messages and for understanding the implications of the findings or numbers reported. Adults can be helped by having a sense for, and expectations about, elements of good journalistic writing, such as for objective writing, presentation of two-sided arguments, accuracy in reporting, or provision of background information to orient readers to the context of a story.
3.5 Critical Skills
Messages aimed at citizens in general may be shaped by political, commercial, or other agendas which may be absent in statistics classrooms or in empirical enquiry contexts. Fred Mosteller said, "Policy implies politics, and politics implies controversy, and the same data that some people use to support a policy are used by others to oppose it" (cited in Moore, 1998, p. 1255). Not surprisingly, the need for critical evaluation of messages to the public has been a recurring theme in writings of educators interested in adults' literacy and numeracy (Freire, 1972; Frankenstein, 1989).
As noted in discussing literacy skills, messages in the general media are produced by very diverse sources, such as journalists, politicians, manufacturers, or advertisers. Depending on their needs and goals, such sources may not necessarily be interested in presenting a balanced and objective report of findings or implications. A potent example is Orcutt & Turner's (1993) analysis of how the print media, especially Newsweek magazine, selectively analyzed and intentionally manipulated trend data collected by the Institute for Social Research (ISR) regarding drug use among American high-school
students between 1975-1985. According to Orcutt & Turner, the media attempted to create for the public an image of a "drug plague", by selecting at its convenience only some of the data collected as part of a multi-year survey project, using graphical methods to augment small percentage differences (after truncating and censorizing), to appear visually large.
Orcutt & Turner (1993) add that later in 1992 Newsweek attempted again to create a sense of national danger by reporting that the use of LSD is "rising alarmingly" and that for the first time since 1976, more high-school seniors used LSD than cocaine. However, analysis of the ISR data on which Newsweek based this argument showed that this argument had no empirical basis. Cocaine use decreased from 6.5% in 1989 to 5.3% in 1990, a statistically significant change (given sample size used), whereas LSD use increased from 4.9% to only 5.4%, which was within the range of sampling error. The contrast between these figures, which were available to Newsweek, and the narrative and graphs used in the articles published, suggest an intentional misuse of data and highlights the media's tendency for sensational reporting practices.
Excerpts #4 and #6 (Figure 1) further illustrate how data can be tailored to serve the needs of specific organizations (e.g., states and manufacturers), and how reports about data are shaped to influence the opinions of the listener or reader in a specific direction. Paulos (1995, p. 79) notes that originators of messages regarding diseases, accidents, or other misfortunes that afflict humans, depending on their interest, can make them appear more salient and frightening by choosing to report absolute numbers (e.g., 2500 people nationwide suffer from X), or in contrast can downplay them by using incidence rate (e.g., 1 in every 100,000 people suffer from X). Many examples are also presented by Huff ( 1954) and Crossen (1994).
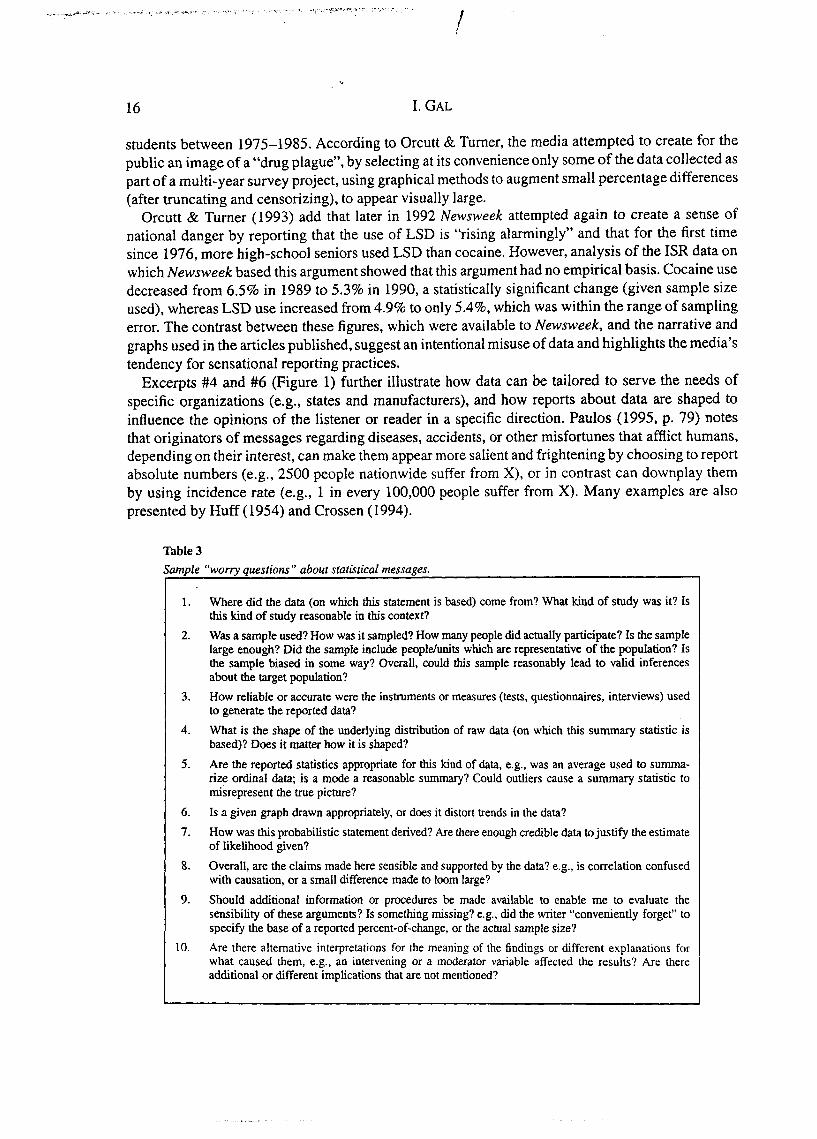
Table 3
Sample "worry questions " about statistical messages.
I 1. Where did the data (on which this statement is based) come from? What kind of study was it? Is this kind of study reasonable in this context?
2. Was a sample used? How was it sampled? How many people did actually participate? Is the sample large enough? Did the sample include peopldunits which are representative of the population? Is the sample biased in some way? Overall, could this sample reasonably lead to valid inferences about the target population?
3. How reliable or accurate were the instruments or measures (tests, questionnaires, interviews) used to generate the reported data?
4. What is the shape of the underlying distribution of raw data (on which this summary statistic is based)? Does it matter how it is shaped?
5. Are the reported statistics appropriate for this kind of data, e.g., was an average used to sumrna- rize ordinal data; is a mode a reasonable summary? Could outliers cause a summary statistic to misrepresent the true picture?
1 6. Is a given graph drawn appropriately, or does it distort trends in the data?
7. How was this probabilistic statement derived? Are there enough credible data to justify the estimate of likelihood given?
I 8. Overall, are the claims made here sensible and supported by the data? e.g., is correlation confused with causation, or a small difference made to loom large?
9. Should additional information or procedures be made available to enable me to evaluate the sensibility of these arguments? Is something missing? e.g., did the writer "conveniently forget" to specify the base of a reported percent-of-change, or the actual sample size?
10. Are there alternative interpretations for the meaning of the findings or different explanations for what caused them, e.g., an intervening or a moderator variable affected the results? Are there additional or different implications that are not mentioned?
Adults' Statistical Literacy 17
In light of such examples, and the possibility for biased reporting (Wanta, 1997), adults have to worry about and examine the reasonableness of claims presented in the media. They have to be concerned about the validity of messages, the nature and credibility of the evidence underlying the information or conclusions presented, and reflect upon possible alternative interpretations of conclusions conveyed to them. It follows that adults should maintain in their minds a list of "worry questions" regarding statistical information being communicated or displayed (Gal, 1994; Moore, 1997b; Garfield & Gal, 1999). Ten such questions are listed in Table 3. When faced with an interpretive statistical task, people can be imagined running through this list and asking for each question, "Is this question relevant for the situation/message/task I face right now?"
The answers people generate to these and related questions can support the process of critical evaluation of statistical messages and lead to the creation of more informed interpretations and judgments. This list can of course be modified, and some of its elements regrouped, depending on the life contexts and functional needs of different adults. It can expand beyond basic statistical issues to cover broader issues of probability and risk, or job-specific statistical topics such as those related to statistical process control or quality assurance.
3.6 Interaction of Knowledge Bases
Five knowledge bases were described above separately for ease of presentation, but they overlap and do not operate independently from each other. For example, familiarity with possible language ambiguities and reporting conventions comprise part of the literacy skills required of adults, yet are also part of general world knowledge, and related to the need for knowledge about intentional (and possibly biased) reporting practices listed as part of critical skills. Some aspects of the statistical knowledge base overlap with mathematical knowledge, for example regarding the difference in the computational procedures used to find medians and means and their implication for interpretation of such statistics under different conditions.
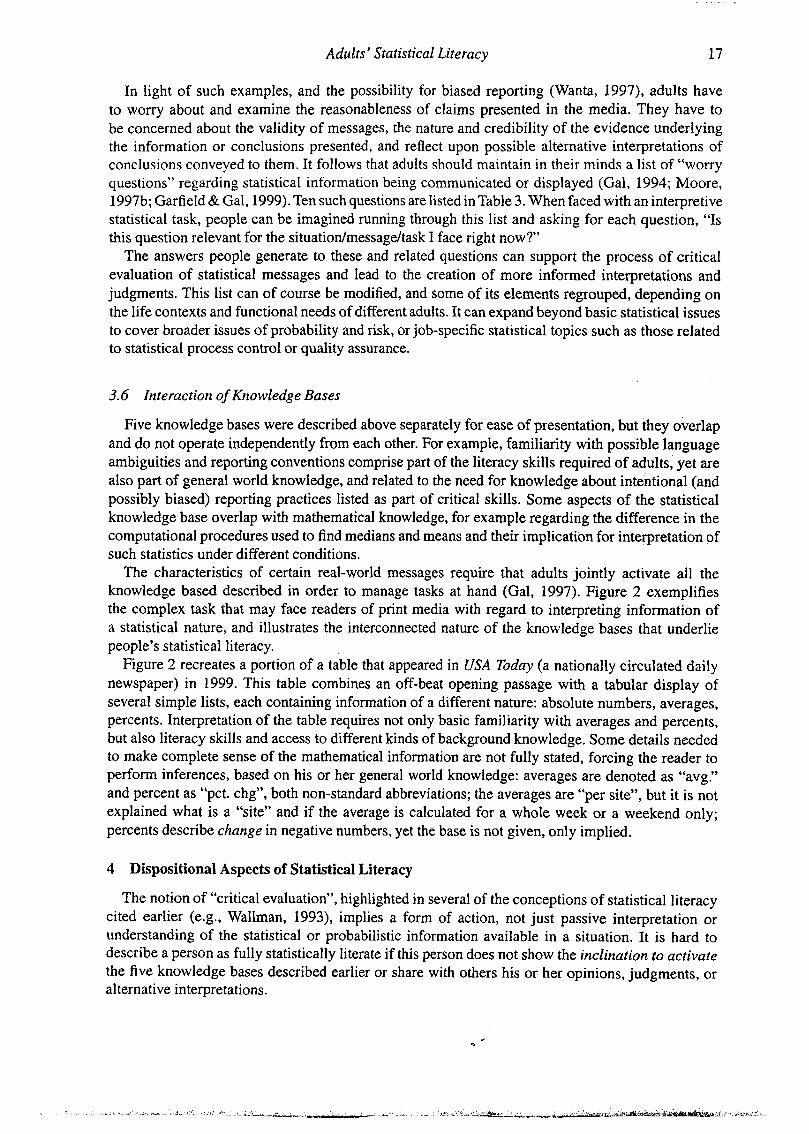
The characteristics of certain real-world messages require that adults jointly activate all the knowledge based described in order to manage tasks at hand (Gal, 1997). Figure 2 exemplifies the complex task that may face readers of print media with regard to interpreting information of a statistical nature, and illustrates the interconnected nature of the knowledge bases that underlie people's statistical literacy.
Figure 2 recreates a portion of a table that appeared in USA Today (a nationally circulated daily newspaper) in 1999. This table combines an off-beat opening passage with a tabular display of several simple lists, each containing information of a different nature: absolute numbers, averages, percents. Interpretation of the table requires not only basic familiarity with averages and percents, but also literacy skills and access to different kinds of background knowledge. Some details needed to make complete sense of the mathematical information are not fully stated, forcing the reader to perform inferences, based on his or her general world knowledge: averages are denoted as "avg." and percent as "pct. chg", both non-standard abbreviations; the averages are "per site", but it is not explained what is a "site" and if the average is calculated for a whole week or a weekend only; percents describe change in negative numbers, yet the base is not given, only implied.
4 Dispositional Aspects of Statistical Literacy
The notion of "critical evaluation", highlighted in several of the conceptions of statistical literacy cited earlier (e.g., Wallman, 1993), implies a form of action, not just passive interpretation or understanding of the statistical or probabilistic information available in a situation. It is hard to describe a person as fully statistically literate if this person does not show the inclination to activate the five knowledge bases described earlier or share with others his or her opinions, judgments, or alternative interpretations.
Statistically literate action can take many forms, both overt and hidden. It can be an internal mental process, such as thinking about the meaning of a passage one read, or raising in one's mind some critical questions and reflecting about them. It can be extended to more external forms, such as re-reading a passage, scanning a graph one encountered in the newspaper, stopping a game of chance after one remembers reading an article about the Gambler's Fallacy, or discussing findings of a survey one heard about on TV with family members at the dinner table or with co-workers. However, for any form of action to occur and be sustained, certain dispositions need to exist and be activated.
The term 'dispositions' is used here as a convenient aggregate label for three related but distinct concepts, critical stance, beliefs, and attitudes, which are all essential for statistical literacy. These concepts are interconnected (McLeod, 1992), and hence are harder to describe in a compartmentalized way, unlike the description of the five knowledge bases above. This section first describes critical stance, and then examines beliefs and attitudes that underlie a critical stance.
Critical stance. A first expectation is that adults hold a propensity to adopt, without external cues, a questioning attitude towards quantitative messages that may be misleading, one-sided, biased, or incomplete in some way, whether intentionally or unintentionally (Frankenstein, 1989). They should be able and willing to spontaneously invoke their personal list of worry questions (see Table 3) when faced with arguments that purport to be based on data or with reports of results or conclusions from surveys or other empirical research (Gal, 1994).
It is important to keep in mind that willingness to invoke action by adults when they encounter statistical information or messages may sometimes be required under conditions of uncertainty. Examples are lack of familiarity with the background of the issues discussed or estimates conveyed, partial knowledge of concepts and their meanings, or the need to cope with technical terms that "fly above the head" of the Reader. This may be the case for many adults without much formal education or effective literacy skills, who constitute a sizable percentage of the population in many countries (Statistics Canada and OECD, 1996; UNESCO, 2000). Action or reaction in such situations may involve taking some personal risks, i.e., exposing to others that one is naive about, or unfamiliar with, certain statistical issues, and possibly suffering some embarrassment or the need to argue with others.
Beliefs and aftitudes. Certain beliefs and attitudes underlie people's critical stance and willingness to invest mental effort or occasionally take risks as part of acts of statistical literacy. There is a definitional challenge in discussing "beliefs" and "attitudes" as the distinction between them is somewhat murky. (Researchers, for example, often implicitly defined statistics attitudes or beliefs as whatever their favorite assessment instrument measures in the context of a specific target population, such as school students, college students, or adults at large).
Based on McLeod's (1992) work on affective aspects of mathematics education, a distinction should be made between emotions, attitudes, and beliefs (see also Edwards, 1990; Green, 1993). Emotions are transient positive and negative responses triggered by one's immediate experiences (e.g., while studying mathematics or statistics, or while facing a certain probabilistic situation, such as receiving medical information about the chances of side-effects of a proposed treatment). Attitudes are relatively stable, intense feelings that develop through gradual internalization of repeated positive or negative emotional responses over time. Attitudes are expressed along a positive-negative continuum (like-dislike, pleasant-unpleasant), and may represent, for example, feelings towards objects, actions, or topics ("I don't like polls and pollsters, they always confuse me with numbers"). Beliefs are individually held ideas or opinions, such as about a domain ("government statistics are always accurate"), about oneself ("I am really naive about statistical information", "I am not a numbers person"), or about a social context ("The government should not waste money on big surveys"; see Wallman, 1993). Beliefs take time to develop and cultural factors play an important part in their development. They have a larger cognitive component and less emotional intensity than
Adults ' Statistical Literacy 19
attitudes, and are stable and quite resistant to change compared to attitudes. Adults should develop a positive view of themselves as individuals capable of statistical and
probabilistic reasoning as well as a willingness and interest to "think statistically" in relevant situations. This assumes that adults hold some appreciation for the power of statistical processes, and accept that properly planned studies have the potential to lead to better or more valid conclusions than those obtained by relying on anecdotal data or personal experiences (Moore, 1998). Broader metacognitive capacities that are considered part of people's general intellectual functioning can further support statistically literate behavior, such as having a propensity for logical reasoning, curiosity, and open-minded thinking (Baron, 1988).
Gal, Ginsburg & Schau (1997) examined the role of attitudes and beliefs in statistics education, and argued that to enable productive problem-solving, learners need to feel safe to explore, conjecture, and feel comfortable with temporary confusion or a state of uncertainty. It was argued earlier that reading contexts, where people are data consumers, differ in several ways from those encountered in enquiry contexts such as those addressed by Gal et al. (1997). Yet, some commonality between these two contexts does exist regarding the required beliefs that support action. Even in reading contexts adults have to feel safe to explore and hypothesize, feel comfortable being in the role of a critical reader or listener, and believe in their ability to make sense of messages (Gal, 1994), as a condition for developing and sustaining their motivation for critical action.
Finally, we come to a point where "critical stance" and "beliefs and attitudes" mesh together. For a critical stance to be maintained, adults should develop a belief in the legitimacy of critical action. Readers should uphold the idea that it is legitimate to be critical about statistical messages or arguments, whether they come from official or other sources, respectable as they may be. Adults should agree that it is legitimate to have concerns about any aspect of a reported study or a proposed interpretation of its results, and to raise pertinent "worry questions", even if they have not learned much formal statistics or mathematics, or do not have access to all the background details needed.
5 Discussion and Implications
The main goal of this paper was to propose a conceptualization of statistical literacy and describe its key components. Given the patchy nature of literature on statistical literacy, the availability of such a model was seen as a necessary prefatory step before further scholarly discussion can ensue regarding the issues involved in developing or studying adult statistical literacy. Statistical literacy was portrayed in this paper as the ability to interpret, critically evaluate, and if needed communicate about statistical information, arguments, and messages. It was proposed that statistically literate behavior requires the joint activation of five interrelated knowledge bases (literacy, statistical, mathematical, context/world, and critical), yet that such behavior is predicated on the presence of a critical stance and supporting beliefs and attitudes.
The proposed conceptualization highlights the key role that non-statistical factors and components play in statistical literacy, and reflects the broad and often multi-faceted nature of the situations in which statistical literacy may be activated. That said, several observations should be made. First, the five knowledge bases discussed in this paper were sketched in broad strokes to clarify the key categories of knowledge to be considered when thinking of what adults needs to know to be statistically literate. Each could be modified or elaborated, depending on the cultural context of interest, and on the sophistication of statistical literacy expected of citizens or workers in a given country or community. As with conceptions of other functional skills, the particulars viewed as essential for statistical literacy in a specific country will be dynamic and may have to change along with technological and societal progress.
Secondly, although five knowledge bases and a cluster of beliefs, attitudes and a critical stance were proposed as jointly essential for statistical literacy, it does not necessarily follow that a person
should fully possess all of them to be able to effectively cope with interpretive tasks in all reading and listening contexts. Following current conceptions of adult literacy (Wagner et al., 1999) and numeracy (Gal, 2000), statistical literacy should be regarded as a set of capacities that can exist to different degrees within the same individual, depending on the contexts where it is invoked or applied. Descriptions of what constitutes statistical literacy may differ in work contexts, in personalhome contexts, in public discourse contexts, and in formal learning contexts.
In the light of the centrality of statistical literacy in various life contexts, yet also its complex nature, educators, statisticians, and professionals interested in how well citizens can interpret and communicate about statistical messages face numerous challenges and responsibilities. Below is a preliminary discussion regarding two key areas, education for statistical literacy, and suggested research in this area.
5.1 Educational Challenges
Several countries and organizations have introduced programs to improve school-level education on data-analysis and probability, sometimes called data handling, stochastics, or chance (Australian Education Council, 1991; National Council of Teachers of Mathematics, 2000). Yet, at the school level, where most individuals will receive their only formal exposure to statistics (Moore, 1998), these topics overall receive relatively little curricular attention compared to other topics in the math- ematical sciences. The most credible information in this regard comes from the curriculum analysis component of TIMSS, the Third International Mathematics and Science Study (Schmidt, McKnight, Valverde, Houang & Wiley, 1997), which examined curriculum documents and textbooks and con- sulted with expert panels from over 40 countries. TIMSS data also pointed to an enormous diversity in curricular frameworks. Various gaps have been documented by TIMSS between the intended and implemented curriculum, i.e., between curriculum plans and what actually appears in mainstream textbooks, which tend to be conservative.
TIMSS tests included few statistics items, hence it was not possible to create a separate scale describing student performance in statistics. However, achievement on individual statistical tasks was problematic. For example, Mullis, Martin, Beaton, Gonzalez, Kelly & Smith (1998) reported performance levels of students in theirfinal year of schooling (usually grade 12) on a task directly related to statistical literacy: explain whether a reporter's statement about a "huge increase" was a reasonable interpretation of a bar graph showing the number of robberies in two years that was manipulated to create a specific impression. The graph included a bar for each year but a truncated scale, causing a small difference between years to appear large. Performance levels varied across countries; on average, less than half of all graduating students appeared to be able to cope (at least partially) with this task that exemplifies one of the most basic skills educators usually use as an example for a statistical literacy skill expected of all citizens: i.e., ability to detect a discrepancy between displayed data and a given interpretation of these data. Keeping in mind that in many countries a sizable proportion of students drop out or leave before the final year of high school, the overall percentage of all school leavers who can cope with such tasks is bound to be even lower.
Efforts to improve statistics education at the secondary or post-secondary levels examine needed changes in a range of areas, including in content and methods, teacher preparation and training, assessments, the use of technology (e.g., Cobb, 1992; Pereira-Mendoza, 1993; Gal & Garfield, 1997; Lajoie, 1998). Yet, a crucial question is, To what extent can such efforts develop students' inter- pretive and statistical literacy skills? To appreciate the complexity of the issues implicated by this question, consider the situation in the related area of scientific literacy. Eisenhart, Finkel & Marion (1996) have argued that the broad, progressive, and inclusive vision of scientific literacy in reform proposals is being implemented in narrow and conventional ways, hence reform efforts may not lead to significant changes in national scientific literacy. To help define educational goals, it may be possible to identify levels of statistical literacy (Watson, 1997; Watson & Moritz, 2000) in a similar
Adults' Statistical Literacy 2 1
fashion to the continuum proposed to describe levels of scientific literacy (Shamos, 1995). This paper argues that statistical literacy depends on possession of elements from all five different
knowledge bases, and that literacy skills, contextual knowledge, critical skills, and needed disposi- tions, play a significant role in this regard. It is not at all clear that learning statistical facts, rules, and procedures, or gaining personal statistical experience through a data-analysis project in a formal classroom enquiry context can in itself lead to an adequate level of statistical literacy.
Calls to change traditional approaches to teaching statistics have been repeatedly made in recent years, and met with some success (Moore & Cobb, 2000). Yet, educators have to distinguish between teaching more statistics (or teaching it better) and teaching statistics for a dlft'erent (or additional) purpose. Literacy demands facing students who are learning statistics are more constrained than those described in Section 3.1 as characterizing Reading contexts. When students who learn statistics read or listen to project reports created by their fellow students (Starkings, 1997), or when they read academic research papers, findings and conclusions are likely to be shared through language that is less varied than what appears in real-world sources. This may happen because academic conventions inhibit or channel the type of expressions and styles that authors, students and teachers are expected to use, or due to logistical limitations in large introductory statistics courses that restrict the richness and scope of classroom discourse that teachers can afford to conduct (Wild, Triggs & Pfannkuch, 1997). When students encounter an unfamiliar or ambiguous term, they can clarify its interpretation by talking with the teacher, unlike consumers of the media. The upshot is that the literacy demands in statistics classes do not necessarily represent the heterogeneous communicative environment within which adults in general have to cope with statistical messages.
To develop statistical literacy, it may be needed to work with learners, both younger students and adults, in ways that are different from, or go beyond, instructional methods currently in use. To better cover all knowledge bases supporting statistical literacy, topics and skills that are normally not stressed in regular statistics modules or introductory courses, for lack of time or teacher preparation, may have to be addressed. Some examples are:
understanding results from polls, samples, and experiments (Landwehr, Swift & Watkins, 1987; MacCoun, 1998) as reported in newspapers or other media channels, understanding probabilistic aspects of statements about risk and side effects (Clemen & Gregory, 2000) as reported in newspapers or other media channels, learning about styles, conventions, and biases in journalistic reporting or advertisements, familiarity with "worry questions" (Table 3), coupled with experience in applying them to real examples (such as one-sided messages, misleading graphs), or seeing someone else, e.g., a teacher, model their application. development of a critical stance and supporting beliefs, including positive beliefs and attitudes about the domain (usefulness of statistical investigations) and oneself.
TIMSS reports on curriculum planning and other school-related variables imply that young people who will be leaving schools in coming years may continue to have insufficient preparation in data analysis and probability. An important and presently much larger population is that of adults in general. The majority of the current adult population in any country has not had much if any formal exposure to the statistical or mathematical knowledge bases described earlier,given known education levels across the world (Statistics Canada & OECD, 1996; UNESCO, 2000). As IALS (Organisation for Economic Co-operation and Development (OECD) & Human Resources Development Canada, 1997) and other studies have shown, even in industrialized countries, literacy levels of many adults are low. This paper argues that literacy skills, including document literacy skills, are an important component of the knowledge base needed for statistical literacy. It follows that achieving the vision of "statistical literacy for all" will require a concerted effort by various educational and other systems, both formal and nonformal.
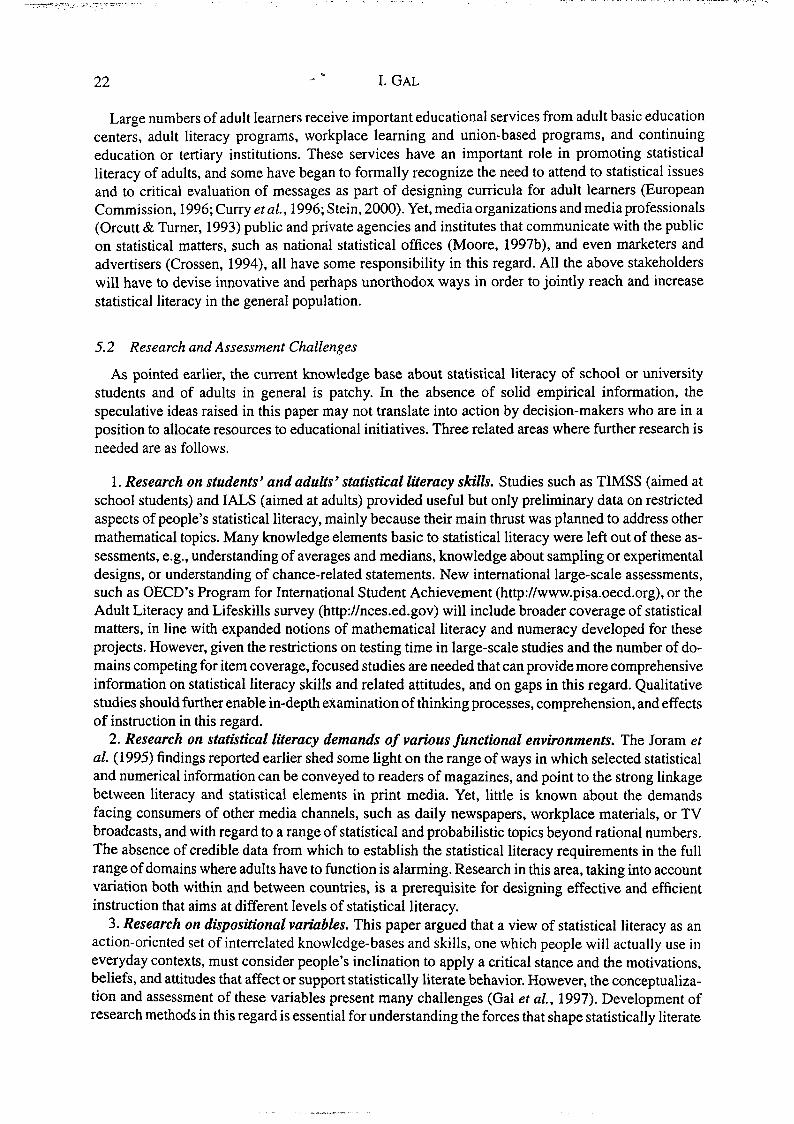
Large numbers of adult learners receive important educational services from adult basic education centers, adult literacy programs, workplace learning and union-based programs, and continuing education or tertiary institutions. These services have an important role in promoting statistical literacy of adults, and some have began to formally recognize the need to attend to statistical issues and to critical evaluation of messages as part of designing curricula for adult learners (European Commission, 1996; Curry et al., 1996; Stein, 2000). Yet, media organizations and media professionals (Orcutt & Turner, 1993) public and private agencies and institutes that communicate with the public on statistical matters, such as national statistical offices (Moore, 1997b), and even marketers and advertisers (Crossen, 1994), all have some responsibility in this regard. All the above stakeholders will have to devise innovative and perhaps unorthodox ways in order to jointly reach and increase statistical literacy in the general population.
5.2 Research and Assessment Challenges
As pointed earlier, the current knowledge base about statistical literacy of school or university students and of adults in general is patchy. In the absence of solid empirical information, the speculative ideas raised in this paper may not translate into action by decision-makers who are in a position to allocate resources to educational initiatives. Three related areas where further research is needed are as follows.
1. Research on students' and adults' statistical literacy skills. Studies such as TIMSS (aimed at school students) and IALS (aimed at adults) provided useful but only preliminary data on restricted aspects of people's statistical literacy, mainly because their main thrust was planned to address other mathematical topics. Many knowledge elements basic to statistical literacy were left out of these as- sessments, e.g., understanding of averages and medians, knowledge about sampling or experimental designs, or understanding of chance-related statements. New international large-scale assessments, such as OECD's Program for International Student Achievement (http://www.pisa.oecd.org), or the Adult Literacy and Lifeskills survey (http:Nnces.ed.gov) will include broader coverage of statistical matters, in line with expanded notions of mathematical literacy and numeracy developed for these projects. However, given the restrictions on testing time in large-scale studies and the number of do- mains competing for item coverage, focused studies are needed that can provide more comprehensive information on statistical literacy skills and related attitudes, and on gaps in this regard. Qualitative studies should further enable in-depth examination of thinking processes, comprehension, and effects of instruction in this regard.
2. Research on statistical literacy demands of various functional environments. The Joram et al. (1995) findings reported earlier shed some light on the range of ways in which selected statistical and numerical information can be conveyed to readers of magazines, and point to the strong linkage between literacy and statistical elements in print media. Yet, little is known about the demands facing consumers of other media channels, such as daily newspapers, workplace materials, or TV broadcasts, and with regard to a range of statistical and probabilistic topics beyond rational numbers. The absence of credible data from which to establish the statistical literacy requirements in the full range of domains where adults have to function is alarming. Research in this area, taking into account variation both within and between countries, is a prerequisite for designing effective and efficient instruction that aims at different levels of statistical literacy.
3. Research on dispositional variables. This paper argued that a view of statistical literacy as an action-oriented set of interrelated knowledge-bases and skills, one which people will actually use in everyday contexts, must consider people's inclination to apply a critical stance and the motivations, beliefs, and attitudes that affect or support statistically literate behavior. However, the conceptualiza- tion and assessment of these variables present many challenges (Gal et al., 1997). Development of research methods in this regard is essential for understanding the forces that shape statistically literate
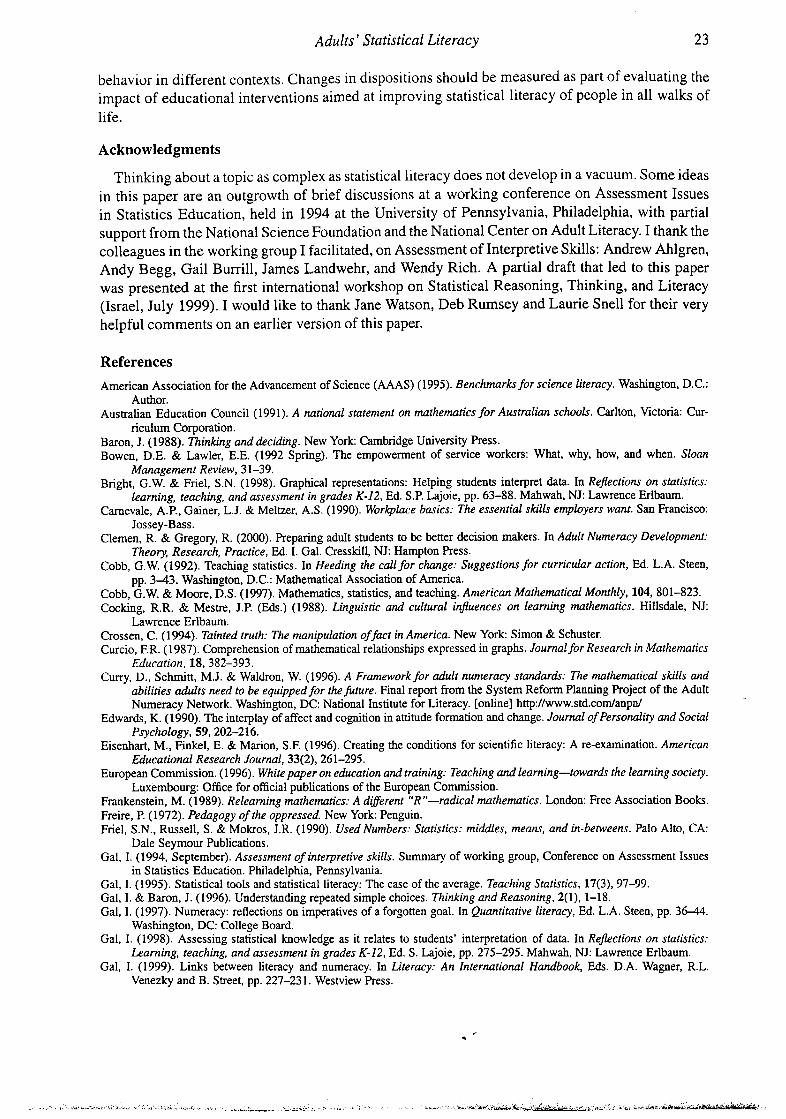
Adults ' Statistical Literacy
behavior in different contexts. Changes in dispositions should be measured as part of evaluating the impact of educational interventions aimed at improving statistical literacy of people in all walks of life.
Acknowledgments
Thinking about a topic as complex as statistical literacy does not develop in a vacuum. Some ideas in this paper are an outgrowth of brief discussions at a working conference on Assessment Issues in Statistics Education, held in 1994 at the University of Pennsylvania, Philadelphia, with partial support from the National Science Foundation and the National Center on Adult Literacy. I thank the colleagues in the working group I facilitated, on Assessment of Interpretive Skills: Andrew Ahlgren, Andy Begg, Gail Burrill, James Landwehr, and Wendy Rich. A partial draft that led to this paper was presented at the first international workshop on Statistical Reasoning, Thinking, and Literacy (Israel, July 1999). I would like to thank Jane Watson, ~ e b Rumsey and Laurie Snell for their very helpful comments on an earlier version of this paper.
References
American Association for the Advancement of Science (AAAS) (1995). Benchmark. for science literacy. Washington, D.C.: Author.
Australian Education Council (1991). A national statement on mathematics for Australian schools. Carlton, Victoria: Cur- riculum Corporation.
Baron, J. (1988). Thinking and deciding. New York: Cambridge University Press. Bowen, D.E. & Lawler, E.E. (1992 Spring). The empowerment of service workers: What, why, how, and when. Sloan
Management Review, 3 1-39. Bright, G.W. & Friel, S.N. (1998). Graphical representations: Helping students interpret data. In Reflections on statistics:
learning, teaching, and assessment in grades K-12, Ed. S.P. Lajoie, pp. 63-88. Mahwah, NJ: Lawrence Erlbaurn. Camevale, A.P., Gainer, L.J. & Meltzer, A.S. (1990). Workplace basics: The essential skills employers want. San Francisco:
Jossey-Bass. Clemen, R. & Gregory, R. (2000). Preparing adult students to be better decision makers. In Adult Nurneracy Development:
Theory, Research, Practice, Ed. I. Gal. Cresskill, NJ: Hampton Press. Cobb, G.W. (1992). Teaching statistics. In Heeding the call for change: Suggestions for curricular action, Ed. L.A. Steen,
pp. 3-43. Washington, D.C.: Mathematical Association of America. Cobb, G.W. & Moore, D.S. (1997). Mathematics, statistics, and teaching. American Mathematical Monthly, 104, 801-823. Cocking, R.R. & Mestre, J.P. (Eds.) (1988). Linguistic and cultural influences on learning mathematics. Hillsdale, NJ:
Lawrence Erlbaum. Crossen, C. (1994). Tainted truth: The manipulation of fact in America. New York: Simon & Schuster. Curcio, F.R. (1987). Comprehension of mathematical relationships expressed in graphs. Journal for Research in Mathematics
Education, 18,382-393. Curry, D., Schmitt, M.J. & Waldron, W. (1996). A Framework for adult numeracy standards: The mathematical skills and
abilities adults need to be equipped for thefuture. Final report from the System Refom Planning Project of the Adult Numeracy Network. Washington, DC: National Institute for Literacy. [online] http://www.std.com/anpnl
Edwards, K. (1990). The interplay of affect and cognition in attitude formation and change. Journal of Personality and Social Psychology, 59,202-216.
Eisenhart, M., Finkel, E. & Marion, S.F. (1996). Creating the conditions for scientific literacy: A re-examination. American Educational Research Journal, 33(2), 261-295.
European Commission. (1996). White paper on education and training: Teaching and learning-towar& the learning society. Luxembourg: Office for official publications of the European Commission.
Frankenstein, M. (1989). Relearning mathematics: A di$erent "R"-radical mathematics. London: Free Association Books. Freire, P. (1972). Pedagogy of the oppressed. New York: Penguin. Friel, S.N., Russell, S. & Mokros, J.R. (1990). Used Numbers: Statistics: middles, means, and in-betweens. Palo Alto, CA:
Dale Seymour Publications. Gal, I. (1994, September). Assessment of interpretive skilLs. Summary of working group, Conference on Assessment Issues
in Statistics Education. Philadelphia, Pe~sylvania. Gal, I. (1995). Statistical tools and statistical literacy: The case of the average. Teaching Statistics, 17(3), 97-99. Gal, I. & Baron, J. (1996). Understanding repeated simple choices. Thinking and Reasoning, 2(1), 1-18. Gal, I. (1997). Numeracy: reflections on imperatives of a forgotten goal. In Quantitative literacy, Ed. L.A. Steen, pp. 3 M .
Washington, DC: College Board. Gal, I. (1998). Assessing statistical knowledge as it relates to students' interpretation of data. In Reflections on statistics:
Learning, teaching, and assessment in grades K-12, Ed. S. Lajoie, pp. 275-295. Mahwah, NJ: Lawrence Erlbaum. Gal, I. (1999). Links between literacy and numeracy. In Literacy: An International Handbook, Eds. D.A. Wagner, R.L.
Venezky and B. Street, pp. 227-231. Westview Press.
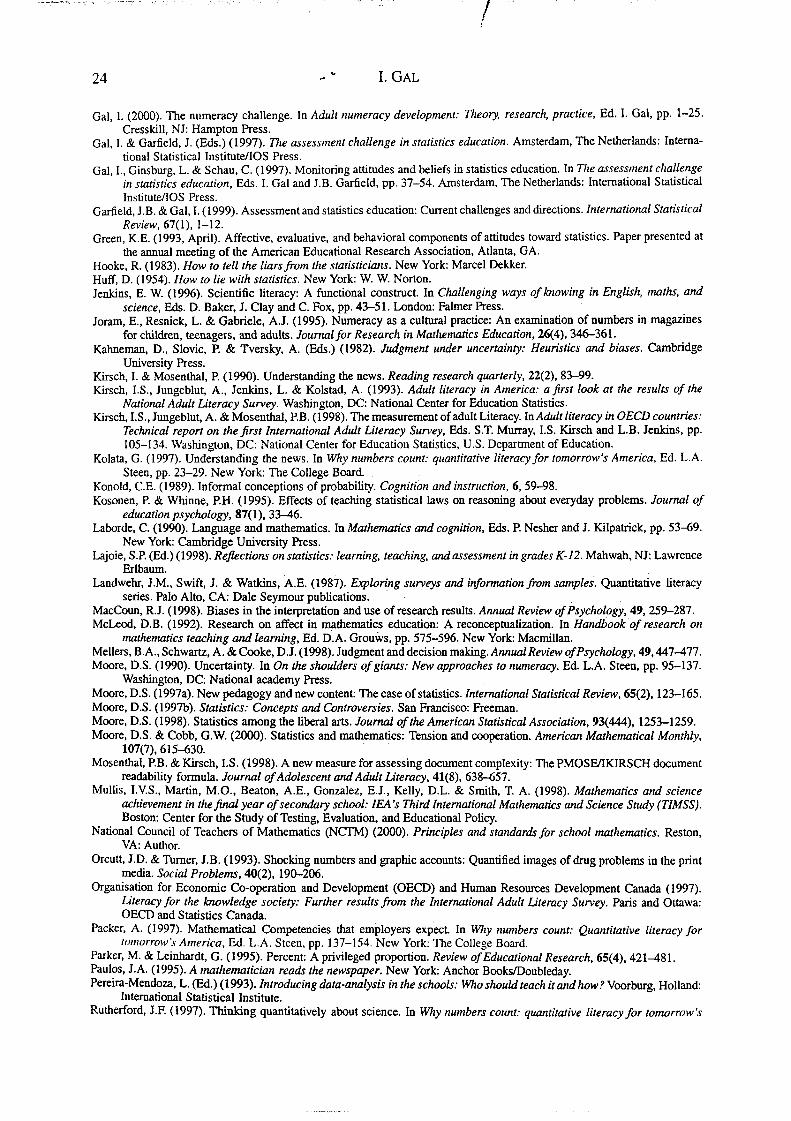
Gal, 1. (2000). The numeracy challenge. In Adult numeracy development: Theory, research, practice, Ed. I . Gal, pp. 1-25. Cresskill, NJ: Hampton Press.
Gal, I. & Garfield, J. (Eds.) (1997). The assessment challe~tge in statistics education. Amsterdam, The Netherlands: Interna- tional Statistical InstitutdIOS Press.
Gal, I., Ginsburg, L. & Schau, C. (1997). Monitoring attitudes and beliefs in statistics education. In The assessment clullenge in statistics education, Eds. I. Gal and J.B. Garfield, pp. 37-54. Amsterdam, The Netherlands: International Statistical InstitutelIOS Press.
Garfield, J.B. & Gal, I. (1999). Assessment and statistics education: Current challenges and directions. International Statistical Review, 67(1), 1-12.
Green, K.E. (1993, April). Affective, evaluative, and behavioral components of attitudes toward statistics. Paper presented at the annual meeting of the American Educational Research Association, Atlanta, GA.
Hooke, R. (1983). How to tell the liarsfrom the statisticicuts. New York: Marcel Dekker. Huff, D. (1954). How to lie with statistics. New York: W. W. Norton. Jenkins, E. W. (1996). Scientific literacy: A functional conshuct. In Challenging ways of knowing in English, matlls, and
science, Eds. D. Baker, J. Clay and C. Fox, pp. 43-51. London: Falmer Press. Joram, E., Resnick, L. & Gabriele, A.J. (1995). Numeracy as a cultural practice: An examination of numbers in magazines
for children, teenagers, and adults. Journal for Research in Mathematics Education, 26(4), 346-361. Kahneman, D., Slovic, P. & Tversky, A. (Eds.) (1982). Judgment under uncertainty: Heuristics and biases. Cambridge
University Press. Kirsch, I. & Mosenthal, P. (1990). Understanding the news. Reading research quarterly, 22(2), 83-99. Kirsch, I.S., Jungebluf A., Jenkins, L. & Kolstad, A. (1993). Adult literacy in America: afirst look at the results of the
National Adult Literacy Survey. Washington, DC: National Center for Education Statistics. Kirsch, I.S., Jungeblut, A. & Mosenthal, P.B. (1998). The measurement of adult Literacy. In Adult literacy in OECD countries:
Technical report on thejrst International Adult Literacy Survey, Eds. S.T. Mu~~ay, I.S. Kirsch and L.B. Jenkins, pp. 105-134. Washington, DC: National Center for Education Statistics, U.S. Department of Education.
Kolata, G. (1997). Understanding the news. In Why numbers count: quantitative literacy for tomorrow's America, Ed. L.A. Steen, pp. 23-29. New York: The College Board.
Konold, C.E. (1989). Informal conceptions of probability. Cognition and insrniction, 6,59-98. Kosonen, P. & Whinne, P.H. (1995). Effects of teaching statistical laws on reasoning about everyday problems. Journal of
education psychology, 87(1), 3346. Laborde, C. (1990). Language and mathematics. In Mathematics and cognition, Eds. P. Nesher and J. Kilpatrick, pp. 53-69.
New York: Cambridge University Press. Lajoie, S.P. (Ed.) (1998). Refictions on statistics: learning, teaching, andassessment in grades K-12. Mahwah, NJ: Lawrence
Erlbaum. Landwehr, J.M., Swift, J. & Watkins, A.E. (1987). Exploring surveys and information from samples. Quantitative literacy
series. Palo Alto, CA: Dale Seymour publications. MacCoun, R.J. (1998). Biases in the interpretation and use of research results. Annual Review of Psychology, 49,259-287. McLeod, D.B. (1992). Research on affect in mathematics education: A reconceptualization. In Handbook of research on
mathematics teaching and learning, Ed. D.A. Grouws, pp. 575-596. New York: Macmillan. Mellers, B.A., Schwartz, A. & Cooke, D.J. (1998). Judgment and decision making. Annual Review ofPsychology, 49,447-477. Moore, D.S. (1990). Uncertainty. In On the shoulders of giants: New approaches to nurneracy. Ed. L.A. Steen, pp. 95-137.
Washington, DC: National academy Press. Moore, D.S. (1997a). New pedagogy and new content: The case of statistics. International Statistical Review, 65(2), 123-165. Moore, D.S. (1997b). Statistics: Concepts and Controversies. San Francisco: Freeman. Moore, D.S. (1998). Statistics among the liberal arts. Jouml of the American Statistical Association, 93(444), 1253-1259. Moore, D.S. & Cobb, G.W. (2000). Statistics and mathematics: Tension and cooperation. American Mathematical Monthly,
107(7), 615430. Mosenthal, P.B. & Kirsch, I.S. (1998). A new measure for assessing document complexity: The PMOSWKIRSCH document
readability formula. Journal of Adolescent and Adult Literacy, 41(8), 638-657. Mullis, I.V.S., Martin, M.O., Beaton, A.E., Gonzalez, E.J., Kelly, D.L. & Smith, T. A. (1998). Mathematics and science
achievement in the final year of secondary school: IEA's Third International Mathematics and Science Study (TIMSS). Boston: Center for the Study of Testing, Evaluation, and Educational Policy.
National Council of Teachers of Mathematics (NCTM) (2000). Principles and standards for school mathematics. Reston, VA: Author.
Orcua, J.D. & Turner, J.B. (1993). Shocking numbers and graphic accounts: Quantified images of drug problems in the print media. Social Problems, 40(2), 190-206.
Organisation for Economic Co-operation and Development (OECD) and Human Resources Development Canada (1997). Literacy for the knowledge society: Further resultsfrom the International Adult Literacy Survey. Paris and Ottawa: OECD and Statistics Canada.
Packer, A. (1997). Mathematical Competencies that employers expect. In Ully numbers count: Quantitative literacy for to~llorrow's America, Ed. L.A. Steen, pp. 137-154. New York: The College Board.
Parker, M. & Leinhardt, G . (1995). Percent: A privileged proportion. Review of Educational Research, 65(4), 421481. Paulos, J.A. (1995). A rnatl~ematician reads the newspaper. New York: Anchor BooksDoubleday. Pereira-Mendoza, L. (Ed.) (1993). Introducing data-analysis in the schools: Who shouM teach it and how? Voorburg, Holland:
International Statistical Institute. Rutherford, J.F. (1997). Thinking quantitatively about science. In Why numbers count: quantitative literacy for tomorrow S
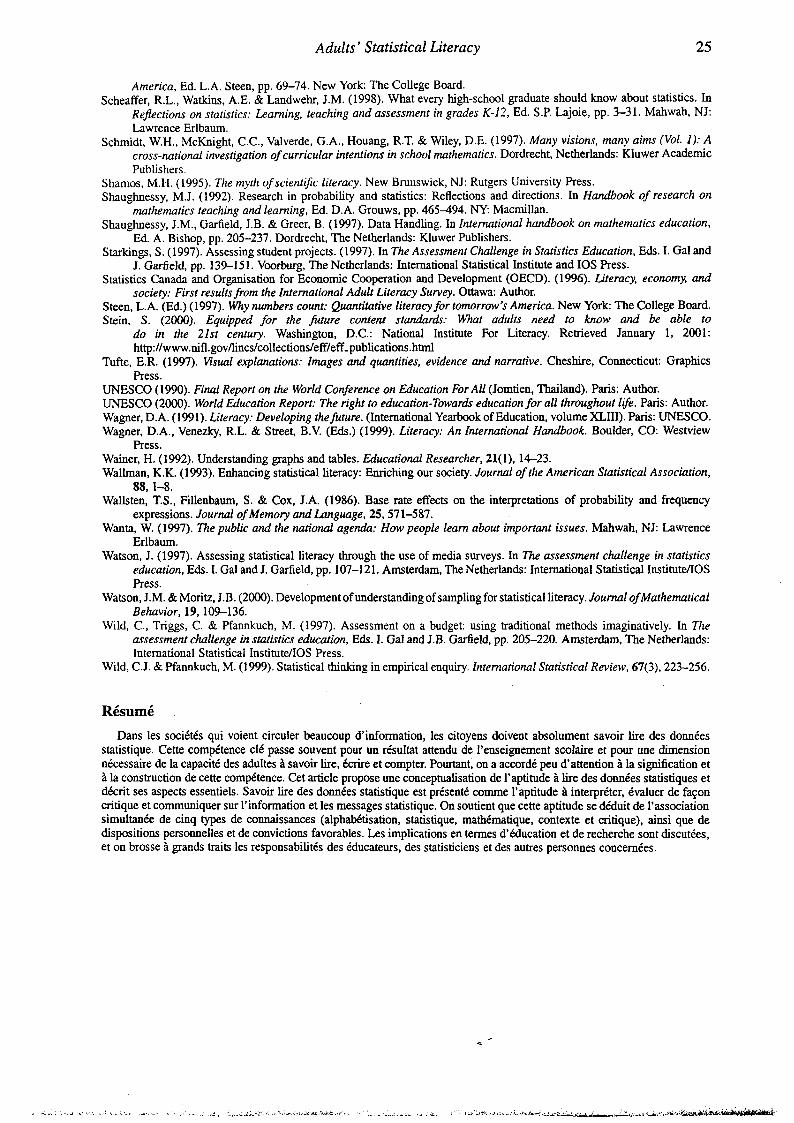
Adults' Statistical Literacy 25
America, Ed. L.A. Steen, pp. 69-74. New York: The College Board. Scheaffer, R.L., Watkins, A.E. & Landwehr, J.M. (1998). What every high-school graduate should know about statistics. In
Rejections on statistics: Learning, teaching and assessment in grades K-12, Ed. S.P. Lajoie, pp. 3-31. Mahwah, NJ: Lawrence Erlbaum.
Schmidt, W.H., McKnight, C.C., Valverde, G.A., Houang, R.T. & Wiley, D.E. (1997). Many visions, many aims (Val. 1): A cross-national investigation of curricular intentions in school mathematics. Dordrecht, Netherlands: Kluwer Academic Publishers
Shamos, M.H. (1995). The myth of scientific literacy. New Brunswick, NJ: Rutgers University Press. Shaughnessy, M.J. (1992). Research in probability and statistics: Reflections and directions. In Handbook of research on
nuthematics teaching and learning, Ed. D.A. Grouws, pp. 465-494. NY Macmillan. Shaughnessy, J.M., Garfield, J.B. & Greer, B. (1997). Data Handling. In International handbook on mathematics education,
Ed. A. Bishop, pp. 205-237. Dordrecht, The Netherlands: Kluwer Publishers. Starkings, S. (1997). Assessing student projects. (1997). In The Assessment Challenge in Statistics Education, Eds. I . Gal and
J. Garfield, pp. 139-15 1. Voorbwg, The Netherlands: International Statistical Institute and IOS Press. Statistics Canada and Organisation for Economic Cooperation and Development (OECD). (1996). Literacy, economy, and
society: First resultsfrom the International Adult Literacy Survey. Ottawa: Author. Steen, L.A. (Ed.) (1997). Why numbers count: Quantitative literacy for tomorrow's America. New York: The College Board. Stein, S. (2000). Equipped for the future content standard: What adults need to know and be able to
do in the 21st century. Washington, D.C.: National Institute For Literacy. Retrieved January 1, 2001: http://www.nifl.govfincs/collectio11~/eff/eff~publi~tions.html
Tufte, E.R. (1997). Visual explanations: Images and quantities, evidence and narrative. Cheshire, Connecticut: Graphics Press.
UNESCO (1990). Final Report on the World Conference on Education For All (Jomtien, Thailand). Paris: Author. UNESCO (2000). World Education Report: The right to education-Towards education for all throughout life. Paris: Author. Wagner, D.A. (1 991). Literacy: Developing thefuture. (International Yearbook of Education, volume XLIII). Paris: UNESCO. Wagner, D.A., Venezky, R.L. & Street, B.V. (Eds.) (1999). Literacy: An International Handbook. Boulder, CO: Westview
Press. Wainer, H. (1992). Understanding graphs and tables. Educational Researcher, 21(1), 14-23. Wallman, K.K. (1993). Enhancing statistical literacy: Enriching ow society. Journal of the American Statistical Association,
88,l-S. Wallsten, T.S., Fillenbaum, S. & Cox, J.A. (1986). Base rate effects on the interpretations of probability and frequency
expressions. Journal of Memory and Lunguage, 25,571-587. Wanta, W. (1997). The public and the national agenda: How people learn about important issues. Mahwah, NJ: Lawrence
Erlbaum. Watson, J. (1997). Assessing statistical literacy through the use of media surveys. In The assessment challenge in statistics
education, Eds. I . Gal and J. Garfield, pp. 107-121. Amsterdam, The Netherlands: International Statistical InstituteAOS Press.
Watson, J.M. & Moritz, J.B. (2000). Development of understanding of sampling for statistical literacy. Journal ofMathematica1 Behavior, 19, 109-136.
Wild, C., Triggs, C. & Pfannkuch, M. (1997). Assessment on a budget: using traditional methods imaginatively. In The assessment challenge in statistics education, Eds. I. Gal and J.B. Garfield, pp. 205-220. Amsterdam, The Netherlands: International Statistical Institute/IOS Press.
Wild, C.J. & Pfannkuch, M. (1999). Statistical thinking in empirical enquiry. International Statistical Review, 67(3), 223-256.
Dans les socittts qui voient circuler beaucoup &information, les citoyens doivent absolument savoir lire des donntes statistique. Cette compitence cli passe souvent pour un rtsultat attendu de I'enseignement scolaire et pour une dimension ntcessaire de la capaciti des adultes ?I savoir lire, h i r e et compter. Pourtant, on a accord6 peu &attention B la signification et B la construction de cette comNtence. Cet article propose une conceptualisation de l'aptitude B lire des donntes statistiques et dicrit ses aspects essentiels. Savoir lire des donntes statistique est prtsentt c o m e I'aptitude B interprtter, Cvaluer de f a ~ o n critique et communiquer sur I'information et les messages statistique. On soutient que cette aptitude se diduit de l'association simultante de cinq types de connaissances (alphaMtisation, statistique, mathtmatique, contexte et critique), ainsi que de dispositions persomelles et de convictions favorables. Les implications en termes d'tducation et de recherche sont discuties, et on brosse B grands traits les responsabilitks des tducateurs, des statisticiens et des autres personnes concerntes.
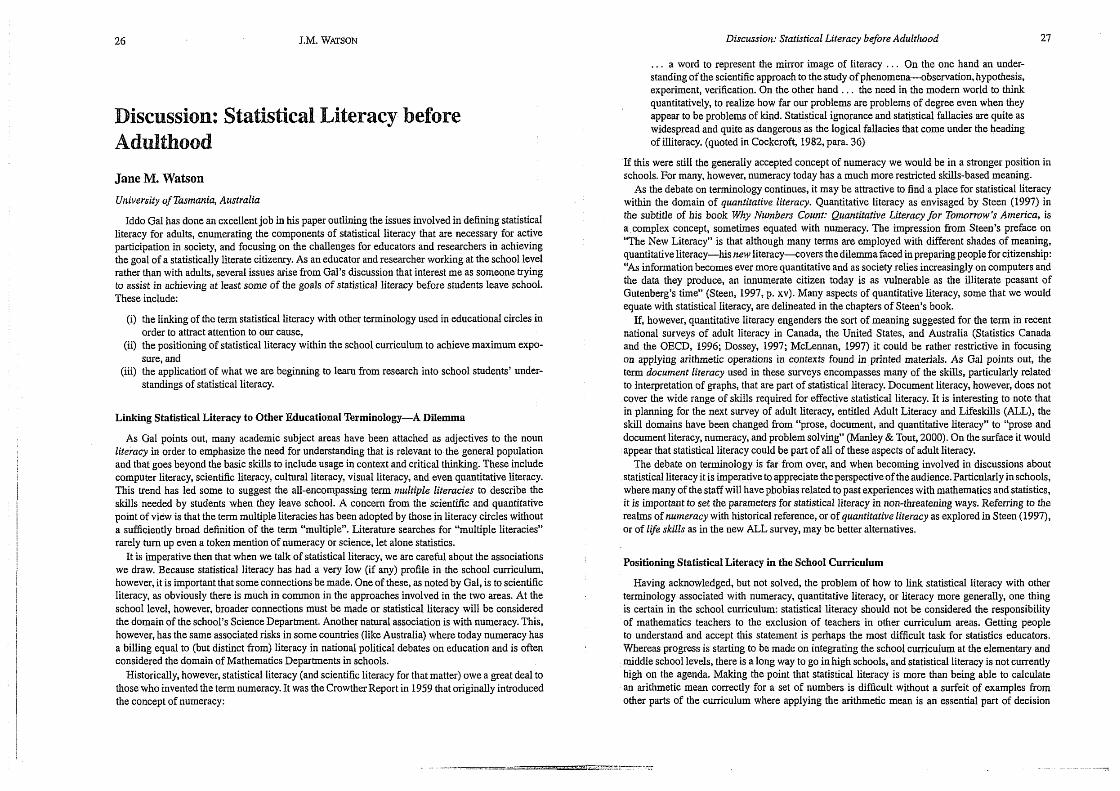
J.M. WATSON
Discussion: Statistical Literacy before Adulthood
Jane M. Watson
University of Tasmania, Australia
Iddo Gal has done an excellent job in his paper outlining the issues involved in defining statistical literacy for adults, enumerating the components of statistical literacy that are necessary for active participation in society, and focusing on the challenges for educators and researchers in achieving the goal of a statistically literate citizenry. As an educator and researcher working at the schooI level rather than with adults, several issues arise h-om Gal's discussion that interest me as someone trying to assist in achieving at least some of the goals of statistical literacy before students leave school. These include:
(i) the linking of the term statistical literacy with other terminology used in educational circles in order to attract attention to our cause,
(ii) the positioning of statistical Iiteracy within the school curriculum to achieve maximum expo- sure, and
(iii) the applicatiorr of what we are beginning to learn from research into school students' under- standings of statistical literacy.
LWmg Statistical Literacy to Other Educational Terminology-A Dilemma
As Gal points out, many academic subject areas have been attached as adjectives to the noun literacy in order to emphasize the need for understanding that is relevant to the general population and that goes beyond the basic skills to include usage in context and critical thinking. These include computer literacy, scientific literacy, cultural literacy, visual literacy, and even quantitative literacy. This trend has led some to suggest the all-encompassing term nlultiple literacies to describe the skills needed by students when they leave school. A concern from the scientific and quantitative point of view is that the term multiple literacies has been adopted by those in literacy circIes without a sufficiently broad definition of the term "multiple". Literature searches for "multiple literacies" rarely turn up even a token mention of numeracy or science, let alone statistics.
It is imperative then that when we talk of statistical Iiteracy, we are careful about the associations we draw. Because statistical literacy has had a very low (if any) profile in the school curriculum, however. it is imporiant that some connections bemade. One of these, as noted by Gal, is to scientific literacy, as obviously there is much in common in the approaches involved in the two areas. At the school level, however, broader connections must be made or statistical literacy wiIl be considered the domain of tho school's Science Department. Another natural association is with numeracy. This, however, has the same associated risks in some countries (like Australia) where today numeracy has a billing equal to (but distinct from) literacy in national political debates on education and is often considcred the domain of Mathematics Departments in schools.
Historically, however, statistical literacy (and scientific literacy for that matter) owe a great deal to those who inventedthe term numeracy. It was the Crowther Report in 1959 that originally introduced the concept of numeracy:
Discussion: Statistical Literacy before Adulthood 27
. . . it word to represent the mirror image of literacy . . . On the one hand an under- standing of the scientific approach to the study of phenomena-observation, hypothesis, experiment, verification. On the other hand . . . the need in the modem world to think quantitatively, to realize how far our problems are problems of degree even when they appear to be problems of kind. Statistical ignorance and statistical fallacies are quite as widespread and quite as dangerous as the logical fallacies that come under the heading of illiteracy. (quoted in Cockcroft, 1982, para. 36)
If this were still the generally accepted concept of numeracy we would be in a stronger position in schools. For many, however, numeracy ioday has a much more restricted skills-based meaning.
As the debate on terminology continues, it may be attractive to find a place for statisticaI literacy within the domain of quantitative literacy. Quantitative literacy as envisaged by Steen (1997) in the subtitle of his book Wky Numbers Count: Qrrantitative Literacyfor Tornorrow's America, is a complex concept, sometimes equated with numeracy. The impression from Steen's preface on 'The New Literacy" is that although many terms are employed with different shades of meaning, quantitative literacy--his ttew literacy--covers the dilemma faced in preparing people for citizenship: "As information becomes ever more quantitative and as sociew relies increasingly on computers and the data they produce, an innumerate citizen today is as vulnerable as the illiterate peasant of Gutenberg's time" (Steen, 1997, p. xv). Many aspects of quantitative Literacy, some that we would equate with statistical Iiteracy, are delineated in the chapters of Steen's book.
If, however, quantitative literacy engenders the sort of meaning suggested for the term in recent national surveys of adult Iiteracy in Canada, the United States, and Australia (Statistics Canada and the OECD, 1996; Dossey, 1997; McLennan, 1997) it could be rather restrictive in focusing on applying arithmetic operations in contexts found in printed materials. As Gal points out, the term document literacy used in these surveys encompasses many of the skills, particularly related to interpretation of graphs, that are part of statistical literacy. Document literacy, however, does not cover the wide range of skills required for effective statistical literacy. It is interesting to note that in planning for the next survey of adult literacy, entitled Adult Literacy and Lieskills (ALL), the ski11 domains have been changed from 'prose, document, and quantitative literacy" to "prose and document literacy, numeracy, and problem solving" wanley &Tout, 2000). On the surface it would appear that statistical literacy could be part of all of these aspects of adult literacy.
The debate on terminology is far from over, and when becoming involved in discussions about statistical literacy it is imperative to appreciate the perspective of the audience. Particularly in schools, where many of the staff will have phobias related to past experiences with mathematics and statistics, it is important to set the parameters for statistical literacy in non-threatening ways. Refemng to the realms of numeracy with historical reference, or of guatztitative literacy as explored in Steen (1997), or of life skills as in the new ALL survey, may be better alternatives.
Positioning Statistical Literacy in the School Curriculum
Having acknowledged, but not solved, the problem of how to link statistical literacy with other terminology associated with numeracy, quantitative literacy, or literacy more generally, one thing is certain in the school curriculum: statistical literacy should not be considered the responsibility of mathematics teachers to the exclusion of teachers in other curriculum areas. Getting people to understand and accept this statement is perhaps the most difficult task for statistics educators. Whereas progress is starting to be made on integrating the school curriculum at the elementary and midde school levels, there is a long way to go in high schools, and statistical literacy is not currently high on the agenda. Making the point that statistical literacy is more than being able to calculate an arithmetic mean correctly for a set of numbers is difficult without a surfeit of examples from other parts of the curriculum where applying the arithmetic mean is an essential part of decision
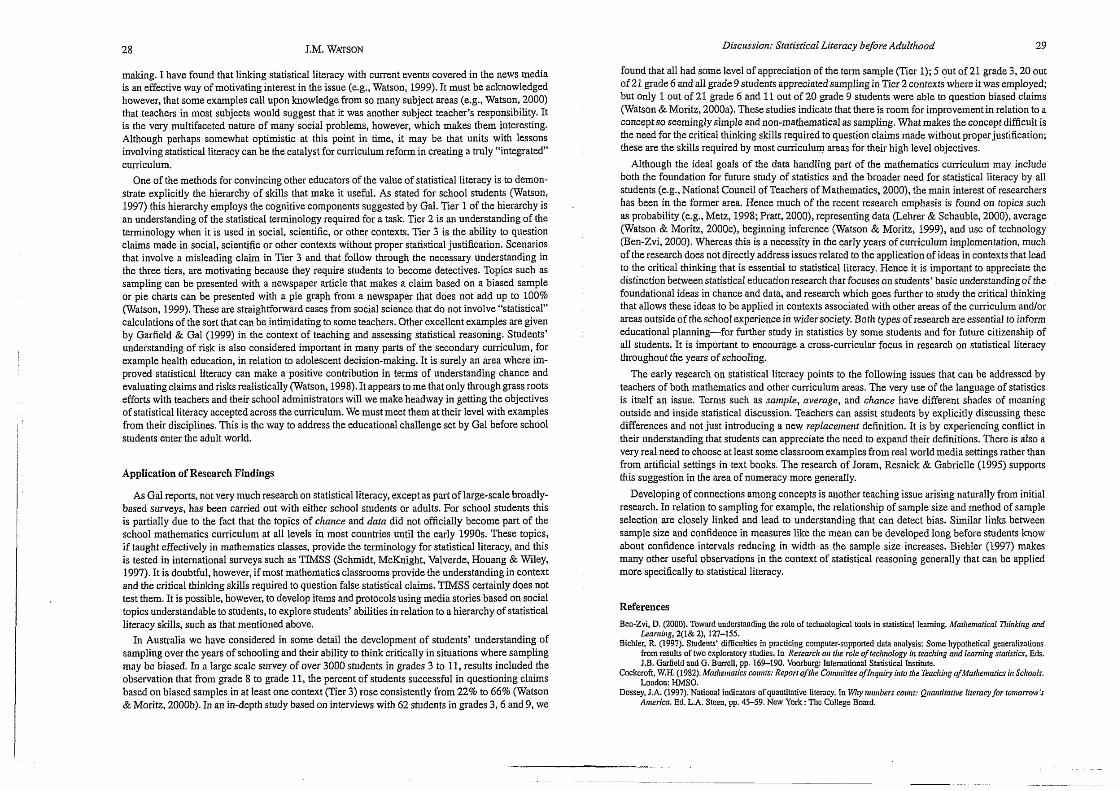
28 J.M. WATSON Disci~ssion: Statistical Literacy before Adt~lthood 29
making. I have found that linking statistical literacy with current events covered in the news media found that all had some level of appreciation of the term sample (Tier 1); 5 out of 21 grade 3,20 out
is an effective way of motivating interest in the issue (e.g., Watson, 1999). It must be achowtedged of 21 grade 6 and all grade 9 students appreciated sampling in Tier 2 contexts where it was employed;
however, that some examples call upon knowledge from so many subject areas (e.g., Watson, 2000) but only 1 out of 21 grade 6 and 11 out of 20 grade 9 students were able to question biased claims
that teachers in most subjects would suggest that it was another subject teacher's responsibility. It (Watson & Moritz, 2000a). These studies indicate that there is room for improvement in relation to a
is the very multifaceted nature of many social problems, however, which makes them interesting. concept so seemingly simple and non-mathematical as sampling. Pmat makes the concept difficult is
Although perhaps somewhat optimistic at this point in time, it may be that units with lessons the need for the critical thinking skills required to question claims made without proper justification;
involving statistical literacy can be the catalyst for curriculum reform in creating a truly "integrated" these are the skills required by most curricul- areas for their high level objectives.
curriculum. Although the ideat goals of the data handling part of the mathematics cuniculum may include
One of the methods for convincing other educators of the value of statistical literacy is to demon- both the foundation for future study of statistics and the broader need for statistical literacy by all
strate explicitly the hierarchy of skills that make it useful. As stated for school students (Watson, students fe.g., National Council of Teachers of Mathematics, 2000), the main interest of researchers
1997) this hierarchy employs the cognitive components suggested by Gal. Tier 1 of the hierarchy is . has been in the former area. Hence much of the recent research emphasis is found on topics such
an understanding of the statistical terminology required for a task. Tier 2 is an understanding of the as probability (e.g., Metz, 1998; Pratt, 2000). representing data (Lehrer & Schauble, 2000), average
terminology when it is used in social, scientific, or other contexts. Tier 3 is the ability to question (Watson & Moritz, 2000c), beginning inference (Watson & Mo&, 1999), and use of technology
claims made in social, scientific or other contexts without proper statistical justification. Scenarios (Ben-Zvi, 2000). Whereas this is a necessity in the early years of curricuiurn implementation, much
that involve a misleading claim in Tier 3 and that follow through the necessary understanding in of the research does not directly address issucs related to the application of ideas in contexts that lead
the three tiers, are motivating because they require students to become detectives. Topics such a to the critical thinking that is essential to statistical literacy, Hence it is important to appreciate the
sampling can be presented with a newspaper article that makes a claim based on a biased sample distinction between statistical education research that focuses on students' basic understanding of the
or pie charts can be presented with a pie graph from a newspaper that does not add up to 100% foundational ideas in chance and data, and research which goes further to study the critical thinking
(Watson, 1999). These are sfraightforward cases from social science that do not involve "statistical" that allows these ideas to be applied in contexts associated with other areas of the curriculum andlor
calculations of the sort that can be intimidating to some teachers. Other excellent examples are given areas outside of the school experience in wider society. Both types of research are essential to inform
by Garfield & Gal (1999) in the context of teaching and assessing statistical reasoning. Students' educational planning-for further study in statistics by some students and for future citizenship of
understanding of risk is also considered important in many parts of the secondary curriculnm, for all students. It is important to encourage a cross-curricular focus in research on statistical Iiteracy
example health education, in relation to adolescent decision-making. it is surely an arca where im- throughout the years of schooling.
proved statistical literacy can make a positive contribution in terms of understanding chance and The early research on statistical literacy points to the following issues that can be addressed by evaluating claims and risks realistically (Watson, 1998). It appears to me that only through grass roots teachers of both mathematics and other curriculum areas. The very use of the language of statistics efforts with teachers and their school administrators will we make headway in getting the objectives is itself an issue. Terms such as sample, average, and chance have di[ferent shades of meaning of statistical literacy accepted across the curriculum. We mustrneet them at their level with examples outside and inside statistical discussion. Teachers can assist students by explicitly discussing these from their disciplines, This is the way to address the educational challenge set by Gal before school differences and not just introducing a new replacenlent definition. It is by experiencing conflict in students enter the adult world. their understanding that students can appreciate the need to expand their definitions. There is also a
very real need to choose at least some classroom examples from real world media settings rather than from artificial settings in text books. The research of Joram, Resnick & Gabrielle (1995) supports
AppIication of Research Findings this suggestion in the area of numeracy more generally.
As Gal reports, not very much research on statistical literacy, except as part of large-scale broadly- Developing of connections among concepts is another teaching issue arising naturally from initial based surveys, has been carried out with either school studeats or adults. For school students this research. In relation to sampling for example, the relationship of sample size and method of sample is partially due to the fact that the topics of cha~lce and dara did not officially become part of the selection are closely linked and lead to understanding that can detect bias. Similar links between school mathematics c r ~ ~ c u ~ u m at all levels in most countries u11til the early 1990s. These topics, sample size and confidence in measures like the mean can be developed long before students know if taught effectively in mathematics classes, provide the terminology for statistical literacy, and this about confidence intervals reducing in width as the sample size increases. Biehler (1997) makes is tested in international surveys such as TIMSS (Schmidt, McKnight, VaIverde, Houang & Wiley. many other useful observations in the context of statistical reasoning generally that can be applied 1997). It is doubtful, however, if most mathematics classrooms provide the understanding in context more specifically to statistical literacy. and the critical thinking skills required to question false statistical claims. TIMSS certainly does not test them. It is possible, however, to develop items and protocols using media stories based on social topics understandable to students, to explore students' abilities in relation to a hierarchy of statistical References
literacy skills, such as that mentioned above. Ben-Zvi, D. (2000). Toward understanding the mle of technolagicnl tools in staiisiicai lcaming Maf/!emotical Tliinhing and Learning, 2(l& 2), 127-155.
In Australia we have considered in some detail the development of students' understanding of Biehler, R. (19m). Smdents' difficulties in practicing computer-supported dah analysis: Some hypothetical ge~enliwtions sampling over the years of schooling and their ability to think critically in situations where sampling fromresnlts of twa exploratory studies. In Researclz oft flte roie of teclmology A teaclting and learning staiisfics, Eds. may be biased. In a large scale survey of over 3000 students in grades 3 to 11, results included the J.B. Garfield sud G. Burrcll, pp. 169-190. Voorhurg: lntunational Sfatistical Institute.
Cockcroft, W.H. (1982). Matlter~mtics connfs: Report ofrlie Comnriffee oflnqitity into llre Teacl1hg ofMat11entatics in Scitools. observation that from grade 8 to grade 11, the percent of students successful in questioning claims Loudan: EIMSO. based on biased samples in at least one context (Tier 3) rose consistently from 22% to 66% (wagson Dossey. J.A. (1997). National indicators of quanlitative literacy. In may numbers corn~t: Q&rantitntiwe liieracylor tomorrow's & Moritz, 2000b). In an in-depth study based on interviews with 62 students in grades 3 ,6 and 9, we America. Ed. L.A. Stecn, pp. 4549. New York : T h e Couegc Board.
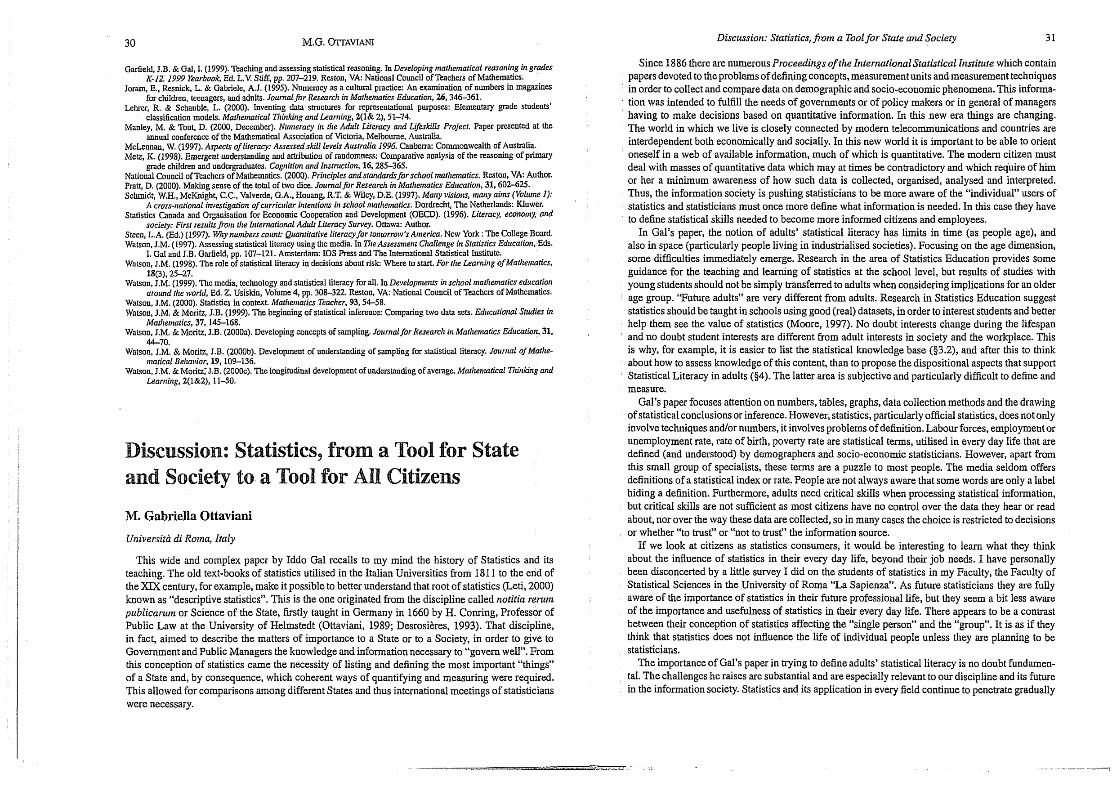
30 M.G. O r r A M Discussion: Statistics, fionz a Tool for State and Society 3 1
Garfield, J.B. &Gal. I. (1999). Teaching and assessing statistical reasoning. In Developing mathematical reasoning in grades K-12.1999~nrbuok, Ed. L.V. Stiff, pp. 207-219. Reston, VA: National Council dTeachers of Mathematics.
Joram, E.. Resnick, L. & Gabriele, A.J. f 1995). Numeracy as a cultural practice: An examination of numbers in magazines for children. teenagers, and adults. Jouml for Researclr in Mallremntics Education, 26,346-361.
Lehrer, R. & Schauble, L. (ZWO). Inveuiittg data stnrcturlls for repmeulational purposes: Elementary grade students' classification modeis. MoAernafical TItirrRing andlaarrring, 2(1& 2). 51-74.
Manley, M. & Tout, D. (2000, December). Nttnreracy in 11~e Adult Literacy mi ndLifsRi1Is Pro]ect. Paper prcsenred at the annual conference o f the Mathematical Association of Mcloria, Melbourne, Australia
McLennaa, W. (1997). Aspects of literncy: Assmsedskill levels Australia 1996. Canberra: Commonwealth of A u s M a . Metz, 1<. (1998). Emergent undersfanding and a m j b u t i ~ ofrandornncss: Cornpantbe analysis of the reasoning of primary
grade children and undergraduates. Cognition and Instmction, 16,285-365. National Council otTcachers af Mathematics. (2000). Principles ands~andardsforsdtool moi~zemotim. Reston, VA: Author. PraR D. (2000). Making sense of the toid of two dice. Journalfor Researeil in Mml~matics Mucotion, 31,602425. Schmidt, W.H., McKnight, C.C.. Valverde, G.A., Houang, R.T. & Wiey, D.E. (1997). Manyvisions, mmty oimr (Volunte I):
A cross-nationnl imesligoh'on of crrrricular hterrtio~ls in scltool nr~1ten1ah'c.r. Dordrechc The Netherlands: Kluwcr. Statistics Canada and Organisatinn for Economic Cooperation and Development (OECD). (f996). Literncy, economy, and
society: Firs1 results~orn llre b t I ~ ~ t i 0 M l Adult Literacy Survey. Ottawa: Author. Stcen, L.A. (Ed.) (1997). W I ~ numbers cow: Qmfitalive literacy for tortromiv's Atrrerica. New York : The College Board. Watson. JM. (1997). Assessing statistical literacy using the media. In The Assessment Clullenge in Staislics Education, Eds.
I. Gal and J.B. Gar6eld, pp. 107-121. Amslerdarn: 10.7 Press and The International Statistical Institute. Watson, J.M. (1998). The mle of statistical literacy in decisions about risk: Where to start. For rlre Learning of Mnliler~lics.
18(3). 25-27: Watson, J.M. (1999). The media, tecllnology and statistical literricy for all. In Developlnents in sclrool mofltematics educorion
around tlte ivorld, Ed. 2. Usiskin, Volume4, pp. 308-322. Reston, VA: National Council of Teachers of Mathematics. Warson, J.M. (2000). St;rtistics io context. Mat/ter~tafics Teoclzer, 93.54-58. Watson, J.M. & Moritz, J.B. (1999). The beginning of statistical inference: Comparing Wo data sets. Educdiorml Studies in
Madrernatics, 37, 145-168. Watson, J.M. & Moritz, J.B. (20003). Dcvcloping conccpb af sampling. Journal for Reseurch in Mati~antatics Edumion. 31.
44-70. Watson. J.M. & Moritz, J.B. (2000b). Development of understanding of sampling for shtisticd litemcy. Journal ofMatfze-
rrratical Belmvior, 19, 109-136. Warson, J.M. & Morilz; J.B. (200k). The longitudinal development of understanding of avera~e. Mai~mnticol Tlrirtking and
Learning, 2(1&2), 11-50.
Discussion: Statistics, from a Tool for State and Society to a Tool for All Citizens
M. Gabriella Ottaviani
Universiti di Rorna, Italy
This wide and complex paper by Iddo Gal recalls to my mind the history of Statistics and its teaching. The old text-books of statistics utilised in the Italian Universities from 181 1 to the end of the XM century, for example, make it possible to better understand that root of statistics (Leti, 2000) known as "descriptive statistics". This is the one originated from the discipline called notitia rerunr publicarurtz or Science of the State, firstly taught in Germany in 1660 by H. Conring, Professor of Public Law at the University of Helmstedt (Ottaviani, 1989; Desrosibres, 1993). That discipline, in fact, aimed to describe the matters of importance to a State or to a Society, in order to give to Government and Public Managers the knowledge and information necessary to "govern well". From this conception of statistics came the necessity of listing and defining the most important "things" of a State and, by consequence, which coherent ways of quantifying and measuring were required. This allowed for comparisons among different States and thus international meetings of statisticians were necessary.
Since 1886 there are numerous Pmceedings o f the blternational Statistical b~stitute which contain - - papers devoted to the problems of defining concepts, measurement units and measurement techniques in order to collect and compare data on demomaphic and socio-economic phenomena. This informa- - *
tion was intended to fuEll the needs of governments or of policy makt3fS or in general of managers having to make decisions based on quantitative information. In this new era things are changing. The world in which we live is closely connccted by modern telecommunications and countries are interdependent both economically and socially. In this new world it is important to be able to orient oneself in a web of available information, much of which is quantitative. The modern citizen must deal with masses of quantitative data which may at times be contradictory and which require of him or her a minimum awareness of how such data is collected, organised, analysed and interpreted. Thus, the information society is pushing statisticians to be more aware of the "individual" users of statistics and statisticians must once more define what information is needed. In this case they have to define statistical skills needed to become more informed citizens and employees.
In Gal's paper, the notion of adults' statistical literacy has limits in time (as people age), and also in space (particularly people living in industrialised societies). Focusing on the age dimension, same difficulties immedrately emerge. Research in the area of Statistics Education prov~des some guidance for the teaching and learning of statistics at the school level, but results of studies with young students should not be simply transferred to adults when considering imphcations for an older age group. 'Future adults" are very different from adults. Research in Statistics Education suggest statistics should be taught in schools using good(rea1) datasets, in order to interest students and better help them see the value of statistics (Moore, 1997). No doubt interests change during the lifespan and no doubt student interests are different from adult interests in society and the workplace. This is why, for example, it is easier to list the statistical knowledge base (§3.2), and after this to think about how to assess knowledgeof this content, than to propose the dispositional aspects that support Statistical Literacy in adults ($4). The latter area is subjective and particularly difficult to define and measure.
Gal's paper focuses attention on numbers, tables, graphs, data collection methods and the drawing of statisticalconcluslons or inference. However, statistics, particularly official statistics, does notoniy involve techniques andlor numbers, it involves problems of definition. Labour forces, employment or unemployment rate, rate of birth, poverty rate are statistical terms, utilised in every day life that are defined (and understood) by demographers and socio-economic statisticians. However, apart from this small group of specialists, these terms are a puzzle to most people. The media seldom offers definitions of a statistical index or rate. People are not always aware that some words are only a label biding a definition. Furtfiermore, adults need critical skills when processing statistical information, but critical skills are not sufficient as most citizens have no control over the data they hear or read about, nor over the way these data are collected, so in many cases the choice is restricted to decisions or whether "to trust" or 'hot to trust" the information source.
If we look at citizens as statistics consumers, it would be interesting to learn what they think about the influence of statistics in their evcry day life, beyond their job needs. I have personally been disconcerted by a tittle survey I did on the students of statistics in my Faculty, the Faculty of Statistical Sciences in the University of Roma "La Sapienza". As future statisticians they are fuUy aware of the importance of statistics in their future professional life, but they seem a bit less aware of the importance and usefu'uincss of statistics in their every day life. There appears to be a contrast between their conception of statistics affecting the "single person" and the "group". It is as if they think that statistics does not influence the life of individual people unless they are planning to be statisticians.
The importance of Gal's paper in trying to define adults' statistical literacy is no doubt fundamen- tal. The challenges he raises & substantial and are especially relevant to o& discipline and its future in the information society. Statistics and its application in every fieId continue to penetrate gradually
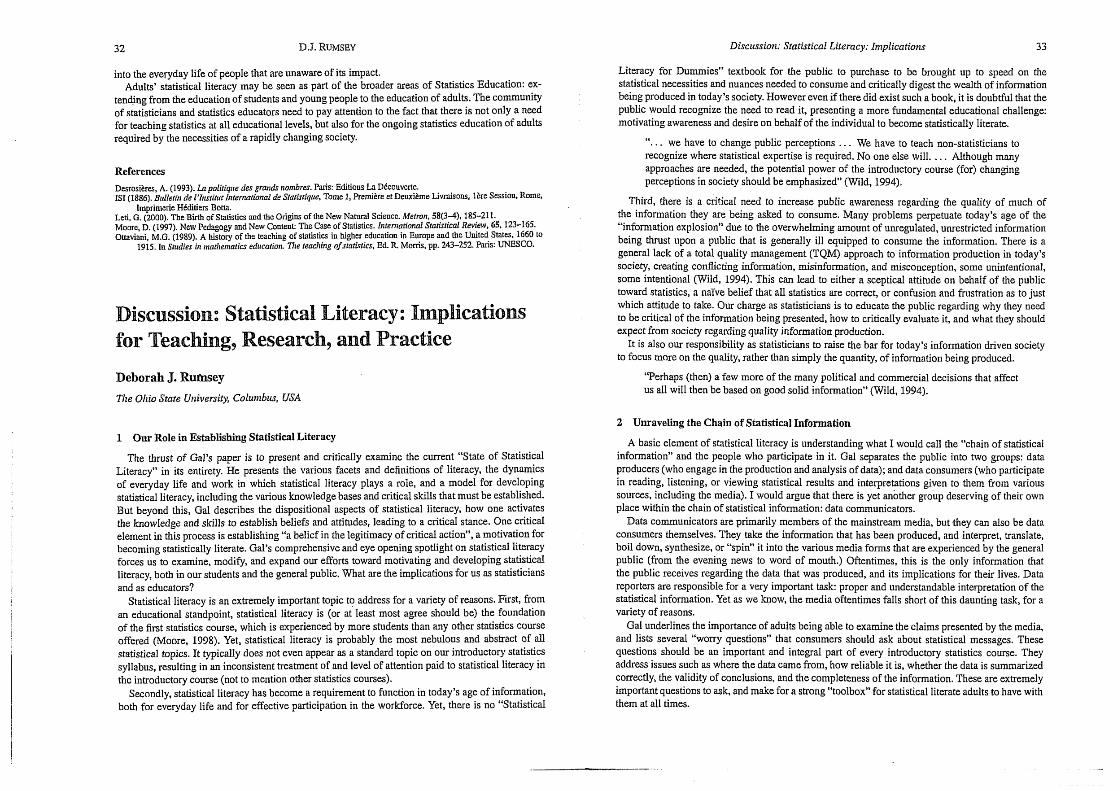
32 D.J. RUMSEY Discussion: Statistical Literacy: Implicatiorzs 33
into the everyday life of people that are unaware of its impact. Adults' statistical literacy may be seen as part of the broader areas of Statistics Education: ex-
tending from the educationif students and young people to the education of adults. The community of statisticians and statistics educators need to pay attention to the fact that there is not only a need for teaching statistics at all educational levels, but also for the ongoing statistics education of adults required by the necessities of a rapidly changing society.
References
Desrosi&re.. A. (1993). Lnpolifiy~re des grfltldr nombres. Pais. Editions LI DEcouvcnc. IS1 118861. Baltrtitt de l'histitlrr Inrernarionol de Srflrisf/q~rc, Tome 1 , Premiere rr Dcuxibmnz Livnjsons, l i r e Scssioo, Komr, . - ,
Imprimese Htditiers Botta. I.eti, G. (2000). The Birth o f Statistics anll the Origins of the New Natwal Science. Metron, 58(34), 185-21 1. Moore, D. (1997). New Pedagogy and New Conrenk The Case of Shtistics. Inten~'om1 Sffltislicol Review, 65.123-165. Ottaviani, M.G. (1989). A history of Ule leaching of slatistics in higher education in Europe and the United States, 1660 10
1915. In Studies in mall~ernafics edrrcarion. The reaclming of statistics, Ed. R Moms, pp. 243-252. Paris: UNESCO.
Discussion: Statistical Literacy: Implications for Teaching, Research, and Practice
Deborah J. Rurnsey
Tlze Olzio State U~liversity, Columbns, USA
1 Our Role in Establishing Statistical Literacy
The thrust of Gal's paper is to present and critically examine the current "State of Statistical Literacy" in its entirety. He presents the various facets and definitions of literacy, the dynamics of everyday life and work in which statistical literacy plays a role, and a model for developing statistical Literacy, including the various knowledge bases and critical skills that must be established. But beyond this, Gal describes the dispositional aspects of statistical literacy, how one activates the knowledge and skills to establish beliefs and attitudes, leading to a critical stance. One critical element in this process is establishing "a belief in the legitimacy of critical action", a motivation for becoming statistically literate. Gal's comprehensive and eye opening spotlight on statistical literacy forces us to examine, modify, and expand our efforts toward morivating and developing statistical literacy, both in our students and the general public. What are the implications for us as statisticians and as educators?
Statistical literacy is an extremely important topic to address for a variety of masons. First, from an educational standpoint, statistical literacy is (or at least most agree should be) the foundation of the first statistics course, which is experienced by more students than any other statistics course offered (Moore, 1998). Yet, statistical literacy is probably the most nebulous and abstract of al l statistical topics. It typically does not even appear as a standard topic on our introductory statistics syllabus, resulting in an inconsistent treatment of md level of attention paid to statistical literacy in the introductory course (not to mention other statistics courses).
Secondly, statistical literacy has become a requirement to function in today's age of information, both for everyday life and for effective participation in the workforce. Yet, there is no "Statistical
Literacy for Dummies" textbook for the public to purchase to be brought up to speed on the statistical necessities and nuances needed to consume and critically digest the wealth of information being produced in today's society. However even if there did exist such a book, it is doubtful that the public wodd recognize the need to read it, presenting a more fundamental educational challenge: motivating awareness and desire on behalf of the individual to become statistically literate.
". . . we have to change public perceptions . . . Wc have to teach non-statisticians to recognize where statistical expertise is required. No one else will. . . . Although many approaches are needed, the potential power of the introductory course (for) changing perceptions in society should be emphasized" W i d , 1994).
Third, there is a criticaI need to increase pubfic awareness regarding the quality of much of the information they are being asked to consume. Many problems perpetuate today's age of the "information expbsion" due to the overwhelming amount of unregulated, unrestricted information being thrust upon a public that is generally ill quipped to consume the information. There is a general lack of a total quality management (TQM) approach to information production in today's society, creating coficting information, misinformation, and misconception, some unintentional, some intentional (Wild, 1994). This can lead to either a sceptical attitude on behalf of the public toward statistics, a nGve belief that aU statistics are correct, or confusion and frustration as to just which attitude to take. Our charge as statisticians is to educate the public regarding why they need to be critical of the information being presented, how to critically evaluate it, and what they should expect from society regarding quality information production,
It is also our responsibility as statisticians to raise the bar for today's information driven society to focus more on the quality, rather than simply the quantity, of information being produced.
'T'erhaps (then) a few more of the many political and commercial decisions that affect us a11 will then be based on good solid information" (Wild, 1994).
2 Unraveling the Chain o f Statistical Information
A basic element of statistical liceracy is understanding what I would call the "chain of statistical information" and the people who participate in it. Gal separates the public into two groups: daia producers (who engage in the production and analysis of data); and data consumers (who participate in reading, listening, or viewing statistical results and interpretations given to them from various sources, including the media). I would argue that there is yet another group deserving of their own place within the chain of statistical information: data communicators.
Data communicators are primarily members of the mainstream media, but they can also be data consumers themselves. They take the information that has been produced, and interpret. translate, boil down, synthesize, or "spin" it into the various media forms that are experienced by the general public (from the evening news to word of mouth.) Oftentimes, this is the only information that the public receives regarding the data that was produced, and its implications for their lives. Data reporters are responsible for a very important task: proper and understandable interpretation of the statistical information. Yet as we how, the media oftentimes falls short of this daunting task, for a variety of reasons.
Gal underlines the importance of adults being able to examine the claims presented by the media, and lists several "worry questions" that consumers should ask about statistical messages. These questions should be an important and integral part of every introductory statistics course. They address issues such as where the data came from, how reliable it is, whether the data is summarized correctly, the validity of conclusions, and the completeness of the information. These are extremely important questions to ask, and make for a strong "toolbox" for statistical liierate adults to have with them at all times.
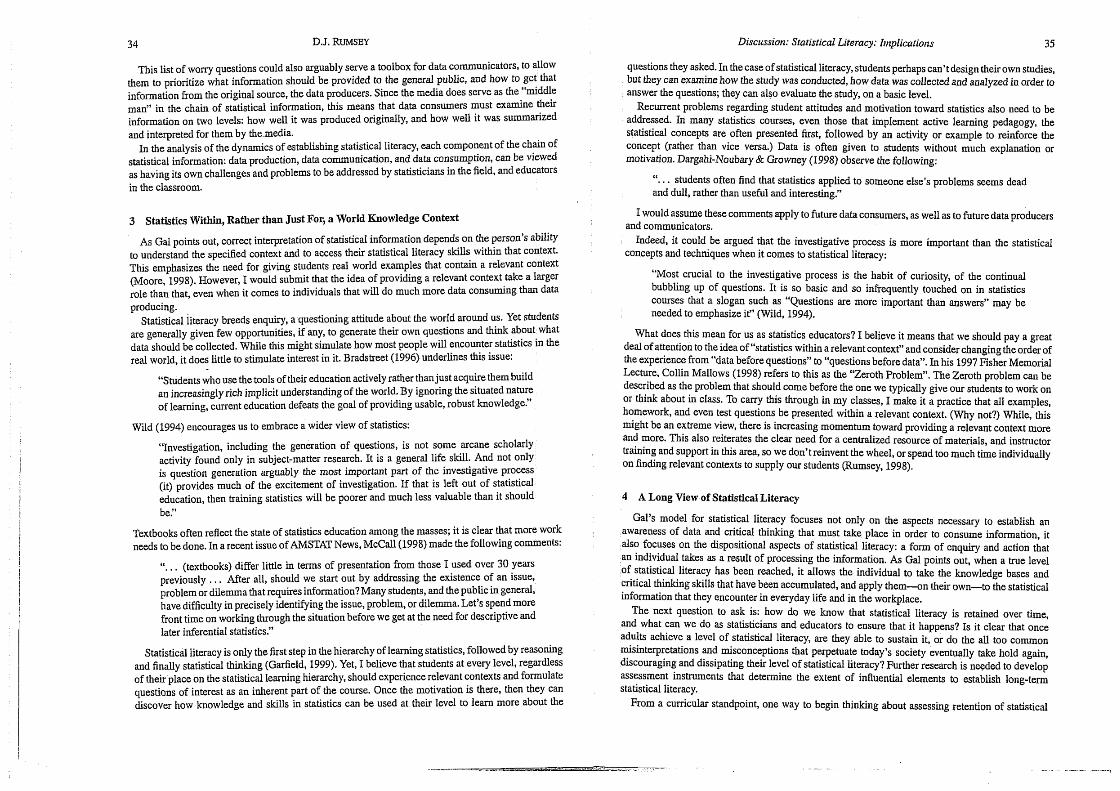
34 D.J. RUMSBY
This list of worry questions could also arguably serve a toolbox for data communicators, to allow them to prioritize what information should be provided to the general public, and how to get that information from the original source, the data producers. Since the media does serve as the "middle man" in the chain of statistical information, this means that data consumers must examine their information on two levels: how well it was produced originally, and how well it was summarized and interpreted for them by the media.
In the analysis of the dynamics of establishing statistical literacy, each component of the chain of statistical information: data production, data communication, and data consumption, can be viewed as having its own challenges and problems to be addressed by statisticians in the field, and educators in the classroom.
3 Statisfics Within, Rather than Just For, a World Knowledge Context
As Gal points out, correct interpretation of statisticaI infomatlon depends on the person's ability to understand the speafied context and to access their statistical literacy skiEs within that context. This emphasizes the need for givmg students real world examples that contain a relcvant context (Moore, 1998). However, I would submit that the idea of providing a relevant context take a larger role than that, even when it comes to individuals that will do much more data consuming than data producing.
Statistical literacy breeds enquiry, a questioning attitude about the world around us. Yet students are generally given few opportunities, if any, to generate their own questions and think about what data should be collected. While this might simulate how most people will encounter statistics in the real world, it does little to stimulate interest in it. Bradstreet (1996) underlines this issue:
"Students who use the tools of their education actively rather than just acquire them build an increasingly dch implicit understanding of the world. By ignoring the situated nature of learning, current education defeats the goal of providing usable, robust knowledge."
Wild (1994) encourages us to embrace a wider view of statistics:
"Investigation, including the generation of questions, is not some arcane scholarly activity found only in subject-matter research. It is a general life skill, And not only i s question generation arguably the most important part of the investigative process (it) provides much of the excitement of investigation. If that is left out of statistical education, then training statistics will be poorer and much less valuable than it should be."
Textbooks often reflect the state of statistics education among the masses; it 1s clear that more work needs to be done. In a recent issue of hMSTAT News, McCall(1998) made the following comments:
". . . (textbooks) differ little in terms of presentation from those I used over 30 years previously . . . After all, should we start out by addressing the existence of an issue, problem or dilemma that requires information? Many students, and the public in general, have difficulty in precisely identifying the issue, problem, or dilemma. Let's spend more front time on working through the situation before we get at the need for descriptive and later inferential statistics."
Statistical literacy is only the first step in the hierarchy of learning statistics, followed by reasoning and finally statistical thinking (Garfield, 1999). Yet, I believe that students at every level, regardless of their place on the statistical leaming hierarchy, should experience relevant contexts and formulate questions of interest as an inherent part of the course. Once the motmition IS there, then they can discover how knowledge and skills in statistics can be used at their level to learn more about the
Discllssion: Statistical Literacy: Implications 35
questions they asked. In the case of statisticalliteracy, students perhaps can't design their own studies, but they can examine how the study was conducted, how data was collected and analyzed in order to answer the questions; they can also evaluate the study, on a basic level.
Recurrent problems regarding student attitudes and motivation toward statistics also need to be addressed. In many statistics courses, even those that implement active learning pedagogy, the statistical concepts are often presented lint, followed by an activity or example to reinforce the concept (rather than vice versa) Data is often given to students without much explanation or motivation. Dargahi-Noubary & Gromey (1998) observe the following:
". . . students often find that statistics applied to someone else's probIems seems dead and dull, rather than useful and interesting."
I would assume thesecomments apply to future data consumers, as well as to future data producers and communicators.
Indeed, it could be argued that the investigative process is more important than the statistical concepts and techniques when it comes to statistical literacy:
'Most crucial to the investigative process is the habit of curiosity, of the continual bubbling up of questions. It is so basic and so infrequently touched on in statistics courses that a slogan such as "Questions are more important than answers" may be needed to emphasize if' (Wild, 1994).
What does this mean for us as statistics educators? I believe it means that we should pay a great deal of attention to the idea of "statistics within a relevant context" and consider changingtheorder of the experience from "data before questions" to "questions before data". In his 1997 Fisher Memorial Lecture, Collin Mallows (1998) refers to this as the 'Zeroth Problem". The Zeroth problem can be described as the problem that should come before the one we typically give our students to work on or think about in class. To carry this through in my classes, I make it a practice that all examples, homework, and even test questions be presented within a relevant context. (Why not?) While, this might be an extreme view, there is increasing momentum toward providing a relevant context more and more. This also reiterates the clear need for a centralized resource of materiaIs, and instructor training and support in this area, so we don't reinvent the wheel, or spend too much time individually on finding relevant contexts to supply our students (Rumsey, 1998).
4 A Long View of Statistical Literacy
Gal's model for statistical literacy focuses not only on the aspects necessary to establish an awareness of data and critical thinking that must take place in order to consume information, it also focuses on the dispositional aspects of statistical literacy: a form of enquiry and action that an individual takes as a result of processing the information. As Gal points out, when a true level of statistical literacy has been reached, it allows the individual to take the knowledge bases and critical thinking slulls that have been accumulated, and apply them--on their own-to the statistical information that they encounter in everyday life and in the workplace.
The next question to ask is: how do we know that statistical literacy is retained over time, and what can we do as statisticians and educators to ensure that it happens? Is it clear that once adults achieve a level of statistical literacy, are they able to sustain it, or do the all too common misinterpretations and misconceptions that perpetuate today's society eventually take hold again, discouraging and dissipating their level of statistical literacy? Further research is needed to develop assessment instruments that determine the extent of influential elements to establish long-term statistical literacy.
From a curricular standpoint, one way to begin thinking about assessing retention of statistical
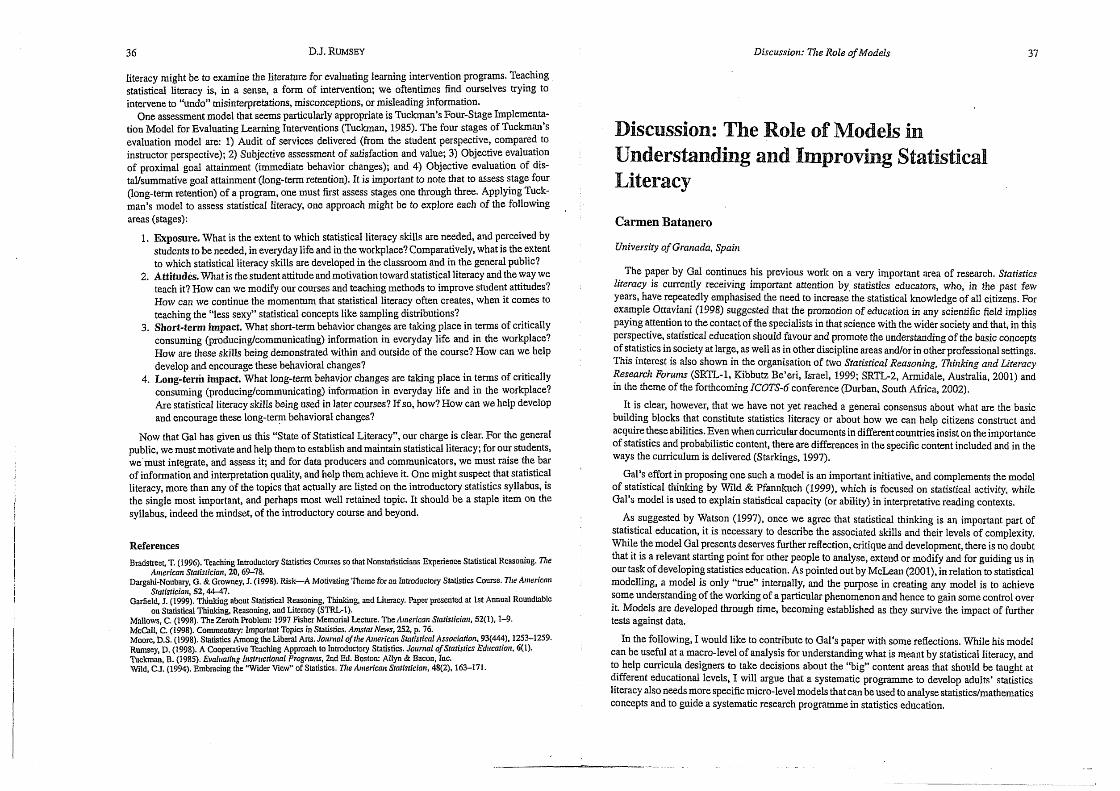
Discussion: Tlze Role ofModels
literacy might be to examine the Literature for evaluating learning intervention programs. Teaching statistical literacy is, in a sense, a form of intervention; we oftentimes find ourselves trying to intervene to "undo" misinterpretations, misconceptions, or misleading information.
One assessment model that seems particularly appropriate is Tuckman's Four-Stage Implementa- tion Model for Evaluating Learning Interventions (Tuckman, 1985). The four stages of Tuckman's evaluation model are: I) Audit of services delivered (from the student perspective, compared to instructor perspective); 2) Subjective assessment of satisfaction and value; 3) Objective evaluation of proximal god attainment (immediate behavior changes); and 4) Objective evaluation of dis- tallsummative god attainment (long-term retention). It is important to note that to assess stage four (long-term retention) of a program, one must first assess stages one through three. Applying Tuck- man's mode1 to assess statistical literacy, one approach might be to explore each of the following areas (stages):
1. Exposure. What is the extent to which statistical literacy skills are needed, and perceived by students to be needed, in everyday life and in the workplace? Comparatively, what is the extent to which statistical literacy skills are developed in the classroom and in the general public?
2. Attitudes. What is the student attitude and motivation toward statisticalliteracy and the way we teach it? How can we modify our courses and teaching methods to improve student attitudes? Wow can we continue the momentum that statistical literacy often creates, when it comes to teaching the "less sexy" statistical concepts like sampling distributions?
3. Short-term impact. What short-term behavior changes are taking place in terms of critically consuming (producing/comm~nicating) informatioiin everyday life and in the workplace? How are these skills being demonstrated within and outside of the course? How can we help - develop and encourage these behavioral changes?
4. Long-term impact. What long-term behavior changes are taking place in terms of critically consuming (producing/communicating) information in everyday life and in the workplace? Are statistical literacy skills being used in later courses? If so, how? How can we help develop and encourage these long-term behavioral changes?
Now that Gal has given us this "State of Statistical Literacy", our charge is clear. For the general public, we must motivate and help them to estabIish andmaintain statistical literacy; for our students, we-must integrate, and assess it; and for data producers and communicators, we must raise the bar of information and interpretation quality, and help them achieve it. One might suspect that statistical literacy, more than any of the topics that actually are listed on the introductory statistics syllabus, is the single most important, and perhaps most well retained topic. It should be a staple item on the syllabus, indeed the mindset, of the introductory course and beyond.
References Bradstreet T. (1996). Teaching Introductory Statistics Courses so tbat Nonstatisticims Experience Statistid Reasoning. 271e
Anrerican Statistician, 20,69-78. Dargahi-Noubary, E. & Erowney, 1. (1998). Risk-h Motivating Theme for an Introductory Slalisbip Course. 771e American
Stalisticia~~. 5 2 , 4 4 7 . Gargeld, J. (1999). Thi&ng about Statistical Reasoning. Thinldng, and Literacy. Paper presented at 1st Annual Roundtable
on Sratistical Thinking, Rwoning, and Literacy (STRL-1). Mallows, C. (1998). The ZerothProblem: 1997 Fisher Memorial Lecture. The American Slatisficirnr, 52(1), 1-9. McCaU, C. (1998). Commentary: Importaut Topics in Slatistim. An1s:ut News, 252. p. 76. Moore. D.S. (1998). Statistics Among the Liberal Arts. Jonmal ofthe American Statistien1 Associarion, 93(444), 133-1259. Rumscy, D. (1998). A Cooperative Teaching Approach to Introductory Statistics. Journal ofStatistics Zdr~corion, 6(1). lbckman, B. (1985). Evnhrnli~ig I~tf~rctiorud P m g m ~ ~ . 2nd Ed. Boston: Allyn 6t Bacon, Inc. Wild. C.J. (1994). Embracing the "Wider View" of Statistics. The Aniericmi StaBtician, 48(2), 163-171.
Discussion: The Role of Modelis in Understanding and Impro Literacy
Carmen Batanero
University of Granada, Spain
The paper by Gal continues his previous work on a very important area of research. Statistics iiteracy is currently receiving important attention by statistics educators, who, in the past few years, have repeatedly emphasised the need to increase the statistical knowledge of all citizens. For example Ottavfani (1998) suggested that the promotion of education in any scientific field implies paying attention to the contact of the specialists in that science with the wider society and that, in this perspective, statistical education should favour and promote the understanding of the basic concepts of statistics in society at large, as well as in other discipline areas andlor in other professional settings. This interest is also shown in the organisation of two Statistical Reasoning, Thinking and Literacy Researclt Foru~ns (SRTL-1, ICibbutz Be'eri, Israel, 1999; SRTL-2, Annidale, Australia, 2001) and in the theme of the forthcoming ICOTS-6conference (Durban, South Africa, 2002).
It is clear, however, that we have not yet reached a general consensus about what are the basic building blocks that constitute statistics literacy or about how we can help citizens construct and acquire these abilities. Even when curricular documents in different countries insist on the importance of statistics and probabilistic content, there are differences in the specific content included and in the ways the curriculum is delivered (Starkings, 1997).
Gal's effort in proposing one such a model is an important initiative, and complements the model of statistical thinking by Wild & Pfannkuch (1999). which is focused on statistical activity, while Gat's model is used to explain statistical capacity (or ability) in interpretative reading contexts.
As suggested by Watson (1997). once we agree that statistical thinking is an important part of statistical education, it is necessary to describe the associated skills and their levels of complexity. While the model Gal presents deserves further reflection, critique and development, there is no doubt that It is a relevant starting point for other people to analyse, extend or modify and far guiding us in our task of developing statistics education. As pointed out by McLean (2001). in relation to statistical modelling, a model is only "true" internally, and the purpose in creating any model is to achieve some understanding of the working of a particular phenomenon and hence to gain some control over it. Models are developed through time, becoming established as they survive the impact of further tests against data.
In the following. I would Iike to contribute to Gars paper with some regections. While his model can be useful at a macro-level of analysis for understanding what is meant by statistical literacy, and to help curricula designers to take decisions about the '%big'' content areas that should be taught at different educational levels, I will argue that a systematic programme to develop adults' statistics literacy dso needs more specificmicro-levelmodels that can be used to analyse statistics/mathematics concepts and to guide a systematic research programmein statistics education.
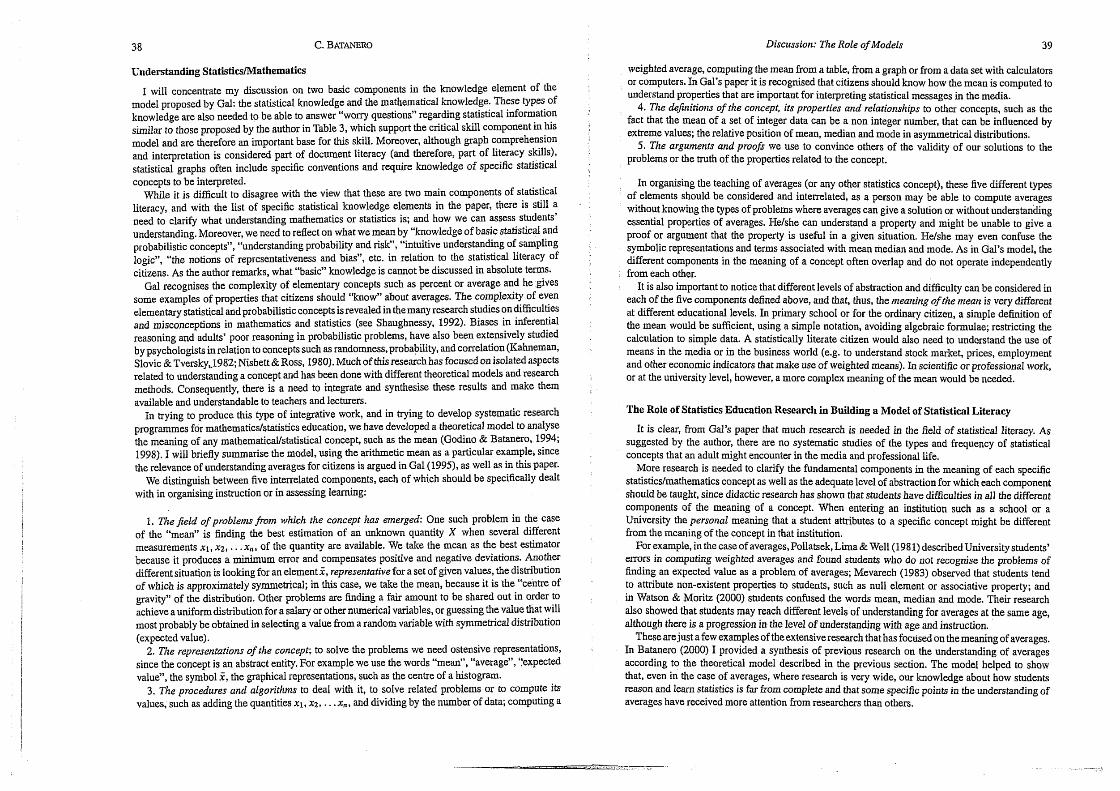
Understanding StatisKcs/Mathematics
I will concentrate my discussion on two basic components in the knowledge element of the model proposed by Gal: the statistical knowledge and the mathematical knowIedge. These types of knowledge are also needed to be able to answer "worry questions" regarding statistical information smilar to those proposed by the author in Table 3, which support the critical skill. component in his model and are therefore an important base for this skill. Moreover, although graph comprehension and interpretation is considered part of document literacy (and therefore, part of literacy sms) , statistical graphs often include specific conventions and require knowledge of specific statistical concepts to be interpreted.
While it is difficult t~ disagree with the view that these are two main components of statistical literacy, and with the list of specific statistical knowledge elements in the paper, there is still a need to clarify what understanding mathematics or statistics is; and how we can assess students' understanding. Moreover, we need to reflect on what we mean by "knowledge of basic statistical and probabilistic concepts", "understanding probability and risk", "intuitive understanding of sampling logic", "the notions of representativeness and bias", etc. in relation to the statistical literacy of citizens. As the author remarks, what "basic" knowledge is cannot be discussed in absolute terms.
Gal recognises the complexity of elementary concepts such as percent or average and he gives some examples of properties that citizens should "know" about averages. The complexity of even elementary statistical and probabilistic conceptsisrevealedin themany research studies ondifficulties and misconceptions in mathematics and statistics (see Shaughnessy, 1992). Biases in inferential reasoning and adults' poor reasoning in probabilistic problems, have also been extensively studied by psychologists in relation to concepts such as randomness,probability, and correlation (Kahneman, Slovic & Tvenky,.l9&2; Nisbett &Ross, 1980). Much of this research has focused on isolated aspects related to understanding a concept and has been done with dserent theoretical models and research methods. Consequently, there is a need to integrate and synthesise thesc results and make them available and understandable to teachers and lecturers.
In trying to produce this type of integrative work, and in wing to develop systematic research programmes for mathematics/statistics education, we have developed a theoretical model to analyse the meaning of any mathematicaYstatishcal concept, such as the mean (Godino & Batanero, 1994; 1998). I will briefly summaise the model, using the arithmetic mean as a particular example, since the relevance of understanding averages for citizens is argued in Gal (1995), as well as in this paper.
We distinguish between five interrelated components, each of which should be specificaliy dealt with in organising instruction or in assessing teaming:
1 . The field of problenzs from which the concept has emerged: One such problem in the case of the "mean" is h d i i g the best estimation of an unknown quantity X when several different measurements X I , 12, . . . xn, of the quantity are available. We take the mean as the best estimator because it produces a minimum enor and compensates positive and negative deviations. Another different situation is looking for an element 2, representative for a set of given values, the distribution of which is approximately symmetrical; in this case, we take the mean, because it is the "centre of gravity" of the distribution. Other problems are finding a fair amount to be shared out in order to achieve a uniformdistribution for a salary or other numerical variables, or guessing the value that will most probably be obtained in selecting a value from a random variable with symmetrical distribution (expected value).
2. The representations ofthe concept; to solve the problems we need ostensive representations, since the concept is an abstract entity. For example we use the words "mean", "average", "expected value", the symbol 2, the graphical representations, such as the centre of a histogram.
3. The procedures and algorithms to deal with it, to solve related problems or to compute its values, such as adding the quantities X I , x z , . . .x,, and dividing by the number of data; computing a
Discussio~z: The Role of Models 39
weighted average, computing the mean from a table, from a graph or from a data set with calculators or computers. In Gal's paper it is recognised that citizens should know how the mean is computed to understand properties that are important for interpreting statistical messages in the media.
4. The definitions of the concept, its properties and relationships to other concepts, such as thc fact that the mean of a set of integer data can be a non integer number, that can be influenced by extreme values; the relative position of mean, median and mode in asymmetrical diitnbutions.
5. The arguments and proofs we use to convince others of the validity of out solutions to the problems or the truth of the properties related to the concept.
In organising the teaching of averages (or any other statistics concept), these five different types of elements should be considered and interrelated, as a person may be able to compute averages without knowing the types of problems where averages can give a solution or without understanding essential properties of averages. Helshe can understand a property and might be unable to give a proof or argument that the property is useful in a given situation. Helshe may even confuse the symbolic representations and terms associated with mean median and mode. As in Gal's model, the different components in the meaning of a concept often overlap and do not operate independently from each other.
It is also important to notice that different levels of abstraction and difficulty can be considered in each of the five components defined above, and that, thus, the meaning of fhe mean is very different at different educational levels. In primary school or for the ordinary citizen, a simple definition of the mean would be sufficient, using a simple notation, avoiding algebraic formulae; restricting the calculation to simple data. A statistically literate citizen would also need to understand the use of means in the media or in the business world (e.g. to understand stock market, prices, employment and other economic indicators that make use of weighted means). In scientific or pmfessionaI work, or at the university level, however, a more complex meaning of the mean would be needed.
The Role of Statistics Education Research in Building a Model of Statistical Literacy
It is clear, from Gal's paper that much research is needed in the field of statistical literacy. As suggested by the author, there are no systematic studies of the types and frequency of statistical concepts that an adult might encounter in the media and professional life.
More research is needed to clarify the fundamental components in the meaning of each spec& statisticslmathematics concept as well as the adequate level of abshaction for which each component should be taught, since didactic research has shown that students have difficulties in all the different components of the meaning of a concept. When entering an institution such as a school or a University the personal meaning that a student attributes to a specific concept might be different from the meaning of the concept in that institution.
For example, in the case of averages. Pollatsek, Lima & Well (198 1) describeduniversity students' errors in computing weighted averages and found students who do not recognise the problems of finding an expected value as a problem of averages; Mevarech (1983) observed that students tend to attribute non-existent properties to students, such as null element or associative property; and in Watson & Moritz (2000) students confused the words mean, median and mode. Their research also showed that students may reach different levels of understanding for averages at &e same age, although there is a progression in the level of understanding with age and instruction.
These arejustafew examples of theextensiveresearch that has focusedontherneaning of averages. In Batanero (2000) I provided a synthesis of previous research on the understanding of averages according to the theoretical model described in the previous section. The model helped to show that, even in the case of averages, where research is very wide, our knowledge about how students reason and learn statistics is far from complete and that some specific pointci in the understanding of averages have received more attention from researchers than others.
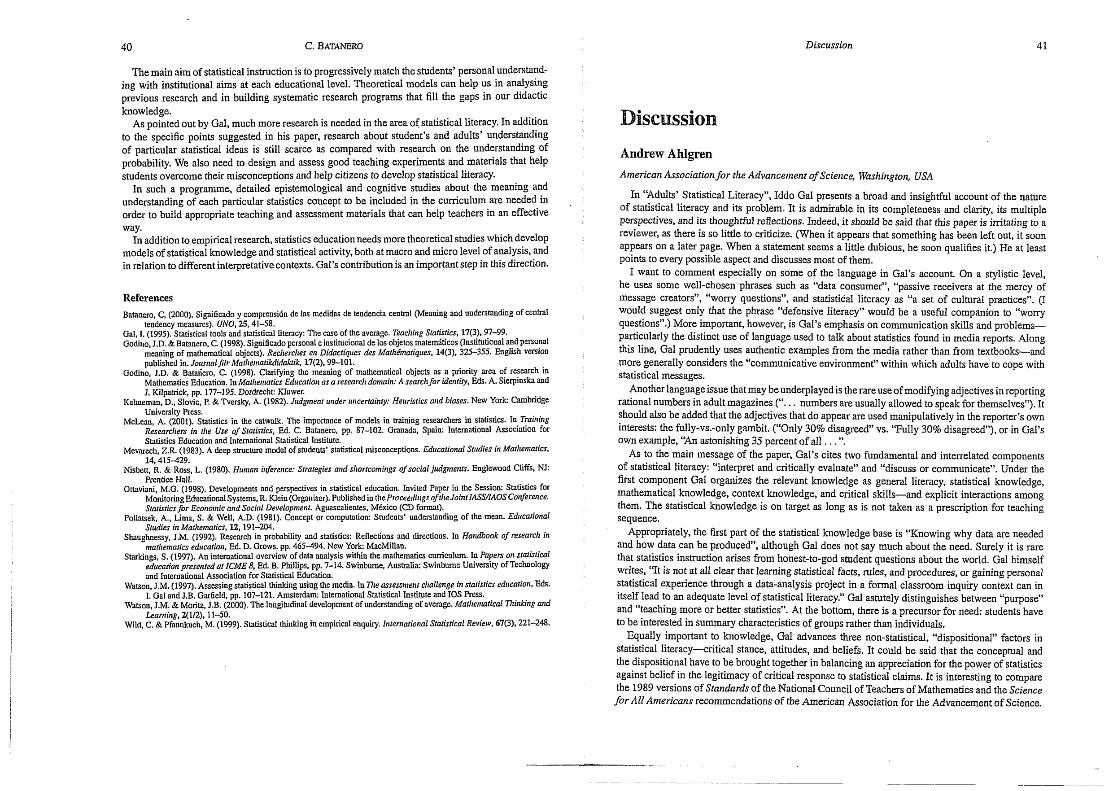
Discussion
The main aim of statistical instruction is to progressively match the students' personal understand- ing with institutional aims at each educational level. Theoretical models can help us in analysing previous research and in building systematic research programs that fill the gaps in our didactic &owledge.
As pointed out by Gal, much more research is needed in the area of staristical Literacy. In addition to the specific points suggested in his paper, research about student's and adults' underscanding of particular statistical ideas is still scarce as compared with research on the understanding of probability. We also need to design and assess good teaching experiments and materials that help students overcome their misconceptions and help citizens to devclop statistical literacy.
In such a programme, detailed epistemological and cognitive studies about the meaning and understanding of each particular statistics concept to be included in the curriculum are needed in order to build appropriate teaching and assessment materials that can help teachers in an effective way.
In addition to empirical research, statistics education needs more theoretical studies which develop models of statistical knowledge and sratistical activity, both at macro and micro level of analysis, and in relation to different interpretative contexts. Gal's contributionis an important step in this direction.
References Batanero. C. (2000). Significado y comprensi6n de las medidas de tendencia central (Meaning and undenWding of central
tendency mehsure-5). ~h70,25,41-58. Gal, 1. (1995). Statistical tools and statistical Iiteracy: The case of the average. Eacliing Sratistics, 17(3), 97-99. Godino, J.D. &Batanern, C. (1998). Significado personal einstitucional delos objetos 1mtem;iticos (Instihltimnl and perzonal
meanine of mathematical obiects). Recl~erches en Didactiqrres des Matli.!matiques, 14(3), 32.5-355. Enghh verSi0ZI pubtish~d in. JournalJiir ~~lier~ntikrlidaktik, 17(2), 99-101.
Godino, J.D. & Bnlariero, C. (1998). Clarifying the meaning of mathematical objects as a priority area of research in Mathematics Education. In Marlfenmrics Ed~rcatiori as a resentrli dornaic A searclifnr identify, Eds. A. Sierpinskn and J. Kilpatrick, pp. 177-195. Dordrecht Kluwer.
Kahuzmm. D.. Slovic. P. & Tvcrskv. A. (1982). Jrrdxtnent tinder rmcertainry: Herrristics and biases. New York: Cambridge univirsiiy ~ress.
McLem, A. (2001). Statistics in the catwak Tho impomnce of models in baining researchers in statistic% In Trainir~g Researchers in tile Use of Statistics, Ed. C. Bamero, pp. 87-102. Gmada, Spain: loternatioua$ Association for Swtktics Eiucation and Inten~ational Statistical Institute.
Mevarech. Z.R. (19831. A deeo structure m d e l of studem' statistical misconceptions. Educational Studies in Matlre~natics, 14.415429. '
Nisben, R. & Ross, L. (1980). Hiiman inference: Straregies and sl~ortcomirrgs of social judgrnet~ts. Englovcod CIifFs. NJ: Prcntice Hall.
Ottaviani, M.G. (1998). Developments and perspectives in statistical education. Invited Paper in the Session: Statistifs for Monitoring Educational Systems, R. Klein (Oqmiser). Published in thePmceedingoftlte Joint IASS/IAOS Confirence. Statistics far Economic and Social Development. Aguascatientes, Mixicc (CD fonnat).
Pollatsek. A.. Lima, S. & Well, A.D. (1981). Concept or computation: Students' understinnding of thc mean. Edr~cationol Sttidies in Matltetnatics, 12, 191-204.
Shaughnessy, J.M. (1992). Research in probabtlity and statistics: Reflections and directions. In FIondbook ofresenrcl~ in mnrl~ematics education, Ed. D. Grows. pp. 465-494. New York MacMilIan.
Starkings. S . (1997). An international overview of data anaJysis wilhin the mathematics curriculum. in Papers on slafistical edricafion presentedat ICME 8. Ed. B. PhiJIips, pp. 7-14. Swinbume, Alrstdinlia: Swinbume Uoivenity of Technology and International Association for Statistical Education.
Watson. J.M. (1997). Assessing statistical thinking using the media. In 771e msefsrnenl clmilenge BI statistics edrrcation. Eds. I . Gal 8ndJ.B. Garfield, pp. 107-121. Amsterdam: lnlernallonnl Statistiul Institute and 10.5 Press.
Watson, J.M. & Moritz, J.B. (2000). The longihldinal development of understanding of avenge. Marizert~atical Tilinking and Learning. 2(1/2). 11-50.
Wild, C. & Phnokuch, M. (1999). Statistical thinking in empirical enquj.. international Statistical Review, 67(3), 221-248.
Discussion
Andrew AhIgren
American Association for the Advancement of Science, Washington, USA
In "Adults' Statistical Literacy", Iddo Gal presents a broad and insightful account of the nature of statistical literacy and its problem. It is admirable in its completeness and clarity, its multiple perspectives, and its thoaghtful reflections. Indeed, it should be said that this paper is irritating to a reviewer, as there is so little to criticize. (When it appears that something has been left out, it soon appears on a later page. When a statement seems a little dubious, he soon qualifies it.) He at least points to every possible aspect and discusses most of them.
I want to comment especially on some of the language in Gal's account. On a stylistic level, he uses some well-chosen phrases such as "data consumer", "passive receivers at the mercy of message creators". "worry questions", and statistical literacy as "a set of cultural practices". (I would suggest only that the phrase "defensive lite~acy" would be a useful companion to "worry questions".) More important, however, is Gal's emphasis on communication skills and problems- particularly the distinct use of language used to talk about statistics found in media reports. Along this line, Gal prudently uses authentic exampIes from the media rather than from textbooks-and more generally considers the "communicative environment" within which adults have to cope with statistical messages.
Another languageissue thatmay be underplayed is the rare use of modifying adjectives in reporting rational numbers in adult magazines (". . . numbers are usuaIly allowed to speak for themselves"). It should also be added that the adjectives that do appear are used manipulatively in the reporter's own interests: the fully-vs.-only gambit. ("Only 30% disagreed" vs. "Fully 30% disagreed"), or in Gal's own example, ' a n astonishing 35 percent of all . . . ".
As to the main message of the paper, Gal's cites two fundamental and interrelated components of statistical literacy: "interpret and critically evaluate" and "discuss or communicate". Under the first component Gal organizes the relevant knowledge as general literacy, statistical knowledge, mathematical knowledge, context knowledge, and critical skills-and explicit interactions among them. The statistical knowledge is on target as long as is not taken as a prescription for teaching sequence.
Appropriately, the first part of the statistical knowledge base is "Knowing why data are needed and how data can be produced", although Gal does not say much about the need. Surely it is rare that statistics instruction arises from honest-to-god student questions about the world. Gal himself urites. "It is not at all clear that learning statistical facts, rules, and procedures, or gaining personal statistical experience through a data-analysis project in a formal classroom inquiry context can in itself lead to an adequate level of statistical literacy." Gal astutely distinguishes between "purpose" and "teaching more or better statistics". At the bottom, there is a preciirsor for need: students have to be interested in summary characteristics of groups rather than individuals.
Equally important to knowledge, Gal advances three non-statistical, "dispositional" factors in statistical literacy--critical stance, attitudes, and beliefs. It could be said that the conceptual and the dispositional have to be brought together in balancing an appreciation for the power of statistics against belief in the legitimacy of critical response to statistical claims. It is interesting to compare the 1989 versions of Standnrds of the National Council of Teachers of Mathematics and the Science fur All Americans recommendations of the American Association for the Advancement of Science.
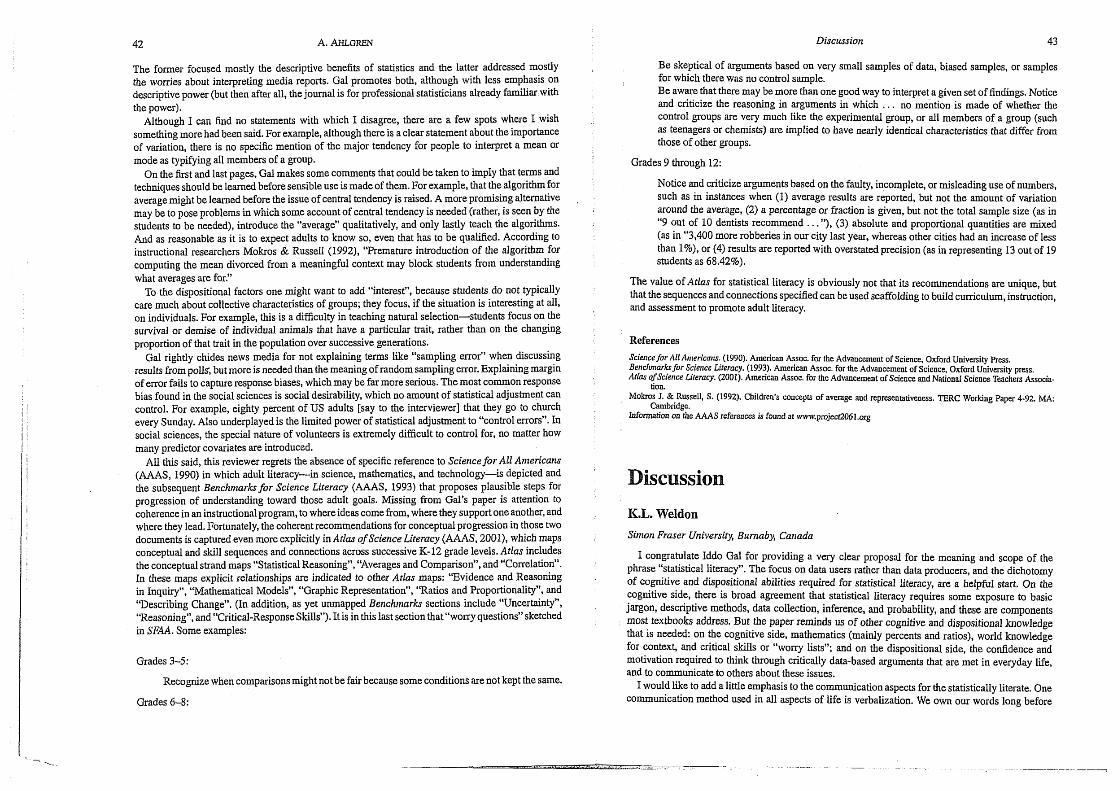
The former focused mostIy the descriptive benefits of statistics and the latter addressed mostly the worries about interpreting media reports. Gal promotes both, although with less emphasis on descriptive power (but then after all, the journal is for professional statisticians already familiar with the power).
Although I can find no statements with which I disagree, there are a few spots where I wish something more had been said. For example, although there is a clear statement about theimpormce of variation, there is no specific mention of the major tendency for peopb to interpret a mean or mode as typifying all members of a group.
On the k s t and last pages, Gal makes some comments that could be taken to imply that terms and techniques should be learned beforesensible use is made of them. For example, that the algorithm for average might be learned before the issue of central tendency i s raised. A more promising alternative ,
may be to pose problems in which some account of central tendency is needed (rather, is seen by the students to be needed), introduce the "average" qualitatively, and only lastly teach the algorithms. And as reasonable as it is to expect adults to know so, even that has to be qualified. According to instructional researchers Mokros & Russell (1992), "Premature introduction of the algorithm for computing the mean divorced from a meaningful context may block students Erom understanding what averages are for."
To the dispositional factors one might want to add "interest", because students do not typically care much about collective characteristics of groups; they focus, if the situation is interesting at all, on individuals. For example, this is a difficulty in teaching natural selection-students focus on the survival or demise of individual that have a particular trait, rather than on the changing proportion of that trait in the population over successive generations.
Gal rightly chides news media for not explaining terms l i b "sampling error" when discussing results from polls, but more is needed than the meaning of random sampling error. Explaining margin of error fails to capture response biases, which may be far more serious. The most common response bias found in the social sciences is social desirability, which no amount of statistical adjustment can control. For example, eighty percent of US adults [say to the interviewer] that they go to church every Sunday. Also underplayedis the l i i t e d power of statistical adjustment to "control errors". In social sciences, the special nature of volunteers is extremely difficult to control for, no matter how many predictor covariatcs are introduced. All this said, this reviewer regrets the absence of specific reference b Sciencefor All Americans
(AAAS, 1990) in which adult literacy-in science, mathematics, and technology-is depicted and the subsequent Benchnzarh for Science Literacy (AAAS. 1993) that proposes plausible steps for progression of understanding toward those adult goals. Missing from Gal's paper is attention to coherence in an instructional program, to whereidcas comefrom, where they support oneanother, and where they lead. Fortunately, the coherent recommendations for conceptual progression in those two documents is captured even more explicitly in Atlas of Science Literacy (AAAS, 2001), which maps conceptual and skill sequences and connections across successive K-12 grade levels. Atlas includes the conceptual strand maps "Statistical Reasoning", "Averages and Comparison", and "Coridation". In these maps explicit relationships are indicated to other A r h maps: 'Xvidence and Reasoning in Inquiry", "Mathematical Models", "Graphic Representation", "Ratios and Proportionality", and '73escribing Change". (In addition, as yet unmapped Benclurlarh sections include "Uncertainty", 'Reasoning", and "Critical-Response Skills"). It is in this last section that "worry questions" sketched in SFAA. Some examples:
Grades 3-5:
Recognize when comparisons might not be fair because some conditions are not kept the same.
Grades 6-8:
Discussion 43
Be skeptical of arguments based on very small samples of data, biased samples, or samples for which there was no control sample. Be aware that there may be more than one good way to interpret a given set of findings. Notice and criticize the reasoning in arguments in which . . . no mention is made of whether the control groups are very much like the experimental group, or all members of a group (such as teenagers or chemists) are implied to have nearly identical chatacteriscics that diEer from those of other groups.
Grades 9 through 12:
Notice and criticize arguments based on the faulty, incomplete, or misleading use of numbers, such as in instances when (1) average results are reported, but not the amount of variation around the average, (2) a percentage or fraction is given, but not the total sample size (as in "9 out of 10 dentists recommend . . . "), (3) absolute and proportional quantities are mixed (as in "3,400 more robberies in our city last year, whereas other cities had an increase of less than I%), or (4) results are reported wlth overstated precision (as in representing 13 out of 19 studen$ as 68.42%).
The value of Atlas for statistical literacy is obviously not that its recommendations are unique, but that the sequences and connections speciiied can be used scaffolding to build curriculum, instruction, and assessment to promote adult literacy.
References Sciencefor All Anrericnns. (1990). Amcrican Assoc. for h e Advancement of Science. Oxford UnivcrsiQ Ress. Benclunarks for Science Lrreracy. (1993). American Assoc for thc Advancement of Science. Oxford University press. Arlm of Science Lileracy. (2001). Arnmwn Assbc. for thc Advancement of Science and Nallonal Science Teachers Assacia-
tion. M o h s J. & Russell, S. (1992). Childton's eoncepffi of average and representativeness. TERC Working Paper 4-92. MA:
Cambridge. Information on the AAAS references is found at www.project2061 .org
Discussion
K.L. Weldon
Si~non Fraser University, Burnaby, Canada
I congratulate Iddo Gal for providing a very clear proposal for the meaning and scope of the phrase "statistical literacy". The focus on data users rather than data producers, and the dichotomy of cognitive and dispositional abilities required for statistical literacy, are a helpful start. On the cognitive side, there is broad agreement that statistical literacy requires some exposure to basic jargon, descriptive methods, data collection, inference, and probability, and these are components most textbooks address. But the paper reminds us of other cognitive and dispositional knowledge that is needed: on the cognitive side, mathematics (mainly percents and ratios), world knowledge for context, and critical skills or "worry lists"; and on the dispositional side, the confidence and motivation required to think through critically data-based arguments that are met in everyday life, and to communicate to others about these issues.
I would like to add a little emphasis to the communication aspects for the statisticdy literate. One communication method used in all aspects of life is verbalization. We own our words long before
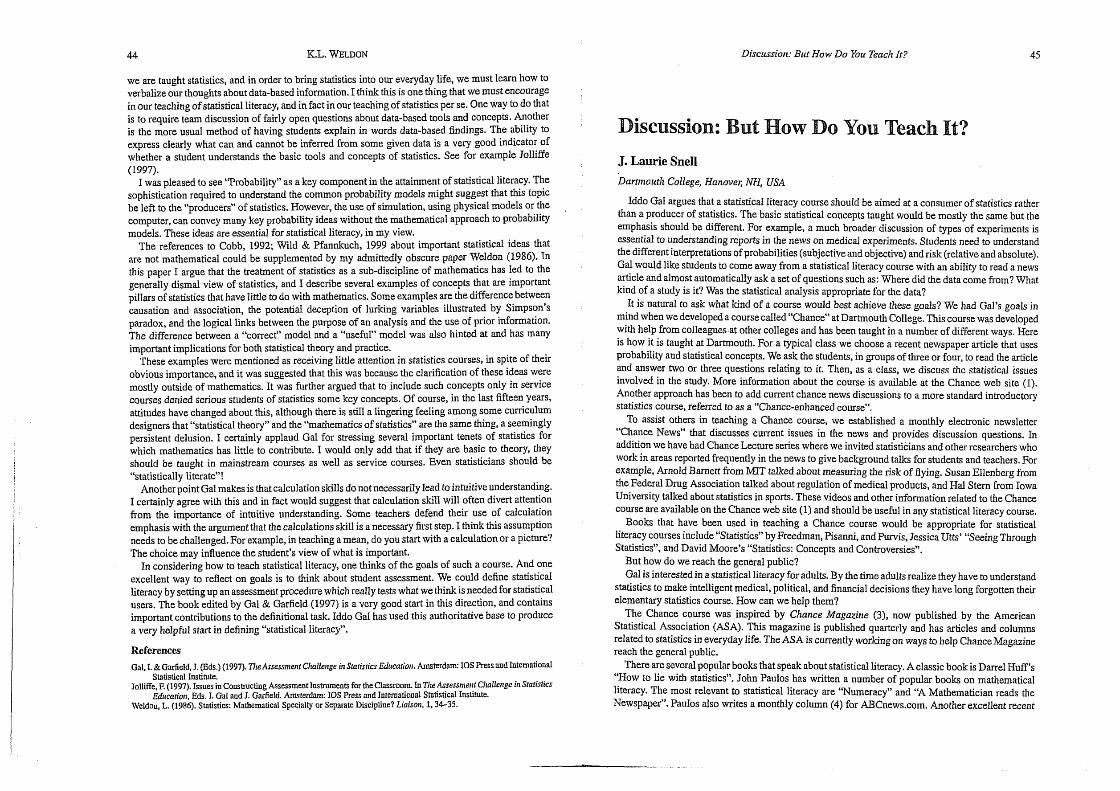
44 K.L. WELDON Discrlssion: But How Do Yorr Teach It?
we are taught statistics, and in order to bring statistics into our everyday life, we must learn how to verbalize our thoughts about data-based information. Ithinkthis is one thing that we must encourage in our teaching of statistical literacy, and in fact in our teaching of statistics per se. One way to do that is to require team discussion of fairly open questions about data-based tools and concepts. Another is the more usual method of having students explain in words data-based findings. The ability to express clearly what can and cannot be inferred from some given data is a very good indicator of whether a student understands the basic tools and concepts of statistics. See for example Jolliffe (1997).
I was pleased to see "Robability" as a key component in the attainment of statistical literacy. The sophistication required to understand the common probability models migbt suggest that rhis topic be left to the "producers" of statistics. However, the use of simulation, using physical models or the ,
computer, can convey many key rob ability ideas without the mathematical approach to probability models. These ideas are essential for statistical literacy, in my view.
The references to Cobb, 1992; Wild & Pfannkuch, 1999 about important statistical ideas that are not mathematical could be supplemented by my admittedly obscure paper Weldon (1986). In this paper I argue that the treatment of statistics as a sub-discipline of mathematics has led to the generally dismal view of statistics, and 1 describe several examples of concepts that are important pillars of statistics that have little to do with mathematics. Some examples are the difference between causation and association, the potential deception of lurking variables illustrated by Simpson's paradox, and the logical links between the purpose of an anaIysis and the use of prior information. The difference between a "correct" model and a "useful" model was also hinted at and has many important implications for both statistical theory and practice.
These exampIes were mentioned as receiving little attention in statistics courses, in spite of their obvious importance, and it was suggested that this was because the clarification of these ideas were mostly outside of mathematics. It was further argued that to include such concepts onIy in service courses denied serious students of statistics some key concepts. Of course, in the last fifteen years, attitudes have changed about this, although there is still a lingering feeling among some curriculum designers that "statistical theory" and the "mathematics of statistics" are the same thing, a seemingly persistent delusion. I certainly applaud Gal for stressing several important tenets of statistics for which mathematics has little to contribute. I would only add that if they are basic to theory, they should be taught in mainstream courses as well as service courses. Even statisticians should be "statistically literate"!
Another point Gal makes is that caIculation skills do not necessarily lead tointuitive understanding. I certainly agree with this and in fact would suggest that calculation skill will often divert attention from the importance of intuitive understanding. Some teachers defend their use of calculation emphasis with the argument that the calculations skill is a necessary first step. I think this assumption needs to be challenged. For example, in teaching a mean, do you start with a calculation or a picture? The choice may influence the student's view of what is important.
In considering how to teach statistical literacy, one thinks of the goals of such a course. And one excellent way to refiect on goals is to think about student assessment. We could define statistical literacy by setting up an assessment procedure which really tests what we think is needed for statistical users. The book edited by Gal & Garfield (1947) is a very good start in this direction, and contains important contributions to the definitional task. Iddo Gal has used this authoritative base to produce a very helpful start in defining "statistical literacy".
References Gal, L &Garfield, J. (Eds.) (1997). Tile Assesment Cltalle~cge in Stutistics Education. Amsterdam: IOS Press and International
Statistical Institute. Jolliffc, E (1997). hsues in Consmcting Assessment Instmments for the Classroom. In Tire Assessmenf Cl~allenxe in Statistics
Edttcatiort, E&. I . Gal and J. G.ufreld. Amsrerdun: 10.9 Press and Inremadonnl Statistical InstiNte. U'eldon. L. (1986). Smtistics: Mathematical Specialty or Separate Discipline? Liaison. 1.34-35.
Discussion: But How Do Yon Teach Xt?
J. Laurie Snell Dartmouth College, Xanove~; NH, USA
Iddo Gal argues that a statistical literacy course should be aimed at a consumer of statistics rather than a producer of statistics. The basic statistical concepts taught would be mostIy the same but the emphasis should be different. For example, a much broader discussion of types of experiments is essential to understanding reports in the news on medical experiments. Students need to understand thedifferent interpretations of probabilities (subjective and objective) and risk (relative and absolute). Gal would like students to come away from a statistical literacy course with an ability to read anews article and almost automatically ask a set of questions such as: Where did the data come from? What kind of a study is it? Was the statistical analysis appropriate for the data?
It is natural to ask what kind of a course would best achieve these goals? We had Gal's goals in m~nd when we developeda course called "Chance" at Dartmouth College. This course was developed with help from colleagues at other colleges and has been taught in a number of different ways. Here is how it is taught at Dartmouth, For a typical class we choose a recent newspaper article that uses probabiky and statistical concepts. We ask the students, in p u p s of three or four, to read the articie and answer two or three questions relating to it. Then, as a class, we discuss the statistical issues involved in the study. More information about the course is available at the Chance web site (I). Another approach has been to add current chance news discussions to a more standard introductory statistics course, referred to as a "Chance-enhanced course".
To assist others in teaching n Chance course, we established a monthly electronic newsletter "Chance News" that discusses current issues in the news and provides discussion questions. In addition we have had Chance Lecture series where we invited statisticians and other researchers who work in areas reported frequently in the news to give background talks for students and teachers. For example, Arnold Barnett from MIT talked about measuring the risk of Rying. Susan EIlenberg from the Federal Drug Association talked about reguIation of medical products, and Hal Stern from Iowa University talked about statistics in sports. These videos md other information related to the Chance course are available on the Chance web site (1) and should be useful in any statistical literacy course.
Books that have been used in teaching a Chance course would be appropriate for statistical literacy courses include "Statistics" by Freedman, Pisanni, andPurvis, Jessica Utts' "Seeing Through Statistics", and David Moore's "Statistics: Concepts and Controversies".
But how do we reach the general public? Gal is interested in a statistical literacy for adults. By the timeadults realize they have to understand
statistics to make intelligent medical, political, and financial decisions they have long forgotten their elementary statistics course. How can we help them?
The Chance course was inspired by Chance Magazine (3), now published by the American Statistical Association (ASA). This magazine is published quarterly and has articles and columns related to statistics in everyday life. The ASA is currently working on ways to hclp ChanceMagazinc reach the general public.
There are several popular books that speak about statistical literacy. A classic book is D n e l Huff's "How to lie wjth statistics". John Paulos has written a number of popuiar books on mathematical literacy. The most relevant to statistical literacy are 'Wumeracy" and "A Mathematician reads the Newspaper". PauIos also writes a monthly column (4) for ABCnews.com, Another excellent recent
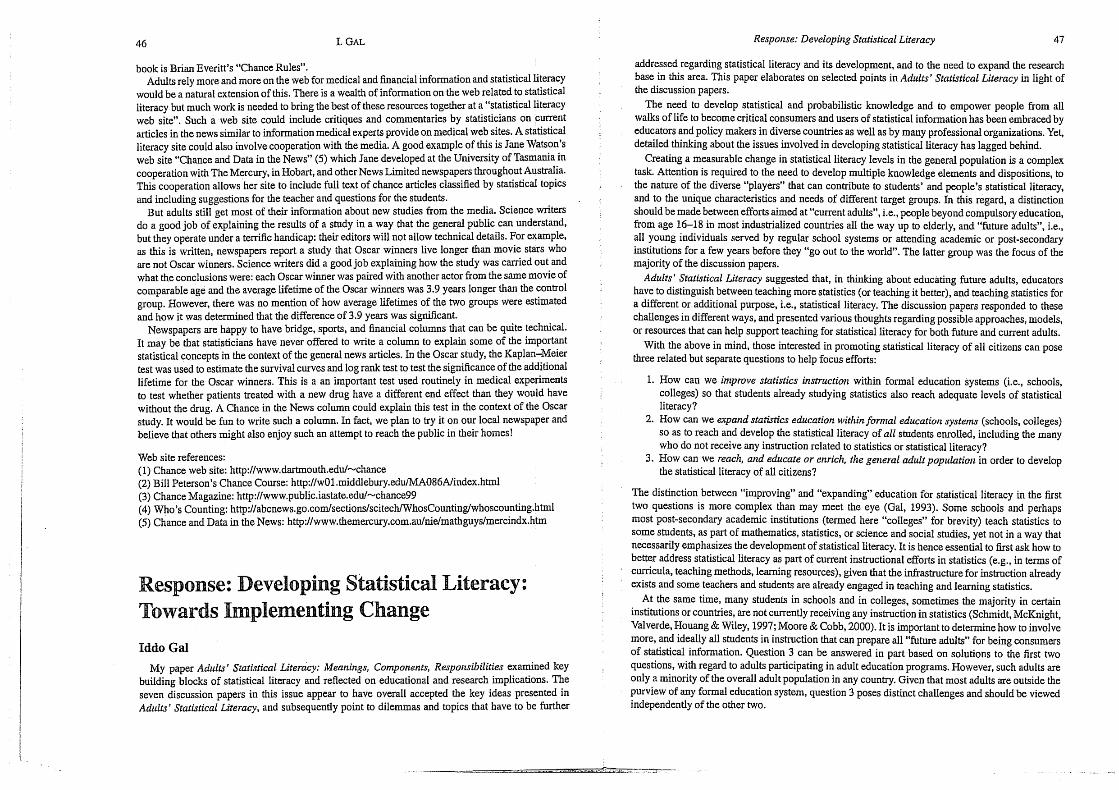
46 I. GAL Response: Developing Sratistical Literacy 47
book is Brian Everitt's "Chance Rules". Adults rely more and more on the web for medical and financial information and statistical literacy
would be a natural extension of this. There is a wealth of information on the web related to statistical literacy but much work is needed to bring the best of these resources together at a "statistical literacy web site". Such a web site could include critiques and commentaries by statisticians on current articles in the news similar to information medical experts provideon medical web sites. A statistical literacy site could also involve cooperation with the media. A good example of this is Jane Watson's web site "Chance and Data in the News" (5) which fane developed at the University of Tasmania in cooperation with The Mercury, in Hobart, and other News Limrtednewspapers throughout Australia. This cooperation allows her site to include full text of chance articles classified by statistical topics and including suggestions for the teacher and questions for the students.
But adults still get most of their information about new studies from the media. Science writers do a good job of explaining the results of a study in a way that the general public can understand, but they operate under a terrific handicap: their editors will not allow technical details. For example, as this is written, newspapers report a study that Oscar winners live longer than movie stars who are not Oscar winners. Science writers did a good job explaining how the study was carried out and what the conclusions were: each Oscar winner was paired with another actor from the same movie of comparable age and the average lifetime of the Oscar winners was 3.9 years longer than the control group. However, there was no mention of how average lifetimes of the two groups were estimated and how it was determined that the difference of 3.9 years was si,&ficant.
Newspapers are happy to have bridge, sports, and financial columns that can be quite technical. It mav be that statisticians have never offered to write a column to explain some of the important statisical concepts in the context ofthe general news articles. In the 0 i a r study, the Kaplan-Meier test was used to estimate the survivalcurves and logrank test to test the significance of the additional lifetime for the Oscar winners. This is a an important test used routinely in medical experiments to test whether patients treated with a new drug have a different end effect than they would have without the drug. A Chance in the News column could explain this test in the context of the Oscar study. It would be fun to write such a column. In fact, we plan to try it on our local newspaper and believe that others might also enjoy such an attempt to reach the public in their homes!
Web site references: (1) Chance web site: http://www.dartmouth.edu/-chance (2) Bill Peterson's Chance Come: http://wOl .middlebury.edu/MAO86A/index.hrml (3) Chance Magazine: http:l/www.public.iastate.edul-chance99 (4) Who's Counting: http://abcnews.go.com/sections/scitech/WhosCountin~whoscoun~g.h~l (5) Chance and Data in the News: http://www.themercury.com.au/nie/mathguys/mercindx.hbn
Response: Developing Statistical Literacy: Towards Ianplernenting Change
Iddo Gal My paper Adults' Statistical Literacy: Meanings, Components, Responsibilities examined key
building blocks of statistical literacy and reflected on educational and research implications. The seven discussion papers in this issue appear to have overall accepted the key ideas presented in Adults' Statisrical Literacy, and subsequently point to dilemmas and topics that have to be further
addressed regarding statistical literacy and its development, and to the need to expand the research base in this area. This paper elaborates on selected points in Adults' Statbtical Literacy in light of the discussion papers.
The need to develop statistical and probabilistic knowledge and to empower people from all walks of life to become critical consumers and users of statistical information has been embraced by educators and policy makers in diverse countries as well as by many professional organizations. Yet, detailed thinking about the issues invofved in developing statistical literacy has lagged behind.
Creating a measurable change in statistical Iiteracy levels in the general population is a complex task. Attention is required to the need to develop multiple knowledge elements and dispositions, to the nature of the diverse "players" that can contribute to students' and people's statistical literacy, and to the unique characteristics and needs of different target groups. In this regard, a distinction should be made between efforts aimed at "current adults", i.e., people beyond compulsory education, from age 16-18 in most industrialized countries all the way up to elderly, and "future adults", i.e., all young individuals served by reguiar school systems or attending academic or post-secondary institutions for a few years before they "go out to the world". The latter group was the focus of the majority of the discussion papers.
Adults' Statistical Literacy suggested that, in thinking about educating future adults, educators have to distinguish between teaching more statistics (or teaching it better), and teaching statistics for a different or additional purpose, i.e., statistical literacy. The discussion papers responded to these challenges in different ways, and presented various thoughts regarding possible approaches, models, or resources that can help support teaching for statistical literacy for both future and current adults.
With the above in mind, those interested in promoting statistical literacy of all citizens can pose three related bur separate questions to help focus efforts:
1. How can we inzprove statistics instruction within formal education systems (i.e., schools, colleges) so that students already studying statistics also reach adequate levels of statistical literacv?
2. How can we expand statistics education within formal educatiol~ .rysterns (schoois, colleges) so as to reach and develop the statistical literacy of all students enrolled, including the many who do not receive any instruction related to statistics or statistical literacy?
3. How can we reach, and educate or enrich, the gefzeral adult population in order to develop the statistical literacy of all citizens?
The distinction between "improving" and "expanding" education for statistical literacy in the fist two questions is more complex than may meet the eye (Gal, 1993). Some schools and perhaps most post-secondary academic institutions (termed here "colleges" for brevity) teach statistics to some students, as part of mathematics, statistics, or science and social studies, yet not in a way that necessarily emphasizes the development of statistical literacy. It i s hence essential to first ask how to better address statistical literacy as part of current instructional efforts in statistics (e.g., in terms of curricula, teaching methods, learning resources), given that the infrastructure for instruction already exists and some teachers and students are already engaged in teaching and learning statistics.
At the same time, many students in schools and in colleges, sometimes the majority in certain institutions or countries, are not currentIy receiving any instruction in statistics (Schmidt, McKnight, Valverde, Houang & Wiley, 1997; Moore & Cobb, 2000). It is important to determine how to invoIve more, and ideally all students in instruction that can prepare all "future adults" for being consumers of statistical information. Question 3 can be answered in part based on solutions to the first two questions, with regard to adults participating in adult education programs. However, such adults are only a minority of the overall adult population in any country. Given that most adults are outside the purview of any formal education system, question 3 poses distinct challenges and should be viewed independently of the other two.
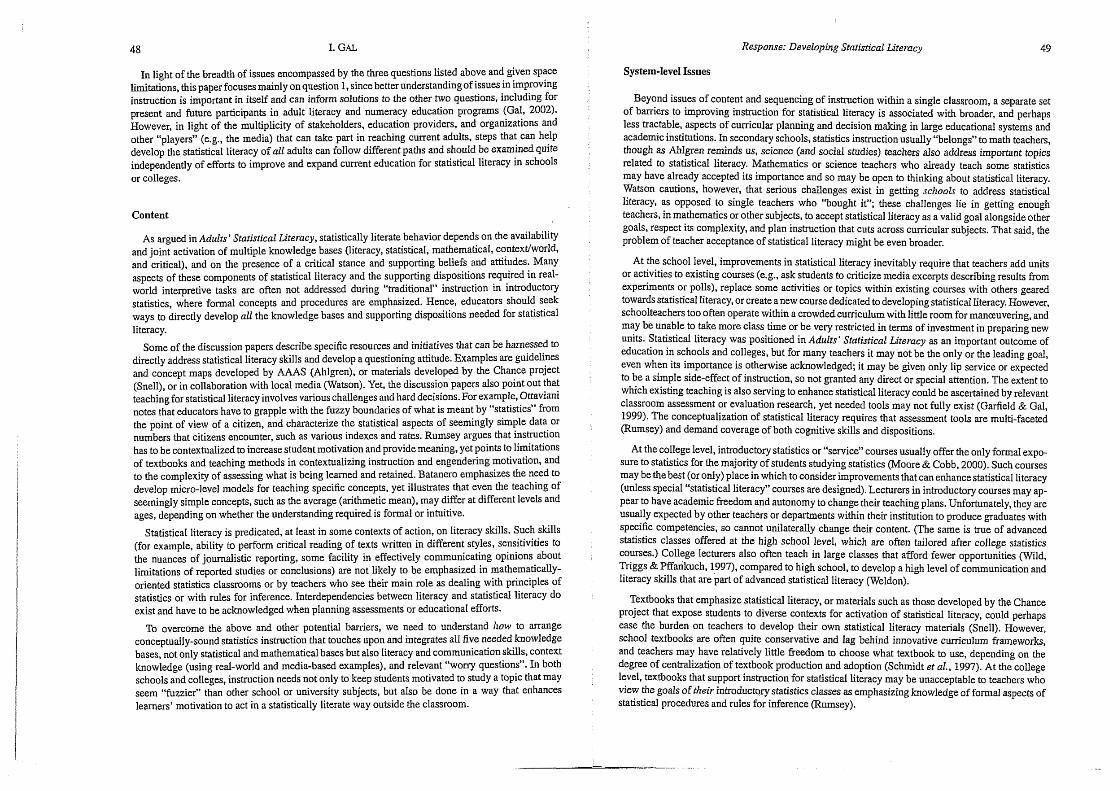
Response: Developing Statistical Literacy
In light of the breadth of issues encompassed by the three questions listed above and given space limitations, this paper focuses mainly on question 1, s i n c ~ better understanding of issues in improving instruction is important in itself and can inform solutions to the other two questions, including for present and future participants in adult literacy and numeracy education program (Gal, 2002). However, in light of the multiplicity of stakeholders, education providers, and organizations and other "players" (e.g., the media) that can take part in reaching current adults, steps that can help develop the statistical literacy of all adults can follow different paths and should be examined quite independently of efforts to improve and expand current education for statistical literacy in schools or colleges.
Content
As argued in Adults' Statistical Literacy, statistically literate behavior depends on the availability and joint activation of multiple knowledge bases (literacy, statisticai, mathematical, context/world, and critical), and on the presence of a critical stance and supporting beliefs and attitudes. Many aspects of these components of statistical literacy and the supporting dispositions required in real- world interpretive tasks are often not addressed during "traditional" instruction in introductory statistics, where formal concepts and procedures are emphasized. Hence, educators should seek vlays to directly develop all the knowledge bases and supporting dispositions needed for statistical literacy.
Some of the discussion papers describe specific resources and initiatives that can be harnessed to directly address statistical literacy skills and develop a questioning attitude. Examples are guidelines and concept maps developed by AAAS (Ahlgen), or materials developed by the Chance project (Snell), or in collaboration with local media (Watson). Yet, the discussion papers also point out that teaching for statistical literacy involves various challenges and hard decisions, For example, Ottaviani notes that educators have to grapple with the fuzzy boundaries of what is meant by "statistics" from the point of view of a citizen, and characterize the statistical aspects of seemingly simple data or numbers that citizens encounter, such as various indexes and rates. Rumsey argues that instruction has to be contextualizedto increase student motivation and provide meaning, yet points to limitations of textbooks and teaching methods in contexmalizing instruction and engendering motivation, and to the complexity of assessing what is being learned and retained, Batanero emphasizes the need to develop micro-level models for teaching specific concepts, yet illustrates that even the teaching of seemingly simple concepts, such as the average (arithmetic mean), may differ at different levels and ages, depending on whether the understanding required is formal or intuitive.
Statistical Iiteracy is predicated, at least in some contexts of action, on literacy skills. Such skills (for example, ability to perform critical reading of texts written in different styles, sensitivities to the nuances of journalistic reporting, some facility in effectively communicating opinions about limitations of reported studies or conclusions) are not likely to be emphasized in mathematicauy- oriented statistics classrooms or by teachers who see their main role as dealing with principles of statistics or with rules for inference. Interdependencies between literacy and statistical literacy do exist and have to be acknowledged when planning assessments or educational efforts.
To overcome the above and other potential barriers, we need to understand Row to arrange conceptually-sound statistics instruction that touches upon and integrates all five needed knowledge bases, not only statistical and mathematical bases but also literacy and communicationslrills, context knowledge (using real-world and media-based examples), and relevant "worry questions". In both schools and colleges, instruction needs not only to keep students motivated to study a topic that may seem "fuzzier" than other school or university subjects, but also be done in a way that enhances learners' motivation to act in a statistically literate way outside the ciassroom.
System-level Issues
Beyond issues of content and sequencing of insh-uction within a single classroom, a separate set of barriers to improvmg instruction for statistical literacy is associated with broader, and perhaps less tractable, aspects of curricular planning and decision making in large educational systems and academic institutions. In secondary schools, statistics instruction usually "belongs" to math teachers, though as Ahlgren reminds us, science (and social studies) teachers also address important topics related to statistical literacy. Mathematics or science teachers who already teach some statishcs may have aIready accepted its importance and so may be open to thinking about statistical literacy. Watson cautions, however, that serious challenges exist in getting schools to address statrsticaf literacy, as opposed to single teachers who "bought it"; these chaIIenges lie in getting enough teachers, in mathematics or other subjects, to accept statistical literacy as a valid goal alongside other goals, respect its complexity, and pIan insbaction that cuts across curricular subjects. That said, the problem of teacher acceptance of statistical literacy might be even broader.
At the school level, improvements in statistical literacy inevitably require that teachers add units or activities to existing courses (e.g., ask students to criticize media excerpts describing results from experiments or polls), replace some activities or topics within existing courses with others geared towards statisticalliteracy, or create anew course dedicated to deveIoping statistical literacy. However, schoolteachers too often operate within a crowdedcurriculum with little room for manoeuvering, and may be unable to take more class time or be very restricted in terms of inveshnent in preparing new units. Statistical Iiteracy was positioned in Adttlts' Statirtical Literacy as an important outcome of education in schools and colleges, but for many teachers it may not be the only or the leading goal, even when its importance is otherwise acknowledged; it may be given only lip service or expected to be a simple side-effect of instruction, so not granted any direct or special attention. The extent to which existing teaching is also serving to enhance statistical literacy could be ascertained by relevant classroom assessment or evaluation research, yet needed tools may not fully exist (Garfield & Gal, 1999). The conceptualization of statistical literacy requires that assessment tools are multi-faceted (Rumsey) and demand coverage of both cognitive skills and dispositions.
At the college level, introductory statistics or "service" courses usually offer the only formal expo- sure to statistics for the majority of students studying statistics (Moore & Cobb, 2000). Such courses may be the best (or only) place in which to consider improvements that can enhance statistical literacy (unless special "statistical literacy" courses are designed). Lecturers in introductory courses may ap- pear to have academic freedom and autonomy to change their teachingplm. Unfortunately, they are usually expected by other teachers or departments within their institution to produce graduates with specific competencies, so cannot unilaterally change their content. (The same is true of advanced statistics classes offered at the high school level, which are often tiulored after college statistics courses.) College lecturers also often teach in large classes that afford fewer opportunities (Wild, Triggs & Pffankuch, 19971, compared to high school, to develop a high level of communication and literacy skills that are part of advanced statistical literacy (Weldon).
Textbooks that emphasize statistical literacy, or materials such as those developed by the Chance project that expose students to diverse contexts for activation of statistical literacy, could perhaps ease the burden on teachers to develop their own statistical literacy materials (Snell). However, school textbooks are often quite conservative and lag behlnd innovative curriculum frameworks, and teachers may have relatively little freedom to choose what textbook to use, depending on the degree of centraIization of textbook production and adoption (Schmidt et aL, 1997). At the college level, textbooks that support instruction for statistical literacy may be unacceptable to teachers who view the goals of their introductory statistics classes as emphasizing howledge of formal aspects of statistical procedures and rules for inference (Rumsey).
Implications
How then do we improve and expand instruction towards statistical literacy? Watson argues that, "Only through grass roots effort with teachers and their school administrators will we make headway in getting the objectives of statistical literacy accepted across the curriculum."In contrast, Schoenfeld (2001), argues that, "Writing across the curricuium is typically more rhetoric than reality . . . and infusing quantitative literacy throughout the curriculum would be an uphill battle fp. 54)". Clearly, local adoption by teachers and school principals (or department heads in colleges) must occur, as Watson suggests, but this means that the vision of statistical literacy for all has to be communicated or successfully marketed (by whom?) to individual teachers and lecturers in order to win their hearts, minds, and precious instructional time.
The analysis above pointed to several content and system-level barriers to thc mprovement and . expansion of teaching geared towards statistical literacy. Most schooI or college teachers cannot realistically be expected to invest much ex&a tune in modifying their establ~shed lesson plans, or abandon any of their favorite textbooks, and switch to new and possibly time-consuming teaching schemes or assessment tools. To ease the transibon, teachers need to be given enough resources, e.g., preparation time, access to rich and field-tested teaching materials, and assessment tools. There is a need for top-down processes that can help create such necessary resources as well as a system-wide organizational culture to support the development of statistical literacy of Icarners at all levels.
We also need research-based models describing possible teaching-learning processes related to -.
statistical literacy, as a basis for instnrctional planning, teacher training, and preparation of teaching materials. A model of the types of knowledge elements that need to be developed at different stages - - of teaching towards statistical literacy in schools has beenpresentedand studied by Watson. This and other existing models should be extended to describe and explain not only stages in acquiring needed knowledge and'skills, but also stages in developing dispositional elements, i.e., critical stance and supporting beiiefs and attitudes, which are just as critical for statistically literate behavior. Further, teaching-learning models should be adapted to use with learners of different ages and with different levels of literacy and quantitative skills, in order to enable educators to plan instruction that makes statistical literacy accessible to learners fromdiverse backgrounds. (Gal, 1993, describedcases where some schools offered entry to statistics courses only to students with advancedmathematical skills.)
As Adults' Statisfical Literacy and some of the discussion papers (e.g., Rumsey, Snell, Watson) point out, various 'players" involved in creating and communicating statistical information to the public can be recruited to take part in enhancing statistical literacy skals of both future and current aduIts. These players include, for example, statistid agencies and research organizations in the public and private sectors that conduct surveys or experiments and release statistical information to the public, or media organizations, news providers, and producers who dislribute information via printed newspapers and magazines, television programming, advertisements, and the Internet
The groups described above along with other data creators and data communicators (Rumsey) can contribute in many ways to communication efforts, such as better explaining the meaning of information being communicated, or by making their materials accessible to educators. Professional organizations, statisticians, statistics educators, researchers, and policy-makers interested in improv- ing statistical literacy need to work together to champion statistical literacy as a valued educational and civic goal, and to enhance the knowledge-base and professional development options available to educators working with school children, college students, or with adults.
References Gd, I. (1993). Reaching out: Some issues and dilemmas in expanding statistics education. In Introducing dnra-analysis
in the sclrook iWmo slrould read8 it and how?, Ed. L. Pereira-Mendoza, pp. 189-203. Voarburg, The Netherlands: International Statistical Institute.
Gal, I. (2002, forthcoming). Examiningsystemic needs in adult numency education. Adult Bosic Education, 12(1).
Response: Developirrg Statistical Literacy 51
Gdeld , J.B. & Gd. I. (1999). Assessment and statistics education: Current challenges and directions. International Statirtical Review, 67(1), 1-12,
Moore, D.S. & Cobb, G.W. (2TO). Statistics and malbematics: Tension and cooperation. Aniericm Mathematical Montltfy, 10717). 615-5711.
~cbocnfeld,A.~.~. (2001). Reflections on animpoverished edudon. In Malltematics anddemocracy: rite case forquantitative literacy, Ed. L.A. Steen. USA: National council on education and the disciplines.
Schmidt W.'.H.,,McFght, C.C., Valvefie. G.A.. Houang, R.T. & Wiley. D.E. (1997). Many visions, marly a i m (Vol. I): A cross-mlond mnvestigation of curricular intentions in school mnrlmemtics. Dordrecht The Netherlands: Kluwer.
WiW C., Triggs, C, & Pfamhch. M. (1997). Asswsment on a budget: wing haditional meffiodc imagina~vely. In f i e asses~ment dtallenge in statirtics edrccation, Eds. I . Gal and J.B. Gaiield, pp. 205-220. Amsferdam. TheNetherlands: Internationd Statistical InstitutdIOS Ress.
[Received September 2000, accepted October 20011


