l .
U. S. DEPARTMENT OF COMMERCE NATIONAL BUREAU OF STANDARDS
RESEARCH PAPER RP1348
Part of Journal of Research of the National Bureau of Standards, Volume 25, December 1940
A PHOTOMETRIC PROCEDURE USING BARRIER-LAYER PHOTOCELLS
By Louis E. Barbrow
ABSTRACT
A procedure is described whereby barrier-layer photocells, corrected so as to have a spectral response curve simulating the ICI luminosity curve, are used in the photometry of light sources of various colors and in the determination of the transmission factors of colored filters. The procedure involves a determination of the illumination-response curve of the cell used, a method of avoiding the difficulties incident to cell fatigue, and a means for correcting for the improper spectral sensitivity of the cell. The method of correcting for the difference between the spectral response of the cell used and the ICI luminosity curve embodies essentially the procedure recommended in 1937 by the International Committee of Weights and Measures for the photometry of light sources which differ in color. Results obtained using the recommended procedure are given.
CONTENTS Page
1. Introduction ____________________________________________________ 703 II. Circuit _________________________________________________________ 704
III. Illumination-response curves ____________________ __________________ 705 IV. Fatigue characteristics ________________________ . ___________________ 707
V. Correction for improper spectral response___ _ _ _ _ _ _ _ _ _ _ _ _ _ _ _ _ _ _ _ _ _ _ _ _ 707 VI. Conclusion _____________________________________________________ 710
1. INTRODUCTION
Historically, the advent of new light sources has always introduced the difficult problem of measuring them photometrically. Starting back only as far as 1909, we have several outstanding examples of this situation. In 1909, candlepower values were assigned to groups of carbon-filament incandescent lamps by the national standardizing laboratories of England, France, Germany, and the United States. These were to serve as the basic standards by means of which the unit of luminous intensity was to be maintained. Later, vacuum tungstenfilament lamps and then gas-filled tungsten-filament lamps became commercially available, and the various national standardizing laboratories independently derived photometric standards of these types in terms of the basic carbon-filament standards. Because of the color differences involved in such measurements, it has been found that the various laboratories are not in agreement on the tungsten-filament standards, even though they started in substantial agreement on the carbon-filament lamps. The principal reason for this is that different photometric procedures were used by the different laboratories to overcome the color differences involved.
703
704 Journal oj Research oj the National Bureau oj Standards [Vol. fJ6
The International Committee of Weights and Measures in 1937 1
agreed on a procedure to be followed in deriving photometric standards of other colors from the primary standard as follows:
(a) The photometric values of sources having a color different from the primary standard shall be determined by a procedure consistent with the luminosity curve adopted by the International Committee of Weights and Measures.2
(b) To assure uniformity in the procedure of passing from the new primary standard to secondary incandescent filament standards of higher efficiency there is adopted the method of blue filters interposed between the photometer and one of the light sources to be compared, thus establishing a color match.3
More recently mercury-vapor lamps and fluorescent lamps of various colors have come into commercial use and these have presented in an exaggerated form the same general type of problem relative to their photometry.
The object of this paper is to outline a procedure for the photometry of light sources of any color by the use of barrier-layer photocells. The procedure embodies in general that adopted by the International Committee of Weights and Measures in 1937. It involves the determination of (1) the current response of the cell used over a useful range of illumination, (2) the effect of fatigue on this response, and (3) the effect of improper spectral sensitivity and a means of correcting for it.
II. CIRCUIT
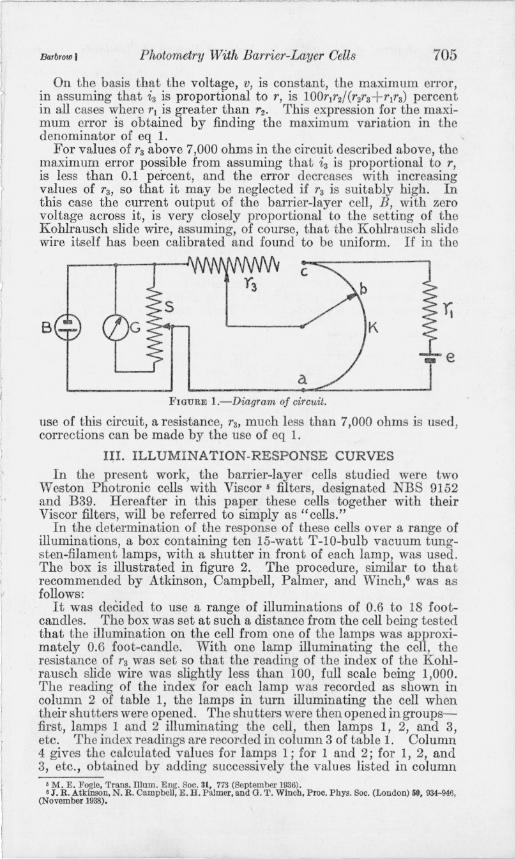
The circuit in which the barrier-layer cell should be used is a currentbalancing circuit giving, in effect, zero external resistance in series with the photocell in a manner recommended by Campbell and Freeth 4 in 1934. The circuit used in the work herein described is illustrated in figure 1. B is the barrier-layer cell; G, a galvanometer of high current sensitivity; S, a suitable galvanometer shunt; K, a Kohlrausch slide wire having resistance r2 (7 ohms) ; e, a 1.5-volt dry cell; r1, a 100-ohm resistance; and r3, a variable resistance, preferably not less than 1,000 ohms. The resistance of the leads from the barrier-layer cell to the galvanometer must be negligibly small. The current generated in the cell as the result of illumination may be balanced by setting the Kohlrausch slide wire, balance being indicated by zero deflection of the galvanometer. Under this condition, the current output of the barrier-layer cell, B, is equal to the current, i 3, in the resistance r3 and is proportional to the potential difference between points a and b, r3 being constant. The potential difference between a and b is nearly proportional to the resistance, r, between points a and b. The degree of approximation involved may be deduced from the following expression for the current, i3:
(1)
in which y =rjr2 and v is the voltage of the dry cell, e. 1 Prociis Verbaux, Comit6 International des Poids et Mesures, p. 223 (1937) . • This luminosity curve represents the luminosity factors adopted in 1024 by the Iuternational Commission
on llIumination, and is known as the ICIluminosity factors (formerly called "visibility factors"). Tbe data on which it is based were reported by K. S. Gibson and E. P. T. Tyndall in Scientific Papers oftbe Bureau of Standards, volume 19, page 131,1923-24 (S475) and, in briefer form, in tbe Transactions of theIJIuminating Engineering Society-,- volume 19, page 176, 1924. See also a comprehensive paper "Spectral LuminOSity Factors," by K. S. uibson, in the Journal of the Optical Society of America, volume 30, page 51, 1940.
a The blue flIters used in accordance with section (b), quoted above, are calibrated bydetermlnlngtheir spectral transmission curves and calculating tbe integral transmission for Iigbt from tbe primary standard by means of the luminosity factors .
• N. R. Campbell and M. K. ,!!'reetb, J. Sci. Instruments 11, 125 (1934).
.1
1
Barbrow I Photometry With Barrier-Layer Oells 705
On the basis that the voltage, v, is constant, the maximum error, in assuming that ia is proportional to r, is 100rlr2/hra+rlra) percent in an cases where rl is greater than r2' This expression for the maximum error is obtained by finding the maximum variation in the denominator of eq 1.
For values of ra above 7,000 ohms in the circuit described above, the maximum error possible from assuming that ia is proportional to r, is less than 0.1 percent, and the error decreases with increasing values of ra, so that it may be neglected if ra is suitably high. In this case the current output of the barrier-layer cell, B, with zero voltage across it, is very closely proportional to the setting of the Kohlrausch slide wire, assuming, of course, that the Kohlrausch slide wire itself has been calibrated and found to be uniform. If in the
B K
FIGURE I.-Diagram oj circuit.
use of this circuit, a r esistance, ra, much less than 7,000 ohms is used, corrections can be made by the use of eq 1.
III. ILLUMINATION-RESPONSE CURVES
In the present work, the barrier-layer cells studied were two Weston Photronic cells with Vise or 6 filters, designated NBS 9152 and B39. Hereafter in this paper these cells together with their Viscor filters, will be referred to simply as "cells."
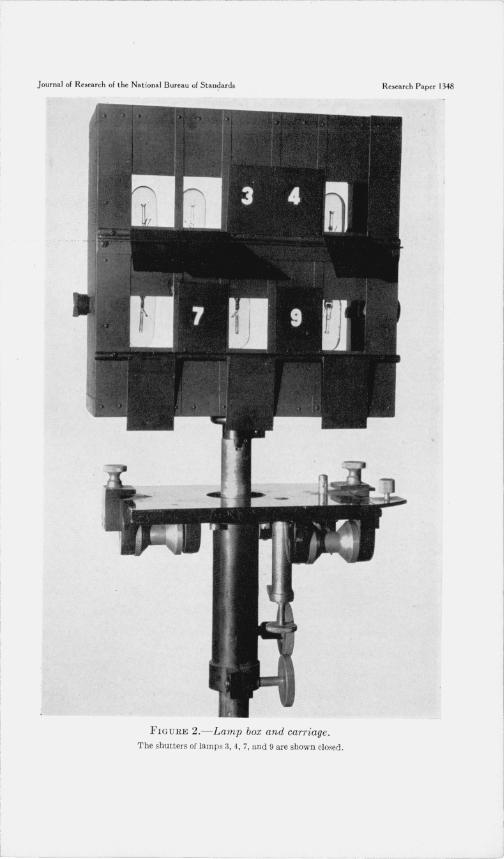
In the determination of the response of these cells over a range of illuminations, a box containing ten IS-watt T-IO-bulb vacuum tungsten-filament lamps, with a shutter in front of each lamp, was used. The box is illustrated in figure 2. The procedure, similar to that recommended by Atkinson, Campbell, Palmer, and Winch,6 was as follows:
It was decided to use a range of illuminations of 0.6 to 18 footcandles. The box was set at such a distance from the cell being tested that the illumination on the cell from one of the lamps was approximately 0.6 foot-candle. With one lamp illuminating the cell, the resistance of ra was set so that the reading of the index of the Kohlrausch slide wire was slightly less than 100, full scale being 1,000. The reading of the index for each lamp was recorded as shown in column 2 of table 1, the lamps in turn illuminating the cell when their shutters were opened. The shutters were then opened in groupsfirst, lamps 1 and 2 illuminating the cell, then lamps 1, 2, and 3, etc. The index readings are recorded in column 3 of table 1. Column 4 gives the calculated values for lamps 1; for 1 and 2; for 1, 2, and 3, etc., obtained by adding successively the values listed in column
'M. E. Fogle, Trans. IlIum. Eng. Soc. 3t, 773 (September 1936), • J. R. Atkinson, N. R. Campbell, E. H. Palmer, and G. T. Winch, Proc. Phys. Soc. (London) 50, 934-946,
(November 1938).
706 J ournal oj Research oj the National Bureau oj Standards [Vol. £6
TABLE I.-Data for determining response curve of barrier-layer cell NBS 9152
Lamp number
L __________________________________ . __ . __ ._. __ 2 __ •• ___ •••• • •••• ____ ._ • • •• _. ____ ••••••• __ ••••• 3 ... _ •.. ___ ._ ..... ____________________________ _ 4. _._. ____ . ___ ._. _______ . ____ _ . _____ . _________ . 5 __ • __ • ______ .. _ .. _____ .. __ . ______ ... _ .. ____ ._.
6. _ ... _._ . __ . _____ ..... _____ . _______ ._._ ... ___ _ 7 __ . __ . ________ __ ._. _________ .. __ . ______ ._._ ... 8 __ . _. _____ . __ . _. _. ____ . ____ ... __ . __ . __ .... ___ _ g-_._ .. .. _ ... _ ...• _ ... _---_.- .. _ ..... _ . .. _._ ... 10_. __ . . _._ .. _. ____ . ____ .. _ .... _ .. __ • _____ . __ ..
Kohlrausch slide wire settings
1----,--- calc~~ted Single lamp
95.6 98.0 90. 1 92.2 98. 0
91.6 86. 1 97.3 96.4 95.2
95.6 194.4 285. a 377. 8 476.1
568.2 654.7 751. 8 848.1 942.8
95.6 193.6 283.7 375.9 473.9
565.5 651. 6 748.9 845.3 940.5
Percent 0 0 .8 .41
1.6 .56 1.9 .50 2.2 .46
2.7 .48 3.1 .48 2.9 .39 2.8 .33 2.3 .24
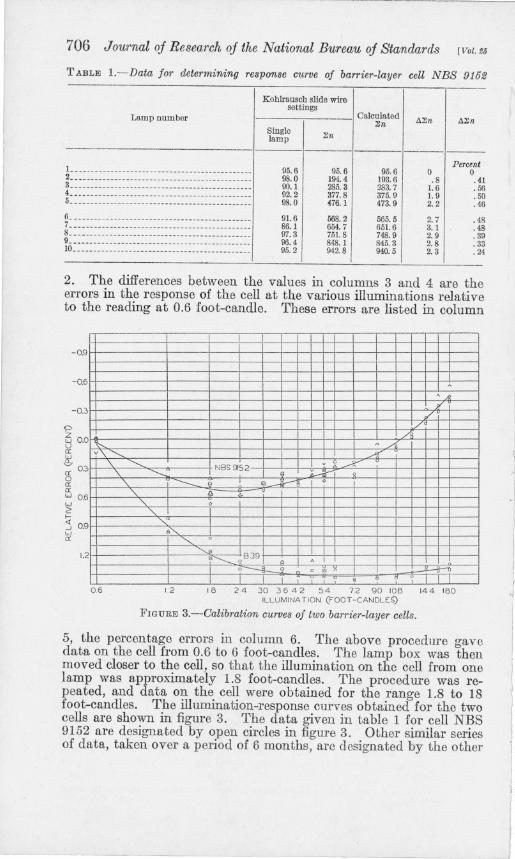
2. The differences between the values in columns 3 and 4 are the errors in the response of the cell at the various illuminations relative to the reading at 0.6 foot-candle. These errors are listed in column
-09
-0.6
-0.3
'P ~ 0.0 u a: I:t ~03 o a: a: W O. w > ;::
6
:s 0.9 w a:
2
~
~
j(
./ A
~ ~ A v'\~ ~
'\ "'"- NBS 9152 • 2 ...-lr '\ -......... ~ v.-1i-
'\ ---- 0 " d:::::::: 0
"- &!. v
"- 0
" 8'----'""- 0
"" BJ9 B'-....... 0 Q . 0_ 0 0 " ~ J--
• " 0
06 1.2 18 24 30 3642 54 72 90 108 144 180 ILLUMINA TION (FOOT -CANOLES)
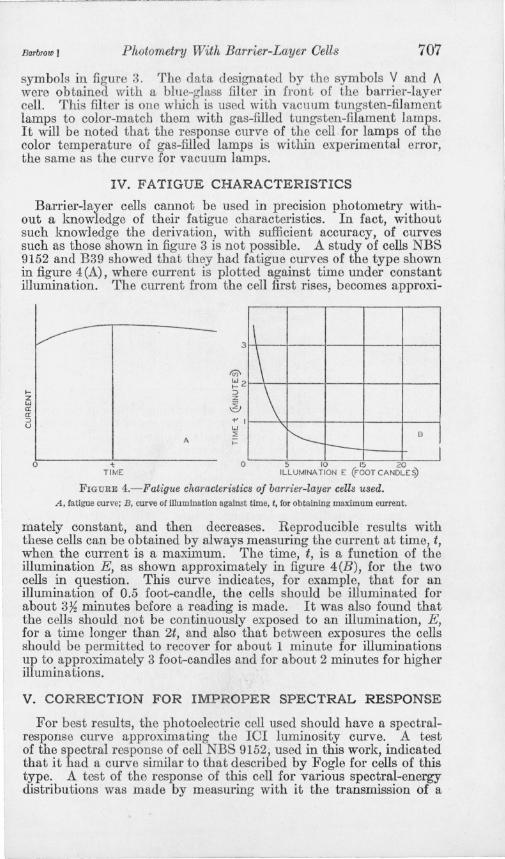
FIGURE 3.- Calibration curves of two barrier-layer cells.
5, the percentage errors in column 6. The above procedure gave data on the cell from 0.6 to 6 foot-candles. The lamp box was then moved closer to the cell, so that the illumination on the cell from one lamp was approximately 1.8 foot-candles. The procedure was repeated, and data on the cell were obtained for the range 1.8 to 18 foot-candles. The illumination-response curves obtained for the two cells are shown in figure 3. The data given in table 1 for cell NBS 9152 are designated by open circles in figure 3. Other similar series of data, taken over a period of 6 months, are designated by the other
-/
Journal of Research of the National Bureau of Sta n?ards Research Paper 1348
FICURE 2.- Lamp box and carriage. The shutters of lamps 3, 4, 7, and 9 are shown closed.
BarbTOW) Photometry With Barrier-Layer Cells 707
symbols in figure 3. The data designated by the symbols V and A were obtained with a blue-glass filter in front of the barrier-layer cell. This filter is one which is used with vacuum tungsten-filament lamps to color-match them with gas-filled tungsten-filament lamps. It will be noted that the response curve of the cell for lamps of the color temperature of gas-filled lamps is within experimental error, the same as the curve for vacuum lamps.
IV. FATIGUE CHARACTERISTICS
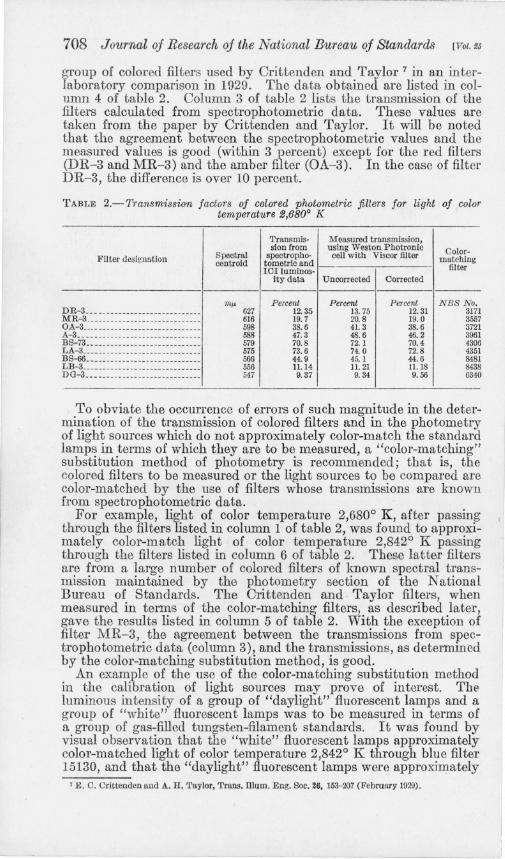
Barrier-layer cells cannot be used in precision photometry without a lmowledge of their fatigue characteristics. In fact, without such lmowledge the derivation, with sufficient accuracy, of curves such as those shown in figure 3 is not possible. A study of cells NBS 9152 and B39 showed that they had fatigue curves of the type shown in figure 4 (A), where current is plotted against time under constant illumination. The current from the cell first rises, becomes approxi-
... z w a: a: ::> u
o
\
\ 3
I \ I'--- B
r--I
A
-t 0 5 10 15 2 0 TIME ILLUMINATION E (FOOT CANDLES)
FIGURE 4.-Fatigue characteristics of barrier-layer cells used. A, fatigue curve; B, curve of illumination against time, t, for obtaining maximum current.
mately constant, and then decreases. Reproducible results with these cells can be obtained by always measuring the current at time, t, when the current is a maximum. The time, t, is a function of the illumination E, as shown approximately in figure 4(B), for the two cells in question. This curve indicates, for example, that for an illumination of 0.5 foot-candle, the cells should be illuminated for about 37f minutes before a reading is made. It was also found that the cells should not be continuously exposed to an illumination, E, for a time longer than 2t, and also that between exposures the cells should be permitted to recover for about 1 minute for illuminations up to approximately 3 foot-candles and for about 2 minutes for higher illuminations.
v. CORRECTION FOR IMPROPER SPECTRAL RESPONSE
For best results, the photoelectric cell used should have a spectralresponse curve approximating the 10 1 luminosity curve. A test of the spectral response of cell NBS 9152, used in this work, indicated that it had a curve similar to that described by Fogle for cells of this type. A test of the response of this cell for various spectral-energy distributions was made by measuring with it the transmission of a
708 Journal oj Research oj the National Bureau oj Standards [Vol. S5
group of colored filters used by Crittenden and Taylor 7 in an interlaboratory comparison in 1929. The data obtained are listed in column 4 of table 2. Column 3 of table 2 lists the transmission of the filters calculated from spectrophotometric data. These values are taken from the paper by Crittenden and Taylor. It will be noted that the agreement between the spectrophotometric values and the measured values is good (within 3 percent) except for the red filters (DR-3 and MR-3) and the amber filter (OA-3). In the case of filter DR-3, the difference is over 10 percent.
TABLE 2.-Transmission factol's of colored photometric filters for light of color temperature 2,680° K
Transmis· Measured transmission, sian from using Weston Photronic Oolor-
Filter designation Spectral spectropho- cell with Viscor filter matching centroid tometric and IOIluminos- filter
ity data Uncorrected Corrected
ml' Percent Percelll Percent NBS No. DR-3 ___ ____ __ ________ ______ ___ __ _ 627 12.35 13.75 12.31 3171 MR-3 __ ____ ____ _____ ___ ___ ___ _____ 616 19.7 20.8 19.0 3557 OA-3 _____ _________ _______ ___ ____ __ 598 38.6 41. 3 38.6 3721 A-3 _____ _______ ______ ______ _______ 588 47.3 48.6 46.2 3961 BS-73 _____ ___ ____ __ ______ ___ ______ 579 70.8 72.1 70.4 4306 LA-3 ______ ________ _____ ___ _______ _ 575 73.6 74. 0 72.8 4351
BS~6 _____ ________ ________________ 566 44.9 45.1 44.6 8481 LB-3 __ ____ ____ __ ______ __ __________ 556 11.14 11. 21 11.18 8438 DO-3 _____ ___ ___ __ __________ ______ 547 9.37 9.34 9.56 6340
To obviate the occurrence of errors of such magnitude in the determination of the transmission of colored filters and in the photometry of light sources which do not approximately color-match the standard lamps in terms of which they are to be measured, a "color-matching" substitution method of photometry is recommended; that is, the colored filters to be measured or the light sources to be compared are color-matched by the use of filters whose transmissions are known from spectrophotometric data.
For example, light of color temperature 2,680° K, after passing through the filters listed in column 1 of table 2, was found to approximately color-match light of color temperature 2,842° K passing through the filters listed in column 6 of table 2. These latter filters are from a large number of colored filters of known spectral transmission maintained by the photometry section of the National Bureau of Standards. The Crittenden and · Taylor filters, when measured in terms of the color-matchin~ filters, as described later, gave the results listed in column 5 of table 2. With the exception of filter MR-3, the agreement between the transmissions from spectrophotometric data (column 3), and the transmissions, as determined by the color-matching substitution method, is good.
An example of the use of the color-matching substitution method in the calibration of light sources may prove of interest. Th(> luminous intensity of a group of "daylight" fluorescent lamps and a group of "white" fluorescent lamps was to be measured in terms of a group of gas-filled tungsten-filament standards. It was found by visual observation that the "white" fluorescent lamps approximately color-matched light of color temperature 2,842° K through blue filter 15130, and that the "daylight" fluorescent lamps were approximately
1 E. O. Orittenden and A. H. Taylor, Trans. Dlum. Eng. Soc. 26, 153-207 (February 1929).
Barbrow) Photometry With Barrier-Layer Cells 709
color-matched by light of color temperature 2,842° K through blue filters 8438, 8456, and 8331 separately. Filter 8438 was slightly too blue and filters 8456 and 8331 were not quite blue enough. The barrier-layer cell used was found to measure the transmission of filter 15130 correctly to within 0.1 percent and that of filters 8438, 8456, and 8331 low by an average of 0.6 percent. The results obtained on the "daylight" fluorescent lamps measured directly against the gasfilled tungsten standards were therefore increased by 0.6 percent; no corrections were applied to the results obtained on the "white" fluorescent lamps. Although this method of correction for color differences does not take into account the differences in spectral distribution of the somces being compared (even though a color match prevails), it is felt that the method obviates large errors except, perhaps, where extreme differences in spectral distribution remain. As photoelectric cells become obtainable which, with or without filters, more closely approximate in spectral response the ICI luminosity cmve, the corrections for color differences will become progressively smaller.
The procedure outlined above was also used in the measurement of the luminous intensity of a group of vacuum tungsten-filament lamps at color temperatme 2,360° K and of a group of gas-filled tungsten-filament lamps at 2,727° K, both in terms of a group of carbon-filament lamps at 2,045° K. Blue-glass filter 15130 was used as the color-matching filter in stepping from 2,045° to 2,360° K, and again in stepping from 2,360° to 2,727° K. The average candlepower of each group of lamps determined photoelectrically by the method outlined above is given in column 2 of table 3. The values assigned to the lamps by other methods are given in column 3. The value for the vacuum tungsten-filament lamps listed in column 3 was obtained by visual photometry, using the blue-glass method recommended by the International Committee of Weights and Measures. The value for the gas-filled tungsten-filament lamps listed in column 3 is an average of two values, one obtained by using the blue-glass method recommended by the International Committee of Weights and Measmes and the other obtained by comparison with a black body at 2,727° K,B the brightness of the black body at this temperature having been calculated from that at 2,046° K by means of the luminosity factors.
TABLE a.-Calibration of vacuum and gas-filled incandescent lamps
Color temperature of
lamps
OK 2,3(;0 2,727
Candles
Pbotoeleo- Assigoetl trically
23. 63 2Zl.5
23.83 230.2
The difference between the assigned values on these lamps and those obtained photoelectrically are of the order of 1 percent, and can probably be accounted for on the basis of the spectral difference between the radiant energy of higher color temperature and that of lower
8 H. T. Wensel, Wm. F. Roeser, L. E. Barbrow, and F. R. Caldwell, J. Research NBS 13, 161-168 (1934) RP 699.
L
-~~ - ~ - ~~-~~~~----------
710 Journal of Research oj the National Bureau of Standards [Vol. t6
color temperature as transmitted by the blue filter, even though a color match exists.
VI. CONCLUSION
It is felt that the procedure outlined in this paper is applicable to photoelectric photometry generally. Obviously, the curves and data given in this paper do not necessarily apply to barrier-layer cells other than those tested, even if they are of the same type. If the characteristics of the particular photoelectric cell used are determined, and if corrections for color differences are made as recommended above, it is felt that the photometric results obtained will be more consistent and possibly more accurate than those obtained by any direct visual procedure. The accuracy obtainable by following the method proposed will increase as photoelectric cells and correcting filters become available which more closely approximate the leI luminosity curve.
WASHINGTON, August 19, 1940.


