Section 3.5 Graphing Linear Equations in Slope-Intercept Form 135
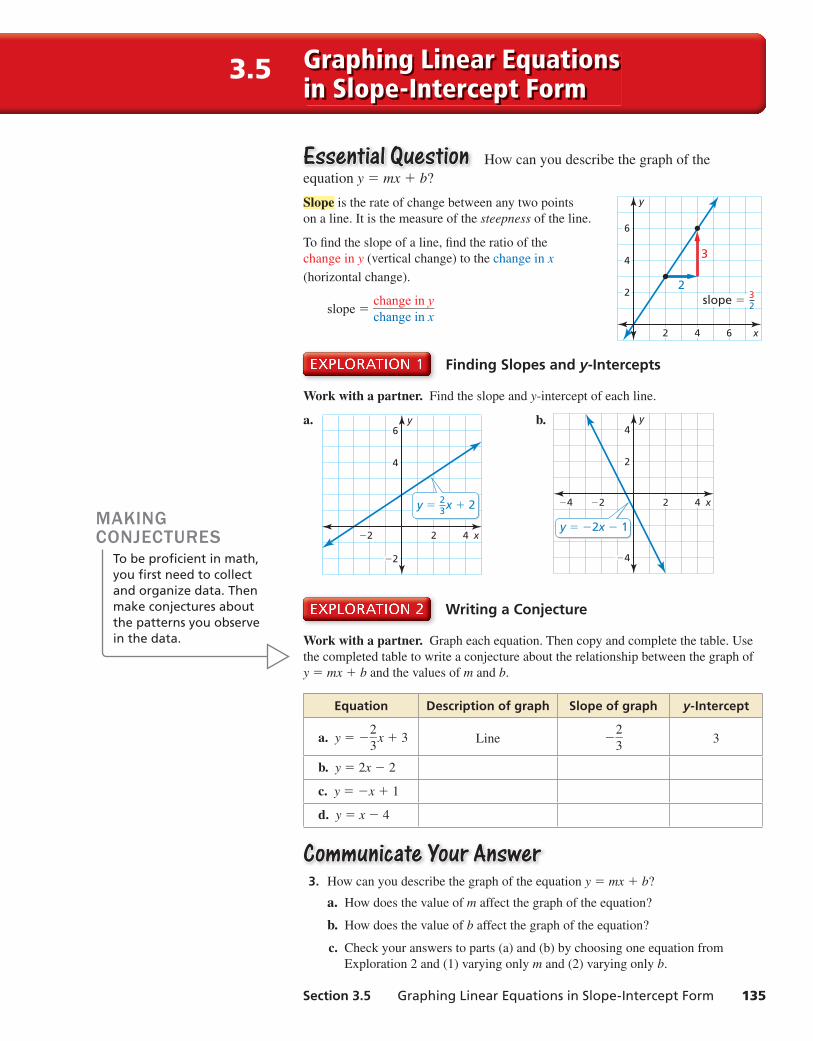
Essential QuestionEssential Question How can you describe the graph of the
equation y = mx + b?
Slope is the rate of change between any two points
on a line. It is the measure of the steepness of the line.
To fi nd the slope of a line, fi nd the ratio of the
change in y (vertical change) to the change in x
(horizontal change).
slope = change in y — change in x
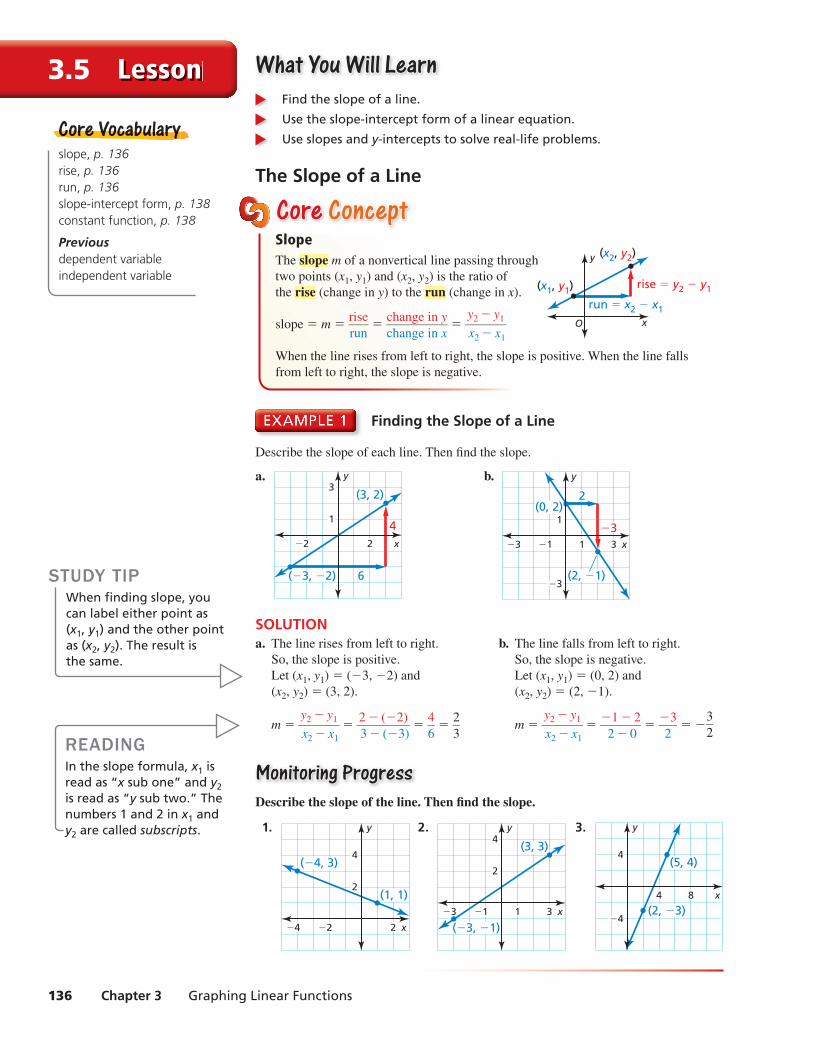
Finding Slopes and y-Intercepts
Work with a partner. Find the slope and y-intercept of each line.
a.
x
y
4
6
−2
42−2
y = x + 223
b.
x
y4
2
−4
42−2−4
y = −2x − 1
Writing a Conjecture
Work with a partner. Graph each equation. Then copy and complete the table. Use
the completed table to write a conjecture about the relationship between the graph of
y = mx + b and the values of m and b.
Equation Description of graph Slope of graph y-Intercept
a. y = − 2 —
3 x + 3 Line −
2 —
3 3
b. y = 2x − 2
c. y = −x + 1
d. y = x − 4
Communicate Your AnswerCommunicate Your Answer 3. How can you describe the graph of the equation y = mx + b?
a. How does the value of m affect the graph of the equation?
b. How does the value of b affect the graph of the equation?
c. Check your answers to parts (a) and (b) by choosing one equation from
Exploration 2 and (1) varying only m and (2) varying only b.
MAKING CONJECTURES
To be profi cient in math, you fi rst need to collect and organize data. Then make conjectures about the patterns you observe in the data.
x
y
4
2
6
42 6
3
slope = 32
2
Graphing Linear Equations in Slope-Intercept Form
3.5
alg1_ch3 book.indb 135alg1_ch3 book.indb 135 7/11/17 10:52 AM7/11/17 10:52 AM
136 Chapter 3 Graphing Linear Functions
3.5 Lesson What You Will LearnWhat You Will Learn Find the slope of a line.
Use the slope-intercept form of a linear equation.
Use slopes and y-intercepts to solve real-life problems.
The Slope of a Lineslope, p. 136rise, p. 136run, p. 136slope-intercept form, p. 138constant function, p. 138
Previous dependent variableindependent variable
Core VocabularyCore Vocabullarry
Core Core ConceptConceptSlopeThe slope m of a nonvertical line passing through
two points (x1, y1) and (x2, y2) is the ratio of
the rise (change in y) to the run (change in x).
slope = m = rise
— run
= change in y
— change in x
= y2 − y1
— x2 − x1
When the line rises from left to right, the slope is positive. When the line falls
from left to right, the slope is negative.
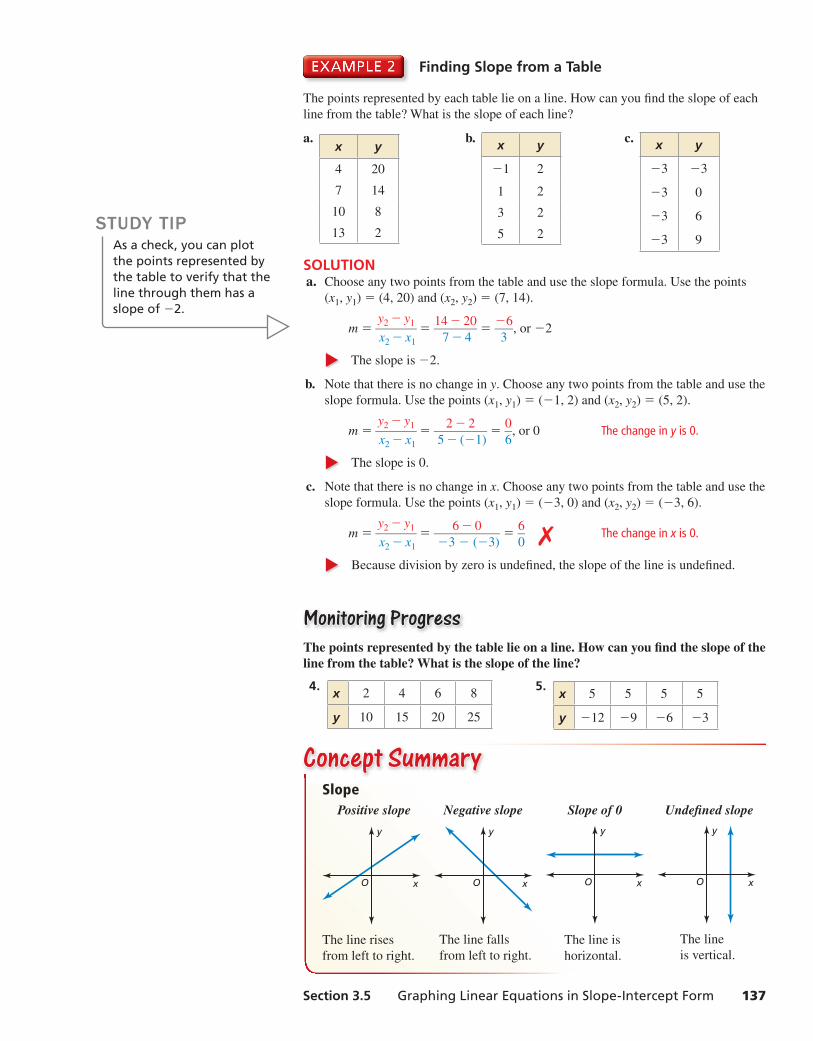
Finding the Slope of a Line
Describe the slope of each line. Then fi nd the slope.
a.
x
y3
1
2−2
4
6(−3, −2)
(3, 2)
b.
x
y
1
−3
31−1−3
(0, 2)
(2, −1)
2
−3
SOLUTION
x
y
(x1, y1)
run = x2 − x1
rise = y2 − y1
(x2, y2)
O
a. The line rises from left to right.
So, the slope is positive.
Let (x1, y1) = (−3, −2) and
(x2, y2) = (3, 2).
m = y2 − y1
— x2 − x1
= 2 − (−2)
— 3 − (−3)
= 4 —
6 =
2 —
3
b. The line falls from left to right.
So, the slope is negative.
Let (x1, y1) = (0, 2) and
(x2, y2) = (2, −1).
m = y2 − y1
— x2 − x1
= −1 − 2 — 2 − 0
= −3
— 2 = −
3 —
2
Monitoring ProgressMonitoring Progress
Describe the slope of the line. Then fi nd the slope.
1.
x
y
2
4
2−2−4
(−4, 3)
(1, 1)
2.
x
y4
2
31−1−3
(−3, −1)
(3, 3)
3.
x
y
4
−4
4 8
(2, −3)
(5, 4)
STUDY TIPWhen fi nding slope, you can label either point as (x1, y1) and the other point as (x2, y2). The result is the same.
READINGIn the slope formula, x1 is read as “x sub one” and y2 is read as “y sub two.” The numbers 1 and 2 in x1 and y2 are called subscripts.
alg1_ch3 book.indb 136alg1_ch3 book.indb 136 7/11/17 10:52 AM7/11/17 10:52 AM
Section 3.5 Graphing Linear Equations in Slope-Intercept Form 137
Finding Slope from a Table
The points represented by each table lie on a line. How can you fi nd the slope of each
line from the table? What is the slope of each line?
a. x y
4 20
7 14
10 8
13 2
b. x y
−1 2
1 2
3 2
5 2
c. x y
−3 −3
−3 0
−3 6
−3 9
SOLUTION a. Choose any two points from the table and use the slope formula. Use the points
(x1, y1) = (4, 20) and (x2, y2) = (7, 14).
m = y2 − y1
— x2 − x1
= 14 − 20
— 7 − 4
= −6
— 3 , or −2
The slope is −2.
b. Note that there is no change in y. Choose any two points from the table and use the
slope formula. Use the points (x1, y1) = (−1, 2) and (x2, y2) = (5, 2).
m = y2 − y1
— x2 − x1
= 2 − 2 —
5 − (−1) =
0 —
6 , or 0 The change in y is 0.
The slope is 0.
c. Note that there is no change in x. Choose any two points from the table and use the
slope formula. Use the points (x1, y1) = (−3, 0) and (x2, y2) = (−3, 6).
m = y2 − y1
— x2 − x1
= 6 − 0 —
−3 − (−3) =
6 —
0 ✗ The change in x is 0.
Because division by zero is undefi ned, the slope of the line is undefi ned.
Monitoring ProgressMonitoring Progress
The points represented by the table lie on a line. How can you fi nd the slope of the line from the table? What is the slope of the line?
4. x 2 4 6 8
y 10 15 20 25
5. x 5 5 5 5
y −12 −9 −6 −3
STUDY TIPAs a check, you can plot the points represented by the table to verify that the line through them has a slope of −2.
Slope Positive slope Negative slope Slope of 0 Undefi ned slope
y
xO
y
xO
y
xO
y
xO
The line rises
from left to right.
The line falls
from left to right.
The line is
horizontal.
The line
is vertical.
Concept SummaryConcept Summary
alg1_ch3 book.indb 137alg1_ch3 book.indb 137 7/11/17 10:52 AM7/11/17 10:52 AM
138 Chapter 3 Graphing Linear Functions
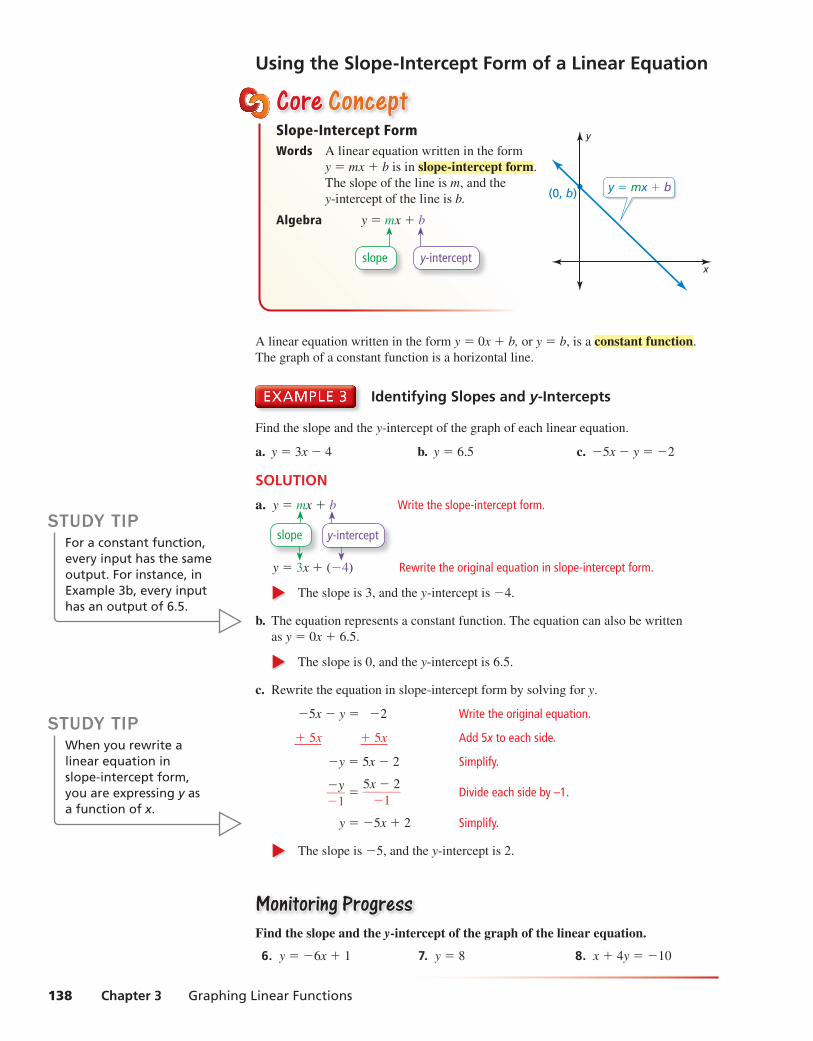
Using the Slope-Intercept Form of a Linear Equation
Core Core ConceptConceptSlope-Intercept FormWords A linear equation written in the form
y = mx + b is in slope-intercept form.
The slope of the line is m, and the
y-intercept of the line is b.
Algebra y = mx + b
x
y
(0, b) y = mx + b
slope y-intercept
A linear equation written in the form y = 0x + b, or y = b, is a constant function.
The graph of a constant function is a horizontal line.
Identifying Slopes and y-Intercepts
Find the slope and the y-intercept of the graph of each linear equation.
a. y = 3x − 4 b. y = 6.5 c. −5x − y = −2
SOLUTION
a. y = mx + b Write the slope-intercept form.
y = 3x + (−4) Rewrite the original equation in slope-intercept form.
The slope is 3, and the y-intercept is −4.
b. The equation represents a constant function. The equation can also be written
as y = 0x + 6.5.
The slope is 0, and the y-intercept is 6.5.
c. Rewrite the equation in slope-intercept form by solving for y.
−5x − y = −2 Write the original equation.
+ 5x + 5x Add 5x to each side.
−y = 5x − 2 Simplify.
−y
— −1
= 5x − 2 — −1
Divide each side by –1.
y = −5x + 2 Simplify.
The slope is −5, and the y-intercept is 2.
Monitoring ProgressMonitoring Progress
Find the slope and the y-intercept of the graph of the linear equation.
6. y = −6x + 1 7. y = 8 8. x + 4y = −10
STUDY TIPFor a constant function, every input has the same output. For instance, in Example 3b, every input has an output of 6.5.
STUDY TIPWhen you rewrite a linear equation in slope-intercept form, you are expressing y as a function of x.
slope y-intercept
alg1_ch3 book.indb 138alg1_ch3 book.indb 138 7/11/17 10:52 AM7/11/17 10:52 AM
Section 3.5 Graphing Linear Equations in Slope-Intercept Form 139
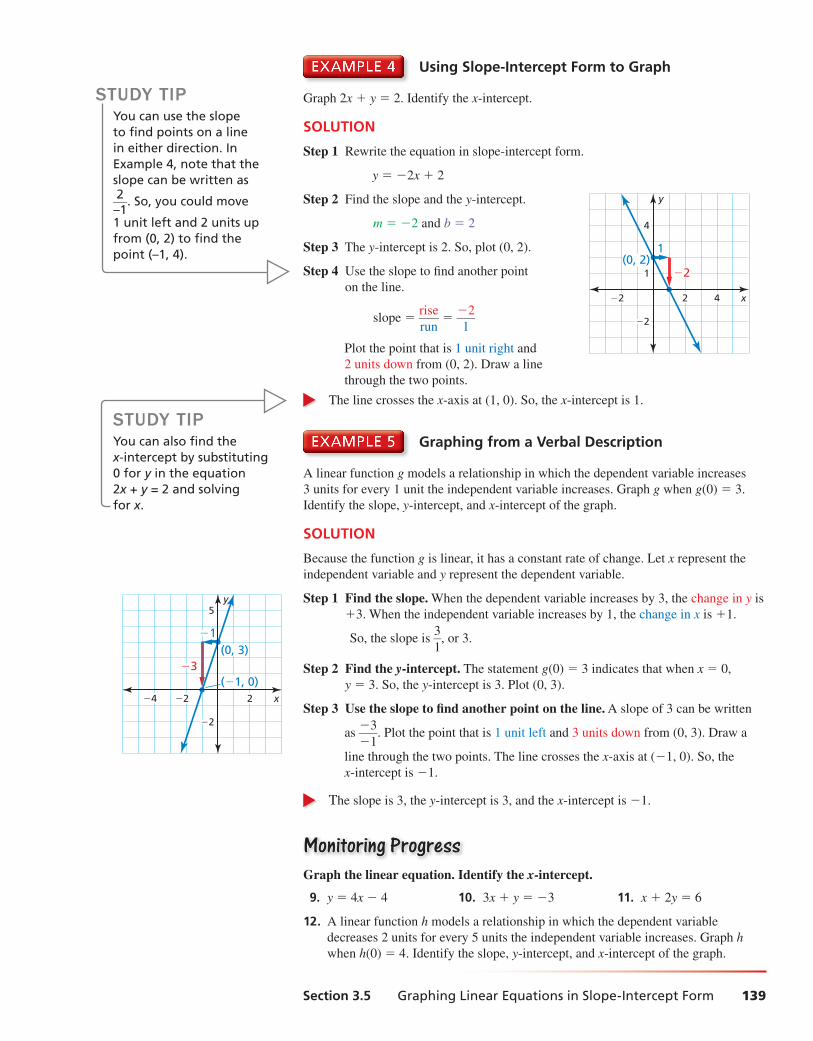
Using Slope-Intercept Form to Graph
Graph 2x + y = 2. Identify the x-intercept.
SOLUTION
Step 1 Rewrite the equation in slope-intercept form.
y = −2x + 2
Step 2 Find the slope and the y-intercept.
m = −2 and b = 2
Step 3 The y-intercept is 2. So, plot (0, 2).
Step 4 Use the slope to fi nd another point
on the line.
slope = rise
— run
= −2
— 1
Plot the point that is 1 unit right and
2 units down from (0, 2). Draw a line
through the two points.
The line crosses the x-axis at (1, 0). So, the x-intercept is 1.
x
y
4
1
−2
42−2
(0, 2)1
−2
STUDY TIPYou can use the slope to fi nd points on a line in either direction. In Example 4, note that the slope can be written as 2 — –1
. So, you could move
1 unit left and 2 units up from (0, 2) to fi nd the point (–1, 4).
STUDY TIPYou can also fi nd the x-intercept by substituting 0 for y in the equation 2x + y = 2 and solving for x.
x
y5
−2
2−2−4
(0, 3)
(−1, 0)
−1
−3
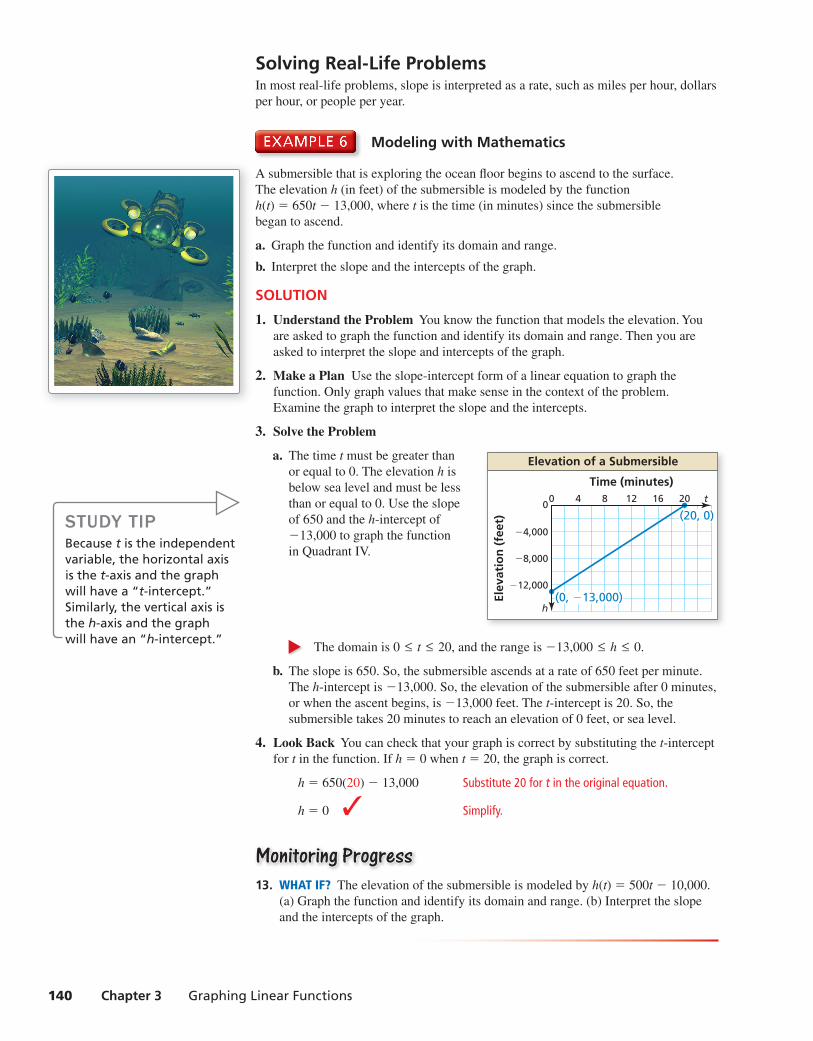
Graphing from a Verbal Description
A linear function g models a relationship in which the dependent variable increases
3 units for every 1 unit the independent variable increases. Graph g when g(0) = 3.
Identify the slope, y-intercept, and x-intercept of the graph.
SOLUTION
Because the function g is linear, it has a constant rate of change. Let x represent the
independent variable and y represent the dependent variable.
Step 1 Find the slope. When the dependent variable increases by 3, the change in y is
+3. When the independent variable increases by 1, the change in x is +1.
So, the slope is 3 —
1 , or 3.
Step 2 Find the y-intercept. The statement g(0) = 3 indicates that when x = 0,
y = 3. So, the y-intercept is 3. Plot (0, 3).
Step 3 Use the slope to fi nd another point on the line. A slope of 3 can be written
as −3
— −1
. Plot the point that is 1 unit left and 3 units down from (0, 3). Draw a
line through the two points. The line crosses the x-axis at (−1, 0). So, the
x-intercept is −1.
The slope is 3, the y-intercept is 3, and the x-intercept is −1.
Monitoring ProgressMonitoring Progress
Graph the linear equation. Identify the x-intercept.
9. y = 4x − 4 10. 3x + y = −3 11. x + 2y = 6
12. A linear function h models a relationship in which the dependent variable
decreases 2 units for every 5 units the independent variable increases. Graph h
when h(0) = 4. Identify the slope, y-intercept, and x-intercept of the graph.
alg1_ch3 book.indb 139alg1_ch3 book.indb 139 7/11/17 10:52 AM7/11/17 10:52 AM
140 Chapter 3 Graphing Linear Functions
Solving Real-Life ProblemsIn most real-life problems, slope is interpreted as a rate, such as miles per hour, dollars
per hour, or people per year.
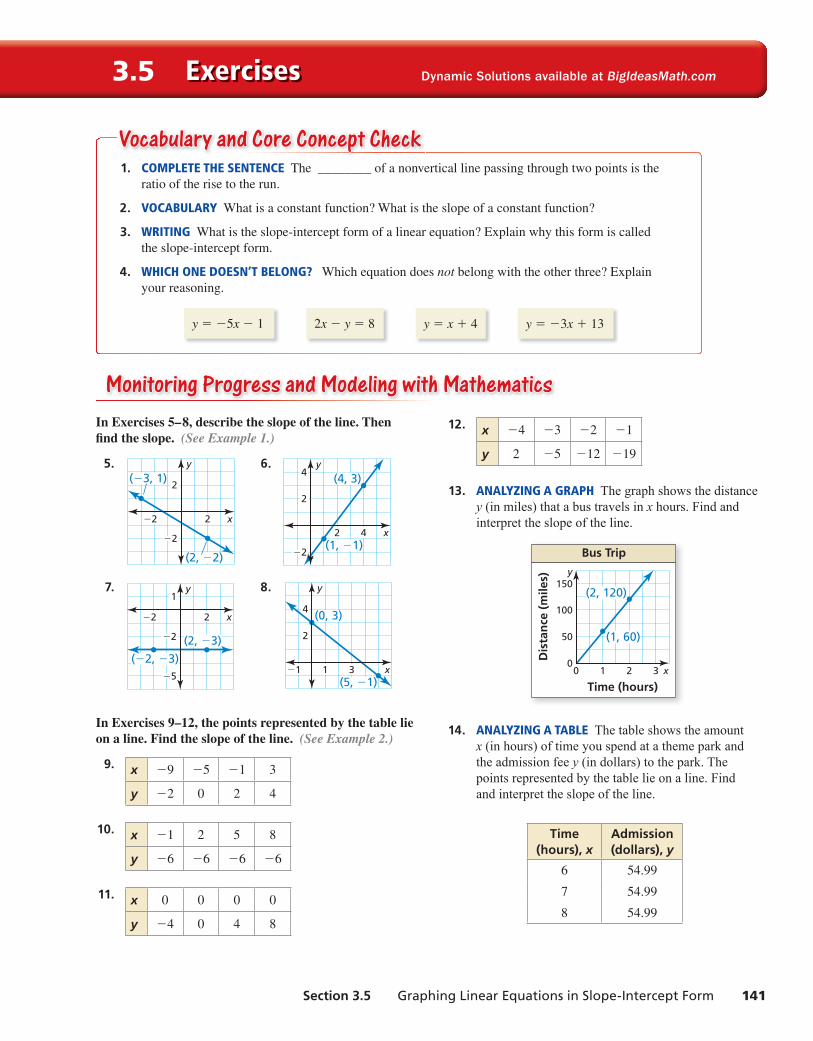
Modeling with Mathematics
A submersible that is exploring the ocean fl oor begins to ascend to the surface.
The elevation h (in feet) of the submersible is modeled by the function
h(t) = 650t − 13,000, where t is the time (in minutes) since the submersible
began to ascend.
a. Graph the function and identify its domain and range.
b. Interpret the slope and the intercepts of the graph.
SOLUTION
1. Understand the Problem You know the function that models the elevation. You
are asked to graph the function and identify its domain and range. Then you are
asked to interpret the slope and intercepts of the graph.
2. Make a Plan Use the slope-intercept form of a linear equation to graph the
function. Only graph values that make sense in the context of the problem.
Examine the graph to interpret the slope and the intercepts.
3. Solve the Problem
a. The time t must be greater than
or equal to 0. The elevation h is
below sea level and must be less
than or equal to 0. Use the slope
of 650 and the h-intercept of
−13,000 to graph the function
in Quadrant IV.
The domain is 0 ≤ t ≤ 20, and the range is −13,000 ≤ h ≤ 0.
b. The slope is 650. So, the submersible ascends at a rate of 650 feet per minute.
The h-intercept is −13,000. So, the elevation of the submersible after 0 minutes,
or when the ascent begins, is −13,000 feet. The t-intercept is 20. So, the
submersible takes 20 minutes to reach an elevation of 0 feet, or sea level.
4. Look Back You can check that your graph is correct by substituting the t-intercept
for t in the function. If h = 0 when t = 20, the graph is correct.
h = 650(20) − 13,000 Substitute 20 for t in the original equation.
h = 0 ✓ Simplify.
Monitoring ProgressMonitoring Progress
13. WHAT IF? The elevation of the submersible is modeled by h(t) = 500t − 10,000.
(a) Graph the function and identify its domain and range. (b) Interpret the slope
and the intercepts of the graph.
Elevation of a Submersible
Elev
atio
n (
feet
)0
−12,000
−8,000
−4,000
Time (minutes)40 8 12 16 t
h
20
(20, 0)
(0, −13,000)
STUDY TIPBecause t is the independent variable, the horizontal axis is the t-axis and the graph will have a “t-intercept.” Similarly, the vertical axis is the h-axis and the graph will have an “h-intercept.”
alg1_ch3 book.indb 140alg1_ch3 book.indb 140 7/11/17 10:52 AM7/11/17 10:52 AM
Section 3.5 Graphing Linear Equations in Slope-Intercept Form 141
1. COMPLETE THE SENTENCE The ________ of a nonvertical line passing through two points is the
ratio of the rise to the run.
2. VOCABULARY What is a constant function? What is the slope of a constant function?
3. WRITING What is the slope-intercept form of a linear equation? Explain why this form is called
the slope-intercept form.
4. WHICH ONE DOESN’T BELONG? Which equation does not belong with the other three? Explain
your reasoning.
y = −5x − 1 2x − y = 8 y = x + 4 y = −3x + 13
Exercises3.5
Vocabulary and Core Concept CheckVocabulary and Core Concept Check
In Exercises 5–8, describe the slope of the line. Then fi nd the slope. (See Example 1.)
5.
x
y
2
−2
2−2
(−3, 1)
(2, −2)
6.
x
y4
2
−2
2 4
(4, 3)
(1, −1)
7.
x
y1
−2
−5
2−2
(−2, −3)
(2, −3)
8.
x
y
2
4
31−1
(0, 3)
(5, −1)
In Exercises 9–12, the points represented by the table lie on a line. Find the slope of the line. (See Example 2.)
9. x −9 −5 −1 3
y −2 0 2 4
10. x −1 2 5 8
y −6 −6 −6 −6
11. x 0 0 0 0
y −4 0 4 8
12. x −4 −3 −2 −1
y 2 −5 −12 −19
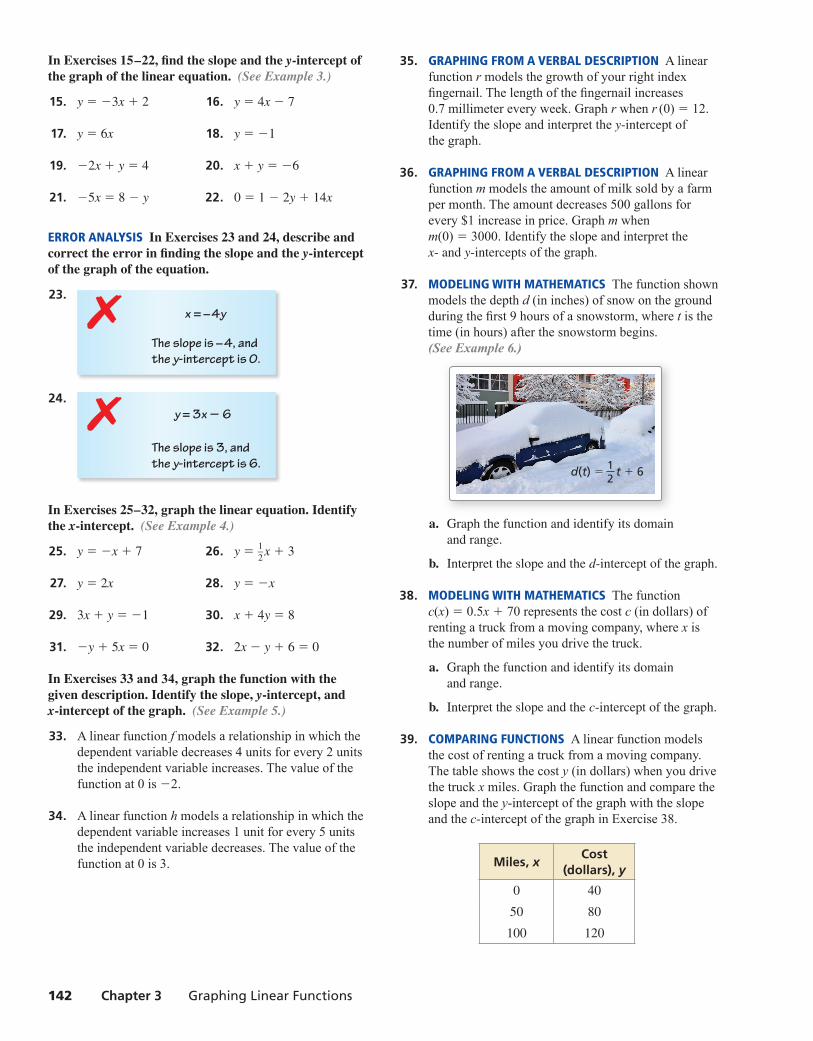
13. ANALYZING A GRAPH The graph shows the distance y (in miles) that a bus travels in x hours. Find and interpret the slope of the line.
Bus TripD
ista
nce
(m
iles)
0
50
100
150y
Time (hours)10 2 3 x
(1, 60)
(2, 120)
14. ANALYZING A TABLE The table shows the amount x (in hours) of time you spend at a theme park and the admission fee y (in dollars) to the park. The points represented by the table lie on a line. Find and interpret the slope of the line.
Time (hours), x
Admission (dollars), y
6 54.99
7 54.99
8 54.99
Monitoring Progress and Modeling with MathematicsMonitoring Progress and Modeling with Mathematics
Dynamic Solutions available at BigIdeasMath.com
alg1_ch3 book.indb 141alg1_ch3 book.indb 141 7/11/17 10:52 AM7/11/17 10:52 AM
142 Chapter 3 Graphing Linear Functions
In Exercises 15–22, fi nd the slope and the y-intercept of the graph of the linear equation. (See Example 3.)
15. y = −3x + 2 16. y = 4x − 7
17. y = 6x 18. y = −1
19. −2x + y = 4 20. x + y = −6
21. −5x = 8 − y 22. 0 = 1 − 2y + 14x
ERROR ANALYSIS In Exercises 23 and 24, describe and correct the error in fi nding the slope and the y-intercept of the graph of the equation.
23.
x = –4y
The slope is –4, and
the y-intercept is 0.
✗
24. y = 3x − 6
The slope is 3, and
the y-intercept is 6.
✗
In Exercises 25–32, graph the linear equation. Identify the x-intercept. (See Example 4.)
25. y = −x + 7 26. y = 1 —
2 x + 3
27. y = 2x 28. y = −x
29. 3x + y = −1 30. x + 4y = 8
31. −y + 5x = 0 32. 2x − y + 6 = 0
In Exercises 33 and 34, graph the function with the given description. Identify the slope, y-intercept, and x-intercept of the graph. (See Example 5.)
33. A linear function f models a relationship in which the dependent variable decreases 4 units for every 2 units the independent variable increases. The value of the function at 0 is −2.
34. A linear function h models a relationship in which the dependent variable increases 1 unit for every 5 units the independent variable decreases. The value of the function at 0 is 3.
35. GRAPHING FROM A VERBAL DESCRIPTION A linear function r models the growth of your right index fi ngernail. The length of the fi ngernail increases 0.7 millimeter every week. Graph r when r (0) = 12. Identify the slope and interpret the y-intercept of the graph.
36. GRAPHING FROM A VERBAL DESCRIPTION A linear function m models the amount of milk sold by a farm per month. The amount decreases 500 gallons for every $1 increase in price. Graph m when m(0) = 3000. Identify the slope and interpret thex- and y-intercepts of the graph.
37. MODELING WITH MATHEMATICS The function shown models the depth d (in inches) of snow on the ground during the fi rst 9 hours of a snowstorm, where t is the time (in hours) after the snowstorm begins. (See Example 6.)
d(t) = t + 612
a. Graph the function and identify its domain
and range.
b. Interpret the slope and the d-intercept of the graph.
38. MODELING WITH MATHEMATICS The function c(x) = 0.5x + 70 represents the cost c (in dollars) of renting a truck from a moving company, where x is the number of miles you drive the truck.
a. Graph the function and identify its domain
and range.
b. Interpret the slope and the c-intercept of the graph.
39. COMPARING FUNCTIONS A linear function models the cost of renting a truck from a moving company. The table shows the cost y (in dollars) when you drive the truck x miles. Graph the function and compare the slope and the y-intercept of the graph with the slope and the c-intercept of the graph in Exercise 38.
Miles, xCost
(dollars), y
0 40
50 80
100 120
alg1_ch3 book.indb 142alg1_ch3 book.indb 142 7/11/17 10:52 AM7/11/17 10:52 AM

Section 3.5 Graphing Linear Equations in Slope-Intercept Form 143
ERROR ANALYSIS In Exercises 40 and 41, describe and correct the error in graphing the function.
40.
x
y
2
−2
4−2 13
(0, −1)
y + 1 = 3x
✗
41.
1
x
y
3
1
31−1−3
(0, 4)−2
−4x + y = −2
✗
42. MATHEMATICAL CONNECTIONS Graph the four equations in the same coordinate plane.
3y = −x − 3
2y − 14 = 4x
4x − 3 − y = 0
x − 12 = −3y
a. What enclosed shape do you think the lines form?
Explain.
b. Write a conjecture about the equations of
parallel lines.
43. MATHEMATICAL CONNECTIONS The graph shows the relationship between the width y and the length x of a rectangle in inches. The perimeter of a second rectangle is 10 inches less than the perimeter of the fi rst rectangle.
a. Graph the relationship
x
y
16
8
0
24
1680 24
y = 20 − xbetween the width and
length of the second
rectangle.
b. How does the graph
in part (a) compare to
the the graph shown?
44. MATHEMATICAL CONNECTIONS The graph shows the relationship between the base length x and the side length (of the two equal sides) y of an isosceles triangle in meters. The perimeter of a second isosceles triangle is 8 meters more than the perimeter of the fi rst triangle.
x
y8
4
0840 12
y = 6 − x12
a. Graph the relationship between the base length
and the side length of the second triangle.
b. How does the graph in part (a) compare to the
graph shown?
45. ANALYZING EQUATIONS Determine which of the equations could be represented by each graph.
y = −3x + 8 y = −x −
4 —
3
y = −7x y = 2x − 4
y = 7 —
4 x −
1 —
4 y =
1 —
3 x + 5
y = −4x − 9 y = 6
a.
x
y b.
x
y
c.
x
y d.
x
y
46. MAKING AN ARGUMENT Your friend says that you can write the equation of any line in slope-intercept form. Is your friend correct? Explain your reasoning.
alg1_ch3 book.indb 143alg1_ch3 book.indb 143 7/11/17 10:52 AM7/11/17 10:52 AM
144 Chapter 3 Graphing Linear Functions
Maintaining Mathematical ProficiencyMaintaining Mathematical ProficiencyFind the coordinates of the fi gure after the transformation.
54. Translate the rectangle
4 units left.
55. Dilate the triangle with
respect to the origin using
a scale factor of 2.
56. Refl ect the trapezoid in
the y-axis.
x
y4
2
−4
−2
42−2−4A B
CD
x
y4
2
−4
−2
41−2−4 Z
Y
X
x
y4
2
−4
−2
1 3−1−3S
T
R
Q
Determine whether the equation represents a linear or nonlinear function. Explain.
57. y − 9 = 2 —
x 58. x = 3 + 15y 59. x —
4 +
y —
12 = 1 60. y = 3x4 − 6
Reviewing what you learned in previous grades and lessons
47. WRITING Write the defi nition of the slope of a line in
two different ways.
48. THOUGHT PROVOKING Your family goes on vacation
to a beach 300 miles from your house. You reach your
destination 6 hours after departing. Draw a graph that
describes your trip. Explain what each part of your
graph represents.
49. ANALYZING A GRAPH The graphs of the functions g(x) = 6x + a and h(x) = 2x + b, where a and b are constants, are shown. They intersect at the point (p, q).
x
y
(p, q)
a. Label the graphs of g and h.
b. What do a and b represent?
c. Starting at the point (p, q), trace the graph of g
until you get to the point with the x-coordinate
p + 2. Mark this point C. Do the same with
the graph of h. Mark this point D. How much
greater is the y-coordinate of point C than the
y-coordinate of point D?
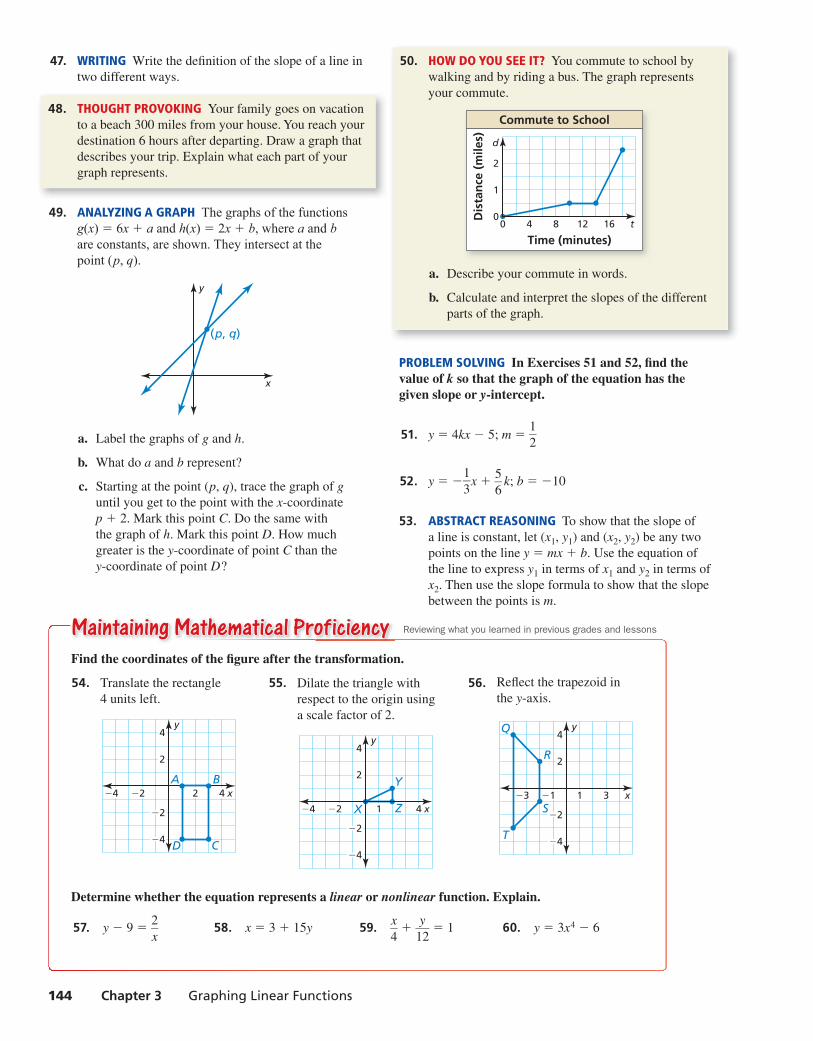
50. HOW DO YOU SEE IT? You commute to school by
walking and by riding a bus. The graph represents
your commute.
Commute to School
Dis
tan
ce (
mile
s)
0
1
2
d
Time (minutes)40 8 12 16 t
a. Describe your commute in words.
b. Calculate and interpret the slopes of the different
parts of the graph.
PROBLEM SOLVING In Exercises 51 and 52, fi nd the value of k so that the graph of the equation has the given slope or y-intercept.
51. y = 4kx − 5; m = 1 — 2
52. y = − 1 —
3 x +
5 —
6 k; b = −10
53. ABSTRACT REASONING To show that the slope of
a line is constant, let (x1, y1) and (x2, y2) be any two
points on the line y = mx + b. Use the equation of
the line to express y1 in terms of x1 and y2 in terms of
x2. Then use the slope formula to show that the slope
between the points is m.
alg1_ch3 book.indb 144alg1_ch3 book.indb 144 7/11/17 10:52 AM7/11/17 10:52 AM


