Rev. Roum. Sci. Tech. Méc. Appl., Tome 55, Nº _, P. , Bucarest, 2010
BUCKLING CURVES FOR HEAVY WIDE FLANGE STEEL COLUMNS
H.H. SNIJDER*, L.-G. CAJOT†, N. POPA†, R.C. SPOORENBERG‡
Abstract: This paper proposes existing European buckling curves to be used for checking the resistance of heavy wide flange columns made from mild and high-strength steel, failing by flexural buckling. Buckling curves are not available in the current Eurocode3 EN 1993-1-1, for height-to-width ratios h/b > 1.2 and flange thicknesses tf > 100 mm. The buckling curves are evaluated according to the statistical procedure given in Annex D of EN 1990 using finite element analyses. Residual stress models as described in literature were used to define the initial stress state of the column in the finite element model. A large database was created containing the ratio between the elastic-plastic buckling resistance obtained from finite element analysis and the buckling resistance obtained from the proposed buckling curve for a wide set of column configurations from which a partial factor γRd
was deduced. Different section types with flange thicknesses tf >100 mm were investigated: the stocky HD and more slender HL type, featuring h/b = 1.23 and h/b = 2.35 respectively. The materials investigated were: - Quenched and Self-Tempered (QST) steel available under the proprietary name
HISTAR 460 (High Strength ArcelorMittal) with a yield stress of 460 N/mm2; - steel grade S460; - steel grade S355; - steel grade S235. For as far as available, statistical information on these materials was used to estimate the partial factor for material properties γm. Then the partial (safety) factor γM1 can be calculated as γM1 = γRd · γm. Based on the criterion that γM1 should not exceed 1.05, buckling curves are suggested which can be used together with γM1 = 1.0. Buckling curves to be included in Eurocode3 EN 1993-1-1 are finally proposed for heavy wide flange columns in S235 to S500, with cross-sections with height-to-width ratios h/b>1.2 and flange thicknesses tf > 100 mm. This paper is an extended and more complete version of an earlier paper [1].
Keywords: Buckling curves, Finite element analyses, Heavy wide flange sections, High-strength steel, Mild steel, Partial factor, Statistical evaluation.
* Eindhoven University of Technology, Department of the Built Environment, P.O. Box 513, 5600 MB Eindhoven, The Netherlands † ArcelorMittal, Long Products, 66, rue de Luxembourg, L-4009 Esch/Alzette, Luxembourg ‡ Iv-Consult b.v., P.O. Box 1155, 3350 CD Papendrecht, The Netherlands
H.H. Snijder, L.-G. Cajot, N. Popa, R.C. Spoorenberg 2
1. INTRODUCTION
The advent of Quenched and Self-Tempered (QST) steel sections which combine high strength (i.e. nominal yield stress greater than 430 N/mm2) with good ductility and weldability has led to a broadening of the possibilities in steel construction. This manufacturing method can also be applied to produce heavy wide flange sections, i.e. wide flange sections with flanges thicker than 40 mm. At the moment, heavy wide flange QST sections are manufactured by ArcelorMittal under the proprietary name of HISTAR (HIgh-STrength ARcelorMittal). Two grades are currently produced: HISTAR 355 and (high-strength) HISTAR 460, which possess a yield stress of 355 N/mm2 and 460 N/mm2 respectively, not considering reduction of yield stress with increasing material thickness. Heavy wide flange HISTAR 460 sections have already been applied worldwide, with the majority in the United States where the US equivalent of HISTAR 460, Grade 65, is covered by ASTM A913 [2, 3].
Besides the high yield stress, HISTAR 460 sections have improved material
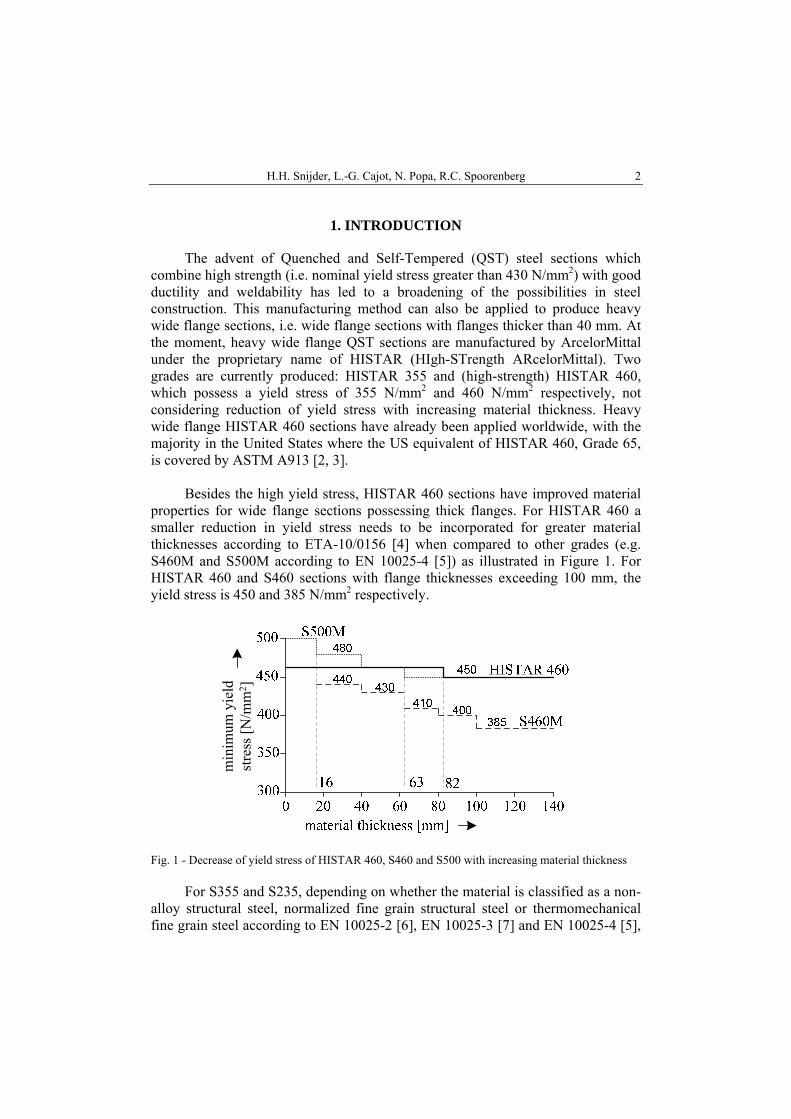
properties for wide flange sections possessing thick flanges. For HISTAR 460 a smaller reduction in yield stress needs to be incorporated for greater material thicknesses according to ETA-10/0156 [4] when compared to other grades (e.g. S460M and S500M according to EN 10025-4 [5]) as illustrated in Figure 1. For HISTAR 460 and S460 sections with flange thicknesses exceeding 100 mm, the yield stress is 450 and 385 N/mm2 respectively.
min
imum
yie
ld
stre
ss [
N/m
m2 ]
Fig. 1 - Decrease of yield stress of HISTAR 460, S460 and S500 with increasing material thickness
For S355 and S235, depending on whether the material is classified as a non-alloy structural steel, normalized fine grain structural steel or thermomechanical fine grain steel according to EN 10025-2 [6], EN 10025-3 [7] and EN 10025-4 [5],
Buckling curves for heavy wide flange steel columns 3
respectively, a substantially reduced yield stress must be used to account for a reduction in material properties for thick plated parts. For the present study with sections possessing flange thicknesses between 100 and 150 mm, the yield stress for S235 steel is 195 N/mm2. For S355 the lowest yield stress value according to the three different standards is selected: 295 N/mm2.
As such, heavy wide flange HISTAR 460 sections are used to their best
advantage when the ultimate limit state is the governing design criterion. This is the case when applied as gravity columns in multi-story buildings, beams in short- or medium-span bridges or chord- and brace members as part of truss-like structures. In these situations the design is most often controlled by the flexural buckling resistance of the member for which due allowance has to be made according to the relevant design codes.
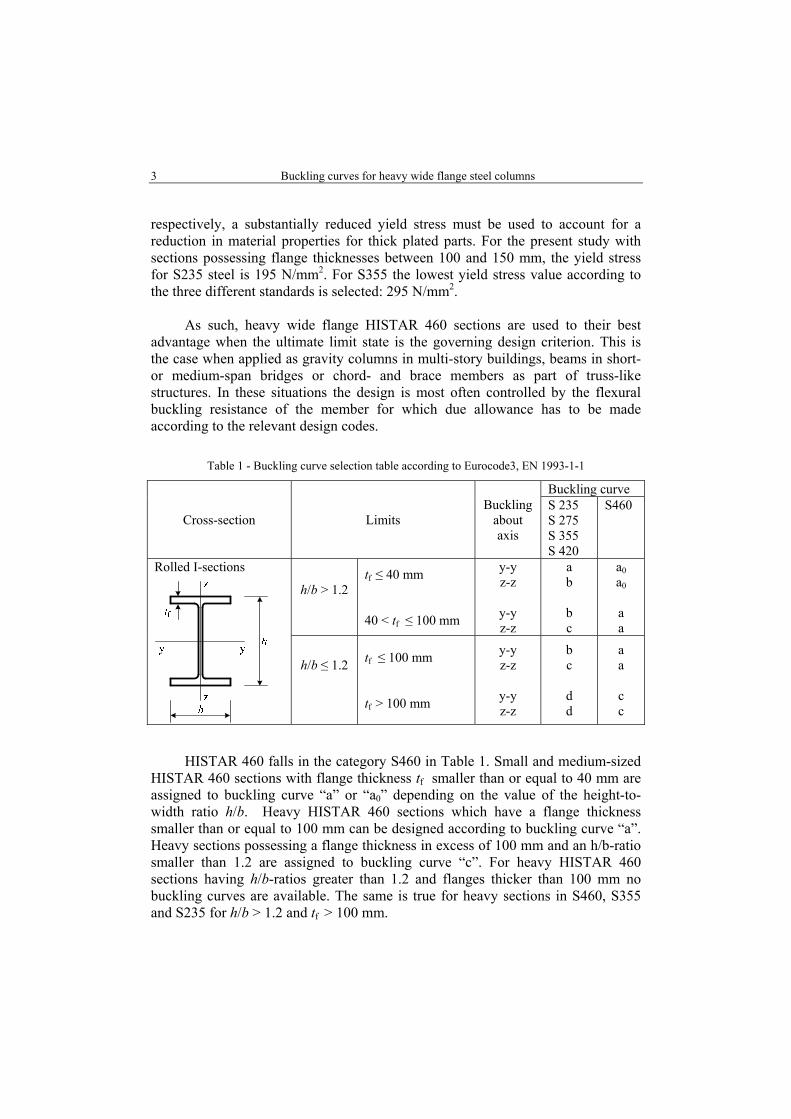
Table 1 - Buckling curve selection table according to Eurocode3, EN 1993-1-1
Cross-section Limits Buckling
about axis
Buckling curve S 235 S 275 S 355 S 420
S460
Rolled I-sections
h/b > 1.2
tf ≤ 40 mm 40 < tf ≤ 100 mm
y-y z-z
y-y z-z
a b b c
a0 a0 a a
h/b ≤ 1.2
tf ≤ 100 mm tf > 100 mm
y-y z-z
y-y z-z
b c d d
a a c c
HISTAR 460 falls in the category S460 in Table 1. Small and medium-sized HISTAR 460 sections with flange thickness tf smaller than or equal to 40 mm are assigned to buckling curve “a” or “a0” depending on the value of the height-to-width ratio h/b. Heavy HISTAR 460 sections which have a flange thickness smaller than or equal to 100 mm can be designed according to buckling curve “a”. Heavy sections possessing a flange thickness in excess of 100 mm and an h/b-ratio smaller than 1.2 are assigned to buckling curve “c”. For heavy HISTAR 460 sections having h/b-ratios greater than 1.2 and flanges thicker than 100 mm no buckling curves are available. The same is true for heavy sections in S460, S355 and S235 for h/b > 1.2 and tf > 100 mm.

H.H. Snijder, L.-G. Cajot, N. Popa, R.C. Spoorenberg 4
In order to arrive at buckling curves reflecting the buckling response for heavy sections in HISTAR 460, S460 , S355 and S235 with flange thickness larger than 100 mm and h/b-ratios greater than 1.2, a combined experimental and numerical study was initiated by ArcelorMittal in Luxemburg and set up and executed by Eindhoven University of Technology in the Netherlands. The experiments consisted of residual stress measurements performed on two different heavy wide flange section types made in steel grade HISTAR 460. A residual stress model was proposed which can be used for heavy wide flange QST sections. The testing procedure and the derivation of this so called ‘QST residual stress model’ are detailed in [9]. Since the manufacturing process of heavy S460 sections is identical to that of HISTAR 460 sections, the residual stress model of the latter was applied to the S460 analyses. As no experimental data is available to model the residual stresses state for heavy HL sections made from S235 or S355 an assumption was made on their distribution. For the S235 members the so called ‘ECCS residual stress model’ [10] featuring a bilinear stress pattern over the web height and flange width was used to define the initial stress state. For the sections made from S355 steel the QST residual stress model was adopted in addition to the ECCS residual stress model.
In the present paper, existing ECCS buckling curves are proposed to check
the flexural buckling resistance of heavy HISTAR 460 sections. The reliability of the suggested buckling curves is evaluated according to annex D of EN 1990 [11]. The buckling resistance for a wide set of columns in HISTAR 460, S460, S355 and S235 is evaluated with the finite element method using the residual stress models mentioned to define the initial stress state of the column and with widely accepted geometric imperfections.
1.1 Earlier approaches for derivation of buckling curves
From the earliest experiments on pin-ended columns failing by flexural buckling it was observed that the slenderness (ratio between length and radius of gyration) of the member has profound influence on the buckling response. This led to the development of the buckling curve concept, relating the load a column can withstand before instability occurs to its non-dimensional or relative slenderness (slenderness normalized against the steel properties). Important references include [12, 13]. The studies underlying the buckling curve concept were often based on a two-fold approach: to obtain the elastic-plastic buckling resistance through full-scale column testing and to conduct theoretical (and later numerical) analyses to replicate and supplement the experimental results. The theoretical analyses were expanded to include a wide set of columns not part of the experimental plan from which design rules (buckling curves) were proposed. The accuracy of the buckling curve was often evaluated through comparison with characteristic values from full-
Buckling curves for heavy wide flange steel columns 5
scale tests performed, where ‘good agreement’ between the buckling curve and test justified the selected buckling curve.
1.2 Statistical evaluation of resistance models
The earlier approaches to arrive at buckling curve formulations have become
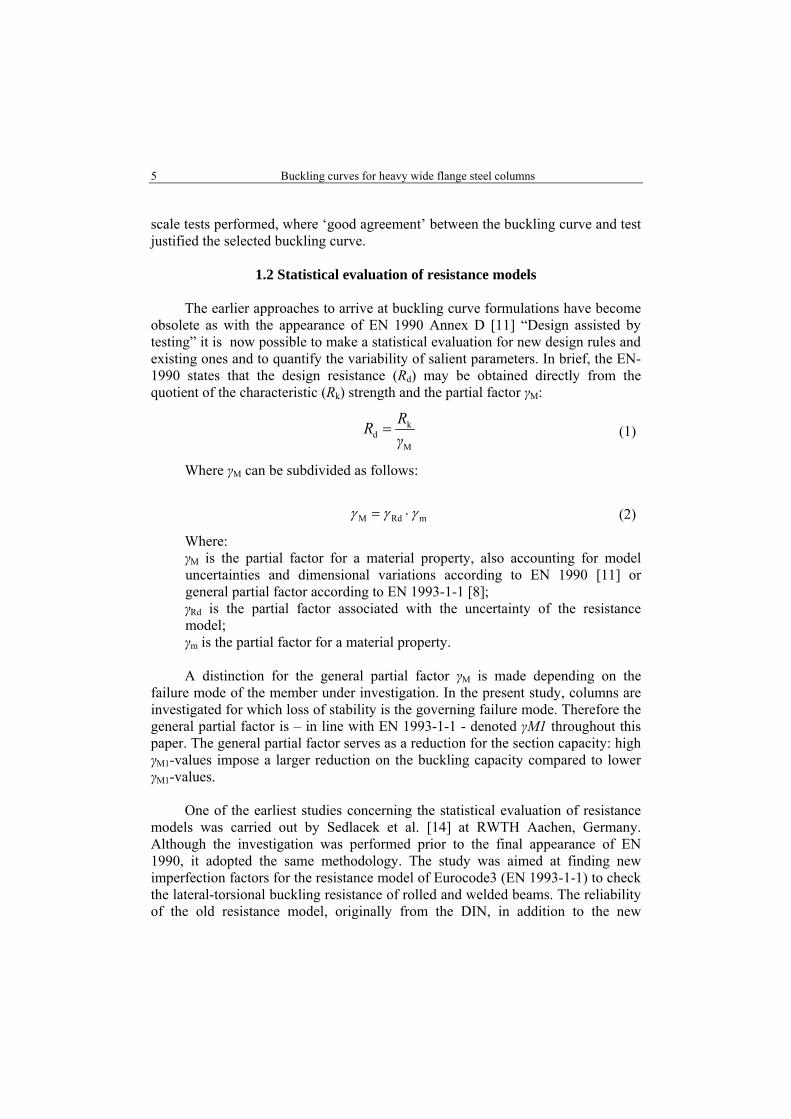
obsolete as with the appearance of EN 1990 Annex D [11] “Design assisted by testing” it is now possible to make a statistical evaluation for new design rules and existing ones and to quantify the variability of salient parameters. In brief, the EN-1990 states that the design resistance (Rd) may be obtained directly from the quotient of the characteristic (Rk) strength and the partial factor γM:
kd
M
RR
γ
(1)
Where γM can be subdivided as follows:
mRdM (2)
Where: γM is the partial factor for a material property, also accounting for model uncertainties and dimensional variations according to EN 1990 [11] or general partial factor according to EN 1993-1-1 [8]; γRd is the partial factor associated with the uncertainty of the resistance model; γm is the partial factor for a material property. A distinction for the general partial factor γM is made depending on the
failure mode of the member under investigation. In the present study, columns are investigated for which loss of stability is the governing failure mode. Therefore the general partial factor is – in line with EN 1993-1-1 - denoted γM1 throughout this paper. The general partial factor serves as a reduction for the section capacity: high γM1-values impose a larger reduction on the buckling capacity compared to lower γM1-values.
One of the earliest studies concerning the statistical evaluation of resistance
models was carried out by Sedlacek et al. [14] at RWTH Aachen, Germany. Although the investigation was performed prior to the final appearance of EN 1990, it adopted the same methodology. The study was aimed at finding new imperfection factors for the resistance model of Eurocode3 (EN 1993-1-1) to check the lateral-torsional buckling resistance of rolled and welded beams. The reliability of the old resistance model, originally from the DIN, in addition to the new
H.H. Snijder, L.-G. Cajot, N. Popa, R.C. Spoorenberg 6
resistance model was re-evaluated. The statistical evaluation was based on 144 lateral-torsional buckling tests.
A probabilistic assessment of the existing design rules to check the lateral
torsional buckling resistance of beams was performed by the University of Coimbra, Portugal for wide flange beams. The partial factor associated with the uncertainty of the resistance model γRd was computed for different load cases and section types using the three different design models for lateral torsional buckling available in EN 1993-1-1, Rebelo et al. [15]. The evaluation of the partial factors was based on the solution results from finite element analyses conducted on a wide set of beam configurations.
In the accompanying paper by Simoes da Silva et al. [16], the partial factor
for the material properties γm was determined based on tensile tests conducted on sections made from different steel grades. Using equation (2), the factors from [15, 16] were used to arrive at γM1-values for different load cases and steel grades.
1.3 Present Study
In the present study the methodology adopted by Rebelo et al. [15] and in
line with Annex D of EN 1990 will be used to check the reliability of proposed buckling curves for heavy wide flange sections.
A large database is created containing the ratio between the elastic-plastic
buckling resistance obtained from non-linear finite element analyses and buckling resistances obtained from the suggested buckling curve for a wide set of column configurations. It is mentioned that the numerically obtained elastic-plastic buckling resistance serves as a replacement of the ultimate resistance found in a column buckling test. The ratio between both buckling resistances for a specific set of columns is used to compute the partial factor γRd associated with the uncertainty of the resistance model.
For S460, statistical literature information concerning the relevant material
property, being the yield stress fy, is used to estimate γm < 1.0. Then the general partial factor γM1 is computed according to equation (2). Since for HISTAR 460 such information is not yet available γm = 1.0 can be conservatively used to compute the general partial factor γM1 according to equation (2). This general partial factor can have a lower value in the nearby future pending the availability of a lower γm-value representing the variability in mechanical properties of HISTAR 460 steels. For S355 and S235 γm = 1.0 was also conservatively adopted to compute the general partial factor γM1 according to equation (2).
Buckling curves for heavy wide flange steel columns 7
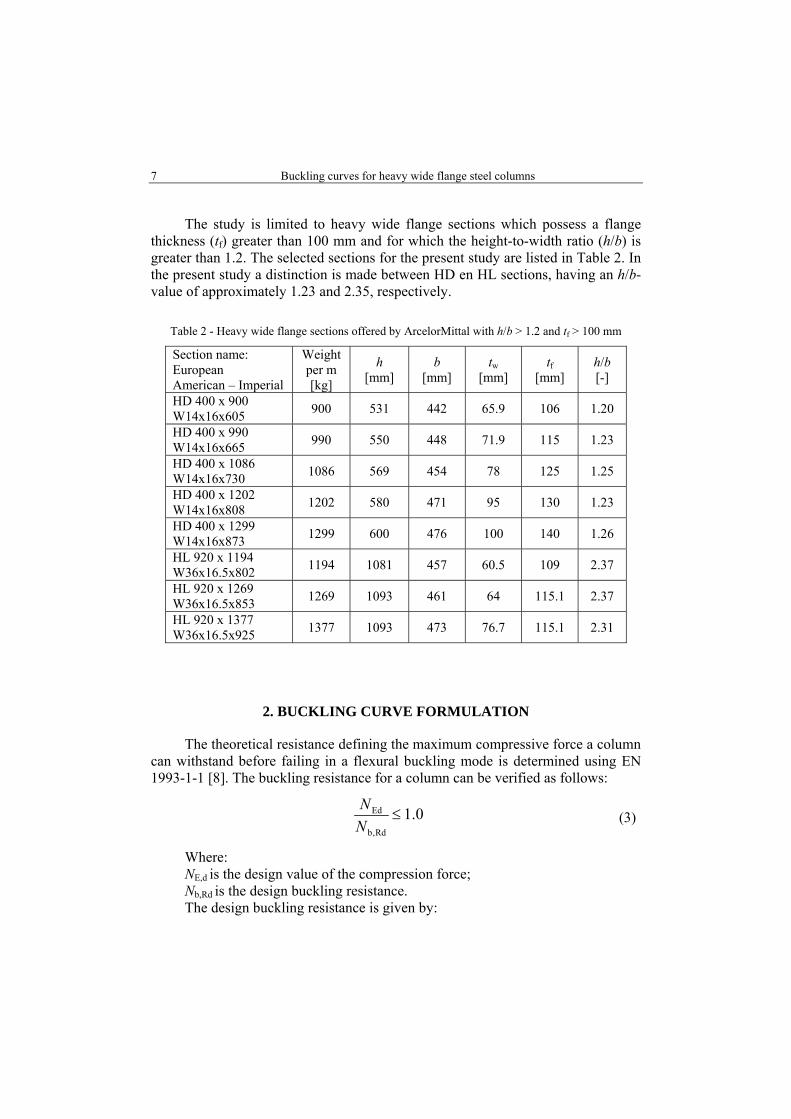
The study is limited to heavy wide flange sections which possess a flange thickness (tf) greater than 100 mm and for which the height-to-width ratio (h/b) is greater than 1.2. The selected sections for the present study are listed in Table 2. In the present study a distinction is made between HD en HL sections, having an h/b-value of approximately 1.23 and 2.35, respectively.
Table 2 - Heavy wide flange sections offered by ArcelorMittal with h/b > 1.2 and tf > 100 mm
Section name: European American – Imperial
Weight per m [kg]
h [mm]
b [mm]
tw [mm]
tf [mm]
h/b [-]
HD 400 x 900 W14x16x605
900 531 442 65.9 106 1.20
HD 400 x 990 W14x16x665
990 550 448 71.9 115 1.23
HD 400 x 1086 W14x16x730
1086 569 454 78 125 1.25
HD 400 x 1202 W14x16x808
1202 580 471 95 130 1.23
HD 400 x 1299 W14x16x873
1299 600 476 100 140 1.26
HL 920 x 1194 W36x16.5x802
1194 1081 457 60.5 109 2.37
HL 920 x 1269 W36x16.5x853
1269 1093 461 64 115.1 2.37
HL 920 x 1377 W36x16.5x925
1377 1093 473 76.7 115.1 2.31
2. BUCKLING CURVE FORMULATION
The theoretical resistance defining the maximum compressive force a column can withstand before failing in a flexural buckling mode is determined using EN 1993-1-1 [8]. The buckling resistance for a column can be verified as follows:
Ed
b,Rd
1.0N
N
(3)
Where: NE,d is the design value of the compression force; Nb,Rd is the design buckling resistance. The design buckling resistance is given by:
H.H. Snijder, L.-G. Cajot, N. Popa, R.C. Spoorenberg 8
yb,R d
M1
χAfN
γ
(4)
Where A is the cross-sectional area, fy is the yield stress, γM1 is the general partial factor for instability and χ is the buckling reduction factor. This check is only valid for sections belonging to cross-sectional class 1, 2 or 3. The product of the cross-sectional area and the yield stress is known as the squash load of the cross-section or Npl. Using equations (3, 4), the verification of the buckling resistance can be rewritten as follows:
Ed
pl M1
1.0N
χN /γ
(5)
The buckling reduction factor can be computed according to:
2 2
1but 1.0χ χ
Φ Φ λ
(6)
Where:
20.5 1 0.2Φ α λ λ
(7)
The relative slenderness can be determined as follows:
pl crλ N N
(8)
Where Ncr is the elastic critical force of the column. The imperfection factor α attains one of the values as listed in Table 3, depending on the cross-section, steel grade and buckling case (weak-axis or strong-axis buckling) under consideration.
Table 3 - Imperfection factor for buckling curves
Buckling curve a0 a b c d Imperfection factor α 0.13 0.21 0.34 0.49 0.76
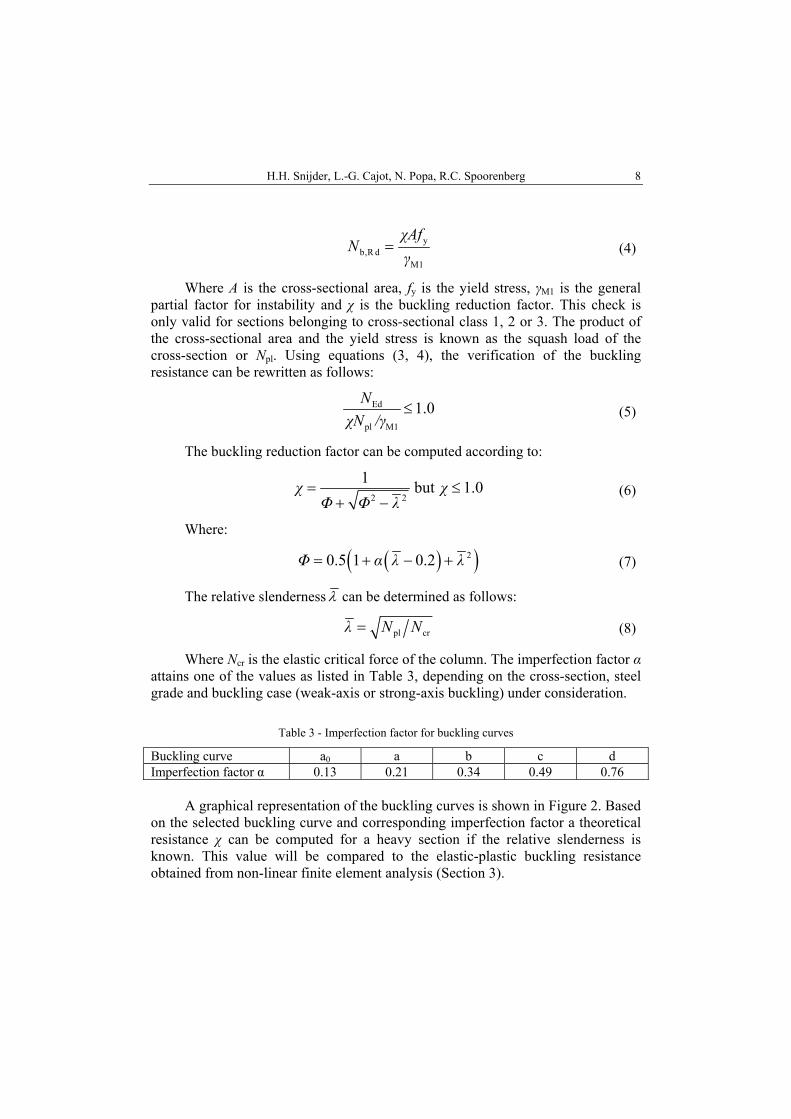
A graphical representation of the buckling curves is shown in Figure 2. Based
on the selected buckling curve and corresponding imperfection factor a theoretical resistance χ can be computed for a heavy section if the relative slenderness is known. This value will be compared to the elastic-plastic buckling resistance obtained from non-linear finite element analysis (Section 3).
Buckling curves for heavy wide flange steel columns 9
0
0.2
0.4
0.6
0.8
1
0 1 2 3
Rel
ativ
e re
sist
ance
χ[-
]
Relative slenderness λ [-]
a0
abc
d
Fig. 2 - Buckling curves from Eurocode3
3. FINITE ELEMENT MODEL
3.1 Elements
The geometrical and material non-linear analyses on the columns containing imperfections (GMNIA) were performed in the ANSYS v.11.0 implicit environment. The columns were modelled with beam elements. The 3D three node finite strain element (BEAM189) was selected for the analyses as it can describe plasticity, large deformations and large strains. A user-defined cross-section was modelled based on nominal dimensions, see Table 2. The cross-section is subdivided into different cells to capture growth of plastic zones across the cross-section. Each cell contains four integration points where the stresses are evaluated (Figure 4a). Two integration point locations in longitudinal direction of each element describe progressive yielding along the length of the column. A total of 20 elements along the length of the member were considered sufficient. Earlier research studies on column buckling have shown that this element type is able to replicate experimental elastic-plastic buckling tests with good accuracy thereby taking into account the effects of residual stresses [17, 18].
H.H. Snijder, L.-G. Cajot, N. Popa, R.C. Spoorenberg 10
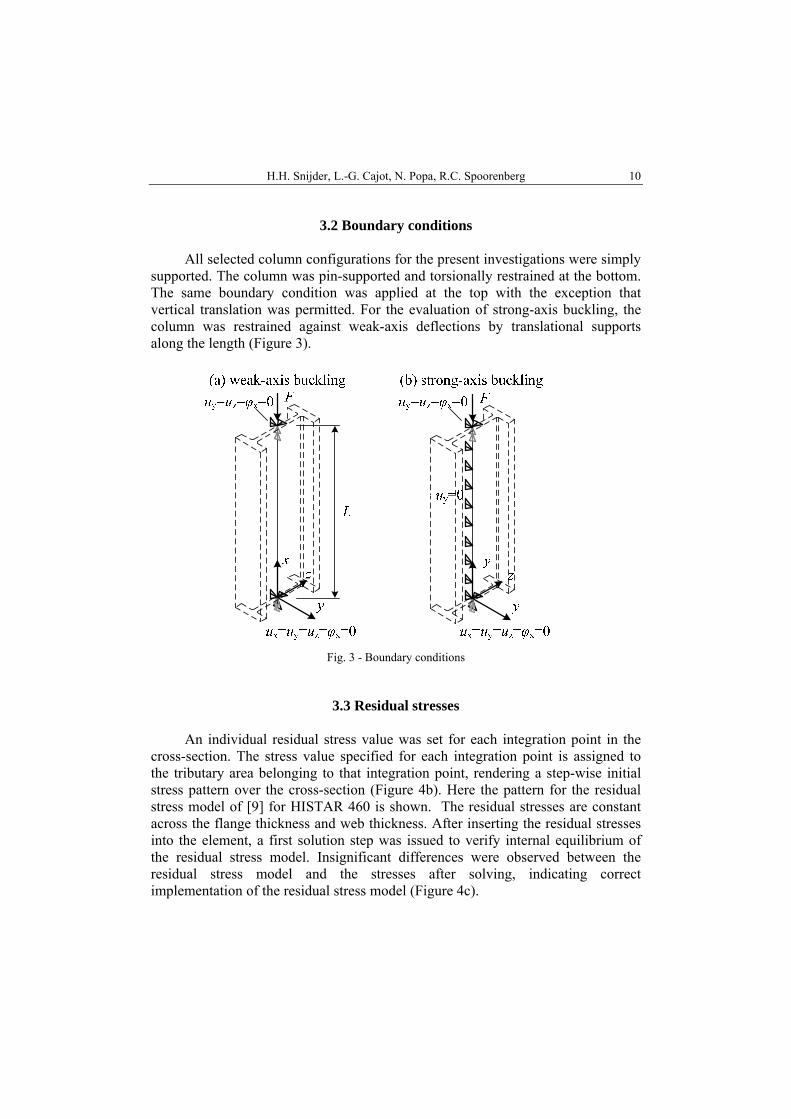
3.2 Boundary conditions All selected column configurations for the present investigations were simply
supported. The column was pin-supported and torsionally restrained at the bottom. The same boundary condition was applied at the top with the exception that vertical translation was permitted. For the evaluation of strong-axis buckling, the column was restrained against weak-axis deflections by translational supports along the length (Figure 3).
Fig. 3 - Boundary conditions
3.3 Residual stresses
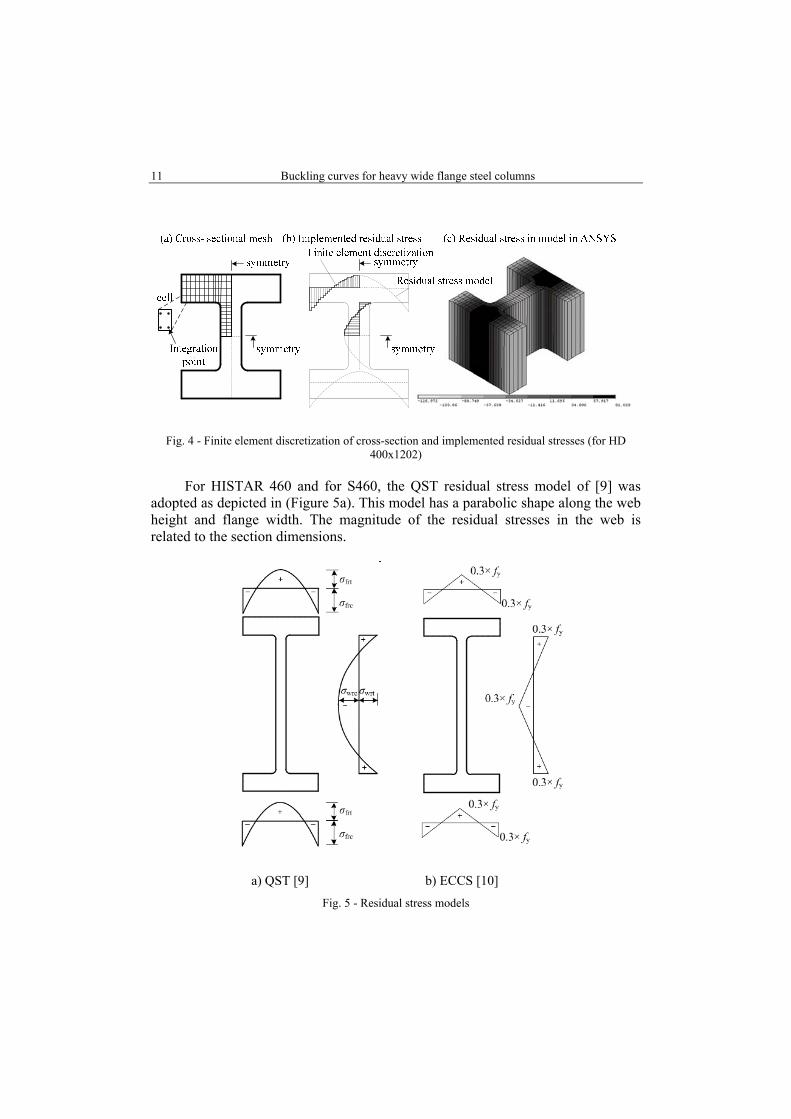
An individual residual stress value was set for each integration point in the
cross-section. The stress value specified for each integration point is assigned to the tributary area belonging to that integration point, rendering a step-wise initial stress pattern over the cross-section (Figure 4b). Here the pattern for the residual stress model of [9] for HISTAR 460 is shown. The residual stresses are constant across the flange thickness and web thickness. After inserting the residual stresses into the element, a first solution step was issued to verify internal equilibrium of the residual stress model. Insignificant differences were observed between the residual stress model and the stresses after solving, indicating correct implementation of the residual stress model (Figure 4c).
Buckling curves for heavy wide flange steel columns 11
Fig. 4 - Finite element discretization of cross-section and implemented residual stresses (for HD 400x1202)
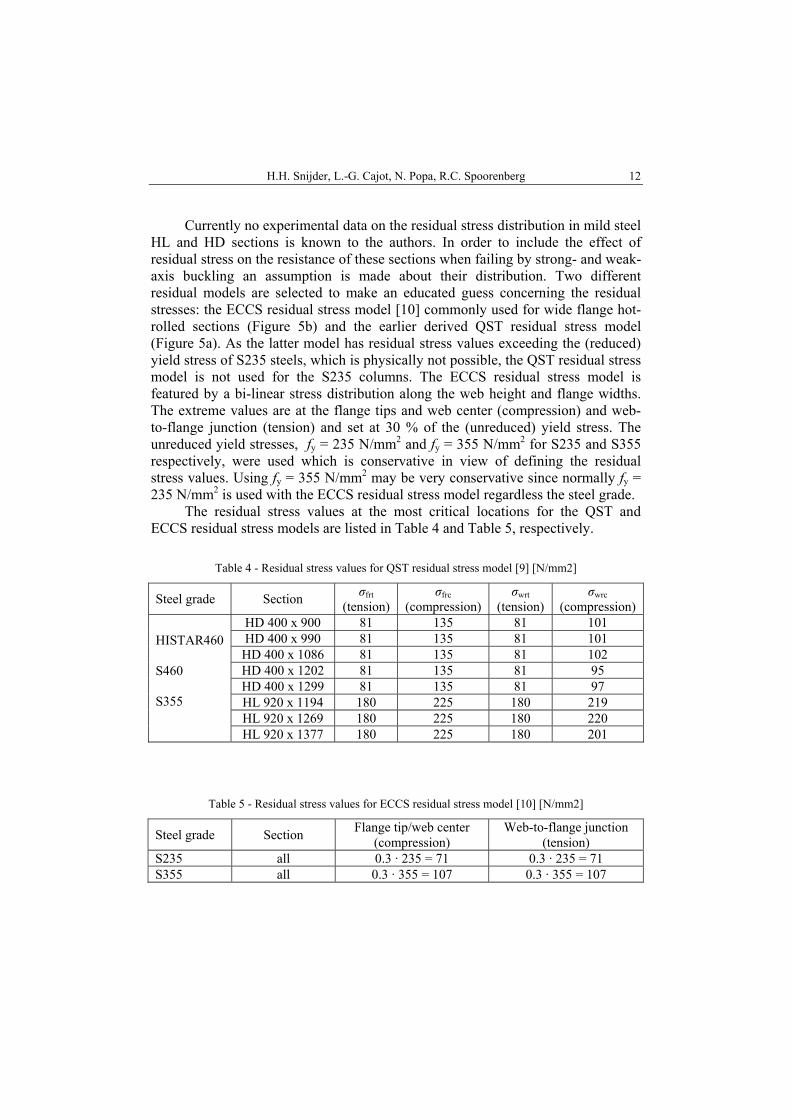
For HISTAR 460 and for S460, the QST residual stress model of [9] was adopted as depicted in (Figure 5a). This model has a parabolic shape along the web height and flange width. The magnitude of the residual stresses in the web is related to the section dimensions.
a) QST [9] b) ECCS [10]
Fig. 5 - Residual stress models
H.H. Snijder, L.-G. Cajot, N. Popa, R.C. Spoorenberg 12
Currently no experimental data on the residual stress distribution in mild steel HL and HD sections is known to the authors. In order to include the effect of residual stress on the resistance of these sections when failing by strong- and weak-axis buckling an assumption is made about their distribution. Two different residual models are selected to make an educated guess concerning the residual stresses: the ECCS residual stress model [10] commonly used for wide flange hot-rolled sections (Figure 5b) and the earlier derived QST residual stress model (Figure 5a). As the latter model has residual stress values exceeding the (reduced) yield stress of S235 steels, which is physically not possible, the QST residual stress model is not used for the S235 columns. The ECCS residual stress model is featured by a bi-linear stress distribution along the web height and flange widths. The extreme values are at the flange tips and web center (compression) and web-to-flange junction (tension) and set at 30 % of the (unreduced) yield stress. The unreduced yield stresses, fy = 235 N/mm2 and fy = 355 N/mm2 for S235 and S355 respectively, were used which is conservative in view of defining the residual stress values. Using fy = 355 N/mm2 may be very conservative since normally fy = 235 N/mm2 is used with the ECCS residual stress model regardless the steel grade.
The residual stress values at the most critical locations for the QST and ECCS residual stress models are listed in Table 4 and Table 5, respectively.
Table 4 - Residual stress values for QST residual stress model [9] [N/mm2]
Steel grade Section σfrt
(tension) σfrc
(compression) σwrt
(tension) σwrc
(compression) HISTAR460 S460 S355
HD 400 x 900 81 135 81 101 HD 400 x 990 81 135 81 101 HD 400 x 1086 81 135 81 102 HD 400 x 1202 81 135 81 95 HD 400 x 1299 81 135 81 97 HL 920 x 1194 180 225 180 219 HL 920 x 1269 180 225 180 220 HL 920 x 1377 180 225 180 201
Table 5 - Residual stress values for ECCS residual stress model [10] [N/mm2]
Steel grade Section Flange tip/web center
(compression) Web-to-flange junction
(tension) S235 all 0.3 · 235 = 71 0.3 · 235 = 71 S355 all 0.3 · 355 = 107 0.3 · 355 = 107
Buckling curves for heavy wide flange steel columns 13
3.4 Material model
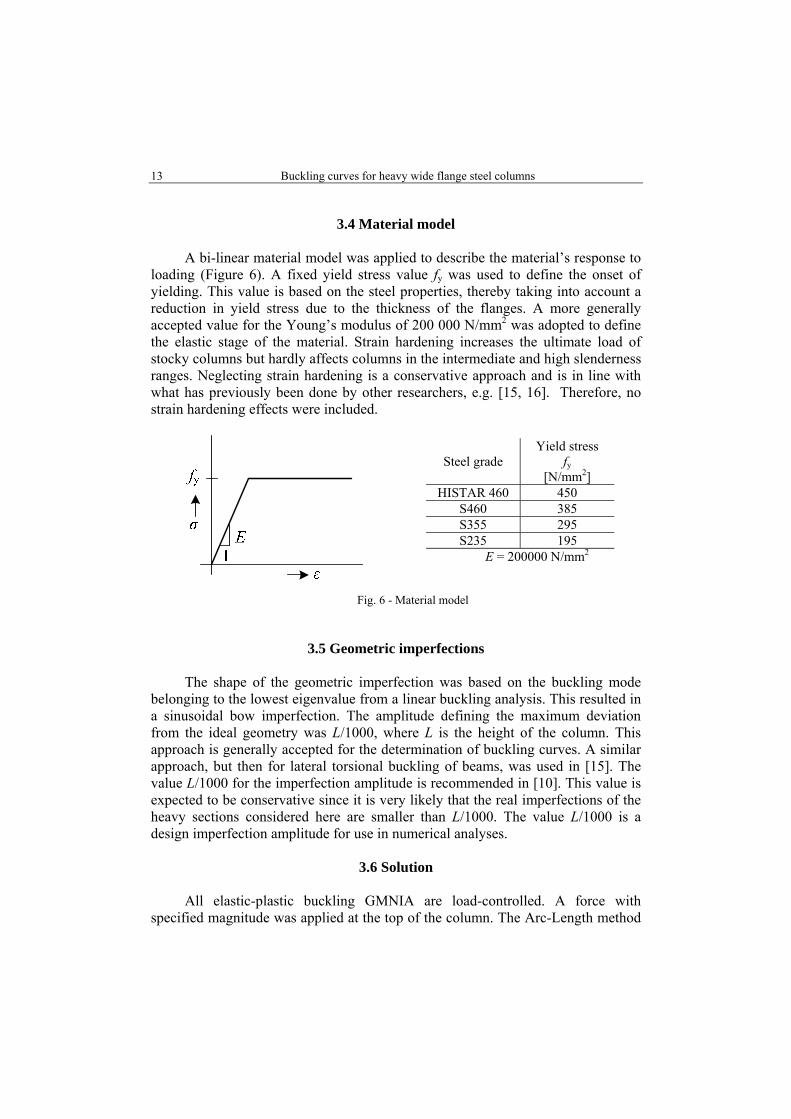
A bi-linear material model was applied to describe the material’s response to loading (Figure 6). A fixed yield stress value fy was used to define the onset of yielding. This value is based on the steel properties, thereby taking into account a reduction in yield stress due to the thickness of the flanges. A more generally accepted value for the Young’s modulus of 200 000 N/mm2 was adopted to define the elastic stage of the material. Strain hardening increases the ultimate load of stocky columns but hardly affects columns in the intermediate and high slenderness ranges. Neglecting strain hardening is a conservative approach and is in line with what has previously been done by other researchers, e.g. [15, 16]. Therefore, no strain hardening effects were included.
Steel grade Yield stress
fy [N/mm2]
HISTAR 460 450 S460 385 S355 295 S235 195
E = 200000 N/mm2
Fig. 6 - Material model
3.5 Geometric imperfections
The shape of the geometric imperfection was based on the buckling mode
belonging to the lowest eigenvalue from a linear buckling analysis. This resulted in a sinusoidal bow imperfection. The amplitude defining the maximum deviation from the ideal geometry was L/1000, where L is the height of the column. This approach is generally accepted for the determination of buckling curves. A similar approach, but then for lateral torsional buckling of beams, was used in [15]. The value L/1000 for the imperfection amplitude is recommended in [10]. This value is expected to be conservative since it is very likely that the real imperfections of the heavy sections considered here are smaller than L/1000. The value L/1000 is a design imperfection amplitude for use in numerical analyses.
3.6 Solution
All elastic-plastic buckling GMNIA are load-controlled. A force with
specified magnitude was applied at the top of the column. The Arc-Length method
H.H. Snijder, L.-G. Cajot, N. Popa, R.C. Spoorenberg 14
was selected to solve the non-linear equilibrium iterations. The Arc-Length method was selected in preference to the conventional Newton-Raphson method as the former is able to describe the decreasing load-deflection curve beyond the maximum load whereas the latter will abort the solution when the maximum resistance has been reached. The load was divided into four load steps which in turn were further divided into substeps or load increments. For each load-increment a number of equilibrium iterations were performed to arrive at a converged solution. The solution was considered solved when the out-of-balance load vector is smaller than 0.05 % of the load increment. The ultimate strength or flexural buckling resistance of the column (Nult;FEM) was identified as the maximum load on the load-deflection curve. The elastic buckling load (Ncr;FEM) is obtained from a linear buckling analysis (LBA) using the Block-Lanczos extraction method of eigenvalues.
3.7 Plotting results in buckling curve
For each column configuration for which the ultimate resistance is evaluated
through non-linear finite element analyses, the reduction factor is obtained by normalizing the ultimate load against the squash load of the cross-section (Npl;FEM).
ult;FEMFEM
pl;FEM
N
N
(9)
Where the squash load of the cross-section is computed according to:
pl;FEM yN Af (10)
Where A is the cross-sectional area of the element and fy is the yield stress. The factor χFEM is labeled as the ‘experimental’ resistance for comparison
with the theoretical resistance χ. The relative slenderness of the column can be computed by taking the square root of the ratio between the squash load of the cross-section and the elastic buckling load evaluated from a linear buckling analysis:
FEM pl;FEM cr;FEMN N
(11)
Note that equation (11) is similar to equation (8) but the squash load is now based on that of the FEM model and the elastic buckling load is calculated with a LBA.
Buckling curves for heavy wide flange steel columns 15
3.8 Finite element results
3.8.1 Steel HISTAR 460
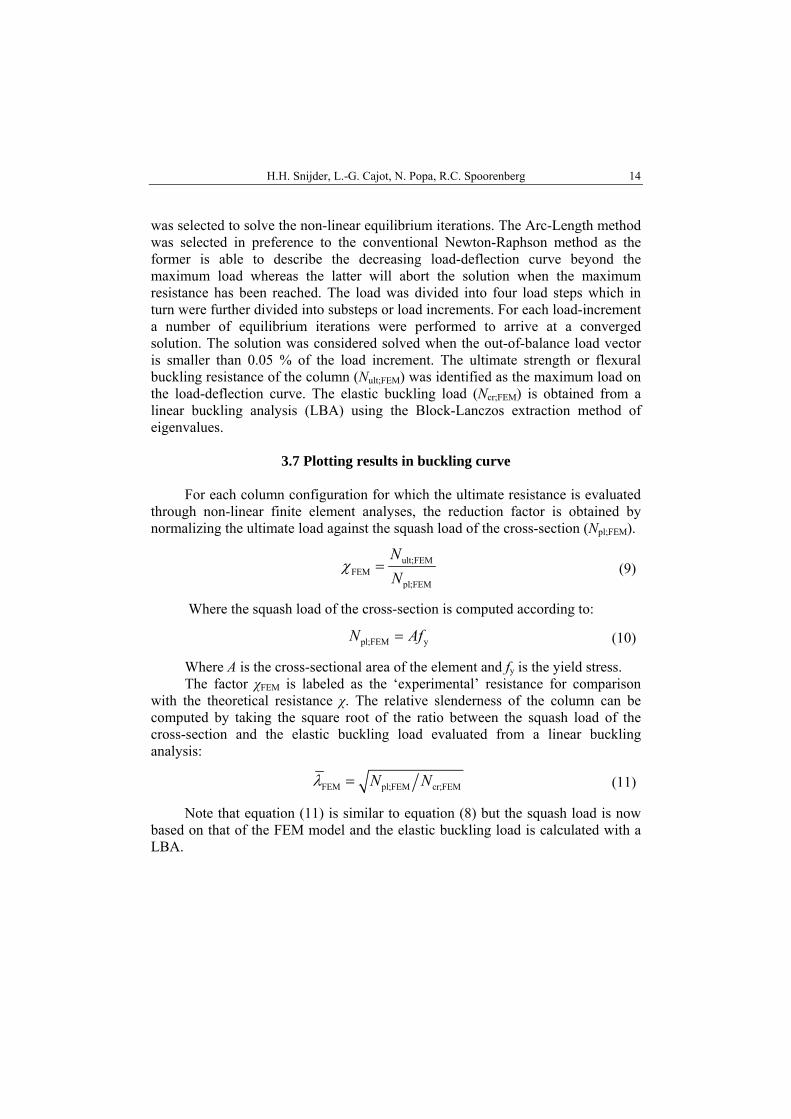
Typical load-deflection curves as obtained from the finite element analyses are shown in Figure 7a.
0
0.2
0.4
0.6
0.8
1
0 10 20 30 40 50
Nul
t;FE
M/N
cr;F
EM
[-]
Lateral displacement [mm]
HD 400x1202 L=8000 mm weak-axis
HD 920x1377L=14400 mm strong-axis
0
0.2
0.4
0.6
0.8
1
1.2
0 1 2 3
Red
ucti
on f
acto
r [-]
Relative slenderness [-]
Column curve a
HD 400x1202 L=8000 mm weak-axis
HD 920x1377L=14400 mm strong-axis
a b
Fig. 7 - Finite element output: load-deflection curves for HISTAR 460 (a) and corresponding
data in buckling curve diagram (b)
In Figure 7b the ultimate loads from Figure 7a are plotted in the buckling curve diagram using the equations (10, 11) in addition to buckling curve “a”. Plotting the ultimate load for a specific group of columns in the buckling curve diagram in addition to a buckling curve allows a first estimate to be made as to whether that specific buckling curve is on the conservative or unconservative side.
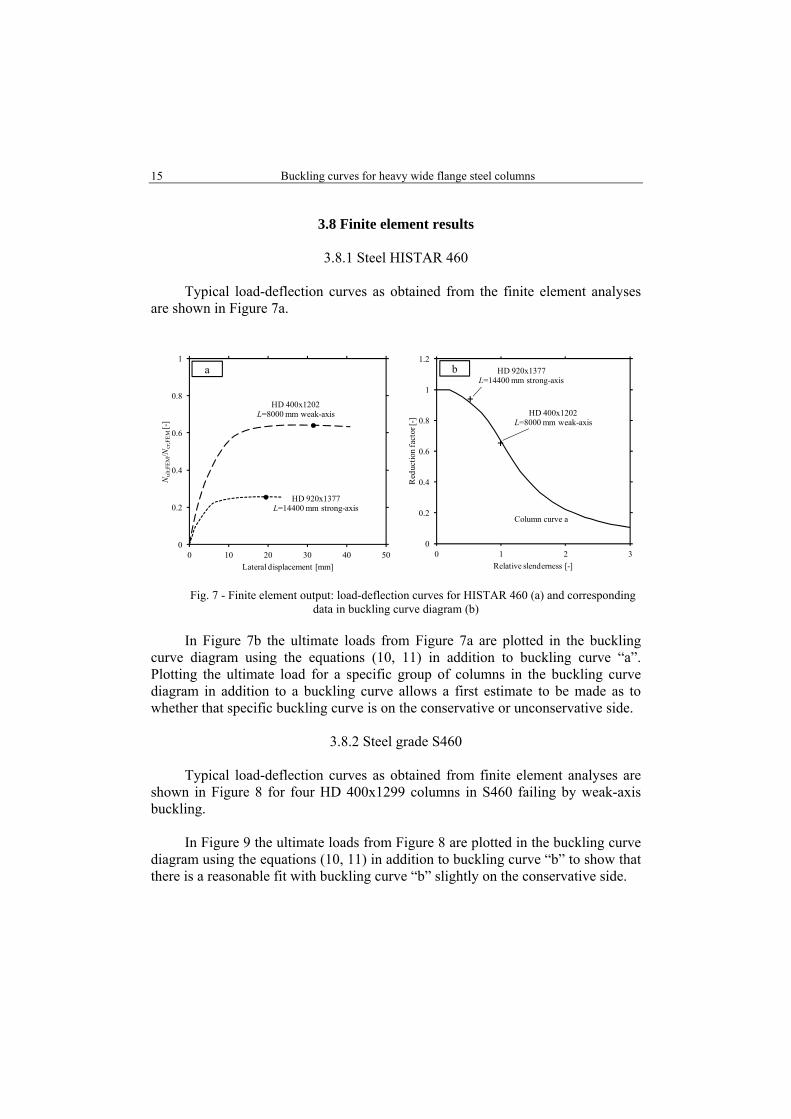
3.8.2 Steel grade S460
Typical load-deflection curves as obtained from finite element analyses are
shown in Figure 8 for four HD 400x1299 columns in S460 failing by weak-axis buckling.
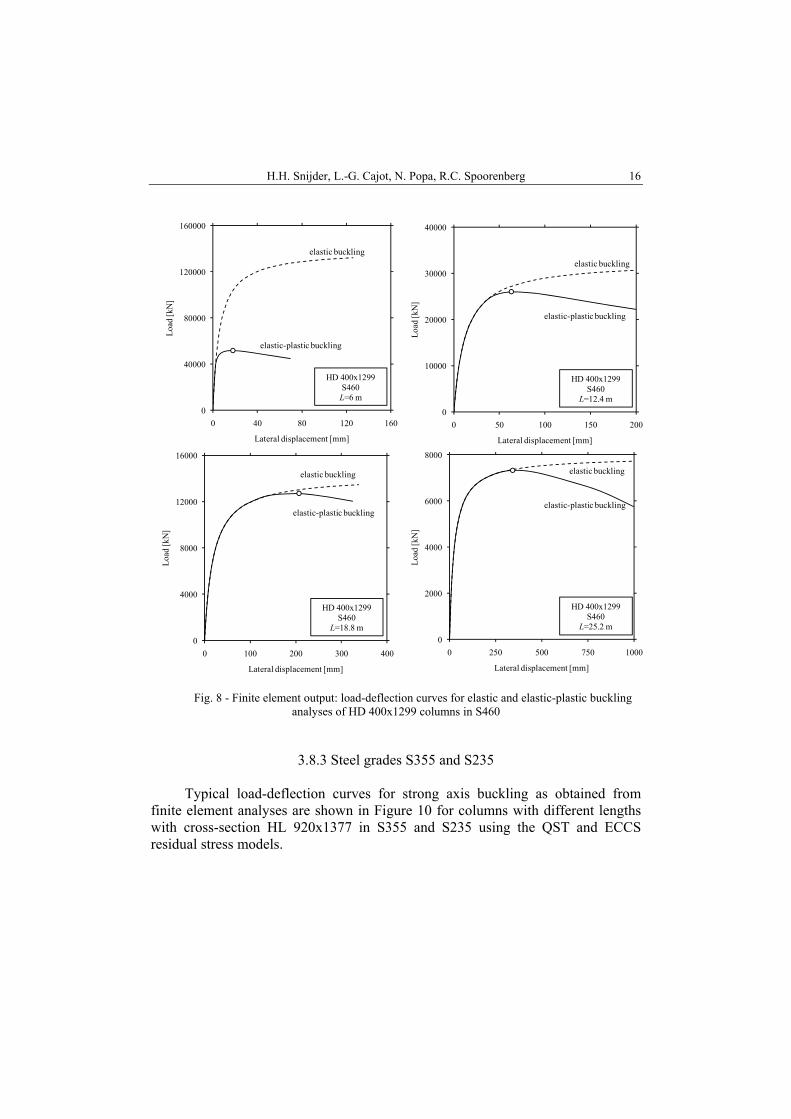
In Figure 9 the ultimate loads from Figure 8 are plotted in the buckling curve
diagram using the equations (10, 11) in addition to buckling curve “b” to show that there is a reasonable fit with buckling curve “b” slightly on the conservative side.
H.H. Snijder, L.-G. Cajot, N. Popa, R.C. Spoorenberg 16
0
10000
20000
30000
40000
0 50 100 150 200L
oad
[kN
]
Lateral displacement [mm]
HD 400x1299S460
L=12.4 m0
40000
80000
120000
160000
0 40 80 120 160
Loa
d [k
N]
Lateral displacement [mm]
HD 400x1299S460 L=6 m
elastic buckling
elastic-plastic buckling
elastic buckling
elastic-plastic buckling
0
4000
8000
12000
16000
0 100 200 300 400
Loa
d [k
N]
Lateral displacement [mm]
HD 400x1299S460
L=18.8 m
elastic buckling
elastic-plastic buckling
0
2000
4000
6000
8000
0 250 500 750 1000
Loa
d [k
N]
Lateral displacement [mm]
HD 400x1299S460
L=25.2 m
elastic buckling
elastic-plastic buckling
Fig. 8 - Finite element output: load-deflection curves for elastic and elastic-plastic buckling
analyses of HD 400x1299 columns in S460
3.8.3 Steel grades S355 and S235
Typical load-deflection curves for strong axis buckling as obtained from
finite element analyses are shown in Figure 10 for columns with different lengths with cross-section HL 920x1377 in S355 and S235 using the QST and ECCS residual stress models.
Buckling curves for heavy wide flange steel columns 17
0
0.2
0.4
0.6
0.8
1
0 1 2 3
Red
ucti
on fa
ctor
[-]
Relative slenderness [-]
Buckling curve b
FEM
HD 400x1299S460
weak-axis
Fig. 9 - Finite element results plotted in buckling curve diagram for buckling of HD 400x1299
columns in S460
0
10000
20000
30000
40000
50000
0 250 500 750 1000
Loa
d [k
N]
Lateral displacement [mm]
HL 920 x 1377L = 50 m
S235ECCS model
S355QST model
0
10000
20000
30000
40000
50000
0 50 100 150 200
Loa
d [k
N]
Lateral displacement [mm]
HL 920 x 1377L = 30 m
S235ECCS model
S355QST model
Fig. 10 - Finite element output: load-deflection curves for buckling analyses of HL 920x1377
columns
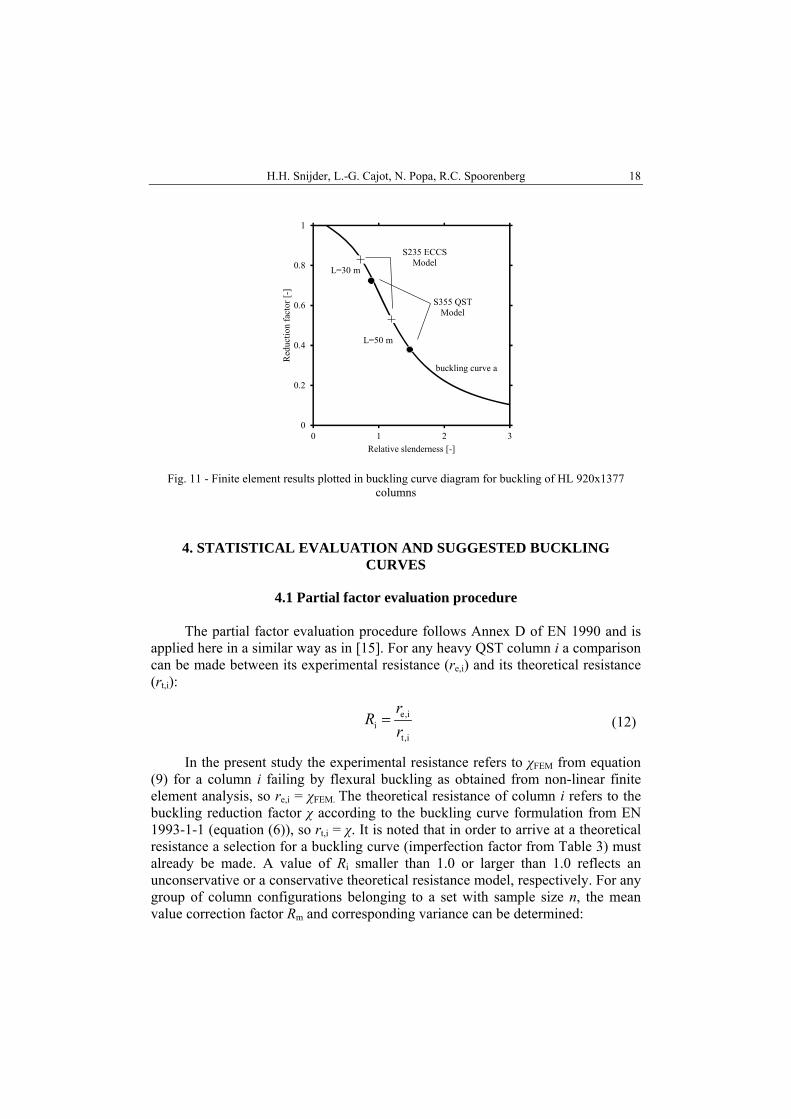
In Figure 11 the ultimate loads from Figure 10 are plotted in the buckling curve diagram using the equations (10, 11) in addition to buckling curve “a” to show that there is a reasonable fit.
H.H. Snijder, L.-G. Cajot, N. Popa, R.C. Spoorenberg 18
0
0.2
0.4
0.6
0.8
1
0 1 2 3
Red
ucti
on f
acto
r [-
]
Relative slenderness [-]
buckling curve a
S235 ECCSModel
L=30 m
L=50 m
S355 QSTModel
Fig. 11 - Finite element results plotted in buckling curve diagram for buckling of HL 920x1377
columns
4. STATISTICAL EVALUATION AND SUGGESTED BUCKLING CURVES
4.1 Partial factor evaluation procedure
The partial factor evaluation procedure follows Annex D of EN 1990 and is applied here in a similar way as in [15]. For any heavy QST column i a comparison can be made between its experimental resistance (re,i) and its theoretical resistance (rt,i):
e,ii
t,i
rR
r
(12)
In the present study the experimental resistance refers to χFEM from equation (9) for a column i failing by flexural buckling as obtained from non-linear finite element analysis, so re,i = χFEM. The theoretical resistance of column i refers to the buckling reduction factor χ according to the buckling curve formulation from EN 1993-1-1 (equation (6)), so rt,i = χ. It is noted that in order to arrive at a theoretical resistance a selection for a buckling curve (imperfection factor from Table 3) must already be made. A value of Ri smaller than 1.0 or larger than 1.0 reflects an unconservative or a conservative theoretical resistance model, respectively. For any group of column configurations belonging to a set with sample size n, the mean value correction factor Rm and corresponding variance can be determined:
Buckling curves for heavy wide flange steel columns 19
22
m i R i m1 1
1 1
1
n n
i i
R R σ R Rn n
(13)
When plotting the experimental resistance on the y-axis and corresponding theoretical resistance on the x-axis for all column configurations belonging to subset n, the points will be distributed around the so-called estimator line: re = Rm·rt.
For each column configuration belonging to subset n an error term δi is introduced:
mit,
ie,i Rr
r
(14)
A logarithmic transformation is performed:
i ilnΔ δ
(15)
For the logarithmic error terms belonging to sample size n, the mean value and corresponding variance are determined as follows:
22
i i1 1
1 1
1
n n
i i
Δ Δ σ Δ Δn n
(16)
The variance can be used to compute the coefficient of variation as follows:
2exp 1V σ
(17)
When using a subset with a sample size n > 100 the partial factor associated with the uncertainty of the resistance model can be determined as follows:
Rd 2
m d,n
11.0
exp 0.5γ
R k Q Q
(18)
For which:
2ln V 1Q
(19)
And where kd,n is the characteristic fractile factor: 0.8 · 3.8 = 3.04. So, finally equation (18) gives the partial factor γRd belonging to a suggested
buckling curve based on a set of column configurations.
H.H. Snijder, L.-G. Cajot, N. Popa, R.C. Spoorenberg 20
4.2 Partial factor for suggested buckling curves
Non-linear finite element analyses were carried out for the heavy wide flange
cross-sections of Table 2. Per steel grade, cross-section, buckling axis and where appropriate residual stress model at least 100 analyses were performed indicated by the sample size n.
4.2.1 Steel HISTAR 460
For HISTAR 460 all eight cross-sections were considered, see Table 2. For
each cross-section the weak-axis and strong-axis buckling response was evaluated. The relative slenderness of the investigated columns was in the range between 0.31 and 3.3.
Plotting the finite element results in a buckling curve diagram permits a first
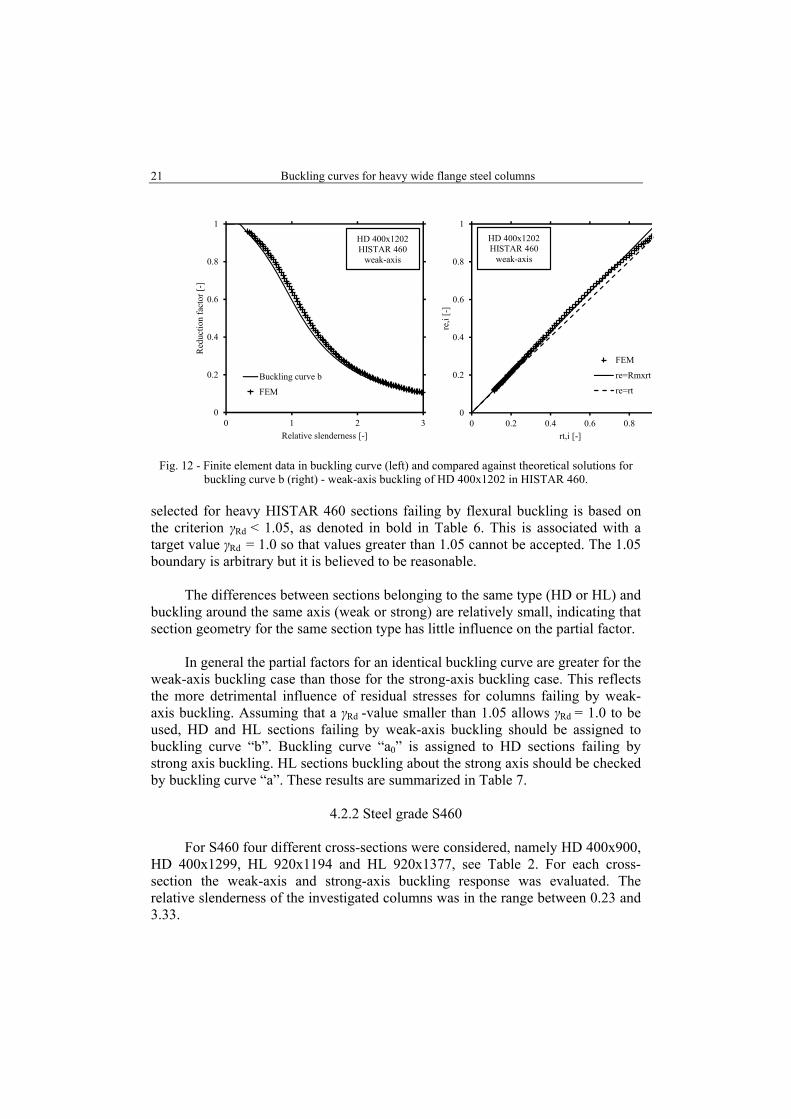
judgment on the suitability of the buckling curve to represent the column strength for heavy HISTAR 460 sections. In case the chosen buckling curve is positioned below the finite element results, it will provide conservative column strength values. The buckling curve can be regarded as unconservative when the finite element data is below the buckling curve. Figure 12 (left) shows the finite elements results for a HL 400x1202 section in HISTAR 460 buckling about its weak axis in a buckling curve diagram in addition to buckling curve “b”.
Similar trends are found when plotting the theoretical column strength rt,i = χ
against its numerical counterpart re,i = χFEM such as shown in Figure 12 (right). In case the buckling curve produces column strengths similar to the finite element results, the data is positioned on the line re = rt. Data distributed above the line re = rt indicates that the buckling curve provides conservative values for the column strength. Unconservative columns strengths are found when the data points are below re = rt. When the buckling curve formulation represents column strengths different from those obtained with finite element analyses the data points will be distributed around the line re = Rm·rt, where Rm is mean value correction factor according to equation (13), [11, 19]. This line will give a better description of the correlation between the theoretical and numerical values in comparison to re = rt.
The partial factor associated with the uncertainty of the resistance model is
evaluated for each buckling curve. The corresponding γRd-values for each section type and buckling axis are presented in Table 6. For unfavorable buckling curves the γRd-value is lower in comparison to more favorable buckling curves for a majority of the investigated cases. Hence, relating the elastic-plastic buckling response of a heavy HISTAR 460 section to a more favorable buckling curve is at the expense of a higher partial factor γRd. The most favorable buckling curve
Buckling curves for heavy wide flange steel columns 21
0
0.2
0.4
0.6
0.8
1
0 1 2 3
Red
ucti
on f
acto
r [-
]
Relative slenderness [-]
Buckling curve b
FEM
0
0.2
0.4
0.6
0.8
1
0 0.2 0.4 0.6 0.8
re,i
[-]
rt,i [-]
FEM
re=Rmxrt
re=rt
HD 400x1202HISTAR 460
weak-axis
HD 400x1202HISTAR 460
weak-axis
Fig. 12 - Finite element data in buckling curve (left) and compared against theoretical solutions for buckling curve b (right) - weak-axis buckling of HD 400x1202 in HISTAR 460.
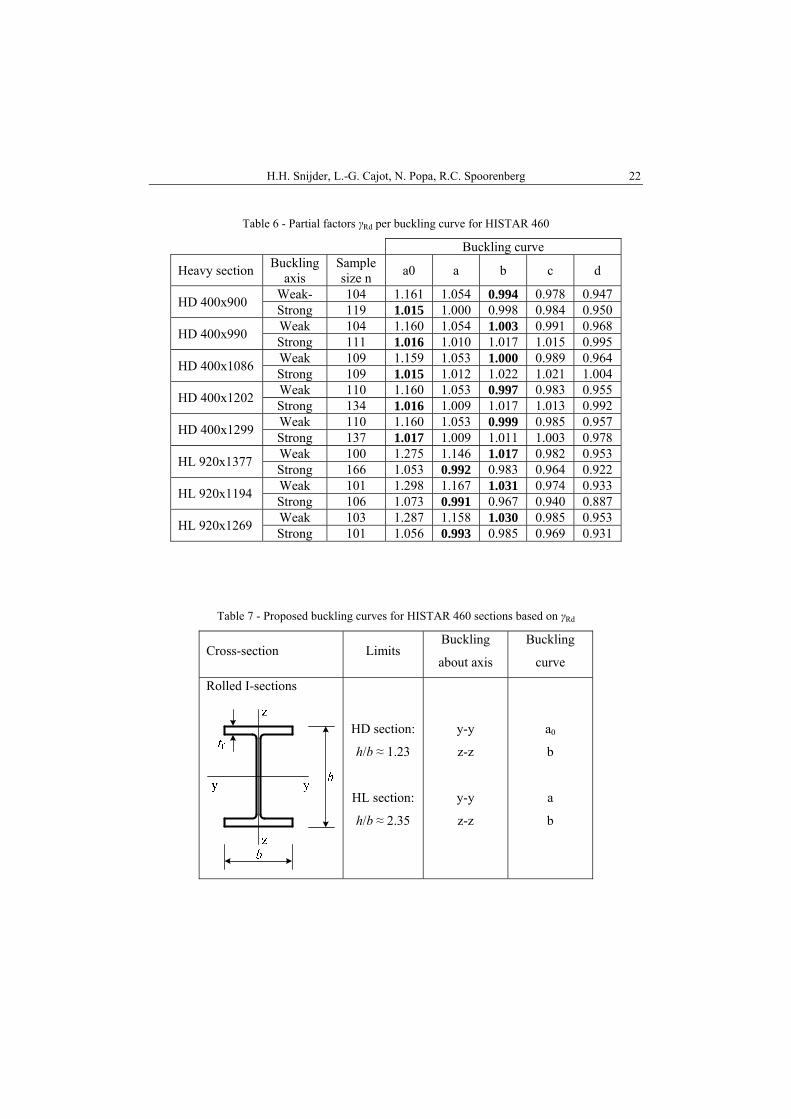
selected for heavy HISTAR 460 sections failing by flexural buckling is based on the criterion γRd < 1.05, as denoted in bold in Table 6. This is associated with a target value γRd = 1.0 so that values greater than 1.05 cannot be accepted. The 1.05 boundary is arbitrary but it is believed to be reasonable.
The differences between sections belonging to the same type (HD or HL) and
buckling around the same axis (weak or strong) are relatively small, indicating that section geometry for the same section type has little influence on the partial factor.
In general the partial factors for an identical buckling curve are greater for the
weak-axis buckling case than those for the strong-axis buckling case. This reflects the more detrimental influence of residual stresses for columns failing by weak-axis buckling. Assuming that a γRd -value smaller than 1.05 allows γRd = 1.0 to be used, HD and HL sections failing by weak-axis buckling should be assigned to buckling curve “b”. Buckling curve “a0” is assigned to HD sections failing by strong axis buckling. HL sections buckling about the strong axis should be checked by buckling curve “a”. These results are summarized in Table 7.
4.2.2 Steel grade S460
For S460 four different cross-sections were considered, namely HD 400x900,
HD 400x1299, HL 920x1194 and HL 920x1377, see Table 2. For each cross-section the weak-axis and strong-axis buckling response was evaluated. The relative slenderness of the investigated columns was in the range between 0.23 and 3.33.
H.H. Snijder, L.-G. Cajot, N. Popa, R.C. Spoorenberg 22
Table 6 - Partial factors γRd per buckling curve for HISTAR 460
Buckling curve
Heavy section Buckling
axis Sample size n
a0 a b c d
HD 400x900 Weak- 104 1.161 1.054 0.994 0.978 0.947 Strong 119 1.015 1.000 0.998 0.984 0.950
HD 400x990 Weak 104 1.160 1.054 1.003 0.991 0.968 Strong 111 1.016 1.010 1.017 1.015 0.995
HD 400x1086 Weak 109 1.159 1.053 1.000 0.989 0.964 Strong 109 1.015 1.012 1.022 1.021 1.004
HD 400x1202 Weak 110 1.160 1.053 0.997 0.983 0.955 Strong 134 1.016 1.009 1.017 1.013 0.992
HD 400x1299 Weak 110 1.160 1.053 0.999 0.985 0.957 Strong 137 1.017 1.009 1.011 1.003 0.978
HL 920x1377 Weak 100 1.275 1.146 1.017 0.982 0.953 Strong 166 1.053 0.992 0.983 0.964 0.922
HL 920x1194 Weak 101 1.298 1.167 1.031 0.974 0.933 Strong 106 1.073 0.991 0.967 0.940 0.887
HL 920x1269 Weak 103 1.287 1.158 1.030 0.985 0.953 Strong 101 1.056 0.993 0.985 0.969 0.931
Table 7 - Proposed buckling curves for HISTAR 460 sections based on γRd
Cross-section Limits Buckling
about axis
Buckling
curve
Rolled I-sections
HD section:
h/b ≈ 1.23
HL section:
h/b ≈ 2.35
y-y
z-z
y-y
z-z
a0
b
a
b
Buckling curves for heavy wide flange steel columns 23
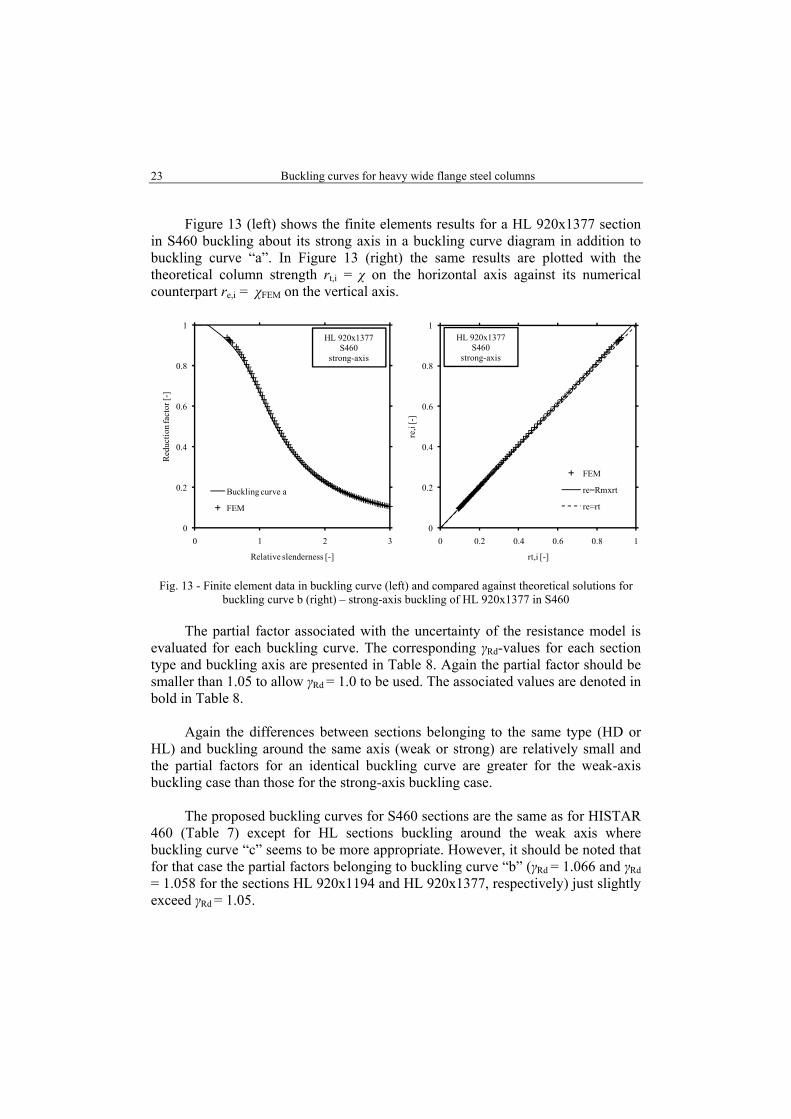
Figure 13 (left) shows the finite elements results for a HL 920x1377 section in S460 buckling about its strong axis in a buckling curve diagram in addition to buckling curve “a”. In Figure 13 (right) the same results are plotted with the theoretical column strength rt,i = χ on the horizontal axis against its numerical counterpart re,i = χFEM on the vertical axis.
0
0.2
0.4
0.6
0.8
1
0 1 2 3
Red
ucti
on fa
ctor
[-]
Relative slenderness [-]
Buckling curve a
FEM
0
0.2
0.4
0.6
0.8
1
0 0.2 0.4 0.6 0.8 1
re,i
[-]
rt,i [-]
FEM
re=Rmxrt
re=rt
HL 920x1377S460
strong-axis
HL 920x1377S460
strong-axis
Fig. 13 - Finite element data in buckling curve (left) and compared against theoretical solutions for
buckling curve b (right) – strong-axis buckling of HL 920x1377 in S460
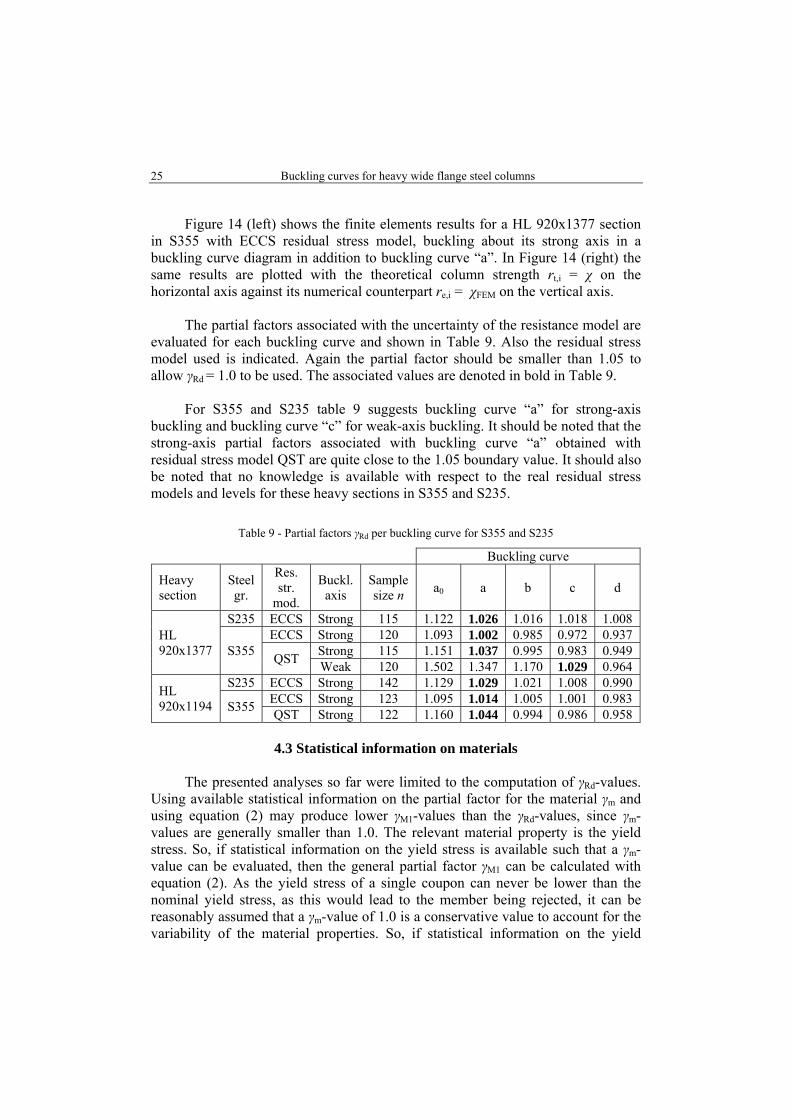
The partial factor associated with the uncertainty of the resistance model is evaluated for each buckling curve. The corresponding γRd-values for each section type and buckling axis are presented in Table 8. Again the partial factor should be smaller than 1.05 to allow γRd = 1.0 to be used. The associated values are denoted in bold in Table 8.
Again the differences between sections belonging to the same type (HD or
HL) and buckling around the same axis (weak or strong) are relatively small and the partial factors for an identical buckling curve are greater for the weak-axis buckling case than those for the strong-axis buckling case.
The proposed buckling curves for S460 sections are the same as for HISTAR
460 (Table 7) except for HL sections buckling around the weak axis where buckling curve “c” seems to be more appropriate. However, it should be noted that for that case the partial factors belonging to buckling curve “b” (γRd = 1.066 and γRd
= 1.058 for the sections HL 920x1194 and HL 920x1377, respectively) just slightly exceed γRd = 1.05.
H.H. Snijder, L.-G. Cajot, N. Popa, R.C. Spoorenberg 24
Table 8 - Partial factors γRd per buckling curve for S460
Buckling curve
Heavy section Buckling axis Sample size n
a0 a b c d
HD 400x900 Weak 116 1.209 1.092 1.004 0.982 0.952 Strong 106 1.033 1.002 1.009 1.005 0.983
HD 400x1299 Weak 131 1.208 1.091 1.005 0.980 0.945 Strong 105 1.035 1.003 1.008 1.002 0.978
HL 920x1194 Weak 100 1.356 1.218 1.066 0.978 0.935 Strong 115 1.101 0.999 0.963 0.934 0.880
HL 920x1377 Weak 108 1.355 1.214 1.058 0.990 0.972 Strong 102 1.084 0.995 0.988 0.975 0.939
4.2.3 Steel grades S355 and S235
Since HL cross-sections apparently result in less favorable buckling curves than HD cross-sections, only HL cross-sections were considered for 355 and S235. For two cross-sections in S355 and S235 strong-axis buckling was considered: HL 920x1377 and HL 920x1194, see Table 2. For cross-section HL 920x1377 made from steel grade S355 buckling about the weak-axis was considered. The relative slenderness of the investigated columns was in the range between 0.21 and 3.58.
0
0.2
0.4
0.6
0.8
1
0 1 2 3
Red
uctio
n fa
ctor
[-]
Relative slenderness [-]
Buckling curve a
FEM
0
0.2
0.4
0.6
0.8
1
0 0.2 0.4 0.6 0.8 1
re,i
[-]
rt,i [-]
FEM
re=Rmxrt
re=rt
HL 920x1377S355 ECCSstrong-axis
HL 920x1377S355 ECCSstrong-axis
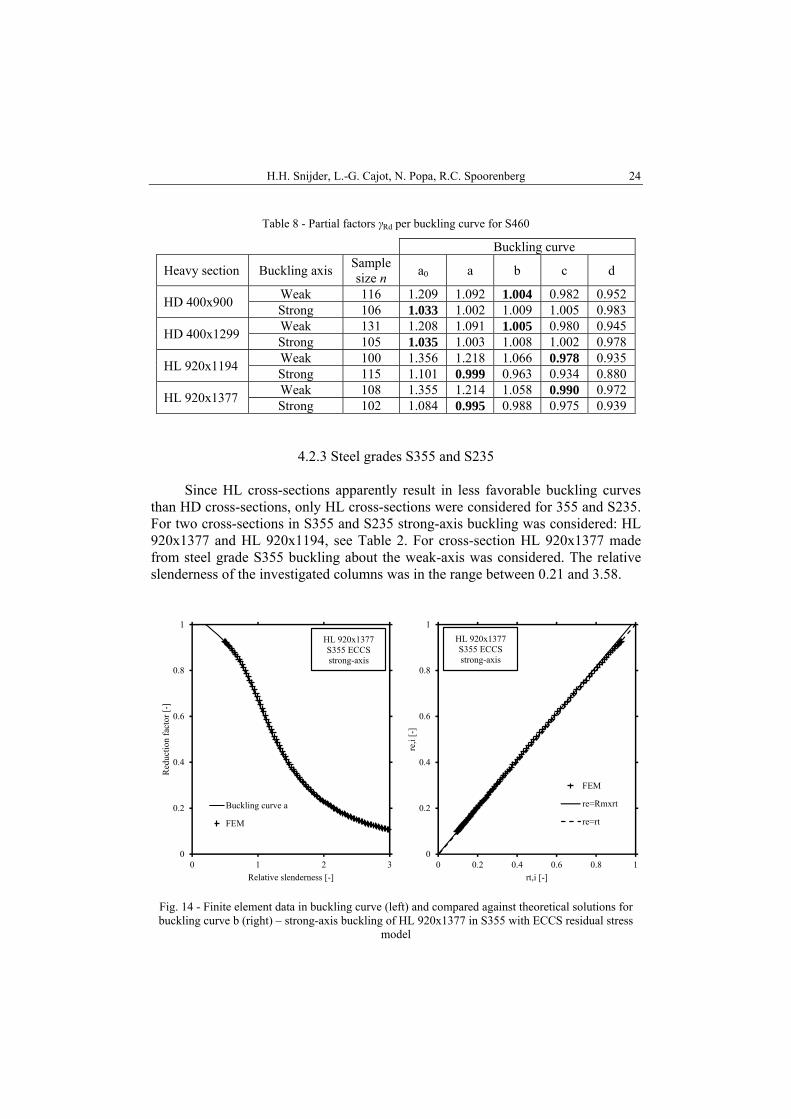
Fig. 14 - Finite element data in buckling curve (left) and compared against theoretical solutions for buckling curve b (right) – strong-axis buckling of HL 920x1377 in S355 with ECCS residual stress
model
Buckling curves for heavy wide flange steel columns 25
Figure 14 (left) shows the finite elements results for a HL 920x1377 section in S355 with ECCS residual stress model, buckling about its strong axis in a buckling curve diagram in addition to buckling curve “a”. In Figure 14 (right) the same results are plotted with the theoretical column strength rt,i = χ on the horizontal axis against its numerical counterpart re,i = χFEM on the vertical axis.
The partial factors associated with the uncertainty of the resistance model are
evaluated for each buckling curve and shown in Table 9. Also the residual stress model used is indicated. Again the partial factor should be smaller than 1.05 to allow γRd = 1.0 to be used. The associated values are denoted in bold in Table 9.
For S355 and S235 table 9 suggests buckling curve “a” for strong-axis
buckling and buckling curve “c” for weak-axis buckling. It should be noted that the strong-axis partial factors associated with buckling curve “a” obtained with residual stress model QST are quite close to the 1.05 boundary value. It should also be noted that no knowledge is available with respect to the real residual stress models and levels for these heavy sections in S355 and S235.
Table 9 - Partial factors γRd per buckling curve for S355 and S235
Buckling curve
Heavy section
Steel gr.
Res. str.
mod.
Buckl. axis
Sample size n
a0 a b c d
HL 920x1377
S235 ECCS Strong 115 1.122 1.026 1.016 1.018 1.008
S355 ECCS Strong 120 1.093 1.002 0.985 0.972 0.937
QST Strong 115 1.151 1.037 0.995 0.983 0.949 Weak 120 1.502 1.347 1.170 1.029 0.964
HL 920x1194
S235 ECCS Strong 142 1.129 1.029 1.021 1.008 0.990
S355 ECCS Strong 123 1.095 1.014 1.005 1.001 0.983 QST Strong 122 1.160 1.044 0.994 0.986 0.958
4.3 Statistical information on materials
The presented analyses so far were limited to the computation of γRd-values.
Using available statistical information on the partial factor for the material γm and using equation (2) may produce lower γM1-values than the γRd-values, since γm-values are generally smaller than 1.0. The relevant material property is the yield stress. So, if statistical information on the yield stress is available such that a γm-value can be evaluated, then the general partial factor γM1 can be calculated with equation (2). As the yield stress of a single coupon can never be lower than the nominal yield stress, as this would lead to the member being rejected, it can be reasonably assumed that a γm-value of 1.0 is a conservative value to account for the variability of the material properties. So, if statistical information on the yield
H.H. Snijder, L.-G. Cajot, N. Popa, R.C. Spoorenberg 26
stress is not available, the partial factor for the material γm can be safely set equal to γm = 1.0 and the general partial factor – based on equation (2) – is equal to γM1 = γRd.
4.3.1 Steel HISTAR 460
Since for HISTAR 460 published statistical information on the yield stress is
not yet available γm = 1.0 is used to compute the general partial factor γM1 according to equation (2): i.e. γM1 = γRd. Assuming that γM1 = 1.0 is the target value for the general partial factor, then the (arbitrary but reasonable) criterion for choosing a buckling curve is that γM1 < 1.05. So, in fact for HISTAR 460 with γM1 = γRd, also the partial factor should fulfil the requirement γRd < 1.05. This means that for HISTAR 460 the buckling curves of Table 7 can be used with γM1 = 1.0. As soon as a database becomes available containing the yield stress from a wide set of coupon tests on HISTAR 460 sections, a value of γm lower than 1.0 can be obtained resulting in either a lower general partial factor or a more favorable buckling curve.
4.3.2 Steel grade S460
For S460, statistical literature information concerning the yield stress fy, is used to estimate γm < 1.0. Two RFCS (Research Fund for Coal and Steel) projects provide statistical data: OPUS [20] and PROQUA [21].
OPUS [20] provides statistical data for the yield stress of S460M in the flange thickness range of 16 < tf < 40mm: the mean value is fy,m = 521.1 N/mm2, the standard deviation is fy,σ = 26.75 N/mm2 and the coefficient of variation then is Vfy = fy,m/ fy,σ = 0.051. The ratio between mean and nominal yield stress can be calculated as R = fy,m/ fy,nom = 521.1/460 = 1.13. If it is assumed that this ratio also applies to S460 cross-sections with flange thicknesses tf > 100mm, then with a reduced nominal yield stress for thickness fy,nom = 385 N/mm2, the mean value becomes: fy,m = fy,nom R = 385 · 1.13 = 435 N/mm2. Keeping the coefficient of variation the same, the material partial factor can be calculated using:
ymy,
nomy,m 64.11 fVf
f
(20)
This results in γm = 385/(435(1-1.64 · 0.051)) = 0.966. If this material partial factor is used with the partial factors γRd of Table 8 in equation (2), more favorable general partial factors γM1 are obtained. This does not affect the buckling curves for HD sections nor does it affect the buckling curve for strong-axis buckling of HL columns but it does affect the buckling curve for weak-axis buckling of HL columns. For HL columns in weak-axis buckling and for buckling curve “b” the γRd-values are 1.066 and 1.058 for HL 920x1194 and HL 920x1377 respectively.
Buckling curves for heavy wide flange steel columns 27
Multiplied (equation (2)) by γm = 0.966 the γM1-values become 1.030 and 1.022 respectively. So γM1 < 1.05 meaning that γM1 = 1.0 may be used in this case together with buckling curve “b”. This means that also for S460 the buckling curves of Table 7 can be used with γM1 = 1.0.
Statistical data given in PROQUA [21] together with plant measurements support the value γm = 0.966 used.
4.3.3 Steel grades S355 and S235
Though statistical information on the yield stress of S355 and S235 is readily
available, there are other reasons (to be mentioned hereafter) not to use this information.
5. BUCKLING CURVES FOR EUROCODE3
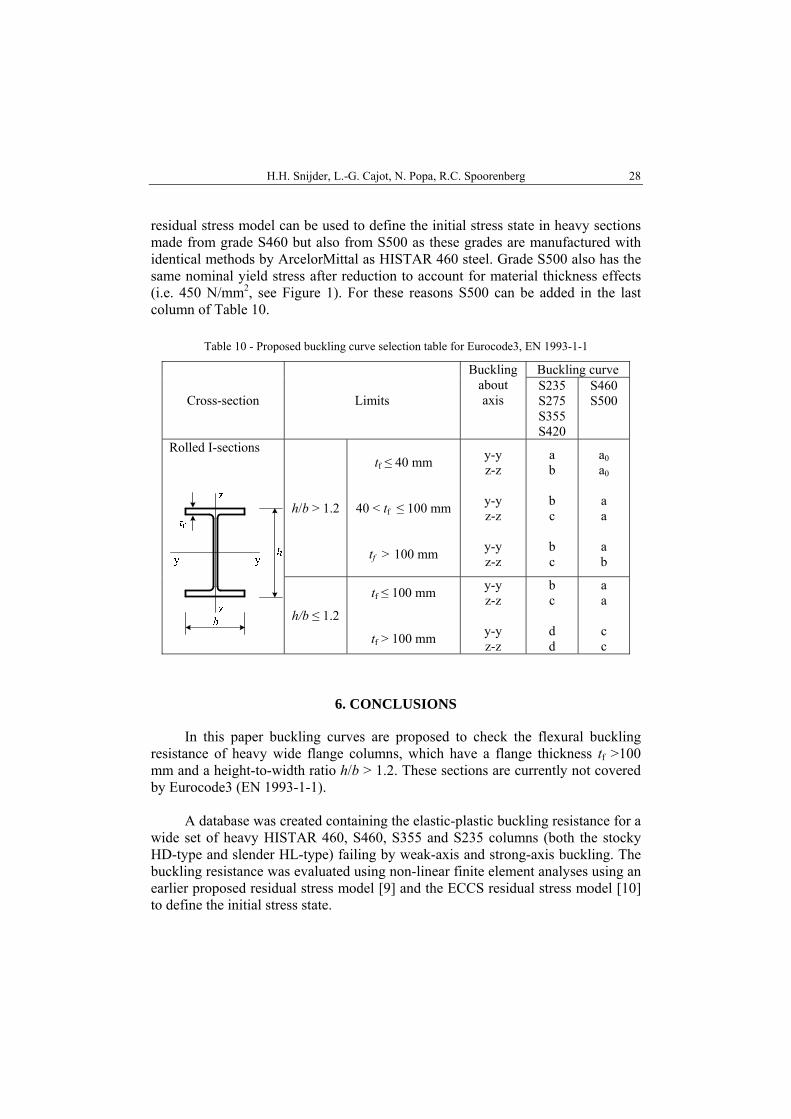
Though for HISTAR 460 and S460 the buckling curves of Table 7 may be used for heavy sections with h/b > 1.2 and tf > 100 mm in combination with the general partial factor γM1 = 1.0, these buckling curves cannot be incorporated in Eurocode3 EN 1993-1-1 [8] if the format of the buckling curve selection table (see Table 1) is to be kept, since no distinction is made between HD and HL cross-sections. For that reason, the most unfavorable buckling curves for HD and HL cross-sections of Table 7 are used in the proposed new Eurocode3 buckling curve selection table (Table 10). Also the proprietary name HISTAR can obviously not be mentioned in the proposed Eurocode3 buckling curve selection table.
For S355 and S235 it was shown in section 4.2.3 that for heavy sections with
h/b > 1.2 and tf > 100 mm the buckling curves “a” and “c” may be used for strong and weak-axis buckling respectively, together with γRd = 1.0. This result may even be improved using statistical data on the yield stress resulting in γm < 1.0 and thus in either a lower value of the general partial factor γM1 or in more favorable buckling curves than mentioned. However, this does not make sense as long as no further and better information is available on residual stress distributions in heavy sections with h/b > 1.2 and tf > 100 mm in S355 and S235. In fact, information on residual stresses is not available at this moment at all. For that reason it is proposed to conservatively use the buckling curves “b” and “c”, which fit nicely in the table when comparing with buckling curves for other cases. Often, moving from S460 to lower steel grades means a shift of one buckling curve and the current proposal is in line with that.
The QST residual stress model [9] as used in the present analyses is
representative for any heavy wide flange section having similar cross-sectional dimensions and made with the Quenched and Self-Tempered process. As such, the
H.H. Snijder, L.-G. Cajot, N. Popa, R.C. Spoorenberg 28
residual stress model can be used to define the initial stress state in heavy sections made from grade S460 but also from S500 as these grades are manufactured with identical methods by ArcelorMittal as HISTAR 460 steel. Grade S500 also has the same nominal yield stress after reduction to account for material thickness effects (i.e. 450 N/mm2, see Figure 1). For these reasons S500 can be added in the last column of Table 10.
Table 10 - Proposed buckling curve selection table for Eurocode3, EN 1993-1-1
Cross-section Limits
Buckling about axis
Buckling curve S235 S275 S355 S420
S460 S500
Rolled I-sections
h/b > 1.2
tf ≤ 40 mm
40 < tf ≤ 100 mm
tf > 100 mm
y-y z-z
y-y z-z
y-y z-z
a b
b c b c
a0 a0
a a a b
h/b ≤ 1.2
tf ≤ 100 mm
tf > 100 mm
y-y z-z
y-y z-z
b c
d d
a a
c c
6. CONCLUSIONS
In this paper buckling curves are proposed to check the flexural buckling resistance of heavy wide flange columns, which have a flange thickness tf >100 mm and a height-to-width ratio h/b > 1.2. These sections are currently not covered by Eurocode3 (EN 1993-1-1).
A database was created containing the elastic-plastic buckling resistance for a
wide set of heavy HISTAR 460, S460, S355 and S235 columns (both the stocky HD-type and slender HL-type) failing by weak-axis and strong-axis buckling. The buckling resistance was evaluated using non-linear finite element analyses using an earlier proposed residual stress model [9] and the ECCS residual stress model [10] to define the initial stress state.
Buckling curves for heavy wide flange steel columns 29
The numerical buckling loads were compared against theoretical values, where the latter correspond to the buckling resistances for a selected buckling curve according to EN 1993-1-1. Based on the ratio between both values, a partial factor γRd associated with the uncertainty of the resistance model was evaluated according to Annex D of EN 1990-1-1 for each of the five buckling curves.
Aiming at a target value for the general partial factor of γM1 = 1.0, meaning
that the resulting γM1-values should not exceed 1.05, buckling curves are proposed. For cross-sections with h/b > 1.2 and tf > 100 mm in steel grades S460 and S500 the buckling curves “a” and “b” are proposed for strong and weak-axis buckling respectively, while for these cross-sections in steel grades S235 up to and including S420 the buckling curves “b” and “c” are proposed for strong and weak-axis buckling respectively.
Quenched and Self-Tempered (QST) steel cross-sections are currently
manufactured under the proprietary name HISTAR (HIgh STrength ARcelorMittal) by ArcelorMittal. For stocky HD cross-sections in HISTAR 460 with h/b ≈ 1.23 and tf > 100 mm it was shown that the buckling curves “a0” and “b” can be used for strong and weak-axis buckling respectively. For slender HL cross-sections in HISTAR 460 with h/b ≈ 2.35 and tf > 100 mm it was shown that the buckling curves “a” and “b” can be used for strong and weak-axis buckling respectively.
REFERENCES
1. SPOORENBERG, R.C., SNIJDER, H.H., CAJOT, L.-G., POPA, N., Buckling curves for heavy wide flange QST columns based on statistical evaluation, Journal of Constructional Steel Research, 101, pp. 280-289, 2014.
2. AXMANN, G., Steel going strong, Modern Steel Construction, 43, pp. 56-61, 2003. 3. POLLAK, B.S., Designing with Grade 65, Modern Steel Construction, 44, 2004. 4. European Technical Approval ETA-10/0156, Long Products made of HISTAR 355/355L and
HISTAR 460/460L, Deutsches Institut für Bautechnik – European Organisation for Technical Approvals, 2010.
5. EN-10025-4 Hot rolled products of structural steels – Part 4: Technical delivery conditions for themomechanical rolled weldable fine grain structural steels, CEN European Committee for Standardization, 2004.
6. EN 10025-2 Hot rolled products of structural steels - Part 2: Technical delivery conditions for non-alloy structural steel, CEN: European Committee for Standardization, 2004.
7. EN 10025-3 Hot rolled products of structural steels - Part 3: Technical delivery conditions for normalized/normalized rolled weldable fine grain structural steels, CEN: European Committee for Standardization, 2004.
8. EN 1993-1-1, Eurocode 3. Design of steel structures, general rules and rules for buildings, Brussels: CEN European Committee for Standardization, 2004.
9. SPOORENBERG, R.C., SNIJDER, H.H., CAJOT, L.-G., MAY, M.S., Experimental investigation on residual stresses in heavy wide flange QST steel sections, Journal of Constructional Steel Research, 89, pp. 63-74, 2013.
H.H. Snijder, L.-G. Cajot, N. Popa, R.C. Spoorenberg 30
10. VOGEL, U., et al., Ultimate Limit State Calculation of Sway Frames with Rigid Joints, ECCS Publication No 33, 1984.
11. EN 1990, Eurocode - Basis for structural design, Brussels: CEN European Committee for Standardization, 2001.
12. BEER, H., SCHULZ, G., Bases théoriques des courbes européennes de flambement, Construction Métallique, No. 3, 1970.
13. RONDAL, J., MAQUOI, R., Single Equation for SSRC Colomn-Strength Curves, Journal of the Structural Division, Proc. of the ASCE, 105, No. ST1, pp. 247-250, 1979.
14. SEDLACEK, G., UBGERMANN, D., KUCK, J., MAQUOI, R., JANSS, J., Background documentation Document 5.03 (partim) - Evaluation of test results on beams with cross-sectional class 1-3 in order to obtain strength functions and suitable model factors, Eurocode 3 Editorial Group, 1989.
15. REBELO, C., LOPES, N., SIMOES DA SILVA, L., NETHERCOT, D., VILA REAL, P.M.M., Statistical evaluation of the lateral-torsional buckling resistance of steel I-beams, Part 1: Variability of the Eurocode 3 resistance model, Journal of Constructional Steel Research, 65, pp. 818-831, 2009.
16. SIMOES DA SILVA, L., REBELO, C., NETHERCOT, D., MARQUES, L., SIMOES, R., VILA REAL, P.M.M., Statistical evaluation of the lateral-torsional buckling resistance of steel I-beams, Part 2: Variability of steel properties, Journal of Constructional Steel Research, 65, pp. 832-849, 2009.
17. BAN, H., SHI, G., SHI, Y., WANG Y., Overall buckling behavior of 460 MPa high strength steel columns: Experimental investigation and design method, Journal of Constructional Steel Research, 74, pp 140-150, 2012.
18. SHI G., BAN, H., BIJLAARD, F.S.K., Tests and numerical study of ultra-high strength steel columns with end restraints, Journal of Constructional Steel Research, 70, pp. 236-247, 2012.
19. BIJLAARD, F.S.K., Eurocode 3 Design of steel structures – Present status and further developments, Steel Construction – Design and Research, 1, 1, pp. 16-23, 2008.
20. BRACONI, A., et al., OPUS, Optimizing the seismic performance of steel and steel-concrete structures by standardizing material quality control, European Commission, Technical Steel Research, Steel products and applications for building construction and industry, Final report, Directorate-General for Research, EUR 25893, ISBN: 978-92-79-29037-4, 2013.
21. CAJOT, L.-G., et al., PROQUA, Probabilistic quantification of safety of a steel structure highlighting the potential of steel versus other materials, European Commission, Technical Steel Research, Steel products and applications for building construction and industry, Final report, Directorate-General for Research, EUR 21695 EN, Luxembourg: Office for Official Publications of the European Communities, ISBN 92-894-9864-1, 2005.


