does training on behavioral finance influence fund...
TRANSCRIPT

Does training on behavioral finance influence
fund managers’ perception and behavior?
Marina Nikiforow, Leibniz Universität Hannover, Germany
Discussion Paper No. 419
June 2009
ISSN 0949-9962
Abstract
This paper provides survey evidence on the influence of training on behavioral finance
on professional fund managers’ perception and investment behavior. In particular, it exam-
ines whether “trained” fund managers differ from the “untrained” ones in their perception
of markets and themselves as well as in their choice of information sources and investment
strategies. Additionally, the influence of integration of behavioral finance approaches into
investment processes is also considered. The results reveal that training on behavioral fi-
nance basically intensifies the perception of biases in the behavior of others, i.e. the reflec-
tion effect and the home bias. Training also reduces the affinity to conformity, leading to
less reliance on colleagues and other market participants as information sources. However,
pure training is insufficient to significantly affect fund managers’ investment behavior, but
behavioral finance approaches need to be integrated into investment processes.
JEL codes: G 10 (general financial markets), D 83 (learning, knowledge, belief)
Keywords: behavioral finance, fund managers, biases, training, integration
Marina Nikiforow, Department of Economics, Leibniz Universität Hannover,
Königsworther Platz 1, D-30167 Hannover, Germany, [email protected]

2
1. Introduction
Psychologists argue that behavioral biases are difficult to overcome even with the
knowledge of their existence (Pronin et al., 2002). From several studies we know that fi-
nancial experts such as brokers, investment bankers, or fund managers are subject to be-
havioral finance biases which negatively affect their performance (see e.g. Biais et al.,
2005). As financial experts typically act fiduciarily, are monitored and paid for good per-
formance, they, in fact, have stronger incentives to learn rational behavior. However, ex-
perts’ sophistication and trading experience may diminish but still fail to eliminate biases
such as e.g. the disposition effect (Shapira and Venezia, 2001, Feng and Seasholes, 2005,
Visaltanachoti et al., 2007)
1. Studies directly comparing the behavior of professionals and
students unveil that professionals often behave even more overconfidently (Glaser et al.,
2005) or exhibit a greater extent of myopic loss aversion than students (Haigh and List,
2005).
This paper ties up to the discussion on the persistence of behavioral anomalies in the
behavior of financial professionals.2 It analyzes the influence of training on behavioral
finance on professional fund managers’ perception and investment behavior.3 A question-
naire survey conducted among German fund managers provides data for this examination.
First, the survey sample is split into two groups: (i) The “trained” fund managers, who get
seminars and training on behavioral finance on the part of their employers, and the “un-
1 Shapira and Venezia (2001) detect that both professional and individual investors are subject to the disposi-
tion effect, whereas this effect is stronger for the latter. Feng and Seasholes (2005) show that sophistication
and trading experience reduce the propensity to realize gains too soon, but fail to eliminate it. Visaltanachoti
et al. (2007) provide strong evidence for the disposition effect in Chinese A-share markets, which are domi-
nated by individual investors; however, regarding B-shares markets, which are dominated by sophisticated
institutional investors, the evidence for the disposition effect is relatively weak. 2 Menkhoff and Nikiforow (2009) analyze the impact of fund managers’ endorsement of behavioral finance
on their perception of markets and themselves. This study reveals that endorsers of behavioral finance sig-
nificantly better recognize behavioral biases in the behavior of other fund managers. However, the view of
one’s own biases is hardly influenced by the endorsement of behavioral finance. Thus, even though endorsers
of behavioral finance are well-informed about the existing behavioral biases and have strong incentives to
learn efficient behavior, they still fail to recognize their own biases more appropriately. Such a biased self-
perception might hinder the effort to overcome one´s own biases. 3 Henceforth, “training” stands for “training on behavioral finance”.

3
trained” ones, who do not get any training in that field. These two groups are tested for
differences with respect to their perception of markets, their self-assessment as well as
their choice of information sources and investment strategies. Second, apart from this gen-
eral analysis, the underlying survey data allow for exploring two further interesting ques-
tions: (ii) How might “experts”, i.e. those fund managers who assess themselves as pos-
sessing good knowledge in behavioral finance, differ from each other depending on
whether they are trained in behavioral finance or not? (iii) How might “trained” fund man-
agers differ from each other, depending on whether their company has integrated behav-
ioral finance approaches into its investment processes or not?4 These two additional con-
siderations aim to examine the influence of training more specifically.
The analysis reveals that the degree of confrontation with behavioral finance in their
daily business affects fund managers’ perception and behavior in a different manner.
Training on behavioral finance, which can be regarded as the weakest kind of implementa-
tion of behavioral finance issues, intensifies fund managers’ perception of biases in the
behavior of others, specifically the reflection effect and the home bias. Training also re-
duces the affinity to conformity – leading to less reliance on colleagues and other market
participants as information sources; however, training does not result in a significant dif-
ferent reliance on other information sources regarded here, i.e. fundamental facts and tech-
nical indicators. Integration of behavioral finance into investment processes, regarded as
strongest kind of implementation of behavioral finance, particularly influences fund man-
agers’ investment behavior. Regarding the information sources used, integration reduces
the importance of fundamental facts (besides the importance of colleagues and other mar-
ket participants). Furthermore, it significantly affects the use of investment strategies: The
buy-and-hold strategy loses its relevance mostly in favor of other strategies (an answering
4 Henceforth, “integration” or “integration of behavioral finance approaches” stands for “integration of be-
havioral finance approaches into investment processes of a company”.

4
category not specified in the survey, but different to the strategies momentum, contrarian,
and buy-and-hold) as well as in favor of the behavioral-finance-motivated momentum
strategy. Hence, training alone rather influences fund managers’ perception and only partly
their investment behavior (at least with regard to the information sources used), whereas
the latter is mainly affected by integration of behavioral finance approaches into invest-
ment processes.5
The remainder of this paper is structured as follows. Section 2 describes the data of the
questionnaire survey. The comparison groups for the three analyses are defined in Section
3. Section 4 presents the results regarding the groups’ perception, specifically that of mar-
kets and themselves. Section 5 focuses on the effects on groups’ investment behavior. Sec-
tion 6 concludes the paper.
2. Data
Between August 15 and December 12, 2002 we conducted a questionnaire survey in
Germany which yielded a representative sample of 117 questionnaires from 35 relevant
German fund management companies. Concerning participating fund management compa-
nies - out of the 59 fund management companies we addressed - this survey resulted in a
response rate of 59%. To avoid any misinterpretation in the formulation of questions and
thus to ensure the reliability of responses, many intensive interviews with fund managers
as well as pre-tests were held before starting the survey. Feedback indicates that the re-
sponse is useful for our research purpose.6
5 We regard the non-influence of training on fund managers’ investment behaviour as a result of an invest-
ment process being determined not by fund managers themselves but by others, e.g. by a company’s senior
management and/or the head of an asset management team. Thus, fund managers usually have to follow
some given investment guidelines, without having a direct influence on them. In this case the given invest-
ment guidelines represent a kind of an institutional “barrier”, which hinders fund managers from adjusting
their investment approach to their knowledge of behavioral finance. This is a plausible explanation for the
observed non-influence of training on fund managers’ investment behaviour. In contrast, the impact of train-
ing becomes observable when fund managers are not restricted by anything, i.e. in case of their perception. 6 The analyses in Menkhoff and Schmidt (2005) and Menkhoff et al. (2006) rely on the same survey.

5
To analyze, first, the influence of training on behavioral finance as well as, second, the
influence of the integration of behavioral finance findings into the investment process on
fund managers’ perception and investment behavior, three pairs of comparison groups are
considered. These groups are formed by reverting to three statements in the questionnaire.
These statements are given in Table 3 as BF (Behavioral Finance) 1, BF2, and BF3, all
assessed by 6 answering categories, ranging from “completely agree” (coded as 1) to
“completely disagree” (coded as 6). By the degree of approval to statement BF1 the re-
spondent expresses to which extent he or she is trained on behavioral finance. For a more
specific differentiation, the information from statement BF2 is also used, where fund man-
agers assess their state of knowledge in behavioral finance. By assessing statement BF3,
the respondent states to which extent his or her company implements behavioral finance
findings in its investment process.
3. Formation of comparison groups
3.1 “Trained” versus “Untrained” fund managers (Analysis I)
The analysis starts by considering the general influence of training on behavioral fi-
nance on fund managers’ perception and behavior. For this purpose the respondents are
split into two comparison groups based on their assessment of statement BF1, asking about
the offer of training and seminars on the part of the respondent’s employer.
Regarding the answer distribution to statement BF1 in Figure 1, it becomes obvious that
behavioral finance still plays an inferior role in German fund management companies.
Only 6 of 110 (5.5%) respondents get relatively intensive training on behavioral finance
issues (answering category “completely agree” coded as 1), whereas 40 of them (36.4%)
get no offer for behavioral finance education or training at all (answering category “com-
pletely disagree” coded as 6).

6
Due to the striking left-skewed distribution of answers, it seems plausible to define
those fund managers with answering categories 1-4 as “trained” ones and assign those with
answering categories 5-6 to the “untrained” group. This way of clustering results in 39
trained (35.5%) vs. 71 untrained (64.5%) fund managers.
3.2 “Trained experts” versus “Untrained experts” (Analysis II)
According to the chi-square test as well as to the Spearman rank correlation, the state-
ments BF1 and BF2 are not independent.7 Their significant positive correlation (p-value
0.015) implies that the knowledge of behavioral finance key messages improves with an
increasing offer of seminars to behavioral finance, which is not really surprising but rather
expected. This confirmation of the expected relation between BF1 and BF2 provides a
good basis for the second, more specific analysis, i.e. whether it matters to be a trained or
an untrained “expert” in behavioral finance (Table 1). Focusing only on “experts”, i.e.
those fund managers who possess “good knowledge” in behavioral finance, might reveal a
specific, marginal influence of training on this good knowledge: As “trained experts” regu-
larly stay in touch with recent insights into behavioral finance research, one might expect
that their knowledge is frequently updated and their behavior rather well trained in this
field. In contrast, the “untrained experts” might have gained their good knowledge of be-
havioral finance in seminars or training some time ago or even through self-study. There-
fore, compared to the trained experts, the untrained experts do not stay in touch with be-
havioral finance issues so regularly, so that they can be assumed to be relatively less so-
phisticated regarding behavioral finance issues. As this second analysis aims for a more
specific differentiation of groups, it can also be regarded as a robustness test for the first
analysis.
7 The result of the chi-square test for statements BF1 and BF2 is 30.602 with the p-value 0.061. The coeffi-
cient of the Spearman rank correlation is 0.232 with the p-value 0.015.

7
To analyze whether it matters to be a trained or an untrained expert, the information
from the assessment of availability of training on behavioral finance (BF1) is combined
with the information on the state of knowledge in behavioral finance (BF2). First, “ex-
perts” in behavioral finance are defined as those fund managers who assess themselves as
possessing “good knowledge” of the behavioral finance key messages, i.e. who answer
statement BF2 with answering categories 1 and 2.8 Second, the group of experts is differ-
entiated according to their assessment of statement BF1. This consideration results in 27
“trained experts”, who posses good knowledge of behavioral finance due to training (BF1-
answering categories 1-4) and 42 “untrained experts”, who posses good knowledge without
training (BF1-answering categories 5-6). These two groups are framed in the contingency
table in Table 1.
3.3 “Trained and BF integrated” versus “Trained and BF not integrated” (Analysis III)
The third analysis examines whether “trained” fund managers’ differ among themselves
depending on the extent of integration of behavioral finance approaches into investment
processes of their company. Thus, it tests for additional influences on trained fund manag-
ers emerging particularly from the integration of behavioral finance. The contingency table
in Table 2 illustrates the definition of the comparison groups for this analysis.
The focus is put only on “trained” fund managers as defined in section 3.1. Here, this
group is further separated on the basis of answers to statement BF3, asking about the extent
to which the respondent’s company implements behavioral finance findings in its invest-
ment process. Regarding the distribution of answers for BF3 given in Table 2, the compari-
son groups are formed by comprising the BF3 answering categories 1-3 vs. 4-6. This de-
fines the groups “Trained and BF integrated” with 21 fund managers, and “Trained and BF
not integrated” with 18 fund managers.
8 Due to the distribution of answers to statement BF2 (see the contingency table in Table 1) the group “ex-
perts” is defined by comprising answering categories 1 and 2, whereas category 3 seems to characterize an
intermediate stance in comparison to the sample.

8
4. Trained fund mangers’ perception of markets and their self-assessment
4.1 Perception of markets
To learn about fund managers’ perception of markets, we ask them to assess the five
statements given in Table 4.
The house money effect, which is grasped by the statement MP (Market Perception) 1,
names the phenomenon that investors become less loss-averse and more likely to take risks
when reinvesting recently made profits. Psychologically, this behavior is explained through
the fact that the perceived discomfort in case of a loss of recently earned money is dimin-
ished only because it was a gain before (Thaler and Johnson, 1990).
The confirmatory bias (statement [MP2]) describes a behavioral propensity which oc-
curs after a decision has been made. Then, people tend to collect information which con-
firms their decisions, thereby ignoring contrary evidence or interpreting even ambiguous
information in favor of their earlier decision. The confirmatory bias serves to preserve the
self-respect of a decider as well as to avoid regret or unpleasant feelings after decision-
making (Festinger, 1957, Nickerson, 1998, Pronin, 2007).
Statement [MP3] addresses the reflection effect. This behavioral bias implies a change
in the risk attitude of an investor depending on whether an outcome is a gain or a loss:
People display risk aversion in the domain of gains, whereas they behave loss averse and
even risk seeking in the domain of losses (Kahneman and Tversky, 1979). Statement
[MP3] asks about the risk seeking behavior in case of loss positions, which partly explains
the disposition effect9, subsuming that investors tend to hold loser assets too long.
Statement [MP4] serves to detect the home bias, i.e. the preference to invest in the home
market or in markets in closer proximity. The psychological explanation for this bias is the
human preference for familiarity, associated with the belief that one possesses more or
9 Investors’ propensity to hold loser stocks too long and to sell winner stocks too early was called the “dispo-
sition effect” by Shefrin and Statman (1985).

9
even special information about the local market (Babilis and Fitzgerald, 2005, Lütje and
Menkhoff, 2007, Konishi, 2007).10
Herding is the last behavioral finance bias considered here with statement [MP5]. Herd-
ing means that - under certain circumstances - fund managers imitate the behavior of oth-
ers, thereby ignoring their own relevant information (see Bikhchandani and Sharma, 2001,
Guo and Shih, 2008, Lütje, 2008).11
Results
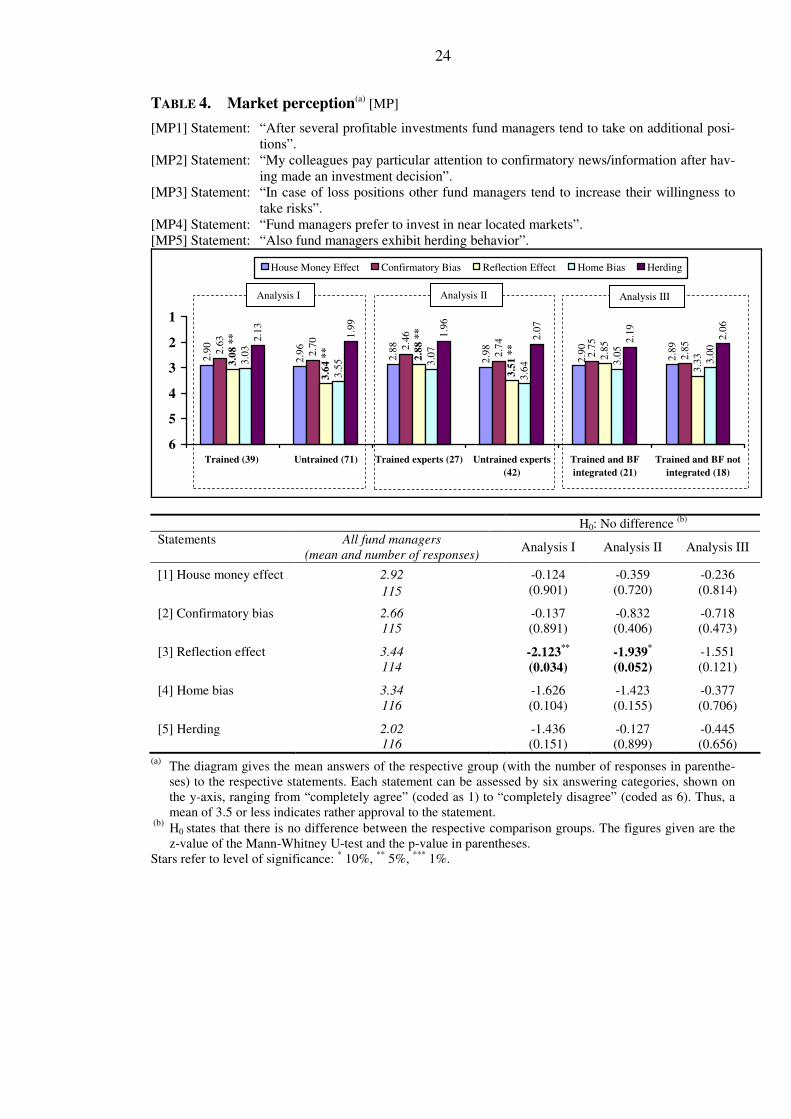
Table 4 gives the mean answers of the respective group to the statements [MP1]-
[MP5]. Regarding the formation of the bars it is striking that, except for the reflection ef-
fect (statement [MP3]), the perception intensities for the five biases examined here are
rather equally ranked in all groups: Herding [MP5] is perceived most strongly, followed by
the confirmatory bias [MP2], the house money effect [MP1] and finally the home bias
[MP4]. A significant impact of training on the perception of biases in the market is observ-
able in the case of the reflection effect [MP3] in analyses I and II. Trained fund managers
perceive this bias significantly more strongly than the untrained ones (mean of 3.08 versus
3.64). Trained experts among the fund managers shape up as being mostly sensitized to
this bias (mean of 2.88) which partly accounts for the well-known disposition effect. This
result indicates a learning effect and thus an obvious impact of training on fund managers’
market perception. In particular, an increased awareness of the reflection effect is a very
10
In the UK pension fund portfolios, Babilis and Fitzgerald (2005) detect strong evidence for the home bias
against overseas foreign assets, and among the latter, in particular, against emerging markets. In the German
market, the study of Lütje and Menkhoff (2007) reveals the home bias in the behavior of professional equity
managers. Konishi (2007) provides some evidence for the reduction of the home bias when the world stock
markets are integrated, thus giving foreign investors the opportunity of investing in domestic stocks more
easily (here shown for NASDAQ). 11
For the Taiwan market Guo and Shih (2008) show that the degree of directional co-movement, as a modi-
fied measure of herd behaviour, is higher in the high-tech stocks market than in traditional industries. Fur-
thermore, they find that herding is greater during extreme up markets for all industries. Lütje (2009) provides
evidence for reputational herding among professional fund managers. In his study, herding managers regard
themselves as generally more risk averse than their non-herding peers.

10
welcome result, considering that the literature warns against the consequences of the dis-
position effect, for which several studies provide evidence of its negative impact on risk-
adjusted performance (Odean, 1998, Coval and Shumway, 2005, Locke and Mann, 2005).
Furthermore, the difference in the perception of the home bias in analysis I is close to
significance (p-value of 0.104): Compared to untrained fund managers, the trained ones
observe the home bias remarkably more strongly (mean of 3.03 vs. 3.55). In analysis II,
this difference also persists among the experts on behavioral finance with a p-value of
0.155.
Analysis III does not reveal any significant results. Thus, integration of behavioral fi-
nance approaches into investment processes of a company does not seem to additionally
affect trained fund managers’ perception of markets.
4.2 Self-assessment
This section focuses on fund managers’ perception of their own behavior. Table 5
documents the groups’ answers to the following five items: Statement SA (Self-
Assessment) 1, question [SA2], and task [SA3] refer to the three facets of overconfidence:
Illusion of control (Langer, 1975), grasped here by the persistent hindsight bias (Biais and
Weber, 2007), better-than-average effect (Taylor and Brown, 1988) as well as miscalibra-
tion (Lichtenstein et al., 1982). For further discussion on these three interpretations of
overconfidence see e.g. Menkhoff et al. (2006) and Glaser and Weber (2007). Statement
[SA4] addresses another driving force of the disposition effect: As a counterpart to the as-
sessment of their peers’ behavior in the domain of losses (statement [MP3] Section 4.1),
the surveyed fund managers are now asked to comment their own risk aversion in the do-
main of gains. This phenomenon also motivates the preference to sell “winning” assets too
soon (Kahneman and Tversky, 1979, Shefrin and Statman, 1985, Weber and Camerer,

11
1998). Statement [SA5] aims to assess fund managers’ affinity to conformity, also regarded
as a motivation for herding (Bikhchandani and Sharma, 2001).
All these biases are guided by emotions and other natural human mechanisms preserv-
ing self-esteem and avoiding cognitive dissonance of the decision-maker. These mecha-
nisms interfere with rational learning, including the recognition of and learning from one’s
own mistakes (Hirshleifer, 2001). Several studies have shown that the biases analyzed in
this section have a negative impact on risk-adjusted investment performance (see Odean,
1999, Barber and Odean, 2000, 2001, Biais and Weber, 2007, Coval and Shumway, 2005).
What will be the influence of training and integration of behavioral finance on fund man-
agers’ self-assessment and thus their ability to regard their own behavioral biases more
critically?
Results
The only significant result in Table 5 reveals that training on behavioral finance signifi-
cantly diminishes the affinity to conformity (statement [SA5]). In analysis I, there is a sig-
nificantly stronger denial by trained fund managers that the discussion of an investment
decision with colleagues reduces the pressure to succeed (means of 4.28 vs. 3.58 with a p-
value of 0.022). In the group of experts in analysis II, this result sustains with a lower level
of significance (means of 4.37 vs. 3.74 with a p-value of 0.096). This attitude in the group
of trained fund managers might result from the knowledge of social psychology that, in
contrast to the idea of the perfect group decision, where the group’s members offset each
other’s biases, groups in fact reduce the variance of their members’ opinions in a decision-
making process. Thus, discussions of an investment decision in groups rather provide a
feeling of confidence, conformity and competence (especially when one’s own view is
consistent with the view of the group) than result in better solutions (Montier, 2005). In

12
that context, we might conclude that training does have a significant impact on the recogni-
tion that group-based consensus decisions do not necessarily lead to the best decision mak-
ing as they reduce group members’ variance of views, thereby lowering their creativity.
The self-perception of all the other biases (mentioned in Table 5) turns out to be not sig-
nificantly affected by training.
Table 6 additionally presents the results for the home bias task in the questionnaire. This
task serves to analyze whether training on behavioral finance affects fund managers’ skills
to diversify their portfolios internationally in an appropriate manner or whether fund man-
agers remain prone to overweighting German assets (their home market) in their portfolios.
The latter result would confirm the findings of several studies indicating the persistence of
the home bias (Lütje and Menkhoff, 2007, Solnik, 2007). To obtain fund managers’ per-
sonally preferred portfolios, which might differ from their managed ones due to restrictions
e.g. on the part of their clients, task [AA] asks them to allocate a hypothetical amount of 10
million € to the global financial markets, thereby ignoring the respective fund’s restric-
tions. According to the IAPM (International Asset Pricing Model) the optimum portfolio
share of a country corresponds to the ratio of its market capitalization to the world capitali-
zation. German investors’ portfolios should thus contain 4% of German stocks and 8% of
German bonds.12
Even with the explicit hint to ignore their funds’ restrictions in this task, all the groups
equally strongly overweight their home country Germany in their portfolios (around 14%).
However, compared to the mean allocation of the whole sample as well as to analysis I,
analyses II and III detect a shift in the allocation from Europe towards the USA and Can-
ada. Compared to the untrained experts, trained experts (analysis II) would invest signifi-
cantly more in the USA and Canada (mean of 34.28% vs. 28.70%), thereby decreasing
12
Regarding this home bias task, it should be noted that specific overweightings of countries could also re-
flect active fund managers’ market opinions (i.e. tracking error vs. neutral market weighting), even if they are
well aware of the neutral, well diversified portfolio (according to global benchmarks).

13
their European engagements (30.90% vs. 35.22%). This tendency is also shown in analysis
III: The group “Trained and BF integrated” differs from its comparison group by a re-
markably lower investment share in Europe (means of 30.91% vs. 36.94% with a p-value
of 0.172) mainly investing in the USA and Canada (35.32% vs. 29.89% with a p-value of
0.254).
Regarding these analyses, training seems not to affect the exaggerated preference to in-
vest in the German home market, which supports the persistence of the home bias as re-
ported in the literature. However, if we widen the definition for the “home market” from
Germany to Europe, the picture changes. The observed tendencies of shifting the main
investment share from the European market to a more highly capitalized American market
(see analyses II and III) might be interpreted as an effort to overcome the concentration on
the European home market. This conclusion would hold for 25% of the sample. Thus, in
the case of experts, training significantly contributes to diminishing their home bias on the
European level, whereas the investment share for the German home market remains at the
same (overweighted) level. Also, fund managers working in companies that implement
behavioral finance approaches show rather more effort in struggling against the European
home bias.
In summary, the main results of section 4 are the following: First, with respect to fund
managers’ perception of markets, training on behavioral finance contributes to a significant
better recognition of the reflection effect. Second, also the perception of the home bias
becomes remarkably improved. Third, when it comes to self-assessment, training results in
a significantly lower affinity to discussing decisions in groups and thus in a lower affinity
to conformity, implying a lower tendency to imitate the decisions of others. Fourth, the
diversification task reveals that trained experts would allocate a significantly higher share
of assets to the USA and Canada, thereby shifting the weighting from the closer European

14
markets. By the same token, the group “Trained and BF integrated” tends to allocate less
investment to Europe.
Thus, the results of section 4 detect some influence of training on fund managers’ per-
ception of markets and themselves. These influences might be understood as a learning
process towards a more rational behavior, which training in behavioral finance aims to
activate. However, it is not observable that trained fund managers’ perception is addition-
ally (significantly) affected by the integration of behavioral finance approaches into in-
vestment processes.
5. Consequences on the investment behavior
After focusing on fund managers’ perception, next, their investment behavior is exam-
ined. Again, the analysis differentiates whether fund managers are trained on behavioral
finance issues or not as well as whether they work in companies with integrated behavioral
finance approaches or not.
Within the survey, investment behavior is grasped through the choice of information
sources and investment strategies. The four sources of information given in Table 7, as
well as the four investment strategies presented in Table 8, have been named as important
for the investment management by fund managers in ex-ante interviews.13
According to analysis I in Table 7, training does not significantly affect the ranking in
the use of information sources: Fundamental facts turn out to be the main information
source, followed by technical indicators, colleagues14
and finally by other market partici-
pants. Compared to the untrained fund managers, the trained ones tend to assess colleagues
13
Menkhoff and Schmidt (2005) find that the strategies buy-&-hold, momentum and contrarian are typically
applied mutually. Their use reflects the viewpoints and the level of risk-aversion of the respective fund man-
ager. 14
In the questionnaire this source of information is given as “Colleagues in the own company”. In our pretest
interviews fund managers indicated that they regard this answering category as a generic one, including their
colleagues’ statements/analyses/opinions.

15
and other market participants as relatively less important (analysis I). This difference be-
comes significant in analysis II: Compared to the untrained experts, trained experts rely
significantly less on their colleagues (means of 3.41 vs. 2.81) and other market participants
(4.02 vs. 3.52).15
This assessment is absolutely consistent with trained experts’ lower affin-
ity to conformity, detected by the results from statement [SA5] in Table 5. Thus, less affin-
ity to conformity seems to result in a lower consideration of colleagues and other market
participants as information sources.16
One plausible implication of this finding might be
that trained experts more strongly trust in their own information. This might lead to a
higher independence in their information processing, resulting in decisions being relatively
less susceptible to market noise.
Analysis III in Table 7 reveals some first significant influences of the integration of be-
havioral finance approaches into investment processes. Compared to the untrained fund
managers, trained fund managers in firms which implemented behavioral finance ap-
proaches attach significantly less importance to fundamental facts (mean of 2.26 vs. 1.56),
colleagues (3.76 vs. 2.89) and other market participants (4.36 vs. 3.44) as information
sources.
The results of analysis III in Table 8 reveal one further central finding: A significant dif-
ference in the ranking of investment strategies between the comparison groups. Trained
fund managers in companies where behavioral finance is not integrated into investment
process rely significantly more on the fundamental buy-and-hold strategy (mean of
37.05%), whereas their comparison group “Trained and BF integrated” shows a clearly
lower use of the buy-and-hold (20.87%) but a remarkably higher use of the momentum
15
To assess the relevance of the information sources given in the questionnaire there are 6 answering catego-
ries, ranging from “highest relevance” (coded as 1) to “no relevance” (coded as 6). 16
Arnswald (2001) explains the importance assigned to these sources of information by interpreting them as
a kind of external confirmation of one’s own decisions. But he also mentions them to be channels for conta-
gions of fear and exuberance.

16
strategy (28.71%) and other17
strategies (20.57%). Regarding analyses I and II, it seems
that training alone does not noticeably affect the use of investment strategies.5
In sum, based on the results presented in Table 7 and 8, we might conclude that it is
rather the integration of behavioral finance than training in behavioral finance that signifi-
cantly affects fund managers’ investment behavior. In analysis III in Tables 7 and 8, we
find that the group “Trained and BF integrated” significantly differs from its comparison
group in its choice of information sources and investment strategies: The group “Trained
and BF integrated” relies significantly less strongly on fundamental information and the
fundamentally orientated buy-and-hold strategy, but instead more strongly on the behav-
ioral-finance-motivated momentum strategy and other strategies (which are highly proba-
bly also based on behavioral finance approaches). This orientation seems to point to the
expected direction of the analysis: Fund managers in the “Trained and BF integrated” clus-
ter comparatively more strongly aim at benefiting from other market participants’ behav-
ioral biases.
6. Conclusion
This paper examines the influence of training in behavioral finance on professional fund
managers’ perception and behavior. It is based on a questionnaire survey including an-
swers from more than 100 German fund managers. By separating this sample into
“trained” and “untrained” fund managers, i.e. depending on whether they are trained in
behavioral finance issues or not, we test these groups’ perception of markets, their self-
assessment as well as their choice of information sources and investment strategies for
differences. Additionally, the influence of training only on the group of “experts” in behav-
17
The answering category “other strategies” is not specified in the questionnaire. In this survey it includes all
other strategies being different to the strategies momentum, contrarian, and buy-and-hold.

17
ioral finance is regarded. Furthermore, the effect of integrating behavioral finance ap-
proaches into investment processes is also analyzed.
Results of this study show that training rather influences fund managers’ perception
than their investment behavior. Training significantly sharpens the awareness towards the
reflection effect, which is an important and desirable result, as this bias partly explains the
well known disposition effect. Training also remarkably improves the perception of the
home bias in the behavior of other fund managers. Furthermore, training reduces the affin-
ity to conformity, which is reflected in a weaker consideration of colleagues and other
market participants as information sources. To significantly affect fund managers’ invest-
ment behavior, the integration of behavioral finance approaches in the investment process
is needed: Trained fund managers in companies which implement behavioral finance in
their investment processes assign less importance to fundamental facts, colleagues and
other market participants as information sources. Furthermore, they use the fundamental
buy-and-hold strategy remarkably less intensively, thereby applying more momentum and
other (probably also behavioral finance motivated) strategies. This investment behavior
indicates a relatively stronger intention to profit from behavioral finance biases in the mar-
ket.

18
References
Arnswald, Torsten (2001): Investment Behaviour of German Equity Fund Managers: An
Exploratory Analysis of Survey Data, Deutsche Bundesbank Discussion Paper
08/01, Frankfurt.
Babilis Sofia and Valpy Fitzgerald (2005): Risk Appetite, Home Bias and the Unstable
Demand for Emerging Market Assets, International Review of Applied Economics,
19:4, 459-476.
Barber, Brad M. and Terrance Odean (2000): Trading Is Hazardous to Your Wealth: The
Common Stock Investment Performance of Individual Investors, Journal of Finance,
55:2, 773-806.
Barber, Brad M. and Terrance Odean (2001): Boys Will Be Boys: Gender, Overconfi-
dence, and Common Stock Investment, Quarterly Journal of Economics, 116:1, 261-
292.
Biais, Bruno, Denis Hilton, Karine Mazurier and Sébastien Pouget (2005): Judgmental
overconfidence, self-monitoring and trading performance in an experimental finan-
cial market, Review of Economic Studies, 72, 287-312.
Biais, Bruno and Martin Weber (2007): Hindsight Bias and Investment Performance, IDEI
Working Paper No. 476.
Bikhchandani, Sushil and Sunil Sharma (2001): Herd Behavior in Financial Markets: A
Review, IMF Staff Papers, 47:3, 279-310.
Coval, Joshua D. and Tyler Shumway (2005): Do Behavioral Biases Affect Prices?, Jour-
nal of Finance, 60:1, 1-34.
Deaves, Richard, Erik Lüders and Michael Schröder (2005): The Dynamics of Overconfi-
dence: Evidence from Stock Market Forecasters, Center for European Economic Re-
search (ZEW), ZEW Discussion Paper No. 05-83.
De Bondt, Werner F.M. and Richard Thaler (1985): Does the Stock Market Overreact?,
Journal of Finance, 40:3, 793-805.
Festinger, Leon (1957): A Theory of Cognitive Dissonance, Stanford, CA: Stanford Uni-
versity Press.
Feng, Lei and Mark S. Seasholes (2005): Do Investor Sophistication and Trading Experi-
ence Eliminate Behavioral Biases in Financial Markets?. Review of Finance, 9, 305-
351.
Glaser, Markus, Thomas Langer and Martin Weber (2005): Overconfidence of Profession-
als and Lay Men: Individual Differences Within and Between Tasks?, Working Pa-
per No. 05-25, SFB 504, University of Mannheim.
Glaser, Markus and Martin Weber (2007): Overconfidence and Trading Volume, The GE-
NEVA Risk and Insurance Review, 32, 1-36.
Guo, Wen-Chung and Hsiu-Ting Shih (2008): The Co-movement of Stock Prices, Herd
Behavior and High-tech Mania, Applied Financial Economics, 18:16, 1343-1350.
Haigh, Michael S. and John A. List (2005): Do Professional Traders Exhibit Myopic Loss
Aversion? An Experimental Analysis, Journal of Finance, 60:1, 523-534.

19
Hirshleifer, David (2001): Investor Psychology and Asset Pricing, Journal of Finance,
56:4, 1533-1597.
Jegadeesh, Narasimhan and Sheridan Titman (2001): Profitability of Momentum Strate-
gies: An Evaluation of Alternative Explanations, Journal of Finance, 56:2, 699-720.
Kahneman, Daniel and Amos Tversky (1979): Prospect Theory: An Analysis of Decision
Under Risk, Econometrica, 47:2, 263-292.
Konishi, Masaru (2007): A Global Network of Stock Markets and Home Bias Puzzle,
Applied Financial Economics Letters, 3:3, 197-199.
Langer, Ellen J. (1975): The Illusion of Control, Journal of Personality and Social Psy-
chology, 32, 311-328.
Lichtenstein, Sarah, Baruch Fischhoff and Lawrence D. Phillips (1982): Calibration of
Probabilities: The State of the Art to 1980, in: Judgment under Uncertainty: Heuris-
tics and Biases, ed. D. Kahneman, P. Solvic and A. Tversky, Cambridge University
Press, 306-334.
Locke, Peter R. and Steven C. Mann (2005): Professional Trader Discipline and Trade
Disposition, Journal of Financial Economics, 76:2, 401-444.
Lütje, Torben (2009): To Be Good or To Be Better: Asset Managers' Attitudes Towards
Herding, Applied Financial Economics, 19:10, 825-839.
Lütje, Torben and Lukas Menkhoff (2007): What Drives Home Bias? Evidence from Fund
Managers’ Views, International Journal of Finance & Economics, 12:1, 21-35.
Menkhoff, Lukas and Ulrich Schmidt (2005): The Use of Trading Strategies by Fund Man-
agers: Some First Survey Evidence, Applied Economics, 37:15, 1719-1730.
Menkhoff, Lukas and Marina Nikiforow (2009): Professionals’ Endorsement of Behavioral
Finance: Does it Impact their Perception of Markets and Themselves?, Journal of
Economic Behavior & Organization, forthcoming.
Menkhoff, Lukas, Ulrich Schmidt and Torsten Brozynski (2006): The Impact of Experi-
ence on Risk Taking, Overconfidence, and Herding of Fund Managers: Complemen-
tary Survey Evidence, European Economic Review, 50:7, 1753-1766.
Montier, James (2005): Seven Sins of Fund Management, SSRN Working Paper No.
881760.
Nickerson, Raymond S. (1998): Confirmation Bias: Ubiquitous Phenomenon in Many
Guises, Review of General Psychology, 2:2, 175-220.
Odean, Terrance (1998): Are Investors Reluctant to Realize Their Losses?, Journal of Fi-
nance, 53:5, 1775-1798.
Odean, Terrance (1999): Do Investors Trade Too Much?, American Economic Review,
89:5, 1279-1298.
Pronin, Emily (2007): Perception and Misperception of Bias in Human Judgement, Trends
in Cognitive Sciences, 11:1, 37-43.
Pronin, Emily, Thomas Gilovich and Lee Ross (2004): Objectivity in the Eye of the Be-
holder: Divergent Perception of Bias in Self Versus Others, Psychological Review,
111:3, 781-799.

20
Pronin, Emily, Daniel Y. Lin and Lee Ross (2002): The Bias Blind Spot: Perceptions of
Bias in Self Versus Others, Personality and Social Psychology Bulletin, 82:3, 369-
381.
Shapira, Zur and Itzhak Venezia (2001): Patterns of Behavior of Professionally Managed
and Independent Investors, Journal of Banking and Finance, 25, 1573-1587.
Shefrin, Hersh and Meir Statman (1985): The Disposition to Sell Winners Too Early and
Ride Losers Too Long: Theory and Evidence, Journal of Finance, 40:3, 777-790.
Shiller, Robert J. (2003): From Efficient Markets Theory to Behavioral Finance, Journal of
Economic Perspectives, 17:1, 83-104.
Solnik, Bruno (2007): Are Financial Market Expectations Driven by Some Form of Na-
tional Preference, SSRN Working Paper No. .1099914.
Taylor, Shelley S. and Jonathan D. Brown (1988): Illusion and Well-Being: A Social Psy-
chology Perspective on Mental Health, Psychological Bulletin, 103:2, 193-210.
Thaler, Richard H. and Eric J. Johnson (1990): Gambling with the House Money and Try-
ing to Break Even: The Effects of Prior Outcomes on Risky Choice, Management
Science, 36:6, 643-660.
Visaltanachoti, Nuttawat, Hang (Robin) Luo and Lin Lu (2007): Holding Periods, Illiquid-
ity and Disposition Effect in the Chinese Stock Markets, Applied Financial Econom-
ics, 17:15, 1265 – 1274.
Weber, Martin and Colin F. Camerer (1998): The Disposition Effect in Securities Trading:
An Experimental Analysis, Journal of Economic Behavior and Organization, 33,
167-184.

21
FIGURE 1. “Trained” versus “Untrained” fund managers (Analysis I)
Distribution of answers to statement BF1 (frequencies and %)
[BF1] Statement: “My employer provides in-house training on behavioral finance or sends his/her
employees to appropriate seminars”.
TABLE 1. “Trained experts” versus “Untrained experts” (Analysis II)
[BF1] Statement: “My employer provides in-house training on behavioral finance or sends his/her
employees to appropriate seminars”.
[BF2] Statement: “I’ve already concerned myself with behavioral finance, the key messages are
well known to me”.
Distribution of responses (frequencies)
BF1: Employer provides training and semi-
nars on behavioral finance
1 2 3 4 5 6 ∑
1 6 4 5 3 8 8 34
2 0 6 0 3 10 16 35
3 0 3 2 2 7 8 22
4 0 0 3 2 5 4 14
5 0 0 0 0 1 4 5
6 - - - - - -
BF2:
Key messages of
behavioral finance are
well known to the
respondent
∑ 6 13 10 10 31 40 110
Number
of re-
sponses
(N=110)
completely agree completely disagree
completely agree completely disagree
6
1310 10
31
5.5%11.8% 9.1% 9.1%
28.2%
36.4%
40
0
10
20
30
40
1 2 3 4 5 6
„Trained“ „Untrained“
„Trained“ „Untrained“
„Experts“
„No experts“

22
TABLE 2. “Trained and BF integrated” versus “Trained and BF not integrated”
(Analysis III)
[BF1] Statement: “My employer provides in-house training on behavioral finance or sends his/her
employees to appropriate seminars”.
[BF3] Statement: “Behavioral finance approaches are already integrated in the investment process
of our company”.
Distribution of responses (frequencies)
BF1: Employer provides training and semi-
nars on behavioral finance
1 2 3 4 5 6 ∑
1 4 2 0 1 1 1 9
2 1 1 2 2 2 1 9
3 1 3 0 4 7 4 19
4 0 5 6 2 4 3 20
5 0 2 0 1 11 9 23
6 0 0 2 0 6 22 30
BF3:
Behavioral finance
approaches are inte-
grated into
investment process
∑ 6 13 10 10 31 40 110
completely agree completely disagree
„BF integrated“
„BF not integrated“
„Trained“ „Untrained“

23
TABLE 3. Familiarity with behavioral finance [BF]: Training, knowledge, integra-
tion(a)
[BF1] Statement: “My employer provides in-house training on behavioral finance or sends his/her
employees to appropriate seminars”.
[BF2] Statement: “I’ve already concerned myself with behavioral finance, the key messages are well
known to me”. [BF3] Statement: “Behavioral finance approaches are already integrated in the investment process of
our company”.
2,4
8
2,7
8
5,5
7 *
**
2,4
1 *
**
5,5
6 *
**
2,6
2 *
**
1.9
7 *
*
2.4
5 *
* 1.3
3 *
*
1.6
2 *
*
1.9
7
2.4
4
3.1
3 *
**
4.7
5 *
**
2.9
6 *
**
4.6
9 *
**
2.2
7 *
**
5.1
4 *
**
1
2
3
4
5
6Trained (39) Untrained (71) Trained experts (27) Untrained experts
(42)
Trained and BF
integrated (21)
Trained and BF not
integrated (18)
BF1: offer of trainings / seminars BF2: key messages are well known BF3: BF approches integrated
H0: No difference (b)
Statements All fund managers
(mean and number of responses) Analysis I Analysis II Analysis III
BF1: offer of training and
seminars
4.52
110
-8.988***
(0.000)
-7.207***
(0.000)
-0.893
(0.372)
BF2: key messages are
well known
2.42
116
-2.111**
(0.035)
-2.300**
(0.021)
-1.590
(0.112)
BF3: BF approaches are
integrated
4.17
110
-5.144***
(0.000)
-4.091***
(0.000)
-5.477***
(0.000) (a)
The diagram gives the mean answers of the respective group (with the number of responses in parenthe-
ses) to the respective statements. Each statement can be assessed by six answering categories, shown on
the y-axis, ranging from “completely agree” (coded as 1) to “completely disagree” (coded as 6). Thus, a
mean of 3.5 or less indicates rather approval to the statement. (b)
H0 states that there is no difference between the respective comparison groups. The figures given are the
z-value of the Mann-Whitney U-test and the p-value in parentheses.
Stars refer to level of significance: * 10%,
** 5%,
*** 1%.
Analysis I Analysis III Analysis II
24
TABLE 4. Market perception(a) [MP]
[MP1] Statement: “After several profitable investments fund managers tend to take on additional posi-
tions”.
[MP2] Statement: “My colleagues pay particular attention to confirmatory news/information after hav-
ing made an investment decision”.
[MP3] Statement: “In case of loss positions other fund managers tend to increase their willingness to
take risks”.
[MP4] Statement: “Fund managers prefer to invest in near located markets”.
[MP5] Statement: “Also fund managers exhibit herding behavior”.
2.9
0
2.9
6
2.8
8
2.9
8
2.9
0
2.8
9
2.6
3
2.7
0
2.4
6
2.7
4
2.7
5
2.8
5
3.0
8 *
*
3.6
4 *
*
2.8
8 *
*
3.5
1 *
*
2.8
5
3.3
3
3.0
3
3.5
5 3.0
7
3.6
4 3.0
5
3.0
0
2.1
3
1.9
9
1.9
6
2.0
7
2.1
9
2.0
6
1
2
3
4
5
6Trained (39) Untrained (71) Trained experts (27) Untrained experts
(42)
Trained and BF
integrated (21)
Trained and BF not
integrated (18)
House Money Effect Confirmatory Bias Reflection Effect Home Bias Herding
H0: No difference (b)
Statements All fund managers
(mean and number of responses) Analysis I Analysis II Analysis III
[1] House money effect 2.92
115
-0.124
(0.901)
-0.359
(0.720)
-0.236
(0.814)
[2] Confirmatory bias 2.66
115
-0.137
(0.891)
-0.832
(0.406)
-0.718
(0.473)
[3] Reflection effect 3.44
114
-2.123**
(0.034)
-1.939*
(0.052)
-1.551
(0.121)
[4] Home bias 3.34
116
-1.626
(0.104)
-1.423
(0.155)
-0.377
(0.706)
[5] Herding 2.02
116
-1.436
(0.151)
-0.127
(0.899)
-0.445
(0.656)
(a) The diagram gives the mean answers of the respective group (with the number of responses in parenthe-
ses) to the respective statements. Each statement can be assessed by six answering categories, shown on
the y-axis, ranging from “completely agree” (coded as 1) to “completely disagree” (coded as 6). Thus, a
mean of 3.5 or less indicates rather approval to the statement. (b)
H0 states that there is no difference between the respective comparison groups. The figures given are the
z-value of the Mann-Whitney U-test and the p-value in parentheses.
Stars refer to level of significance: * 10%,
** 5%,
*** 1%.
Analysis II Analysis I Analysis III

25
TABLE 5. Self-assessment(a) [SA]
[SA1] Statement: “The majority of economic news is not surprising for me”.
[SA2] Question: “How do you evaluate your own performance compared to other asset managers?”
[SA3] Task(c): “Give an estimation of the DAX in one month. Determine a lower und an upper
bound such that the quote of the DAX in one month from now will be inside the re-
sulting interval with a probability of 90%”.
[SA4] Statement: “I prefer to take profits when I am confronted with unexpected liquidity demands”.
[SA5] Statement: “Discussion of an investment decision with colleagues reduces the pressure to suc-
ceed”.
3.2
2
3.4
0
3.2
3
3.1
5
3.1
6
3.3
2
2.3
9
2.2
0
2.3
0
2.1
2
2.3
5
2.2
9
4.2
83.9
0
4.1
4
4.1
9
3.9
6
4.0
8
3.7
4 *
4.3
9
4.1
9
4.3
7 *3
.58
**
4.2
8 *
*
1
2
3
4
5
6Trained (39) Untrained (71) Trained experts (27) Untrained experts
(42)
Trained and BF
integrated (21)
Trained and BF not
integrated (18)
Illusion of control Better-than-average Disposition effect Discussion with colleagues
H0: No difference (b)
Statements All fund managers
(mean and number of responses) Analysis I Analysis II Analysis III
[SA1] Illusion of control
(Hindsight bias)
3.20
115
-0.780
(0.436)
-0.183
(0.855)
-0.623
(0.533)
[SA2] Better-than-average 2.34
111
-0.695
(0.487)
-0.280
(0.201)
-0.515
(0.614)
[SA3] Miscalibration (c)
887
111
-0.649
(0.516)
-0.870
(0.384)
-1.536
(0.124)
[SA4] Disposition effect 3.99
116 -0.529
(0.597)
-0.151
(0.880)
-0.546
(0.585)
[SA5] Affinity to conformity 3.73
116
-2.295**
(0.022)
-1.665*
(0.096)
-0.519
(0.604)
(a) The diagram gives the mean answers of the respective group (with the number of responses in parenthe-
ses) to the respective statements. Each statement, except statement [SA2], can be assessed by six answer-
ing categories, shown on the y-axis, ranging from “completely agree” (coded as 1) to “completely dis-
agree” (coded as 6). Thus, a mean of 3.5 or less indicates rather approval to the statement.
For statement [SA2] there are five answering categories: much better (coded as 1), slightly better (coded
as 2), equally good (coded as 3), slightly worse (coded as 4), much worse (coded as 5). (b)
H0 states that there is no difference between the respective comparison groups. The figures given are the
z-value of the Mann-Whitney U-test and the p-value in parentheses. (c)
The results for task [SA3] are not given in the diagram. The means for the stated interval are 945 vs. 878
for analysis I, 1074 vs. 896 for analysis II, and 800 vs. 600 for analysis III.
Stars refer to level of significance: * 10%,
** 5%,
*** 1%.
Analysis I Analysis II Analysis III

26
TABLE 6. International asset allocation(a) [AA]
[AA] Task: “Please, allocate an amount of 10 million € to the following markets so that the shares sum
up to 100% (thereby ignoring your funds’ restrictions).”
% Germany % Europe (without Germany) % USA and Canada”
%Asia % Emerging Markets.
16
.50
13.5
5
14.4
7
14.0
8
14.4
0
14
.95
36.9
4
30
.91
35
.22
30
.90
33
.31
33
.77
29
.8935
.32
28
.70
*
34
.28
*
29
.20
32
.75
11
.50
12
.68
13.9
5
13.2
9
14.3
9
12
.12
7.6
7
7.6
2
8.7
0
6.4
1 7.5
3
5.1
7
0
10
20
30
40
50
Trained (39) Untrained (71) Trained experts (27) Untrained experts
(42)
Trained and BF
integrated (21)
Trained and BF not
integrated (18)
Germany Europe (ex. Germany) USA and Canada Asia Emerging Markets
H0: No difference (b)
Statements All fund managers
(mean and number of responses) Analysis I Analysis II Analysis III
Germany 14.21
111
-0.144
(0.886)
-0.102
(0.913)
-0.744
(0.457)
Europe
(without Germany)
33.68
111
-0.429
(0.668)
-0.834
(0.404)
-1.366
(0.172)
USA and Canada 30.61
111
-1.301
(0.193) -1.720
*
(0.086)
-1.140
(0.254)
Asia 13.62
111
-0.459
(0.646)
-0.433
(0.665)
-0.317
(0.752)
Emerging Markets 7.89
111
-1.329
(0.184)
-0.063
(0.950)
-1.374
(0.169)
(a) The diagram gives the mean answers of the respective group (with the number of responses in parenthe-
ses) in %. (b)
H0 states that there is no difference between the respective comparison groups. The figures given are the
z-value of the Mann-Whitney U-test and the p-value in parentheses.
Stars refer to level of significance: * 10%,
** 5%,
*** 1%.
Analysis I Analysis II Analysis III

27
TABLE 7. Assessment of information sources(a) [INFO]
[INFO] Task: “Please assess the importance of the following sources of information for you”.
Information sources: “Fundamental facts about the company / market”, “Technical indicators”,
“Colleagues from the own company”, “Other market participants, not from the own company”.
1.9
4
1.8
0
1.9
3
1.7
6
2.2
6*
*
1.5
6*
*
3.1
1
3.0
4
2.8
1
3.0
7
3.1
4
3.0
6
3.7
6*
3.4
1*
*
3.1
1
3.3
6 2.8
9*
2.8
1**
3.4
4*
*
4.3
6*
*
4.0
2*
3.6
3
3.9
4 3.5
2*
1
2
3
4
5
6
Trained (39) Untrained (71) Trained experts (27) Untrained experts
(42)
Trained and BF
integrated (21)
Trained and BF not
integrated (18)
Fundamentals Technical indicators Colleagues Other market participants
H0: No difference (b)
Statements All fund managers
(mean and number of responses) Analysis I Analysis II Analysis III
Fundamental facts 1.82
115 -0.686
(0.493)
-0.663
(0.507) -2.146
**
(0.032)
Technical indicators 3.02
114 -0.193
(0.847)
-0.909
(0.363)
-0.365
(0.715)
Colleagues 3.17
115 -1.058
(0.290) -1.957
**
(0.050)
-1.853*
(0.064)
Other market participants 3.73
115
-1.229
(0.219) -1.683
*
(0.092)
-2.485**
(0.013) (a)
The diagram gives the mean answers of the respective group (with the number of responses in parenthe-
ses). The importance of each source of information can be assessed by six answering categories, shown
on the y-axis, ranging from “highest relevance” (coded as 1) to “no relevance” (coded as 6). (b)
H0 states that there is no difference between the respective comparison groups. The figures given are the
z-value of the Mann-Whitney U-test and the p-value in parentheses.
Stars refer to level of significance: * 10%,
** 5%,
*** 1%.
Analysis I Analysis II Analysis III

28
TABLE 8. Assessment of investment strategies(a) [STRAT]
[STRAT] Question: “How intensively do you use the various strategies? Please allocate 100%.”
% Momentum strategy” % Contrarian strategy (Value strategy)”
% Buy-and-Hold strategy” % Others”
22
.942
8.7
1
27
.39
28
.52
25
.72
26
.13
29.5
1
29.8
433
.35
32
.35
30
.34
29.6
9
20
.87
**
37
.05
**
25
.25
24
.75
30
.89
28
.11
20
.57
10
.5014
.01
14
.39
13
.05
16
.07
0
5
10
15
20
25
30
35
40
Trained (39) Untrained (71) Trained experts (27) Untrained experts
(42)
Trained and BF
integrated (21)
Trained and BF not
integrated (17)
Momentum Contrarian Buy&Hold Others
H0: No difference (b)
Statements All fund managers
(mean and number of responses) Analysis I Analysis II Analysis III
Momentum 26.27
108
-0.293
(0.769)
-0.370
(0.712)
-1.365
(0.172)
Contrarian 29.31
108
-0.069
(0.945)
-0.007
(0.995)
-0.148
(0.882)
Buy-and-Hold 30.73
108
-0.565
(0.572)
-0.488
(0.626) -2.095
**
(0.036)
Others 13.69
108
-0.490
(0.624)
-1.101
(0.920)
-0.934
(0.350)
(a) The diagram gives the mean answers of the respective groups (with the number of responses in parenthe-
ses) in %. (b)
H0 states that there is no difference between the respective comparison groups. The figures given are the
z-value of the Mann-Whitney U-test and the p-value in parentheses.
Stars refer to level of significance: * 10%,
** 5%,
*** 1%.
Analysis I Analysis II Analysis III