does information on health status lead to a healthier lifestyle? evidence from china on the effect...
TRANSCRIPT
DC
Ma
b
c
a
ARR2AA
JDIQ
KHHDRC
1
ssgamlcs
toeOAmH
0h
Journal of Health Economics 32 (2013) 367– 385
Contents lists available at SciVerse ScienceDirect
Journal of Health Economics
j ourna l ho me page: www.elsev ier .com/ locate /econbase
oes information on health status lead to a healthier lifestyle? Evidence fromhina on the effect of hypertension diagnosis on food consumption�
eng Zhaoa,∗, Yoshifumi Konishib, Paul Glewwec
Waseda Institute for Advanced Study, Waseda University, 1-6-1 Nishiwaseda, Shinjuku-ku, Tokyo 169-8050, JapanFaculty of Liberal Arts, Sophia University, 7-1 Kioi-cho, Chiyoda-ku, Tokyo 102-8554, JapanDepartment of Applied Economics, University of Minnesota, 1994 Buford Avenue 337A, St. Paul 55108, USA
r t i c l e i n f o
rticle history:eceived 3 November 2011eceived in revised form1 November 2012ccepted 22 November 2012vailable online 10 December 2012
EL classification:12
1211
a b s t r a c t
We examine the role of information in understanding the differential effects of income on the demandfor health. In the health capital framework of Grossman (JPE, 1972), we derive the testable hypothesesthat individuals adjust their diet in a healthier direction upon receiving negative health information, andthat the effect is greater for richer individuals. Based on unique Chinese longitudinal data and a regres-sion discontinuity design that exploits the exogenous cutoff of systolic blood pressure in the diagnosis ofhypertension, we find that, upon receiving hypertension diagnosis, individuals reduce fat intake signif-icantly, and richer individuals reduce more. Our results also indicate that among the rich, hypertensiondiagnosis is more effective for individuals with lower education.
© 2012 Elsevier B.V. All rights reserved.
eywords:ealth informationypertensionietegression discontinuity
2Thd
npd
hina
. Introduction
Economists have long been interested in the causal relation-hips between income and health. A large number of empiricaltudies have found a positive income-health gradient, which sug-ests that health is a normal good (e.g. Wilkinson, 1986; Pritchettnd Summers, 1996; Deaton and Paxson, 2001; Deaton, 2003). Yet,ore recently, some studies have also substantiated high preva-
ence rates of chronic health conditions such as hypertension,ardiovascular diseases and cancer among high-income groups inome developing countries (Case et al., 2004; Van de Poel et al.,
� The paper is based on Essay 2 of the corresponding author’s doctoral disserta-ion, which was in part supported by the Hueg-Harrison Fellowship at Universityf Minnesota. The authors gratefully acknowledge the helpful comments from theditor and two anonymous referees, Amitabh Chandra, Michael Grossman, Seritsugura, Sayaka Nakamura, Emilia Simeonova, and other seminar participants at theustralian Conference of Economists, the Japanese Health Economics Associationeeting, the Japanese Economic Association meeting, and the American Society ofealth Economists meeting.∗ Corresponding author. Tel.: +81 3 5286 2928; fax: +81 3 5286 2470.
E-mail addresses: [email protected], [email protected] (M. Zhao).
hhcwhlwetdhtoo
167-6296/$ – see front matter © 2012 Elsevier B.V. All rights reserved.ttp://dx.doi.org/10.1016/j.jhealeco.2012.11.007
009; Gaziano et al., 2010; Gersh et al., 2010; Koch et al., 2010).his study attempts to reconcile this puzzle: How could chronicealth conditions be positively associated with income while theemand for health generally increases with income and wealth?
Chronic diseases are well known for their latency. Individualseed to make long-term and persistent health investments torevent the development of chronic health conditions, yet haveifficulty observing their own health status or the effects of theirealth investments on it. Given this nature of chronic diseases,igher incomes may not necessarily result in better health out-omes under certain economic conditions. On one hand, individualsith higher incomes may demand better health. Yet, on the otherand, these richer individuals can also afford unhealthy diets and
ifestyles such as high-calorie foods, cigarettes and alcohol, all ofhich increase the probability and severity of many chronic dis-
ases. Hence, individuals would need adequate health informationo guide their daily consumption choices in order for an increasedemand for health due to higher incomes to result in better
ealth outcomes. In countries undergoing rapid economic transi-ion, incomes may grow faster than the availability and acceptancef reliable health information by consumers, which in turn dependsn their innate demand for such information, both at the individual
3 lth Ec
aws
ioeaceoptktiowCntb
bGoahfohrcpoislago
Nst
mm2
sp
tittoheivhsoh
otoesircse
lmhlifSahtiupaif
gagesiobboimst
68 M. Zhao et al. / Journal of Hea
nd aggregate levels. Thus the key to disentangling the channels byhich income affects chronic health outcomes requires an under-
tanding of the role of health information.This study investigates the causal relationships between
ncomes, diet, and chronic health outcomes, focusing on the rolef health information and carefully accounting for endogeneity inach of these variables. Though a large number of studies havettempted to identify the causal effect of health information ononsumers’ choices, their results have often met with substantialmpirical challenges (see Section 2 for more thorough discussionsn this point). First, as consumers’ knowledge of either private orublic health information may correlate with some unobservableshat affect their food consumption, estimates of the impact of suchnowledge on consumers’ choices is likely to suffer from omit-ed variable bias. Second, since the quality of health informations important for consumers’ decision making, health knowledge isften difficult to quantify. To circumvent both of these problems,e adopt a regression discontinuity (RD) approach using uniquehinese panel data, which allow us to examine the variation inutrient intake patterns among individuals with different incomeso new information regarding their true health status, as measuredy hypertension status.1
We first begin by presenting our theoretical framework thatuilds upon Grossman’s (1972) health capital model. Extendingrossman’s framework to account for imperfect information aboutnes’ health status, we derive testable hypotheses that individualsdjust their diet in a healthier direction upon receiving negativeealth information, and that such dietary adjustments are greater
or individuals with higher incomes. These hypotheses are thenperationalized in our RD approach by exploiting the fact thatypertension status is determined by one’s blood pressure readingelative to a sharply defined cutoff point established by medi-al experts.2 Since individuals cannot precisely control their bloodressure, among those with blood pressure readings near the cut-ff, some randomly are above it while others randomly fall belowt, which can be regarded as a random assignment of hypertensiontatus. Because the consumption patterns and other behaviors areikely to be almost identical for the samples right below and rightbove the cutoff, the difference in the outcomes between these tworoups may be used to estimate the treatment effect – i.e. the effectf being informed that one has hypertension.3
The data used in this study are from the China Health and
utrition Survey (CHNS), which was conducted in China in threeeparate rounds from 1997 to 2004. We exploit several features ofhis data set to control for potential biases. First, the panel nature
1 Hypertension is an asymptomatic condition that is considered to be one of theost critical risk factors of major chronic diseases (Vasan et al., 2002) and is esti-ated to affect approximately one third of the world’s population (Kearney et al.,
005).2 According to the American Heart Association, one is judged to have hyperten-
ion if one’s systolic blood pressure is above 140 mmHg or if one’s diastolic bloodressure is above 90 mmHg.3 Of course, individuals may respond differently to the notification of hyper-
ension status, depending on their knowledge of hypertension or other healthnformation, either before or after receiving the blood pressure tests. However,here is no a priori reason to believe that individuals’ prior knowledge differs sys-ematically between the two samples around the cutoff, as the assignment is basedn the cutoff point. The estimated treatment effect of being diagnosed as havingypertension may include systematic differences between the two samples in thendogenous accumulation of knowledge on diet and hypertension after receivingnformation regarding one’s blood pressure. Moreover, if all individuals in the sur-ey had been perfectly informed of their own hypertension status, the effect wouldave been weak or null. But this was not the case, as will be seen below. In ourample, three-quarters of those with blood pressure above the cutoff were unawaref their condition. Compare this number with a corresponding rate of 20% for theypertensive population in United States and Canada (Wolf-Maier et al., 2004).
tafda
tiiahefl
2
eTse
onomics 32 (2013) 367– 385
f the data allows one to condition the outcome variables, intake ofhree macronutrients (fat, protein and carbohydrates) and energy,n a diagnosis of hypertension that occurred as much as 3–4 yearsarlier. Second, instead of relying on self-reported hypertensiontatus, we draw upon the blood pressure test results from a phys-cal examination conducted for every individual surveyed in eachound of the survey. Finally, since the blood pressure test results areommunicated to all survey subjects, the data do not suffer fromample selection bias, which is often a problem in identifying theffect of information provision.
Our main results are as follows. First, our results confirm ear-ier findings in the epidemiological literature that the rich are
ore likely to have hypertension in China, which suggests that goodealth outcomes can be an inferior good, and that this effect is
ikely to occur mainly through an unhealthy diet – the positivencome-hypertension gradient disappears once one controls forood consumption and nutrition intake in previous time periods.econd, our non-parametric RD estimates indicate that, on aver-ge, individuals who were informed that they have hypertensionave reduced their fat intake by about 7.7 g per day 3–4 years afterhe blood pressure test. More importantly, estimates by differentncome groups confirm the theoretical prediction that rich individ-als are more responsive to a diagnosis of hypertension than theoor, which implies that a good (chronic) health condition is indeed
normal good, conditional on past food consumption and healthnformation. In fact, the estimates on fat intake are significant onlyor the rich group.
Lastly, our results for the full sample indicate that there is noeneral differential effect by education level. However, among rel-tively wealthy individuals the estimated reduction in fat intake isreater for those with primary education than those with higherducation. This finding is important, as it helps to identify theources of the effect of hypertension diagnosis and reveals howncome and education may interact with each other. On one hand,ne may argue that the differential effects of treatment coulde attributed to differences in education rather than in income,ecause more educated individuals may be more health-consciousr more efficient in adopting healthier dietary habits and becausencome is positively correlated with education. On the other hand,
ore educated individuals may be more informed of their healthtatus, which would make hypertension diagnosis more informa-ive to less educated individuals. Most importantly, our findingshat dietary adjustments differ by income, but not by education,nd that among the rich individuals, the adjustments are greateror those with lower education levels suggest that hypertensioniagnosis is most useful to rich individuals with lower educationalttainment.
The rest of the paper is organized as follows. Section 2 reviewshe literature on health and income, and the role of informationn determining health behaviors. Section 3 provides backgroundnformation on China and describes the data. Section 4 presentsn organizing framework for empirical analysis, from which ourypothesis is derived. Section 5 discusses the identification andstimation strategies used in the regression-discontinuity designramework. The main results are presented in Section 6, and theast section concludes.
. Literature review
In the past several decades, economists have devoted much
ffort to understand the relationship between health and income.he existing literature has found a relationship that ranges fromtrongly positive to weakly negative (Fuchs, 2004), with differentconomists providing different interpretations of this relationship.
lth Ec
WoooseiKmApstto
dttasprhtettIspoaObte
hStieetihtlfistem
sccwpptoe
ot
ifSchbflulecuondghd
tabmpcccttsiesftsaa
3
rDCtotal deaths in China in 1982, but by 2005 they accounted for about
M. Zhao et al. / Journal of Hea
hereas some studies claim to have found a positive causal effectf income on health (Pritchett and Summers, 1996; Deaton, 2003),thers argue that causality may run in the opposite direction,r through third factors such as education and access to healthervices (Grossman, 2006; Fuchs, 2004). Moreover, some recentpidemiological studies have found a reverse relationship betweenncome and health in some developing countries.4 For example,och et al. (2010) find that income is positively associated withortality rate in an 8-year cohort study conducted in Chile.nother study, Van de Poel et al. (2009), also finds that income isositively associated with the prevalence of obesity and hyperten-ion using data from 1991 to 2004 in China. Our study attemptso reconcile these seemingly contradictory findings by examininghe role of health information and the competing effects of incomen chronic health outcomes.
The study most closely related to ours is that conducted usingata from South Africa by Case et al. (2004). While their findinghat richer people are more likely than the poor to take hyper-ensive medication is consistent with our result, they also found
puzzling result that observed hypertension does not exhibit aignificantly negative relationship with income among those whoarticipated in medical exams. They suspect that this puzzlingesult may occur because richer individuals have a higher risk ofypertension. Indeed, our study provides empirical support forheir conjecture – we find a positive hypertension-income gradi-nt, which comes mainly from individual food consumption. Thus,heir result is likely to suffer from endogeneity bias due to the mul-iple pathways by which income affects health, as discussed above.n addition, Case and her coauthors note that their result is likely touffer from serious sample selection bias, as only 30% of their sam-le self-selected to take the medical exams. Lastly, while they focusn medical compliance, hypertension needs a more comprehensivenalysis that incorporates long-term changes in lifestyle and diet.ur study overcomes both endogeneity and sample selection biasy employing the regression discontinuity method and exploringhe unique Chinese longitudinal data, and it also focuses on theffect of hypertension diagnosis on consumers’ diet patterns.
This study is not the first attempt to estimate the impacts ofealth information on food demand. Several studies (Brown andchrader, 1990; Chern et al., 1995; Roosen et al., 2009) have inves-igated how consumers respond to the provision of public healthnformation on what constitutes a healthy diet, while others havexamined the effects of nutrition labels or social marketing (Martint al., 1994; Crutchfield et al., 2001). Many of these studies focus onhe short-term impacts of public information on consumer behav-or. Yet Grossman’s framework posits that consumers build upealth capital through long-run health investments, such as sus-ained efforts to change dietary habits and lifestyles. Viewed in thisight, gauging the short-run effect of information is insufficient. In aeld experiment conducted in France, for instance, warning of poi-on in fish modified household fish consumption only slightly, and
he impact became insignificant after only three months. Roosent al. (2009) attributed such lack of impact to consumers’ weakemory of the information provided. In contrast, our study focuses4 Epidemiologists divide epidemiological transition as income rises into fourtages. The first stage, at the lowest level of income, is characterized by widespreadommunicable diseases and malnutrition. In the second stage, as incomes risehronic health conditions start to emerge. The third stage is defined as the periodhen burden of chronic diseases exceeds that of infection and malnutrition, accom-anied by increased risk factors such as fatty diet, inactivity, and smoking. In thiseriod, the majority of the chronic diseases occur among the privileged ones. Inhe fourth stage, chronic diseases are the major causes of death and the burdenf chronic diseases is mainly born by those in lower socio-economic status (Gersht al., 2010).
8fO
dFvNiHssra
onomics 32 (2013) 367– 385 369
n the effect of hypertension diagnosis on daily dietary patternshree to four years later.
Furthermore, the findings from the above-mentioned stud-es should be treated with caution, as they are likely to sufferrom endogeneity of health information. For example, Brown andchrader (1990) created a health information index based onounts of journal articles that found links between cholesterol andeart disease. They found that health information, as measuredy the health information index, reduced the per capita demandor eggs by 16% to 25% in United States from 1955 to 1987. Simi-arly, Kim and Chern (1999) created a cholesterol information indexsing a modified weighting method, assuming that articles pub-
ished during specific time periods can have carry-over and decayffects. The study found evidence that health information on fat andholesterol increased the consumption of fish oil and reduced these of lard, tallow and palm oil in Japan. These studies rely heavilyn the assumption that the numbers of article published are exoge-ous, which may not be the case as medical research is in fact oftenriven by public interest and financial support from industry andovernments. Our study circumvents the endogeneity problem ofealth information by adopting the RD approach and exploiting theynamic features of the longitudinal data from China.
Another problem with some of these previous studies is a poten-ial sample selection bias. For example, Crutchfield et al. (2001)nalyzed the impact of nutrition labels to estimate the economicenefit of new rules that require the provision of nutrition infor-ation for all the raw meat and poultry products. They show that
roviding these nutrition labels decreases the intake of fat andholesterol and, therefore, reduces the risks of developing futureases of stroke, cancer and heart disease. However, since those whoare more about the potentially harmful effects of food consump-ion may also look for and read nutritional and other labeling onhe products more carefully, the estimated effect of nutrition orocial labeling may suffer from sample selection bias, even if thentroduction of the label itself is exogenous. In other words, thestimation of the effect of nutrition labeling was based on only theample who had noticed the label, who may be systematically dif-erent from those who had not. In contrast, this study is less likelyo suffer from such sample selection bias, because the blood pres-ure test results were communicated to all subjects (so everyonet least sees the result) and the hypertension diagnosis is based on
well-defined cutoff in blood pressure readings.5
. Background and data
China’s economy has grown rapidly since 1980, with an averageeal GDP per capita growth rate of 8% during the past three decades.uring that same period, the prevalence of chronic diseases inhina has also increased. Chronic diseases accounted for only 65% of
0% (Bryant, 2003; Wang et al., 2005). The implications of this trendor health care costs are formidable: according to the World Healthrganization (WHO, 2005), 560 billion U.S. dollars will be foregone
5 Aside from the economic literature, there are also a number of studies in epi-emiology and public health examining the effect of health information on lifestyles.or example, Milne et al. (1985) show that individuals who are both newly and pre-iously diagnosed as having hypertension are more likely to report a weight loss.eutel and Campbell (2008) find that individuals who were newly diagnosed as hav-
ng hypertension in Canada tend to quit smoking and increase physical activities.owever, as the hypertension diagnosis examined in these studies is often based on
elf-chosen physical examinations, their estimates are likely to suffer from sampleelection bias. Moreover, these studies provide little insight as to how consumers’esponses to the diagnosis of hypertension interact with other socio-economic vari-bles, such as income.
3 lth Economics 32 (2013) 367– 385
dht
vfi2ss9ptpf
jraIwusirtmtw
3
hpsabfmUtcawohCet
dcCpas
P
Tprds
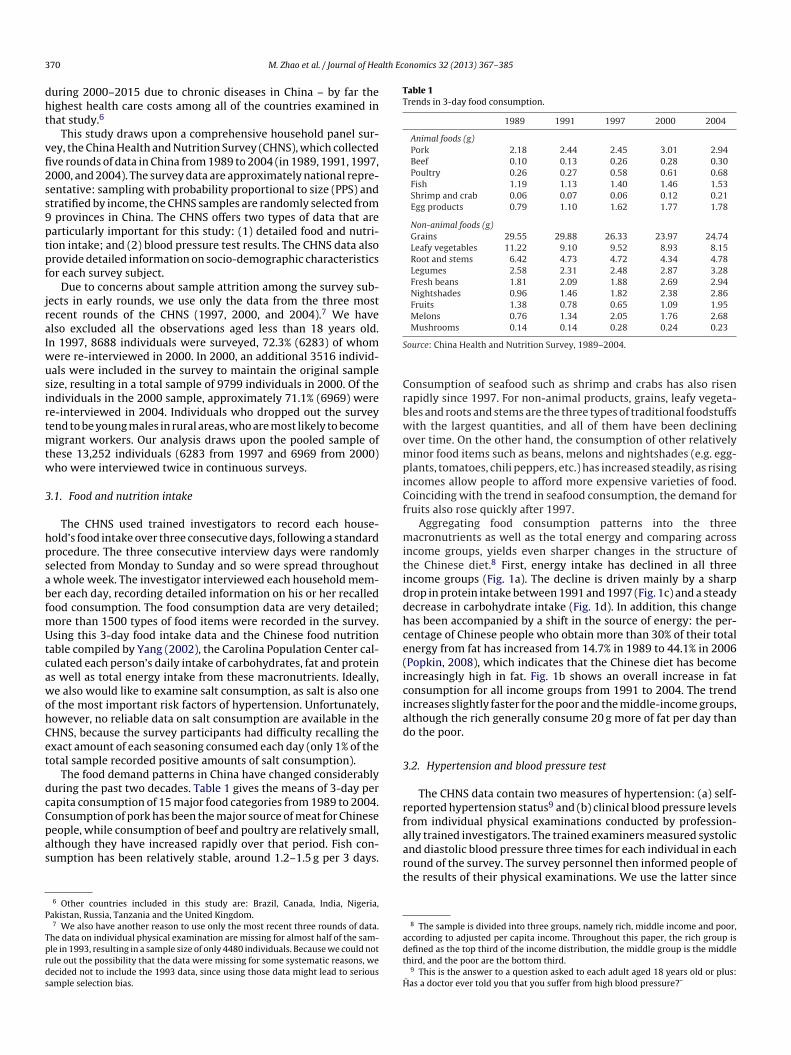
Table 1Trends in 3-day food consumption.
1989 1991 1997 2000 2004
Animal foods (g)Pork 2.18 2.44 2.45 3.01 2.94Beef 0.10 0.13 0.26 0.28 0.30Poultry 0.26 0.27 0.58 0.61 0.68Fish 1.19 1.13 1.40 1.46 1.53Shrimp and crab 0.06 0.07 0.06 0.12 0.21Egg products 0.79 1.10 1.62 1.77 1.78
Non-animal foods (g)Grains 29.55 29.88 26.33 23.97 24.74Leafy vegetables 11.22 9.10 9.52 8.93 8.15Root and stems 6.42 4.73 4.72 4.34 4.78Legumes 2.58 2.31 2.48 2.87 3.28Fresh beans 1.81 2.09 1.88 2.69 2.94Nightshades 0.96 1.46 1.82 2.38 2.86Fruits 1.38 0.78 0.65 1.09 1.95Melons 0.76 1.34 2.05 1.76 2.68
S
CrbwompiCf
mitiddhce(iciad
3
r
70 M. Zhao et al. / Journal of Hea
uring 2000–2015 due to chronic diseases in China – by far theighest health care costs among all of the countries examined inhat study.6
This study draws upon a comprehensive household panel sur-ey, the China Health and Nutrition Survey (CHNS), which collectedve rounds of data in China from 1989 to 2004 (in 1989, 1991, 1997,000, and 2004). The survey data are approximately national repre-entative: sampling with probability proportional to size (PPS) andtratified by income, the CHNS samples are randomly selected from
provinces in China. The CHNS offers two types of data that arearticularly important for this study: (1) detailed food and nutri-ion intake; and (2) blood pressure test results. The CHNS data alsorovide detailed information on socio-demographic characteristicsor each survey subject.
Due to concerns about sample attrition among the survey sub-ects in early rounds, we use only the data from the three mostecent rounds of the CHNS (1997, 2000, and 2004).7 We havelso excluded all the observations aged less than 18 years old.n 1997, 8688 individuals were surveyed, 72.3% (6283) of whom
ere re-interviewed in 2000. In 2000, an additional 3516 individ-als were included in the survey to maintain the original sampleize, resulting in a total sample of 9799 individuals in 2000. Of thendividuals in the 2000 sample, approximately 71.1% (6969) weree-interviewed in 2004. Individuals who dropped out the surveyend to be young males in rural areas, who are most likely to become
igrant workers. Our analysis draws upon the pooled sample ofhese 13,252 individuals (6283 from 1997 and 6969 from 2000)ho were interviewed twice in continuous surveys.
.1. Food and nutrition intake
The CHNS used trained investigators to record each house-old’s food intake over three consecutive days, following a standardrocedure. The three consecutive interview days were randomlyelected from Monday to Sunday and so were spread throughout
whole week. The investigator interviewed each household mem-er each day, recording detailed information on his or her recalledood consumption. The food consumption data are very detailed;
ore than 1500 types of food items were recorded in the survey.sing this 3-day food intake data and the Chinese food nutrition
able compiled by Yang (2002), the Carolina Population Center cal-ulated each person’s daily intake of carbohydrates, fat and proteins well as total energy intake from these macronutrients. Ideally,e also would like to examine salt consumption, as salt is also one
f the most important risk factors of hypertension. Unfortunately,owever, no reliable data on salt consumption are available in theHNS, because the survey participants had difficulty recalling thexact amount of each seasoning consumed each day (only 1% of theotal sample recorded positive amounts of salt consumption).
The food demand patterns in China have changed considerablyuring the past two decades. Table 1 gives the means of 3-day perapita consumption of 15 major food categories from 1989 to 2004.onsumption of pork has been the major source of meat for Chinese
eople, while consumption of beef and poultry are relatively small,lthough they have increased rapidly over that period. Fish con-umption has been relatively stable, around 1.2–1.5 g per 3 days.6 Other countries included in this study are: Brazil, Canada, India, Nigeria,akistan, Russia, Tanzania and the United Kingdom.7 We also have another reason to use only the most recent three rounds of data.
he data on individual physical examination are missing for almost half of the sam-le in 1993, resulting in a sample size of only 4480 individuals. Because we could notule out the possibility that the data were missing for some systematic reasons, weecided not to include the 1993 data, since using those data might lead to seriousample selection bias.
faart
adt
H
Mushrooms 0.14 0.14 0.28 0.24 0.23
ource: China Health and Nutrition Survey, 1989–2004.
onsumption of seafood such as shrimp and crabs has also risenapidly since 1997. For non-animal products, grains, leafy vegeta-les and roots and stems are the three types of traditional foodstuffsith the largest quantities, and all of them have been declining
ver time. On the other hand, the consumption of other relativelyinor food items such as beans, melons and nightshades (e.g. egg-
lants, tomatoes, chili peppers, etc.) has increased steadily, as risingncomes allow people to afford more expensive varieties of food.oinciding with the trend in seafood consumption, the demand for
ruits also rose quickly after 1997.Aggregating food consumption patterns into the three
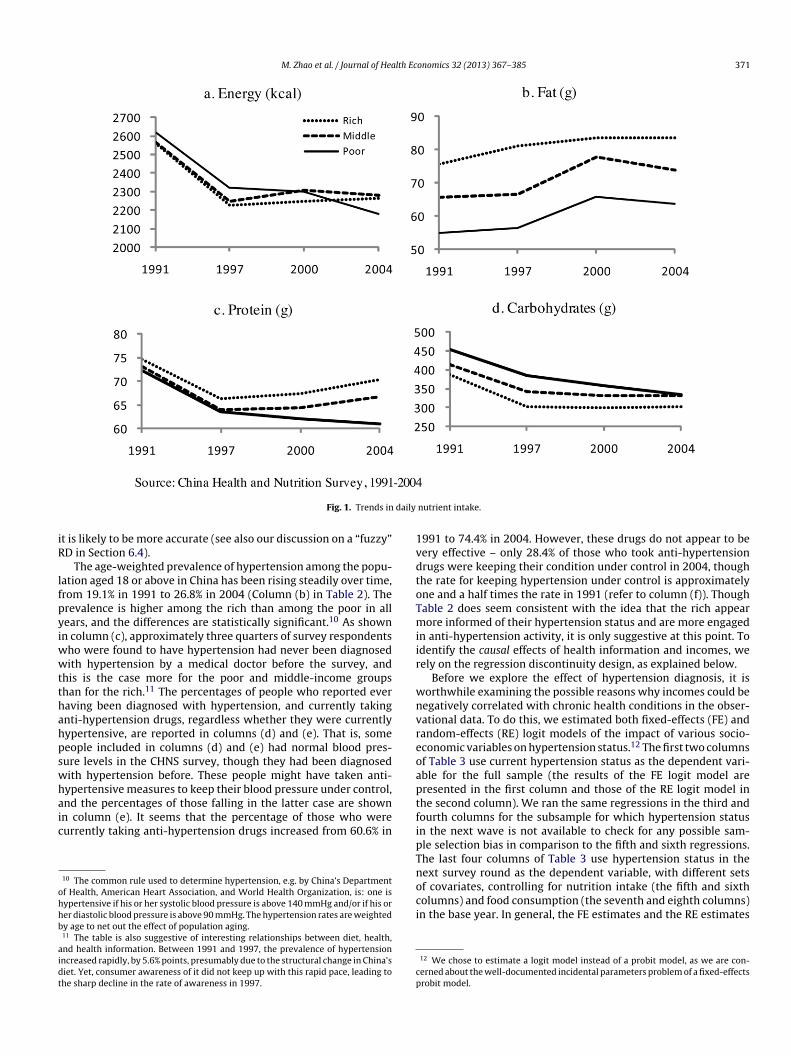
acronutrients as well as the total energy and comparing acrossncome groups, yields even sharper changes in the structure ofhe Chinese diet.8 First, energy intake has declined in all threencome groups (Fig. 1a). The decline is driven mainly by a sharprop in protein intake between 1991 and 1997 (Fig. 1c) and a steadyecrease in carbohydrate intake (Fig. 1d). In addition, this changeas been accompanied by a shift in the source of energy: the per-entage of Chinese people who obtain more than 30% of their totalnergy from fat has increased from 14.7% in 1989 to 44.1% in 2006Popkin, 2008), which indicates that the Chinese diet has becomencreasingly high in fat. Fig. 1b shows an overall increase in fatonsumption for all income groups from 1991 to 2004. The trendncreases slightly faster for the poor and the middle-income groups,lthough the rich generally consume 20 g more of fat per day thano the poor.
.2. Hypertension and blood pressure test
The CHNS data contain two measures of hypertension: (a) self-eported hypertension status9 and (b) clinical blood pressure levelsrom individual physical examinations conducted by profession-lly trained investigators. The trained examiners measured systolic
nd diastolic blood pressure three times for each individual in eachound of the survey. The survey personnel then informed people ofhe results of their physical examinations. We use the latter since8 The sample is divided into three groups, namely rich, middle income and poor,ccording to adjusted per capita income. Throughout this paper, the rich group isefined as the top third of the income distribution, the middle group is the middlehird, and the poor are the bottom third.
9 This is the answer to a question asked to each adult aged 18 years old or plus:¨ as a doctor ever told you that you suffer from high blood pressure?¨
M. Zhao et al. / Journal of Health Economics 32 (2013) 367– 385 371
daily
iR
lfpyiwwtthahpswhaic
ohhb
aidt
1vdtoTmiir
wnvreoap
Fig. 1. Trends in
t is likely to be more accurate (see also our discussion on a “fuzzy”D in Section 6.4).
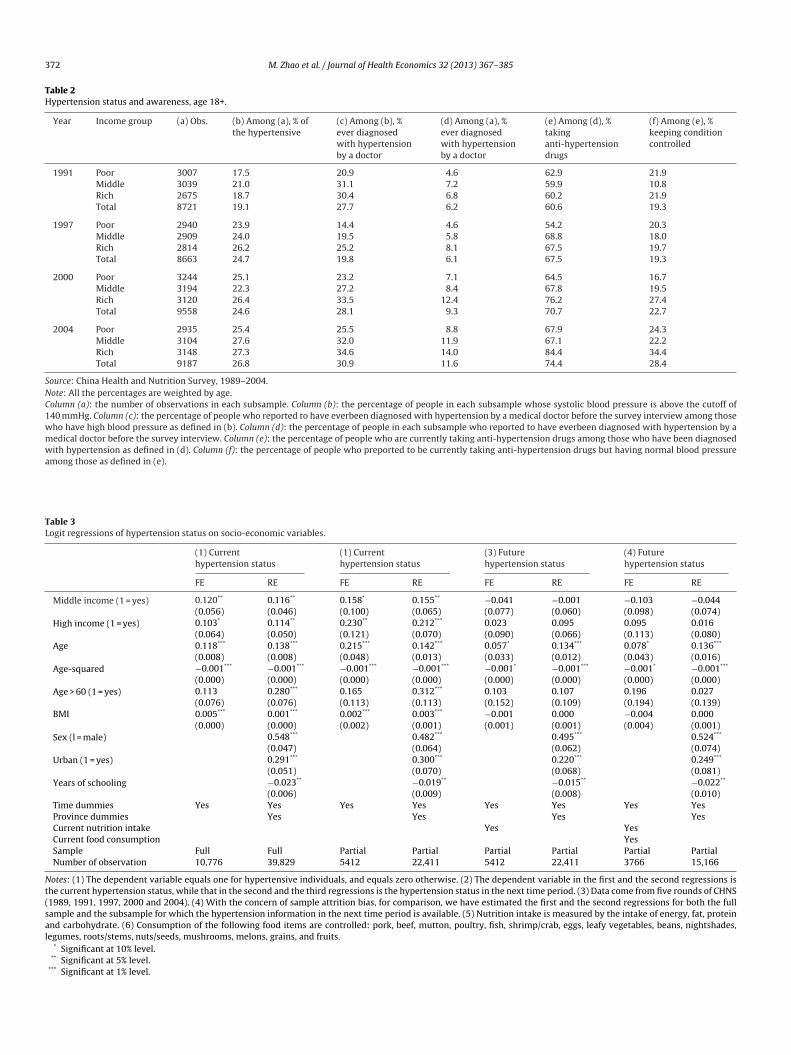
The age-weighted prevalence of hypertension among the popu-ation aged 18 or above in China has been rising steadily over time,rom 19.1% in 1991 to 26.8% in 2004 (Column (b) in Table 2). Therevalence is higher among the rich than among the poor in allears, and the differences are statistically significant.10 As shownn column (c), approximately three quarters of survey respondents
ho were found to have hypertension had never been diagnosedith hypertension by a medical doctor before the survey, and
his is the case more for the poor and middle-income groupshan for the rich.11 The percentages of people who reported everaving been diagnosed with hypertension, and currently takingnti-hypertension drugs, regardless whether they were currentlyypertensive, are reported in columns (d) and (e). That is, someeople included in columns (d) and (e) had normal blood pres-ure levels in the CHNS survey, though they had been diagnosedith hypertension before. These people might have taken anti-ypertensive measures to keep their blood pressure under control,
nd the percentages of those falling in the latter case are shownn column (e). It seems that the percentage of those who wereurrently taking anti-hypertension drugs increased from 60.6% in10 The common rule used to determine hypertension, e.g. by China’s Departmentf Health, American Heart Association, and World Health Organization, is: one isypertensive if his or her systolic blood pressure is above 140 mmHg and/or if his orer diastolic blood pressure is above 90 mmHg. The hypertension rates are weightedy age to net out the effect of population aging.11 The table is also suggestive of interesting relationships between diet, health,nd health information. Between 1991 and 1997, the prevalence of hypertensionncreased rapidly, by 5.6% points, presumably due to the structural change in China’siet. Yet, consumer awareness of it did not keep up with this rapid pace, leading tohe sharp decline in the rate of awareness in 1997.
tfipTnoci
cp
nutrient intake.
991 to 74.4% in 2004. However, these drugs do not appear to beery effective – only 28.4% of those who took anti-hypertensionrugs were keeping their condition under control in 2004, thoughhe rate for keeping hypertension under control is approximatelyne and a half times the rate in 1991 (refer to column (f)). Thoughable 2 does seem consistent with the idea that the rich appearore informed of their hypertension status and are more engaged
n anti-hypertension activity, it is only suggestive at this point. Todentify the causal effects of health information and incomes, weely on the regression discontinuity design, as explained below.
Before we explore the effect of hypertension diagnosis, it isorthwhile examining the possible reasons why incomes could beegatively correlated with chronic health conditions in the obser-ational data. To do this, we estimated both fixed-effects (FE) andandom-effects (RE) logit models of the impact of various socio-conomic variables on hypertension status.12 The first two columnsf Table 3 use current hypertension status as the dependent vari-ble for the full sample (the results of the FE logit model areresented in the first column and those of the RE logit model inhe second column). We ran the same regressions in the third andourth columns for the subsample for which hypertension statusn the next wave is not available to check for any possible sam-le selection bias in comparison to the fifth and sixth regressions.he last four columns of Table 3 use hypertension status in theext survey round as the dependent variable, with different sets
f covariates, controlling for nutrition intake (the fifth and sixtholumns) and food consumption (the seventh and eighth columns)n the base year. In general, the FE estimates and the RE estimates12 We chose to estimate a logit model instead of a probit model, as we are con-erned about the well-documented incidental parameters problem of a fixed-effectsrobit model.
372 M. Zhao et al. / Journal of Health Economics 32 (2013) 367– 385
Table 2Hypertension status and awareness, age 18+.
Year Income group (a) Obs. (b) Among (a), % ofthe hypertensive
(c) Among (b), %ever diagnosedwith hypertensionby a doctor
(d) Among (a), %ever diagnosedwith hypertensionby a doctor
(e) Among (d), %takinganti-hypertensiondrugs
(f) Among (e), %keeping conditioncontrolled
1991 Poor 3007 17.5 20.9 4.6 62.9 21.9Middle 3039 21.0 31.1 7.2 59.9 10.8Rich 2675 18.7 30.4 6.8 60.2 21.9Total 8721 19.1 27.7 6.2 60.6 19.3
1997 Poor 2940 23.9 14.4 4.6 54.2 20.3Middle 2909 24.0 19.5 5.8 68.8 18.0Rich 2814 26.2 25.2 8.1 67.5 19.7Total 8663 24.7 19.8 6.1 67.5 19.3
2000 Poor 3244 25.1 23.2 7.1 64.5 16.7Middle 3194 22.3 27.2 8.4 67.8 19.5Rich 3120 26.4 33.5 12.4 76.2 27.4Total 9558 24.6 28.1 9.3 70.7 22.7
2004 Poor 2935 25.4 25.5 8.8 67.9 24.3Middle 3104 27.6 32.0 11.9 67.1 22.2Rich 3148 27.3 34.6 14.0 84.4 34.4Total 9187 26.8 30.9 11.6 74.4 28.4
Source: China Health and Nutrition Survey, 1989–2004.Note: All the percentages are weighted by age.Column (a): the number of observations in each subsample. Column (b): the percentage of people in each subsample whose systolic blood pressure is above the cutoff of140 mmHg. Column (c): the percentage of people who reported to have everbeen diagnosed with hypertension by a medical doctor before the survey interview among thosewho have high blood pressure as defined in (b). Column (d): the percentage of people in each subsample who reported to have everbeen diagnosed with hypertension by amedical doctor before the survey interview. Column (e): the percentage of people who are currently taking anti-hypertension drugs among those who have been diagnosedwith hypertension as defined in (d). Column (f): the percentage of people who preported to be currently taking anti-hypertension drugs but having normal blood pressureamong those as defined in (e).
Table 3Logit regressions of hypertension status on socio-economic variables.
(1) Currenthypertension status
(1) Currenthypertension status
(3) Futurehypertension status
(4) Futurehypertension status
FE RE FE RE FE RE FE RE
Middle income (1 = yes) 0.120** 0.116** 0.158* 0.155** −0.041 −0.001 −0.103 −0.044(0.056) (0.046) (0.100) (0.065) (0.077) (0.060) (0.098) (0.074)
High income (1 = yes) 0.103* 0.114** 0.230** 0.212*** 0.023 0.095 0.095 0.016(0.064) (0.050) (0.121) (0.070) (0.090) (0.066) (0.113) (0.080)
Age 0.118*** 0.138*** 0.215*** 0.142*** 0.057* 0.134*** 0.078* 0.136***
(0.008) (0.008) (0.048) (0.013) (0.033) (0.012) (0.043) (0.016)Age-squared −0.001*** −0.001*** −0.001*** −0.001*** −0.001* −0.001*** −0.001* −0.001***
(0.000) (0.000) (0.000) (0.000) (0.000) (0.000) (0.000) (0.000)Age > 60 (1 = yes) 0.113 0.280*** 0.165 0.312*** 0.103 0.107 0.196 0.027
(0.076) (0.076) (0.113) (0.113) (0.152) (0.109) (0.194) (0.139)BMI 0.005*** 0.001*** 0.002*** 0.003*** −0.001 0.000 −0.004 0.000
(0.000) (0.000) (0.002) (0.001) (0.001) (0.001) (0.004) (0.001)Sex (l = male) 0.548*** 0.482*** 0.495*** 0.524***
(0.047) (0.064) (0.062) (0.074)Urban (1 = yes) 0.291*** 0.300*** 0.220*** 0.249***
(0.051) (0.070) (0.068) (0.081)Years of schooling −0.023** −0.019** −0.015** −0.022**
(0.006) (0.009) (0.008) (0.010)Time dummies Yes Yes Yes Yes Yes Yes Yes YesProvince dummies Yes Yes Yes YesCurrent nutrition intake Yes YesCurrent food consumption YesSample Full Full Partial Partial Partial Partial Partial PartialNumber of observation 10,776 39,829 5412 22,411 5412 22,411 3766 15,166
Notes: (1) The dependent variable equals one for hypertensive individuals, and equals zero otherwise. (2) The dependent variable in the first and the second regressions isthe current hypertension status, while that in the second and the third regressions is the hypertension status in the next time period. (3) Data come from five rounds of CHNS(1989, 1991, 1997, 2000 and 2004). (4) With the concern of sample attrition bias, for comparison, we have estimated the first and the second regressions for both the fullsample and the subsample for which the hypertension information in the next time period is available. (5) Nutrition intake is measured by the intake of energy, fat, proteinand carbohydrate. (6) Consumption of the following food items are controlled: pork, beef, mutton, poultry, fish, shrimp/crab, eggs, leafy vegetables, beans, nightshades,legumes, roots/stems, nuts/seeds, mushrooms, melons, grains, and fruits.
* Significant at 10% level.** Significant at 5% level.
*** Significant at 1% level.
lth Ec
asgntoctbi
4
sAisih
H
wafGmmcd
Fs
H
wmεthwitse
ε
mwh
hesf
IWceec
io
hhrftGcr
thrhpcici(powwmc
Hatal
dbschho
p0
M. Zhao et al. / Journal of Hea
re very similar, with the latter being more efficient due to a largerample size. The results in columns (1)–(4) confirm that the richenerally are more likely to be hypertensive than the poor. Yet, afterutrition intake and food consumption in the base year were con-rolled for, as shown in the columns (5)–(8), the estimated effectsf income dummies turn completely insignificant. This finding isonsistent with our explanation about the observed puzzle – i.e.he negative gradient between income and hypertension exists,ut is mainly intermediated by food consumption and/or nutrition
ntake.
. Empirical framework
We present an organizing framework for our empirical analy-is, building on the health capital framework of Grossman (1972).ccording to recent clinical findings, daily diet is one of the most
mportant determinants of health capital. We thus posit that con-umer’s health capital in the next period, Ht + 1, depends on currentntake of fat, Ft, current intake of other nutrients, Nt, and currentealth capital, Ht.
t+1 = I(Ft, Nt) + (1 − ıt)Ht, (1)
here I is the health investment function, with IF < 0 and IN > 0,nd ıt ∈[0, 1] is the depreciation rate of health capital.13 Exceptor the investment function I, all other essential components ofrossman’s model are maintained. One important prediction of theodel is that, as in Grossman, an increase in the wage rate raises thearginal benefit of health capital since it increases the opportunity
ost of the working time lost due to sickness and results in higheremand for both health investment and health capital.
We now introduce information imperfections into the model.irst, assume that the consumer observes her true initial healthtatus (H0) with an i.i.d. error:
˜ 0 = H0 + ε0. (2)
here H0 is perceived health status. Note that some individualsay have accurate knowledge of their initial health status, so that
0 = 0, while others either overestimate or underestimate their ini-ial health status (ε0 > 0 or ε0 < 0). Assume that the consumer makesealth investments over time, observing her initial health capitalith errors but knowing the health production function (1).14 One
mportant implication of this modeling strategy is that, because herrue and perceived health capitals evolve according to (1), she con-istently misperceives her health capital over time, with an error
volving according to15:t+1 = (1 − ıt)εt. (3)
13 The health effect of fat can be positive when under consumed, e.g. in the case ofalnutrition. For simplicity, we assume it is bad for health as the health outcomee are interested in is hypertension, for which fat intake is generally considered toave a negative impact14 Obviously, there are a number of other ways consumers may misperceive theirealth conditions. For example, consumers may have inaccurate knowledge on theffect of health investment I or depreciation rate of health capital ı. The extent ofuch misperception may also interact with consumers’ education levels. We refrainrom these complications in order to obtain clear predictions from the model.15 To see this, observe that, for any time period t, Ht+1 = I(Ft, Nt ) + (1 − ıt )Ht =(Ft, Nt ) + (1 − ıt )(Ht + εt ) = Ht+1 + (1 − ıt )εt .
e posit that the error in health perception is most closely related to innate personalharacters (e.g. optimistic vs. pessimistic persons) so that the consumer receives thisrror in period 0 and carries over her lifetime according to (3), unless she experi-nces exogenous information shocks such as a chronic health condition or a medicalheckup.
haaca
aEt
b
dd
onomics 32 (2013) 367– 385 373
This equation implies that consumers who overestimated theirnitial health status continue to overestimate their health, but suchver-confidence decreases over time as they get older.
Once in a while, however, the consumer experiences a chronicealth condition or has a medical checkup, either of which allowser to observe her true health status Ht. Grossman (1972) doesecognize the importance of medical checkups (e.g., p. 227), butocuses on the time-investment aspect rather than the informa-ional aspect of such activities. Assuming perfect information,rossman’s model fails to explain how information from medi-al checkups impacts consumers’ decision making processes withespect to investment in health capital.
Importantly, if a consumer realizes in some period � that herrue health capital is lower than she thought it was (due to H∗
� , beingigher than H�), she must further increase her health investment toaise her future health capital to the new optimum given her actualealth capital today. That is, because she had chosen (F∗
t , N∗t ) up to
eriod � > t rationally expecting their impact on her future healthapital H∗
t for t ≥ �, and because her health capital evolves accord-ng to (1), she must raise I� to achieve the new optimal path H∗
�+1onditional on observing H� < H∗
� .16 Provided that IF < 0 and IN > 0,t follows that: F∗
t ≤ F∗t and N∗
t ≥ N∗t for t ≥ �, iff H� < H∗
� , whereF∗, N∗) and (F*, N*) indicate the consumer’s optimal consumptionath along her perceived health and her true health conditional onbserving H� , respectively. Moreover, since individuals with higherage incomes demand higher health capital than those with lowerage incomes, ceteris paribus, the former must adjust their dietore than the latter, conditional on observing the same true health
apital.
ypothesis. Consumers adjust their diet toward less/more fat intakend more/less intake of other nutrients, upon receiving a nega-ive/positive health information shock. Moreover, dietary adjustmentsre greater for consumers with higher wage incomes than those withower wage incomes, conditional on the same true health status.
Our approach to testing this hypothesis is to use a regression-iscontinuity estimator, making use of the exogenous cutoff inlood pressure readings for diagnosing hypertension. Hyperten-ion status is one of the most important measures of one’s healthapital. Let hi = 1 if individual i has hypertension (we suppress tenceforth). An individual is diagnosed as having hypertension ifer blood pressure level bi is above a cutoff level c. The individualbserves bi with an error εi: bi = bi + εi.
An individual whose belief bi lies below c but whose true bloodressure bi lies above c gets a negative information shock: hi − hi <. Analogously, there are two other cases: hi − hi > 0 and hi −i = 0. Therefore, any individual whose true blood pressure bi liesbove c would get either no information surprise (her bi also liesbove c) or a negative information shock. Assuming that individualsonsider hypertension status h (not the blood pressure level per se)s an important part of their health capital, we posit that F∗
i< F∗
i
nd N∗i
> N∗i
iff hi − hi < 0. It follows then that we should observe[F∗ − F∗ ≤ 0|b > c] and E[F∗ − F∗ ≥ 0|b < c] where the expecta-ion operator is taken over all i. Hence, we should observe that:
lim→c+
E[F∗(b) − F∗(b)] − limb→c−
E[F∗(b) − F∗(b)]
= limb→c+
E[F∗(b)] − limb→c−
E[F∗(b)] ≤ 0.
16 More precisely, a sufficient condition for the optimal health investment I∗� con-
itional on H� to be higher than that conditional on H∗� when H� < H∗
� , is that theemand for health capital is inelastic.
3 lth Ec
bbtnl
sieHchFesfhpanmworteS
5
5
sthpsaTaT
wedwrpe
Y
wvˇHttt
t
Iftn
chivctfolbst
b“misf
Y
waufyii
tp(d
ˇ
w
ft
(
(
wakL
5.2. Preliminary checks on the regression discontinuity design
74 M. Zhao et al. / Journal of Hea
Note that limb→c+
E[F∗(b)] and limb→c−
E[F∗(b)] are the same because,
efore knowing their true hypertension status, people whose truelood pressure is close to the cutoff behave similarly and demandhe same amount of F∗. An analogous expression exists for otherutrients N. According to our model, this difference should also be
arger for richer individuals.A final question is: Can we derive testable hypotheses on con-
umers’ dietary adjustments in terms of education rather than byncome? Our answer is “No”. As Grossman (1972) points out, moreducated consumers may be more productive in health production.is argument also seems valid in this context, because more edu-ated consumers may have better knowledge of what constitutes aealthy diet or may simply be better at (self-)controlling daily diet.ollowing this line of argument, it is tempting to derive a hypoth-sis that dietary adjustments upon receiving a health informationhock are greater for consumers with higher education levels thanor those with lower education levels, conditional on the same trueealth status. However, such a hypothesis does not account for theossibility that more educated consumers may be more informedbout their own health status. In other words, hypertension diag-osis may be more informative to less educated consumers thanore educated ones. In the empirical framework described below,e have no means to disentangle these two competing effects
f education, and thus we do not derive any testable hypothesesegarding education levels. Indeed, our results indicate that withinhe wealthiest group, dietary adjustments are greater for the lessducated consumers than for the more educated consumers (seeection 6.2).
. Identification and estimation
.1. The regression discontinuity design
To operationalize the organizing framework in Section 4, thetudy exploits the facts that all survey subjects were informed ofheir blood pressure test results in each survey round and thatypertension status is a deterministic function of continuous bloodressure measures – i.e. an individual is judged to have hyperten-ion if either her systolic blood pressure (SBP) is above 140 mmHgnd/or her diastolic blood pressure (DBP) is above 90 mmHg.hough DBP is also an important indicator of hypertension, patientsnd physicians often pay closer attention to SBP (Kannel, 2000).17
hus, for simplicity this study focuses only on SBP.This assignment of hypertension status in the CHNS lends itself
ell to estimating causal impacts of health information using a RDstimation method. Consider a random sample of individuals withata on the outcome measure, Yi, and the treatment indicator Ti,here the subscript i indicates the ith individual. Ti equals one if i
eceives the treatment and equals zero otherwise. The standardarametric econometric specification to evaluate the treatmentffect is:
i = + ˇTi + ui (4)
here measures the treatment effect and ui is the unexplainedariation in Yi. If the assignment of the treatment is random, then
can be consistently estimated by ordinary least square (OLS).
owever, if the treatment is not randomly assigned, it is likelyhat E[u|T] /= 0, in which case the OLS estimate will be biased. Inhis study, the treatment of interest is the notification of hyper-ension status and the outcomes of interest are nutrition intakes.
17 Moreover, hypertension due to high DBP only is often treated differently fromhat due to high SBP in medical practice.
a
aa
onomics 32 (2013) 367– 385
ndividuals develop hypertension due to a variety of unobservableactors such as diet, lifestyle and genetic inheritance. Therefore,he assignment of hypertension status is often endogenous in aon-experimental setup.
The RD design can circumvent this problem by exploiting theutoff point for blood pressure that determines the diagnosis ofypertension. Consider the individuals who are within a small
nterval in the neighborhood of the cutoff point. Because these indi-iduals have essentially the same blood pressure, and since theyannot precisely control their blood pressure on a particular day ofhe blood pressure test, some may fall slightly below, and some mayall slightly above, the cutoff point. As the average characteristicsf the two samples slightly below and slightly above the cutoff areikely to be the same (the validity of this assumption is discussedelow), the average outcomes for the two samples should be theame in the absence of treatment. Thus, in the small neighborhood ofhe cutoff point, our RD design mimics a randomized experiment.
If consumers are well informed of their hypertension statusased on the cutoffs, we could use a “sharp” RD design.18 In asharp” RD, the assignment of treatment Ti is based on a deter-inistic function of the cutoff: i.e., Ti = 1(bi ≥ c). Because the cutoff
s fixed, the error term ui is uncorrelated with Ti conditional on bi,o that E[ui|Ti, bi] = E[ui|bi] = f(bi) where f(.) is a flexible continuousunction of bi. We can thus rewrite Eq. (4):
i = + ˇTi + f (bi) + �i (5)
here �i = ui − E[ui|Ti, bi] with E[�i|Ti] = 0. If Eq. (5) is linear in Tind f(.) can be correctly specified, the parameter b can be estimatedsing OLS. The primary issue in OLS estimation is the choice of theunctional form for f. If over-specified, the estimate of b is consistentet inefficient; if under-specified, the estimate will be efficient butnconsistent. Quartic polynomials are preferred for their flexibilityn practice (Lee, 2004).
However, since there is no a priori reason to believe thathe underlying model is linear, estimation is often done non-arametrically (Lee and Lemieux, 2010). Following Hahn et al.2001), we estimate a local linear regression (LLR), using only theata close to the cutoff point. Thus the treatment effect is:
= Y+ − Y− (6)
here Y+ = limb→c+
E[Yi|bi] and Y− = limb→c−
E[Yi|bi]. The LLR estimators
or Y+ and Y− are given by ıYr and ıYl from the following optimiza-ion:
ıYr, �Yr) ≡ arg minı,�
∑
i:bi≥c
[Yi − ı − �(bi − c)2]�i,
ıYl, �Yl) ≡ arg minı,�
∑
i:bi<c
[Yi − ı − �(bi − c)2]�i,
here �i = K[(bi − c)/h] is a kernel function. Following the literature, triangular kernel is used in this study, since the choice of theernel function “typically has little impact in practice” (Lee andemieux, 2010).
A regression discontinuity design is appropriate only if twossumptions are satisfied (Hahn et al., 2001). First, the individuals
18 If consumers are informed of their SBP readings but not of hypertension statusnd if consumers are not well informed of the cutoffs, a “fuzzy” RD may be moreppropriate. We will return to this discussion in Section 6.4.
lth Ec
bmortspihm
d
picLmsdt
TT
Ncc
M. Zhao et al. / Journal of Hea
eing studied cannot precisely control the value of the assign-ent variable (i.e. systolic blood pressure in our case). Second, the
bserved or unobserved characteristics of individuals whose SBPeadings are right above or below the cutoff point do not differ sys-ematically. The first assumption appears to trivially hold in thisetting, as one cannot precisely control his or her systolic bloodressure at a particular time of the day. Though one can surely
nfluence blood pressure by taking some measures such as anti-
ypertension drugs, one cannot control the effectiveness of sucheasures.To check if the second assumption holds, we first examine theistribution of several observable socio-economic factors by blood
twls
able 4he Effects of being informed of hypertension status on daily nutrient intake.
All
Fat (g)Nonparametric estimatesOptimal bandwidth = 13 −7.7***
(3.3)Bandwidth = 6.5 −7.7**
(4.4)
Parametric estimatesWithout additional controls −3.5*
(2.2)
With additional controls −2.9
(2.3)
Protein (g)Nonparametric estimatesOptimal bandwidth = 10 0.6
(2.8)Bandwidth = 5 0.8
(3.8)
Parametric estimatesWithout additional controls −0.9
(1.4)
With additional controls 0.3
(1.3)
Carbohydrates (g)Nonparametric estimatesOptimal bandwidth = 15 7.1
(11.1)Bandwidth = 7.5 6.3
(16.5)
Parametric estimatesWithout additional controls −1.0
(2.5)
With additional controls 0.4
(7.5)
Energy (kcal)Nonparametric estimatesOptimal bandwidth = 20 −40.0
(45.3)Bandwidth = 10 −43.0
(79.8)
Parametric estimatesWithout additional controls −57.3
(43.2)
With additional controls −30.1
(41.8)
otes: (1) Robust standard errors are reported in parenthesis. (2) The optimal bandwidthlearer expression, we only report the averages here. (3) Quartic polynomials of systole bloontrols include age, sex, education, urban residence, province and year dummies.
* Significant at 15% level.** Significant at 10% level.
*** Significant at 5% level.
onomics 32 (2013) 367– 385 375
ressure in a manner similar to an experimental design. As shownn Fig. A.1, these variables are distributed continuously around theutoff point of 140 mmHg. To check for unobservables, Lee andemieux (2010) suggest examining the distribution of the assign-ent variable itself. This is done in Fig. A.2. The kernel density of
ystolic blood pressure shows that SBP is approximately normallyistributed, without a notable change in its distribution aroundhe cutoff point. Since there is no systematic difference between
he two samples to the left and to the right of the cutoff point, ife observe changes in the outcomes variables of interest, they areikely to be due to the treatment, i.e. notification of hypertensiontatus.
Poor Middle Rich
0.6 −4.4 −10.2***
(5.3) (5.9) (5.3)1.1 −5.1 −12.7**
(7.7) (7.4) (7.4)
1.2 −2.4 −7.6**
(3.7) (4.3) (4.1)1.2 −1.5 −6.9**
(3.6) (4.2) (4.1)
3.7 −1.1 2.6(3.1) (3.6) (5.2)1.8 3.4 −0.3(4.7) (5.2) (8.5)
−0.6 0.5 −1.8(2.1) (2.3) (2.6)0.7 1.4 −0.9(2.1) (2.3) (2.5)
19.5 2.9 −1.3(15.5) (16.7) (19.9)13.1 7.8 −3.8(21.8) (23.9) (35.2)
−3.4 −7.8 −1.2(7.7) (12.1) (13.1)1.3 −6.1 2.9(11.7) (12.6) (13.9)
8.6 −4.2 −90.3(72.6) (84.5) (86.7)57.7 5.3 −121.9(117.9) (134.5) (150.4)
−43.7 −2.1 −114.9*
(70.8) (74.7) (76.3)1.4 −9.5 −75.2(68.7) (72.5) (73.8)
is actually sightly different for different subsamples, as it is data-dependent. For aod pressure are included in all parametric estimation specifications. (4) Additional
376 M. Zhao et al. / Journal of Health Economics 32 (2013) 367– 385
Table 5The effects of being informed of hypertension status on the use of anti-hypertension drugs (%).
All Poor Middle Rich
(a) Full sampleNonparametric estimatesOptimal bandwidth = 5 1.8 5.7*** 2.9*** 1.7***
(0.2) (0.5) (0.3) (0.3)
Parametric estimatesWith additionalcontrols
5.3*** 5.7*** 5.3*** 4.30***
(0.3) (0.6) (0.5) (0.5)Number of observations 12,985 4466 4335 4184
(b) Excluding self-reported hypertensive individuals in base yeara
Nonparametric estimatesOptimal bandwidth = 5 4.9*** 4.3*** 5.1*** 5.9***
(0.1) (0.2) (0.9) (0.3)
Parametric estimatesWith additionalcontrols
4.0*** 4.2*** 4.8*** 2.44***
(0.3) (0.6) (0.5) (0.7)Number of observations 12,255 4272 4129 3854
(c) Excluding anti-hypertension drug users in base yearb
Nonparametric estimatesOptimal bandwidth = 5 6.1*** 4.3*** 2.6*** 7.6***
(0.2) (1.2) (0.5) (0.5)
Parametric estimatesWith additionalcontrols
4.1*** 4.3*** 4.5*** 3.10***
(0.3) (0.6) (0.5) (0.6)Number of observations 12,476 4342 4196 3938
Notes: (1) Robust standard errors are reported in parenthesis. (2) The optimal bandwidth is actually slightly different for different subsamples, as it is data-dependent. For aclearer expression, we only report the averages here. (3) Quartic polynomials of systolic blood pressure are included in all parametric estimation specifications. (4) Additionalcontrols include age, sex, education, urban residence, province and year dummies.
a Self-reported hypertensive individuals are defined as those who reported to have ever been diagnosed of hypertension by a medical doctor before the survey interview.b Anti-hypertension drug users are defined as those who reported to be currently using anti-hypertension drug.
*
*
6
wToS1nrFcmi
soaFcctfqcasfuth
Table 6Summary statistics for additional control variables.
Observations Mean S.D. Min Max
Age 13,229 45.40 14.50 17 118Years of schooling 13,116 6.55 4.17 0 18Sex (l = male) 13,252 0.48 0.50 0 1Urban residence (1 = yes) 13,252 0.29 0.45 0 1Rich tertile (1 = yes) 13,252 0.32 0.47 0 1Middle tertile (1 = yes) 13,252 0.34 0.47 0 1
S
Significant at 10% level.* Significant at 5% level.*** Significant at 1% level.
. Results
Local linear regressions were estimated, with optimal band-idths, for the four outcome measures of the nutrient intake in
able 4. Though not our primary focus, we also report our resultsn the use of anti-hypertension drugs in Table 5. As discussed inection 5, we use individual systolic blood pressure (SBP) in the997 and 2000 CHNS surveys as our assignment variable, and dailyutrient intake from the next survey round (i.e. 3–4 years later), asecorded in the 2000 and 2004 surveys, as our outcome variable.19
ollowing Imbens and Kalyanaraman (2009), we first estimate the
onsistent optimal bandwidth around the cutoff by minimizing theean integrated squared error. We then use the sample within thenterval to estimate the upper and lower limits of outcomes at the
19 We have also considered two alternative sets of dependent variables: (a) con-umption of specific food groups such as meats, vegetables, fruits, etc.; (b) the sharef a component nutrient intake (e.g. fat) in the total energy intake. These results arevailable upon request. We do not report these results for the following reasons.or the former, estimation with aggregated food categories will not capture subtlehanges in food choices as well as the substitution between food items in the sameategory, which may mask what consumers are attempting to do to change their dietoward a healthier direction. For example, consumers may reduce fats by reducingat-cut meats or substituting different types of meats without changing the overalluantity of meats. Because the CHNS survey records nutrient contents of differentuts as well as different types of meats, we think that nutrition intake can give us
better and clearer picture of the changes in overall diet patterns. For the secondet of dependent variables, it turns out that when a major nutrient intake such asat increases, the total calorie intake also increases. Thus the relative measure givess substantially less variation than the absolute measure. For instance, in our datahe proportion of calories coming from fat does not differ significantly betweenypertensive and non-hypertensive people (29.3% and 28.9%, respectively).
ctaIps
6
tF
rra
Poor tertile (1 = yes) 13,252 0.34 0.48 0 1
ource: China Health and Nutrition Survey, 1997–2004.
utoff point. Lastly, the standard errors are calculated for statis-ical inference. For robustness, the estimation is also done using
bandwidth that is half of the calculated optimal bandwidth.20
n addition, we estimate the parametric specification with quarticolynomials with and without other covariates (see Table 6 for theummary statistics of these covariates).
.1. Main results
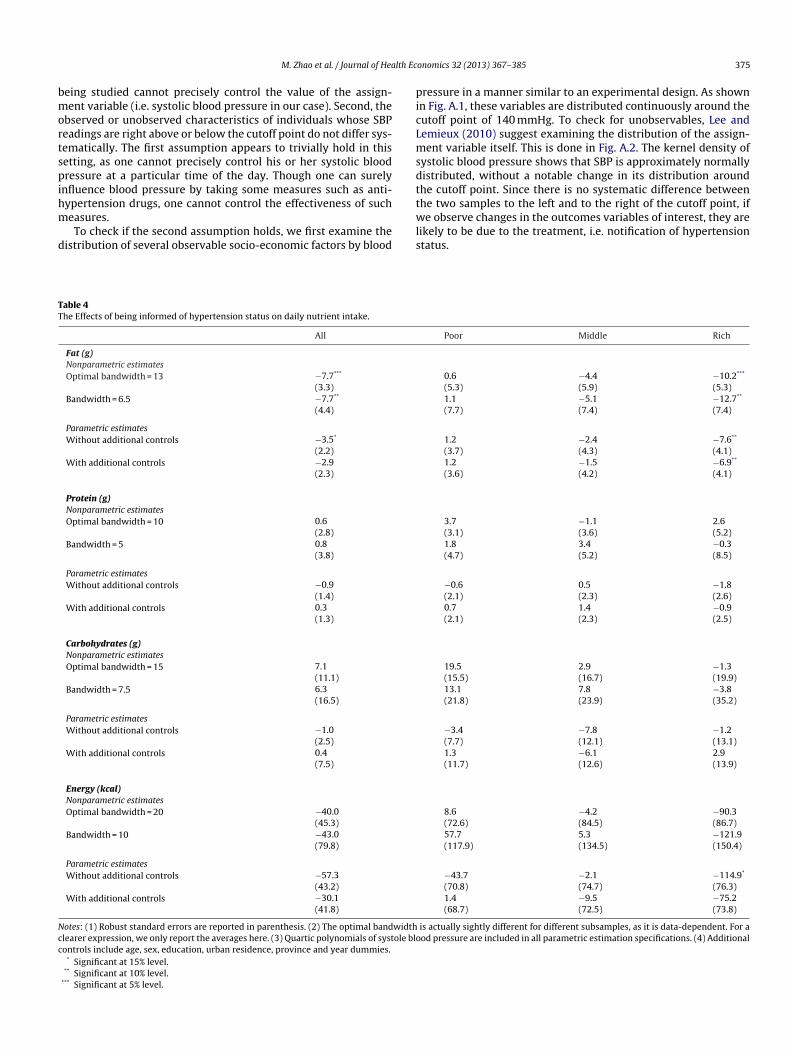
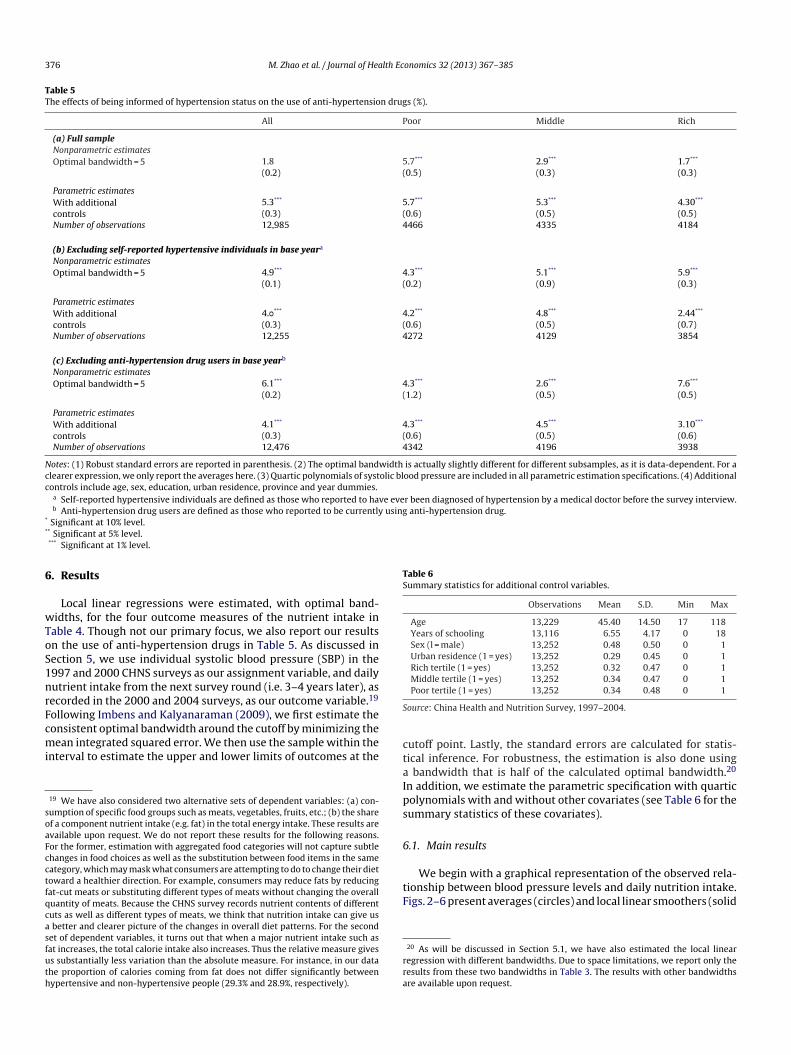
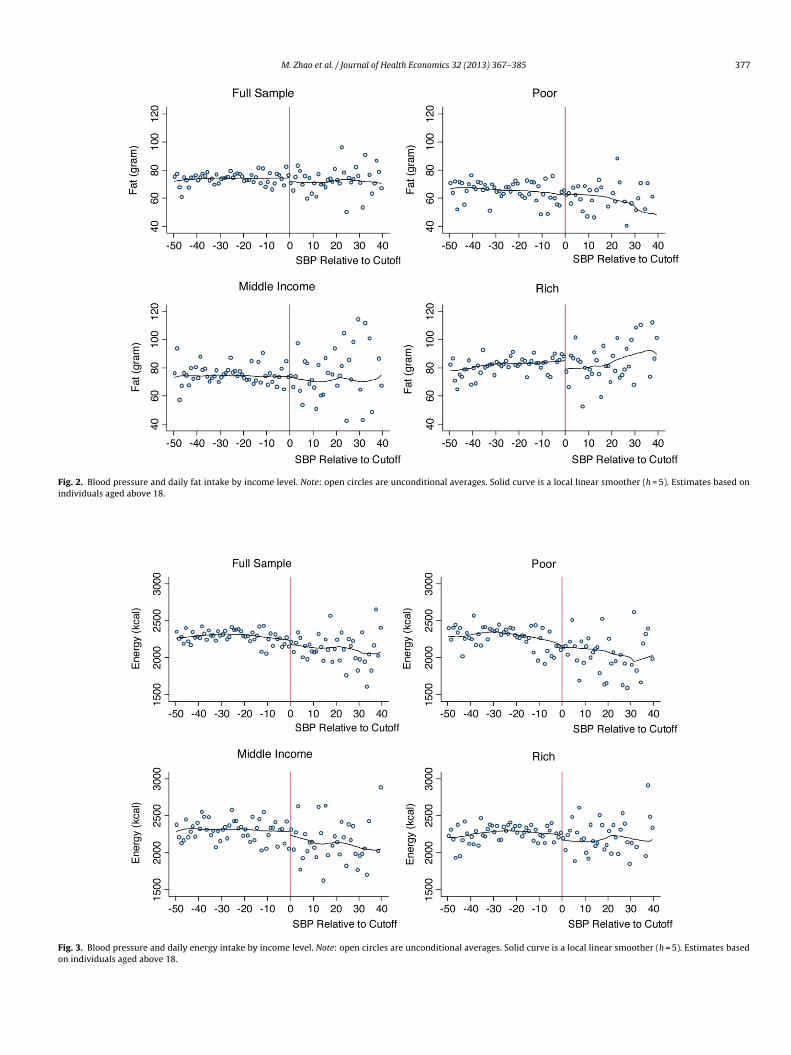
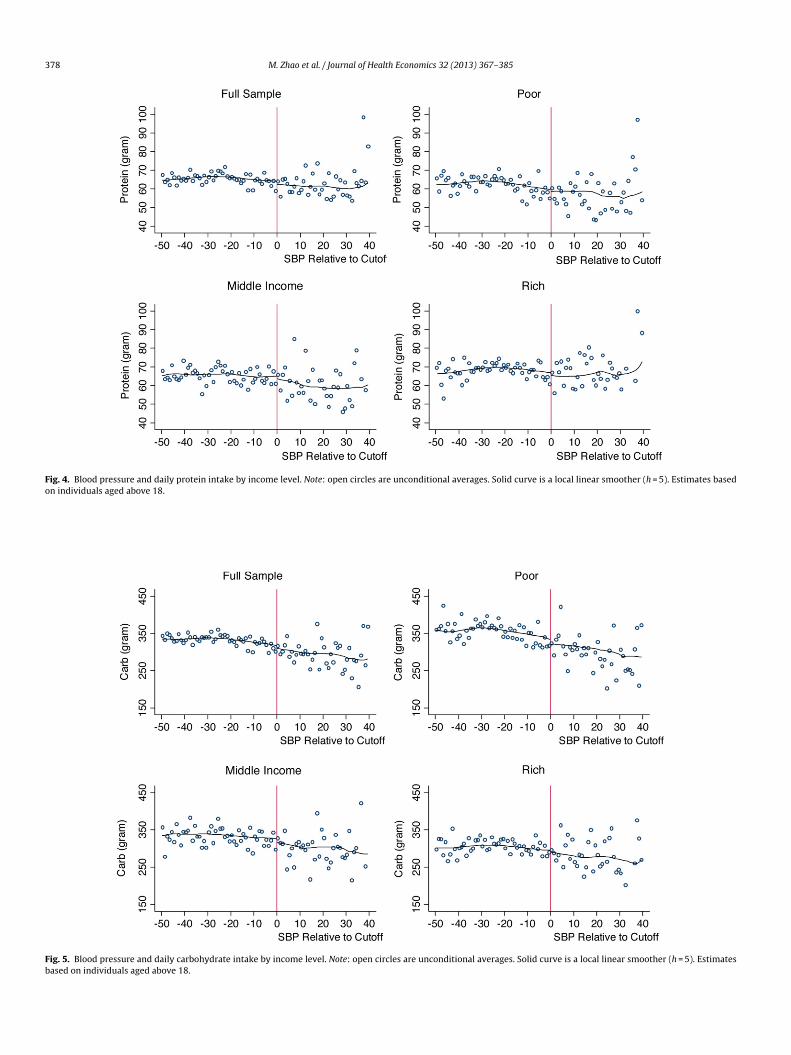
We begin with a graphical representation of the observed rela-ionship between blood pressure levels and daily nutrition intake.igs. 2–6 present averages (circles) and local linear smoothers (solid
20 As will be discussed in Section 5.1, we have also estimated the local linearegression with different bandwidths. Due to space limitations, we report only theesults from these two bandwidths in Table 3. The results with other bandwidthsre available upon request.
M. Zhao et al. / Journal of Health Economics 32 (2013) 367– 385 377
Fig. 2. Blood pressure and daily fat intake by income level. Note: open circles are unconditional averages. Solid curve is a local linear smoother (h = 5). Estimates based onindividuals aged above 18.
Fig. 3. Blood pressure and daily energy intake by income level. Note: open circles are unconditional averages. Solid curve is a local linear smoother (h = 5). Estimates basedon individuals aged above 18.
378 M. Zhao et al. / Journal of Health Economics 32 (2013) 367– 385
Fig. 4. Blood pressure and daily protein intake by income level. Note: open circles are unconditional averages. Solid curve is a local linear smoother (h = 5). Estimates basedon individuals aged above 18.
Fig. 5. Blood pressure and daily carbohydrate intake by income level. Note: open circles are unconditional averages. Solid curve is a local linear smoother (h = 5). Estimatesbased on individuals aged above 18.
M. Zhao et al. / Journal of Health Economics 32 (2013) 367– 385 379
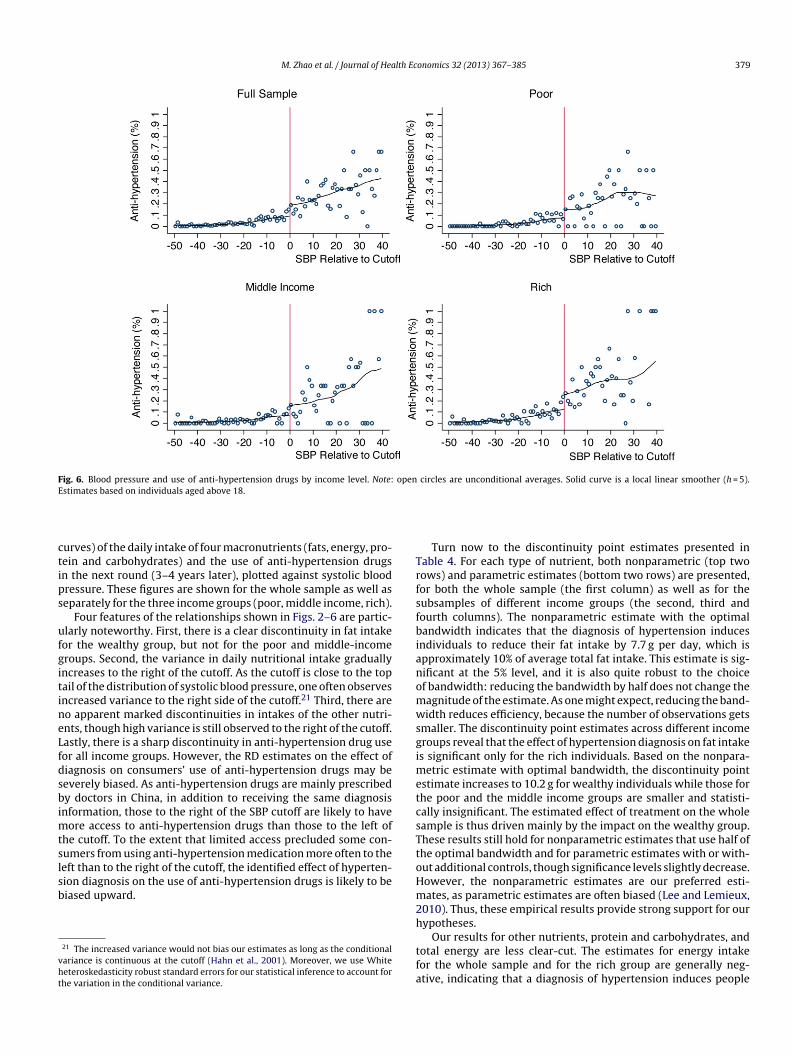
Fig. 6. Blood pressure and use of anti-hypertension drugs by income level. Note: open circles are unconditional averages. Solid curve is a local linear smoother (h = 5).E
ctips
ufgitineLfdsbimtslsb
vht
TrfsfbianomwsgimetcsTt
stimates based on individuals aged above 18.
urves) of the daily intake of four macronutrients (fats, energy, pro-ein and carbohydrates) and the use of anti-hypertension drugsn the next round (3–4 years later), plotted against systolic bloodressure. These figures are shown for the whole sample as well aseparately for the three income groups (poor, middle income, rich).
Four features of the relationships shown in Figs. 2–6 are partic-larly noteworthy. First, there is a clear discontinuity in fat intakeor the wealthy group, but not for the poor and middle-incomeroups. Second, the variance in daily nutritional intake graduallyncreases to the right of the cutoff. As the cutoff is close to the topail of the distribution of systolic blood pressure, one often observesncreased variance to the right side of the cutoff.21 Third, there areo apparent marked discontinuities in intakes of the other nutri-nts, though high variance is still observed to the right of the cutoff.astly, there is a sharp discontinuity in anti-hypertension drug useor all income groups. However, the RD estimates on the effect ofiagnosis on consumers’ use of anti-hypertension drugs may beeverely biased. As anti-hypertension drugs are mainly prescribedy doctors in China, in addition to receiving the same diagnosis
nformation, those to the right of the SBP cutoff are likely to haveore access to anti-hypertension drugs than those to the left of
he cutoff. To the extent that limited access precluded some con-umers from using anti-hypertension medication more often to the
eft than to the right of the cutoff, the identified effect of hyperten-ion diagnosis on the use of anti-hypertension drugs is likely to beiased upward.21 The increased variance would not bias our estimates as long as the conditionalariance is continuous at the cutoff (Hahn et al., 2001). Moreover, we use Whiteeteroskedasticity robust standard errors for our statistical inference to account forhe variation in the conditional variance.
oHm2h
tfa
Turn now to the discontinuity point estimates presented inable 4. For each type of nutrient, both nonparametric (top twoows) and parametric estimates (bottom two rows) are presented,or both the whole sample (the first column) as well as for theubsamples of different income groups (the second, third andourth columns). The nonparametric estimate with the optimalandwidth indicates that the diagnosis of hypertension induces
ndividuals to reduce their fat intake by 7.7 g per day, which ispproximately 10% of average total fat intake. This estimate is sig-ificant at the 5% level, and it is also quite robust to the choicef bandwidth: reducing the bandwidth by half does not change theagnitude of the estimate. As one might expect, reducing the band-idth reduces efficiency, because the number of observations gets
maller. The discontinuity point estimates across different incomeroups reveal that the effect of hypertension diagnosis on fat intakes significant only for the rich individuals. Based on the nonpara-
etric estimate with optimal bandwidth, the discontinuity pointstimate increases to 10.2 g for wealthy individuals while those forhe poor and the middle income groups are smaller and statisti-ally insignificant. The estimated effect of treatment on the wholeample is thus driven mainly by the impact on the wealthy group.hese results still hold for nonparametric estimates that use half ofhe optimal bandwidth and for parametric estimates with or with-ut additional controls, though significance levels slightly decrease.owever, the nonparametric estimates are our preferred esti-ates, as parametric estimates are often biased (Lee and Lemieux,
010). Thus, these empirical results provide strong support for ourypotheses.
Our results for other nutrients, protein and carbohydrates, andotal energy are less clear-cut. The estimates for energy intakeor the whole sample and for the rich group are generally neg-tive, indicating that a diagnosis of hypertension induces people
380 M. Zhao et al. / Journal of Health Economics 32 (2013) 367– 385
F unconi
ttcmteacstmarpHosi
amasempi
3baI
ascobe
sdhehtyotipnfstsb
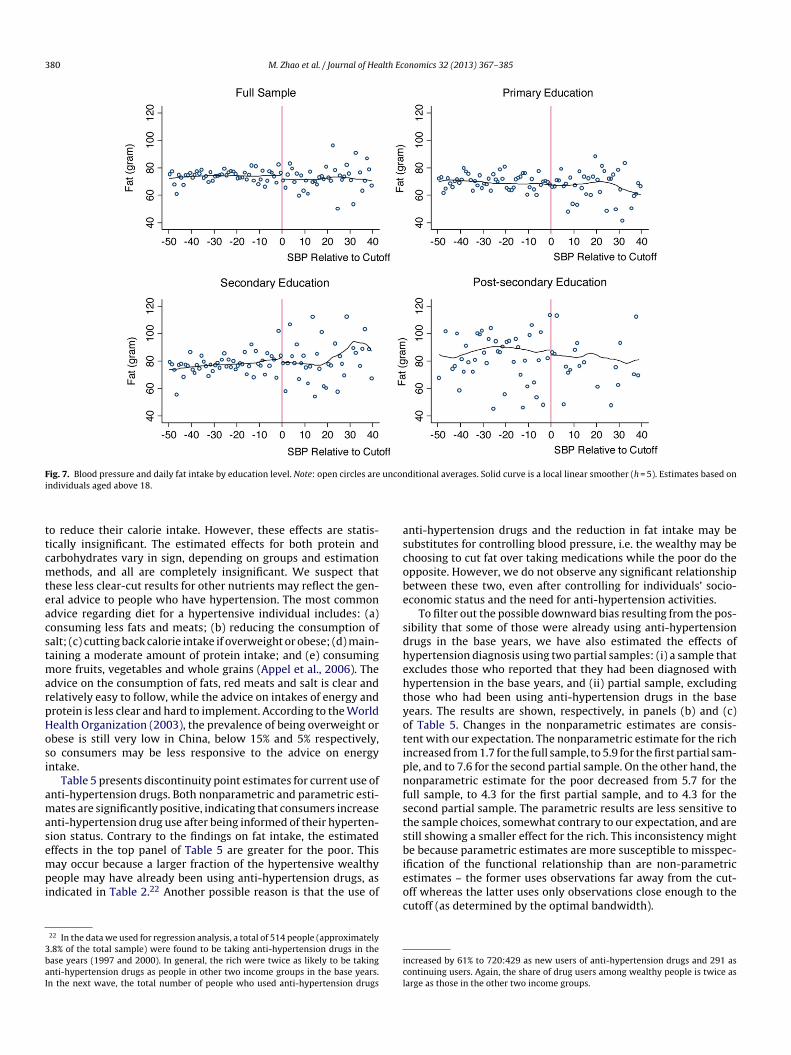
ig. 7. Blood pressure and daily fat intake by education level. Note: open circles arendividuals aged above 18.
o reduce their calorie intake. However, these effects are statis-ically insignificant. The estimated effects for both protein andarbohydrates vary in sign, depending on groups and estimationethods, and all are completely insignificant. We suspect that
hese less clear-cut results for other nutrients may reflect the gen-ral advice to people who have hypertension. The most commondvice regarding diet for a hypertensive individual includes: (a)onsuming less fats and meats; (b) reducing the consumption ofalt; (c) cutting back calorie intake if overweight or obese; (d) main-aining a moderate amount of protein intake; and (e) consuming
ore fruits, vegetables and whole grains (Appel et al., 2006). Thedvice on the consumption of fats, red meats and salt is clear andelatively easy to follow, while the advice on intakes of energy androtein is less clear and hard to implement. According to the Worldealth Organization (2003), the prevalence of being overweight orbese is still very low in China, below 15% and 5% respectively,o consumers may be less responsive to the advice on energyntake.
Table 5 presents discontinuity point estimates for current use ofnti-hypertension drugs. Both nonparametric and parametric esti-ates are significantly positive, indicating that consumers increase
nti-hypertension drug use after being informed of their hyperten-ion status. Contrary to the findings on fat intake, the estimatedffects in the top panel of Table 5 are greater for the poor. This
ay occur because a larger fraction of the hypertensive wealthyeople may have already been using anti-hypertension drugs, asndicated in Table 2.22 Another possible reason is that the use of
22 In the data we used for regression analysis, a total of 514 people (approximately.8% of the total sample) were found to be taking anti-hypertension drugs in thease years (1997 and 2000). In general, the rich were twice as likely to be takingnti-hypertension drugs as people in other two income groups in the base years.n the next wave, the total number of people who used anti-hypertension drugs
ieoc
icl
ditional averages. Solid curve is a local linear smoother (h = 5). Estimates based on
nti-hypertension drugs and the reduction in fat intake may beubstitutes for controlling blood pressure, i.e. the wealthy may behoosing to cut fat over taking medications while the poor do thepposite. However, we do not observe any significant relationshipetween these two, even after controlling for individuals’ socio-conomic status and the need for anti-hypertension activities.
To filter out the possible downward bias resulting from the pos-ibility that some of those were already using anti-hypertensionrugs in the base years, we have also estimated the effects ofypertension diagnosis using two partial samples: (i) a sample thatxcludes those who reported that they had been diagnosed withypertension in the base years, and (ii) partial sample, excludinghose who had been using anti-hypertension drugs in the baseears. The results are shown, respectively, in panels (b) and (c)f Table 5. Changes in the nonparametric estimates are consis-ent with our expectation. The nonparametric estimate for the richncreased from 1.7 for the full sample, to 5.9 for the first partial sam-le, and to 7.6 for the second partial sample. On the other hand, theonparametric estimate for the poor decreased from 5.7 for the
ull sample, to 4.3 for the first partial sample, and to 4.3 for theecond partial sample. The parametric results are less sensitive tohe sample choices, somewhat contrary to our expectation, and aretill showing a smaller effect for the rich. This inconsistency mighte because parametric estimates are more susceptible to misspec-
fication of the functional relationship than are non-parametricstimates – the former uses observations far away from the cut-
ff whereas the latter uses only observations close enough to theutoff (as determined by the optimal bandwidth).ncreased by 61% to 720:429 as new users of anti-hypertension drugs and 291 asontinuing users. Again, the share of drug users among wealthy people is twice asarge as those in the other two income groups.
M. Zhao et al. / Journal of Health Economics 32 (2013) 367– 385 381
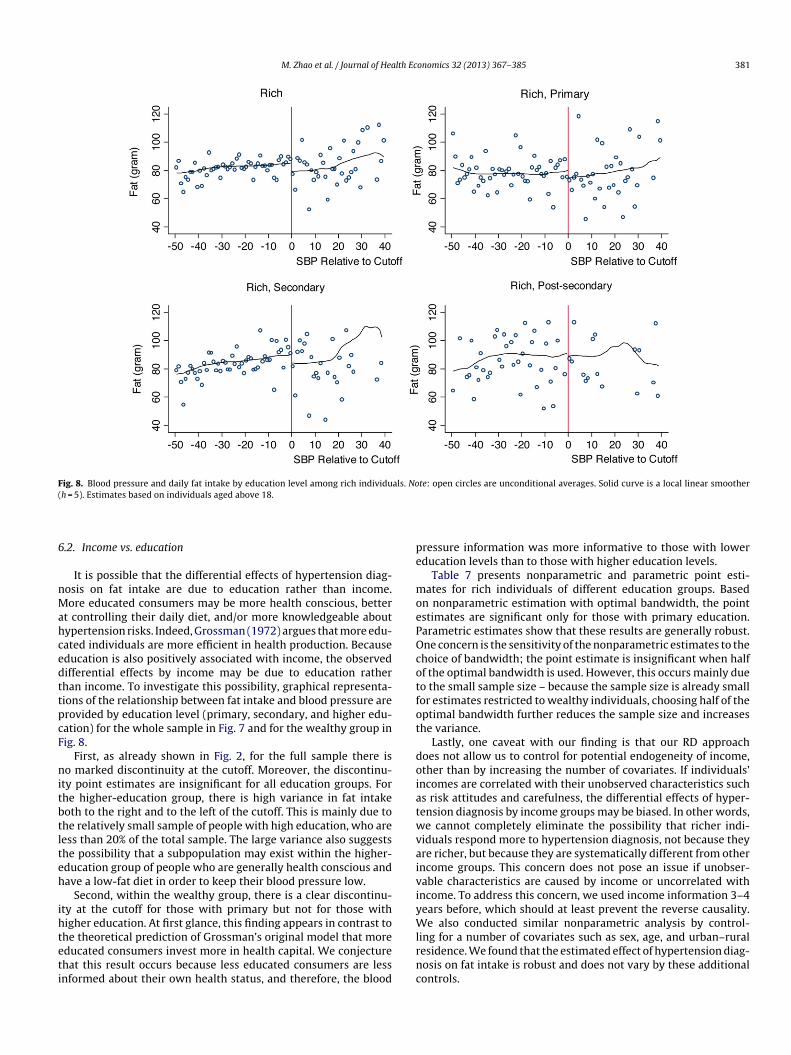
Fig. 8. Blood pressure and daily fat intake by education level among rich individuals. Note: open circles are unconditional averages. Solid curve is a local linear smoother(
6
nMahcedttpcF
nitbtlteh
ihteti
pe
moePOcotfot
doiatwvaiviyW
h = 5). Estimates based on individuals aged above 18.
.2. Income vs. education
It is possible that the differential effects of hypertension diag-osis on fat intake are due to education rather than income.ore educated consumers may be more health conscious, better
t controlling their daily diet, and/or more knowledgeable aboutypertension risks. Indeed, Grossman (1972) argues that more edu-ated individuals are more efficient in health production. Becauseducation is also positively associated with income, the observedifferential effects by income may be due to education ratherhan income. To investigate this possibility, graphical representa-ions of the relationship between fat intake and blood pressure arerovided by education level (primary, secondary, and higher edu-ation) for the whole sample in Fig. 7 and for the wealthy group inig. 8.
First, as already shown in Fig. 2, for the full sample there iso marked discontinuity at the cutoff. Moreover, the discontinu-
ty point estimates are insignificant for all education groups. Forhe higher-education group, there is high variance in fat intakeoth to the right and to the left of the cutoff. This is mainly due tohe relatively small sample of people with high education, who areess than 20% of the total sample. The large variance also suggestshe possibility that a subpopulation may exist within the higher-ducation group of people who are generally health conscious andave a low-fat diet in order to keep their blood pressure low.
Second, within the wealthy group, there is a clear discontinu-ty at the cutoff for those with primary but not for those withigher education. At first glance, this finding appears in contrast to
he theoretical prediction of Grossman’s original model that moreducated consumers invest more in health capital. We conjecturehat this result occurs because less educated consumers are lessnformed about their own health status, and therefore, the bloodlrnc
ressure information was more informative to those with lowerducation levels than to those with higher education levels.
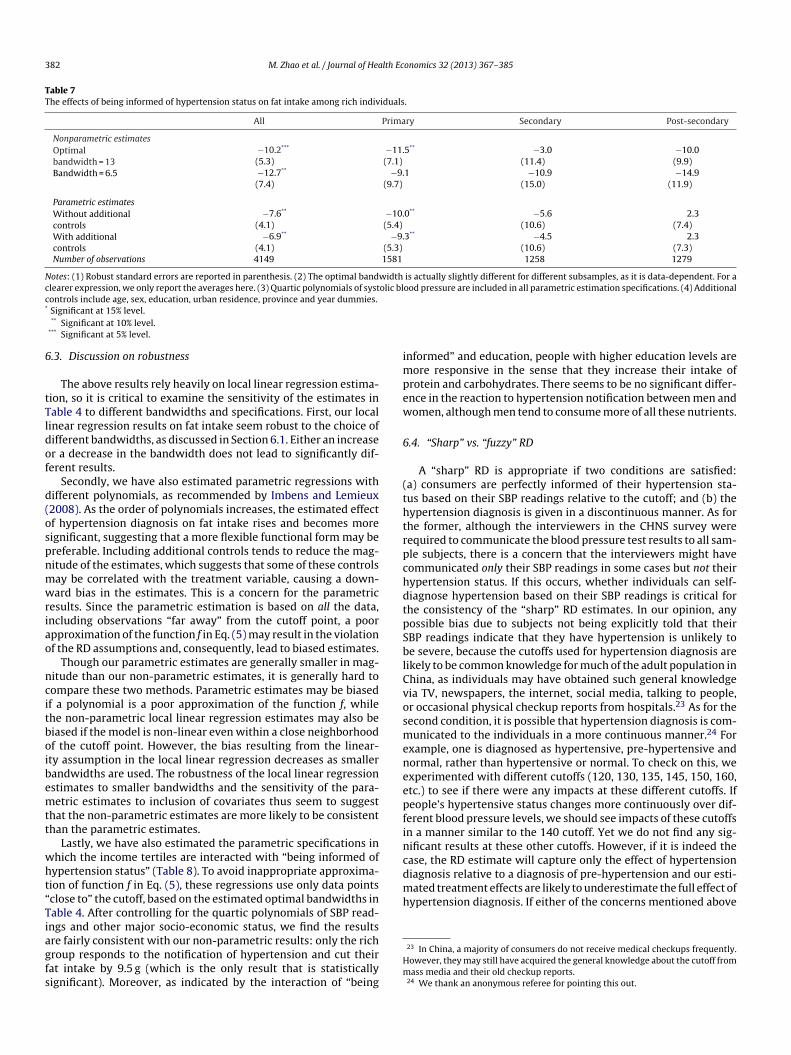
Table 7 presents nonparametric and parametric point esti-ates for rich individuals of different education groups. Based
n nonparametric estimation with optimal bandwidth, the pointstimates are significant only for those with primary education.arametric estimates show that these results are generally robust.ne concern is the sensitivity of the nonparametric estimates to thehoice of bandwidth; the point estimate is insignificant when halff the optimal bandwidth is used. However, this occurs mainly dueo the small sample size – because the sample size is already smallor estimates restricted to wealthy individuals, choosing half of theptimal bandwidth further reduces the sample size and increaseshe variance.
Lastly, one caveat with our finding is that our RD approachoes not allow us to control for potential endogeneity of income,ther than by increasing the number of covariates. If individuals’ncomes are correlated with their unobserved characteristics suchs risk attitudes and carefulness, the differential effects of hyper-ension diagnosis by income groups may be biased. In other words,e cannot completely eliminate the possibility that richer indi-
iduals respond more to hypertension diagnosis, not because theyre richer, but because they are systematically different from otherncome groups. This concern does not pose an issue if unobser-able characteristics are caused by income or uncorrelated withncome. To address this concern, we used income information 3–4ears before, which should at least prevent the reverse causality.e also conducted similar nonparametric analysis by control-
ing for a number of covariates such as sex, age, and urban–ruralesidence. We found that the estimated effect of hypertension diag-osis on fat intake is robust and does not vary by these additionalontrols.
382 M. Zhao et al. / Journal of Health Economics 32 (2013) 367– 385
Table 7The effects of being informed of hypertension status on fat intake among rich individuals.
All Primary Secondary Post-secondary
Nonparametric estimatesOptimalbandwidth = 13
−10.2*** −11.5** −3.0 −10.0(5.3) (7.1) (11.4) (9.9)
Bandwidth = 6.5 −12.7** −9.1 −10.9 −14.9(7.4) (9.7) (15.0) (11.9)
Parametric estimatesWithout additionalcontrols
−7.6** −10.0** −5.6 2.3(4.1) (5.4) (10.6) (7.4)
With additionalcontrols
−6.9** −9.3** −4.5 2.3(4.1) (5.3) (10.6) (7.3)
Number of observations 4149 1581 1258 1279
Notes: (1) Robust standard errors are reported in parenthesis. (2) The optimal bandwidth is actually slightly different for different subsamples, as it is data-dependent. For aclearer expression, we only report the averages here. (3) Quartic polynomials of systolic blood pressure are included in all parametric estimation specifications. (4) Additionalc*
6
tTldof
d(ospnmwriao
ncitboibemtt
wht“Tiagfs
impew
6
(thtrpchdtpSblCvosmeneepfincdiagnosis relative to a diagnosis of pre-hypertension and our esti-mated treatment effects are likely to underestimate the full effect ofhypertension diagnosis. If either of the concerns mentioned above
ontrols include age, sex, education, urban residence, province and year dummies.Significant at 15% level.** Significant at 10% level.
*** Significant at 5% level.
.3. Discussion on robustness
The above results rely heavily on local linear regression estima-ion, so it is critical to examine the sensitivity of the estimates inable 4 to different bandwidths and specifications. First, our localinear regression results on fat intake seem robust to the choice ofifferent bandwidths, as discussed in Section 6.1. Either an increaser a decrease in the bandwidth does not lead to significantly dif-erent results.
Secondly, we have also estimated parametric regressions withifferent polynomials, as recommended by Imbens and Lemieux2008). As the order of polynomials increases, the estimated effectf hypertension diagnosis on fat intake rises and becomes moreignificant, suggesting that a more flexible functional form may bereferable. Including additional controls tends to reduce the mag-itude of the estimates, which suggests that some of these controlsay be correlated with the treatment variable, causing a down-ard bias in the estimates. This is a concern for the parametric
esults. Since the parametric estimation is based on all the data,ncluding observations “far away” from the cutoff point, a poorpproximation of the function f in Eq. (5) may result in the violationf the RD assumptions and, consequently, lead to biased estimates.
Though our parametric estimates are generally smaller in mag-itude than our non-parametric estimates, it is generally hard toompare these two methods. Parametric estimates may be biasedf a polynomial is a poor approximation of the function f, whilehe non-parametric local linear regression estimates may also beiased if the model is non-linear even within a close neighborhoodf the cutoff point. However, the bias resulting from the linear-ty assumption in the local linear regression decreases as smallerandwidths are used. The robustness of the local linear regressionstimates to smaller bandwidths and the sensitivity of the para-etric estimates to inclusion of covariates thus seem to suggest
hat the non-parametric estimates are more likely to be consistenthan the parametric estimates.
Lastly, we have also estimated the parametric specifications inhich the income tertiles are interacted with “being informed ofypertension status” (Table 8). To avoid inappropriate approxima-ion of function f in Eq. (5), these regressions use only data pointsclose to” the cutoff, based on the estimated optimal bandwidths inable 4. After controlling for the quartic polynomials of SBP read-ngs and other major socio-economic status, we find the results
re fairly consistent with our non-parametric results: only the richroup responds to the notification of hypertension and cut theirat intake by 9.5 g (which is the only result that is statisticallyignificant). Moreover, as indicated by the interaction of “beingHm
nformed” and education, people with higher education levels areore responsive in the sense that they increase their intake of
rotein and carbohydrates. There seems to be no significant differ-nce in the reaction to hypertension notification between men andomen, although men tend to consume more of all these nutrients.
.4. “Sharp” vs. “fuzzy” RD
A “sharp” RD is appropriate if two conditions are satisfied:a) consumers are perfectly informed of their hypertension sta-us based on their SBP readings relative to the cutoff; and (b) theypertension diagnosis is given in a discontinuous manner. As forhe former, although the interviewers in the CHNS survey wereequired to communicate the blood pressure test results to all sam-le subjects, there is a concern that the interviewers might haveommunicated only their SBP readings in some cases but not theirypertension status. If this occurs, whether individuals can self-iagnose hypertension based on their SBP readings is critical forhe consistency of the “sharp” RD estimates. In our opinion, anyossible bias due to subjects not being explicitly told that theirBP readings indicate that they have hypertension is unlikely toe severe, because the cutoffs used for hypertension diagnosis are
ikely to be common knowledge for much of the adult population inhina, as individuals may have obtained such general knowledgeia TV, newspapers, the internet, social media, talking to people,r occasional physical checkup reports from hospitals.23 As for theecond condition, it is possible that hypertension diagnosis is com-unicated to the individuals in a more continuous manner.24 For
xample, one is diagnosed as hypertensive, pre-hypertensive andormal, rather than hypertensive or normal. To check on this, wexperimented with different cutoffs (120, 130, 135, 145, 150, 160,tc.) to see if there were any impacts at these different cutoffs. Ifeople’s hypertensive status changes more continuously over dif-erent blood pressure levels, we should see impacts of these cutoffsn a manner similar to the 140 cutoff. Yet we do not find any sig-ificant results at these other cutoffs. However, if it is indeed thease, the RD estimate will capture only the effect of hypertension
23 In China, a majority of consumers do not receive medical checkups frequently.owever, they may still have acquired the general knowledge about the cutoff fromass media and their old checkup reports.
24 We thank an anonymous referee for pointing this out.
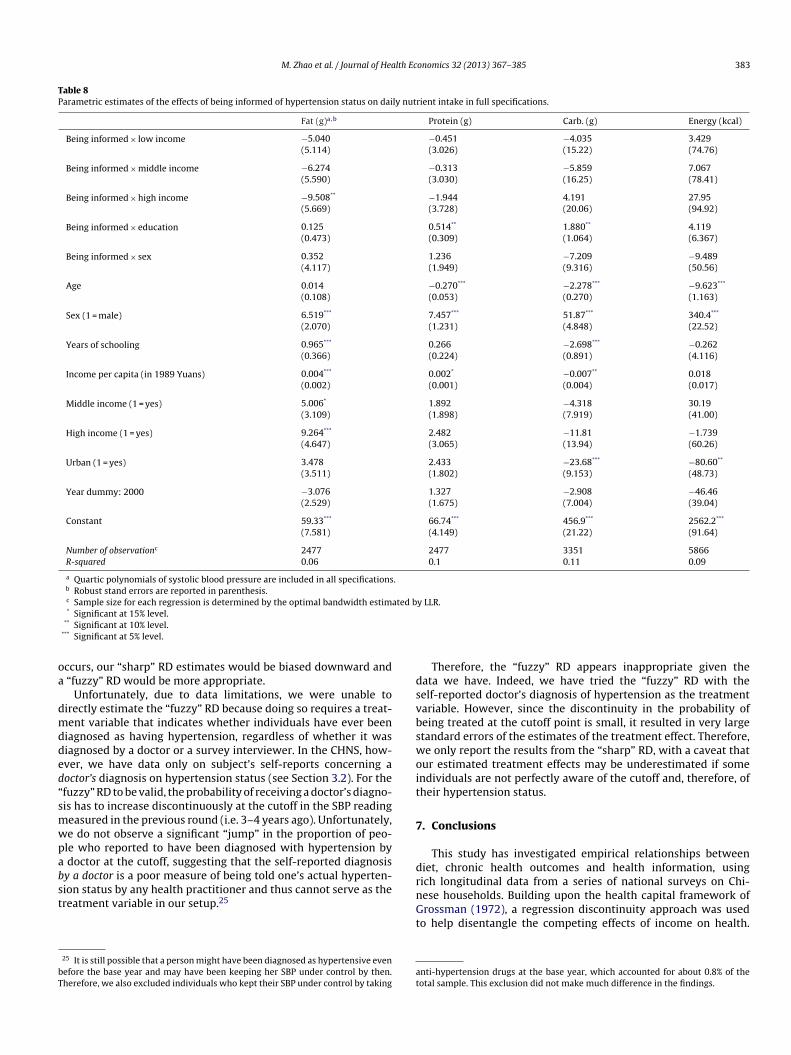
M. Zhao et al. / Journal of Health Economics 32 (2013) 367– 385 383
Table 8Parametric estimates of the effects of being informed of hypertension status on daily nutrient intake in full specifications.
Fat (g)a,b Protein (g) Carb. (g) Energy (kcal)
Being informed × low income −5.040 −0.451 −4.035 3.429(5.114) (3.026) (15.22) (74.76)
Being informed × middle income −6.274 −0.313 −5.859 7.067(5.590) (3.030) (16.25) (78.41)
Being informed × high income −9.508** −1.944 4.191 27.95(5.669) (3.728) (20.06) (94.92)
Being informed × education 0.125 0.514** 1.880** 4.119(0.473) (0.309) (1.064) (6.367)
Being informed × sex 0.352 1.236 −7.209 −9.489(4.117) (1.949) (9.316) (50.56)
Age 0.014 −0.270*** −2.278*** −9.623***
(0.108) (0.053) (0.270) (1.163)
Sex (1 = male) 6.519*** 7.457*** 51.87*** 340.4***
(2.070) (1.231) (4.848) (22.52)
Years of schooling 0.965*** 0.266 −2.698*** −0.262(0.366) (0.224) (0.891) (4.116)
Income per capita (in 1989 Yuans) 0.004*** 0.002* −0.007** 0.018(0.002) (0.001) (0.004) (0.017)
Middle income (1 = yes) 5.006* 1.892 −4.318 30.19(3.109) (1.898) (7.919) (41.00)
High income (1 = yes) 9.264*** 2.482 −11.81 −1.739(4.647) (3.065) (13.94) (60.26)
Urban (1 = yes) 3.478 2.433 −23.68*** −80.60**
(3.511) (1.802) (9.153) (48.73)
Year dummy: 2000 −3.076 1.327 −2.908 −46.46(2.529) (1.675) (7.004) (39.04)
Constant 59.33*** 66.74*** 456.9*** 2562.2***
(7.581) (4.149) (21.22) (91.64)
Number of observationc 2477 2477 3351 5866R-squared 0.06 0.1 0.11 0.09
a Quartic polynomials of systolic blood pressure are included in all specifications.b Robust stand errors are reported in parenthesis.c Sample size for each regression is determined by the optimal bandwidth estimated by LLR.
oa
dmdded“smwpabst
bT
dsvbswoit
7
d
* Significant at 15% level.** Significant at 10% level.
*** Significant at 5% level.
ccurs, our “sharp” RD estimates would be biased downward and “fuzzy” RD would be more appropriate.
Unfortunately, due to data limitations, we were unable toirectly estimate the “fuzzy” RD because doing so requires a treat-ent variable that indicates whether individuals have ever been
iagnosed as having hypertension, regardless of whether it wasiagnosed by a doctor or a survey interviewer. In the CHNS, how-ver, we have data only on subject’s self-reports concerning aoctor’s diagnosis on hypertension status (see Section 3.2). For thefuzzy” RD to be valid, the probability of receiving a doctor’s diagno-is has to increase discontinuously at the cutoff in the SBP readingeasured in the previous round (i.e. 3–4 years ago). Unfortunately,e do not observe a significant “jump” in the proportion of peo-le who reported to have been diagnosed with hypertension by
doctor at the cutoff, suggesting that the self-reported diagnosisy a doctor is a poor measure of being told one’s actual hyperten-
ion status by any health practitioner and thus cannot serve as thereatment variable in our setup.2525 It is still possible that a person might have been diagnosed as hypertensive evenefore the base year and may have been keeping her SBP under control by then.herefore, we also excluded individuals who kept their SBP under control by taking
rnGt
at
Therefore, the “fuzzy” RD appears inappropriate given theata we have. Indeed, we have tried the “fuzzy” RD with theelf-reported doctor’s diagnosis of hypertension as the treatmentariable. However, since the discontinuity in the probability ofeing treated at the cutoff point is small, it resulted in very largetandard errors of the estimates of the treatment effect. Therefore,e only report the results from the “sharp” RD, with a caveat that
ur estimated treatment effects may be underestimated if somendividuals are not perfectly aware of the cutoff and, therefore, ofheir hypertension status.
. Conclusions
This study has investigated empirical relationships betweeniet, chronic health outcomes and health information, using
ich longitudinal data from a series of national surveys on Chi-ese households. Building upon the health capital framework ofrossman (1972), a regression discontinuity approach was usedo help disentangle the competing effects of income on health.
nti-hypertension drugs at the base year, which accounted for about 0.8% of theotal sample. This exclusion did not make much difference in the findings.
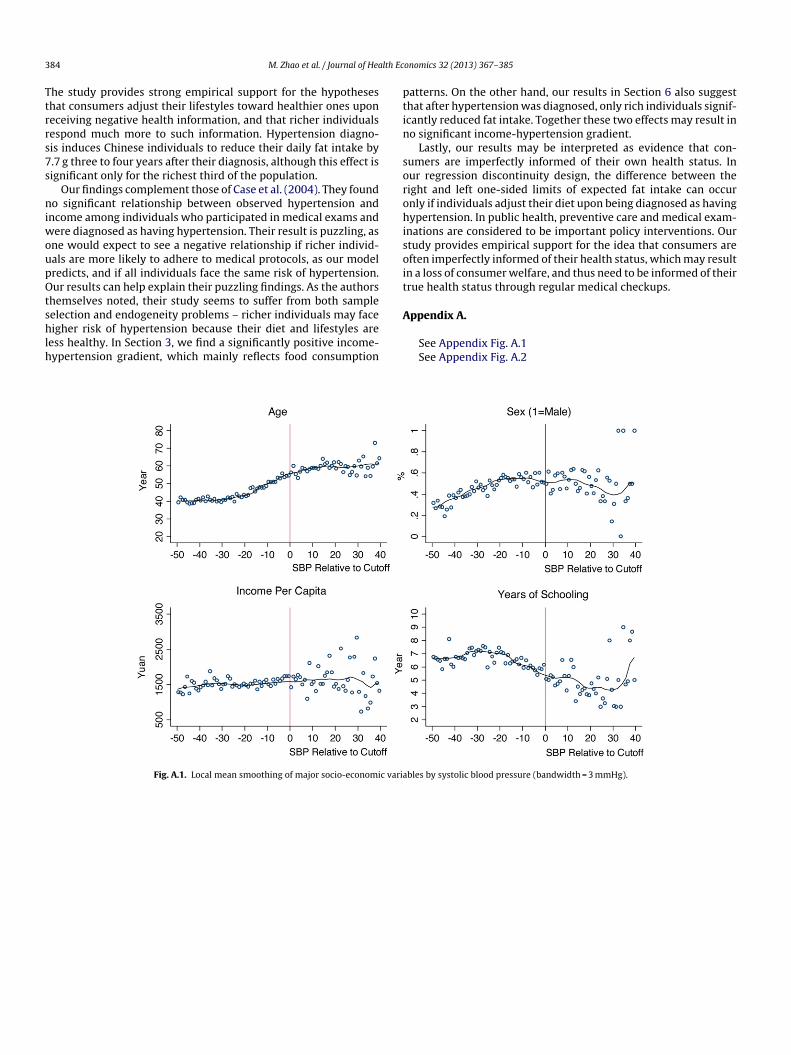
3 lth Ec
Ttrrs7s
niwoupOtshlh
ptin
sorohisoit
84 M. Zhao et al. / Journal of Hea
he study provides strong empirical support for the hypotheseshat consumers adjust their lifestyles toward healthier ones uponeceiving negative health information, and that richer individualsespond much more to such information. Hypertension diagno-is induces Chinese individuals to reduce their daily fat intake by.7 g three to four years after their diagnosis, although this effect isignificant only for the richest third of the population.
Our findings complement those of Case et al. (2004). They foundo significant relationship between observed hypertension and
ncome among individuals who participated in medical exams andere diagnosed as having hypertension. Their result is puzzling, as
ne would expect to see a negative relationship if richer individ-als are more likely to adhere to medical protocols, as our modelredicts, and if all individuals face the same risk of hypertension.ur results can help explain their puzzling findings. As the authors
hemselves noted, their study seems to suffer from both sample
election and endogeneity problems – richer individuals may faceigher risk of hypertension because their diet and lifestyles areess healthy. In Section 3, we find a significantly positive income-ypertension gradient, which mainly reflects food consumption
A
Fig. A.1. Local mean smoothing of major socio-economic varia
onomics 32 (2013) 367– 385
atterns. On the other hand, our results in Section 6 also suggesthat after hypertension was diagnosed, only rich individuals signif-cantly reduced fat intake. Together these two effects may result ino significant income-hypertension gradient.
Lastly, our results may be interpreted as evidence that con-umers are imperfectly informed of their own health status. Inur regression discontinuity design, the difference between theight and left one-sided limits of expected fat intake can occurnly if individuals adjust their diet upon being diagnosed as havingypertension. In public health, preventive care and medical exam-
nations are considered to be important policy interventions. Ourtudy provides empirical support for the idea that consumers areften imperfectly informed of their health status, which may resultn a loss of consumer welfare, and thus need to be informed of theirrue health status through regular medical checkups.
ppendix A.
See Appendix Fig. A.1See Appendix Fig. A.2
bles by systolic blood pressure (bandwidth = 3 mmHg).
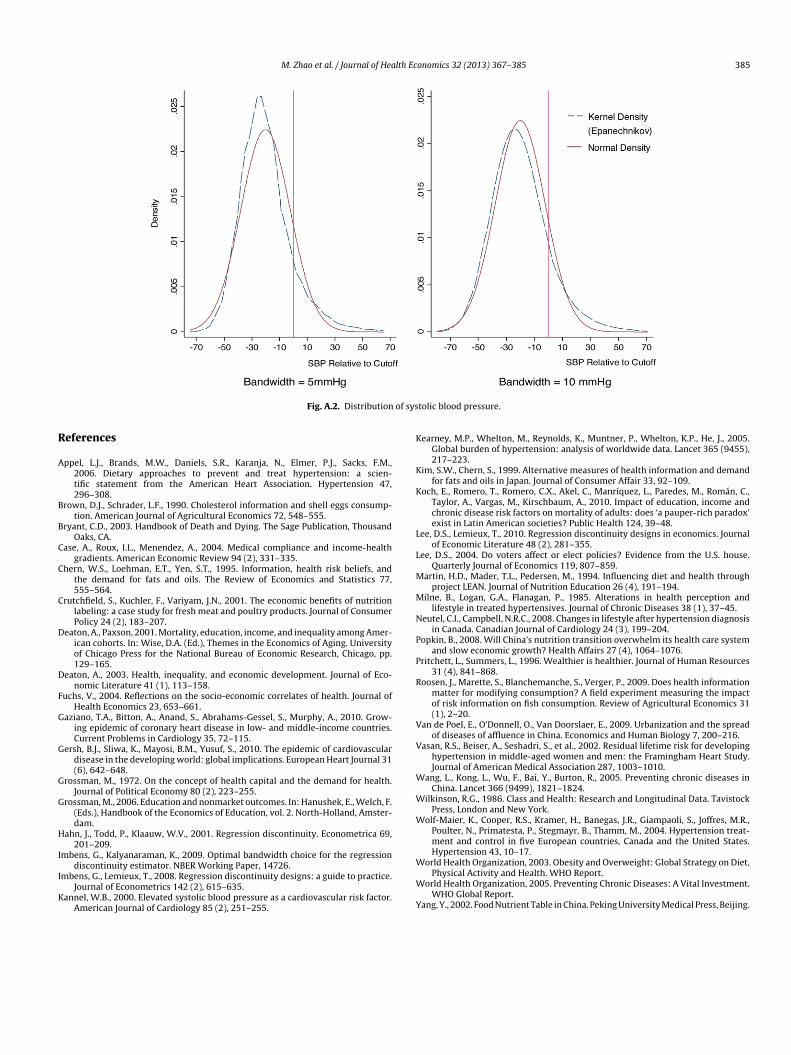
M. Zhao et al. / Journal of Health Economics 32 (2013) 367– 385 385
of sys
R
A
B
B
C
C
C
D
D
F
G
G
G
G
H
I
I
K
K
K
K
L
L
M
M
N
P
P
R
V
V
W
W
W
Fig. A.2. Distribution
eferences
ppel, L.J., Brands, M.W., Daniels, S.R., Karanja, N., Elmer, P.J., Sacks, F.M.,2006. Dietary approaches to prevent and treat hypertension: a scien-tific statement from the American Heart Association. Hypertension 47,296–308.
rown, D.J., Schrader, L.F., 1990. Cholesterol information and shell eggs consump-tion. American Journal of Agricultural Economics 72, 548–555.
ryant, C.D., 2003. Handbook of Death and Dying. The Sage Publication, ThousandOaks, CA.
ase, A., Roux, I.L., Menendez, A., 2004. Medical compliance and income-healthgradients. American Economic Review 94 (2), 331–335.
hern, W.S., Loehman, E.T., Yen, S.T., 1995. Information, health risk beliefs, andthe demand for fats and oils. The Review of Economics and Statistics 77,555–564.
rutchfield, S., Kuchler, F., Variyam, J.N., 2001. The economic benefits of nutritionlabeling: a case study for fresh meat and poultry products. Journal of ConsumerPolicy 24 (2), 183–207.
eaton, A., Paxson, 2001. Mortality, education, income, and inequality among Amer-ican cohorts. In: Wise, D.A. (Ed.), Themes in the Economics of Aging. Universityof Chicago Press for the National Bureau of Economic Research, Chicago, pp.129–165.
eaton, A., 2003. Health, inequality, and economic development. Journal of Eco-nomic Literature 41 (1), 113–158.
uchs, V., 2004. Reflections on the socio-economic correlates of health. Journal ofHealth Economics 23, 653–661.
aziano, T.A., Bitton, A., Anand, S., Abrahams-Gessel, S., Murphy, A., 2010. Grow-ing epidemic of coronary heart disease in low- and middle-income countries.Current Problems in Cardiology 35, 72–115.
ersh, B.J., Sliwa, K., Mayosi, B.M., Yusuf, S., 2010. The epidemic of cardiovasculardisease in the developing world: global implications. European Heart Journal 31(6), 642–648.
rossman, M., 1972. On the concept of health capital and the demand for health.Journal of Political Economy 80 (2), 223–255.
rossman, M., 2006. Education and nonmarket outcomes. In: Hanushek, E., Welch, F.(Eds.), Handbook of the Economics of Education, vol. 2. North-Holland, Amster-dam.
ahn, J., Todd, P., Klaauw, W.V., 2001. Regression discontinuity. Econometrica 69,201–209.
mbens, G., Kalyanaraman, K., 2009. Optimal bandwidth choice for the regression
discontinuity estimator. NBER Working Paper, 14726.mbens, G., Lemieux, T., 2008. Regression discontinuity designs: a guide to practice.Journal of Econometrics 142 (2), 615–635.
annel, W.B., 2000. Elevated systolic blood pressure as a cardiovascular risk factor.American Journal of Cardiology 85 (2), 251–255.
W
W
Y
tolic blood pressure.
earney, M.P., Whelton, M., Reynolds, K., Muntner, P., Whelton, K.P., He, J., 2005.Global burden of hypertension: analysis of worldwide data. Lancet 365 (9455),217–223.
im, S.W., Chern, S., 1999. Alternative measures of health information and demandfor fats and oils in Japan. Journal of Consumer Affair 33, 92–109.
och, E., Romero, T., Romero, C.X., Akel, C., Manríquez, L., Paredes, M., Román, C.,Taylor, A., Vargas, M., Kirschbaum, A., 2010. Impact of education, income andchronic disease risk factors on mortality of adults: does ‘a pauper-rich paradox’exist in Latin American societies? Public Health 124, 39–48.
ee, D.S., Lemieux, T., 2010. Regression discontinuity designs in economics. Journalof Economic Literature 48 (2), 281–355.
ee, D.S., 2004. Do voters affect or elect policies? Evidence from the U.S. house.Quarterly Journal of Economics 119, 807–859.
artin, H.D., Mader, T.L., Pedersen, M., 1994. Influencing diet and health throughproject LEAN. Journal of Nutrition Education 26 (4), 191–194.
ilne, B., Logan, G.A., Flanagan, P., 1985. Alterations in health perception andlifestyle in treated hypertensives. Journal of Chronic Diseases 38 (1), 37–45.
eutel, C.I., Campbell, N.R.C., 2008. Changes in lifestyle after hypertension diagnosisin Canada. Canadian Journal of Cardiology 24 (3), 199–204.
opkin, B., 2008. Will China’s nutrition transition overwhelm its health care systemand slow economic growth? Health Affairs 27 (4), 1064–1076.
ritchett, L., Summers, L., 1996. Wealthier is healthier. Journal of Human Resources31 (4), 841–868.
oosen, J., Marette, S., Blanchemanche, S., Verger, P., 2009. Does health informationmatter for modifying consumption? A field experiment measuring the impactof risk information on fish consumption. Review of Agricultural Economics 31(1), 2–20.
an de Poel, E., O’Donnell, O., Van Doorslaer, E., 2009. Urbanization and the spreadof diseases of affluence in China. Economics and Human Biology 7, 200–216.
asan, R.S., Beiser, A., Seshadri, S., et al., 2002. Residual lifetime risk for developinghypertension in middle-aged women and men: the Framingham Heart Study.Journal of American Medical Association 287, 1003–1010.
ang, L., Kong, L., Wu, F., Bai, Y., Burton, R., 2005. Preventing chronic diseases inChina. Lancet 366 (9499), 1821–1824.
ilkinson, R.G., 1986. Class and Health: Research and Longitudinal Data. TavistockPress, London and New York.
olf-Maier, K., Cooper, R.S., Kramer, H., Banegas, J.R., Giampaoli, S., Joffres, M.R.,Poulter, N., Primatesta, P., Stegmayr, B., Thamm, M., 2004. Hypertension treat-ment and control in five European countries, Canada and the United States.Hypertension 43, 10–17.
orld Health Organization, 2003. Obesity and Overweight: Global Strategy on Diet,Physical Activity and Health. WHO Report.
orld Health Organization, 2005. Preventing Chronic Diseases: A Vital Investment.WHO Global Report.
ang, Y., 2002. Food Nutrient Table in China. Peking University Medical Press, Beijing.