does energy consumption contribute to economic performance ... · does energy consumption...
TRANSCRIPT

EAST-WEST Journal of ECONOMICS AND BUSINESS
43
Journal of Economics and Business
Vol. XII – 2009, No 2
DOES ENERGY CONSUMPTION CONTRIBUTE TO ECONOMIC
PERFORMANCE? EMPIRICAL EVIDENCE FROM NIGERIA
Gbadebo, Olusegun ODULARU REGIONAL POLICIES & MARKETS NSF, FARA Chinedu Okonkwo CENTRAL BANK OF NIGERIA ABSTRACT This study investigates the relationship between energy consumption and the Nigerian economy from the period of 1970 to 2005. The energy sources used to test for this relationship were crude oil, electricity and coal. By applying the co-integration technique, the results derived infer that there exists a positive relationship between current period energy consumption and economic growth. With the exception of coal which was positive, a negative relationship was noted for lagged values of energy consumption and economic growth. The implication of the study is that increased energy consumption is a strong determinant of economic growth having an implicit effect in lagged periods and both an implicit and explicit effect on the present period in Nigeria. Thus, it is pertinent that this sector should be given more relevance even by exploiting the opportunities laden in the sector to increase economic growth. Keywords: Energy consumption, Economic performance, Nigeria, JEL Classification: Q3, Q4

EAST-WEST Journal of ECONOMICS AND BUSINESS
44
Introduction World economies are heavily reliant on energy and Nigeria is not an exception. As Shehiel Alam (2006) puts it, “energy is the indispensable force driving all economic activities.” In other words, the greater the energy consumption, the more the economic activity in the nation and as a result a greater economy emerges. Today, Nigeria is seen as one of the greatest developing nations in Africa with highly endowed natural resources including potential energy resources. However, increasing access to energy in Nigeria has proved to be not only a continuous challenge but also a pressing issue with the international community. Economic growth is a prerequisite for a nation to move from a third world country to a developed country. For a developing country like Nigeria, the greater the economic growth, the better its chances to become more developed. With adequate utilization of energy potentials to meet the demand, the nation would experience high levels of economic growth. Energy efficiency does not just connote a reduction in utility cost but it involves increasing revenue through greater productivity. Ovieniuwo (2006) agrees that “energy efficiency is the indispensable component of any effort to improve productivity” and of course contribute to economic wealth. Majority of Nigerian are dependent on fossil fuel and fuel wood (firewood). The over dependence on fossils and fuel wood (used mainly by poor rural commuters) have not yielded enough capacity to meet increasing demands. The objectives of this study will be the following:-
1. To establish a relationship between energy consumption and the Nigerian economy.
2. To discuss the main sources of energy in Nigeria and how they contribute to economic growth.
3. To make policy recommendations based on the analysis from the study. The co-integration econometric technique would be employed as the regression analysis to show the impact of energy consumption in the Nigerian economy. The period under this study would start from 1970 and end at 2005. The dependent variable would be real GDP while the independent variables would be electricity consumption, crude oil consumption and coal consumption.

EAST-WEST Journal of ECONOMICS AND BUSINESS
45
Study Background The significance that the country has placed on crude oil is relatively very high. The over reliance of crude oil in Nigeria is a major challenge because it has failed to diversify its energy consumption and ensure an appropriate energy mix. The consumption for oil is high practically because there is no alternative to it. This paper remains very silent on petroleum energy because this energy is well exploited in Nigeria. Fossil fuels like coal are insignificantly mined in the country. The coal located in eastern Nigeria is sub-bituminous which means that it burns slowly and gives out a lot of heat. Subsequently, it is also low in sulphur and ash content. Coal is the oldest commercial fuel used in Nigeria in 1916. Since oil was discovered in Nigeria, coal was given less relevance and became highly dormant. With a reserve of over 2 billion metric tonnes, Nigeria produces about 200000 to 600000 tonnes yearly. Per capita power consumption in Nigeria is estimated at 82KW where as other African counterparts like South Africa has a per capita consumption of 3793KW. Not withstanding, with vast potentials, energy can be adequately supplied in the country if well tapped. If consumption is positively related to economic growth, the benefits of increased consumption includes generating more income, boosting economic activities which will boost economic growth and increased development especially poverty reduction. Petroleum Energy Crude oil is the dominant source of commercial energy use, accounting for over 70% of national commercial energy consumption, of this, the transport sector accounts for about 70% of commercial energy consumption. In Nigeria, crude oil has been a major economic growth determinant. For the past three decades it has claimed the topmost position in the export list of the country (National Bureau of statistics, 2006). Presently, there are eleven huge Oil producing and exporting companies in the country. The share of oil in total exports is over 90%. Nigeria was one time the 6th largest oil producing country in the world but today it is presently 8th due to the unrest in the Niger Delta region of Nigeria which is under intense militant crises. Oil is Nigeria’s major sources of revenue used for development. As at January 2005, Nigerian’s proven crude oil reserve stood at 35.2 billion barrels. The Nigerian government plans to expand its proven reserve to 40 billion barrels by 2010. The majority of reserves are found along the country’s coastal Niger Delta. Due to the Niger Delta crises, the oil producing companies are producing below
EAST-WEST Journal of ECONOMICS AND BUSINESS
46
capacity. However, as a member of the Organization of Petroleum Exporting Countries (OPEC), Nigerian oil attracts very huge buyers in the international market. The major reason for this is because Nigerian oil is of high quality and most environmental friendly relative to oil from other countries. Nigeria’s export blends are light, sweet crudes and have low sulphur contents of 0.05 – 0.2 percent. The local consumption of oil in the country is low. With only 3 of 4 refineries at work in Nigeria there is inadequate capacity to meet the increasing demands for petroleum products. Nigeria’s four refineries have a total capacity of 445,000 barrels of oil per day but these refineries are currently unable to meet domestic demand of 300,000 barrels of oil per day. This is as a result of inadequate maintenance and a general declining technical inefficiency causing incessant shortages, hoarding and long queues at petrol filling stations. The effect of oil as an energy source is glaring and is majorly felt in the Economic accounts. For this paper, less emphasis is placed on oil as an energy resource which contributes to economic growth not because it is the least significant but because its emphasis on the country has been adequately awarded recognition especially in the international scene. In the Nigerian case, infrastructure must be put up to increase supply and consequentially domestic consumption which will not only bring in revenue to the government but will also increase economic and social activities in the country. Coal Energy The Energy Information Association (EIA) (2007) is of the view that Coal is not part of the country’s energy consumption mix. Nigeria is heavily endowed with 22 mines of coal resources which have a total proven capacity of 2 billion tonnes. Coal was the first energy resource to be exploited in Nigeria. It then immediately became the power of the country but its relevance began to drop immediately after oil was discovered. The level of significance attributed to coal by the nation began to drop very quickly and today it is insignificantly used as an energy resource. In many countries which use coal as an energy resource, increased coal consumption reflects the increasing output of industry, transportation, and even agriculture. Coal resources are mainly located in Anambra State and it is sub bituminous with low sulphur and ash content. This makes it attractive to African countries like Ghana; Egypt as well as European countries which have began to show interest in Nigerian Coal. Underground and surface coal production potential is

EAST-WEST Journal of ECONOMICS AND BUSINESS
47
reported to be 200,000 to 600,000 tonnes per year and 400,000 to 800,000 tonnes per year, respectively (World Bank, 1983). This potential still exists but the resource is not tapped. Natural Gas Energy Nigeria has abundant reserve of natural gas. In energy terms, the quantity of natural gas is at least twice as much as the oil, and the horizon for the availability of natural gas is definitely longer than that of oil. The known reserves of natural gas have been estimated at about 2.4 x 10
12 cubic meter and are expected to last
for more than a century as a domestic fuel and a major export. Nigeria has the largest natural gas reserves in Africa and is among the top ten in the world. However, due to a lack of utilization infrastructure, Nigeria still flares about 40% of the natural gas it produces, accounts for about 20 percent of all gas flared worldwide. In Nigeria, 75% of the associated gas was burnt off i.e. flared. This wastage was due to the inadequate infrastructure and the remedy is therefore to build suitable infrastructure to reduce this wastage which could have been used to boost supply and increase receipt from sellers of this energy product. Natural gas can be also converted into liquid state known as the Liquefied Natural Gas (LNG). This is a natural gas product whose market is also constantly increasing. Natural Gas has been affirmed to be the fastest growing source of primary energy according to EIA (2004). Electricity Only 40% of Nigerians have access to electricity (Energy Information Administration, 2007). However, majority of the electricity is supplied to the urban areas. According to the encyclopaedia on energy (2006), energy is a vital ingredient to economic growth and that this has been discovered for as long as economic data has been compiled. For just over 120 years now, electricity has been a thing generated to power human technologies. To do this, various sources of energies could be used. Electricity can be generated in diverse ways. The most common of these methods include:
• Rotating Turbines attached to electrical generators. These turbines are driven by fluids (steam, water etc), hot gasses and wind which give the turbine propellers the rotating effect.

EAST-WEST Journal of ECONOMICS AND BUSINESS
48
• Burning of Diesel, Biogas or Natural gas reciprocating engines to produce electricity
• Photovoltaic panels. This converts sunlight directly to electricity. According to Krizanic, F (2007), one importance of power supply is the fact that is has become equally indispensable as food supply. Food is a necessity for the survival of all life forms in the world. In this same likeness, energy is also a necessary condition for an economy to thrive. In other words, what Krizanic is saying is that what food is to a hungry man, energy is to economic growth of a nation. In both situations, consumption will increase productivity and therefore growth is achieved. Current Electricity Situation in Nigeria Just like in India, the electricity sector in Nigeria is presently characterized by chronic power shortages and poor power quality supply. With an approximated installed capacity of 6000MW (EPIC, 2004), it was stated that the country consumes about half its capacity. With an increased population coupled with diversification of economic activities, energy demand is rising but yet, electricity supply is relatively stagnant. It is therefore obvious that electricity demand is way above its supply thereby showing signs of potential economic growth. The inefficiency as well as inadequate facilities to boost electricity supply has also been a major cause of the increasing gap between demand and supply of electricity. This could be due to the fact that there are only 9 working generating stations in Nigeria (3 hydro and 6 thermal). Out of the approximated 6000MW of installed capacity in Nigeria, not more than 4500MW is ever produced. This is due to poor maintenance, fluctuation in water levels powering the hydro plants and the loss of electricity in transmission. It could be also due to the 80MW export of electricity each to the republic of Niger and Benin. “Apart from serving as a pillar of wealth creation in Nigeria, electricity is also the nucleus of operations and subsequently the engine of growth for all sector of the economy” (Sesan Ayodele, 2004). He has indirectly re-echoed the electricity consumption is positively related to economic growth and that the former is a cause factor of the latter. This means that electricity consumption have diverse impact in a range of socio economic activities and consequentially the living standards of Nigerians. The essence of electricity in a nation is one so pertinent that generating sets is owned by most Nigerians. In august 2000, 2400MW of electricity was being generated by diesel and petrol generating set (EPIC, 2004). This shows that

EAST-WEST Journal of ECONOMICS AND BUSINESS
49
electricity is not only important for fuelling economic activities and growth but it is also necessary for the attainment of sustained comfort. Uses of Electricity are very numerous and increase economic activities in a country. However, in a developing economy like Nigeria where electricity is in short supply, rational use of energy has been professed as a measure to enhance consumption of electricity. Engineers and scientists have also advocated the potential rational energy use depending on scientific knowledge and technology. This will aid energy conservation and sustainability. (Jochem E, 2004). Towards this end, the long term technical potential for rational use of energy could be driven by various efforts. Among these efforts, increasing energy efficiency is paramount. The problems of electricity sub-sector in Nigeria The incapacity for electricity sub sector to efficiently meet demand for electricity has been caused by a number of problems which have been detrimental to economic growth. The Central Bank of Nigeria (2000) has identified eight (9) problems associated with NEPA (now Power Holding Company of Nigeria (PHCN)) and they include:
1. Lack of preventive and routine maintenance of National Electric Power Authority’s (NEPA’s) facilities which results in huge energy losses.
2. Frequent major breakdowns, arising from the use of out-dated and heavily overloaded equipments.
3. Lack of co-ordination between town planning authority and NEPA, resulting in poor overall power system planning and over-loading of NEPA equipments.
4. Inadequate generation due to operational/technical problems arising from machine breakdown, low gas pressure and low water levels.
5. Poor funding of the organization. 6. Inadequate budgetary provision and undue delay in release of funds to
NEPA. 7. NEPA’s inefficient billing and collection system 8. High indebtedness to NEPA by both public and private consumers who
are reluctant to pay for electricity consumed as and when due. 9. Vandalization and pilfering of NEPA equipments.

EAST-WEST Journal of ECONOMICS AND BUSINESS
50
Brief Review of Literature, Theoretical Link and Model Specification The demand for energy leads to economic growth. It is true that consumption is derived from demand. That is, whatever is consumed must have been demanded. Birol, F (2007) argues that demand for energy has surged and in that respect, the unrelenting increase has helped fuelled global economic growth. Yu and Choi (1985) carried out a research on the Philippines and found that there is a positive relationship between energy consumption and economic growth. They went further to define that relationship as a unidirectional one where economic growth served as the dependent variable and energy consumption was the independent variable. Asafu-Adjaye (2000) carried out the same research on Singapore and Indonesia respectively and found out the same unidirectional causality effect of Energy consumption and Economic growth. There are other economic findings which are contrary to the Energy – GDP causality relationship. Yu and Choi (1985) carried out a verification study on the causality relationship between energy consumption and economic growth and found out that the causality ran in an opposite direction, from economic growth to energy consumption. The Relationship between Electricity Consumption and Economic Growth The positive relationship between electricity and economic growth has been justified by some Authors as being consistent. Many economists agree that there is a strong correlation between electricity use and economic development. Morimoto R and Hope C (2001) have discovered, using Pearson correlation coefficient, that economic growth and energy consumption in Sri Lanka are highly correlated. Paul Breshin (2004) said that electricity is vital for driving growth in the energy, manufacturing and social sector. He went further to say that a parallel (positive) growth trend existed between electricity demand and gross domestic product (GDP). According to Simpson E. S (1969), “it is electricity rather than Steam engine, which is driving the developing industries in modern Africa”. By implication, He re-emphasizes the fact that electricity drives economic growth. Ageel, A and Mohammad, S.B (2001) ran a cointegration on energy and its relationship with economic growth in Pakistan, a developing nation like Nigeria and found that increase in electricity consumption leads to economic growth. Sanchis, M.T (2007) stated that “electricity as an industry is responsible for a

EAST-WEST Journal of ECONOMICS AND BUSINESS
51
great deal of output”. She went on to say that electricity had effects not only on factors of production but also on the impact it had on capital accumulation. Alam M.S (2006) agrees that there is a departure from neoclassical economics which include only capital, labour and technology as factors of production to one which now includes energy as a factor of production. He went further to say that energy drives the work that converts raw materials into finished products in the manufacturing process. Sanchis, M.T (2007) added that increase in the electricity production will avoid the paralysation of the industrial production. Increased industrial production will eventually increase output. Thus, this implies that electricity production should become an economic policy high-priority objective which should be urgently responded to. Energy efficiency is also called ‘efficient energy use’. It is not just about reducing utility bills of energy. It also involves boosting revenue through greater productivity. Energy efficiency is an indispensable component of any effort to improve electricity productivity. Ultimately, energy efficiency contributes to wealth. Oviemuno A O (2006). Energy efficiency provides another option for meeting air quality goals in that combustion volumes are reduced proportionately with fossil fuel consumption. Energy Efficiency refers to the improvement of products and practices that result in a reduction in the amount of energy necessary to provide energy services such as lighting, cooking, heating, cooling, transportation and manufacturing (kinika Amaewhule, 2000). Classical economists did not recognize energy as a factor of production in the production process and neither did the Neoclassicals. Today, economists like Alam, M.S (2006) found out in his work on ‘Economic Growth with Energy’ that not only does energy serve as a factor of production; it also acts as a booster to growth of a nation. Theoretical Framework Before the growth theory proposed by Romar, there were other growth theories which thrived. Solow growth theory was one of such theories which was then in vogue. The Solow growth theory was also known as the exogenous theory because it professed technology as an exogenous factor which determines growth. One of the basic assumptions of the Solow model is the diminishing returns to labour and capital and constant returns to scale as well as competitive market equilibrium and constant savings rate. However, what is crucial about the Solow model is the fact that it explains the long run per capita growth by the rate of technological progress, which comes from outside the model.

EAST-WEST Journal of ECONOMICS AND BUSINESS
52
The endogenous growth theory or new growth theory was developed as a reaction to the flaws of the neoclassical (exogenous) growth theory. Romar endogenous growth theory was first presented in 1986 in which he takes knowledge as an input in the production function. The theory aimed at explaining the long run growth by endogenizing productivity growth or technical progress. The major assumptions of the theory are:
1. Increasing returns to scale because of positive externalities 2. Human capital (knowledge, skills and training of individuals) and the
production of new technologies are essential for long run growth. 3. Private investment in Research and Development is the most important
source of technological progress 4. Knowledge or technical advances are non-rival good.
In the New growth theory, the savings rate affects the long run economic growth because in this framework, a higher level of savings and capital formation allows for greater investment in human capital and Research and development. The model predicts that the economy can grow forever as long as it does not run out of new ideas or technological advancement. Just like the exogenous growth theory, the endogenous growth theory professes convergence of nations by diffusion of technology. That is, a situation where poor countries manage to catch up with the richer countries by gradual imitation of technology by poorer countries. Romar states that production function of a firm in the following form:
Y = A(R) F(Ri, Ki, Li)
where: A – public stock of knowledge from research and development (R) Ri – Stock of results from the stock of expenditure on research and development. Ki – Capital stock of firm i Li – Labour stock of firm i The Ri actually represents the technology prevalent at the time in firm i. Any new research technology spill over quickly across the entire nation. Technological progress (advancement) implies the development of new ideas

EAST-WEST Journal of ECONOMICS AND BUSINESS
53
which resemble public goods because they are non-rival. When the new ideas are added as factors of production the returns to scale tend to be increasing. In this model new technology is the ultimate determinant for long run growth and it is itself determined by investment into in research technology. Therefore, Romar takes investment in research technology as endogenous factor in terms of the acquisition of new knowledge by rational profit maximization firms. From the forgoing, we can derive the aggregate production function of the endogenous theory as follow:
Y=F (A, K, L) where
Y = aggregate real output. K = stock of capital. L = stock of labour. A = Technology (or technological advancement)
It is worthy of note that A (technological advancement) is based on the investment on research technology. Technology is seen as an endogenous factor which could be related to energy. Most technology as given per time is dependent on the availability of useful energy to power it. The technology referred to here is that such as plants, machinery and the likes. Without adequate energy supply (in this case electricity or petroleum) then these technology are practically useless. The law of thermodynamics helps to justify this by stating that “no production process can be driven without energy conversion”. Energy is not the sole determinant of technology but is a necessary factor to ensure that technology (at what ever level) is being utilized. Conversion of energy in its raw state into useful state is highly technology oriented. Taking cue from the technology oriented nature of energy production; it is also a known that energy production is capital intensive. Huge machineries are required to produce useable energy. This will mean that huge amount of capital will be required to produce energy. Huge investments must then be made on energy not only to produce but to attain energy efficiency. For the sake of justifying the endogenous growth model, capital and labour will be used along side various energy sources in the specification of the model.

EAST-WEST Journal of ECONOMICS AND BUSINESS
54
Model Specification Taking inference from the empirical findings and theories, which has been derived from the theoretical exposition of the exogenous growth theories and then making energy central to the equation, a model will be drawn up to determine economic growth in Nigeria context. If energy is taken as an independent variable then the model can be stated as
Y = f (K. L, E)
where: Y = Output Gfcf = Gross fixed capital formation Laf = Labour force E = Energy
However, in Nigeria context, 3 main energy types are considered and they include petroleum, electricity, and coal. Therefore, splitting E into 3 then the model could be restated as follows:
RGDP = f (Gfcf, Laf, Coc, Etc, Clc)
where: RGDP = Output Gfcf = Gross fixed capital formation Laf = Labour force Coc = Crude Oil consumption Etc = Electricity consumption Clc = Coal consumption Rewriting the model above in a linear form, we obtain:
RGDPt = α0 + α1Gfcft + α2Laft + α3Coct + α4Etct + α5Clct + Ut
Priori expectations:
α1>0, α2>0, α3>0, α4>0, α5>0
where:
α1 to α4 represents the slope coefficients α0 is the intercept Ut is the stochastic term or the error term at time t

EAST-WEST Journal of ECONOMICS AND BUSINESS
55
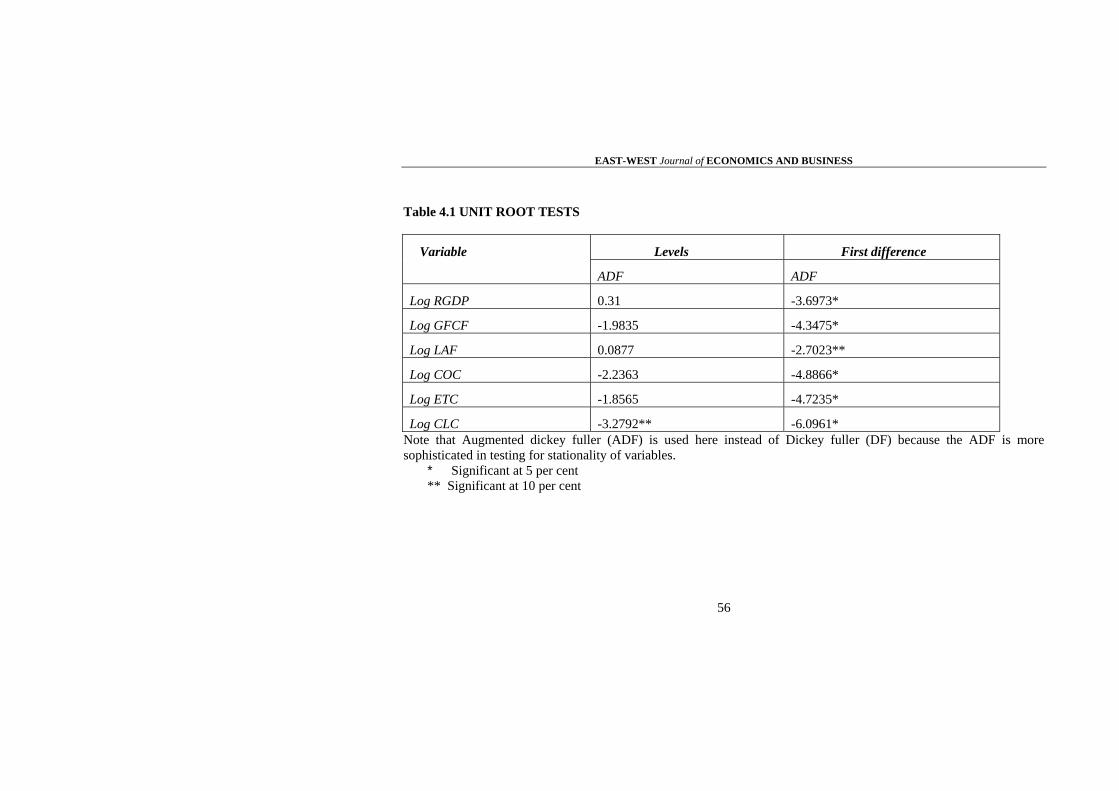
Data Analysis and Presentation The previous chapter has dealt with the theoretical framework and methodology of the study. A model which represents the subject matter of the study has been specified and will be used to justify the relationship between energy consumption and economic growth. Therefore, this chapter, using the co-integration technique, concentrates on the analysis of data, estimation of the model and interpretation of the results obtained in this study. Using the data which have been obtained from secondary sources, this section of the chapter talks of the results obtained in the study using co-integration technique. All three (3) stages of the technique are utilized here. Table 4.1 shows the unit root tests using Augmented Dickey Fuller at levels and first difference. Table 4.2 shows the unit root test of the residual which is derived from the ordinary least square result. Finally, table 4.3 shows the error correction of the growth model.
EAST-WEST Journal of ECONOMICS AND BUSINESS
56
Table 4.1 UNIT ROOT TESTS
Variable Levels First difference
ADF ADF
Log RGDP 0.31 -3.6973*
Log GFCF -1.9835 -4.3475*
Log LAF 0.0877 -2.7023**
Log COC -2.2363 -4.8866*
Log ETC -1.8565 -4.7235*
Log CLC -3.2792** -6.0961* Note that Augmented dickey fuller (ADF) is used here instead of Dickey fuller (DF) because the ADF is more sophisticated in testing for stationality of variables.
* Significant at 5 per cent ** Significant at 10 per cent

EAST-WEST Journal of ECONOMICS AND BUSINESS
57
Table 4.2 UNIT ROOT TEST OF RESIDUAL
Variable ADF
Trended Untrended
ECM -3.8071* -3.8716* The critical values for ADF for 5 per cent and 10 per cent are -3.5514 and -2.9527 respectively.
* Significant at 5 per cent Note that the unit root test is stationary at the 5 per cent level which also means that it is stationary at the 10 per cent level.

EAST-WEST Journal of ECONOMICS AND BUSINESS
58
TABLE 4.3 PARSIMONIOUS ERROR CORRECTION OF THE GROWTH MODEL Dependent Variable: DLOG (RGDP)
Variable Coefficient Std. Error T-Statistic Prob.
C -0.09467 0.080272 -1.179368 0.2555 DLOGLAF 5.04269 2.972829 1.69626 0.1092
DLOGGFCF 0.174282 0.022729 7.667836 0.0000
DLOGETC 0.038994 0.028086 1.388371 0.1841
DLOGCOC 0.224128 0.04132 5.424171 0.0001
DLOGETC(-2) -0.06492 0.032058 -2.025101 0.0599
DLOGETC(-3) -0.073318 0.033623 -2.180611 0.0445
DLOGETC(-4) -0.098741 0.029719 -3.322547 0.0043
DLOGCOC(-2) -0.107854 0.055888 -1.929816 0.0716
DLOGCOC(-3) -0.125692 0.053261 -2.359924 0.0313
DLOGCOC(-4) -0.159702 0.053906 -2.962612 0.0092
DLOGCLC(-3) 0.023286 0.011412 2.040412 0.0582

EAST-WEST Journal of ECONOMICS AND BUSINESS
59
DLOGCLC(-4) 0.049943 0.012048 4.14532 0.0008
ECM(-1) -0.578795 0.159026 -3.639639 0.0022 R2 0.869540
0.763542 F- Statistics 8.203320 S.E. of regression 0.022507 Durbin-Watson stat 2.056501

EAST-WEST Journal of ECONOMICS AND BUSINESS
60
ANALYSIS OF RESULTS Unit Root Test In table 4.1 it is observed, using the ADF, that the variables are non stationary at levels at 5 and 10 per cent with the exception of coal consumption which is stationary at 10 per cent. Subject to first difference, we notice that all the variables are significant (stationary) either at 5% or 10%. Test for co-integration Having shown that the variables are stationary at the 5 or 10 per cent level, tables 4.2 tests for co-integration of the variables by testing for unit root of the residual. The major aim of this test is to find out whether a linear combination of variables that are integrated of the same order is stationary. If co-integration exists, then there is a long run relationship between the variables. After running the OLS estimation, the residual of the equation was tested for unit root and was discovered to be stationary at both 5 and 10 percent levels as shown in table 4.2. This was due to the fact that the absolute value of the observed variable is greater than the absolute critical value. This means that the null hypothesis which states that the residual of the co-integrating regression equation is non stationary has to be rejected at both 5 and 10 percent levels of significance. By this, it is evident that there exists a long run relationship between the variables in the growth equation. Coefficient of Determination The error correction model is of a good fit. This is shown by the coefficient of determination i.e. R square (R2) and R square Adjusted ( ) which are 86.95% and 76.35% respectively. Using , this means that 76.35% variation in the dependent variable is explained by the independent variables. F Statistics The f value calculated is 8.2 and this shows that it is statistically significant at 5 per cent level. This basically means that the explanatory variables simultaneously explain the variations in the dependent variable.

EAST-WEST Journal of ECONOMICS AND BUSINESS
61
Durbin Watson (DW) The DW measures for the presence of autocorrelation in the model. However, it is noticed that the model is free from autocorrelation since the DW Statistic observed in the model is 2.06 which is approximately 2. This means that the model is reliable in explaining the economic growth in Nigeria. Significance of Variables From the parsimonious error correction model reported in table 4.3, it is observed that all the variables are significant at either at the 5 percent or 10 percent level. The model is the best and also captures the lagged changes in the independent variables. From the result obtained in the model, the current period coefficients of all the variables positively related to the gross domestic product. With the exception of electricity consumption and labour force which was significant at 10 percent, that other current period coefficients are significant at 5 percent level. It was also noted that the second, third and forth period lags of electricity and crude oil consumption are negatively related to the real GDP. The observed lagged variables of electricity consumption and crude oil consumption have been found to be statistically significant at 5 percent level with the exception of the second period lag of crude oil consumption which is significant at the 10 percent level. Finally, the third and forth period lags of coal consumption have been found to be positively related to economic growth shown by the gross domestic product. The lagged variable was also found to be statistical significant at the 5% level. Error Correction Term To check for the speed of adjustment of the model from the short run to the long run equilibrium state then we consider the error correcting term (ECM_1). The greater the coefficient of the error correcting term, the faster the speed of adjustment of the model from the short run to the long run. In the results obtained from the model, the coefficient of ECM_1 as shown in table 4.3 is approximately -0.58. Considering its absolute value, it is notice that the speed of adjustment from short run to long run is 58%. This shows that the ECM_1 has a relatively high speed of adjustment.

EAST-WEST Journal of ECONOMICS AND BUSINESS
62
TESTING OF HYPOTHESIS Haven discussed the result obtained from the co-integration technique; the hypotheses which were expected will be tested in this segment. Test of Hypothesis 1 H0: Petroleum consumption has no impact on the Nigerian economy. H1: Petroleum consumption has impact on the Nigerian economy. Result From the result obtained, it is seen that the present period petroleum is more highly correlated with economic growth. It is seen that the variable also passed the test at 5 per cent level of significance. The present period petroleum consumption has met the apriori expectation which states that petroleum and economic growth are positively related. However, it is noticed that the second, third and forth period lags are negatively related to GDP. On this note, we reject the null hypothesis and accept the alternative which states that petroleum consumption has an effect on economic growth. . Test of Hypothesis 2 H0: Electricity consumption has no impact on Nigerian economy. H1: Electricity consumption has impact on Nigerian economy. Results Like petroleum, present period electricity consumption is positively related to economic growth. However, the second, third and fourth lags are negatively related to economic growth. The present period value conforms to apriori expectation and is significant at the 10 percent level. Therefore, the null hypothesis is rejected which states that electricity has no effect on economic growth Test of Hypothesis 3 H0: Coal consumption has no impact on Nigerian economy. H1: Coal consumption has impact on Nigerian economy.

EAST-WEST Journal of ECONOMICS AND BUSINESS
63
Result It is noticed that the third and forth lags of coal consumption is positively related to economic growth. The variables are statistically significant at 5% and meet the apriori expectation. Therefore, the null hypothesis which states that coal consumption have no effects on economic growth is rejected. Conclusion and Recommendations This study aimed to assert that there exist a positive relationship between energy consumption and economic growth. Chapter one of the study focused on the introductory process in which the research question, statement of the problem hypothesis and the likes were added. In chapter two, literatures of various authors were reviewed showing with respect to the relationship which exists between energy consumption and economic growth. Chapter three of the study focused on the theoretical framework and methodology. The endogenous growth theory served as the theoretical framework. Taking cue from the basics of this theory, a model was specified using real Gross domestic product as a function of capital, labour, crude oil consumption, electricity consumption and coal consumption. Chapter four uses the co-integration technique to test for the relationship between the variables in the model specified in chapter three and after this we are able to come up with some findings. In light of the test being carried out covering a period of 36 years (1970 – 2005), the following are the key findings to the study:
1. There is a positive relationship between real gross domestic product and capital.
2. There is a positive relationship between real gross domestic product and labour force.
3. There is a positive relationship between real gross domestic product and crude oil consumption.
4. There is a positive relationship between real gross domestic product and electricity consumption
5. There is a positive relationship between real gross domestic product and the third and forth lagged values of coal consumption.

EAST-WEST Journal of ECONOMICS AND BUSINESS
64
6. There is a negative relationship between the second, third and forth lagged values of crude oil consumption and economic growth.
7. There is a negative relationship between the second, third and forth lagged values of electricity consumption and economic growth.
In light of the above, we find that capital and labour force conform to known theories which state that they are positively related to economic growth. Furthermore, we also discover that crude oil consumption and electricity consumption and coal consumption are positively related to economic growth. However, lagged values of electricity and crude oil consumption are negatively related to economic growth. The reason for this could be because these two energy sources have a high direct influence on the economy in the present period than in lagged periods. That is to say that energy consumption acts mainly as an intermediate good in past periods and then acts both as an intermediate and a final product in the present period. In other words, the effect of electricity in the past can only be seen in other factors or products which influences Gross domestic product today but the effects of electricity in the current period will not only be seen in the same frame as in the lagged years but in the tune with its direct effect on economic growth. RECOMMENDATIONS At this point, in the light of the findings derived from this study, it is paramount that the following recommendations be made. They include:
• Increase energy supply around the country: Since it has been found that energy is related to growth, increasing energy supply in an energy hungry nation like Nigeria will have a positive influence on economic growth. Increasing energy supply should also involve optimal production and utilization.
• Sustain and enhance energy infrastructure:This does not only involve good maintenance practices of existing energy infrastructure but it also deals with ensuring that there is increase in such infrastructure through the issuance of licences to the private sector for operation of such facilities and by reducing regulatory barriers even to long term capacity contracting. Also, natural gas infrastructures are required in the country to reduce natural gas flare. Availability of such facilities will increase the gas production and consumption and possibly growth.
• Increased research and development in the energy sector:There is need to increase research and development in the

EAST-WEST Journal of ECONOMICS AND BUSINESS
65
energy sector so that innovation can be fostered. Research and development into renewable sources of energy could be fostered and this could enhance economic growth.
• Diversification of energy sources:Oil has single handedly accounted for the majority share in energy production and consumption. Due to this, it has the ability to cause microeconomic volatility by halting major economic activities. Natural gas, coal and even ethanol could be used to serve as additions and backups in times of oil shortages.
• Promote energy efficiency and conservation: This would include education of the public on energy conservation and efficiency. It also involves a review and upgrade of energy efficient standards. By this we mean that buildings and appliances used in the country should have been of high standards such that it consumes the lowest quantity of energy possible.
• Attain efficient pricing of energy supply: When energy prices are too high, then there is abuse of resource by the masses who can’t afford it and this might reduce consumption especially that of the low income class of people. Also, when prices are a bit too low there tends to be inefficient use of energy.
• Increased funding in the sector: It is certain that the energy sector is capital intensive and would require huge amount of investments. Towards this end, the public and private sector could form a partnership to tackle this investment problem. Also, government need to increase the budgetary allocation to the sector and make the release of funds as fast as possible without delays.
Conclusion From the study carried out, it would be a fallacy to conclude that there is no relationship between energy consumption and economic growth. The place of energy as a contributor to economic growth cannot be overemphasized. It is therefore paramount that such a sector is not neglected in the country. The government should ensure that energy supply is beefed up in diversity so that more economic activity can thrive. Energy is the vital backbone of an economy. Research and development backed up by energy efficiency will be beneficial to the nation. Also, increased investment will be needed to foster increased energy production. The private, public or a partnership project could be carried out to see to the increase in provision of energy.

EAST-WEST Journal of ECONOMICS AND BUSINESS
66
APPENDIX DATA USED IN THE STUDY
Year GDP at 1990 constant prices (Nm)
Gross fixed capital formation at 1990 factor prices (Nm)
Labour force (millions of people)
Crude Oil consumption (millions of barrels)
Electricity consumption (megawatts)
Coal consumption (milllions of tonnes)
1970 250604 17126 20.39 395.69 145.3 0.061
1971 278556 22437 20.85 558.69 181.1 0.193
1972 295255 23221 21.32 665.30 211.1 0.341
1973 313390 22775 21.82 719.38 232.7 0.327
1974 351843 22708 22.36 823.32 266.2 0.304
1975 342208 37802 22.96 660.15 318.7 0.249
1976 378058 53153 23.61 758.06 369.8 0.299
1977 406800 63145 24.31 766.06 435.5 0.267
1978 381774 60609 25.05 696.32 504.4 0.219
1979 375855 48476 25.78 845.46 460.1 0.172
1980 388982 60428 26.50 760.12 536.9 0.176
1981 379972 75597 27.17 525.29 335.9 0.104
1982 373425 59068 27.83 470.64 685.6 0.056
1983 348686 32811 28.48 450.96 696.7 0.054
1984 343954 17790 29.15 507.49 625.5 0.076
1985 382940 18022 29.87 547.09 717.4 0.140

EAST-WEST Journal of ECONOMICS AND BUSINESS
67
1986 390161 25582 30.63 535.93 841.8 0.144
1987 387456 24601 31.42 483.27 852.9 0.115
1988 416837 22929 32.26 529.60 853.5 0.082
1989 446625 22392 33.11 625.91 976.8 0.081
1990 497351 37411 33.98 660.56 898.5 0.078
1991 497410 38289 35.03 689.85 946.6 0.100
1992 510493 39764 36.10 711.34 993 0.087
1993 518441 45715 37.20 691.40 1141.4 0.028
1994 522510 35437 38.32 696.19 1115 0.025
1995 533736 30903 39.46 715.40 1050.9 0.020
1996 555791 33872 40.63 740.19 1033.3 0.008
1997 571854 48570 41.83 759.71 1009.6 0.010
1998 587954 39380 43.04 776.01 972.8 0.012
1999 594975 41613 44.26 778.90 883.7 0.016
2000 624072 43797 45.49 797.88 1017.3 0.003
2001 653512 34470 46.84 817.15 1004.7 0.003
2002 683786 42793 48.19 655.06 1271.6 0.043
2003 749202 69841 49.56 655.06 1519.5 0.023
2004 798496 105239 50.94 900.60 1825.8 0.023
2005 848219 134164 NA 919.29 1873.1 0.023

EAST-WEST Journal of ECONOMICS AND BUSINESS
68
UNIT ROOT TEST OF DLOG(RGDP)
Null Hypothesis: D(LOG(RGDP)) has a unit root
Exogenous: Constant
Lag Length: 1 (Fixed)
t-Statistic Prob.*
Augmented Dickey-Fuller test statistic -3.697386 0.0088
Test critical values: 1% level -3.646342
5% level -2.954021
10% level -2.615817
UNIT ROOT TEST OF DLOG(LAF)
Null Hypothesis: D(LOG(LAF)) has a unit root
Exogenous: Constant
Lag Length: 1 (Fixed)
t-Statistic Prob.*
Augmented Dickey-Fuller test statistic -2.702309 0.0847
Test critical values: 1% level -3.653730
5% level -2.957110
10% level -2.617434

EAST-WEST Journal of ECONOMICS AND BUSINESS
69
UNIT ROOT TEST OF DLOG(GFCR)
Null Hypothesis: D(LOG(GFCF)) has a unit root
Exogenous: Constant
Lag Length: 1 (Fixed)
t-Statistic Prob.*
Augmented Dickey-Fuller test statistic -4.347519 0.0016
Test critical values: 1% level -3.646342
5% level -2.954021
10% level -2.615817
UNIT ROOT TEST OF DLOG(COC)
Null Hypothesis: D(LOG(COC)) has a unit root
Exogenous: Constant
Lag Length: 1 (Fixed)
t-Statistic Prob.*
Augmented Dickey-Fuller test statistic -4.886592 0.0004
Test critical values: 1% level -3.646342
5% level -2.954021
10% level -2.615817

EAST-WEST Journal of ECONOMICS AND BUSINESS
70
UNIT ROOT TEST OF DLOG(ETC)
Null Hypothesis: D(LOG(ETC)) has a unit root
Exogenous: Constant
Lag Length: 1 (Fixed)
t-Statistic Prob.*
Augmented Dickey-Fuller test statistic -4.723468 0.0006
Test critical values: 1% level -3.646342
5% level -2.954021
10% level -2.615817
UNIT ROOT TEST OF DLOG(CLC) Null Hypothesis: D(LOG(CLC)) has a unit root
Exogenous: Constant
Lag Length: 1 (Fixed)
t-Statistic Prob.*
Augmented Dickey-Fuller test statistic -6.096123 0.0000
Test critical values: 1% level -3.646342
5% level -2.954021

EAST-WEST Journal of ECONOMICS AND BUSINESS
71
10% level -2.615817
ORDINARY LEAST SQUARE ESTIMATE Dependent Variable: LOG(RGDP)
Method: Least Squares
Date: 02/28/08 Time: 14:26
Sample (adjusted): 1970 2004
Included observations: 35 after adjustments
Variable Coefficient Std. Error t-Statistic Prob.
LOG(LAF) 1.046419 0.090738 11.53225 0.0000
LOG(GFCF) 0.084133 0.015638 5.380063 0.0000
LOG(ETC) -0.030524 0.028179 -1.083222 0.2876
LOG(COC) 0.238772 0.036162 6.602922 0.0000
LOG(CLC) 0.026562 0.009814 2.706693 0.0113
C 7.219333 0.212339 33.99908 0.0000
R-squared 0.987346 Mean dependent var 13.00090
Adjusted R-squared 0.985164 S.D. dependent var 0.285593

EAST-WEST Journal of ECONOMICS AND BUSINESS
72
S.E. of regression 0.034786 Akaike info criterion -3.724402
Sum squared resid 0.035092 Schwarz criterion -3.457771
Log likelihood 71.17703 F-statistic 452.5487
Durbin-Watson stat 1.279565 Prob(F-statistic) 0.000000
UNIT ROOT TEST OF THE RESIDUAL
Null Hypothesis: ECM has a unit root
Exogenous: Constant
Lag Length: 1 (Fixed)
t-Statistic Prob.*
Augmented Dickey-Fuller test statistic -3.871634 0.0057
Test critical values: 1% level -3.646342
5% level -2.954021
10% level -2.615817
*MacKinnon (1996) one-sided p-values.

EAST-WEST Journal of ECONOMICS AND BUSINESS
73
OVER PARAMETERIZED ERROR CORRECTION GROWTH MODEL
Dependent Variable: DLOGRGDP
Method: Least Squares
Date: 02/28/08 Time: 14:22
Sample (adjusted): 1975 2004
Included observations: 30 after adjustments
Variable Coefficient Std. Error t-Statistic Prob.
DLOGLAF 17.54886 8.954356 1.959813 0.1449
DLOGGFCF 0.232817 0.052690 4.418625 0.0215
DLOGETC -0.006367 0.075365 -0.084483 0.9380
DLOGCOC 0.174828 0.060635 2.883281 0.0634
DLOGCLC -0.012596 0.015395 -0.818171 0.4732
DLOGLAF(-1) 6.086371 8.395221 0.724980 0.5209
DLOGLAF(-2) -16.90108 11.17489 -1.512416 0.2276
DLOGLAF(-3) 8.911665 11.05020 0.806471 0.4790
DLOGLAF(-4) -6.084627 7.032375 -0.865231 0.4506
DLOGGFCF(-1) 0.019992 0.032711 0.611175 0.5843
DLOGGFCF(-2) 0.010005 0.034480 0.290177 0.7906

EAST-WEST Journal of ECONOMICS AND BUSINESS
74
DLOGGFCF(-3) -0.031741 0.036737 -0.864006 0.4511
DLOGGFCF(-4) 0.000646 0.036326 0.017781 0.9869
DLOGETC(-1) -0.089606 0.114534 -0.782357 0.4911
DLOGETC(-2) -0.128445 0.079497 -1.615725 0.2046
DLOGETC(-3) -0.119080 0.056393 -2.111597 0.1252
DLOGETC(-4) -0.093887 0.037016 -2.536391 0.0849
DLOGCOC(-1) -0.133039 0.092686 -1.435377 0.2467
DLOGCOC(-2) -0.345503 0.134749 -2.564040 0.0829
DLOGCOC(-3) -0.333169 0.106983 -3.114225 0.0527
DLOGCOC(-4) -0.243233 0.122836 -1.980149 0.1420
DLOGCLC(-1) 0.001078 0.019333 0.055779 0.9590
DLOGCLC(-2) -0.002632 0.015213 -0.172993 0.8737
DLOGCLC(-3) 0.034536 0.023859 1.447500 0.2436
DLOGCLC(-4) 0.074637 0.024979 2.987970 0.0582
ECM(-1) -0.783102 0.329029 -2.380041 0.0976
C -0.204247 0.163988 -1.245495 0.3014
R-squared 0.973366 Mean dependent var 0.027318
Adjusted R-squared 0.742536 S.D. dependent var 0.046284
S.E. of regression 0.023485 Akaike info criterion -5.167484

EAST-WEST Journal of ECONOMICS AND BUSINESS
75
Sum squared resid 0.001655 Schwarz criterion -3.906407
Log likelihood 104.5123 F-statistic 4.216810
Durbin-Watson stat 2.494448 Prob(F-statistic) 0.130361
PARSIMONIOUS ERROR CORRECTION GROWTH MODEL
Dependent Variable: DLOGRGDP
Method: Least Squares
Date: 02/26/08 Time: 16:20
Sample (adjusted): 1975 2004
Included observations: 30 after adjustments
Variable Coefficient Std. Error t-Statistic Prob.
DLOGLAF 5.042690 2.972829 1.696260 0.1092
DLOGGFCF 0.174282 0.022729 7.667836 0.0000
DLOGETC 0.038994 0.028086 1.388371 0.1841
DLOGCOC 0.224128 0.041320 5.424171 0.0001
DLOGETC(-2) -0.064920 0.032058 -2.025101 0.0599
DLOGETC(-3) -0.073318 0.033623 -2.180611 0.0445
DLOGETC(-4) -0.098741 0.029719 -3.322547 0.0043

EAST-WEST Journal of ECONOMICS AND BUSINESS
76
DLOGCOC(-2) -0.107854 0.055888 -1.929816 0.0716
DLOGCOC(-3) -0.125692 0.053261 -2.359924 0.0313
DLOGCOC(-4) -0.159702 0.053906 -2.962612 0.0092
DLOGCLC(-3) 0.023286 0.011412 2.040412 0.0582
DLOGCLC(-4) 0.049943 0.012048 4.145320 0.0008
ECM(-1) -0.578795 0.159026 -3.639639 0.0022
C -0.094670 0.080272 -1.179368 0.2555
R-squared 0.869540 Mean dependent var 0.027318
Adjusted R-squared 0.763542 S.D. dependent var 0.046284
S.E. of regression 0.022507 Akaike info criterion -4.445283
Sum squared resid 0.008105 Schwarz criterion -3.791390
Log likelihood 80.67924 F-statistic 8.203320
Durbin-Watson stat 2.056501 Prob(F-statistic) 0.000085

EAST-WEST Journal of ECONOMICS AND BUSINESS
77
References Abare (2006). China’s coal sector. Australian Commodities, vol. 13 no. 3,
September quarter 2006. Pp 542-54. Access to energy in developing Countries (2002). Retrieved August 9, 2007,
from www.parliament.uk/post/home.htm Alam, M. S (2006). Economic growth with energy. Retrieved on the 20th
November 2006. Aqeel, A. and Butt, M. S. (2001). The Relationship between Energy
Consumption and Economic Growth in Pakistan. Asia-Pacific Development Journal 8(2): 101-109.
Asafu-Adjaye, J (2000) ‘The relationship between energy consumption, energy prices
and economic growth: time series evidence from Asian developing countries’. Energy Economics 22, 615-625
Ayodele, A. S (2004). Improving and sustaining power (electricity) supply for socio economic development in Nigeria.
Birol, F (2007). World energy prospects and challenges. Melbourne: Blackwell publishing.
Central Bank of Nigeria (2000). The Changing Structure of the Nigerian Economy and Implications for development. Lagos: Realms Communications Ltd.
Chontanawat S, Hunt L.C, Pierse R. (2006). Casualty between energy consumption and GDP. From 30 OECD and 78 Non – OECD comprises the survey Energy Economics Discussion paper series. ISSN 1749 – 8384.
Community for research and development centre (2006). Renewable energy: The key to sustainable energy development in Nigeria.
Cortright, J. (2001). New growth theory, technology and learning: A practitioner’s guide. Portland: Impresa Inc.
Energy information Administration (2007). Country analysis briefs: Nigeria. Retrieved on 12th November 2007 from www.eia.doe.gov
Energy information Administration (2004). International energy Outlook, Highlights. Retrieved on 12th November 2007 from www.eia.doe.gov
Energy Sector Management Assistance Program (2005). Nigeria: Expanding Access to Rural Infrastructure Issues and Options for Rural Electrification, Water Supply and Telecommunications. Washington, D.C, ESMAP publications.
Electric Power sector reform Implementation Committee (EPIC) (2004). National electric power policy. Retrieved on 21st July 2007.
Gujarati, D (1995). Basic Econometrics. 3rd Edition. New York: McGraw-Hill, Inc.

EAST-WEST Journal of ECONOMICS AND BUSINESS
78
Guttormsen, A.G (2004). Causality between Energy consumption and Economic growth. Discussion paper #D-24/2004. Retrieved on 09th September 2004 from www.nhl.no/ior/
Ikuponisi, F.S (2004, November 21). Status of Renewable Energy in Nigeria. Paper presented at the 2004 conference on Making Renewable Energy a Reality, Abuja. Retrieved July 24, 2007.
Jhingan, M.L (2004). Monetary Economics(6th ed.). Delhi: Vrinda publications Ltd. Jhingan, M.L (1998). The Economics of Development and Planning (30th ed.).
Delhi: Vrinda Publications Ltd. Jochem, E (2004). World Energy assessment: Energy and the challenges of
sustainability. Energy end - use efficiency, pgs 174-217. Johansson et al (1993). Renewable Energy: Sources for fuel and electricity.
Washington DC, Island press. Kinika Amaewhule (2000). What are the constraints facing the development and
implementation of an energy efficiency policy in Nigeria and how can these be overcome?, (undated). Retrieved on 4th December 2007.
Kittelson, D.A (1998). Productive uses of electricity: Country Experiences. Bolivia, NRECA International Ltd.
Krizanic, F (2007). The European market of Electricity and Natural Gas. EIB forum, Ljubljana.
Methane to Markets Partnership Coal Subcommittee (2006). Nigeria – Summary of coal in Nigeria. CMM global Overview.
Morimoto, R and Hope, C (2001). The impact of electricity supply on economic growth in Sri Lanka. Judge Institute of Management Research Paper.
National Bureau of Statistics (2006). National Petroleum Council (2003). Balancing Natural Gas Policy: Fuelling the
demands of a growing Economy. Washington, D.C: National Petroleum Council.
Nigeria country analysis brief (2005). Retrieved July 24, 2007, from www.parliament.uk/post/home.htm
Nigerian National Committee of the World Energy Council (NNC-WAC) (2007). Communiqué on Africa forum on energy efficiency. 8 - 9th January, 2007.
Okpanefe, P.E and Owolabi, S (2001). Small Hydropower in Nigeria. 2001 TCDC Training Workshop on SHP
Oviemuno, A.O (2006). Impact of energy on the manufacturing sector of Nigeria. Retrieved on 01 November 2007 from www.searchwarp.com
Prep – Crest (2001). About renewable energy. Retrieved on 28th November 2007 from www.crest.org/efficiency/index.htm

EAST-WEST Journal of ECONOMICS AND BUSINESS
79
Reddy, M (1998). Energy consumption and Economic activity in Fiji. The Journal of Pacific Studies, Volume 22, 81–96
Roger Bezdek (2007). Renewable Energy and Energy Efficiency: Economic drivers for the 21st century. Colorado: American solar energy society.
Ron, M (2006). Africa’s Role in Meeting Energy Demand. London: ISH Inc. Sanchis, M.T (2007).Quantifying the contribution of electricity to Spanish
economic growth during the twentieth Century. Paper presented at the III Iberometrics Valencia, March 23-24, 2007.
Sambo, A. S et al (2006). Nigeria’s experience on the application of IAEA’s energy models (MAED & WASP) for national energy planning. Paper presented during the Training Meeting / Workshop on Exchange of Experience in Using IAEA’s Energy Models and Assessment of Further Training Needs, held at the Korea Atomic Energy Research Institute, Daejon, Republic of Korea.
Simpson, E.S (1969). Electricity production in Nigeria. Economic Geography, Vol. 45, No. 3. (Jul., 1969), pp. 239-257.
The association between unexpected changes in electricity volume and GDP growth for residential customers. (2007). Melbourne: Frontier Economics Pty Ltd.
Todaro M.P and Smith S.C (2003). Economic Development (eighth edition). Singapore: Pearson Education.
Yu, E. and J. Choi (1985). The causal relationship between energy and GNP, an international comparison. Journal of Energy and Development.