does biochar addition influence the change points of soil phosphorus leaching?
TRANSCRIPT

Journal of Integrative Agriculture2014, 13(3): 499-506 March 2014RESEARCH ARTICLE
© 2014, CAAS. All rights reserved. Published by Elsevier Ltd.doi: 10.1016/S2095-3119(13)60705-4
Does Biochar Addition Influence the Change Points of Soil Phosphorus Leaching?
ZHAO Xiao-rong, LI Dan, KONG Juan and LIN Qi-mei
College of Resource and Environmental Sciences, China Agricultural University, Beijing 100193, R.R.China
Abstract
Phosphorus change point indicating the threshold related to P leaching, largely depends on soil properties. Increasing data have shown that biochar addition can improve soil retention capacity of ions. However, we have known little about weather biochar amendment influence the change point of P leaching. In this study, two soils added with 0, 5, 10, 20, and 50 g biochar kg-1 were incubated at 25°C for 14 d following adjusting the soil moisture to 50% water-holding capacity (WHC). The soils with different available P values were then obtained by adding a series of KH2PO4 solution (ranging from 0 to 600 mg P kg-1
soil), and subjecting to three cycles of drying and rewetting. The results showed that biochar addition significantly lifted the P change points in the tested soils, together with changes in soil pH, organic C, Olen-P and CaCl2-P but little on exchangeable Ca and Mg, oxalate-extractable Fe and Al. The Olsen-P at the change points ranged from 48.65 to 185.07 mg kg-1 in the alluvial soil and 71.25 to 98.65 mg kg-1 in the red soil, corresponding to CaCl2-P of 0.31-6.49 and 0.18-0.45 mg L-1, respectively. The change points of the alluvial soil were readily changed by adding biochar compared with that of the red soil. The enhancement of change points was likely to be explained as the improvement of phosphate retention ability in the biochar-added soils.
Key words: biochar, soil, phosphorus, change point
INTRODUCTION
Phosphorus as a ‘wealthy’nutrient element plays an important role in food production (Brookes et al. 1997). However, it has been world-widely reported that the P accumulation in soil increases P load from soil to water due to P fertilizer input (Sharpley et al. 1994; Kleinman et al. 2011), which promote eutrophication and impose a threat to environmental health (Laird et al. 2010b). Besides runoff, the leached P, probably by preferential flow, markedly contributes to P loss from soil (Heckrath et al. 1995). The P concentrations in drainage water are related to soil P level, increasing linearly when Olsen-P is above certain level, which
is termed as change point. The value of change point can be determined in laboratory through the correlation equation of calcium chloride extractable P (CaCl2-P) to Olsen-P (Zhao et al. 2007). High change point may imply the low P leaching (Neri et al. 2005).
Biochar is a by-product of biomass thermal decomposition under low oxygen. It is of unique characteristics such as high recalcitrant aromatic carbon, porosity, low density, large surface area, positive and negative charges (Liang et al. 2006). A significant amount of data have shown that biochar as a soil conditioner can significantly improve soil physical properties (e.g., soil water retention, hydraulic conductivity and aggregate stability) (Glaser et al. 2002; Oguntunde et al. 2008; Asai et al. 2009),
Received 9 October, 2013 Accepted 18 December, 2013Correspondence ZHAO Xiao-rong, Tel: +86-10-62732502, E-mail: [email protected]; Correspondence LIN Qi-mei, Tel: +86-10-62732502, E-mail: [email protected]

500 ZHAO Xiao-rong et al.
© 2014, CAAS. All rights reserved. Published by Elsevier Ltd.
chemical properties (e.g., pH, soil organic C, CEC and cation) (Liang et al. 2006; Xu et al. 2013), and crop yields (Lehmann et al. 2003; Steiner et al. 2007; van Zwieten et al. 2010; Peng et al. 2011). The biochar-amended soil has high capacity of holding water and ions (Lehmann et al. 2005). Adding biochar has been demonstrated to reduce nutrient leaching in greenhouse (Lehmann et al. 2003), in soil column from a typical Midwestern agricultural soil (Larid et al. 2010a) and in a sandy soil (Yao et al. 2012). Erosion reductions based on the movement of nutrients adsorbed to sediments are debatable, whereas reductions in soluble nutrients can be expected (Lehman 2007).
We hypothesizes that P change point of soil may change with biochar addition since it changes the soil retention behavior of phosphates. The specific objectives are to determine 1) the chemical properties of biochar derived from pyrolysis of maize (Zea mays) straw at 500°C; 2) effects of biochar addition on soil chemical properties and P change point; 3) the different responses of two different soils to biochar addition.
RESULTS
Soil chemical properties
Two tested soils were different in pH, organic C, Olsen-P, exchangeable Ca and poorly crystalline aluminium (Alox) (Table 1). Biochar addition resulted in significant changes in soil pH, organic C, exchangeable Ca and Mg, but little in poorly crystalline iron (Feox) and Alox in the two soils (Table 2). In general, the more biochar added, the higher values were detected in the soils. Organic C of both soils proportionally increased with increasing additional rates of biochar. Surprisingly, the red soil was readily influenced by adding biochar comparing with the alluvial soil. The pH value of red soil increased by 0.32-1.49 units, but little in alluvial soil. Both exchangeable Ca and Mg had larger changes in the biochar-added red soil than that of alluvial soil.
Biochar addition had significant influence in Olsen-P and CaCl2-P. Both proportionally increased with biochar addition rates. In particular, the alluvial soil had much more obvious increases, 154 and
529% for Olsen-P and CaCl2-P, respectively, than the red soil. However, biochar addition had much less impacts on either PSI or DPS. The alluvial soil had lower PSI (<200 L 100 g-1) but higher DPS (>25%), while the red soil had higher PSI (>307 L 100 g-1) but lower DPS (<6.5%) (Table 3).
Change point
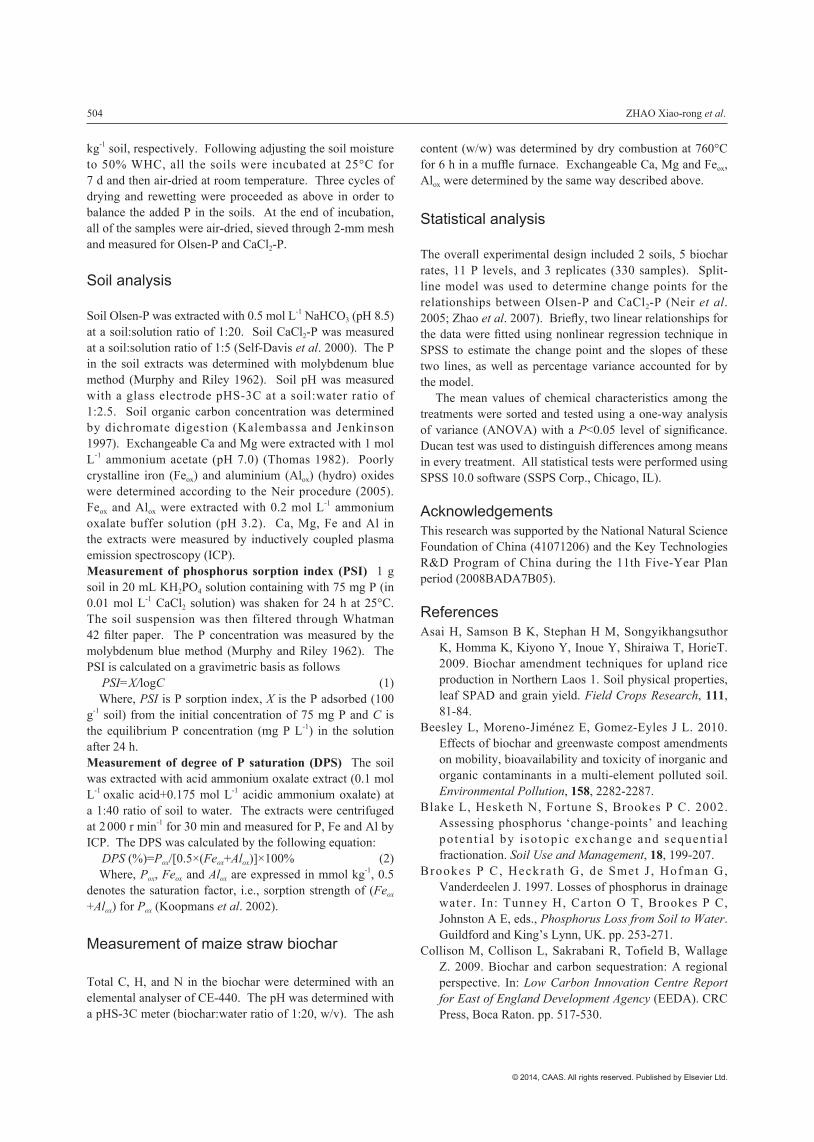
There was a clear relationship between the CaCl2-P and Olsen-P in all the soils (Fig.). The CaCl2-P increased linearly with Olsen-P when Olsen-P exceeded a certain threshold concentration, termed as change point. Above the change point value, CaCl2-P increased at a greater rate per unit increase in Olsen-P than that below the change point. The change points in Olsen-P ranged from 48.65 to 185.07 mg kg-1 in the alluvial soil and 71.25 to 98.65 mg kg-1 in the red soil, corresponding to CaCl2-P 0.31 to 6.49 mg L-1 and 0.18 to 0.45 mg L-1, respectively (Table 4). Biochar addition significantly enhanced the change points. The more the biochar added, the higher the change points were detected. The change points of the alluvial soil were readily changed with biochar addition compared to that of the red soil. Olsen-P at the change point in the biochar-added alluvial soil was 3.8 times as high as that without biochar addition, while lifted by only 39% in the red soil. Surprisingly, biochar addition induced in much larger increase in CaCl2-P concentration compared to Olsen-P, by maximum 21 and 2.5 times in the alluvial and the red soils, respectively.
The relationships between change point and soil chemical properties
Olsen-P concentration at the change point was closely correlated to CaCl2-P (r=0.749, P<0.05). The close
Table 1 Some chemical properties of two tested soils and maize straw derived biocharParameters Alluvial soil Red soil BiocharpH (H2O) 8.64 5.30 9.39Organic C (g kg-1) 5.19 8.11 406.53Olsen-P (mg kg-1) 9.41 7.50 Not determinedCaCl2-P (mg L-1) 0.16 0.02 2.85Exchangeable Ca (mg kg-1) 2 157.24 1 384.91 6 784.33Exchangeable Mg (mg kg-1) 239.88 286.48 2 085.08Feox (mg kg-1) 1 621.66 1 779.47 1 052.76Alox (mg kg-1) 722.53 1 298.24 16 826.98

Does Biochar Addition Influence the Change Points of Soil Phosphorus Leaching? 501
© 2014, CAAS. All rights reserved. Published by Elsevier Ltd.
and Al, PSI and DPS were not significantly influenced although a number of the components were added into the soils through biochar addition. Thereby, the added Ca, Mg, Fe and Al may combine with soil clay minerals and become un-extractable to these regents.
The impacts of biochar addition on P change point
Both long-term field and lysimeter experiments have demonstrated a close linear relationship between the P concentration in leachate and Olsen-P once the change point has been reached (Heckrath et al. 1995;
Table 2 Changes of pH, organic carbon, exchangeable Ca and Mg and crystalline iron (Feox) and aluminum (Alox) (hydro) oxides in red and alluvial soils added with maize straw biocharSoil Biochar addition (g kg-1) pH Organic C (g kg-1) Exchangeable Ca (mg kg-1) Exchangeable Mg (mg kg-1) Feox (mg kg-1) Alox (mg kg-1)Alluvial soil 0 8.66 b 4.50 a 2 386.33 ab 244.90 a 1 313.94 a 763.70 a
5 8.65 b 5.44 a 2 344.28 ab 245.37 a 1 529.97 a 810.48 a 10 8.61 a 6.01 ab 2 343.75 ab 251.60 a 1 498.66 a 755.24 a 20 8.59 a 8.98 bc 2 407.41 a 284.70 ab 1 408.10 a 747.06 a 50 8.65 b 17.43 c 2 265.06 b 324.06 b 1 524.66 a 749.71 a
Red soil 0 5.20 a 6.87 a 1 187.99 a 281.60 a 1 807.68 ab 1 263.53 a 5 5.52 b 13.52 b 1 194.25 a 292.82 b 1 643.85 b 1 091.26 a
10 5.62 c 15.03 b 1 159.53 a 302.41 c 1 601.09 b 1 096.10 a 20 5.68 d 17.37 b 1 369.11 b 337.83 d 1 543.57 b 1 103.58 a 50 6.69 e 31.01 c 1 625.30 b 381.21 e 1 644.04 b 1 200.19 a
Data were mean values sorted by amendment rate of biochar and were compared using a one-way ANOVA for multiple comparisons vs. a control (soil+0 g biochar kg-1 soil). The different letters are significantly different at P<0.05. The same as below.
Table 3 Changes of soil P properties after maize straw biochar amendment with soilsSoil Biochar addition (g kg-1) Olsen-P (mg kg-1) CaCl2-P (mg L-1) PSI (L 100 g-1) DPS (%)Alluvial soil 0 10.00 a 0.14 ab 182.27 a 24.88 a
5 10.96 b 0.10 a 190.95 a 26.15 a10 13.20 c 0.14 ab 181.43 a 25.60 a20 15.46 d 0.21 b 186.60 a 26.37 a50 25.36 e 0.88 c 199.07 a 28.49 a
Red soil 0 6.02 a 0.17 c 341.65 b 7.90 b5 6.94 b 0.10 ab 344.66 b 6.86 ab
10 8.16 c 0.09 ab 284.96 a 7.01 ab20 7.91 c 0.07 ab 326.13 ab 6.47 a50 12.70 d 0.12 b 307.15 ab 7.63 ab
relationships were found between Olsen-P and exchangeable Mg (r=0.713, P<0.05), and between CaCl2-P and DPS (r=0.625, P<0.05).
DISCUSSION
The effect o f b iochar addi t ion on so i l properties
Increasing researches have shown that biochar as a soil conditioner can significantly improve soil fertility and crop growth (Steiner et al. 2007; van Zwieten et al. 2010; Peng et al. 2011). The most dramatic changes include soil pH (Liang et al. 2006; Xu et al. 2013), organic C (Novak et al. 2009; Xu et al. 2013), bulk density (Gundale and DeLuca 2006; Laird et al. 2010a; Major et al. 2010), water and nutrient retention (Lehmann et al. 2005; Laird et al. 2010a). In this study, adding biochar resulted in large increases in soil pH, organic C, Olsen-P and CaCl2-P since the used biochar contained significant amounts of ash, organic C and CaCl2-P (Table 1). However, the parameters such as exchangeable Ca and Mg, oxalate-extractable Fe
Table 4 Change points relative to split-linear relationships between concentration of 0.01 mol L-1 CaCl2-extractable P and Olsen-P for the biochar treatment in two soils studiedSoil Biochar addition (g kg-1) Olsen-P (mg kg-1) CaCl2-P (mg L-1)Alluvial soil 0 48.65 a 0.31 a
5 49.17 a 0.76 a 10 53.64 a 1.47 b 20 63.75 b 2.89 c 50 185.07 c 6.49 d
Red soil 0 71.25 a 0.18 a 5 74.80 a 0.21 ab
10 87.98 ab 0.18 a 20 90.69 ab 0.31 b 50 98.65 b 0.45 c

502 ZHAO Xiao-rong et al.
© 2014, CAAS. All rights reserved. Published by Elsevier Ltd.
Brookes et al. 1997; Maguire and Sims 2002; Neir et al. 2005; Zhao et al. 2007). Olsen-P values at change point have been reported to range from 14.8 to 253.1 mg kg-1 soil for 10 soils from central Italy (Neir et al. 2005) and 30 to 160 mg kg-1 soil for 23 soils from
Fig. Relationship between concentration of CaCl2-P and Olsen-P for the alluvial soil and the red soil with different amount of biochar addition. Split-line model fitted shows the change point as indicated by the arrow. BC0, BC5, BC10, BC20 and BC50 in the figure represent different biochar treatments with the addition of 0, 5, 10, 20, and 50 g kg-1 biochar to soil respectively.
0
5
10
15
20
25
30
0 100 200 300
Alluvial soil
↓
BC0
0
5
10
15
20
25
30
0 100 200 300
49.17, 0.76
↓
BC5
0
5
10
15
20
25
30
0 100 200 300
53.64, 0.76↓
BC10
0
5
10
15
20
25
30
0 50 100 150 200 250 300
63.75, 2.89↓
BC20
0
5
10
15
20
25
30
0 50 100 150 200 250 300
185.07, 6.49
↓
BC50
0.00.51.01.52.02.53.03.5
0 50 100 150 200 250
90.69, 0.31↓
BC20
0.00.51.01.52.02.53.03.5
0 50 100 150 200 250
Red soil
71.25, 0.18
↓
BC0
0.00.51.01.52.02.53.03.5
0 50 100 150 200 250
74.80, 0.21
↓
BC5
0.00.51.01.52.02.53.03.5
0 50 100 150 200 250
98.66, 0.45↓
BC50
0.00.51.01.52.02.53.03.5
0 50 100 150 200 250
87.98, 0.18
↓
BC10
48.65, 0.31
Cad
2-P (m
g L-1
)
Olsen-P (mg kg-1)
China (Zhao et al. 2007). Li et al. (2011) measured 67.2, 85.8 and 113.8 mg kg-1 of the change points for acidic, neutral and calcareous purple soils. The soils with adding different quantities of biochar had the change points ranging from 48.65 to 189.07 mg kg-1

Does Biochar Addition Influence the Change Points of Soil Phosphorus Leaching? 503
© 2014, CAAS. All rights reserved. Published by Elsevier Ltd.
soil, corresponding to CaCl2-P concentrations of 0.31 to 6.49 mg L-1. Biochar addition significantly resulted in increases in both Olsen-P and CaCl2-P. Particularly the CaCl2-P was enhanced by the maximum 21 times due to biochar addition to the alluvial soil. It is thus logically believed that the leachate with so much high P content may give much pressure for water quality since P concentration higher than 1 mg L-1 may induce in algae blooming growth.
The change point values were largely decided by soil organic C (Black et al. 2002; Zhao et al. 2007), Feox or Alox (Black et al. 2002; Fortune et al. 2005; Neri et al. 2005; Zhao et al. 2007), clay content and the degree of phosphorus saturation (DPS) (Neri et al. 2005). Zhao et al. (2007) even reported that a closer correlation was detected in the soils below pH 6.0 than that above pH 6.0. In this study, biochar addition resulted in significant changes on pH, organic C, Olsen-P and CaCl2-P, but little on exchangeable Ca and Mg and oxalate-extractable Fe and Al which markedly influenced the change points. It is thus logical that a significant relationship was only found between the change point and exchangeable Mg and DPS. The enhancement of the change point may be attributed to the increase of retention capacity in the soil with biochar addition rather than organic C, Feox and Alox. It is well known that biochar usually has large surface and positive and negative charges (Zhang et al. 2014). The biochar-amended soil consequently has greater abilities to adsorb cations (Liang et al. 2006; Yuan and Xu 2010), anions (Lehmann et al. 2005; Xu et al. 2013) and organic pollutants (Beesley et al. 2010; Denyes et al. 2013). A few experiments have shown that biochar can reduce nutrient leaching together with enhancing nutrient availability (Collison et al. 2009; Larid et al. 2010a). Larid et al. (2010a, b) even measured a 69% reduction of total dissolved P in the leachate of a typical Midwestern agricultural soil with adding biochar. The high ash content in biochar may also partially contribute to the increase of the change point since the ash constitutions such as Ca, Mg can reinforce the biochar-added soil with high affinity of phosphates.
CONCLUSION
In the short-term incubation condition, adding maize
straw derived biochar to the red soil and the alluvial soil could significantly elevate soil change point, together with changing some parameters of the soils. The change point was readily changed by adding biochar to the alluvial soil compared to the red soil. The CaCl2-P at the change point could reach up to 6.49 mg L-1, which might imply high potential risk to aquatic environment. The enhancement of the change point is likely to be the improvement of phosphate affinity in the biochar-added soils.
MATERIALS AND METHODS
Soils
Two surface soils (0-20 cm), red soil (Oxisol) and alluvial soil (Entisol), were collected from Changsha and Beijing, China, respectively. The soils were air-dried at room temperature and sieved through 2-mm mesh prior to chemical analysis. Soil propertises are shown in Table 1.
Preparation of maize straw biochar
A bulk of cleaned and oven-dried (70°C,72 h) maize (Arachis hypogaea L.) straw piece about 1 cm long was firmly placed into a stainless steel cylinder (11.5 cm in height and 7.5 cm in diameter), and screwed at two ends, one end cover with a 1-mm hole for releasing gas. The cylinder was inserted into a muffle furnace and subjected to pyrolysis anaerobically for 2 h at 500°C. The remains of biochar had pH 9.39, 42.83% ash (w/w), 40.65% C, 1.81% H, 1.02% N. Other parameters are shown in Table 1.
Biochar-containing soils
A sufficient amount of biochar (<2 mm) was thoroughly mixed into 300 g of air-dried soils to achieve the soils containing 0, 5, 10, 20, and 50 g biochar kg-1 soil, labeled as BC0, BC5, BC10, BC20 and BC50, respectively. The mixed soils were incubated for 14 d at 25°C in a dark room following adjusting to 50% water-holding capacity (WHC) with deionized H2O. The measured parameters included soil pH, organic C, exchangeable Ca and Mg, poorly crystalline iron (Feox) and aluminium (Alox), phosphorus sorption index (PSI), degree of P saturation (DPS), Olsen-P and CaCl2-P.
Gradient P soils
Each of the biochar-amended soils were added with a series quantities of KH2PO4 solution to achieve the soils containing 0, 20, 50, 100, 150, 200, 250, 300, 400, 500 and 600 mg P
504 ZHAO Xiao-rong et al.
© 2014, CAAS. All rights reserved. Published by Elsevier Ltd.
kg-1 soil, respectively. Following adjusting the soil moisture to 50% WHC, all the soils were incubated at 25°C for 7 d and then air-dried at room temperature. Three cycles of drying and rewetting were proceeded as above in order to balance the added P in the soils. At the end of incubation, all of the samples were air-dried, sieved through 2-mm mesh and measured for Olsen-P and CaCl2-P.
Soil analysis
Soil Olsen-P was extracted with 0.5 mol L-1 NaHCO3 (pH 8.5) at a soil:solution ratio of 1:20. Soil CaCl2-P was measured at a soil:solution ratio of 1:5 (Self-Davis et al. 2000). The P in the soil extracts was determined with molybdenum blue method (Murphy and Riley 1962). Soil pH was measured with a glass electrode pHS-3C at a soil:water ratio of 1:2.5. Soil organic carbon concentration was determined by dichromate digestion (Kalembassa and Jenkinson 1997). Exchangeable Ca and Mg were extracted with 1 mol L-1 ammonium acetate (pH 7.0) (Thomas 1982). Poorly crystalline iron (Feox) and aluminium (Alox) (hydro) oxides were determined according to the Neir procedure (2005). Feox and Alox were extracted with 0.2 mol L-1 ammonium oxalate buffer solution (pH 3.2). Ca, Mg, Fe and Al in the extracts were measured by inductively coupled plasma emission spectroscopy (ICP).Measurement of phosphorus sorption index (PSI) 1 g soil in 20 mL KH2PO4 solution containing with 75 mg P (in 0.01 mol L-1 CaCl2 solution) was shaken for 24 h at 25°C. The soil suspension was then filtered through Whatman 42 filter paper. The P concentration was measured by the molybdenum blue method (Murphy and Riley 1962). The PSI is calculated on a gravimetric basis as follows
PSI=X/logC (1) Where, PSI is P sorption index, X is the P adsorbed (100 g-1 soil) from the initial concentration of 75 mg P and C is the equilibrium P concentration (mg P L-1) in the solution after 24 h.Measurement of degree of P saturation (DPS) The soil was extracted with acid ammonium oxalate extract (0.1 mol L-1 oxalic acid+0.175 mol L-1 acidic ammonium oxalate) at a 1:40 ratio of soil to water. The extracts were centrifuged at 2 000 r min-1 for 30 min and measured for P, Fe and Al by ICP. The DPS was calculated by the following equation:
DPS (%)=Pox/[0.5×(Feox+Alox)]×100% (2) Where, Pox, Feox and Alox are expressed in mmol kg-1, 0.5 denotes the saturation factor, i.e., sorption strength of (Feox
+Alox) for Pox (Koopmans et al. 2002).
Measurement of maize straw biochar
Total C, H, and N in the biochar were determined with an elemental analyser of CE-440. The pH was determined with a pHS-3C meter (biochar:water ratio of 1:20, w/v). The ash
content (w/w) was determined by dry combustion at 760°C for 6 h in a muffle furnace. Exchangeable Ca, Mg and Feox, Alox were determined by the same way described above.
Statistical analysis
The overall experimental design included 2 soils, 5 biochar rates, 11 P levels, and 3 replicates (330 samples). Split-line model was used to determine change points for the relationships between Olsen-P and CaCl2-P (Neir et al. 2005; Zhao et al. 2007). Briefly, two linear relationships for the data were fitted using nonlinear regression technique in SPSS to estimate the change point and the slopes of these two lines, as well as percentage variance accounted for by the model.
The mean values of chemical characteristics among the treatments were sorted and tested using a one-way analysis of variance (ANOVA) with a P<0.05 level of significance. Ducan test was used to distinguish differences among means in every treatment. All statistical tests were performed using SPSS 10.0 software (SSPS Corp., Chicago, IL).
AcknowledgementsThis research was supported by the National Natural Science Foundation of China (41071206) and the Key Technologies R&D Program of China during the 11th Five-Year Plan period (2008BADA7B05).
ReferencesAsai H, Samson B K, Stephan H M, Songyikhangsuthor
K, Homma K, Kiyono Y, Inoue Y, Shiraiwa T, HorieT. 2009. Biochar amendment techniques for upland rice production in Northern Laos 1. Soil physical properties, leaf SPAD and grain yield. Field Crops Research, 111, 81-84.
Beesley L, Moreno-Jiménez E, Gomez-Eyles J L. 2010. Effects of biochar and greenwaste compost amendments on mobility, bioavailability and toxicity of inorganic and organic contaminants in a multi-element polluted soil. Environmental Pollution, 158, 2282-2287.
Blake L, Hesketh N, Fortune S, Brookes P C. 2002. Assessing phosphorus ‘change-points’ and leaching potent ia l by isotopic exchange and sequent ia l fractionation. Soil Use and Management, 18, 199-207.
Brookes P C, Heckra th G, de Smet J , Hofman G, Vanderdeelen J. 1997. Losses of phosphorus in drainage water. In: Tunney H, Carton O T, Brookes P C, Johnston A E, eds., Phosphorus Loss from Soil to Water. Guildford and King’s Lynn, UK. pp. 253-271.
Collison M, Collison L, Sakrabani R, Tofield B, Wallage Z. 2009. Biochar and carbon sequestration: A regional perspective. In: Low Carbon Innovation Centre Report for East of England Development Agency (EEDA). CRC Press, Boca Raton. pp. 517-530.

Does Biochar Addition Influence the Change Points of Soil Phosphorus Leaching? 505
© 2014, CAAS. All rights reserved. Published by Elsevier Ltd.
Denyes M J, Rutter A, Zeeb B A. 2013. In situ application of activated carbon and biochar to PCB-contaminated soil and the effects of mixing regime. Environmental Pollution, 182, 201-208.
Fortune S, Lu J, Addiscott T M, Brookes P C. 2005. Assessment of phosphorus leaching losses from arable land. Plant and Soil, 269, 99-108.
Glaser B, Lehmann J, Zech W. 2002. Ameliorating physical and chemical properties of highly weathered soils in the tropics with charcoal - a review. Biology and Fertility of Soils, 35, 219-230.
Gundale M J, DeLuca T H. 2006. Temperature and substrate influence the chemical properties of charcoal in the ponderosa pine/Douglas-fir ecosystem. Forest Ecology and Management, 231, 86-93.
Heckrath G, Brookes P C, Poulton P R, Goulding K W T. 1995. Phosphorus leaching from soil containing different phosphorus concentrations in the Broadbalk experiment. Journal of Environmental Quality, 24, 904-910.
Hesketh N, Brookes P C. 2000. Development of an indicator for risk of phosphorus leaching. Journal of Environmental Quality, 29, 105-110.
Kalembassa S J, Jenkinson D S. 1997. A comparative study of titrametic and gravimetric methods for the determination of organic carbon in soils. Journal of the Science of Food and Agriculture, 24, 1085-1090.
Kleinman P J A, Sharpley A N, McDowell R W, Flaten D N, Buda A R, Tao L, Bergstrom L, Zhu Q. 2011. Managing agricultural phosphorus for water quality protection: principles for progress. Plant and Soil, 349, 169-182.
Koopmans J F, McDowell R W, Chardon W J, Oenema O, Dolfing J. 2002. Soil phosphorus quantity-intensity relationships to predict increased soil phosphorus loss to overland and subsurface flow. Chemosphere, 48, 679-687.
Laird D A, Fleming P, Davis D D, Horton R, Wang B Q, Karlen D L. 2010a. Impact of biochar amendments on the quality of a typical Midwestern agricultural soil. Geoderma, 158, 443-449.
Laird D A, Fleming P D, Wang B, Horton R, Karlen D L. 2010b. Biochar impact on nutrient leaching from a midwestern agricultural soil. Geoderma, 158, 436-442.
Lehmann J. 2007. Bio-energy in the black. Frontiers in Ecology and the Environment, 5, 381-387.
Lehmann J, Lan Z, Hyland C, Sato S, Solomon D, Ketterings Q M. 2005. Long-term dynamics of phosphorus forms and retention in manure-amended soils. Environmental Science and Technology, 39, 6672-6680.
Lehmann J, da Silva Jr J P, Steiner C, Nehls T, Zech W, Glaser B. 2003. Nutrient availability and leaching in an archaeological Anthrosol and a Ferralsol of the Central Amazon basin: fertilizer, manure and charcoal amendments. Plant and Soil, 249, 343-357.
Li X P, Shi X J, Liu P, Sui T. 2011. Environmental risk assessment about purple soil phosphorus loss-its
phosphorus ‘change-point’. Chinese Journal of Soil Science, 45, 1153-1158. (in Chinese)
Liang B, Lehmann J, Solomon D. 2006. Black carbon increases cation exchange capacity in soils. Soil Science Society of America Journal, 70, 1719-1730.
Maguire R O, Sims J T. 2002. Soil testing to predict phosphorus leaching. Journal of Environmental Quality, 31, 1601-1609.
Major J, Lehmann J, Rondon M, Goodale C. 2010. Fate of soil-applied black carbon: downward migration, leaching and soil respiration. Global Change Biology, 16, 1366-1379.
Murphy J, Riley J P. 1962. A modified single solution method for the determination of phosphate in natural waters. Analytica Chimica Acta, 27, 31-36.
Neri U, Diana G, Indiati R. 2005. Change point in phosphorus release from variously managed soils with contrasting properties. Communications in Soil Science and Plant Analysis, 36, 2227-2237.
Novak J M, Busscher W J, Laird D L, Ahmedna M, Watts D W, Niandou M A S. 2009. Impact of biochar amendment on fertility of a southeastern coastal plain soil. Soil Science, 174, 105-112.
Oguntunde P G, Abiodun B J, Ajayi A E, van de Giesen N. 2008. Effects of charcoal production on soil physical properties in Ghana. Journal of Plant Nutrition and Soil Science, 171, 591-596.
Peng X, Ye L L, Wang C H, Zhou H, Sun B. 2011. Temperature- and duration-dependent rice straw-derived biochar: Characteristics and its effects on soil properties of an Ultisol in southern China. Soil & Tillage Research, 112, 159-166.
Self-Davis M L, Moore P A, Joern B C. 2000. Determination of water- and/or dilute salt-extractable phosphorus. In: Pierzynski G M, ed., Methods of Phosphorus Analysis for Soils, Sediments, Residuals, And Waters. Southern Cooperative Series Bulletin No. 396. North Carolina State University, Raleigh. pp. 24-26.
Sharpley A N, Chapra S C,Wedepohl R, Sims J T, Daniel T C, Reddy K R. 1994. Managing agricultural phosphorus for protection of surface waters: issues and options. Journal of Environmental Quality, 23, 437-451.
Steiner C, Teixeira W G, Lehmann J, Nehls T, de Macêdo J L V, Blum W E H, Zech W. 2007. Long term effects of manure, charcoal and mineral fertilization on crop production and fertility on a highly weathered central Amazonian upland soil. Plant and Soil, 291, 275-290.
Thomas G. 1982. Exchangeable cations. In: Page A L, Miller R H, Keeney D R, eds., Methods of Soil Analysis. Part 2 Chemical and Microbiological Properties. 2nd ed. American Society of Agronomy, Madison, Wisconsin, USA. pp. 159-165.
Xu G, Wei L L, Sun J N, Shao H B, Chang S X. 2013. What is more important for enhancing nutrient bioavailability with biochar application into a sandy soil: Direct or

506 ZHAO Xiao-rong et al.
© 2014, CAAS. All rights reserved. Published by Elsevier Ltd.
indirect mechanism? Ecological Engineering, 52, 119-124.
Yao Y, Gao B, Zhang M, Inyang M, Zimmerman A R. 2012. Effect of biochar amendment on sorption and leaching of nitrate, ammonium, and phosphate in a sandy soil. Chemosphere, 89, 1467-1471.
Yuan J H, Xu R K. 2010. The amelioration effects of low temperature biochar generated from nine crop residues on an acidic Ultisol. Soil Use and Management, 27, 110-115.
Zhao X R, Zhong X Y, Bao H J, Li H H, Li G T, Tuo D B, Lin Q M, Brookes P C. 2007. Relating soil P
concentrations at which P movement occurs to soil properties in Chinese agricultural soils. Geoderma, 142, 237-244.
Zhang J H, Lin Q M, Zhao X R. 2014. The hydrochar characters of municipal sewage sludge under different hydrothermal temperatures and durations. Journal of Integrative Agriculture, 13, 471-482.
van Zwieten L, Kimber S, Morris S, Chan Y K, Downie A, Rust J, Joseph S, Cowie A. 2010. Effect of biochar from slow pyrolysis of papermill waste on agronomic performance and soil fertility. Plant and Soil, 327, 235-246.
(Managing editor SUN Lu-juan)