document resume - files.eric.ed.gov · document resume. 24. he 001 549. kerpelman, ... of variance...
TRANSCRIPT
ED 038 946
AUTHORTITLE
INSTITUTIONSPONS AGENCY
SUPEAU NOPUS DATEGRANTNOTE
EDPS PRICEDESCRIPTORS
ABSTRACT
DOCUMENT RESUME
24 HE 001 549
Kerpelman, Larry C.Student Activism and Ideology in Higher educationInstitutions. Final Peport.Massachusetts Univ., Amherst. Dept. of Psychology.Office of Education (DHEW), Washington, D.C. Pureauof Research.PP -8 -A -028
Mar 70OEG- 1- 8- 08A02S- 0032 -058130p.
EDPS Price MF-$0.75 HC-$6.60*Activism, Attitudes, *Higher Education, PersonalityAssessment, *Personality Studies, *PoliticalAttitudes, *Students
To identify the characteristics of activists andnonactivists, 22Q students at 3 institutions were studied. Thestudents were divided into 6 groups: left, moderate, and radicalactivists; left, moderate, and radical non-activists. Theinstitutions were a small private liberal arts college, amedium-sized private university, and a large public university.Researchers met with the students in small groups on each campus andadministered, in a 2 hour session, questionnaires. These instrumentsmeasured intelligence, personality, attitudes, values, extent ofpolitical activism, and political ideology. The anonymity ofindividuals and organizations was guaranteed. Results indicated thatsignificant personality differences existed only between tho 2 majorgroups of activists and non-activists. Activists were moreindependent, more sociable, more socially ascendant and moreassertive. Right activists and right non-activists were highest on"Authoritarianism" and left activists lowest. Right and leftactivists were both highest on "Autonomy." (NF)
M FINAL REPORT
(:) Project No. 8-A-028Grant No. OEG-1-8-08A028-0032-058
C:3
STUDENT ACTIVISM AND IDEOLOGY IN HIGHEREDUCATION INSTITUTIONS
Larry C. Kerpelman
Department of Psychology
University of Massachusetts
Amherst, Massachusetts 01002
March 1970
The research reported herein was performed pursuant toa grant with the Office of Education, U. S. Departmentof Health, Education, and Welfare. Contractors under-taking such projects under Goverment sponsorship areencouraged to express freely their professional judg-ment in the conduct of the project. Points of view oropinions stated do not, therefore, necessarily repre-sent official Office of Education position or policy.
U. S. DEPARTMENT OFHEALTH, EDUCATION, AND WELFARE
Office of EducationBureau of Research
ACKNOWLEDGMENTS
The research project on student activism and ideology reportedhere required the assistance of many people--for obtaining subjects,for coordinating and scheduling the administration of the researchinstruments, for analyzing the data, and for critically reading thisfinal report in its formative stages. I wish to thank Charlene Doyleand Jeanne Ann Pezzoli, who served as my able research assistants onthis project, and Elaine Youngblood and Diana Scriver, who providedextremely efficient secretarial assistance. I was fortunate to have,on each campus at which this research was conducted, a consultant whoserved as liaison person with the student organizations involved andwho helped coordinate the myriad details requisite to my administra-tion of the research procedures at each institution. Because I havepromised anonymity to the institutions that participated in thisstudy, these consultants must remain unnamed. I owe a very deep debtof gratitude to the students who participated as subjects in thisresearch. They, too, are anonymous, even to me, but without theircooperation, this study could not have been conducted.
I want to acknowledge, also, the contributions of my wife, JoanKerpelman, who had to spend many evenings alone while I ran subjectsand wrote this report, and yet who still could retain enough objec-tivity about this project to type the first draft of this report, tocritically evaluate early versions of it, and to give me valuablecomments and advice. Two other colleagues, Morton Harmatz andCastellano Turner, also read initial drafts of part of this reportand offered helpful comments. All pointed out inaccuracies and in-consistencies in earlier versions of this report, but, of course, Iam entirely responsible for those that remain.
Finally, I wish to thank the publishers who granted permissionto quote passages from copyrighted material, as follows:
Allyn and Bacon, Incorporated, for permission to reproducethe passage on page 3, reprinted from "Activism and apathyin contemporary adolescents" by Jeanne H. Block, NormaHaan and M. Brewster Smith, in James F. Adams (Ed.), Under-standing adolescence: Current developments in adolescentpsychology, pp. 198-231. Copyright 1968 by Allyn andBacon, Incorporated, Boston.
Science Research Associates, Incorporated, for permissionto reproduce the passage on pages 15-16, reprinted from
iii
the Manual of Survey of Interpersonal Values by Leonard
V. Cordon. Copyright 1960 by Science Research Associ-
ates, Incorporated, Chicago.
Permission to reproduce these copyrighted materials has been
granted by the copyright owners to the Educational Resources Informa-
tion Center (ERIC) and to the organizations operating under contract
with the Office of Education to reproduce ERIC documents. Reproduc-
tion by users of any copyrighted material contained in documents
disseminated through the ERIC system requires permission of the copy-
right owner.
LIST OF TABLES
LIST OF FIGURES
SUMMARY
TABLE OF CONTENTS
ix
xv
Chapter I. Introduction1
Problems in Previous Research 2
Confounding activism and ideology 2Nonactivist controls 3Measuring instruments 4Institutional comparability 6Criteria for selection 6
Overview of the Present Study 7
Chapter II. Method 10
The Institutions 10
Smithvale College 11
Burgess University 11
University of Camden 11
The Organizations 13
Left activist organizations 14Middle activist organizations 14Right activist organizations 14Nonactivist organizations 14
The Instruments 14
Code Number Instructions 14Control Test AA 15
1
vi
Survey of Interpersonal Values 15
Gordon Personal Profile a 16
Politico-Economic Conservatism Scale 16
Activity Scale 17
Quick Word Test 17
Guilford-Zimmerman Temperament Survey 17
Campus Activities List 18
Procedure 18
Chapter III. Results 20
Organization Preratings 20
Criterion Screening 23
Characteristics of the Samples 27
Personality, Attitude, and Intelligence Measures 37
Activism 38
Intellectual ability 42Emotional stability 42Social acceptance 42Ascendancy and assertiveness 51
Sociability 58
Concern for others 58
Responsibility 58
Objective thinking 58
"Factors" Differentiating Groups 66
Supplementary Results 71
Chapter IV. Discussion 75
Criterion Variables 75
Demographic Characteristics 77
Main Results 78
Intellectual characteristicsEmotional stabilitySocial acceptanceAscendancy and assertivenessSociabilityConcern for othersResponsibility
80808182
82
8383
vii
Objectivity 83
Commitment 83
Methodological Implications 84
Conceptual Implications 85
REFERENCES . 87
APPENDIX A: Form of Organization Rating Sheet(all identifying information removed) 91
APPENDIX B: Noncopyrighted Instruments 93
APPENDIX C: Cochran's Tests 97
APPENDIX D: Analysis of Variance Summary Tables 99
LIST OF TABLES
Table Page
1 Characteristics of the Institutions 12
2 Political Ideology Preratings of Target Organizationsby Political Science Faculty at Smithvale College . . . . 21
3 Political Ideology Preratings of Target Organizations byPolitical Science Faculty at the University of Camden . . 22
4 Politico-Economic Conservatism Scale Raw Score Datafor Activist Groups Before Criterion Screening 25
5 Politico-Economic Conservatism Scale Raw Score Datafor Nonactivist Groups Before Criterion Screening . . . 26
6 Descriptive Data for Politico-Economic ConservatismScale After Criterion Screening 28
7 Descriptive Data for Organization Membership 29
8 Descriptive Data for Sex 31
9 Descriptive Data for Major 32
10 Descriptive Data for Age 33
11 Descriptive Data for Year in School 34
12 Descriptive Data for Years at Institution 35
13 Descriptive Data for Number of Activities 36
14 Descriptive Data for Activism-Actual Scale 39
15 Descriptive Data for Activism-Desired Scale . . . 41
16 Descriptive Data for Quick Word Test 43
17 Descriptive Data for Control Test AA 44
18 Descriptive Data for Cordon Personal ProfileEmotional Stability Scale 45
ix
Tab IA,
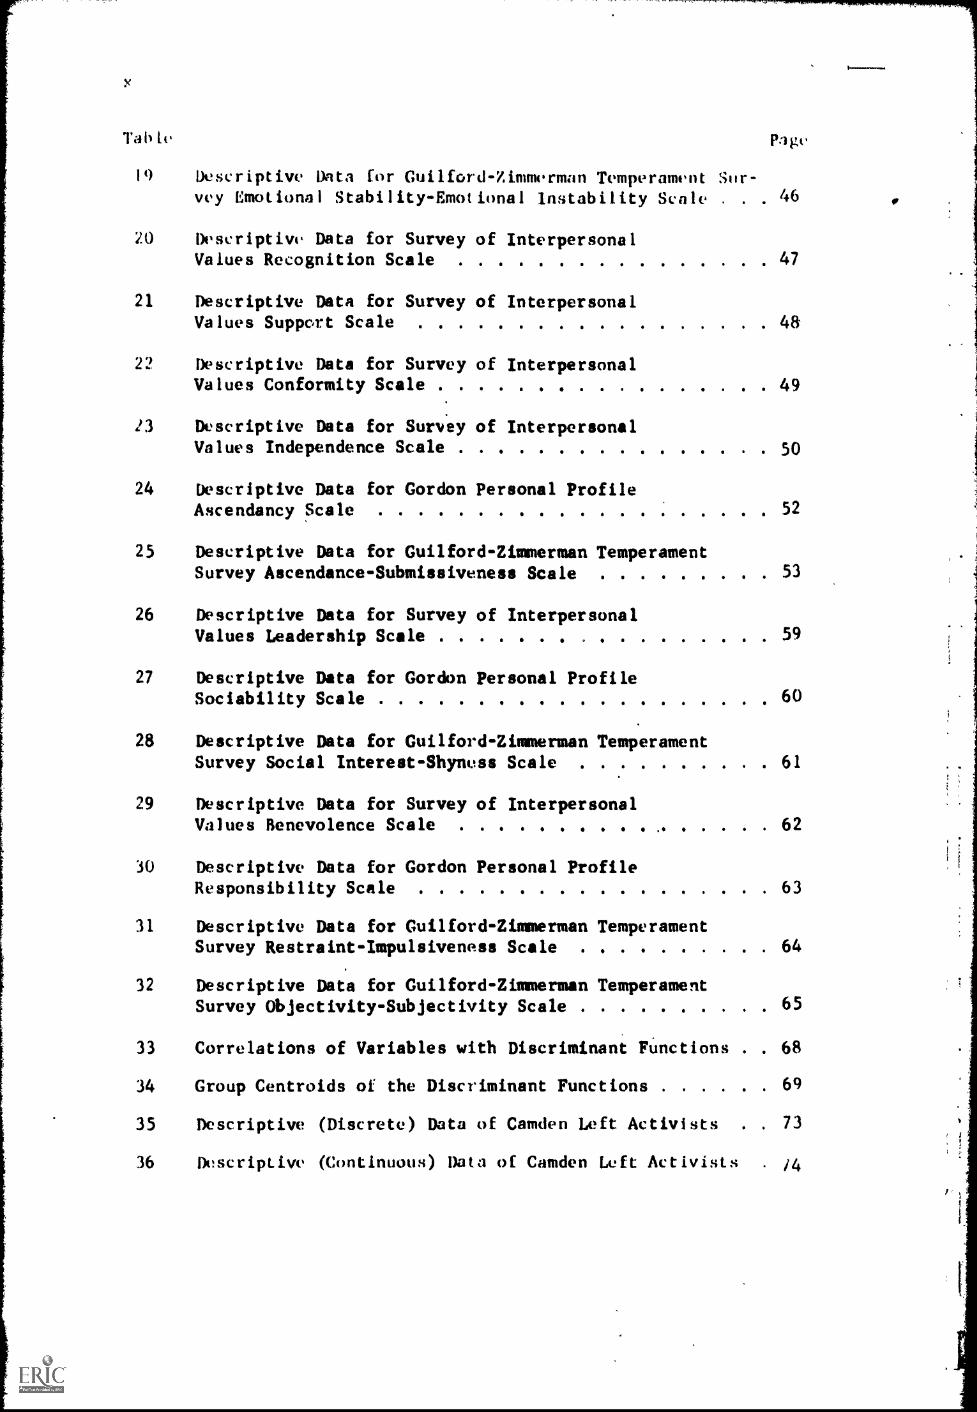
I9) Descriptive Data for Cuilford-Zimmerman Temperament Sur-vey Emotional Stability-Emotional Instability Scale . 46
20 Descriptive Data for Survey of InterpersonalValues Recognition Scale 47
21 Descriptive Data for Survey of InterpersonalValues Support Scale 48
22 Descriptive Data for Survey of InterpersonalValues Conformity Scale ...... . ...... . . . . 49
13 Descriptive Data for Survey of InterpersonalValues Independence Scale 50
24 Descriptive Data for Gordon Personal ProfileAscendancy Scale 52
25 Descriptive Data for Guilford-Zimmerman TemperamentSurvey Ascendance-Submissiveness Scale 53
26 Descriptive Data for Survey of InterpersonalValues Leadership Scale 59
27 Descriptive Data for Gordon Personal ProfileSociability Scale 60
28 Descriptive Data for Guilford-Zimmerman TemperamentSurvey Social Interest-Shyness Scale 61
29 Descriptive Data for Survey of InterpersonalValues Benevolence Scale 62
30 Descriptive Data for Gordon Personal ProfileResponsibility Scale 63
31 Descriptive Data for Guilford-Zimmerman TemperamentSurvey Restraint-Impulsiveness Scale 64
32 Descriptive Data for Guilford-Zimmerman TemperamentSurvey Objectivity-Subjectivity Scale 65
33 Correlations of Variables with Discriminant FUnctions . 68
34 Group Centroids of the Discriminant Functions 69
35 Descriptive (Discrete) Data of Camden Left Activists . 73
36 Descriptive (Continuous) Data of Camden Left Activists 14
xi
Tablo Page
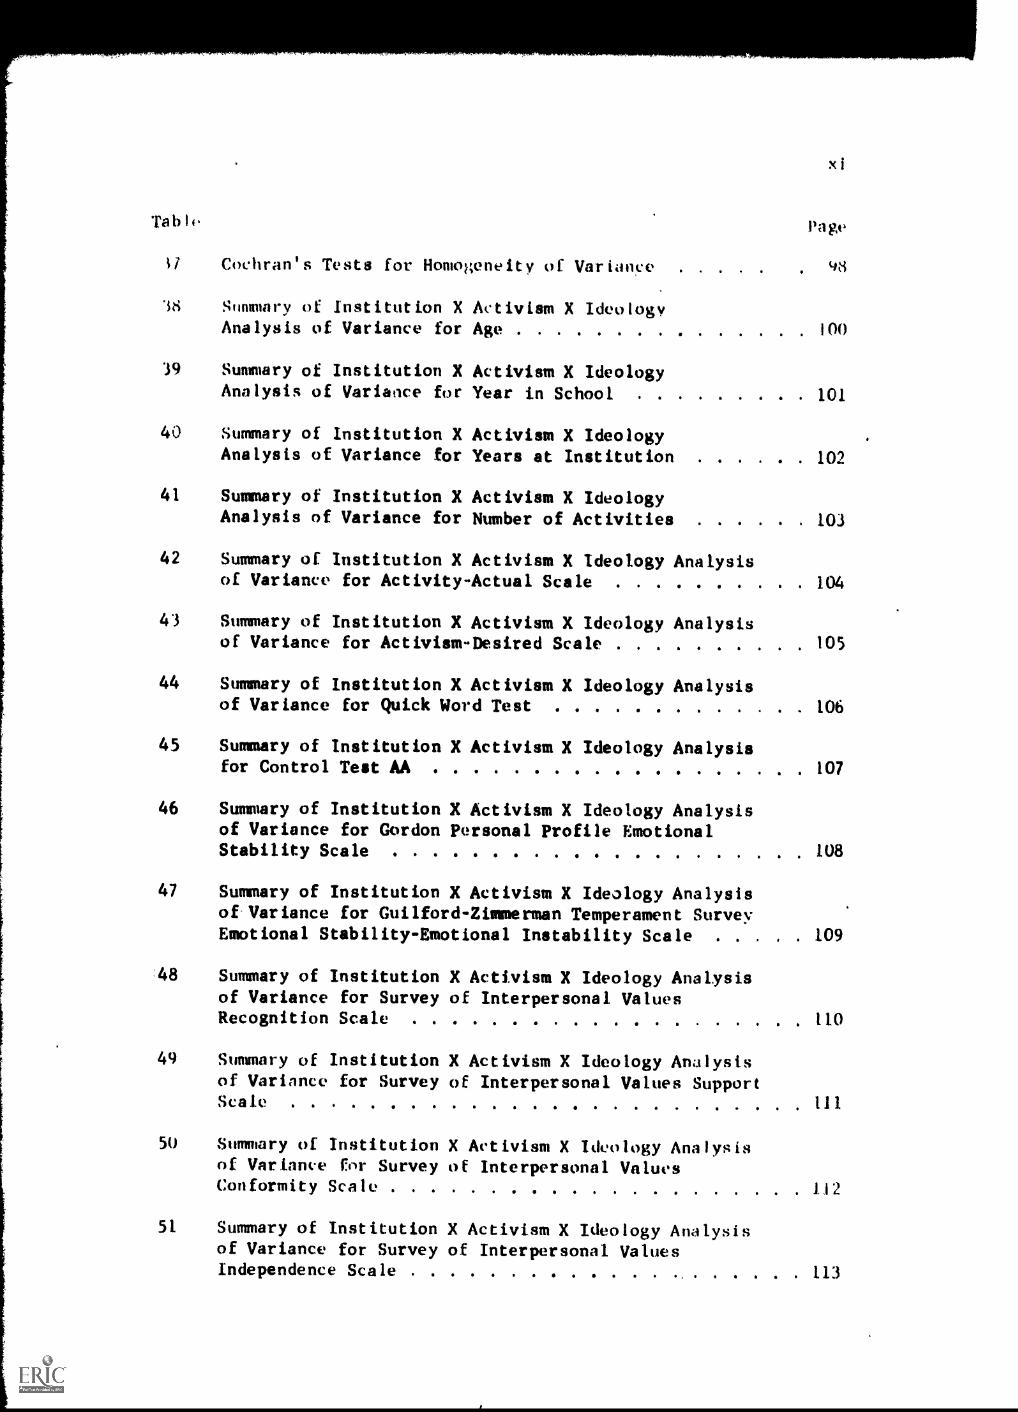
17 Cochran's Tests for Homogeneity of Variance 48
18 Summary of Institution X Activism X IdeologyAnalysis of Variance for Age 100
39 Summary of Institution X Activism X IdeologyAnalysis of Variance for Year in School . . .... 101
40 Summary of Institution X Activism X IdeologyAnalysis of Variance for Years at Institution . . . 102
41 Summary of Institution X Activism X IdeologyAnalysis of Variance for Number of Activities . . 103
42 Summary of Institution X Activism X Ideology Analysisof Variance for Activity-Actual Scale ..... . . 104
43 Summary of Institution X Activism X Ideology Analysisof Variance for Activism-Desired Scale 105
44 Summary of Institution X Activism X Ideology Analysisof Variance for Quick Word Test 106
45 Summary of Institution X Activism X Ideology Analysisfor Control Test AA 107
46 Summary of Institution X Activism X Ideology Analysisof Variance for Gordon Personal Profile EmotionalStability Scale 108
47 Summary of Institution X Activism X Ideology Analysisof Variance for Guilford-Zimmerman Temperament SurveyEmotional Stability-Emotional Instability Scale . . 109
48 Summary of Institution X Activism X Ideology Analysisof Variance for Survey of Interpersonal ValuesRecognition Scale 110
49 Summary of Institution X Activism X Ideology Analystsof Variance for Survey of Interpersonal Values SupportScale 111
50 Summary of Institution X Activism X Ideology Analysisof Variance for Survey of Interpersonal ValuesConformity Scale 112
51 Summary of Institution X Activism X Ideology Analysisof Variance for Survey of Interpersonal Valuesindependence Scale 113
xii
Tab lc
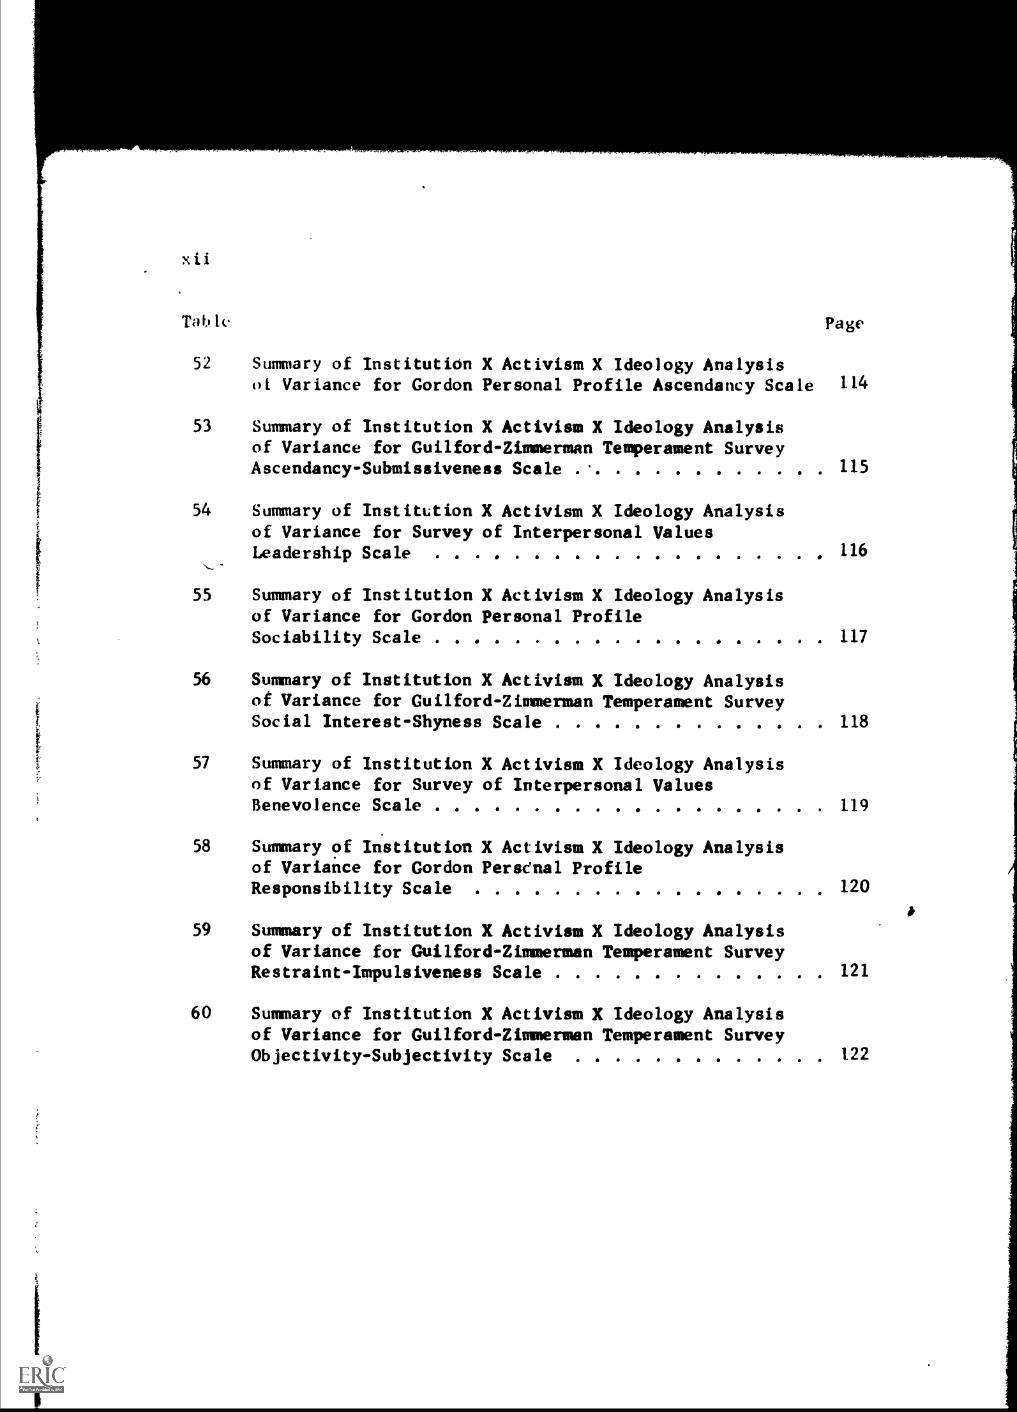
52 Summary of Institution X Activism X Ideology Analysis01 Variance for Gordon Personal Profile Ascendancy Scale
53 Summary of Institution X Activism X Ideology Analysisof Variance for Guilford-Zimmerman Temperament SurveyAscendancy-Submissiveness Scale
54 Summary of Institution X Activism X Ideology Analysisof Variance for Survey of Interpersonal ValuesLeadership Scale
Page
114
115
116
55 Summary of Institution X Activism X Ideology Analysisof Variance for Gordon Personal ProfileSociability Scale 117
56 Summary of Institution X Activism X Ideology Analysisof Variance for Guilford-Zimmerman Temperament SurveySocial Interest-Shyness Scale 118
57 Summary of Institution X Activism X Ideology Analysisof Variance for Survey of Interpersonal ValuesBenevolence Scale 119
58 Summary of Institution X Activism X Ideology Analysisof Variance for Gordon Persenal ProfileResponsibility Scale 120
59 Summary of Institution X Activism X Ideology Analysisof Variance for Guilford-Zimmerman Temperament SurveyRestraint-Impulsiveness Scale 121
60 Summary of Institution X Activism X Ideology Analysisof Variance for Guilford-Zimmerman Temperament SurveyObjectivity-Subjectivity Scale 122
'figure
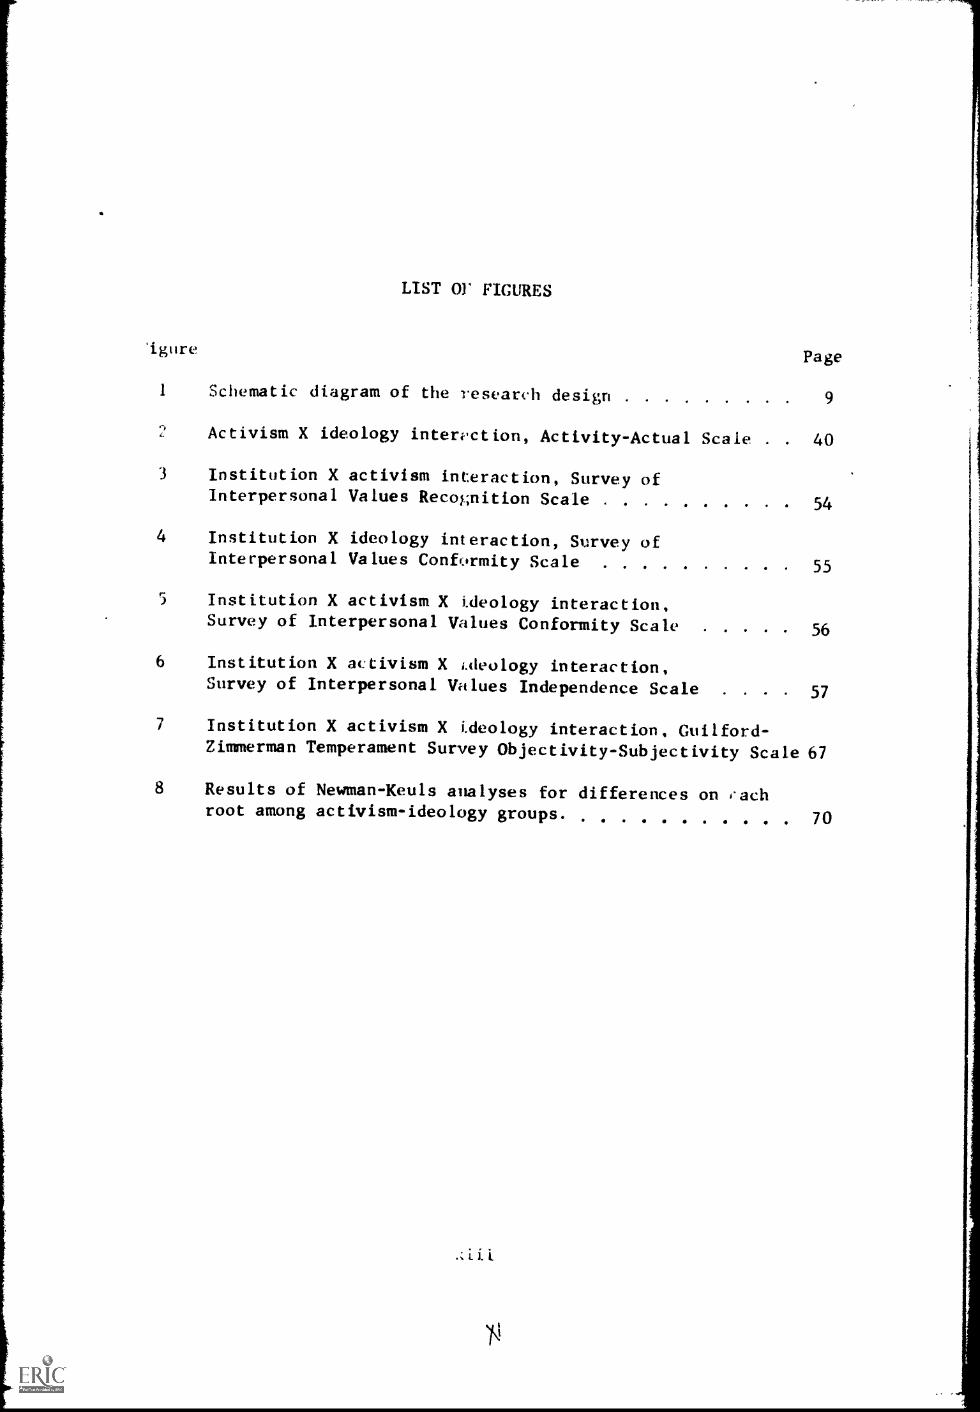
LIST OF FIGURES
Page
Schematic diagram of the research design 9
Activism X ideology interaction, Activity-Actual Scale . . 40
3 Institution X activism interaction, Survey ofInterpersonal Values Recognition Scale .. 54
4 Institution X ideology interaction, Survey ofInterpersonal Values Conformity Scale
. . . 55
5 Institution X activism X ideology interaction,Survey of Interpersonal Values Conformity Scale 56
6 Institution X activism X Weology interaction,Survey of Interpersonal Values Independence Scale 57
7 Institution X activism X ideology interaction, Guilford-Zimmerman Temperament Survey Objectivity-Subjectivity Scale 67
8 Results of Newman-Keuls analyses for differences on eachroot among activism-ideology groups. 70
SUMMARY
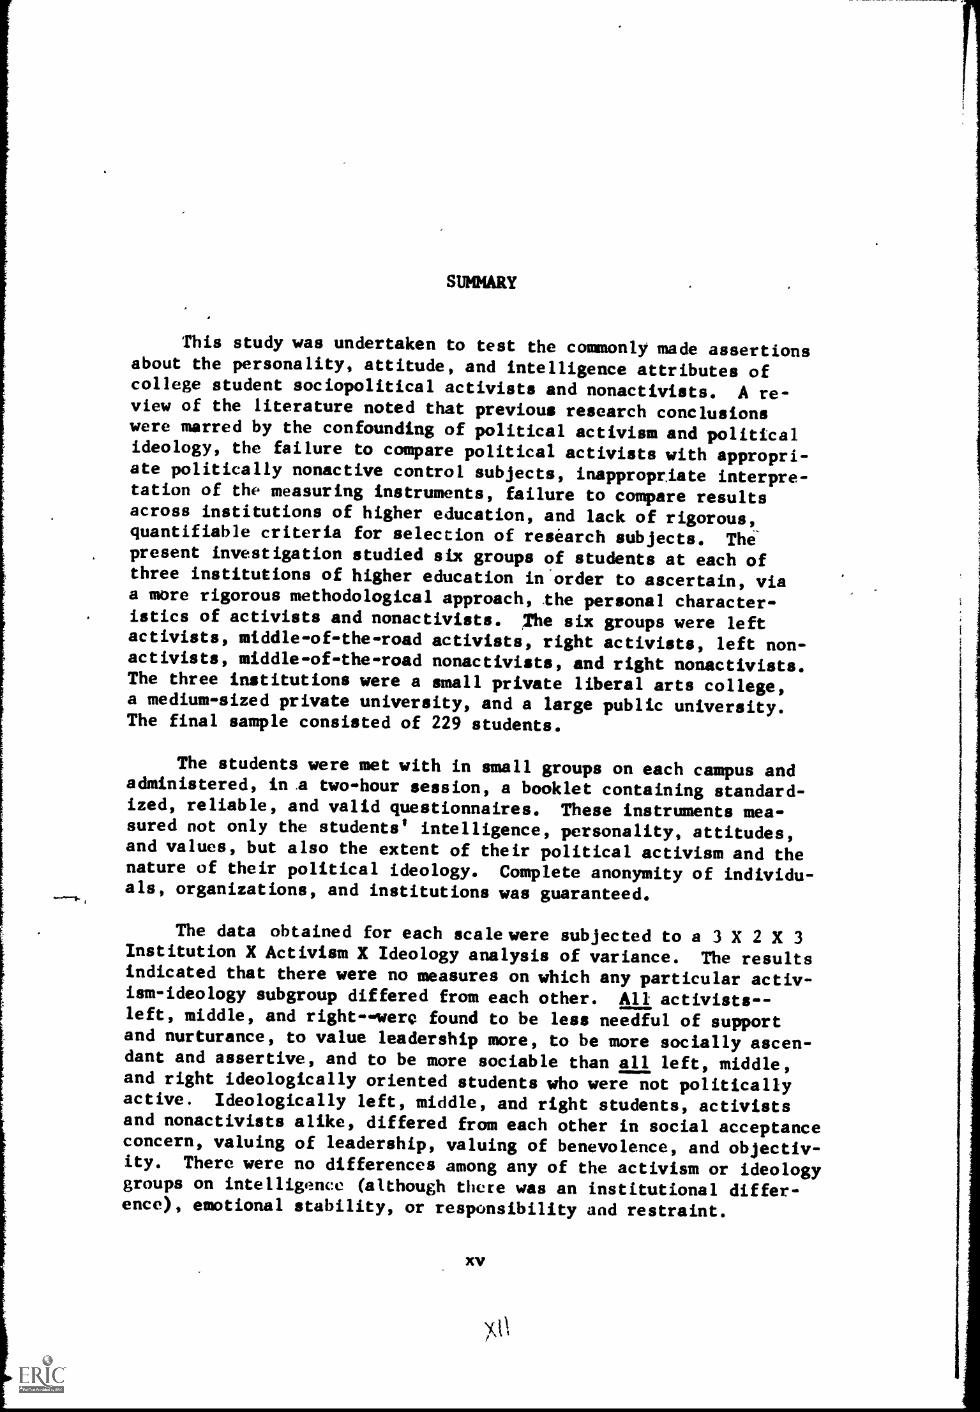
This study was undertaken to test the commonly made assertionsabout the personality, attitude, and intelligence attributes ofcollege student sociopolitical activists and nonactivists. A re-view of the literature noted that previous research conclusionswere marred by the confounding of political activism and politicalideology, the failure to compare political activists with appropri-ate politically nonactive control subjects, inappropriate interpre-tation of the measuring instruments, failure to compare resultsacross institutions of higher education, and lack of rigorous,quantifiable criteria for selection of research subjects. The-present investigation studied six groups of students at each ofthree institutions of higher education in'order to ascertain, viaa more rigorous methodological approach, the personal character-istics of activists and nonactivists. The six groups were leftactivists, middle-of-the-road activists, right activists, left non-activists, middle-of-the-road nonactivists, and right nonactivists.The three institutions were a small private liberal arts college,a medium-sized private university, and a large public university.The final sample consisted of 229 students.
The students were met with in small groups on each campus andadministered, in ,a two-hour session, a booklet containing standard-ized, reliable, and valid questionnaires. These instruments mea-sured not only the students' intelligence, personality, attitudes,and values, but also the extent of their political activism and thenature of their political ideology. Complete anonymity of individu-als, organizations, and institutions was guaranteed.
The data obtained for each scale were subjected to a 3 X 2 X 3Institution X Activism X Ideology analysis of variance. The resultsindicated that there were no measures on which any particular activ-ism-ideology subgroup differed from each other. All activists- -left, middle, and right--owere found to be less needful of supportand nurturance, to value leadership more, to be more socially ascen-dant and assertive, and to be more sociable than all left, middle,and right ideologically oriented students who were not politicallyactive. Ideologically left, middle, and right students, activistsand nonactivists alike, differed from each other in social acceptanceconcern, valuing of leadership, valuing of benevolence, and objectiv-ity. There were no differences among any of the activism or ideologygroups on intelligence (although there was an institutional differ-ence), emotional stability, or responsibility and restraint.
xv
xvi
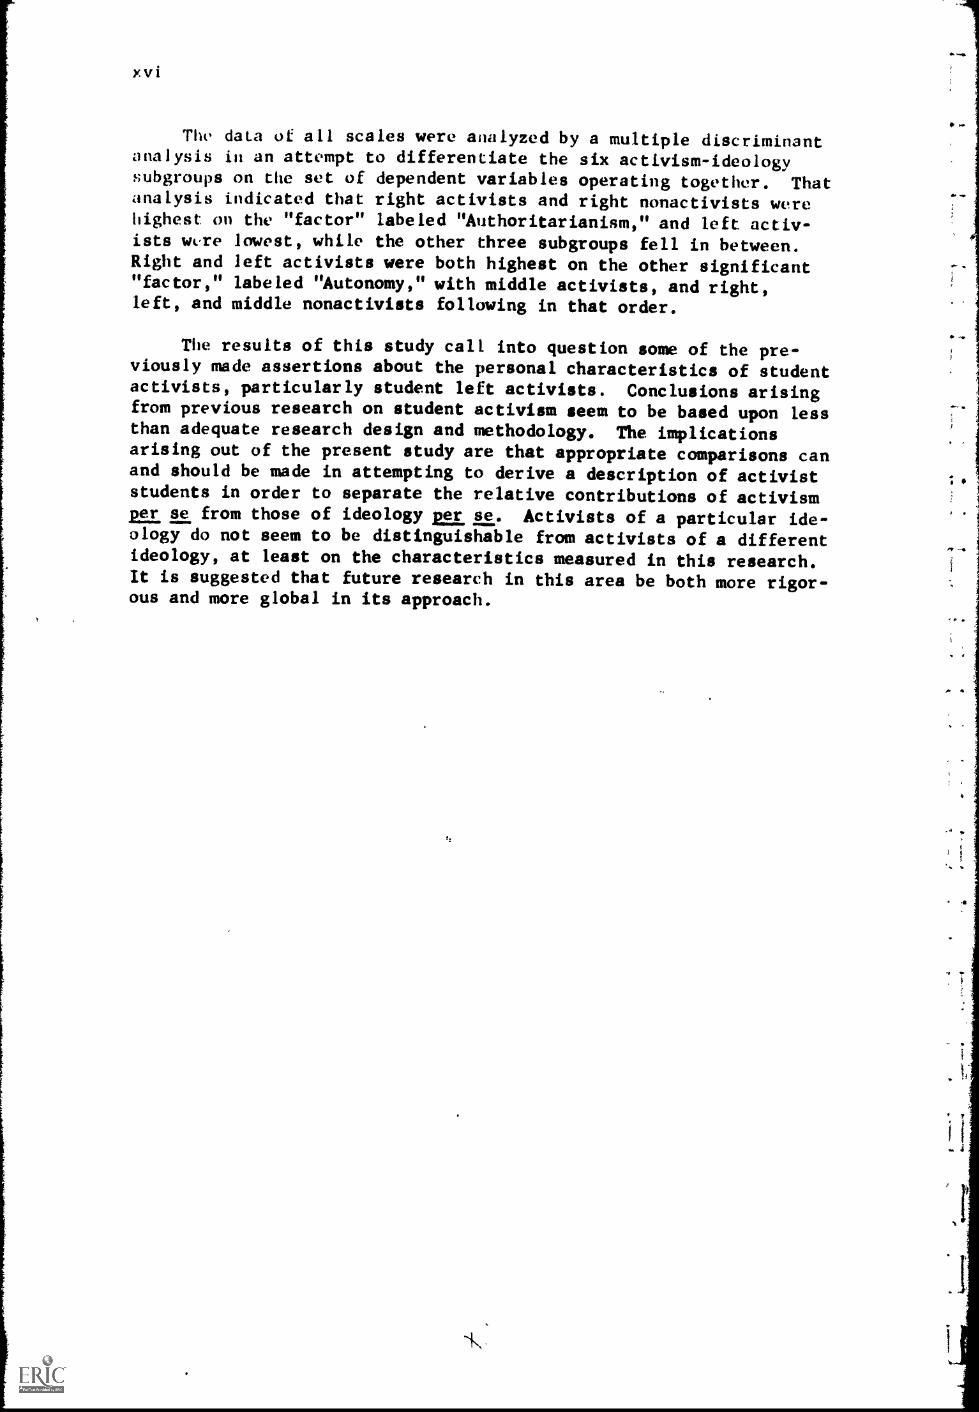
The data of all scales were analyzed by a multiple discriminantanalysis in an attempt to differentiate the six activism-ideologysubgroups on the set of dependent variables operating together. Thatanalysis indicated that right activists and right nonactivists werehighest on the "factor" labeled "Authoritarianism," and left activ-ists were lowest, while the other three subgroups fell in between.Right and left activists were both highest on the other significant"factor," labeled "Autonomy," with middle activists, and right,left, and middle nonactivists following in that order.
The results of this study call into question some of the pre-viously made assertions about the personal characteristics of studentactivists, particularly student left activists. Conclusions arisingfrom previous research on student activism seem to be based upon lessthan adequate research design and methodology. The implicationsarising out of the present study are that appropriate comparisons canand should be made in attempting to derive a description of activiststudents in order to separate the relative contributions of activismper se from those of ideology per se. Activists of a particular ide-ology do not seem to be distinguishable from activists of a differentideology, at least on the characteristics measured in this research.It is suggested that future research in this area be both more rigor-ous and more global in its approach.
CHAPTER I
INTRODUCTION
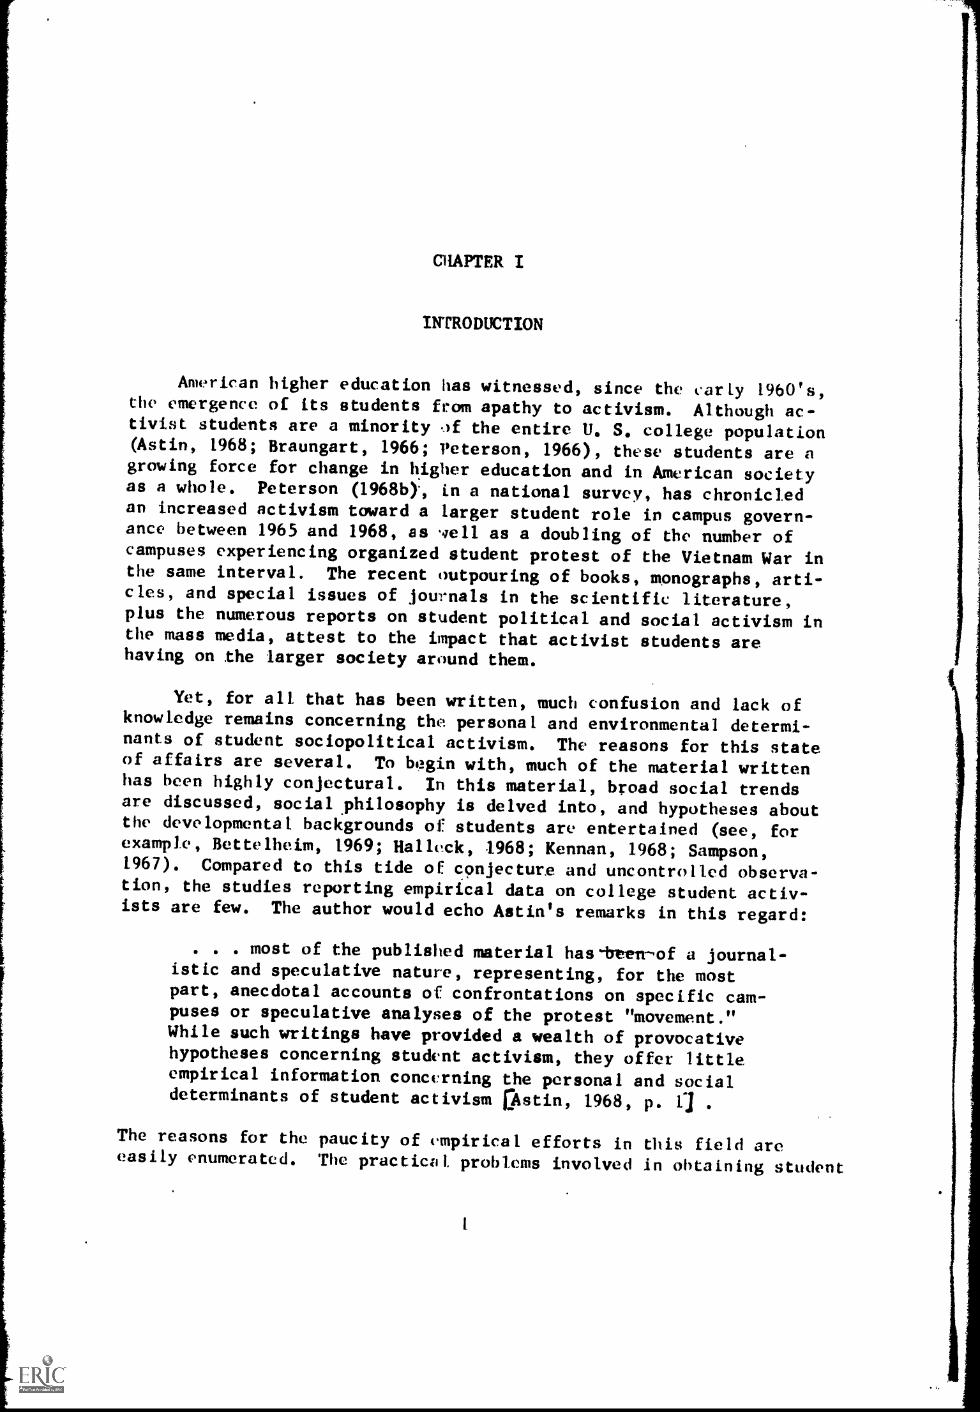
American higher education has witnessed, since the early 1960's,the emergence of its students from apathy to activism. Although ac-tivist students are a minority if the entire U. S. college population(Pisan, 1968; Braungart, 1966; Peterson, 1966), these students are agrowing force for change in higher education and in American societyas a whole. Peterson (1968b)*, in a national survey, has chronicledan increased activism toward a larger student role in campus govern-ance between 1965 and 1968, as as a doubling of the number ofcampuses experiencing organized student protest of the Vietnam War inthe same interval. The recent outpouring of books, monographs, arti-cles, and special issues of journals in the scientific literature,plus the numerous reports on student political and social activism inthe mass media, attest to the impact that activist students arehaving on the larger society around them.
Yet, for all that has been written, much confusion and lack ofknowledge remains concerning the personal and environmental determi-nants of student sociopolitical activism. The reasons for this stateof affairs are several. To begin with, much of the material writtenhas been highly conjectural. In this material, broad social trendsare discussed, social philosophy is delved into, and hypotheses aboutthe developmental backgrounds of students are entertained (see, forexample, Bettelheim, 1969; Halleck, 1968; Kennan, 1968; Sampson,1967). Compared to this tide of conjecture and uncontrolled observa-tion, the studies reporting empirical data on college student activ-ists are few. The author would echo Astin's remarks in this regard:
. . . most of the published material has-brenof a journal-istic and speculative nature, representing, for the mostpart, anecdotal accounts of confrontations on specific cam-puses or speculative analyses of the protest "movement."While such writings have provided a wealth of provocativehypotheses concerning student activism, they offer littleempirical information concerning the personal and socialdeterminants of student activism rAstin, 1968, p. .
The reasons for the paucity of empirical efforts in this field areeasily enumerated. The practical, problems involved in obtaining student
2
and institutional cooperation and confidence, in being on, or travel-ing to, campuses where activism is "hot," and in obtaining researchfunds, and the conceptual difficulties alluded to above and spelledout in detail below, are just a few of the more obvious problems. It
is thus understandable why scientific research on this phenomenon isin the unrefined state it is in at present.
problems in Previous Research
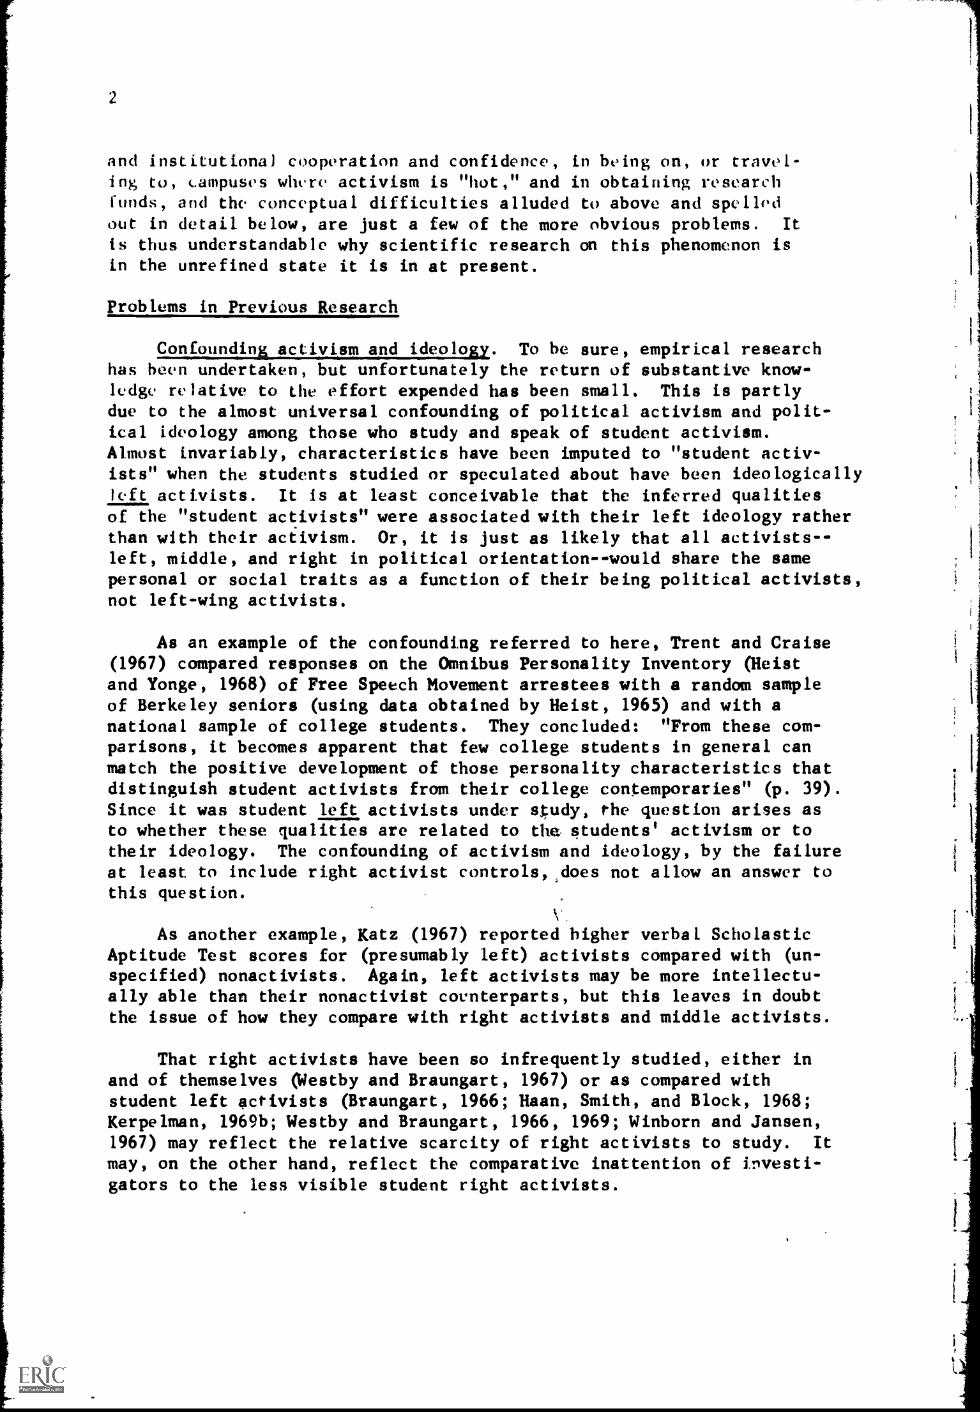
Confounding activism and ideology. To be sure, empirical researchhas been undertaken, but unfortunately the return of substantive know-ledge relative to the effort expended has been small. This is partlydue to the almost universal confounding of political activism and polit-
ti
ical ideology among those who study and speak of student activism.Almost invariably, characteristics have been imputed to "student activ-ists" when the students studied or speculated about have been ideologicallyleft activists. It is at least conceivable that the inferred qualitiesof the "student activists" were associated with their left ideology ratherthan with their activism. Or, it is just as likely that all activists- -left, middle, and right in political orientation--would share the samepersonal or social traits as a function of their being political activists,not left-wing activists.
As an example of the confounding referred to here, Trent and Craise(1967) compared responses on the Omnibus Personality Inventory (Heistand Yonge, 1968) of Free Speech Movement arrestees with a random sampleof Berkeley seniors (using data obtained by Heist, 1965) and with anational sample of college students. They concluded: "From these com-parisons, it becomes apparent that few college students in general canmatch the positive development of those personality characteristics thatdistinguish student activists from their college contemporaries" (p. 39).Since it was student left activists under study, the question arises asto whether these qualities are related to Ova students' activism or totheir ideology. The confounding of activism and ideology, by the failureat least to include right activist controls,,does not allow an answer tothis question.
As another example, Katz (1967) reported higher verbal ScholasticAptitude Test scores for (presumably left) activists compared with (un-specified) nonactivists. Again, left activists may be more intellectu-ally able than their nonactivist counterparts, but this leaves in doubtthe issue of how they compare with right activists and middle activists.
That right activists have been so infrequently studied, either inand of themselves ( Westby and Braungart, 1967) or as compared withstudent left activists (Braungart, 1966; Haan, Smith, and Block, 1968;Kerpelman, 1969b; Westby and Braungart, 1966, 1969; Winborn and Jansen,1967) may reflect the relative scarcity of right activists to study. It
may, on the other hand, reflect the comparative inattention of investi-gators to the less visible student right activists.
3
Upset (1968), Kerpelman (1969b), and Block, Haan, and Smith(1968) all independently have proposed the separation of activismand ideology in investigations of student political activism. TheLatter authors have succinctly stated this view thus:
Although there has been a tendency to equate social in-volvement and political activism with liberal politics, wehave been impressed by the existence of an active protestgroup with a conservativ't political philosophy. The con-tinuing presence of such individuals requires that activismbe defined independently of political ideology if we are toextricate the correlates of activism Ls se from those ofliberalism per se (pock, Haan, and Smith, 1968, p. 2081.
Without instituting appropriate comparative studies in which studentswith different political ideologies are sampled within the activismdimension, it is impossible to state with certainty just what theattributes of the "new left" are and how these distinguish them from"radical right" or "moderate middle" activists.
Nonactivist controls. A further problem with some of the stu-dent activism research lies in the failure of many investigators toprovide for appropriate nonactivist control groups. If no controlgroups are compared with student activists, it is difficult, if notimpossible, to determine whether or not the characteristics ascribedto the activists are actually characteristics common to all collegestudents. Keniston's (1968) intensive interview study of a group ofVietnam Summer volunteers provides interesting insights into thebackgrounds and motivations of a highly committed group of left ac-tivist students. Yet, because of the absence of appropriate controls,unanswered questions remain concerning the qualities that are uniqueto these students and those that are common to all college students.
Even if control group procedures are instituted, the controlsmust be appropriate if interpretation of the data obtained is to bemeaningful. Relatively little is revealed if personality and back-ground characteristics of a sample of student left activists are com-pared with those of a sample of nonactivist students, as Flacks (1967),Heist (1965), Trent and Craise (1967), and Watts and Whittaker (1966),for example, have done. Within the category of students called "non-activists" may be students of left and right persuasion. It is obvi-ous that if ideology is not accounted for, then conclusions that arebased upon comparisons between left activists and nonactivists of un-known ideology are tenuous at best.
Furthermore, randomly selected nonactivist controls are frequentlynot matched with activists in what, for want of a better term, could becalled. participatory activity. Members of activist groups share atleast one feature in common--they all participate in a group. Selec-tion, as control subjects, of students who may or may not belong to anorganized group may then be misleading, for qualities thought to be
4
associated with activism may merely be qualities associated with par-ticipatory activity. While perhaps trivial, this is a factor thatshould at least be considered in investigations of student activists.None of the studies referred to above which used nonactivist controlsselected those control subjects from extant, nonpolitical campusorganizations.
Measuring instruments. Because many research investigations ofstudent activism have been stimulated by momentary events (such assit-ins and demonstrations), the measures of personality and intellec-tual traits used have frequently been hastily chosen and inappropri-ately applied. It has also been the case that, due to practicaldifficulties, indirect measures rather than direct ones have beentaken of students' personality, intellectual, and value attributes.Finally, investigators have been prone to interpret personality meas-ures loosely and to make unwarranted positive value judgments aboutpersonality traits. The result has been that a seemingly firm bodyof knowledge has been built upon a very shaky data base.
Some examples might elucidate these assertions. As quoted above,Trent and Craise (1967) spoke of (left) activists' personality char-acteristics in very positive terms. Closer examination of the sevenOmnibus Personality Inventory (OPI) Scales, which served as the basisfor their assertions, reveals that three scales have to do with intel-lectual orientation, two scales assess the respondents on liberalnessand conservativeness,and only two scales are concerned with ego func-tioning (Heist and Yonge, 1968). Of the latter two scales, the leftactivists scored higher in Impulse Expression and lower on Lack ofAnxiety. The former scale, if extremely high (as the activists' meanscore approached being), can indicate "frequent feelings of rebellionand aggression" (Heist and Yonge, 1968, p. 5). A lower score on thelatter scale indicates a higher anxiety level. It is thus difficultto see how, on the basis of these data, Trent and Craise (1967) canconclude that "few college students in general can match the positivedevelopment of those personality characteristics that distinguishstudent left activists from their college contemporaries" (p. 39).It is further interesting to note that Trent and Craise's report of theOPI data from Heist (1965) failed to include the scores on two egofunctioning scales (Social Alienation and Social Introversion) thatwould indicate that the left activists studied were more withdrawn andisolated than their nonactixist counterparts.
Although Heist (1965) did not extrapolate from his data in themanner described above, other authors have. Katz (1961) cited thesesame data, among others, to supEort his assertions about " . . . thestrength and richness of their Lleft activists'] intellectual, aes-thetic, and emotional endowment" (p. 16). This conclusion, in thiswriter's opinion, is unwarranted on the basis of the empirical datafrom which it is drawn. Indeed, there are recent studies which indi-cate, contrary to the assertions of Katz (1967), Trent and Craise (1967),
5
and Bay (1967), that left activists may be less adjusted, in certainrespects, than their nonactivist, nonleftist counterparts. Whittakerand Watts (1968) found, for example, that, while their left activistsubjects were more autonomous and sought change of routine more thana cross-section of students, the former students also had less self-control, were more emotionally labile, saw themselves as less ad-justed, were more exhibitionistic, and were more aggressive than thelatter students. The point of this is not to say that certain per-sonality traits are more desirable than others: the point is simplyto suggest that conclusions about "positive" personality traits needto be thought through more carefully than has been the case thus farwith statements about the personality characteristics of left activ-ists. Clearly, statements of such certitude as those:of Katz and ofTrent and Craise, quoted above, are unwarranted at the present time.
Nowhere is the tendency to draw unwarranted conclusions, basedupon inappropriate measures, so pronounced as it is in the area ofintellectual ability of student left activists. The departures fromnormal scientific practices are, for some reason, so numerous inthis area that only brief mention can be made of them. Somers (1965)referred to higher self-reported grade point averages of a sample ofleft activists at Berkeley as an indication of greater intelligence.Bay (1967) and Katz (1967) both'cited this in support of their assump-tions concerning the superior intellectual ability of student leftactivists. Yet Watts and Whittaker (1966), examining actual gradepoint average records, found no differences between left activistsand nonactivist students at Berkeley. Even more pertinent was Gellerand Howard's (1969) finding that their sample of left activists atYale viewed themselves as hither in class standing than did their sam-ple of nonactivists, even though substantive evidence of academicability (College Entrance Examination Board scores, high school rank,actual grade point average) revealed no differences between the twogroups. This seriously calls into question the accuracy of self-reported grade point averages. Heist (1965) reported significantlyhigher grade point averages of left activists based upon registrar'sdata, but the absence of supporting numerical data makes it diffi-cult to compare his findings with those reported elsewhere. Katz(1967) even cited Flacks (1967) to support his assertion that leftactivists have higher grade point averages than nonactivists, eventhough the latter's data were based upon self-reported grade pointaverages, the reported mean grade point average of the activists wasonly "slightly higher" than that of the nonactivists, and numerical'data and tests of statistical significance were not reported.
Grade point average is at best a very indirect measure of intel-ligence. Yet even more indirect measures have often been cited tosupport the assertion that left activists arc more intelligent thannonactivists. Heist's (1965) data on the Intellectual DispositionCategories of the Omnibus Personality Inventory have been cited fre-quently in support of contentions "that many of these students are themost bright and able students to be found on the nation's campuses" (Trent
and Clais( , 1967, p. 38) ; "that the activists are recruited particu-larly from the intellectually able and interested students" (Katz,967, p. 14) ; and that there is "at: apparent preponderance of intel-ligence and in resources on the left side of the politicalspectrum" (Bay, 1967, p. 76). Yet the Intellectual Disposition Cate-gory is simply an index of an "intellectual-scholarly disposition,"not intelligence per se. "The abstnce of intrinsic intellectualinterests does not correlate strongly with poor academic achievement
" (Heist and Yonge, 1968, p. 25). The six scales that comprisethe intellectual Disposition Category correlate only slightly and onthe whole nonsignificantly with measures of academic aptitude (Heistand Yonge, 1968, especially Tables 9, 10, and 16).
Only two studies attempted to measure the intelligence of activ-ists directly. One reported a slightly higher mean verbal intelligencetest score for a group of student ]eft activists than for a group ofrandomly selected nonactivist students (Watts, Lynch, and Whittaker,1969). Unfortunately, tests of statistical significance were not re-ported for these data; it appears that the difference was so small asto be nonsignificant. The second Investigation reported a statisti-cally significant higher mean verbal intelligence test score for activ-ist, as contrasted with nonactivist , students, but this was for ideo-logically 1(..ft, middle, and right activists combined as contrasted withleft, middle, and right nonactivists combined. There was no significantinteraction to indicate that left activists alone scored higher on thismeasure than did any other subgroup (Kerpelman, 1969b).
Institutional comparability. The nature of the student activismphenomenon calls for examination that extends beyond any particularhigher education institution. Practicalities frequently prohibit theinvestigation of student activism at more than one campus at a time.Since this usually means that different methodologies and measurementsprevail in each investigation, comparability of results suffers. Al-most all of the studies cited abov have been studies of student socio-political activity on one campus. Only three studies (Braungart, 1966;Flacks, 1967; Haan, Smith, and Block, 1968) examined students frommore than one campus, and only Peterson's (1968b) mail survey of thescope of organized student protest, and Astin's (1968) large-scalelongitudinal study of college students attempted to examine differencesamong institutions. While the sum total of separate researches atseparate campuses may yield useful findings and provocative hypotheses,the heterogeneity of methodologies and instruments used makes it dif-ficult to obtain a more global picture of the student activism phenom-enon. Indeed, group of Fellows vt the Center for Advanced Study inthe Behavioral Sciences (1968) recently put forth a call for a morecomprehensive and objective survey of the determinants of student activ-ism than had heretofore been done. It would seem, thus, that a usefulway to study activism would be to :.ample campuses as well as activists.
Criteria for selection. The issue of the criteria used for
scivktion of act ivist, students is obviously an important one. Sell-identification of subjects as belonging to an activist organizationhas been accepted generally as a selection criterion in research onactivism. In only a few studies (Geller and Howard, 1969; Kerpelman,196Sb) has an attempt been made, in addition, to obtain a quantita-tive index of extent of political activism. Even fewer studiel (e.g.,Kerpelman, 1969b) have attempted to use a quantified index of politi-cal ideology as a selection criterion.
Furthermore, activist organizations contain a range of partici-pants from the highly committed to the hangers-on. Again, only a fewinvestigators have considered this variable. Keniston (1968) andWinborn and Jansen (1967) studied student activist leaders; unfortu-nately, they made no comparisons between these highly committed leadersand their less committed organization members.
Finally, subjects' awareness that they are being studied as mem-bers or representatives of activist groups may affect the way theyrespond to questionnaires and other measuring instruments. As has beenpointed out:
. . . when subjects are aware that they are being questionedas members or representatives of a particular group, they mayattempt to present themselves in a manner which they view asconsistent with the public image of that group. In keepingwith this, the responses of student activists to attitude sur-veys and psychological tests may be influenced by the popu-larly known findings of social scientists as well as thefamiliar image created by the mass media [Geller and Howard,1969, p. 15).
It is obviously very difficult to study student activists withouttheir knowledge and cooperation. Only in the investigation quoted above,by the use of a non-reactive index of politically active commitment,were subjects studied without being aware of the reasons for theirselection. It is also difficult to study student activists anonymously,as names are usually required to keep the research data in order. Yet,students may respond in a much different manner if they know that theirnames will be associated with their responses than if anonymity isassured them, or they even may be hesitant to respond at all (Walsh,1969).
Overview of the Present Stud
The aim of the above discussion was not to deny that left activistsmay be more intelligent or more psychologically rich than any other group,for they may well be. The aim, rather, was to suggest that the data areby no means sufficient or unequivocal to make statements with any cer-tainty about the personality, intellectual, and attitude correlates ofstudent activism. The unclarity of the data has resulted from the con-founding of activism and ideology, the failure to use appropriate control
8
groups (or any controls at all), the misinterpretation of measuringinstruments, the lack of methodological comparability from study tostudy and from institution to institution, and the loose criteriaused in selecting subjects. While the present investigation sharessome of the limitations of the previous research discussed above, itwas undertaken in an attempt to overcome as many of these limitationsas possible. It attempted to achieve this aim by separating activismfrom ideology; by using left, right, and middle activist subjects, aswell as similar nonactivist subjects; by using, for the most part,firmly established, valid measurement instruments; by elempling acrossinstitutions; and by using rigorous criteria for selection of sub-jects. Only in this way was it felt that a reliable body of datacould he obtained to yield an accurate picture of the personality,attitude, and letelligence tendencies associated with activism and non-activism across the entire political ideology spectrum.
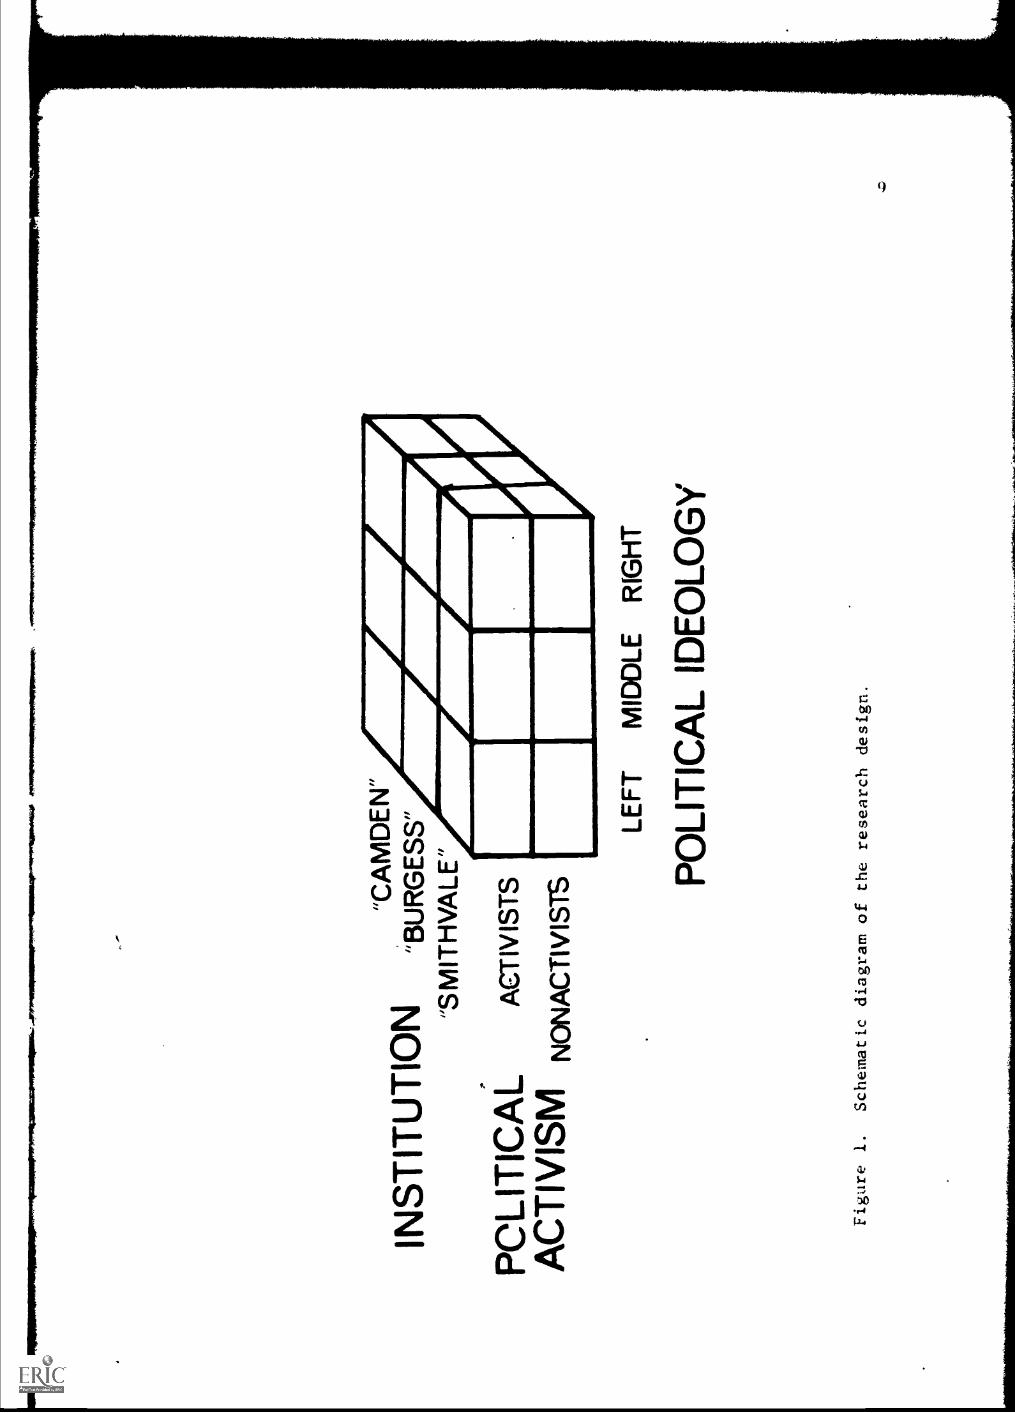
Tu accomplish these aims, students at three different institutionsof higher education were selected from extant campus organizations toparticipate in this study. The students were classified on the basisof organizational membership into politically active and politicallynonactive categories, classifications that were confirmed by using aquantitative measure of amount of political activism actually engagedin. The activist students were further divided, both on the basis of aprerating by political scientists of the probable political characterof the organizations and by a quantitative measure of the subjects' ownpolitical ideology, into politically left, middle, or right categories.The nonactivists were classified into the same three political ideologycategories on the basis of the same quantitative measure of their polit-ical ideology. The research design is indicated schematically inFigure 1.
The measures of the various personality, attitude, and intelligenceattributes administered to the subjects were selected (a) because theycovered as broad a range as possible of psychological attributes whilestill being administrable within a reasonable time period, and (b) be-cause they were, on the whole, supported by a significant amount of pre-vious research indicating that they were reliable and valid measures.
A design such as that described above allows the delineation ofthose personality, attitude, and intelligence characteristics which areassociated with activism per se, those which are correlated with ideol-ogy per se, and those which are associated with one of the three insti-tutions sampled. It allows, furthermore, the important distinction tobe made concerning which psychological qualities are associated withinteractions of these three dimensions, such as, for example, whetherleft activists have certain unique characteristics, or whether right non-activists at one of the institutions diverge in any particular mannerfrom the other subgroups. It is the latter type of differentiation,wherein ideology and activism and institution are examined in interaction,that has been notably absent from previous research and that was insti-tuted in the present investigation.
"CA
MD
EN
"IN
ST
ITU
TIO
N"B
UR
GE
SS
""S
MIT
HV
ALE
",
PO
LIT
ICA
LA
CT
IVIS
TS
AC
TIV
ISM
NO
NA
CT
IVIS
TS
LEF
TM
IDD
LER
IGH
T
PO
LIT
ICA
L ID
EO
LOG
Y
Figure 1.
Schematic diagram of the research design.
CHAPTER II
METHOD
Sampling procedures and res ?arch instruments are important factorsin a research project such as this one. As discussed in Chapter I,many of the previous investigations of the psychological determinantsof student sociopolitical activism manifested incomplete sampling pro-cedures or used measuring instruments of questionable validity for thepurposes to which they were put. In this chapter, the sampling andresponse-measuring procedures are discussed in some detail, so that thestrengths and limitations of the present study can be evaluated.
The Institutions
Each of the institutions at which this research was conducted hadto fulfill several criteria: (a) each had to be an accredited, nation-ally known institution of higher education, not currently stronglyaffiliated with a religious body; (b) each had to be coeducational; (c)each had to be in the northeastern United States in order to be withinrelatively close traveling distance of the investigator's home base; (d)each had to have on the campus political activists of the right, theleft, and the middle; (e) each had to have one person on campus whowould agree to serve as a paid liaison person for the investigator; and(f) each had to grant the investigator administrative assent to under-take the research. In addition; each institution was selected to repre-sent a different major type of institution of higher 'education, namely,a small private liberal arts college, a medium-sized private university,and a large public university.
As an initial step in the selection of the three institutionseventually to be included in this study, the investigator contacted col-leagues at various colleges and universities that fulfilled institutionalcriteria (a), (b), and (c). These persons were asked whether there werevisible left, middle, and right sociopolitical activist organizations ontheir campus (middle activist organizations were tentatively assumed tobe the campus student government bodies). If there were such groups oncampus, the colleague was asked whether he could suggest a possibleliaison person, or consultant, on that campus. The suggested consultantswere then contacted, the research project and their potential role in itwas explained, and, if they were agreeable to serving a liaison function,they were asked to undertake for the investigator the necessary negotia-tions with the administration and with the campus organizations thatwould participate in the study. The consultants were paid a flat con-
lo
11
sultana fee ior their efforts during the course of this investigation.It was emphasized to the consultants, and through them to the admin-istration and to the organizations, that the investigator would guar-antee the anonymity of the institution, the organizations. and theindividual students participating in the research.
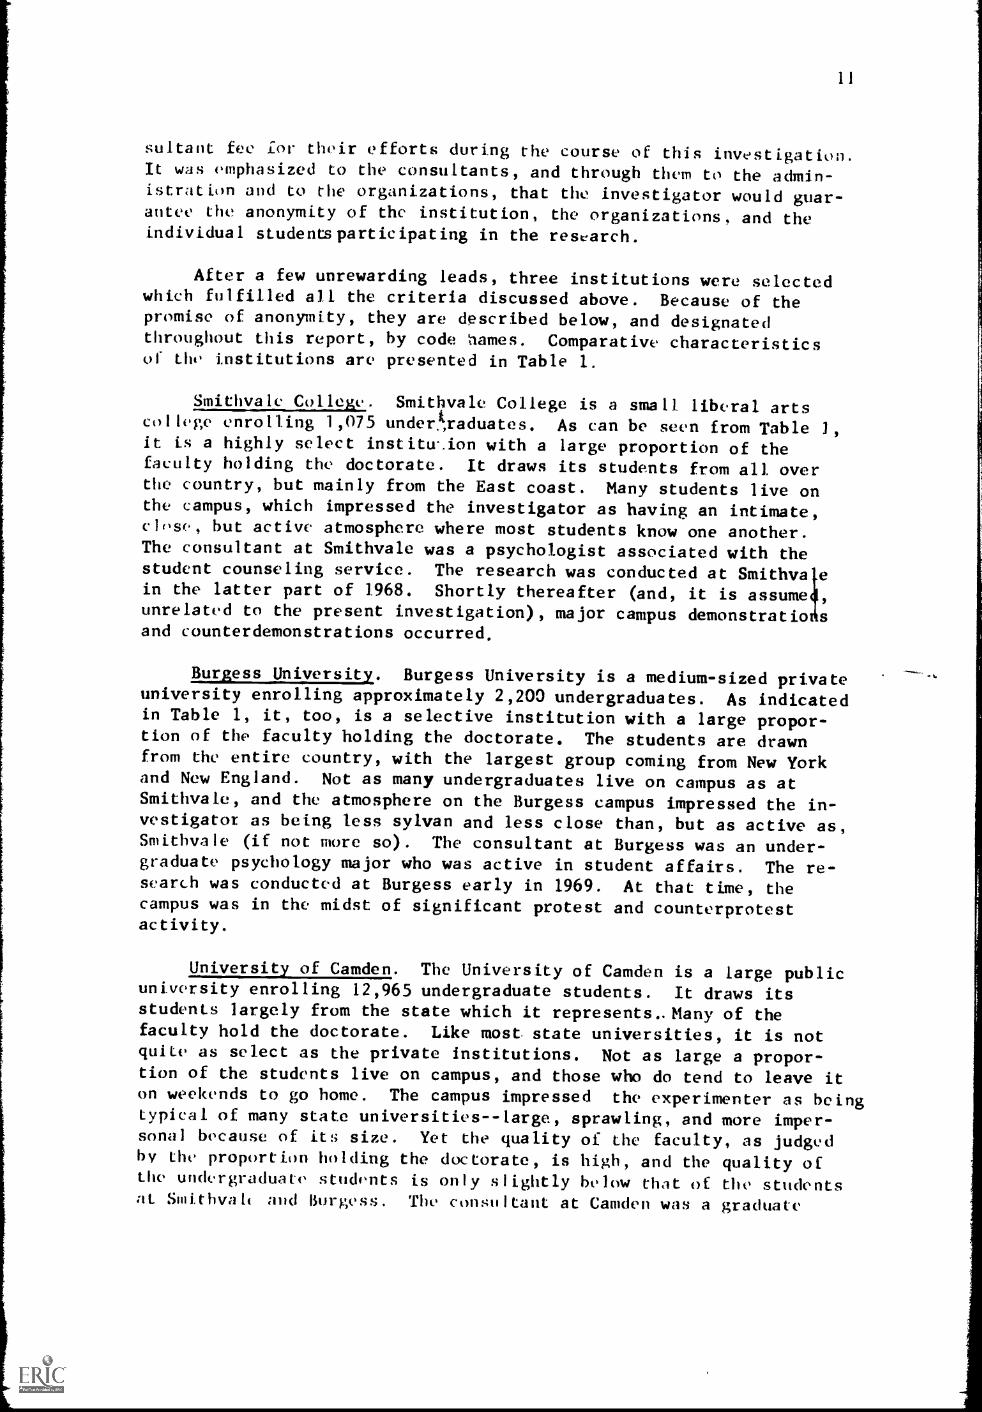
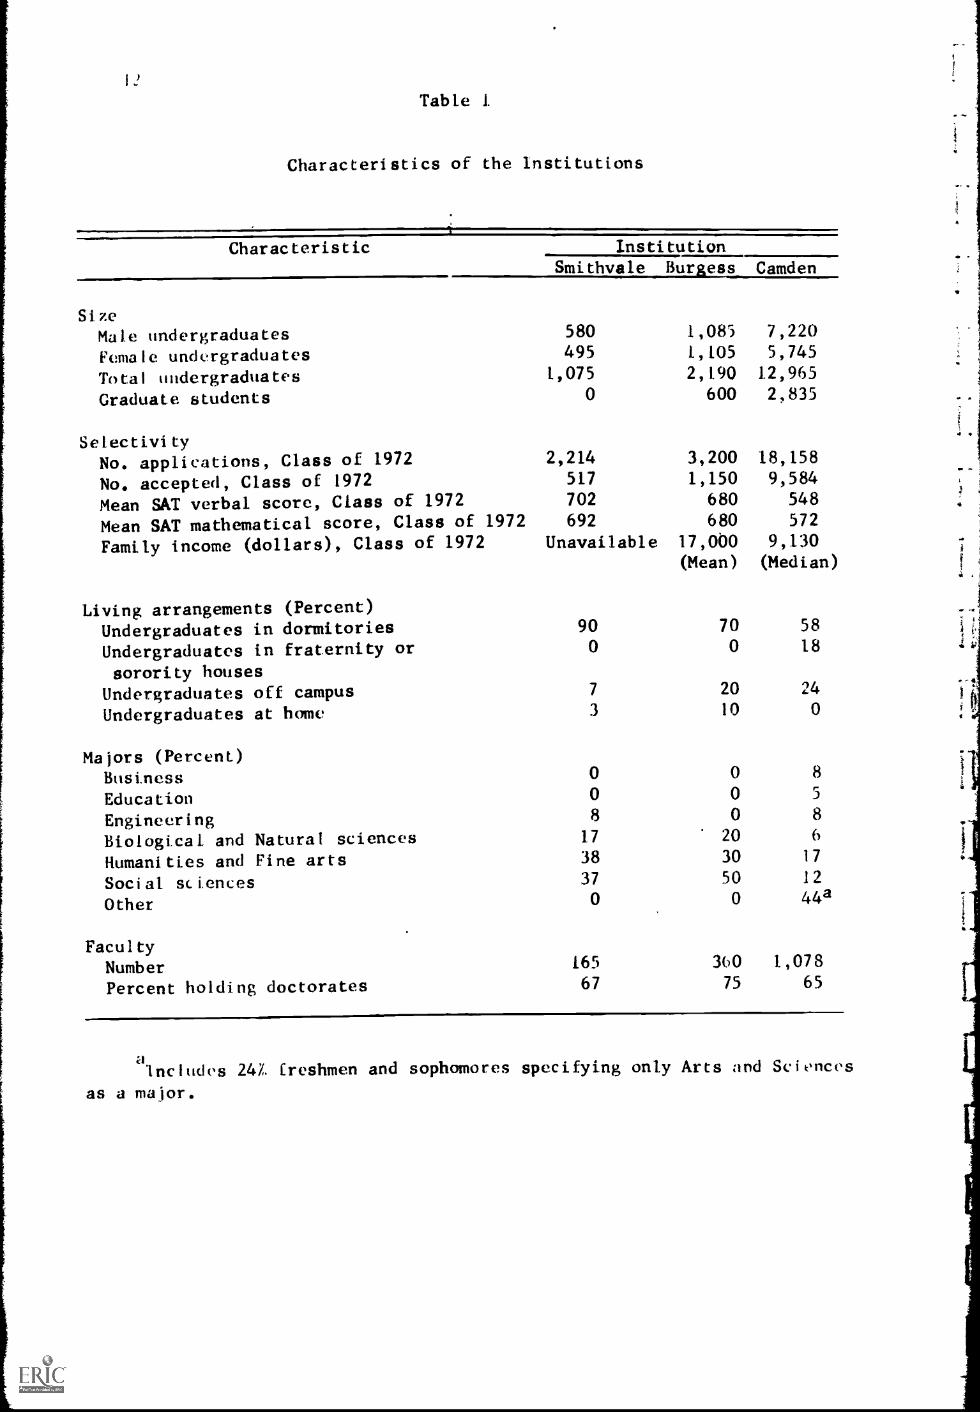
After a few unrewarding leads, three institutions were selectedwhich fulfilled all the criteria discussed above. Because of thepromise of anonymity, they are described below, and designatedthroughout this report, by code names. Comparative characteristicsof the institutions are presented in Table 1.
Smithvale College. Smithvale College is a small liberal artscollege enrolling 1,075 underAraduates. As can be seen from Table l,it is a highly select institution with a large proportion of thefaculty holding the doctorate. It draws its students from all overthe country, but mainly from the East coast. Many students live onthe campus, which impressed the investigator as having an intimate,close, but active atmosphere where most students know one another.The consultant at Smithvale was a psychologist associated with the
1
student counseling service. The research was conducted at Smithvalein the latter part of 1968. Shortly thereafter (and, it is assume ,
unrelated to the present investigation), major campus demonstratio sand counterdemonstrations occurred.
Burgess University. Burgess University is a medium-sized privateuniversity enrolling approximately 2,200 undergraduates. As indicatedin Table 1, it, too, is a selective institution with a large propor-tion of the faculty holding the doctorate. The students are drawnfrom the entire country, with the largest group coming from New Yorkand New England. Not as many undergraduates live on campus as atSmithvale, and the atmosphere on the Burgess campus impressed the in-vestigator as being less sylvan and less close than, but as active as,Smithvale (if not more so). The consultant at Burgess was an under-graduate psychology major who was active in student affairs. The re-search was conducted at Burgess early in 1969. At that time, thecampus was in the midst of significant protest and counterprotestactivity.
University of Camden. The University of Camden is a large publicuniversity enrolling 12,965 undergraduate students. It draws itsstudents largely from the state which it represents.. Many of thefaculty hold the doctorate. Like most state universities, it is notquite as select as the private institutions. Not as large a propor-tion of the students live on campus, and those who do tend to leave iton weekends to go home. The campus impressed the experimenter as beingtypical of many state universities--large, sprawling, and more imper-sonal because of its size. Yet the quality of the faculty, as judgedby the proportion holding the doctorate, is high, and the quality ofthe undergraduate students is only slightly below that of the studentsat Smithval( and Burgess. The consnItant at Camden was a graduate
12
Table 1.
Characteristics of the Institutions
Characteristic InstitutionSmithvale Burgess Camden
SizeMale undergraduates 580 1,085 7,220
Female undergraduates 495 1,105 5,745
Total undergraduates 1,075 2,190 12,965
Graduate students 0 600 2,835
SelectivityNo. applications, Class of 1972 2,214 3,200 18,158
No. accepted, Class of 1972 517 1,150 9,584
Mean SAT verbal score, Class of 1972 702 680 548
Mean SAT mathematical score, Class of 1972 692 680 572
Family income (dollars), Class of 1972 Unavailable 17,000 9,130(Mean) (Median)
Living arrangements (Percent)Undergraduates in dormitories 90 70 58
Undergraduates in fraternity or
sorority houses
0 0 18
Undergraduates off campus 7 20 24
Undergraduates at home 3 10 0
Majors (Percent)Business 0 0 8
Education 0 0 5
Engineering 8 0 8
Biological and Natural sciences 17 20 6
Humanities and Fine arts 38 30 17
Social sciences 37 50 12
Other 0 0 44a
FacultyNumber 165 360 1,078
Percent holding doctorates 67 75 65
includes 24a freshmen and sophomores specifying only Arts and Sciences
as a major.
13
student in psychology who had some knowledge of undergraduate studentactivities. The present investigation was undertaken at Camden latc.in 1968, during which time major demonstrations and counterdemonstra-tions were occurring on the campus.'
The Organizations
The initial step in the selection of the campus organizationsthat would be requested to participate in this study was to obtain apreliminary prorating of the political "character" of the various cam-pus organizations. An Organization Rating Sheet was compiled for eachcampus. On it were listed the politically oriented organizations anda sampling of the nonpolitical organizations on that particular campus.Copies of this instrument were sent to all the faculty members in thepolitical science department on each campus, asking them to rate, tothe best of their knowledge, the political character of the organiza-tions listed. The form of the Organization Rating Sheet is reproducedin Appendix A (with all identifying information removed to preservethe anonymity of the institutions and organizations). On the basis ofthe faculty raters' responses (which are summarized in Chapter III),ideologically left, middle, and right sociopolitical "target" organiza-tions were selected, as were politically nonactive organizations thatreceived preratings describing their probable ideology as moderate.The leaders of the target organizations were then approached by theconsultant for the purpose of discussing possible cooperation of themembers of that organization in the research.
If the leaders of the organizations felt that their members wouldcooperate in the research, the consultant then approached the members,either at a regular meeting of the organization or via mail. The con-sultant explained the general nature of the research, stressed theanonymity of the procedures, indicated the time and payment that wouldbe involved, gathered commitments of participation in the research, andscheduled the subjects (further details are presented below in Proce-dure). The organizations that participated in the research are dis-cussed only in a general fashion below in order to preserve theiranonymity.
1Conducting research on student activism presents unique problems for
the researcher. In addition to dealing with administrators who feelthat their institution's reputation might be harmed, and with studentswho, with some justification from recent events, are suspicious of thenature of the research and the use to which it will be put, there arethe practical problems of scheduling research appointments around
planned demonstrations and counterdemonstrations that have the campusand the organizations in a turmoil, and of having to cancel researchappointments that were scheduled when spontaneous demonstrations oc-curred. In all, it requires in the researcher a certain amount offlexibility and willingness to change plans.
lt activist organizations. At all three' Lampuses. th. left
a,tivist organizations were a local affiliate of a national student
( ft organization. In addition, at. Smithvale, an independent local
ieft sociopolitical action organization was included.
Middle activist organizations. At all three institutions, elec-
ted representatives of the campus student government organization were
included in the middle activist groUp. In addition, at Smithvale, an
organization of students who had campaigned for a moderate-to-liberal
candidate for governmental office, and at Camden, a student judiciary
body, were included as middle activist groups.
Ri &ht activist organizations. At Smithvale, the right activist
group consisted of the campus conservative organization. At Burgess,,
it consisted of a very loosely organized body that had tenuous con-
nections with a national conservative organization, plus a campus
right-of-center political club. The right activist group at. Camden
included a local campus organization formed to protest the activities
of the campus left organizations, pins a campus right-of-center poli-
tical club.
Nonactivist organizations. Members of clubs which were not
political in nature, who, in addition, did not belong to any of the
activist organizations discussed above, were the subjects for the
politically nonactivist subgroups in this research. As was indicated
in Chapter I, this was done, rather than using randomly selected
students, to control for "organization-joining," or "participatory
activity," between the activist and nonactivist subjects. From these
nonpolitical clubs, subjects werR assigned, on the basis of their
responses to questionnaires administered to them during the research
procedures, to politically nonactivist left, middle, and right poli-
tical ideology subgroups. At all three institutions, these clubs con-
sisted of interest: and hobby clubs, campus service organizations, pre-
professional clubs, and the like.
The Instrument:,
The data-gathering instruments are described in this section in
the order in which they were administered ta the subjects. instruments
which are not copyrighted are reproduced in Appendix B. Copyrighted,
commercially available questionnaires used in the present study are not
reproduced in this report: specimen sets are generally available to
qualified researchers from the publisher.
Code Number Instructions (CNI). This brief instrument, devised
by the author and reproduced in Appendix B, enabled each subject to
assign himself a unique 15-digit identification number based upon a
coded combination of demographic variables descriptive of him. This
code number was then placed on all the questionnaire material that the
subject subsequently completed. The code number provided the investi-
gator with a method of keeping an accurate record of all answer sheets
15
and with demographic data for each subject while still completelypreserving each subject's anonymity. Since names were not reqdested,
there is no way of identifying vny individual with any of the ques-tionnaire responses.
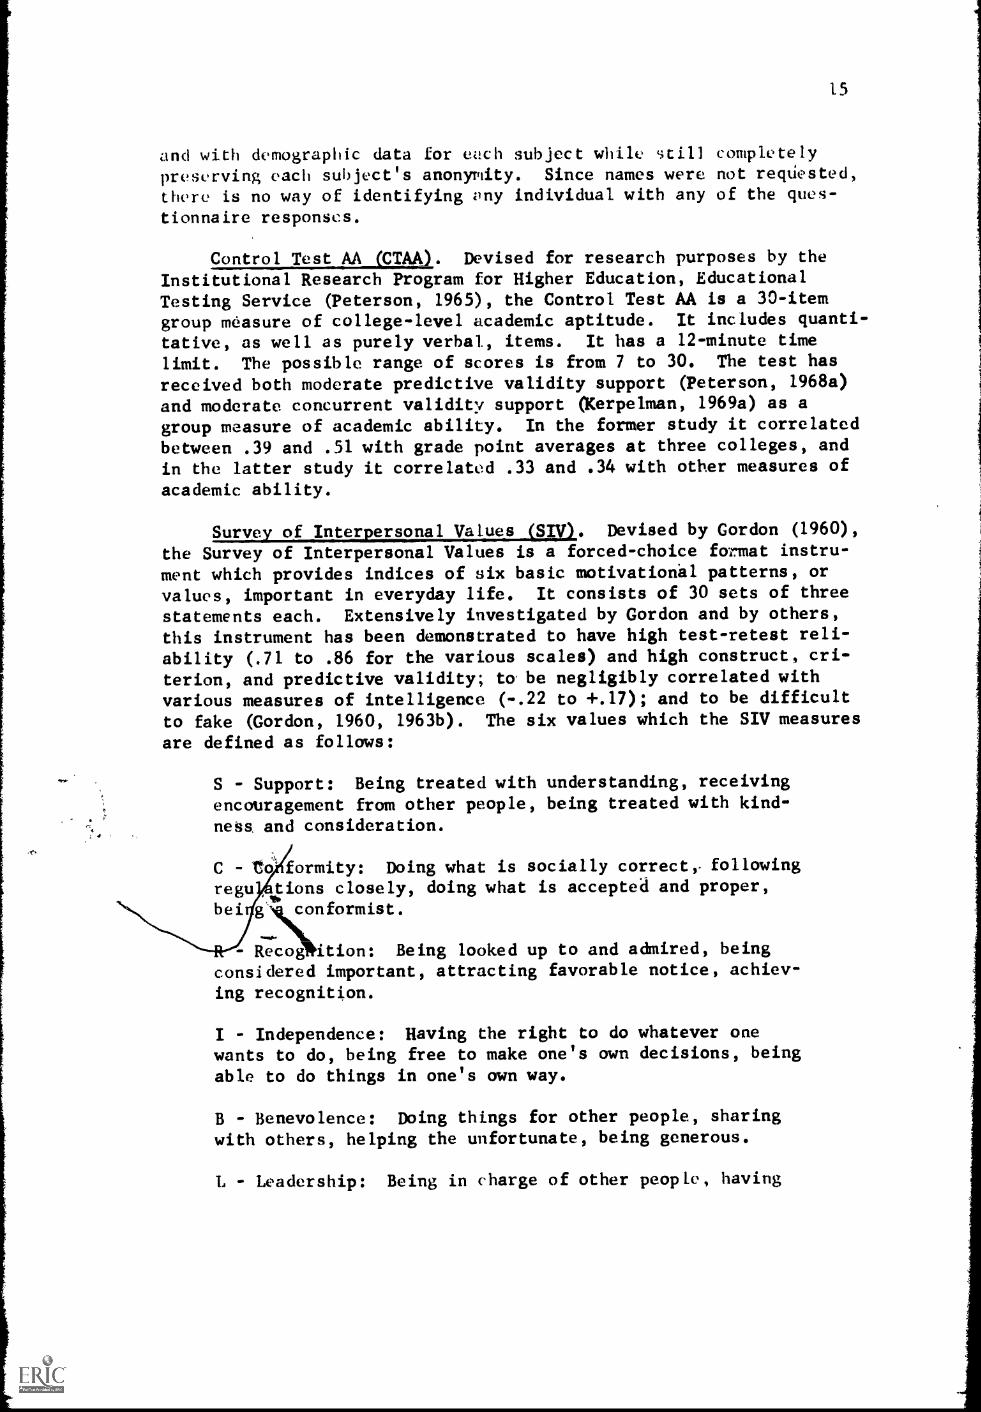
Control Test AA (CTAA). Devised for research purposes by theInstitutional Research Program for Higher Education, EducationalTesting Service (Peterson, 1965), the Control Test AA is a 30-itemgroup measure of college-level academic aptitude. It includes quanti-
tative, as well as purely verbal, items. It has a 12-minute time
limit. The possible range of scores is from 7 to 30. The test has
received both moderate predictive validity support (Peterson, 1968a)
and moderate concurrent validity support (Kerpelman, 1969a) as agroup measure of academic ability. In the former study it correlatedbetween .39 and .51 with grade point averages at three colleges, andin the latter study it correlated .33 and .34 with other measures of
academic ability.
Survey of Interpersonal Values (SIV). Devised by Gordon (1960),
the Survey of Interpersonal Values is a forced-choice format instru-ment which provides indices of six basic motivational patterns, orvalues, important in everyday life. It consists of 30 sets of three
statements each. Extensively investigated by Gordon and by others,this instrument has been demonstrated to have high test-retest reli-ability (.71 to .86 for the various scales) and high construct, cri-terion, and predictive validity; to be negligibly correlated withvarious measures of intelligence (-.22 to +.17); and to be difficult
to fake (Gordon, 1960, 1963b). The six values which the SIV measures
are defined as follows:
S - Support: Being treated with understanding, receivingencouragement from other people, being treated with kind-
ness, and consideration.
C - formity: Doing what is socially correct, following
regu vtions closely, doing what is accepted and proper,
bei
RecoiRition: Being looked up to and admired, beingconsidered important, attracting favorable notice, achiev-
ing recognition.
I - Independence: Having the right to do whatever onewants to do, being free to make one's own decisions, beingable to do things in one's own way.
B - Benevolence: Doing things for other people, sharingwith others, helping the unfortunate, being generous.
L - Leadership: Being in charge of other people, having
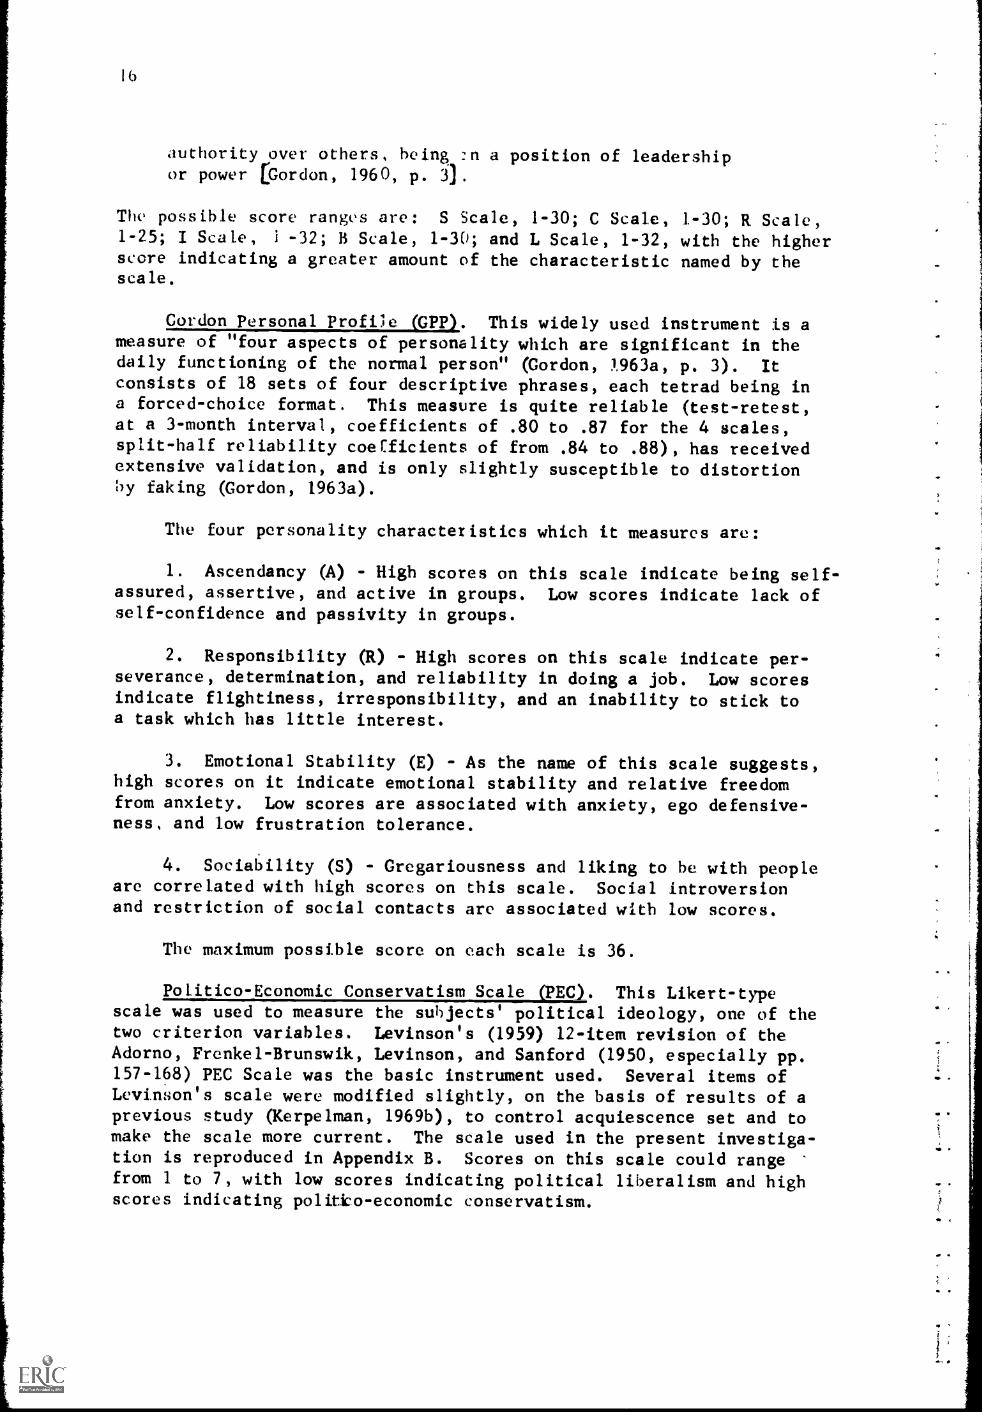
authority over others, being :n a position of leadershipor power [Gordon, 1960, p. 3] .
The possible score ranges are: S Scale, 1-30; C Scale, 1-30; R Scale,1-25; I Scale, 1 -32; B Scale, 1-30; and L Scale, 1-32, with the higherscore indicating a greater amount of the characteristic named by thescale.
Cordon Personal Profile (UP). This widely used instrument is a
measure of "four aspects of personality which are significant in thedaily functioning of the normal person" (Gordon, 1963a, p. 3). Itconsists of 18 sets of four descriptive phrases, each tetrad being ina forced-choice format. This measure is quite reliable (test-retest,at a 3-month interval, coefficients of .80 to .87 for the 4 scales,split-half reliability coefficients of from .84 to .88), has receivedextensive validation, and is only slightly susceptible to distortionby faking (Gordon, 1963a).
The four personality characteristics which it measures are:
1. Ascendancy (A) - High scores on this scale indicate being self-assured, assertive, and active in groups. Low scores indicate lack ofself-confidence and passivity in groups.
2. Responsibility (R) - High scores on this scale indicate per-severance, determination, and reliability in doing a job. Low scoresindicate flightiness, irresponsibility, and an inability to stick toa task which has little interest.
3. Emotional Stability (E) - As the name of this scale suggests,high scores on it indicate emotional stability and relative freedomfrom anxiety. Low scores are associated with anxiety, ego defensive-ness, and low frustration tolerance.
4. Sociability (S) - Gregariousness and liking to be with peopleare correlated with high scores on this scale. Social introversionand restriction of social contacts are associated with low scores.
The maximum possible score on each scale is 36.
Politico-Economic Conservatism Scale (PECI. This Likert-typescale was used to measure the subjects' political ideology, one of thetwo criterion variables. Levinson's (1959) 12-item revision of theAdorno, Frenkel-Brunswik, Levinson, and Sanford (1950, especially pp.157-168) PEC Scale was the basic instrument used. Several items ofLevinson's scale were modified slightly, on the basis of results of aprevious study (Kerpelman, 1969b), to control acquiescence set and tomake the scale more current. The scale used in the present investiga-tion is reproduced in Appendix B. Scores on this scale could rangefrom 1 to 7, with low scores indicating political liberalism and highscores indicating politico-economic conservatism.
17
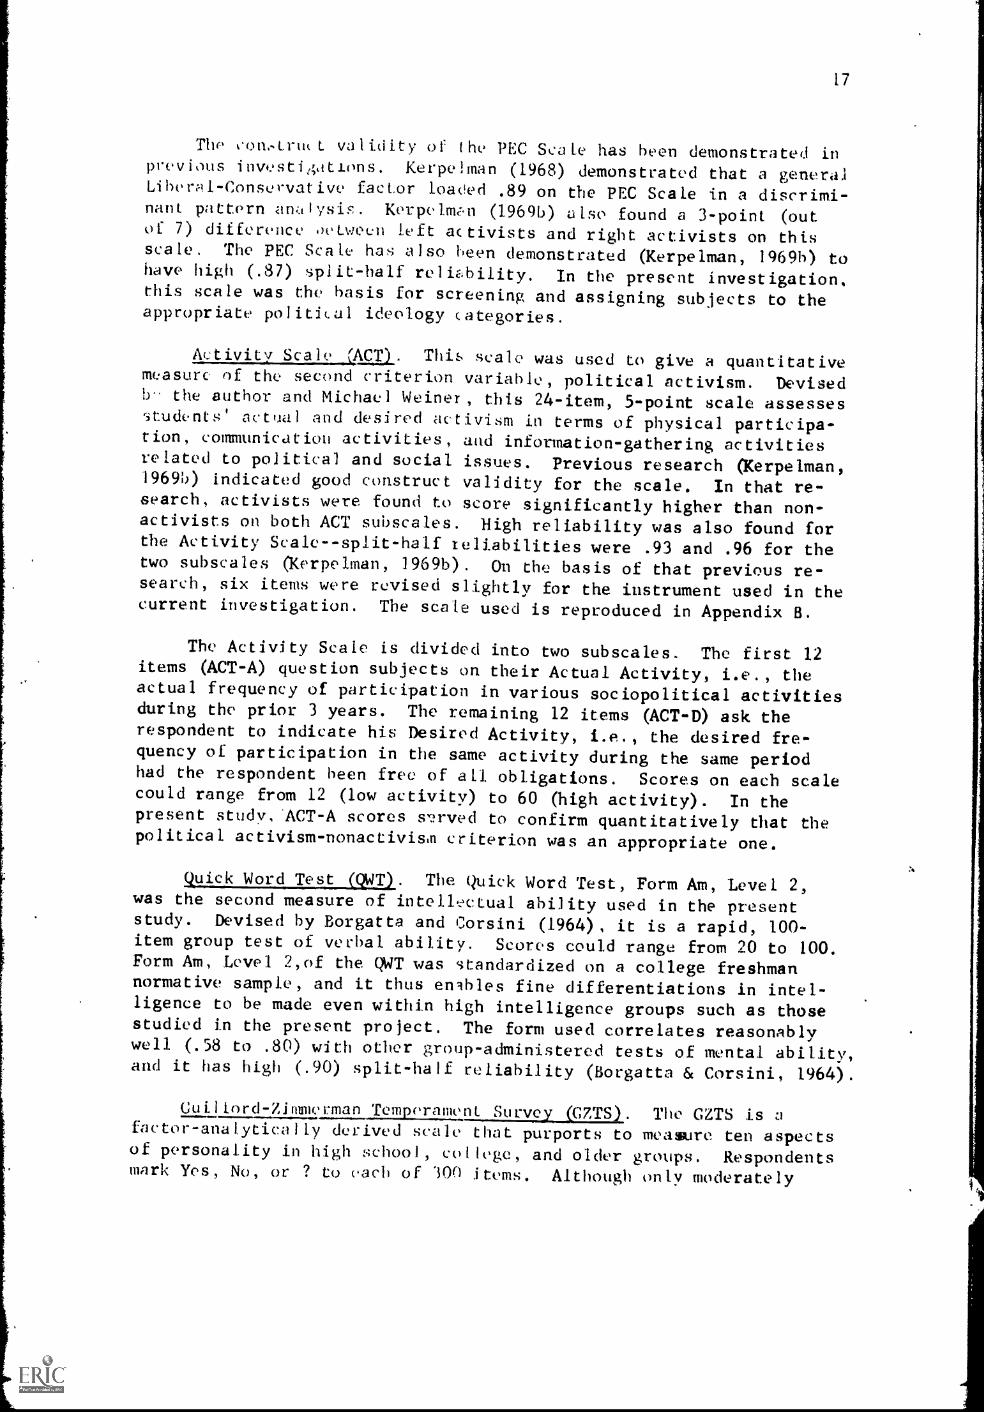
Tho con,tru(t validity of !he PEC Scale has been demonstrated inprevious investitotions. Kerpelman (1968) demonstrated that a generalLiberal-Conservative factor loaded .89 on the PEC Scale in a discrimi-nant pattern analysis. Korpelw*n (19691)) also found a 3-point (outof 7) difference oeLween left activists and right activists on thisscale. The PEC Scale has also been demonstrated (Kerpelman, 1969b) tohave high (.87) split-half relic,bility. In the present investigation,this scale was the basis for screening and assigning subjects to theappropriate political ideology categories.
Activity Scale QN,17T). This scale was used to give a quantitativemeasure of the second criterion variable, political activism. Devisedb the author and Michael Weiner , this 24-item, 5-point scale assessesstudents' actual and desired activism in terms of physical participa-tion, communication activities, and information-gathering activitiesrelated to political and social issues. Previous research (Kerpelman,1969b) indicated good construct validity for the scale. In that re-search, activists were found to score significantly higher than non-activists on both ACT subscales. High reliability was also found forthe Activity Scale- -split -half teliabilities were .93 and .96 for thetwo subscales (Kerpelman, 1969b). On the basis of that previous re-search, six items were revised slightly for the instrument used in thecurrent investigation. The scale used is reproduced in Appendix B.
The Activity Scale is divided into two subscales. The first 12items (ACT-A) question subjects on their Actual Activity, i.e., theactual frequency of participation in various sociopolitical activitiesduring the prior 3 years. The remaining 12 items (ACT-D) ask therespondent to indicate his Desired Activity, i.e., the desired fre-quency of participation in the same activity during the same periodhad the respondent been free of all obligations. Scores on each scalecould range from 12 (low activity) to 60 (high activity). In thepresent study. ACT-A scores srved to confirm quantitatively that thepolitical activism-nonactivism criterion was an appropriate one.
quisLwalaastarli. The Quick Word Test, Form Am, Level 2,was the second measure of intellectual ability used in the presentstudy. Devised by Borgatta and Corsini (1964), it is a rapid, 100 -
item group test of verbal ability. Scores could range from 20 to 100.Form Am, Level 2,of the QWT was standardized on a college freshmannormative sample, and it thus enables fine differentiations in intel-ligence to be made even within high intelligence groups such as thosestudied in the present project. The form used correlates reasonablywell (.58 to .80) with other group-administered tests of mental ability,and it has high (.90) split-half reliability (Borgatta & Corsini, 1964).
Guilford-Zimmerman Temperament Survey (CZTS). The CZTS is a
factor-analytically derived scale that purports to measure ten aspectsof personality in high school, college, and older groups. Respondentsmark Yes, No, or ? to each of 300 items. Although only moderately
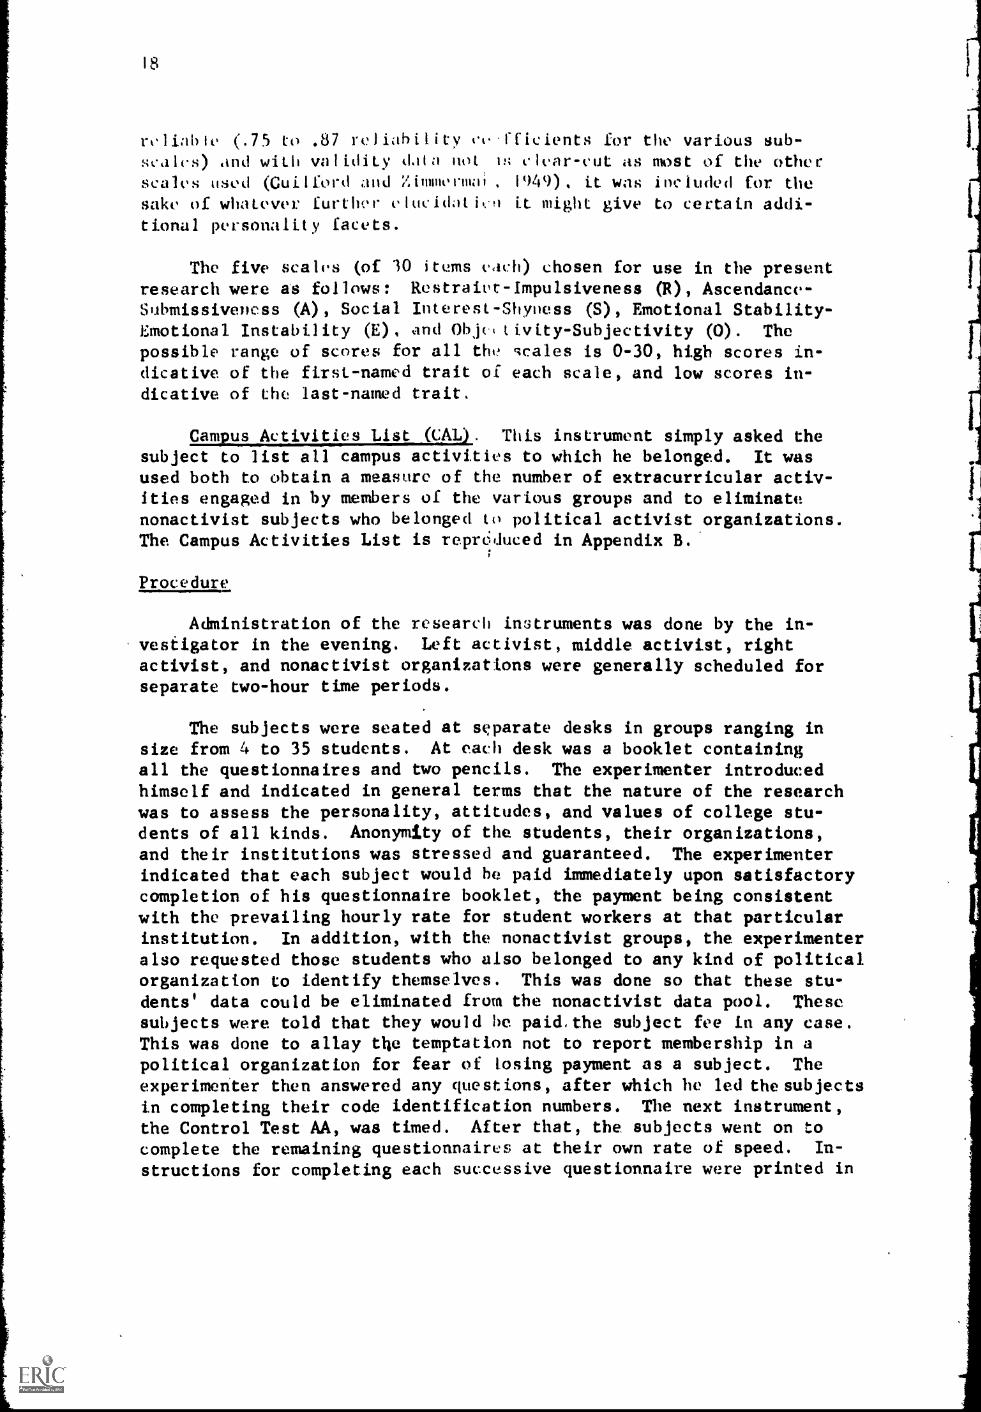
IS
reliable (.75 to 87 reliability co 4ficients for the various sub-scales) and with validity (Lila not is clear -cut as most of the other
scales used (Guilford and Zimmermoi , 1949) , it was included for the
sake of whatever further elucidatik-o it might give to certain addi-tional personality facets.
The five scales (of 10 items each) chosen for use in the presentresearch were as follows: Restraint-Impulsiveness (R), Ascendance-Submissiveness (A), Social Interest-Shyness (S), Emotional Stability-Emotional Instability (E), and Objc,tivity-Subjectivity (0). Thepossible range of scores for all the wales is 0-30, high scores in-dicative of the first-named trait of each scale, and low scores in-dicative of the last-named trait.
Campus Activities List (L:AL). This instrument simply asked thesubject to list all campus activities to which he belonged. It wasused both to obtain a measure of the number of extracurricular activ-ities engaged in by members of the various groups and to eliminatenonactivist subjects who belonged to political activist organizations.The Campus Activities List is reprOduced in Appendix B.
Procedure
Administration of the research instruments was done by the in-vestigator in the evening. Left activist, middle activist, rightactivist, and nonactivist organizations were generally scheduled forseparate two-hour time periods.
The subjects were seated at separate desks in groups ranging insize from 4 to 35 students. At each desk was a booklet containingall the questionnaires and two pencils. The experimenter introducedhimself and indicated in general terms that the nature of the researchwas to assess the personality, attitudes, and values of college stu-dents of all kinds. Anonymity of the students, their organizations,and their institutions was stressed and guaranteed. The experimenterindicated that each subject would he paid immediately upon satisfactorycompletion of his questionnaire booklet, the payment being consistentwith the prevailing hourly rate for student workers at that particularinstitution. In addition, with the nonactivist groups, the experimenteralso requested those students who also belonged to any kind of politicalorganization to identify themselves. This was done so that these stu-dents' data could be eliminated from the nonactivist data pool. Thesesubjects were told that they would he paid, the subject fee in any case.This was done to allay the temptation not to report membership in apolitical organization for fear of losing payment as a subject. Theexperimenter then answered any quest ions, after which be led thesubjectsin completing their code identification numbers. The next instrument,the Control Test AA, was timed. After that, the subjects went on tocomplete the remaining questionnaires at their own rate of speed. In-
structions for completing each successive questionnaire were printed in
i t 01111.. 1 tt i14"01, !CI . Uptll Onlp it Ll tin' tl'ot it t' (`'; ;,','-'1 I 1 ; 11 10)1.111(1 1 i a 11. t(' 1110t1 s) ',( 4101( ilt
'1040`10;'',1 it )t)01 "(.. It) 110' iment'er , who !,,d t !It .1; :A':S It" t It)I rlissin. responses ont thQn pd id Lib ,;thdent 1,,t hi
L 1, i prl I. i .
In ;III, 8> sLodonts Compri:cd t1-1(' prHiminary suhj(c1 pool At
Southvale colieg 92 at Burgess University, and 109 ot, U,niver-
sILv l f c;amdcm, for n total oC 284 students.
CHAPTER III
RE';ULTS
Since so large an amount of data was collected, it may help todescribe initially the exposition of this chapter. First, the
political science faculty prerating of the "target" organizations
are discussed. Then, the criterion screening of the subjects, based
upon the independent variables of organization membership and Politico-Economic Conservatism Scale scores, is described. A general examina-
tion of the final samples follows. The main results are then presented
in two ways: (a) examination of ea 'h dependent variable measure and
how the subgroups performed in relation to each other on each, and (b)
examination of the characteristics of the research subgroups as re-
vealed by a multivariate analysis of the data. Finally, supplementaryresults, bearing upon commitment in left activists, are presented.
Organization Preratings
The preratings by the political science faculty of the potentialtarget organizations at Smithvale ad at Camden are indicated in Tables
2 and 3, respectively. The political science department facultyreturns at Burgess were so few that those data could not be used in the
preselection of the target organizations, and consequently they are
not reported here.
At Smithvale, Organizations SA and SB, with a weighted mean pre-rating of 1.00, were chosen as the organizations to be included in theleft activist cell of the research Aesign. Organizations SC and SD(mean weighted prerating = 2.00) were chosen to be included in the mid-dle activist cell, and Organization SE (mean weighted prerating = 4.00)
was selected for the right activist cell. There was unanimity of thejudges in their preratings of the activist groups, and, except forOrganization SE, their prerating was based upon fairly good knowledge
of the groups.
The politically nonactivist supjects at Smithvale were selectedfrom Organizations SF, SC, SI, and SJ (mean weighted prorating = 2.55).
Interrater reliability for the nonactive organizations was only moder-
ate, and judges' ratings of these organizations were based upon Less
information than were their ratings of the activist organizations. The
political "character" of all the no)activist organizations at Smithvale
'20
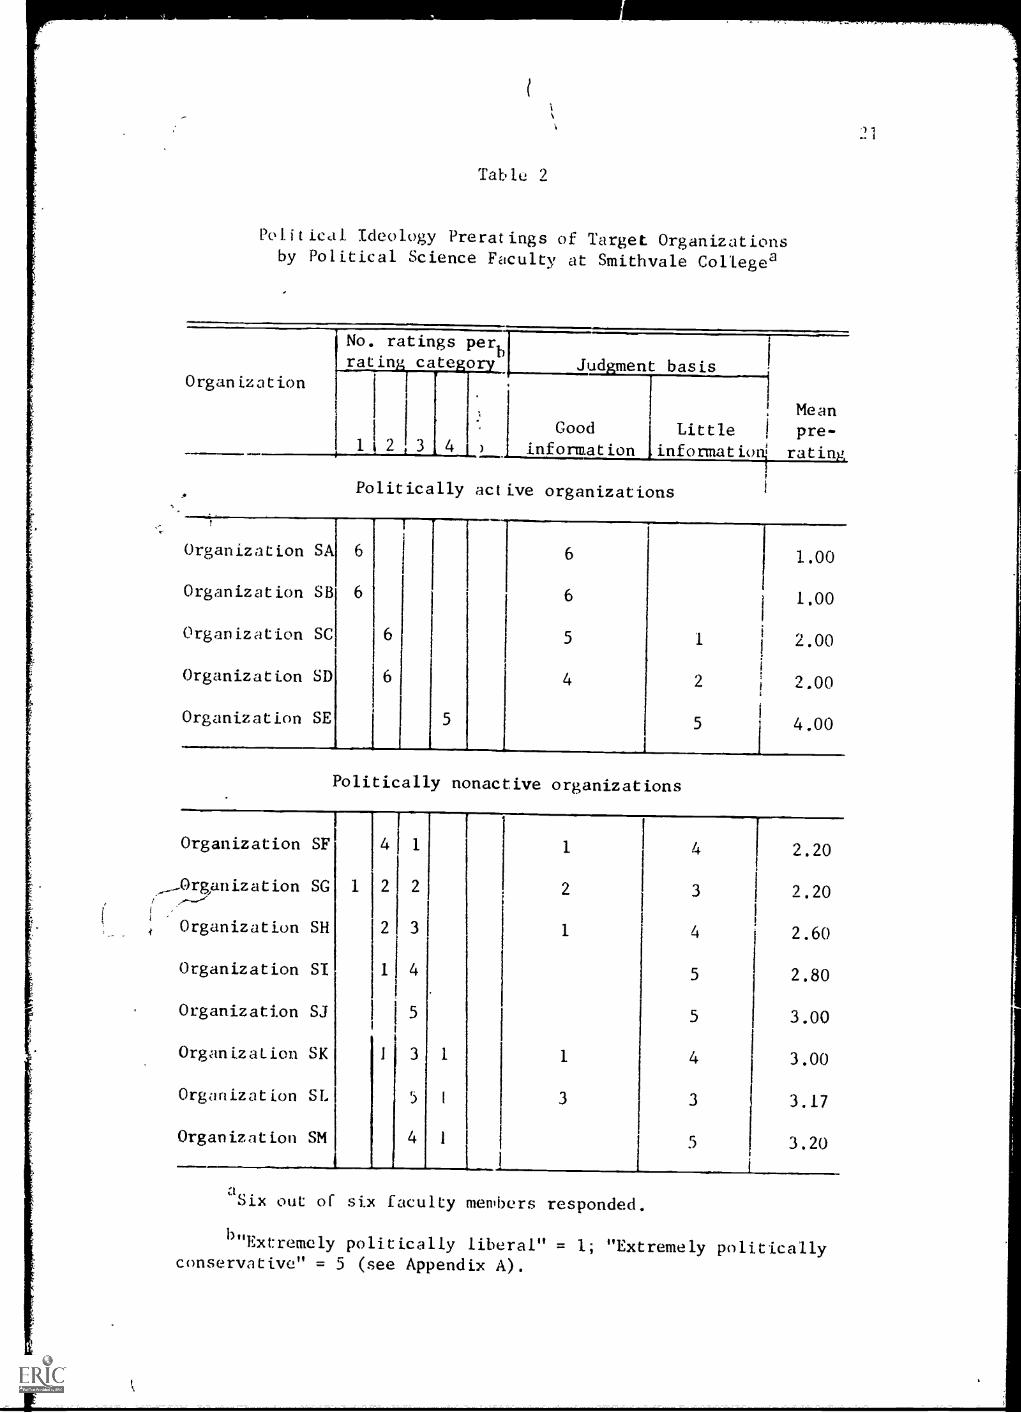
Table 2
Political Ideology Prerat ings of Target Organizationsby Political Science Faculty at Smithvale Collegea
Organization
No. ratings perb
rating cate o Judgment basis
MeanGood Little pre-
2 3 4 information information rating
Politically active organizations
Organization SA
Organization SB
6
6
6
6
1.00
1.00
Organization SC 6 5 1 2.00
Organization SD 6 4 2 2.00
Organization SE 5 5 4.00
Politically nonactive organizations
i
Organization SF 4 1 1 4 2.20
Organization SG 1 2 2 2 3 2.20..-----t
Organization SH 2 3 1 4 2.60
Organization SI 1 4 5 2.80
Organization SJ 5 5 3.00
Organization SK 1 3 1 1 4 3.00
Organization SL 5 1 3 3 3.17
Organization SM 4 1 5 3.20
aSix out of six faculty mewbers responded.
b,'Extremely politically liberal" = 1; "Extremely politically
conservative" = 5 (see Appendix A).
Tar le 3
Political Ideology Preratings of Target Organizationsby Political Science Faculty at the University of Camdend
No. ratings per I
sting categoryb Judgment basis MeanOrganization Good Little pre-
1 2 3 4 5 information information rating
Politically active organizations
Organization C' 9 2 7 4 1.36
Organization CB 5 3 1 2 7 1.56
Organization CC 5 3 3 5 2.38
Organization CD 2 2 1 2 1 6 2.43
Organization CE 1 4 1 1 1 6 2.43
Organization CF 4 3 1 4 4 2.63
Organization CG 2 2 3 1 3 5 3.38
Organization CH 1 1 6 1 4 5 3.78
Organization CI 1 1 3 2 3 4.40
Politically nonaccive organizations
Organization CJ 1 5 6 2.83
Organization CK 1 6 7 2.86
Organization CL 1 6 1 6 2.86
Organization CM 1 8 1 8 2.89
aEleven out of twenty faculty members responded.
b"Extremely politically liberal" = 1; "Extremely politicallyconservative" = 5 (see Appendix A).
21
vd( ,(en by 0( iaeulty raters as falling toward the left side of tiu
spe,.E:nm. The four clubs choser for inclusion in this study werechosen on tnc hdsis of the availability of members to participate in
Lire rescardl, the number of members likely to participate , and the
range of estimated political ideologies represented.
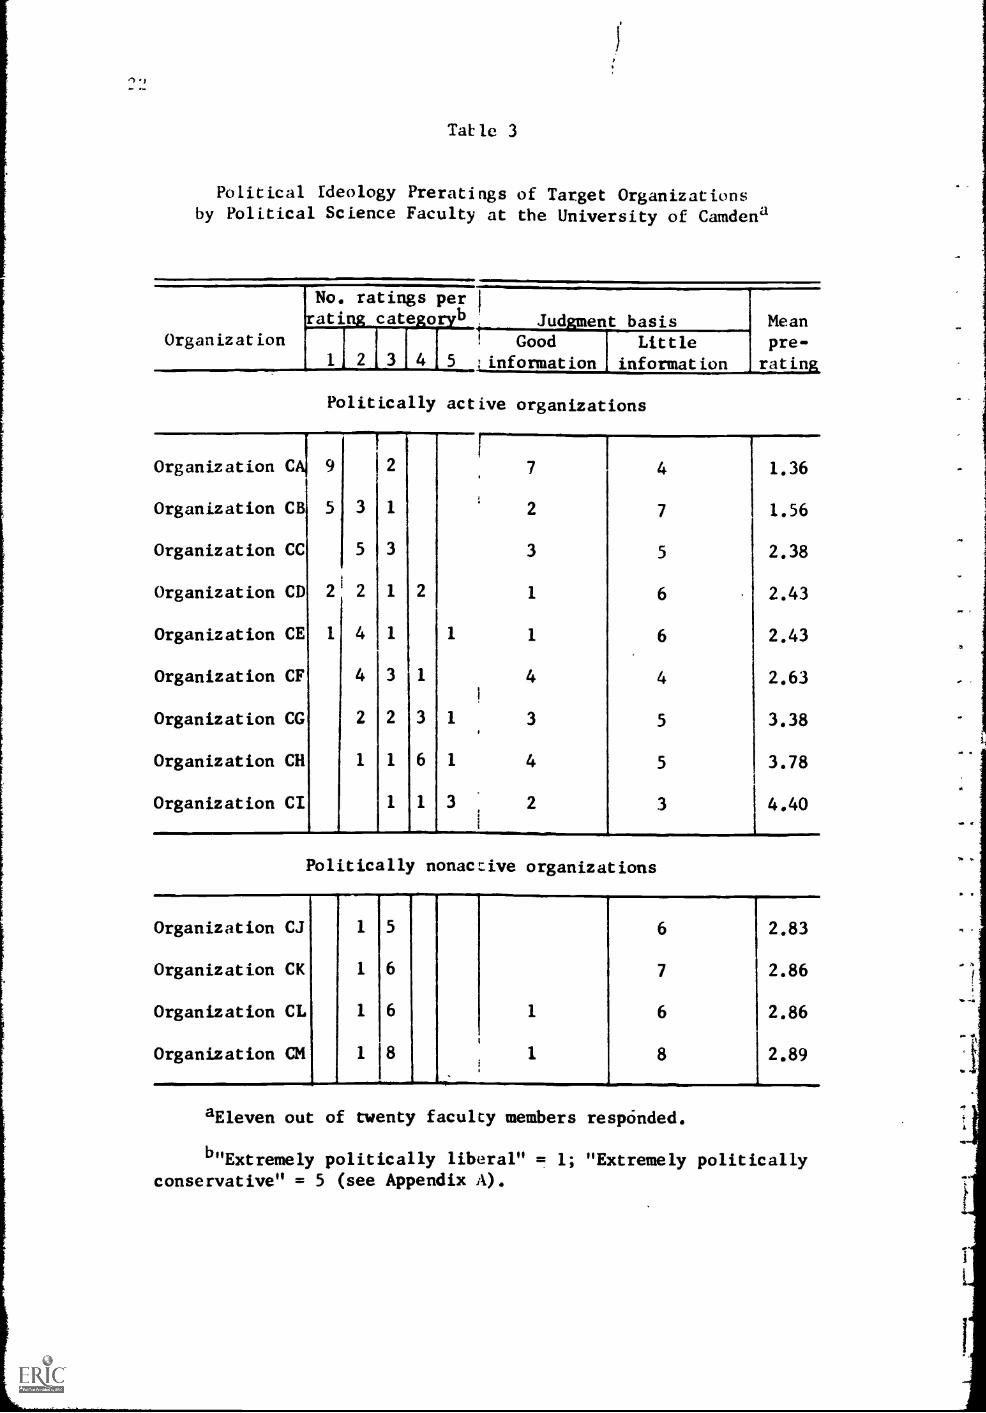
At Camden, Organization CA, with a weighted mean prerating of1.36, was selected for inclusion in the left activist subgroup of the
research design. Organizations CF and CC, with a mean weighted pre-rating of 3.00, were selected as the middle activists, and Organiza-tions CH and CI, with a mean weighted prerating of 4.00, were selected
a, the right activists. Interrater reliability and raters' knowledgeof the organizations were only qoderate for these organizations.
The politically nonact ivist subjects at Camden were selected fromOrganizations CJ and CM (mean weighted prerating = 2.87). While the
intetrater reliability for these organizations was fairly good, theinformation on which the ratings were based was not. The organizationschosen for inclusion in this study at Camden were chosen for the samereasons as were the organizations at Smithvale. On the basis of the
prerating returns at Smithvale and at Camden, it seemed reasonable tobelieve that the left, middle, and right activist organizations chosento participate would indeed be very likely to include members who were
left, middle, and right in political orientation.
Due to the lack of prerating returns at Burgess University, theinvestigator relied upon the consultant's knowledge of the variouscampus organizations in approaching and selecting organizations to
participate in this study. Since the purpose of the preratings wasonly to ascertain, which organizations were likely to consist of sub-jects who would be appropriate for inclusion in this study, and since the
preratings were not the criterion of political ideology of the subjects,this could be done without vitiating the research results. The method
used to screen subjects for their orientation on the criterion variableof socio-political ideology is discussed in the section below.
Criterion Screening
As indicated above, the left, middle, and right activists wereonly preselected, on the basis of their membership in left, middle,and right organizations (as indicated by the preratings), for inclu-
sion in those respective cells of the research design. The final
selection of activist sohjects for the three ideology subgroups wasmade on the basis of their scores on the Politico-rxonomic ConservatismScale which was administered to all subjects as part of the research
procedure. In other words, being a member of a prorated left, middle,
or right activist organization was insufficient for inclusion as a
left, middle, or right activist in this research. In addition, a
student had to s( ore within the left, middle, or right range, respec-
tively, of the Politico-Economic Conservatism Scale. For example,
.4
4tudents who belonged to a prorated left activism organization butwho scored in the middle or right ranges of the PEC Scale weredropped. In a similar fashion, left, middle, and right politicallynonactive subjects were assigned to their respective ideology sub-groups on the basis of the PEC Scale scores.
To accomplish this, frequency distributions of the PEC Scalescores were constructed for each institution. The PEC Scale rawscore data from which the distributions were derived are presentedin Tables 4 and 5. It is apparent immediately that it was in thenature of the three institutions that political ideology, as measuredby the PEC Scale, was distributed differently among the institutions.Specifically, the students at Smithvale and Burgss were more left intheir ideology than were the students at Camden. Since the studentsat Smithvale and at Burgess scored lower on the PEC Scale (more tothe left politically) overall than the students at Camden, the use ofthe same raw score cutting points Aoold have resulted in almost noright subjects at the former two schools and few left subjects at thelatter institution. Consequently, it was decided to use percentilecutting points on the PEC Scale, rather than raw score cutting points,at each institution as the basis for assigning students to politicalideology subgroups. The result was that the subject pool at eachinstitution served as its own norm group for the PEC Scale scores.
The PEC Scale percentile ranges used for selection of left,middle, and right subjects at all three institutions were selected soas to result in the elimination of the fewest subjects. Of course,when nonoverlapping distributions are "forced," as was done here,there is an unavoidable loss of some subjects. It was felt, however,that the statistical power lost from the elimination of subjects wouldbe more than made up for in conceptual refinement by having nonover-lapping, "pure" activism by ideology cells, i.e., cells in which onlythose subjects in a left activist organization who scored on the leftend of the PEC Scale continuum, in which only those subjects in themiddle activist organizations who scored in the mid-range of the PECScale, and in which only those members of right activist organizationswho scored on the right end of the PEC Scale range, were included.
2In fact, the mean scores on the PEC Scale of all groups combined at
each of the institutions (4 = 2.68 at Smithvale, M = 2.78 at Burgess,and M = 3.44 at Camden) were markedly more toward the left end of thecontinuum than was the overall mean PEC Scale score of a group of 258evening school students q2 = 4.45) as reported by Kerpelman (1968). Itappears, then, that these college students in 1968-69 are decidedly moreliberal than a "norm" group of older students in 1964. The data fromthe University of Camden are comparable, however, to the mean PEC Scalescore of 3.91 for younger college students participating more recentlyin a similar study at another large northeastern public university(Kerpelman, 1969b).
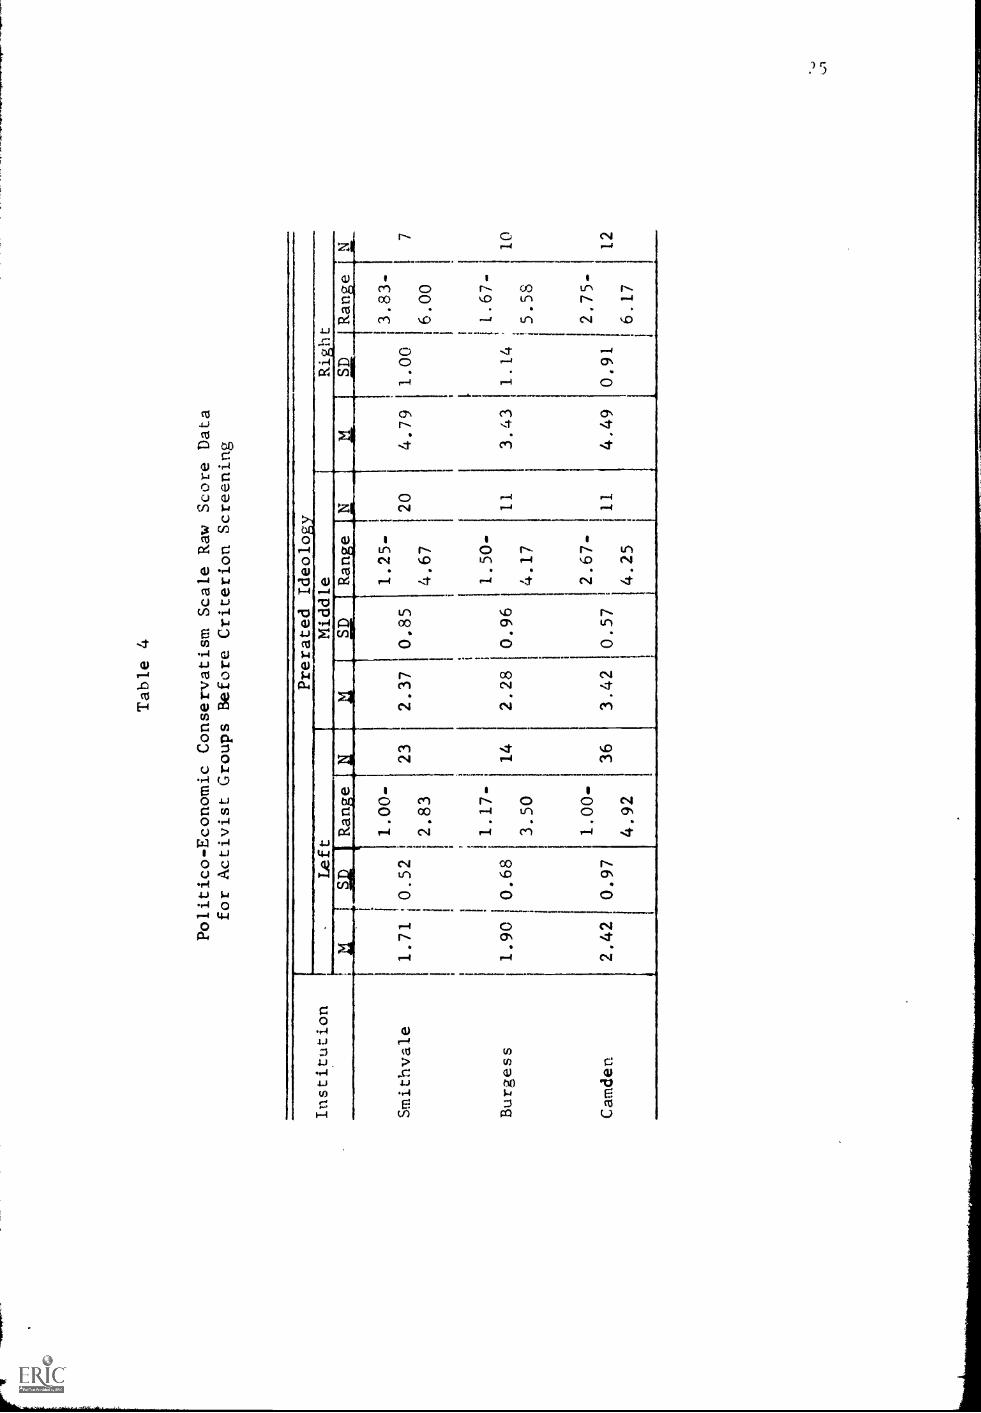
Table 4
Politico-Economic Conservatism Scale Raw Score Data
for Activist Groups Before Criterion Screening
Institution
Smithvale
Burgess
Camden
Left
§,J2
Range
Prerated Ideology
Middle
1.00-
1.71
0.52
2.83
1.17-
1.90
0.68
3.50
1.00-
2.42
0.97
4.92
11SD
Range
23
2.37
0.85
14
2.28
36
3.42
0.96
Right
-"'I----ja-1-1-4lIe-,-L
3.83-
4.79
1.00
7
6.00
1.67-
3.43
1.14
10
5.58
2,75-
4.49
0.91
12
6.17
1.25-
20
4.67
1.50-
11
4.17
2.67-
0.57
11
4.25
±
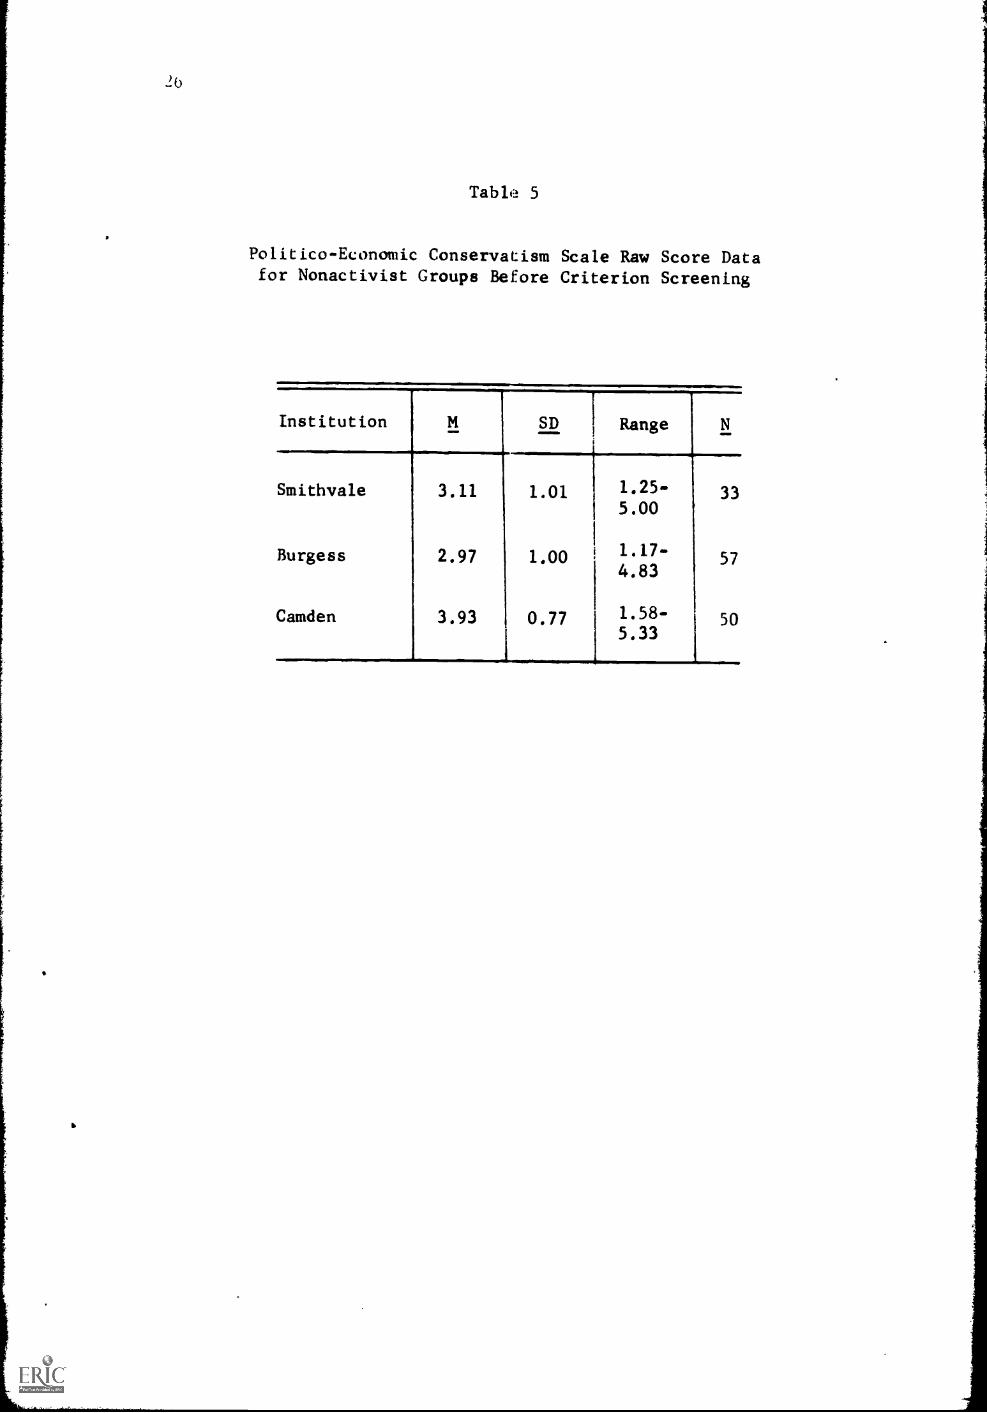
Table 5
Politico-Economic Conservatism Scale Raw Score Datafor Nonactivist Groups Before Criterion Screening
Institution M SD Range N
Smithvale 3.11 1.01 1.25- 335.00
Burgess 2.97 1.00 1.17-57
4.83
Camden 3.93 0.77 1.58- 505.33
To perLentile cutting points selected were, for the left ideologyroe,)s , the 1.0 through 24.9 percentile; for the middle ideologygroups,
groups , the 2S.0 through 74.9 ptrcentile; and for the right ideologygroups. the 75.0 through 99.9 percentile. The selection percentileranges and corresponding raw score data for the PEC Scale are pre-sented in Table 6. The numbers .).f subjects given in Table 6 are thefinal. Ns of the subgroups in this research. All data presented sub-sequently are for these finally selected subjects only.
The single criterion for asignment to an activist or nonactiv-ist group was membership in a politically active organization or ina politically nonactive organization, respectively. The nonactivistshad to fulfill the further requirement of not belonging to anypolitical activist campus organizations. This was ascertained byresponses to the experimenter's request for, nonactivist subjects whowere members of both kinds of organizations to identify themselves,and by examination of all subjects' responses on the Campus ActivitiesList A quantitative measure of amount of actual activism engaged inwas also obtained in order to verify the extent of political activismof the groups on the activism-nonactivism dimension: results of thatmeasure are discussed in the section entitled Personality, Attitude,and Intelligence Measures, below.
The sole criterion for assignment to one of the three institutiongroupings was self-reported status as a registered student at that"nstitution. One subject at each institution was eliminated from thestudy because he was not a registered student.
Before leaving the discussion of the criterion screening, it maybe worthwhile to comment upon the subsample sizes. Because of theforced "purity" of the ideology categories, there were fewer subjectsin some cells than might be thought optimal. It is not felt that thiswould vitiate the results of this study, however, because the analysisof variance statistic used for the data analysis combines across cellsfor the main effects and for the two-way interactions. Only in thecase of the three-way interaction would cell size necessarily causesome concern about interpretation of the data, and in the case of somesimple effects it might lead to caution in interpretation. For allthe main and two-way interaction effects, however, the sample size ofindividual cells should not be cause for reservation.
Characteristics of the Samples
Demographic data, descriptive of each subject group, were obtainedfrom the subjects' identification code. The data for organizationmembership are presented in Table 7. Except at Burgess University,the distributions of Leaders and members among the various organiza-tions at each institution are similar. It should be noted that thesedata for the left activist organizations may be misleading, however,for the members of these groups at all three institutions claimed that
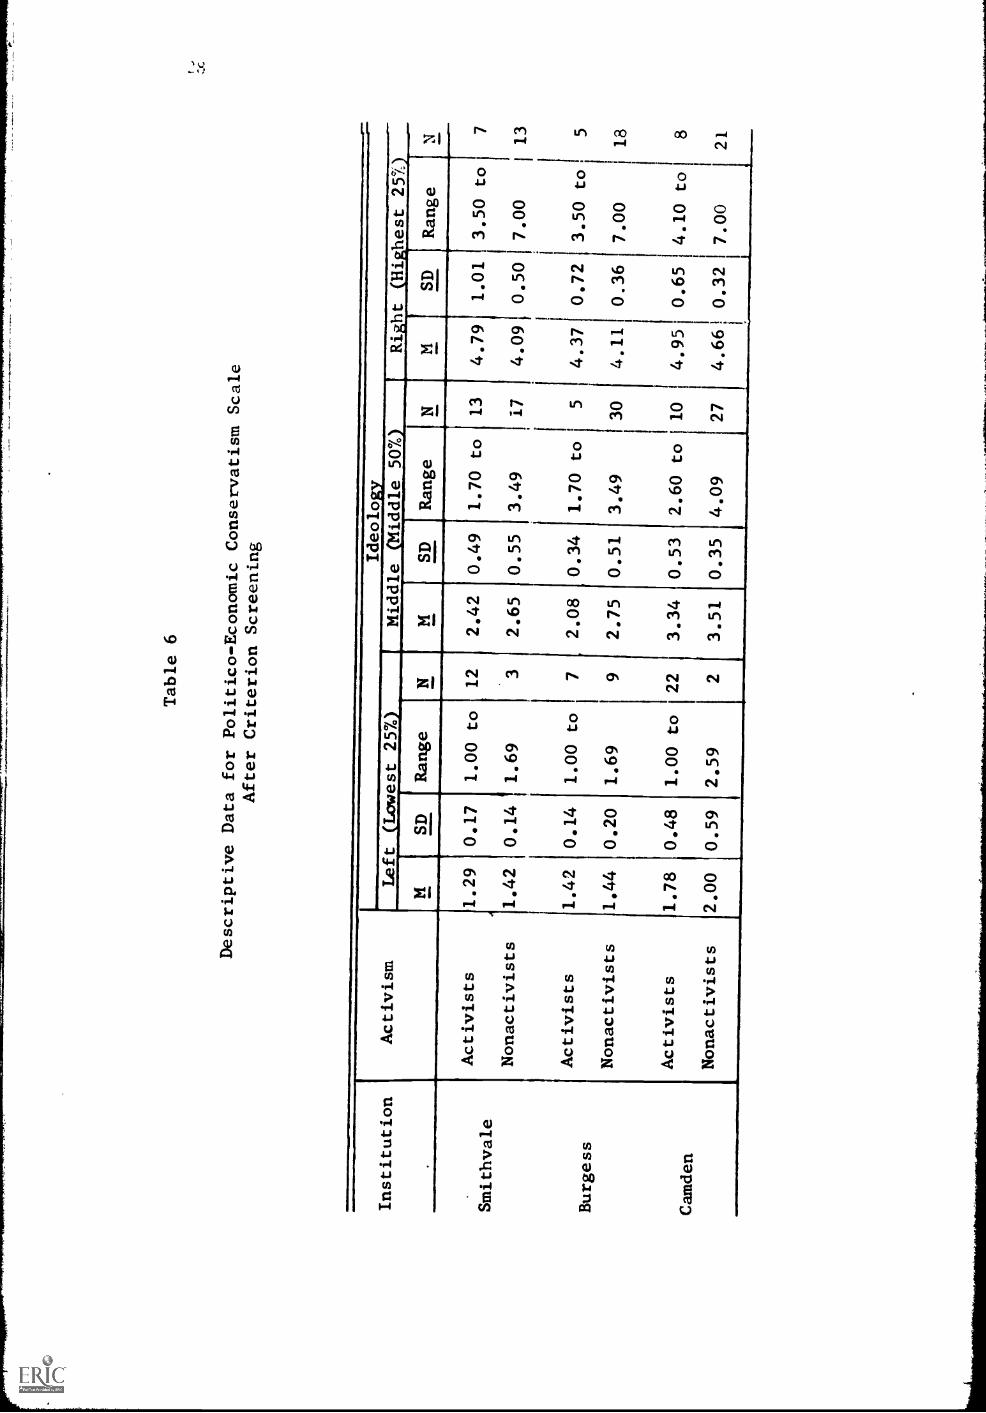
Table 6
Descriptive Data for Politico-Economic
Conservatism Scale
After Criterion Screening
Institution
Activism
Ideology
Left ILowest 25%)
Middle (Middle 50%)
Right (Highest 25'/.
SD
Range
MSD
Range
NM
SD
Range
N4._
Activists
1.29
0.17
1.00 to
12
2.42
0.49
1.70 t
13
4.79
1.01
3.50 to
7Smithvale
Nonactivists
1.42
0.14
1.69
32.65
0.55
3.49
17
4.09
0.50
7.00
13
Activists
1.42
0.14
1.00 to
2.08
0.34
1.70 to
54.37
0.72
3.50 to
5Burgess
Nonactivists
1.44
0.20
1.69
2.75
0.51
3.49
30
4.11
0.36
7.00
18
Activists
1.78
0.48
1.00 to
22
3.34
0.53
2.60 to
10
4.95
0.65
4.10 to
8Camden
Nonactivists
2.00
0.59
2.59
23.51
0.35
4.09
27
4.66
0.32
7.00
21
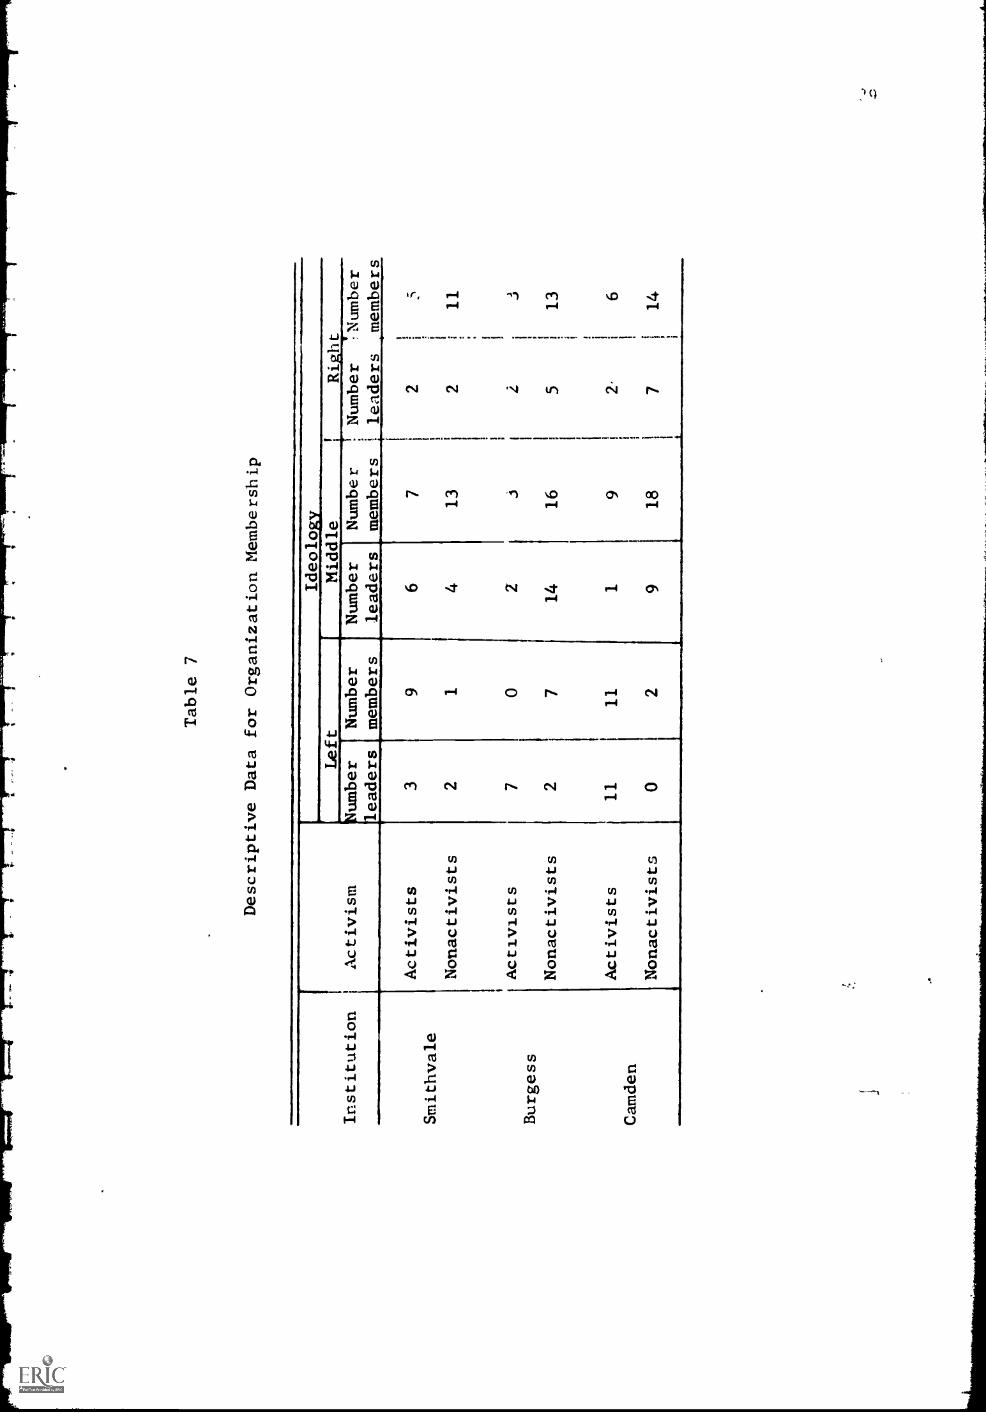
Table 7
Descriptive Data for Organization Membership
Institution
Activism
Ideology
Left
Middle
Right
Number
leaders
Number
members
Number
leaders
Number
members
Number
leaders
Number
,members
Activists
39
67
25
Smithvale
Nonactivists
21
413
c2
11
Activists
70
2Burgess
Nonactivists
27
14
16
513
Activists
11
11
19
2i
6Camden
Nonactivists
02
918
7i
14
;It
ih(re were no hierarchical designations of leaders and members madein their organizations, and consequQntly they marked that particularcode item spuriously. As can be seen in Table 8, sex was distributedamong the Burgess and Camden organizations relatively unevenly. In
Table 9, the data for major area of study are presented. As can beseen in the Code Number Instructions (Appendix B), subjects had theirchoice of 12 categories of major. These categories were combined fortabular presentation into five classifications. Examination of Table9 reveals that a preponderance of students major in the arts, humani-ties, and social sciences. There are also apparent differences amongthe institutions. Smithvale and Burgess students are even more heavilyoverrepresented in the "hard" sciences and in the humanities and socialsciences than are Camden students. Chi-squares were not calculated forany of the data discussed above, as cell frequencies were such that toomany low expected frequencies would have occurred, violating the assump-tions for the chi-square.
Data for the variables of age, year in school, number of yearsspent at the particular institution, and number of campus activitiesengaged in (obtained from the Campus Activities List) are presented inTables 10, 11, 12, and 13, respectively. Because these are all continu-ous variables, an analysis of variance was computed for each measure toascertain any differences among the research subgroups. Preliminary tocomputing analyses of variance, Cochran's tests (Eisenhart, Hastay, andWallis, 1947, ch. 15) for heterogeneity of variance were performed onthe variances of all Institution X Activism X Ideology cells. The re-
sults of the Cochran's tests, for all the continuous measures, are re-ported in Table 37, Appendix C. The acceptable level of statisticalsignificance for all statistical tests used throughout this research was
<.05. Of the demographic variables under discussion here, onlynumber of activities departed significantly from homogeneity of variance.A parametric analysis of variance for this measure was therefore inappro-priate, but it was computed nevertheless, for the sake of comparabilitywith the other measures. It should be interpreted with marked reserva-tions, however.
The least squares solution unequal frequency analyses of variance(Harvey, 1960) of the four demographic variables are presented in Tables38, 39, 40, and 41 in Appendix D. All three main effects for age weresignificant. The nonactivists were, overall, significantly older thanthe activists. Newman-Keuls analyses indicated that the left-orientedstudents were older than the middle and right students, and that thestudents at Camden were significantly older than those at the other twoinstitutions. Newman-Keuls analyses of the Institution main effect foryear in school and year at the institution indicated that the studentsat Camden were at a higher year level and had been at their institution
longer than those at Burgess or Smithvale. The analysis for number ofactivities indicated that the activists engaged in significantly morecampus activities than the nonactivists; Newman-Keuls analysis of the
Institution main effect revealed that the Smithvale students, overall,
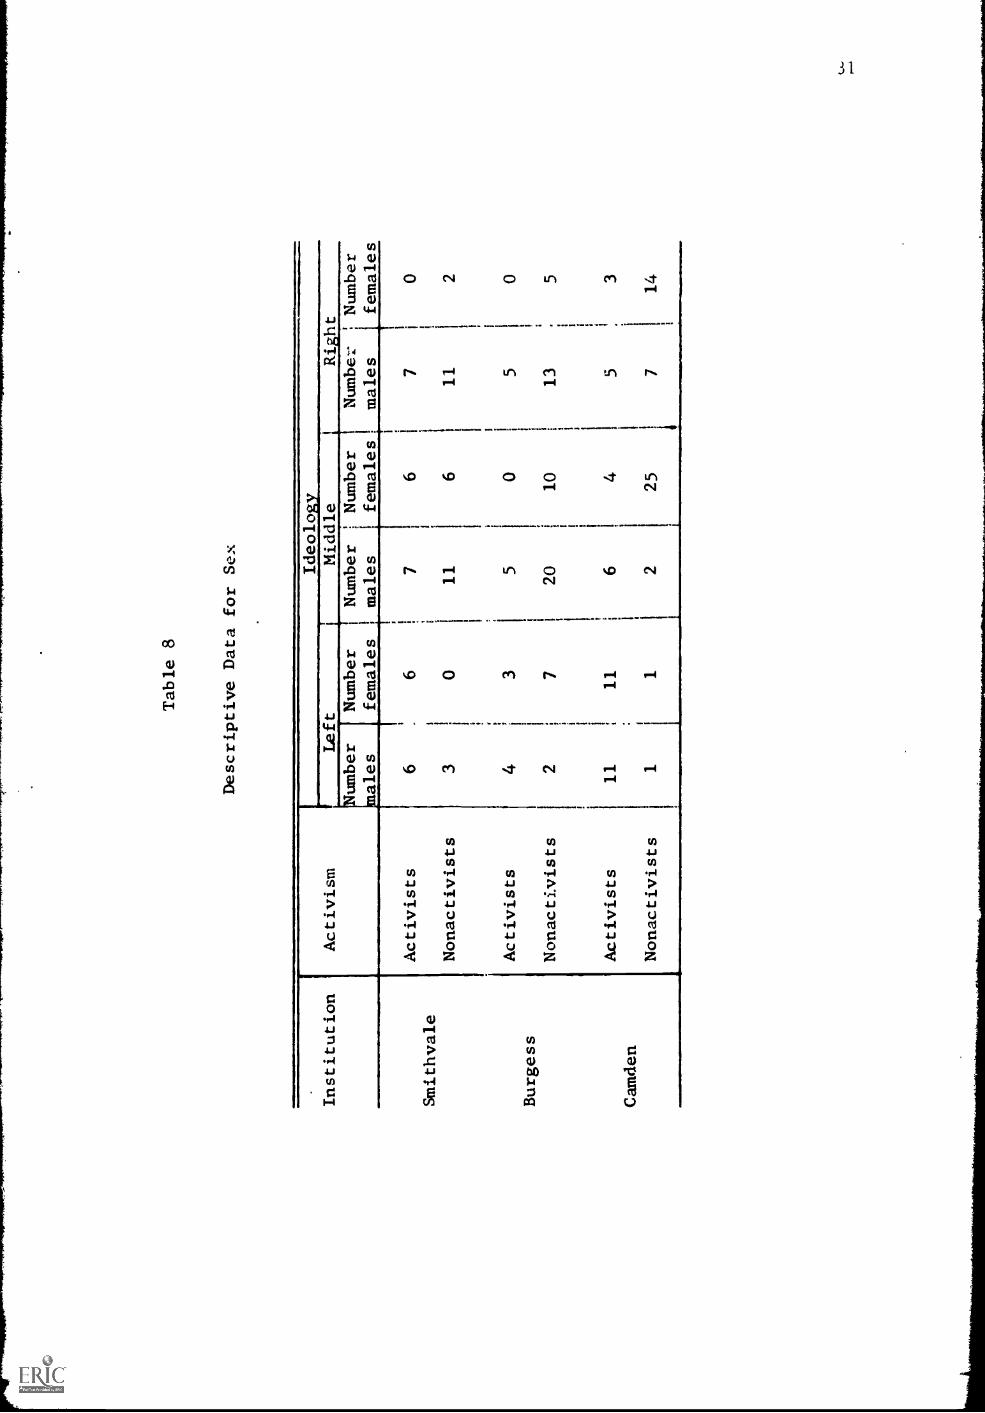
Table 8
Descriptive Data for Sex
Institution
Activism
Ideology
Left
Middle
Right
Number
males
Number
females
Number
males
Number
1
females
Number
!
males
Number
females
Activists
66
76
I
70
Smithvale
Nonactivists
30
11
6i
11
2
Activists
43
50
50
Burgess
Nonactivists
27
20
10
13
5
Activists
11
11
64
53
Camden
1
Nonactivists
11
225
714
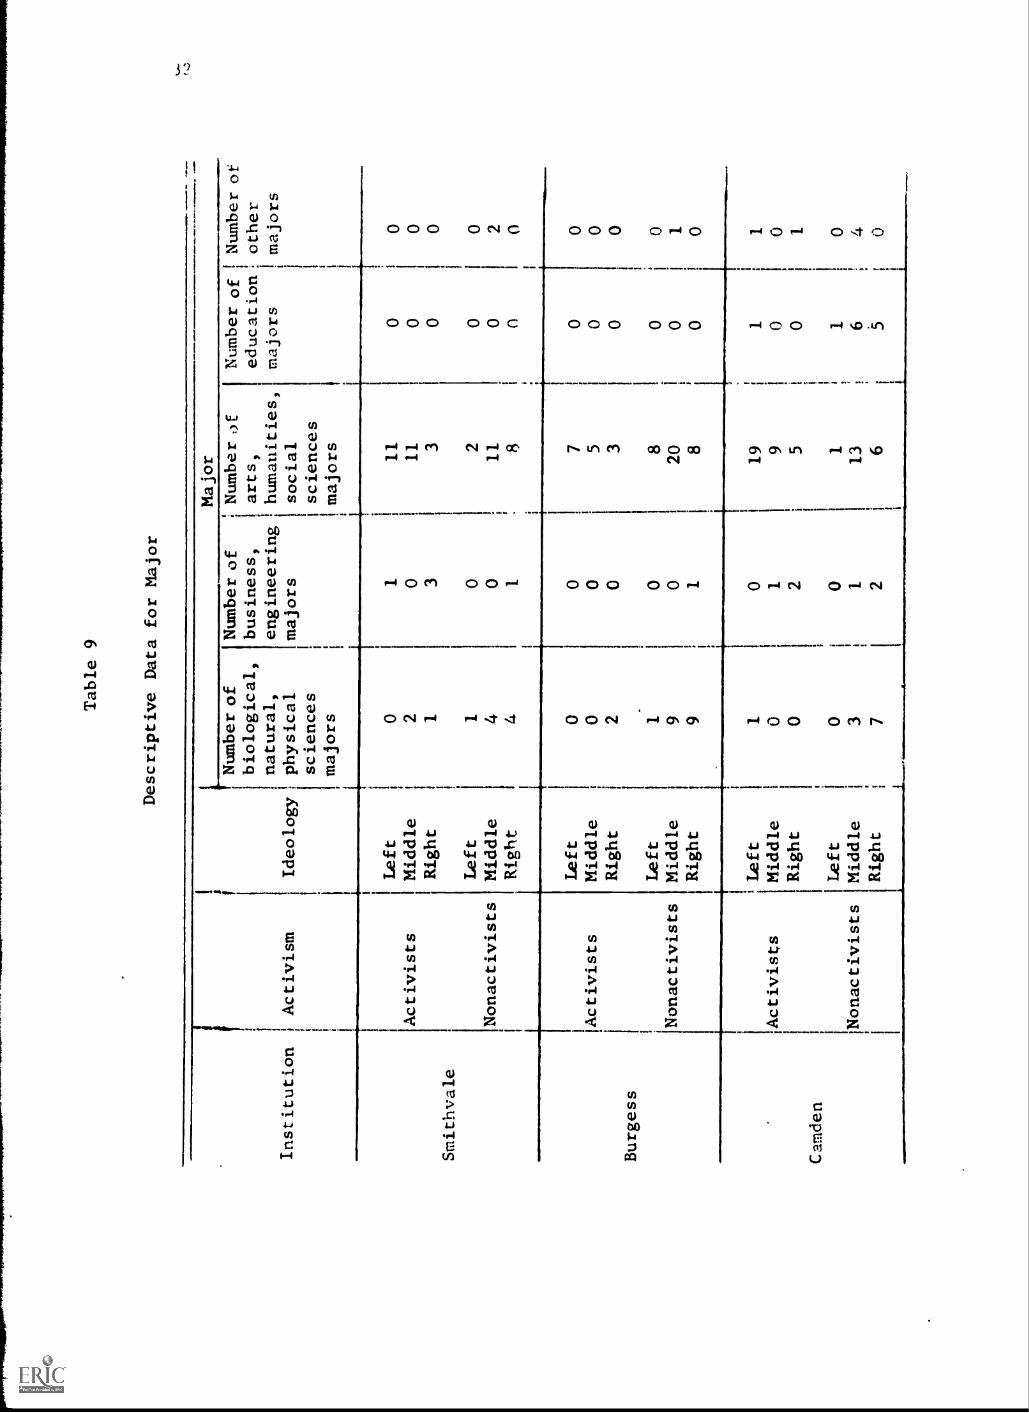
Table 9
Descriptive Data for Major
Institution
Activism
Ideology
Major
Number of
biological,
natural,
physical
sciences
majors
Number of
business,
engineering
majors
Number of
arts,
humanities
,
social
sciences
majors
Number of
Number of
education
other
majors
f
majors
Left
01
11
00
Activists
Middle
20
11
00
Right
33
00
Smithvale
Left
10
20
0Nonactivists
Middle
40
11
02
Right
18
0
Left
00
70
0Activists
Middle
00
50
0
Right
20
30
0Burgess
Left
10
80
0Nonactivists
Middle
90
20
01
Right
91
80
0
Left
10
19
11
Activists
Middle
01
90
0
Right
02
50
1
Camden
Left
00
10
Nonactivists
Middle
31
13
64
Right
72
65
0
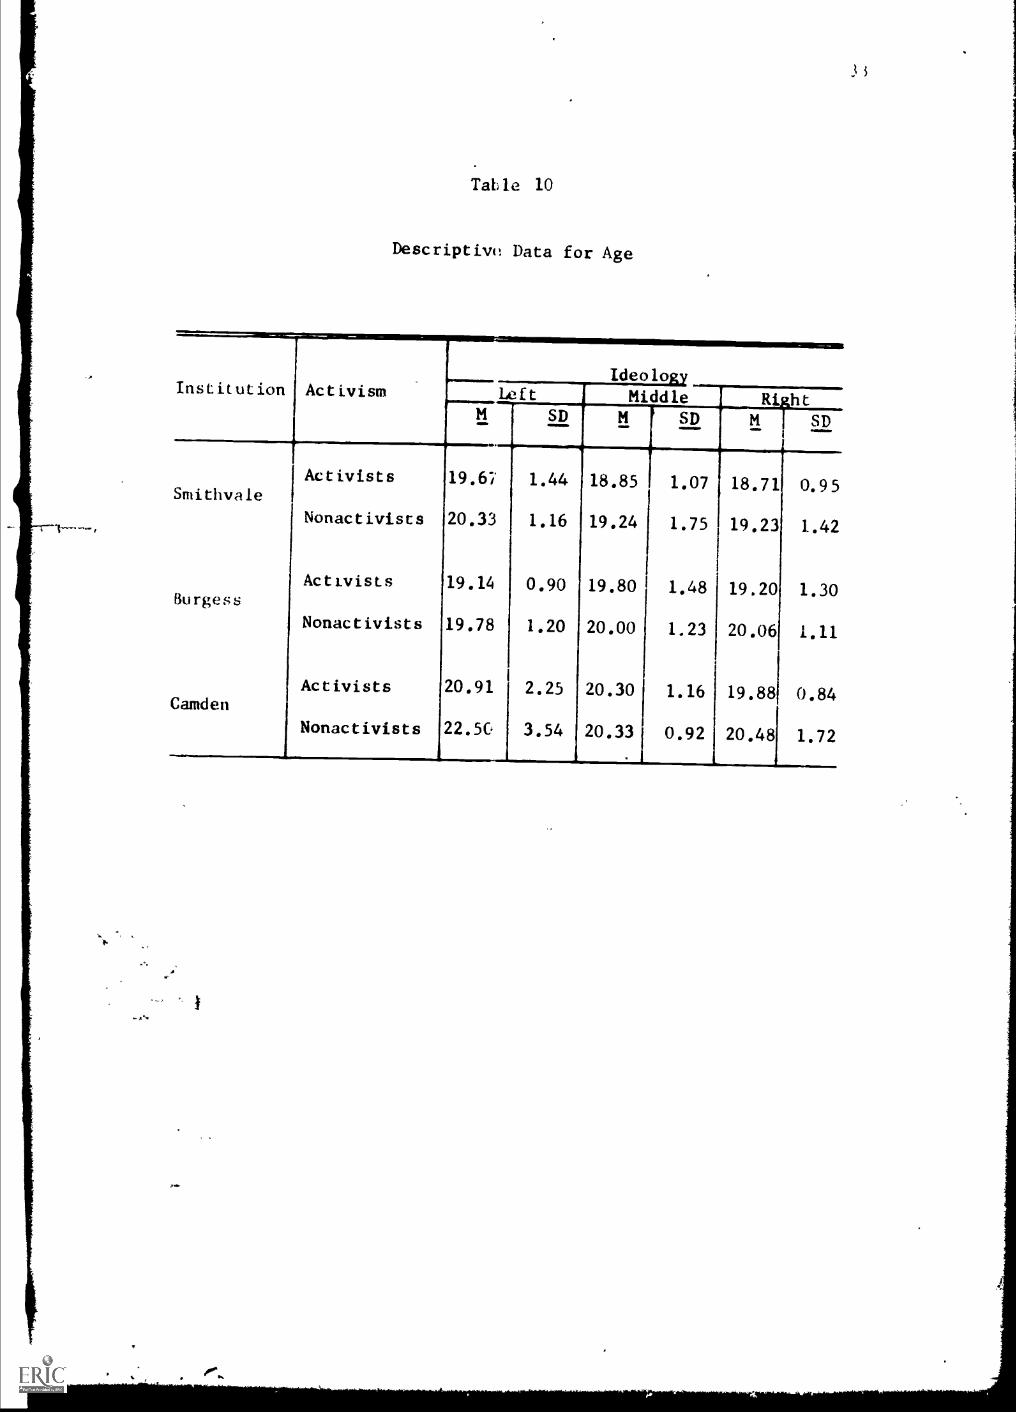
Tat; le 10
Descriptivc Data for Age
Institution Activism LeftM
Smithvale
Burgess
Camden
Activists
Nonactivists
Activists
Nonactivists
Activists
Nonactivists
19.6-/
20.331
19.14
19.78
20.91
22.5C
IdeologyMiddle Right
SD M SD SD
1.44 18.85 1.07 18.71 0.95
1.16 19.24 1.75 19.23 1.42
0.90 19.80 1.48 19.20 1.30
1.20 20.00 1.23 20.06 1.11
2.25 20.30 1.16 19.88 0.84
3.54 20.33 0.92 20.481 1.72
3i
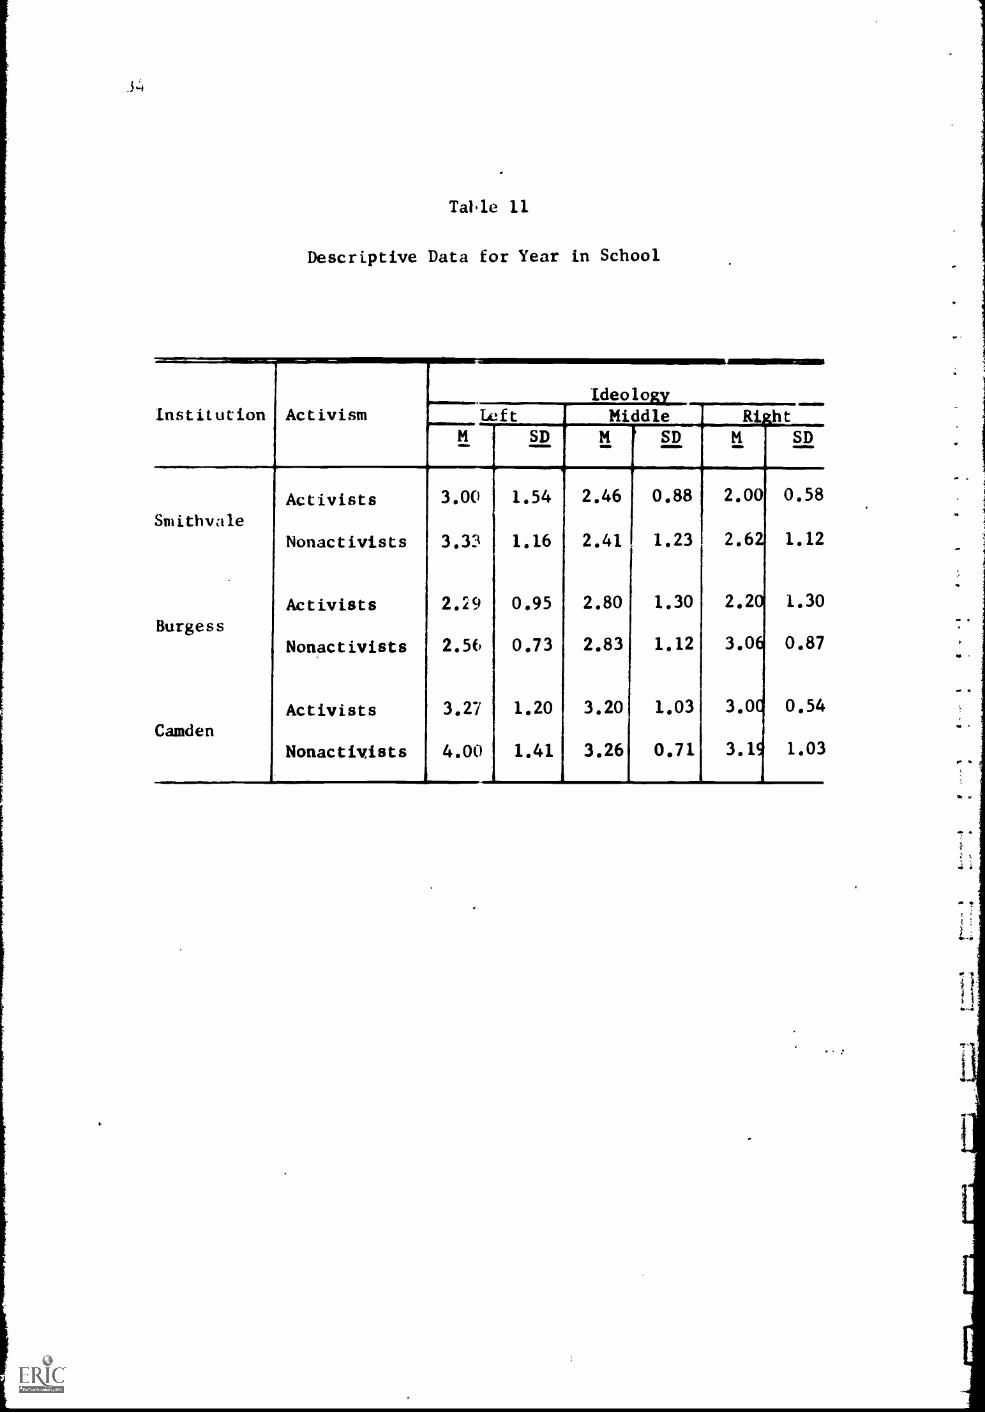
.34
Tal.le 11
Descriptive Data for Year in School
Institution ActivismIdeology
Left Middle RightSD M SD M SD
Activists 3.00 1.54 2.46 0.88 2.00 0.58
SmithvaleNonactivists 3.33 1.16 2.41 1.23 2.62 1.12
Activists 2.29 0.95 2.80 1.30 2.20 1.30
BurgessNonactivists 2.5( 0.73 2.83 1.12 3.06 0.87
Activists 3.27 1.20 3.20 1.03 3.0C 0.54
CamdenNonactivists 4.00 1.41 3.26 0.71 3.1S 1.03
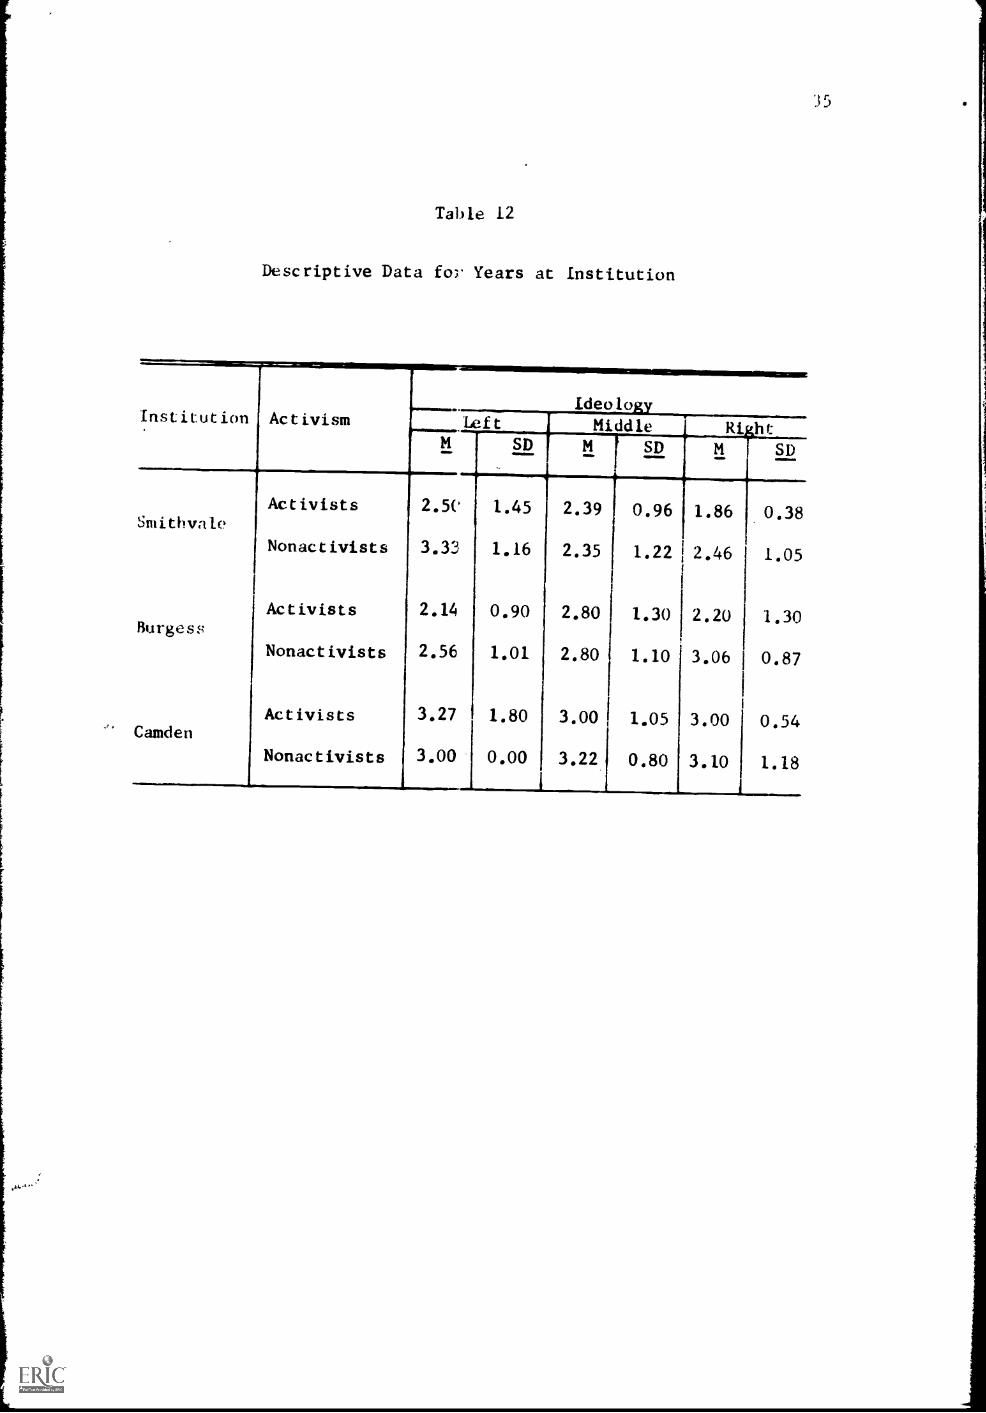
'3 5
Table 12
Descriptive Data fo Years at Institution
Institution ActivismIdeology
Left Middle
RirSDSD M I
SD
1.86 0.38Activists 2.5e 1.45 2.39 0.96
Smithvale
Nonactivists 3.33 1.16 2.35 1.22 2.46 1.05
Activists 2.14 0.90 2.80 1.30 2.20 1.30Burgess
Nonactivists 2.56 1.01 2.80 1.10 3.06 0.87
Activists 3.27 1.80 3.00 1.05 3.00 0.54Camden
Nonactivists 3.00 0.00 3.22 0.80 3.10 1.18
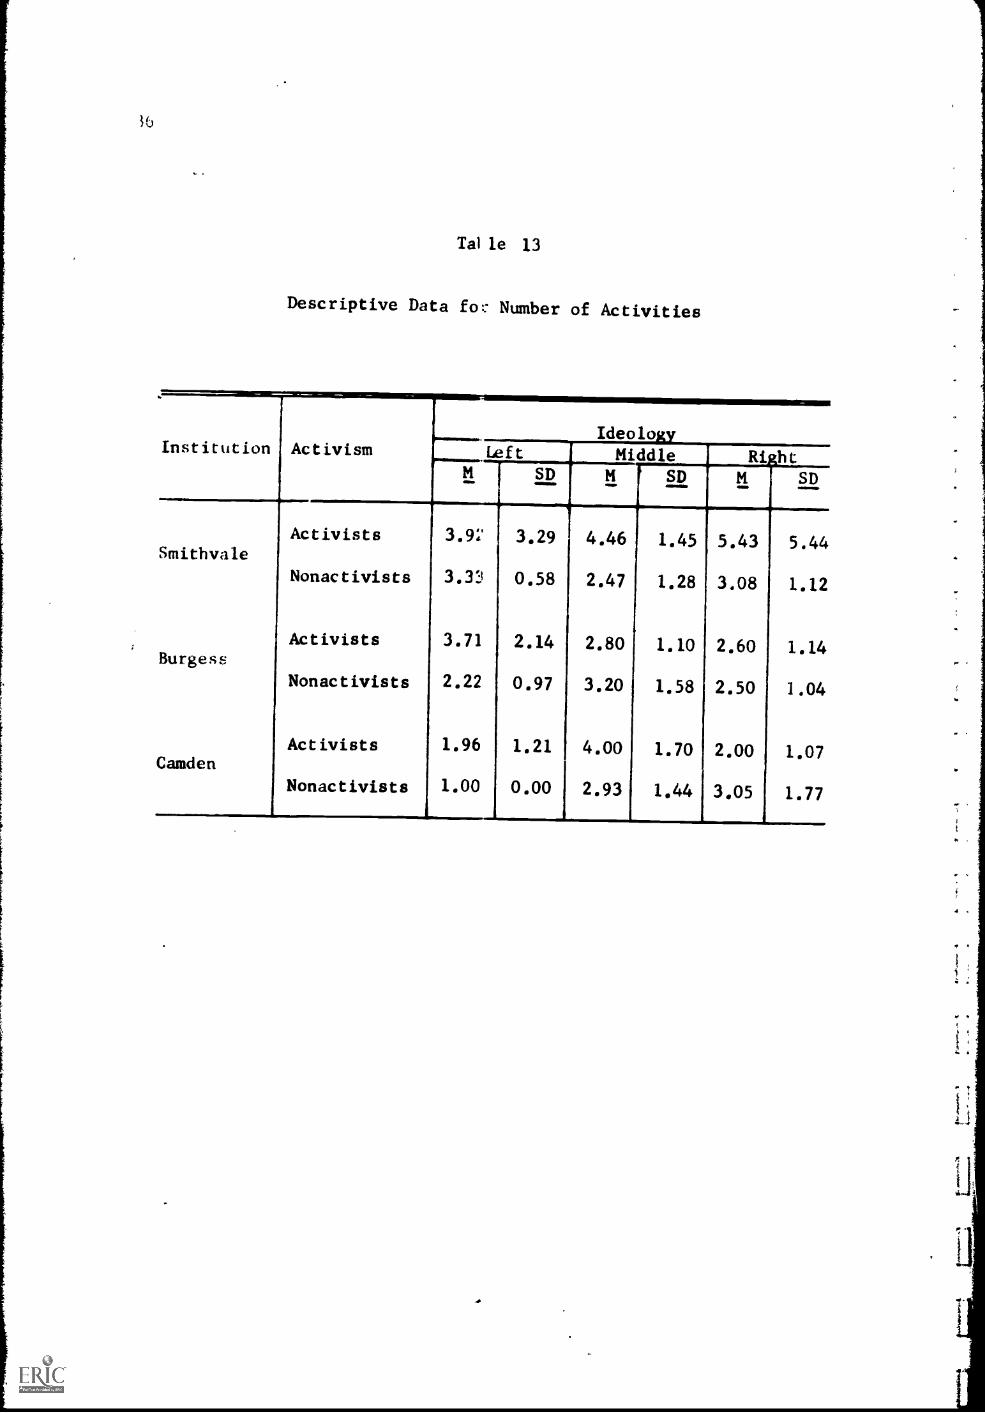
Tal le 13
Descriptive Data fo:: Number of Activities
Institution Activism Left
SD
Smithvale
Burgess
Camden
Activists 3.9:1 3.29
Nonactivists 3.3'J 1 0.58
Activists 3.71 2.14
Nonactivists 2.22 0.97
Activists 1.96 1.21
Nonactivists 1.00 0.00
IdeologyMiddle Right
M SD M SD
4.46 1.45 5.43 5.44
2.47 1.28 3.08 1.12
2.80 1.10 2.60 1.14
3.20 1.58 2.50 1.04
4.00 1.70 2.00 1.07
2.93 1.44 3.05 1.77
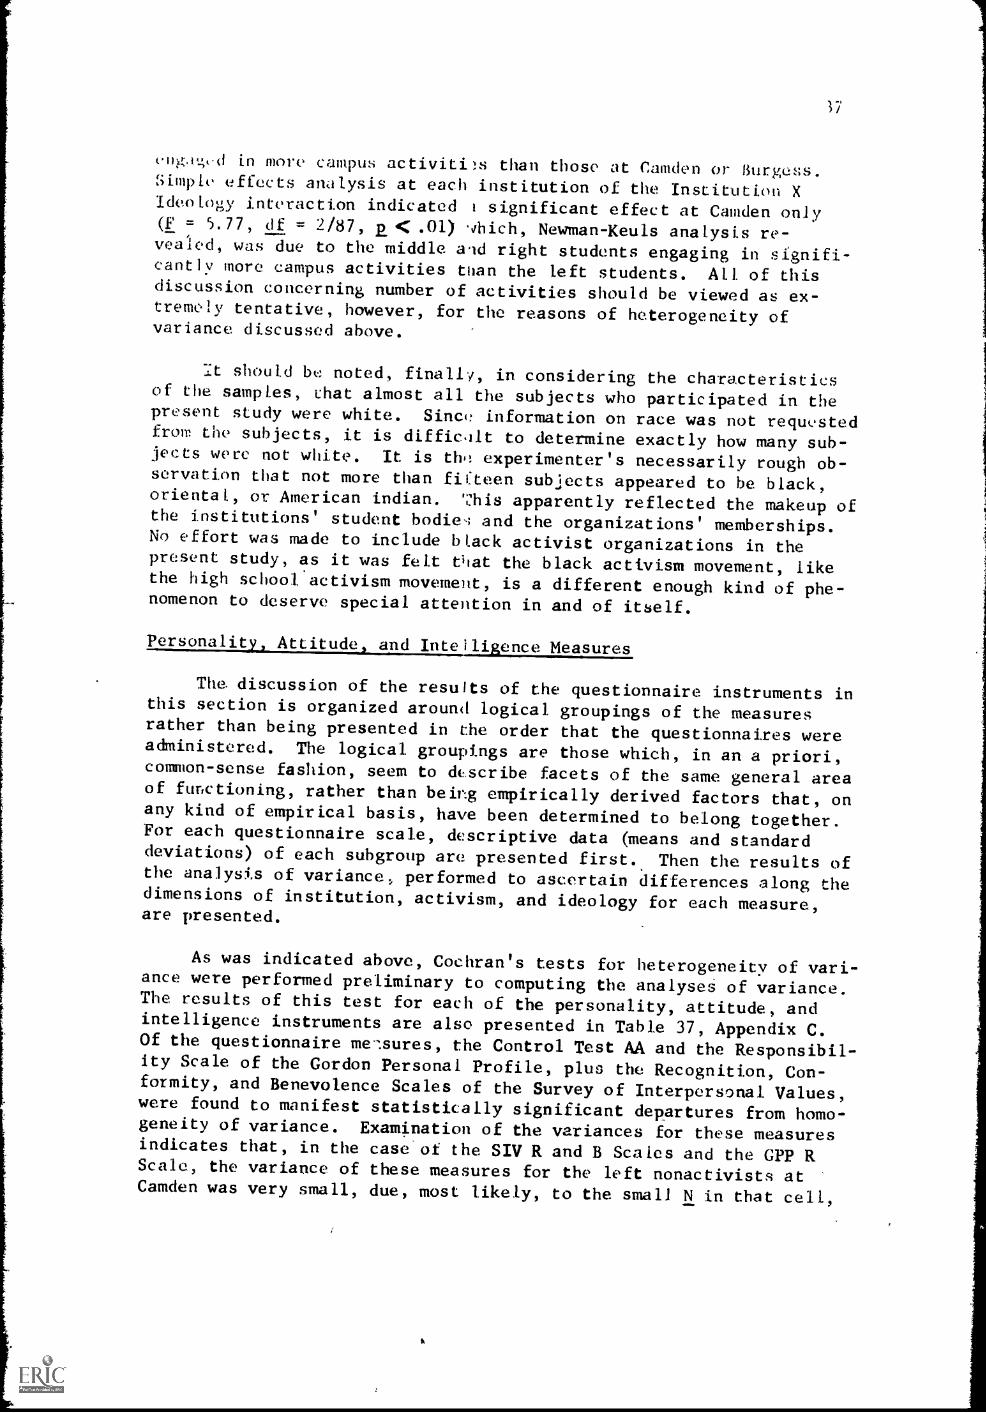
37
cogA,.;,d in more campus activities than those at Camden or Rurgess.Simple effects analysis at each institution of the Institution XIdeology interaction indicated i significant effect at Camden only(F = 5.77, df = 2/87, Et< .01) which, Newman-Keuls analysis re-vealed, was due to the middle ald right students engaging in signifi-cantly more campus activities tban the left students. All of thisdiscussion concerning number of activities should be viewed as ex-tremely tentative, however, for the reasons of heterogeneity ofvariance discussed above.
:t should be noted, finally, in considering the characteristicsof the samples, chat almost all the subjects who participated in thepresent study were white. Since information on race was not requestedfrom the subjects, it is difficlt to determine exactly how many sub-jects were not white. It is th.! experimenter's necessarily rough ob-servation that not more than fifteen subjects appeared to be black,oriental, or American Indian. This apparently reflected the makeup ofthe institutions' student bodie'; and the organizations' memberships.No effort was made to include black activist organizations in thepresent study, as it was felt that the black activism movement, likethe high school activism movement, is a different enough kind of phe-nomenon to deserve special attention in and of itself.
Personality, Attitude, and Intelligence Measures
The discussion of the results of the questionnaire instruments inthis section is organized around logical groupings of the measuresrather than being presented in the order that the questionnaires wereadministered. The logical groupings are those which, in an a priori,common-sense fashion, seem to describe facets of the same general areaof functioning, rather than being empirically derived factors that, onany kind of empirical basis, have been determined to belong together.For each questionnaire scale, descriptive data (means and standarddeviations) of each subgroup are presented first. Then the results ofthe analysi.s of variance, performed to ascertain differences along thedimensions of institution, activism, and ideology for each measure,are presented.
As was indicated above, Cochran's tests for heterogeneity of vari-ance were performed preliminary to computing the analyses of variance.The results of this test for each of the personality, attitude, andintelligence instruments are also presented in Table 37, Appendix C.Of the questionnaire measures, the Control Test AA and the Responsibil-ity Scale of the Gordon Personal Profile, plus the Recognition, Con-formity, and Benevolence Scales of the Survey of Interpersonal Values,were found to manifest statistically significant departures from homo-geneity of variance. Examination of the variances for these measuresindicates that, in the case of the SIV R and B Scales and the GYP RScale, the variance of these measures for the left nonactivists atCamden was very small, due, most likely, to the small N in that cell,
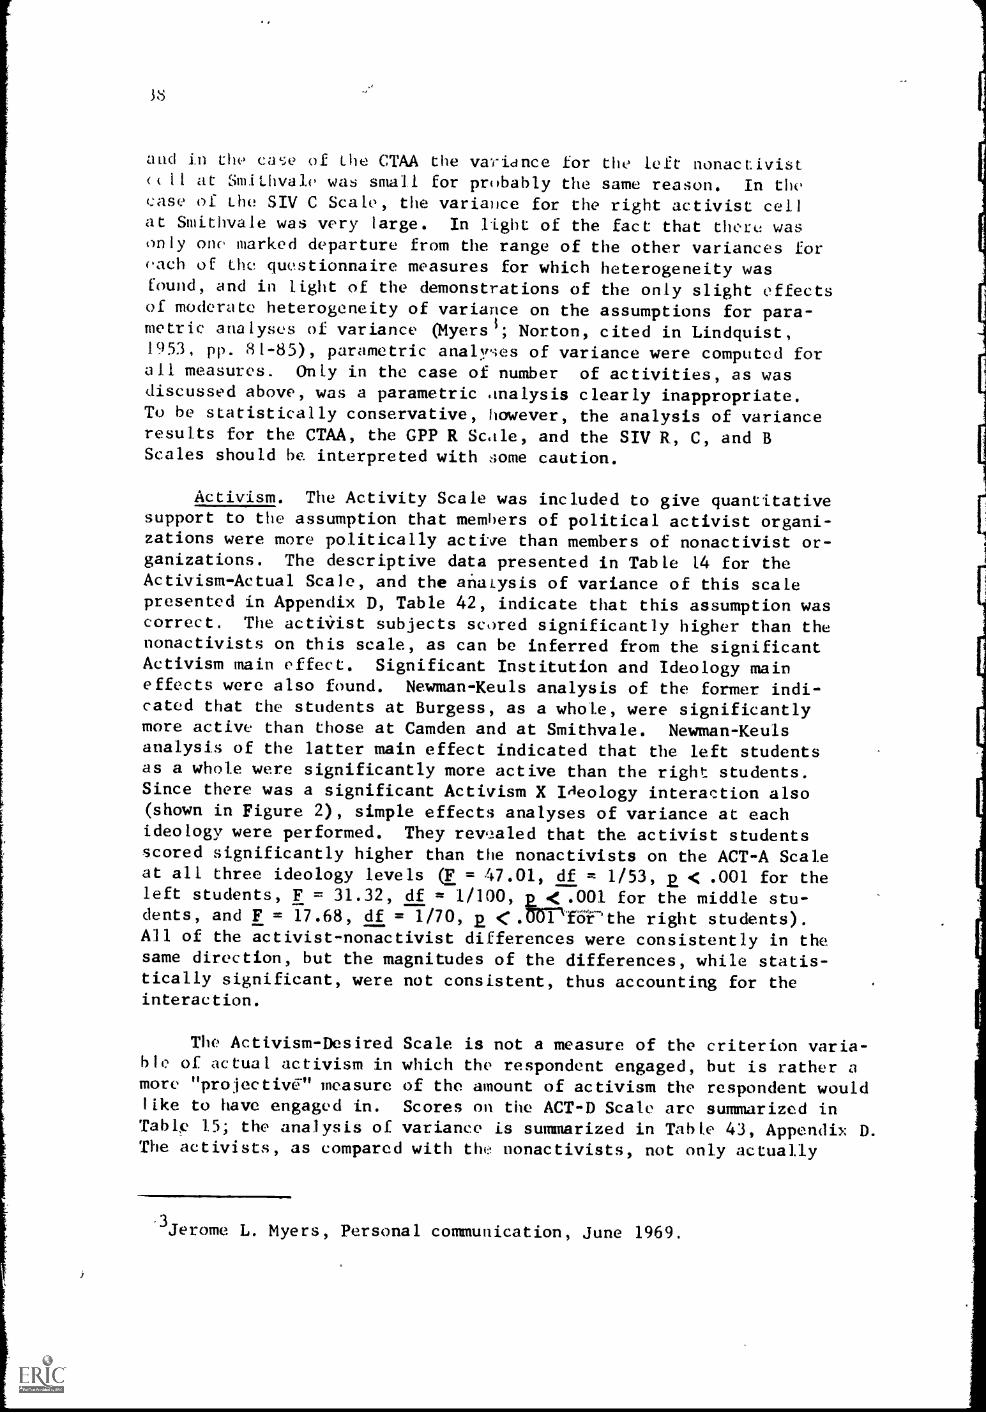
and in the ca ,A, of the CTAA the variance for the left nonactivist« 11 at Smithvale was small for probably the same reason. In thecase of the SIV C Scale, the variance for the right activist cellat Smithvale was very large. In light of the fact that there wasonly one marked departure from the range of the other variances foreach of the questionnaire measures for which heterogeneity wasfound, and in light of the demonstrations of the only slight effectsof moderate heterogeneity of variance on the assumptions for para-metric analyses of variance (Myers 1; Norton, cited in Lindquist,1953, pp. 81-85), parametric analres of variance were computed forall measures. Only in the case of number of activities, as wasdiscussed above, was a parametric analysis clearly inappropriate.To be statistically conservative, however, the analysis of varianceresults for the CTAA, the GPP R Scale, and the SIV R, C, and BScales should be interpreted with some caution.
Activism. The Activity Scale was included to give quantitativesupport to the assumption that members of political activist organi-zations were more politically active than members of nonactivist or-ganizations. The descriptive data presented in Table 14 for theActivism-Actual Scale, and the analysis of variance of this scalepresented in Appendix D, Table 42, indicate that this assumption wascorrect. The activist subjects scored significantly higher than thenonactivists on this scale, as can be inferred from the significantActivism main effect. Significant Institution and Ideology maineffects were also found. Newman-Keuls analysis of the former indi-cated that the students at Burgess, as a whole, were significantlymore active than those at Camden and at Smithvale. Newman-Keulsanalysis of the latter main effect indicated that the left studentsas a whole were significantly more active than the right students.Since there was a significant Activism X Ideology interaction also(shown in Figure 2), simple effects analyses of variance at eachideology were performed. They rew!aled that the activist studentsscored significantly higher than the nonactivists on the ACT-A Scaleat all three ideology levels QE = 47.01, df = 1/53, 2 < .001 for theleft students, F = 31.32, df = 1/100, 21;.001 for the middle stu-dents, and F = 17.68, df = 1/70, 2 <JIDT7fOrthe right students).All of the activist-nonactivist differences were consistently in thesame direction, but the magnitudes of the differences, while statis-tically significant, were not consistent, thus accounting for theinteraction.
The Activism-Desired Scale is not a measure of the criterion varia-ble of actual activism in which the respondent engaged, but is rather amore "projective." measure of the amount of activism the respondent wouldlike to have engaged in. Scores on the ACT-D Scale arc summarized inTable 15; the analysis of variance is summarized in Table 43, Appendix D.The activists, as compared with the nonactivists, not only actually
3Jerome L. Myers, Personal communication, June 1969.
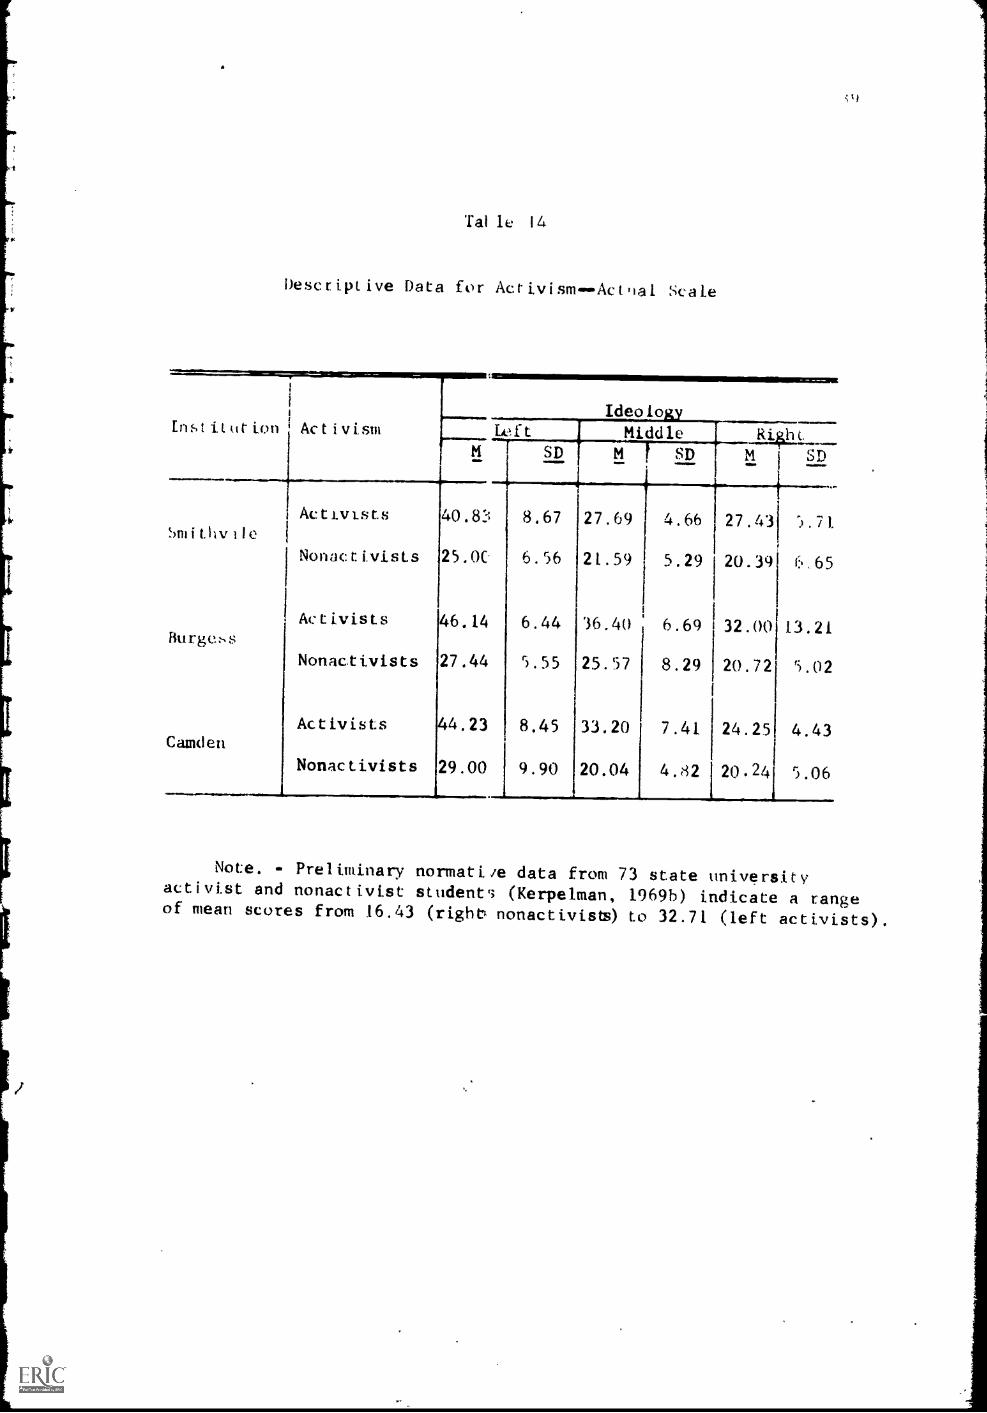
Tal le 14
Descriptive Data for Aerivism--Act,ial Scale
Enstiturion ActivismIdeology
Left Middle RiptSDSD M SD M
Acti.vIsts 40.8..:1 8.67 27.69 4.66 27.43 5.71SmithvileNonactivists 25.0C 6.56 21.59 5.29 20.39 6 65
Activists 46.14 6.44 '36.40 6.69 32.00 13.21Burgess
Nonactivists 27.44 5.55 25.57 8.29 20.72 5.02
Activists 44.23 8.45 33.20 7.41 24.25 4.43Camden
Nonactivists 29.00 9.90 20.04 4.82 20.24 5.06
Note. - Preliminary normati/e data from 73 state universityactivist and nonactivist student; (Kerpelman, 1969h) indicate a rangeof mean scores from 16.43 (right nonactivist) to 32.71 (left activists).
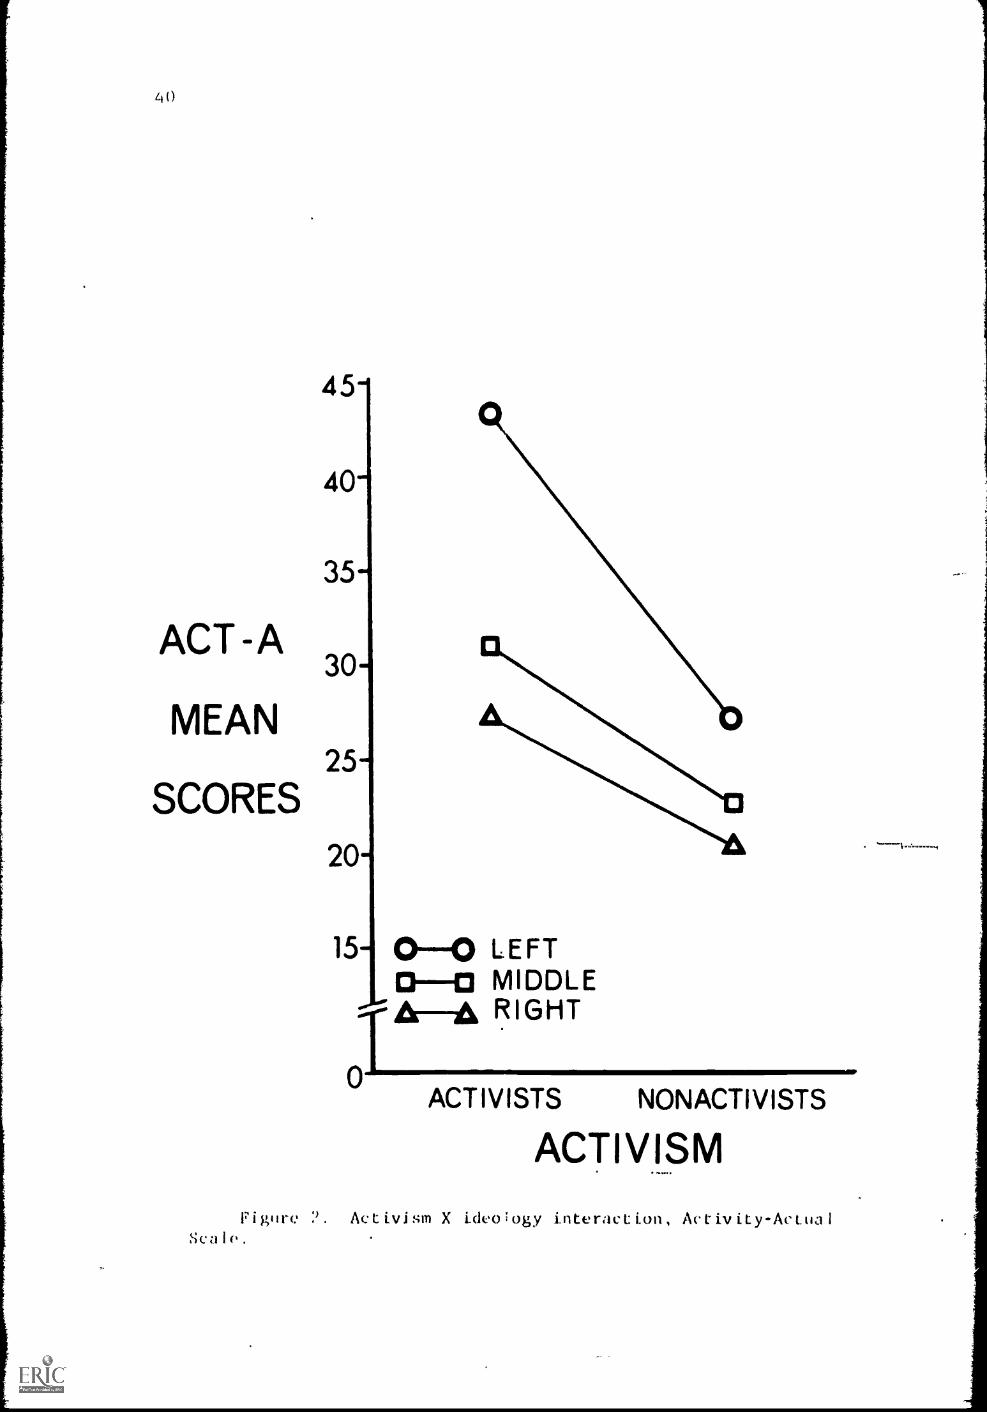
1.40
45-
40--
35-
ACT -A30-
MEAN25-
SCORES
20
15- 0-0 LEFTD--CI MIDDLEA-36, RIGHT
OjACTIVISTS NONACTIVISTS
ACTIVISM
Figure 7 . Activism X i.dco =ogy interact ion, Act iv ity-Ac Lila ISc a I P .
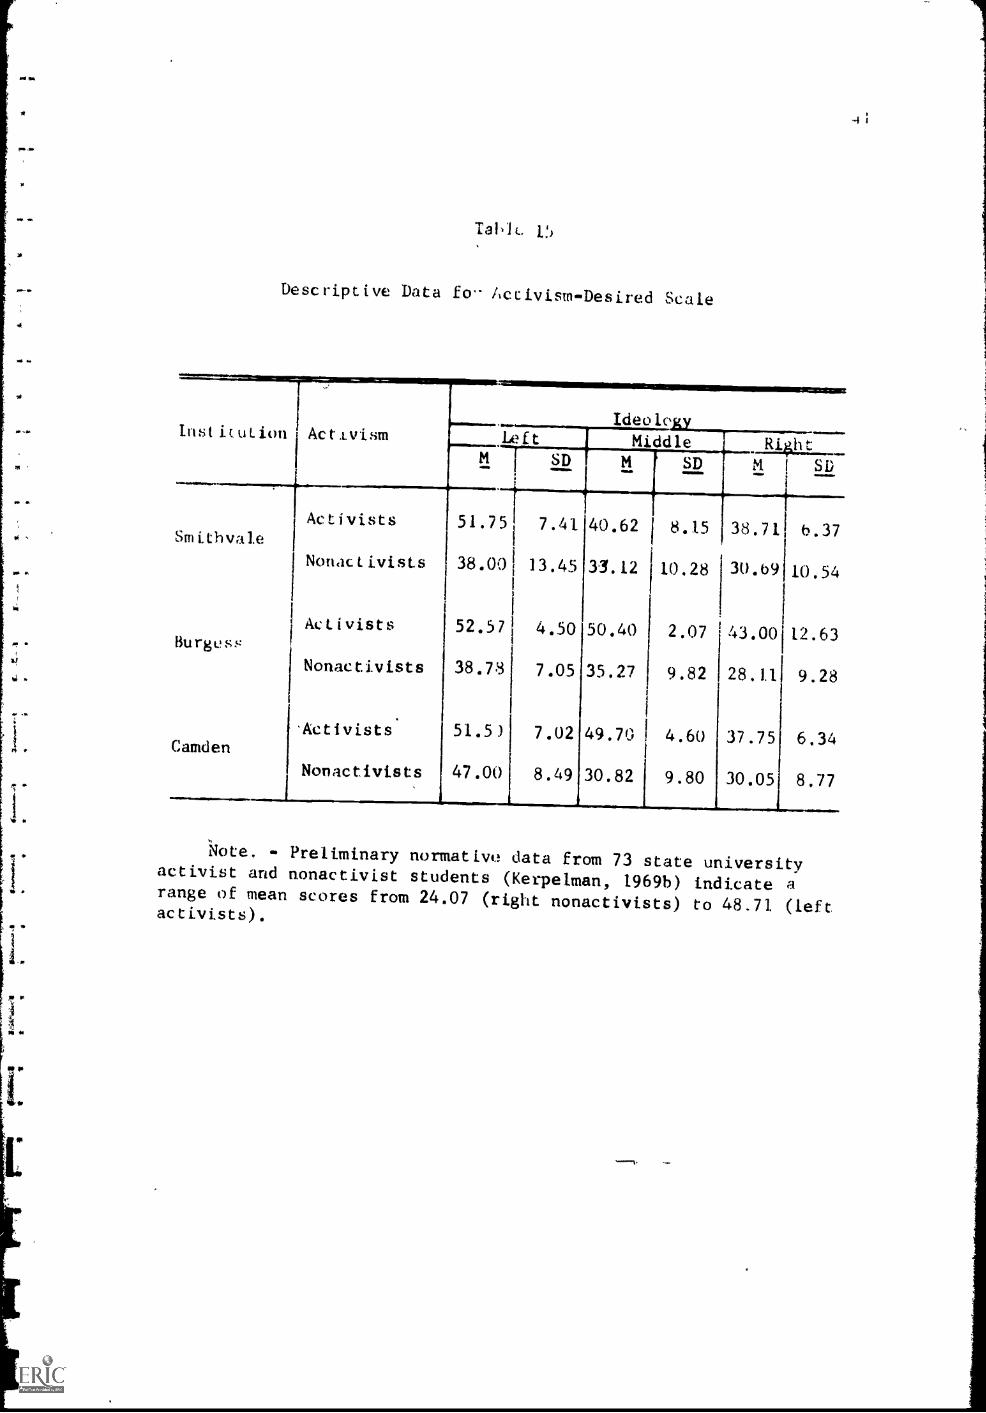
TaHL 1!)
Descriptive Data fo Accivism-Desired Scale
Insti(ution Activism
Smithvale
Burgess
Camden
LeftIdeolo
Middle Ri411tSD M SD SD
Activists 51.75 7.41
Nonact ivists 38.00 13.45
Activists
Nonactivists 38.78
'Activists 51.51
Nonactivists 47.00
52.57 4.50
40.62 8.15
33.12 10.28
38.71 6.37
30.b9 10.54
50.40 2.07 43.00 12.63
7.05 35.27 9.82 28.11 9.28
7.02 49.70 4.60 37.75 6.34
8.49 30.82 9.80 30.05 8.77
4;
Note, - Preliminary normative data from 73 state universityactivist and nonactivist students (Kerpelman, 1969b) indicate arange of mean scores from 24.07 (right nonactivists) to 48.71 (left.activists).
.n,!,:lcd lb mork political ae'tivity, as indicated by their At:T-Arespon4,(.;, imt also expressed the lesire to have engaged in evenwere potiti.cal activi.ty, as indica%ed by their ACT-D responses. The
(It the Newman-Keuls analysis of the ACT-U ideology mainTh.et palallel those of the ACT-A, i.e., left students scoredhia4her on the ACT -I) than did middl, ideology students, who in turnscored hil4her than the student rig itists.
Intellectual ability. Two measures of intellectual ability werei.,Iven to the subjects: the Quick Word Test, a measure of verbal in-telligence, and the Control Test ikak, a measure of academic ability.Doscriptive data for these two meawres are given in Tables 16 and 17,respectively; analyses of variance of the data are presented inTables 44 and 45, Appendix D. The results on both scales are similar:there were no significant differences along the activism dimension oralong the ideology dimension, nor were there any significant inter-ations. The only significant diUerence was an Institution maineffect, wherein, according to a Nwrman-Keuls analysis, students atSmithvale were more intelligent thin students at Burgess, who in turnwere more intelligent than student.; at Camden, as measured by boththe QWT and the CTAA.
Emotional stability. While soveral of the scales measuredvarious aspects of personality related to emotional adjustment, twoscales measured adjustment directl:. Results for the Gordon PersonalProfile Emotional Stability Scale and for the Cuilford-ZimmermanTemperament Survey Emotional Stabi'ity-Emotional Instability Scale arepresented in Tables IS and 19, respectively. It should be noted atthis point that the Ns for the GPP and for the GZTS differ from thesample Ns on the other scales. One middle nonactivist student atCamden was dropped from the GPP data pool because he did not fill outthat scale completely. Many subjei ts, in many of the subgroups, wcredropped from the various GZTS data pools because they marked too m nyitems "" on the CZTS scales (4 or more per scale). Consequently,the GZTS data are based upon attenuated sample sizes, and should
t
interpreted with this deficiency in mind. The cell. Ns for the C7 'Sdata are given 4n the appropriate tables.
The anpiNses ekthvarLance for GPP E Scale and the CZTS E Sealearc przysetitt,:ases,reowise Tables 46 and 47, Appendix D. Thereye,re si.411,ktt renevs\ any of the groups or along anyf the dimensi6 400n either ule.iiiig e of emotional stability.
Smial acceptance. Under thla-(heading have been placed scalesthat are pertinent to concern about the way a person appears to othersand the value a person places on h) s relative acceptability to othersand conformity to others. The re evant scales are all from the Surveyof Interpersonal Values; they are the Recognition, Support, Conformity,and Independence Scales. Data for these four scales are summarized inTables 20, 21, 22, and 23, respectively, and the analyses of varianceare summarized respectively in Tables 48, 49, 50, and 51. of Appendix 0.
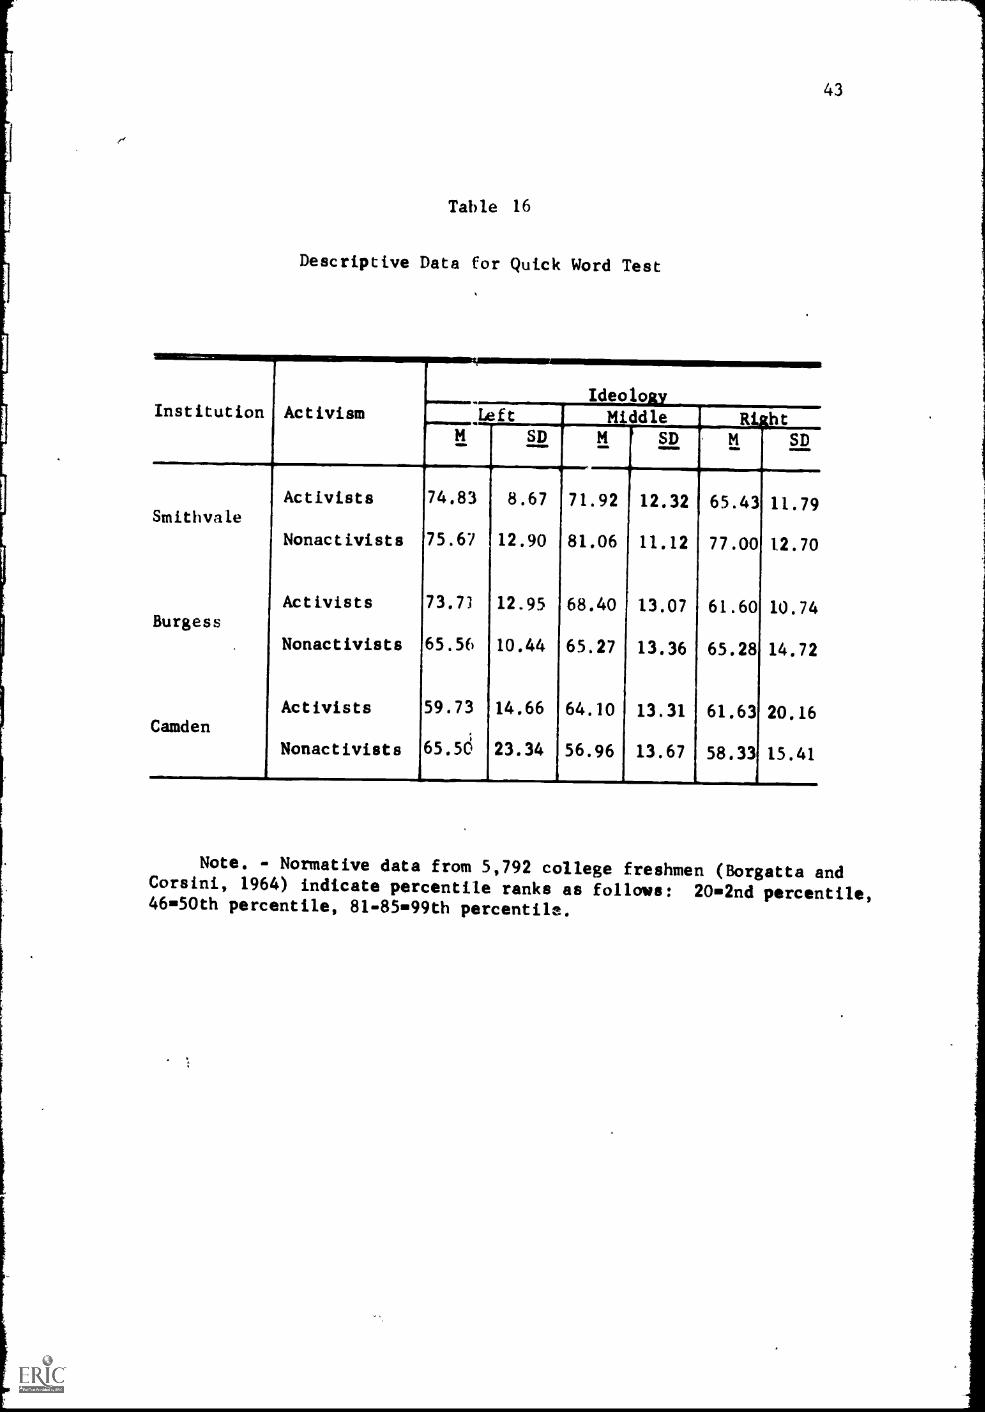
I
I
.,
Table 16
Descriptive Data for Quick Word Test
ONIIIIIIINISSFIBMININI10111/
43
Institution ActivismIdeology
Left Middle / RishtM
. .....-
M SD M I SD SD
V
Activists 74.83 8.67 71.92 12.32 65.43 11.79Smithvale
Nonactivists 75.67 12.90 81.06 11.12 77.00 12.70
Activists 73.73 12.95 68.40 13.07 61.60 10.74Burgess
Nonactivists 65.56 10.44 65.27 13.36 65.28 14.72
Activists 59.73 14.66 64.10 13.31 61.63 20.16Camden
Nonactivists 65.56 23.34 56.96 13.67 58.33 15.41
Note. - Normative data from 5,792 college freshmen (Borgatta andCorsini, 1964) indicate percentile ranks as follows: 20-2nd percentile,46-50th percentile, 81-85-99th percentile.
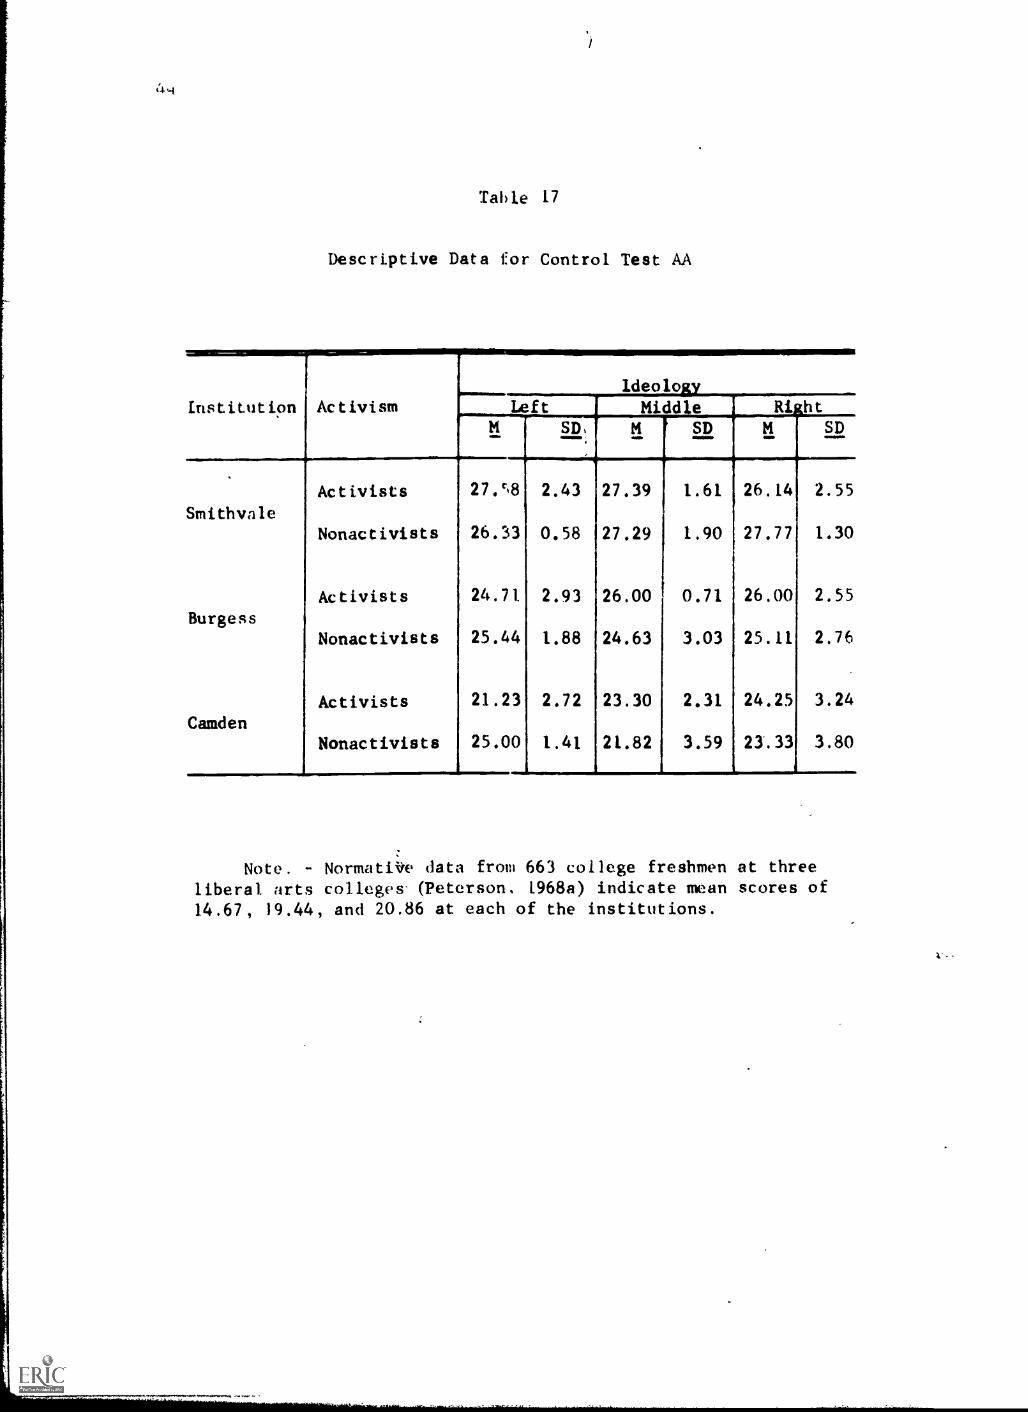
4.4
Table 17
Descriptive Data for Control Test AA
Institution ActivismIdeology
Left Middle RightM SDSD, SD
Activists 27.`8 2.43 27.39 1.61 26.14 2.55
SmithvaleNonactivists 26.33 0.58 27.29 1.90 27.77 1.30
Activists 24.71 2.93 26.00 0.71 26.00 2.55
BurgessNonactivists 25.44 1.88 24.63 3.03 25.11 2.76
Activists 21.23 2.72 23.30 2.31 24.25 3.24
CamdenNonactivists 25.00 1.41 21.82 3.59 23.33 3.80
Note. - Normative data from 663 college freshmen at threeliberal arts colleges (Peterson, 1968a) indicate mean scores of14.67, 19.44, and 20.86 at each of the institutions.
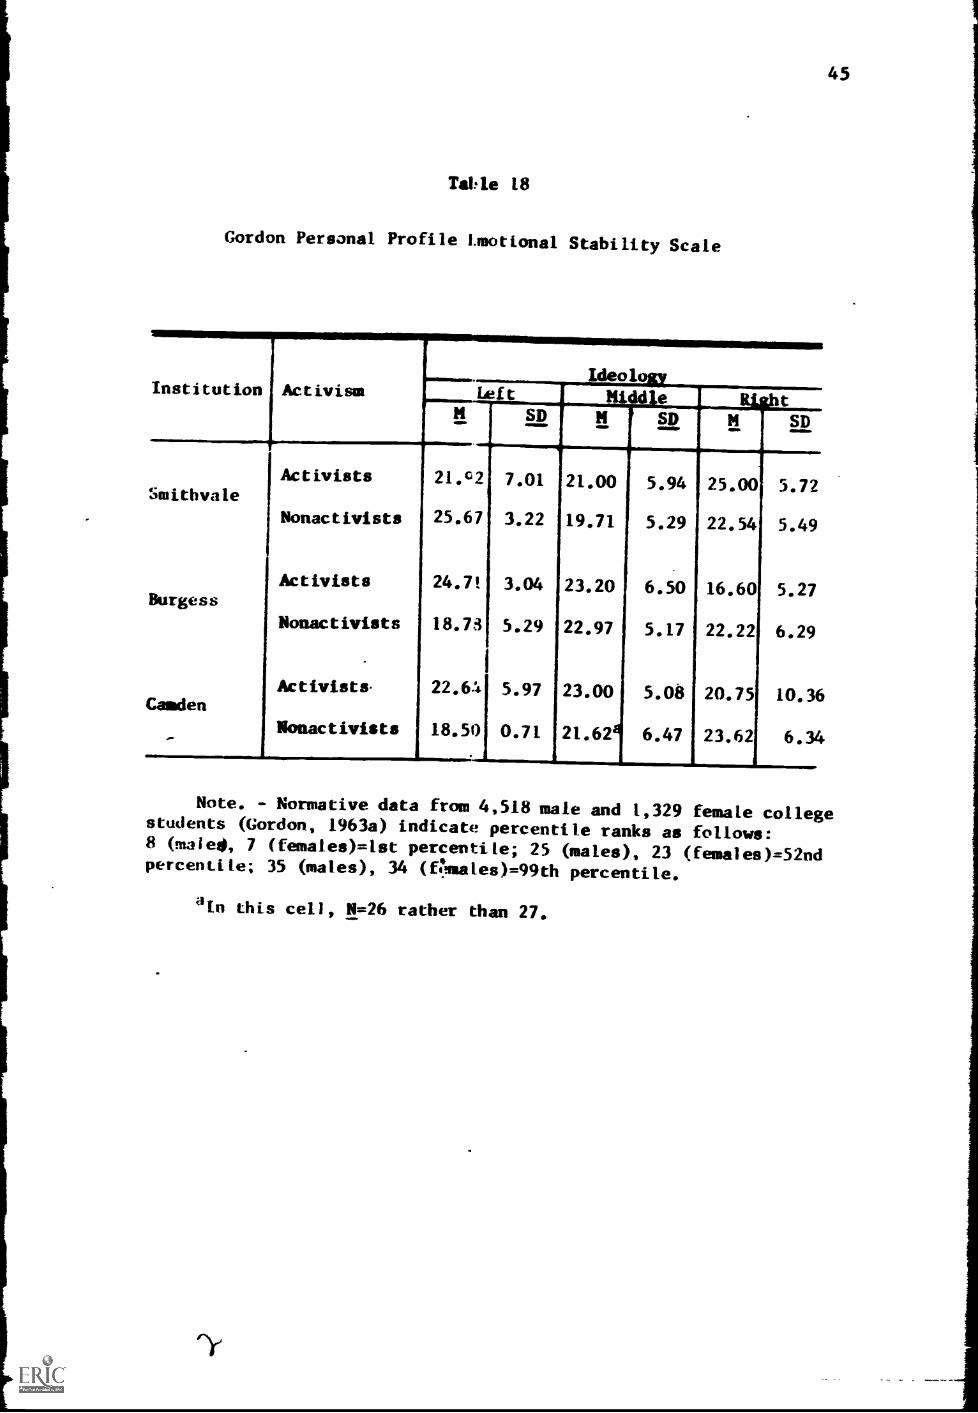
45
Table 18
Gordon Personal Profile Lmotional Stability Scale
Institution ActivismIdeolcgy
Left Middle tSD SD SD
Activists 21.02 7.01 21.00 5.94 25.00 5.72Smithvale
Nonactivists 25.67 3.22 19.71 5.29 22.541 5.49
Activists 24.7! 3.04 23.20 6.50 16.601 5.27Burgess
Nonactivists 18.73 5.29 22.97 5.17 22.221 6.29
Activists. 22.64 5.97 23.00 5.08 20.75 10.36Camden
Nonactivists 18.50 0.71 21.62
16.47 23.62 6.34.
Note. - Normative data from 4,518 male and 1,329 female collegestudents (Gordon, 1963a) indicate percentile ranks as follows:8 (male!), 7 (females)=1st percentile; 25 (males), 23 (females)=52ndpercentile; 35 (males), 34 (Omales)=99th percentile.
'stn this cell, N=26 rather than 27.
rd
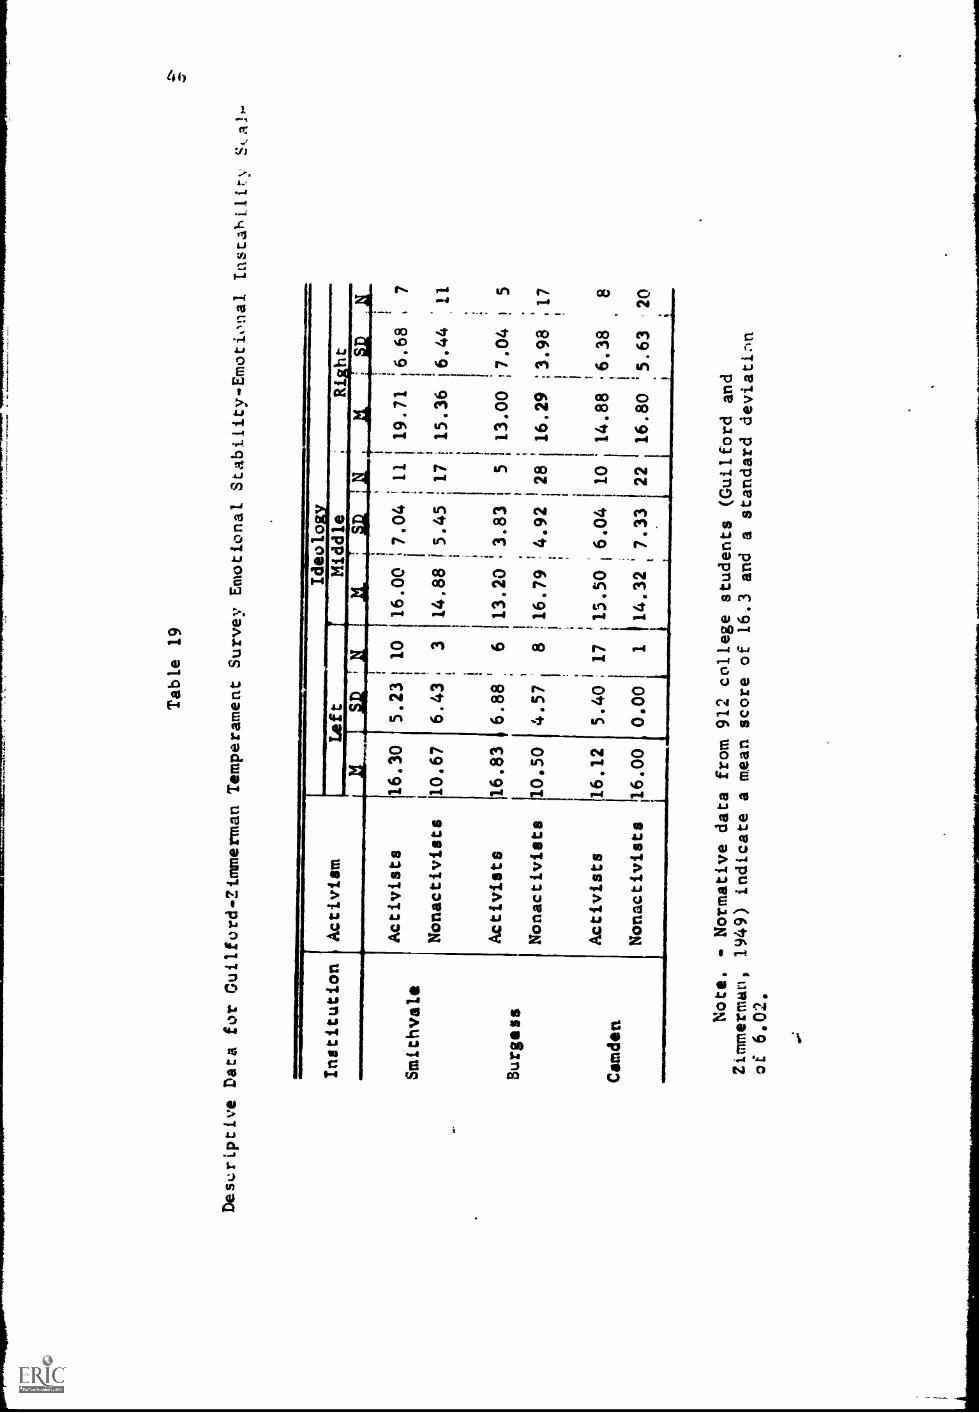
Table 19
Descriptive Data for Guilford-Zimmerman
Temperament Survey Emotional
Stability-Emotional IascabLlir
c4i-
Institution
Activism
Smithvale
Burgess
Camden
Activists
Nonactivists
Left
Ideolo
Middle
Riht
16.30
10.67
Activists
16.83
Nonactivists
110.50
Activists
Nonactivists
16.12
16.00
;.011
5.23 1
10
6.43,
3
1
6.88:
6
4.57
8
16.00
7.04
14.88 !S.45
13.20
3.83
16.79
4.92
6.04
7.33
5.40. 17 0.5.50
0.001
1114.32
J
11
19.71
j 6.68
.7
17
15.36
6.44
'11
513.00
7.04
5
28
16.29
3.98
,17
10
14.88
6.38
8
22
16.80
5.63
20
Note. - Normative data from 912 college
students (Guilford and
Zimmerman, 1949) indicate
a mean score of 16.3 and a standard deviati:m
of 6.02.
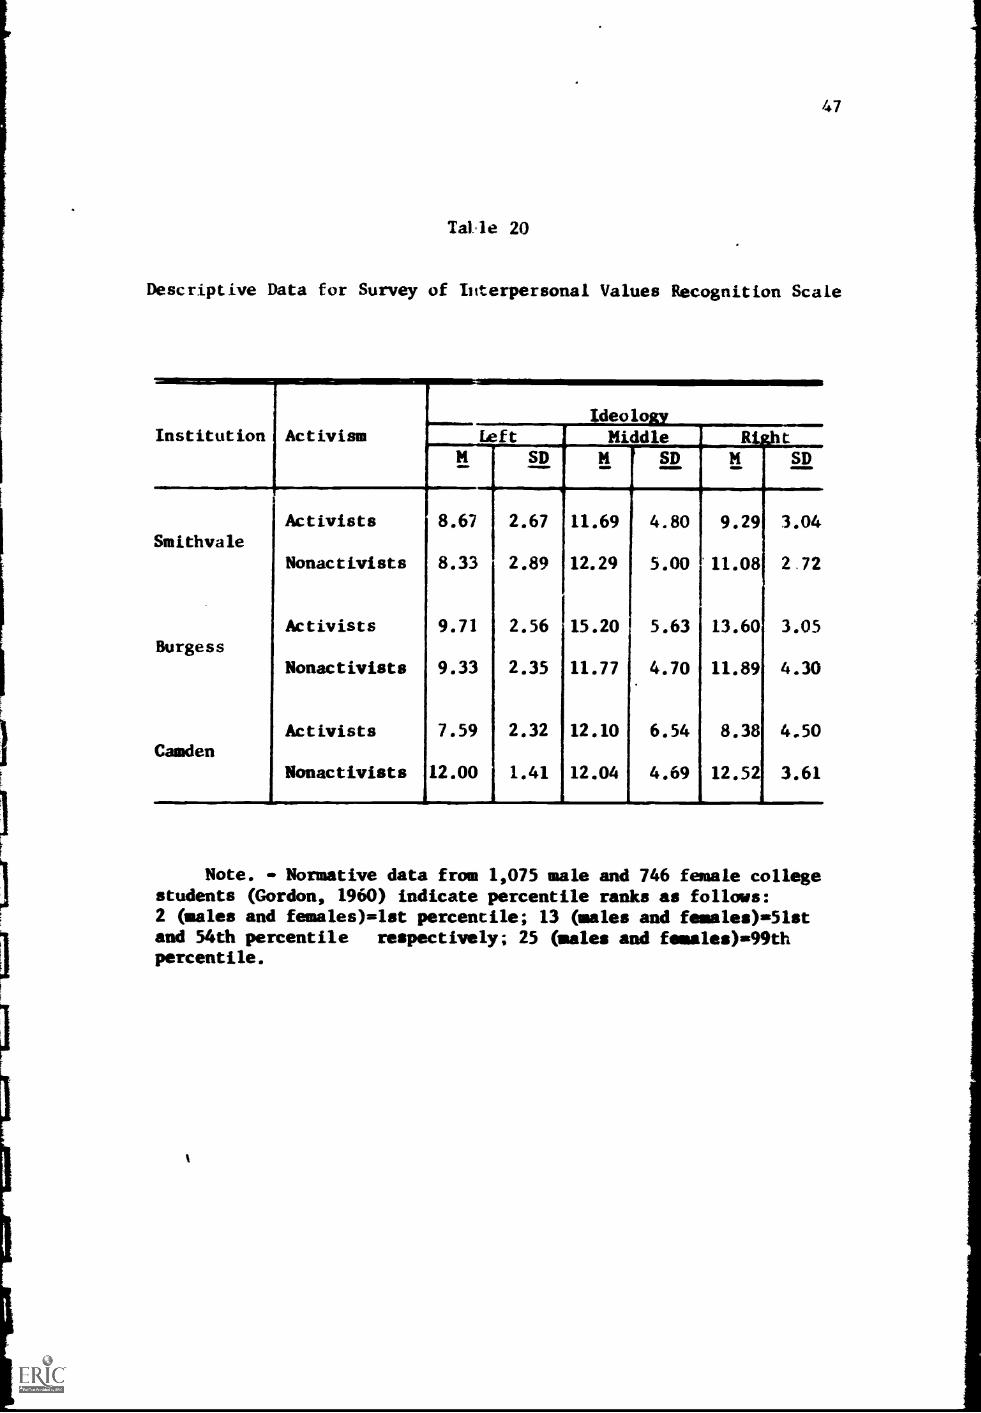
47
Taile 20
Descriptive Data for Survey of Interpersonal Values Recognition Scale
Institution ActivismIdeologyMiddle tLeft
SD SD SD
Activists 8.67 2.67 11.69 4.80 9.29 3.04Smithvale
Nonactivists 8.33 2.89 12.29 5.00 11.08 2,72
Activists 9.71 2.56 15.20 5.63 13.60 3.05Burgess
Nonactivists 9.33 2.35 11.77 4.70 11.89 4.30
Activists 7.59 2.32 12.10 6.54 8.38 4.50Camden
Nonactivists 12.00 1.41 12.04 4.69 12.52 3.61
Note. - Normative data from 1,075 male and 746 female collegestudents (Gordon, 1960) indicate percentile ranks as follows:2 (males and females)=1st percentile; 13 (males and females)=51stand 54th percentile respectively; 25 (males and females)=99thpercentile.
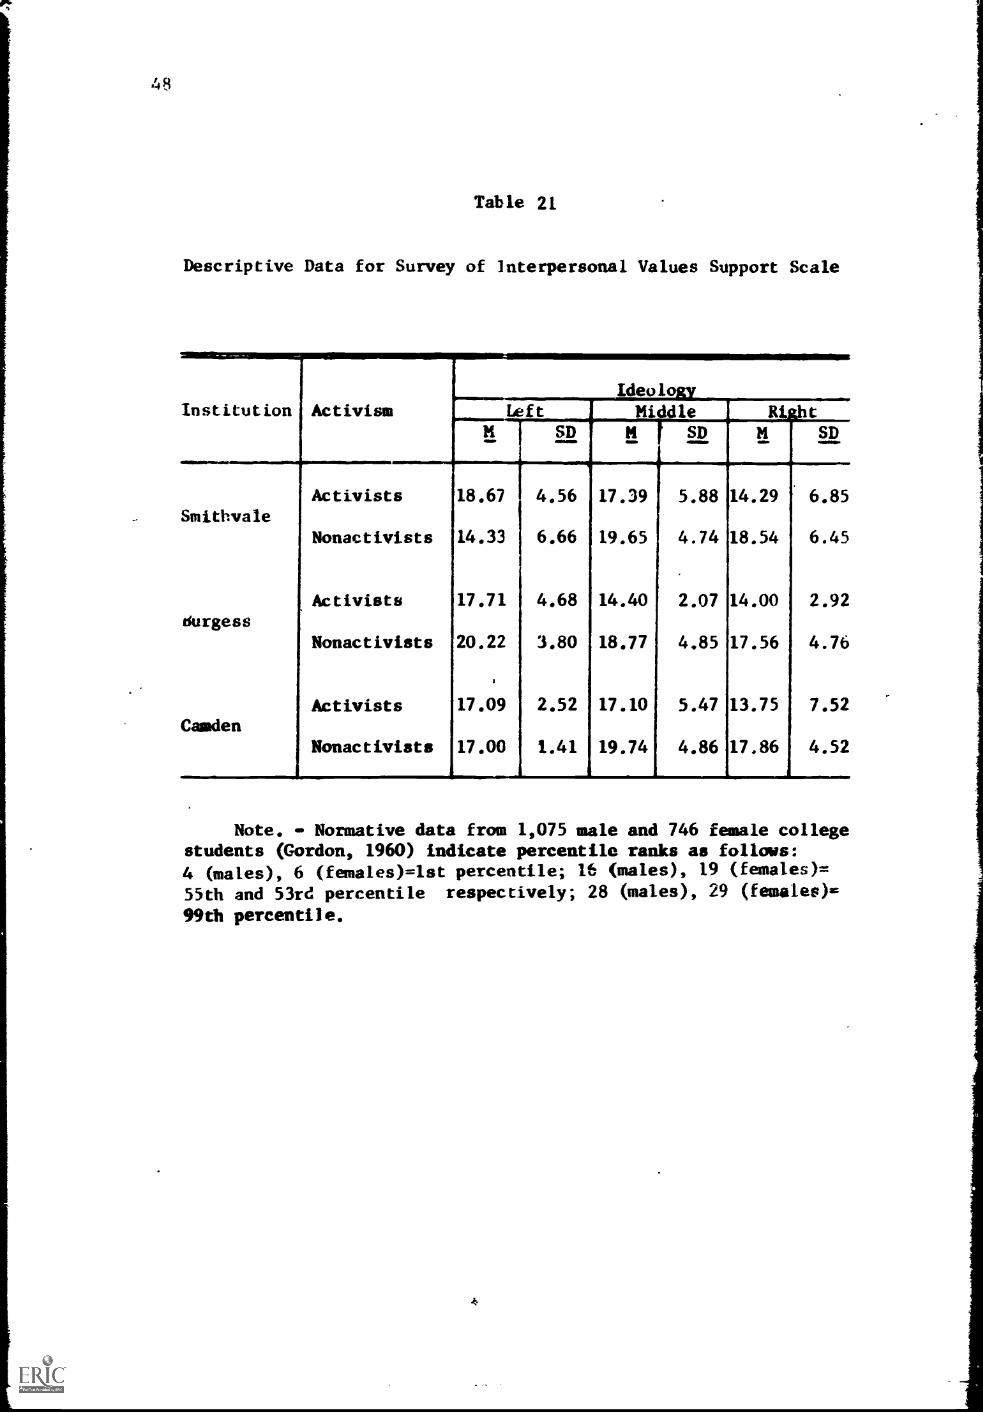
48
Table 21
Descriptive Data for Survey of Interpersonal Values Support Scale
Institution ActivismIdeology
Left Middle RightM SDSD SD
Activists 18.67 1 4.56 17.39 5.88 14.29 6.85Smithvale
Nonactivists 14.33 6.66 19.65 4.74 18.54 6.45
durgessActivists 17.71 4.68 14.40 2.07 14.00 2.92
Nonactivists 20.22 3.80 18.77 4.85 17.56 4.76
Activists 17.09 2.52 17.10 5.47 13.75 7.52Camden
Nonactivists 17.00 1.41 19.74 4.86 17.86 4.52
Note. - Normative data from 1,075 male and 746 female collegestudents (Gordon, 1960) indicate percentile ranks as follows:4 (males), 6 (females)=1st percentile; 16 (males), 19 (females)=
55th and 53rd percentile respectively; 28 (males), 29 (famales)=
99th percentile.
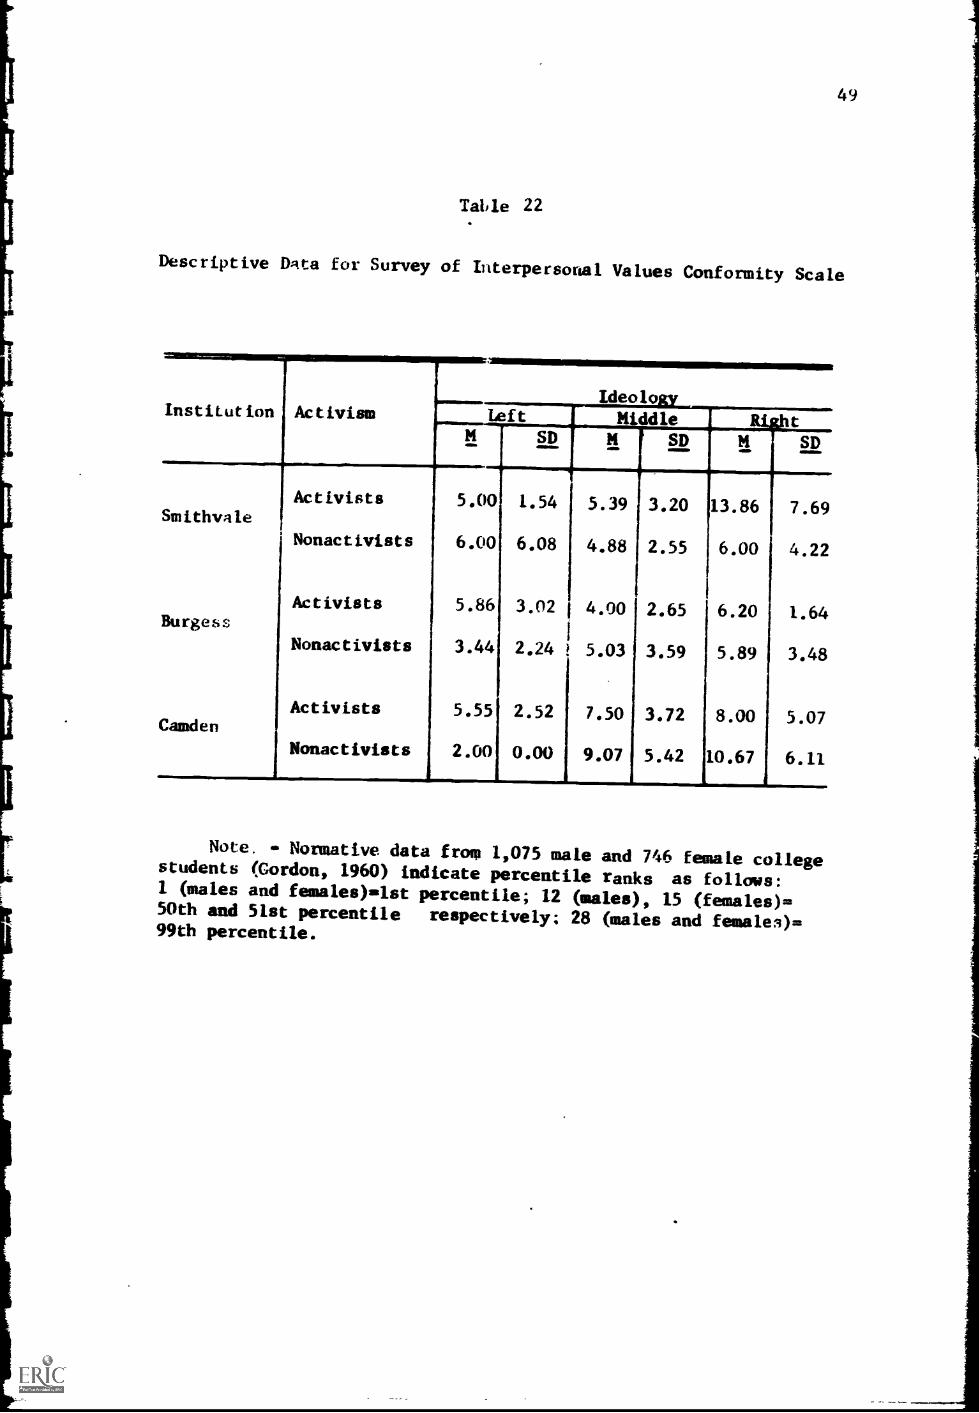
49
Table 22
Descriptive Data for Survey of Interpersonal Values Conformity Scale
Institution ActivismIdeolo
Left Middle tSD M SD SD
Activists 5.00 1.54 5.39 3.20 13.86 7.69Smithvale
Nonactivists 6.00 6.08 4.88 2.55 6.00 4.22
Activists 5.86 3.02 4.00 2.65 6.20 1.64Burgess
Nonactivists 3.44 2.24 5.03 3.59 5.89 3.48
Activists 5.55 2.52 7.50 3.72 8.00 5.07Camden
Nonactivists 2.00 0.00 9.07 5.42 10.67 6.11
Note. Normative data from 1,075 male and 746 female collegestudents (Cordon, 1960) indicate percentile ranks as follows:1 (males and females)=1st percentile; 12 (males), 15 (females)=50th and 51st percentile respectively; 28 (males and females)=99th percentile.
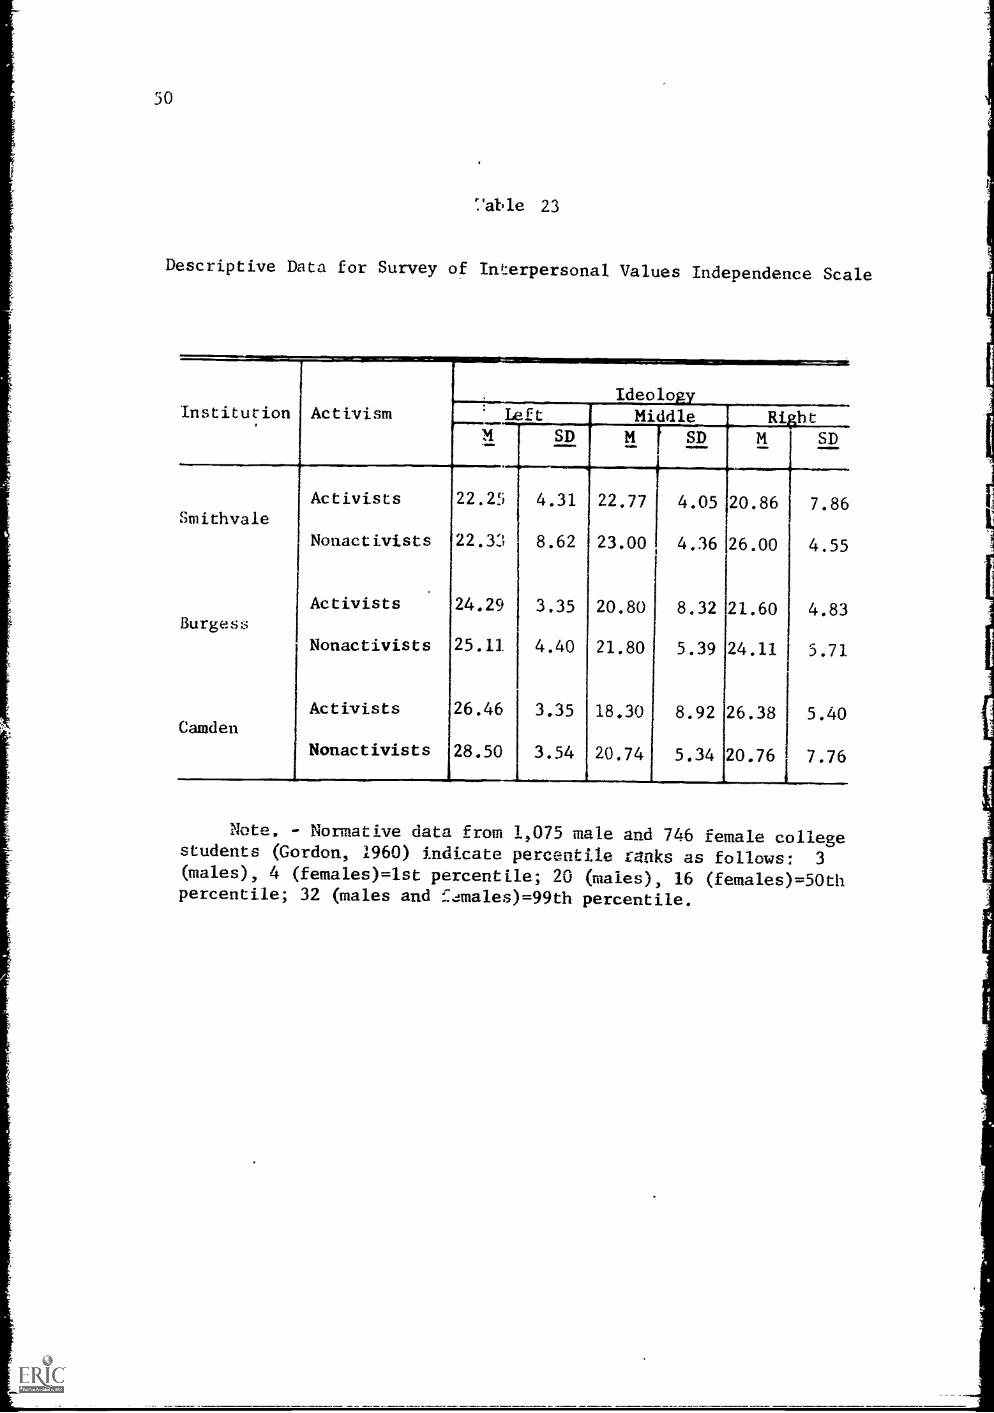
50
''able 23
Descriptive Data for Survey of Interpersonal Values Independence Scale
Institution ActivismIdeolo
Leflt Middle RightM SDM SD
!
SD
Activists 22.25 4.31 22.77 4.05 20.86 7.86Smithvale
Nonactivists 22.32, 8.62 23.00 4.36 26.00 4.55
Activists 24.29 3.35 20.80 8.32 21.60 4.83Burgess
Nonactivists 25.11 4.40 21.80 5.39 24.11 5.71
Activists 26.46 3.35 18.30 8.92 26.38 5.40Camden
Nonactivists 28.50 3.54 20.74 5.34 20.76 7.76
Note. - Normative data from 1,075 male and 746 female collegestudents (Gordon, 1960) indicate percentile ranks as follows: 3(males), 4 (females)=1st percentile; 20 (males), 16 (females)=50thpercentile; 32 (males and f4males)=99th percentile.
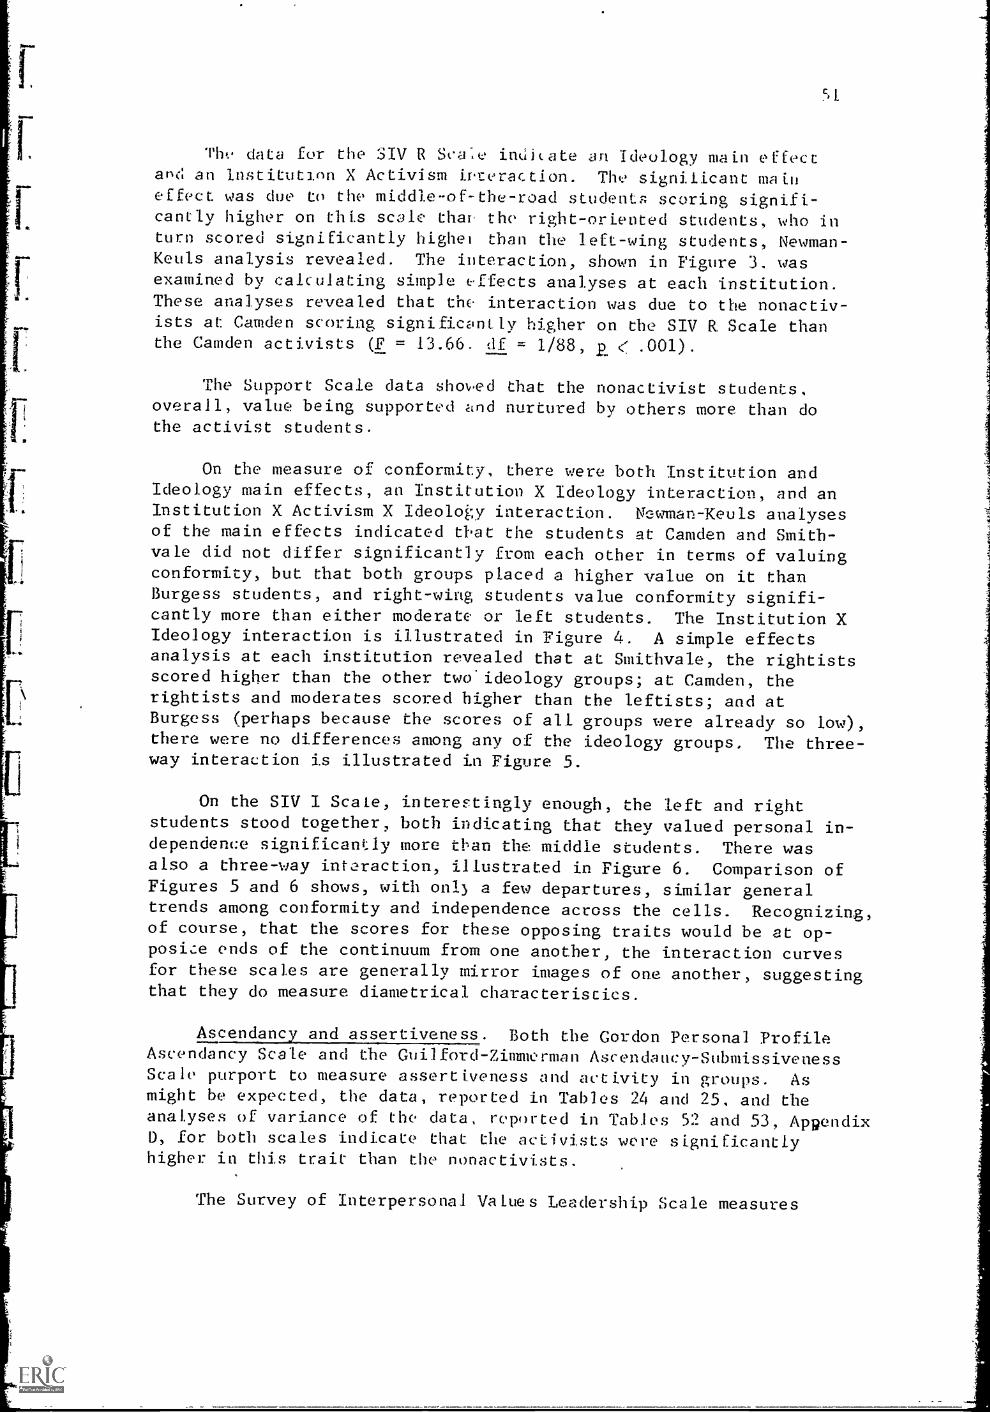
Thy data for the SIV R Sae indicate an Ideology main effectand an institution X Activism irceraction. The significant maineffect was due to the middle-of-the-road students scoring signifi-cantly higher on this scale than the right-oriented students, who inturn scored significantly higher than the left-wing students, Newman-Keuls analysis revealed. The interaction, shown in Figure 3. wasexamined by calculating simple effects analyses at each institution.These analyses revealed that the interaction was due to the nonactiv-ists at: Camden scoring significantly higher on the SDI R Scale thanthe Camden activists (F = 13.66. df = 1/88, < .001).
The Support Scale data shoved that the nonactivist students,overall, value being supported and nurtured by others more than dothe activist students.
On the measure of conformity, there were both Institution andIdeology main effects, an Institution X Ideology interaction, and anInstitution X Activism X Ideology interaction. Newman -Keuls analysesof the main effects indicated aat the students at Camden and Smith-vale did not differ significantly from each other in terms of valuingconformity, but that both groups placed a higher value on it thanBurgess students, and right-wing students value conformity signifi-cantly more than either moderate or left students. The Institution XIdeology interaction is illustrated in Figure 4. A simple effectsanalysis at each institution revealed that at Smithvale, the rightistsscored higher than the other two ideology groups; at Camden, therightists and moderates scored higher than the leftists; and atBurgess (perhaps because the scores of all groups were already so low),there were no differences among any of the ideology groups, The three-way interaction is illustrated in Figure 5.
On the SIV I Scale, intereFtingly enough, the left and rightstudents stood together, both indicating that they valued personal in-dependence significantly more tban the middle students. There wasalso a three-way interaction, illustrated in Figure 6. Comparison ofFigures 5 and 6 shows, with on13 a few departures, similar generaltrends among conformity and independence across the cells. Recognizing,of course, that the scores for these opposing traits would be at op-posite ends of the continuum from one another, the interaction curvesfor these scales are generally mirror images of one another, suggestingthat they do measure diametrical characteristics.
Ascendancy and assertiveness. Both the Gordon Personal ProfileAscendancy Scale and the Guilford-Zimmerman Ascendancy-SubmissivenessScale purport to measure assertiveness and activity in groups. Asmight be expected, the data, reported in Tables 24 and 25, and theanalyses of variance of the data, reported in Tables 52 and 53, AppendixD, for both scales indicate that the activists were significantlyhigher in this trait than the nonactivi.sts.
The Survey of interpersonal Values Leadership Scale measures
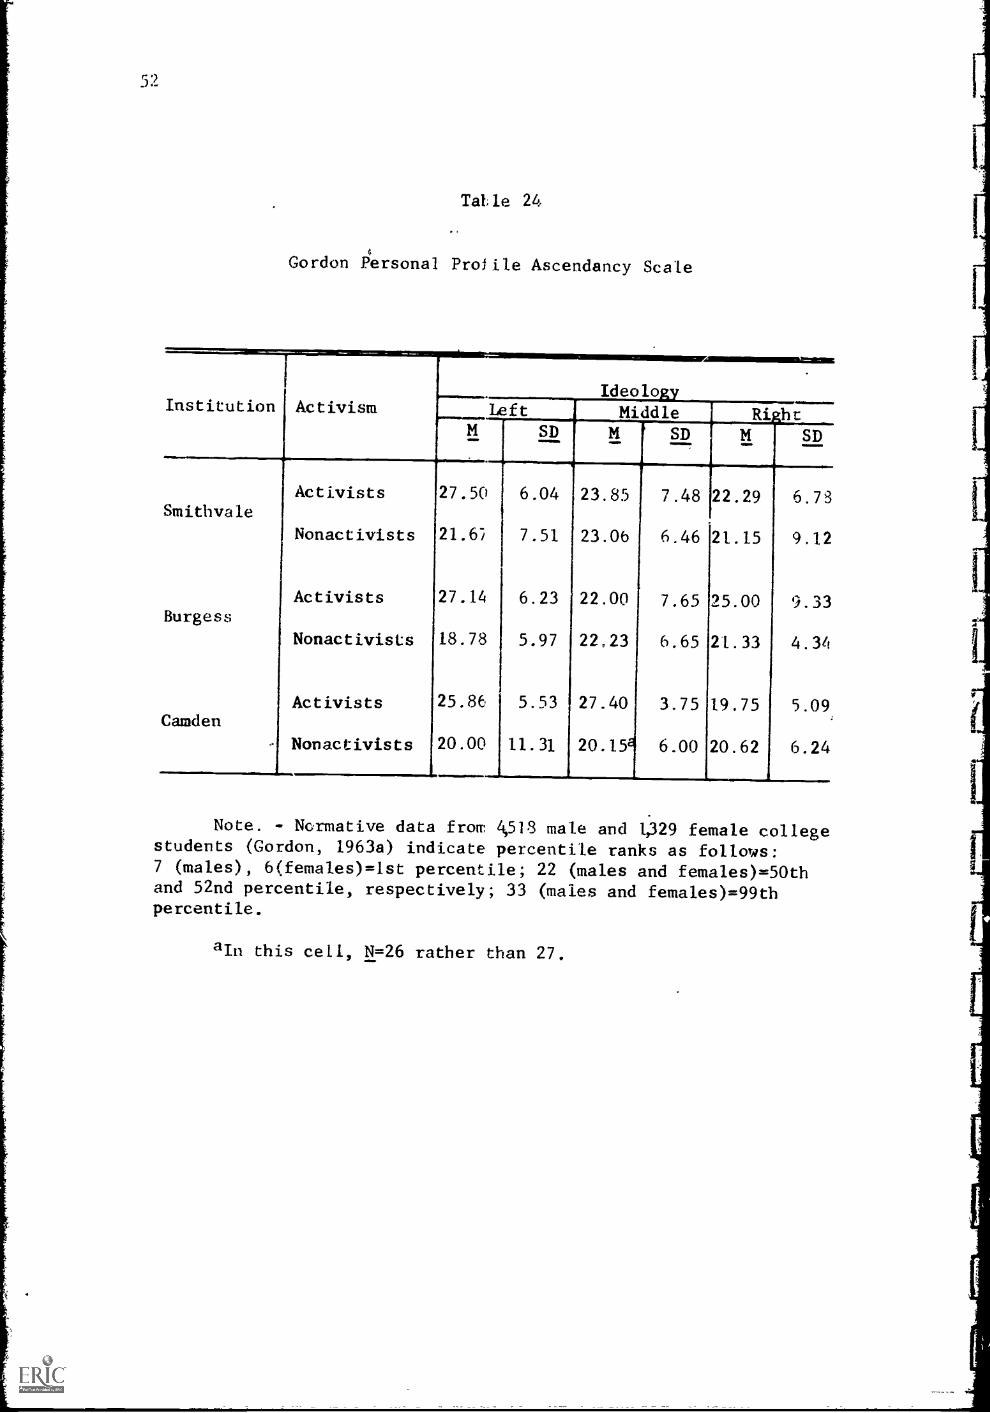
52
Tale 24
Gordon Personal Profile Ascendancy Scale
InstitutionI ActivismIdeologyMiddle Right
M SD
Left
SD M SD
Activists 27.50 6.04 23.85 7.48 22.29 6.7SSmithva le
Nonactivists 21.6; 7.51 23.06 6.46 21.15 9.12
Activists 27.14 6.23 22.00 7.65 5.00 9..33Burgess
Nonactivists 18.78 5.97 22 23 6.65 21.33 4.34
Activists 25.86 5.53 27.40 3.75 19.75 5.09Camden
Nonactivists 20.00 11.31 20.15 6.00 20.62 6.24
Note. - Normative data from 4,518 male and 1,329 female collegestudents (Gordon, 1963a) indicate percentile ranks as follows:7 (males), 6(females)=1st percentile; 22 (males and females)=50thand 52nd percentile, respectively; 33 (males and females)=99thpercentile.
aIn this cell, N=26 rather than 27.
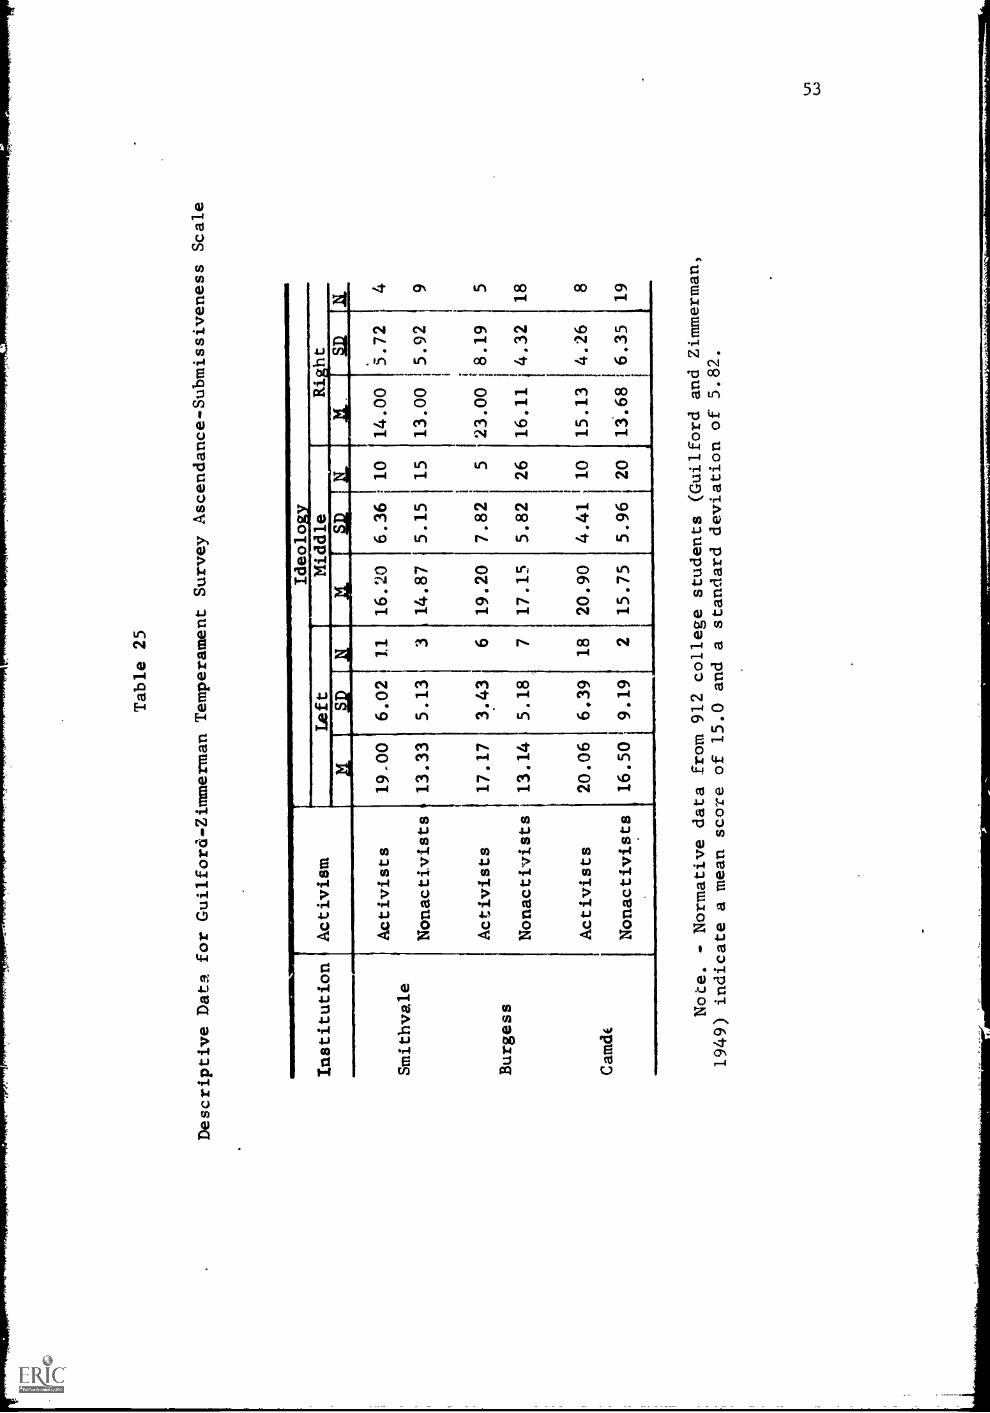
Table 25
Descriptive Data for Guilford-Zimmerman Temperament
Survey Ascendance-Submissiveness Scale
Institution Activism
Left
Middle
Smithvale
Burgess
Cam&
Activists
Nonactivists
Activists
Nonactivists
3.43
5.18
6.39
Nonactivists
16.501 9.19
18 2
19.20
17.15
20.90
15.75
7.82
5.82
26
4.41
10
5.96
20
23.00
8.19
16.11
4.32
15.13
4.26
13.68
6.35
5
18 8 19
Note. - Normative data from 912 college
students (Guilford and Zimmerman,
1949) indicate a mean score of 15.0 and a standard
deviation of 5.82.
54
SIV-R
MEAN
SCORES
0
0-0 SMITHVALE13---0 BURGESSIi----hi CAMDEN
ACTIVISTS NONACTIVISTS
ACTIVISM
Figure 3. Institution X activism interaction, Survey ofInterpersonal Values Recognition Scale.
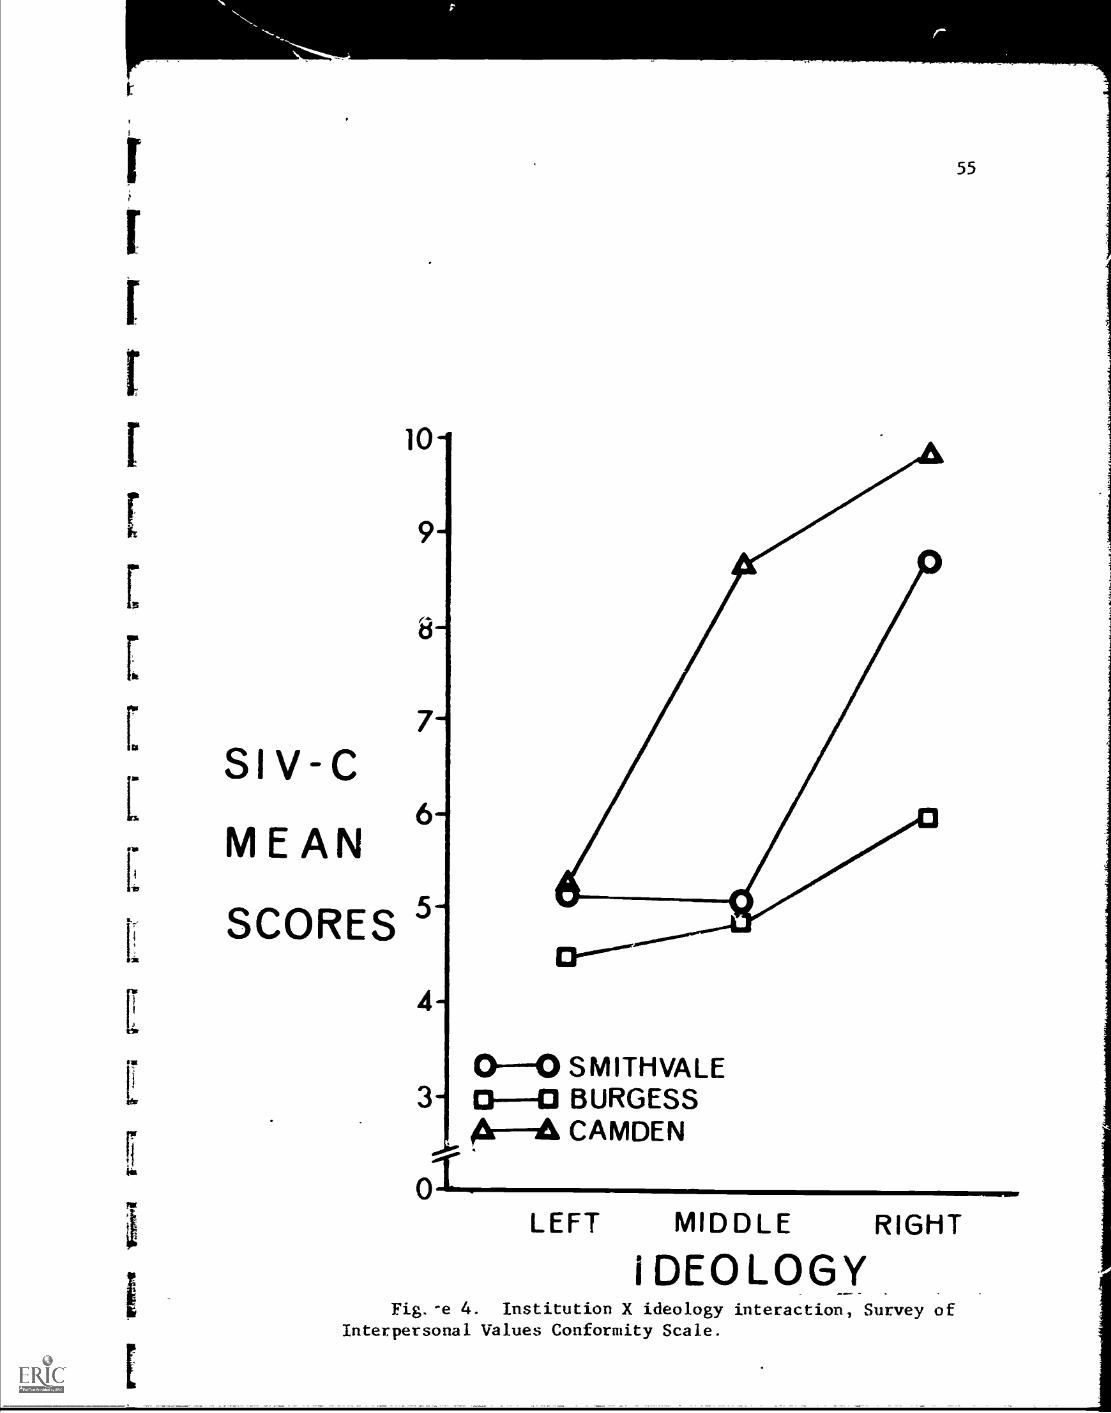
55
9-
Ij
10-
a
7-
SIV-C6
MEAN
SCORES
4-
0-0 SMITHVALE3- a-a BURGESS
11----A CAMDEN
01-4LEFT MIDDLE RIGHT
I DEOLOGYFig.-e 4. Institution X ideology interaction, Survey of
Interpersonal Values Conformity Scale.
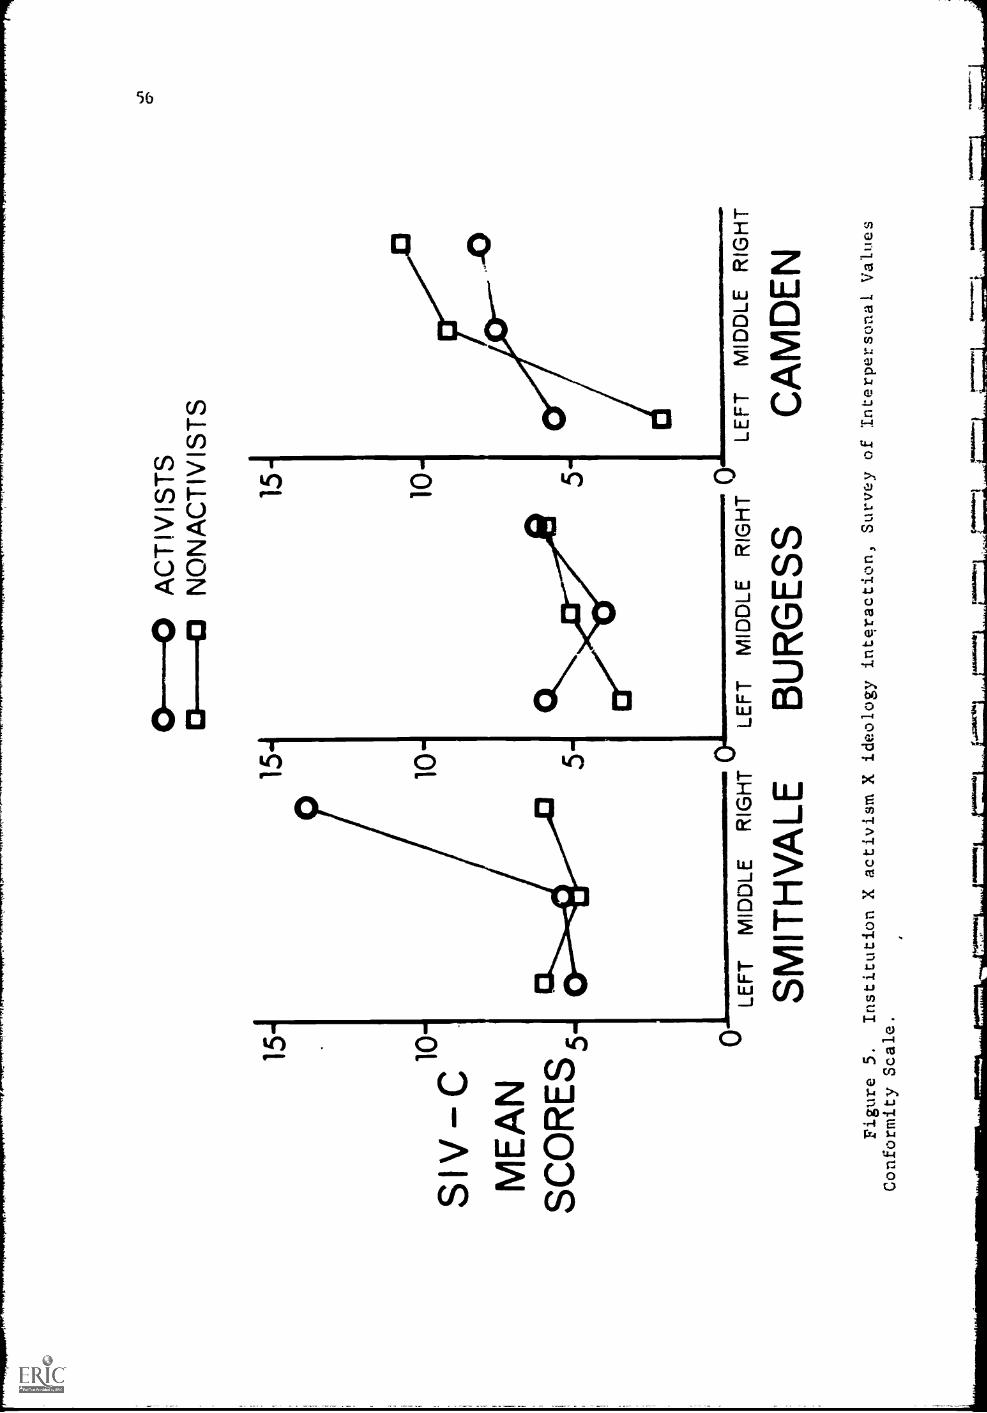
15
SIV
C10
ME
AN
SC
OR
ES
5 0LE
FT
MID
DLE
RIG
HT
LEF
TM
IDD
LER
IGH
T
SM
ITH
VA
LEB
UR
GE
SS
AC
TIV
IST
S0-
0 N
ON
AC
TIV
I S
TS
1515
-
1010
- 5-
LEF
TM
IDD
LE R
IGH
T
CA
MD
EN
Figure 5.
Institution X activism X ideology interaction, Survey of Interpersonal Values
Conformity Scale.
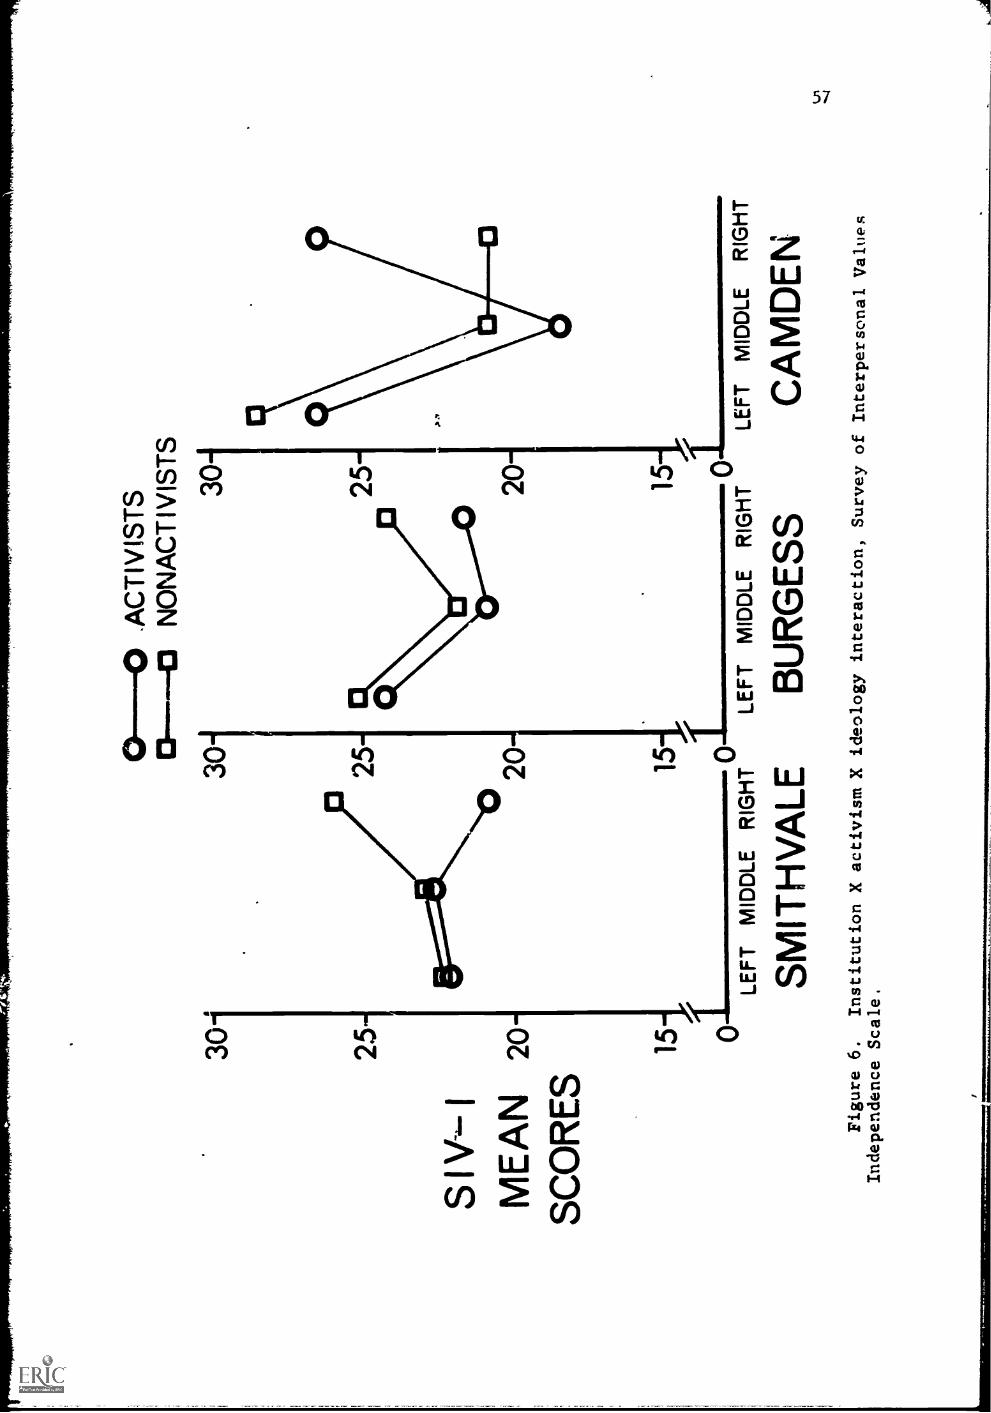
30j
25
S I
Va-
I
ME
AN
20
SC
OR
ES
0-0
AC
T I
V I
ST
S13
----
C1
NO
NA
CT
I V
I S
TS
3030
2020
1
1515
15- ?.
-
LEF
T M
IDD
LE R
IGH
TO
LEF
T M
IDD
LE R
IGH
TO
f LEF
T M
IDD
LER
IGH
Tf
O
SM
ITH
VA
LEB
UR
GE
SS
CA
MD
EN
Figure 6.
Institution X activism X ideology interaction, Survey of
Interpersonal Values
Independence Scale.
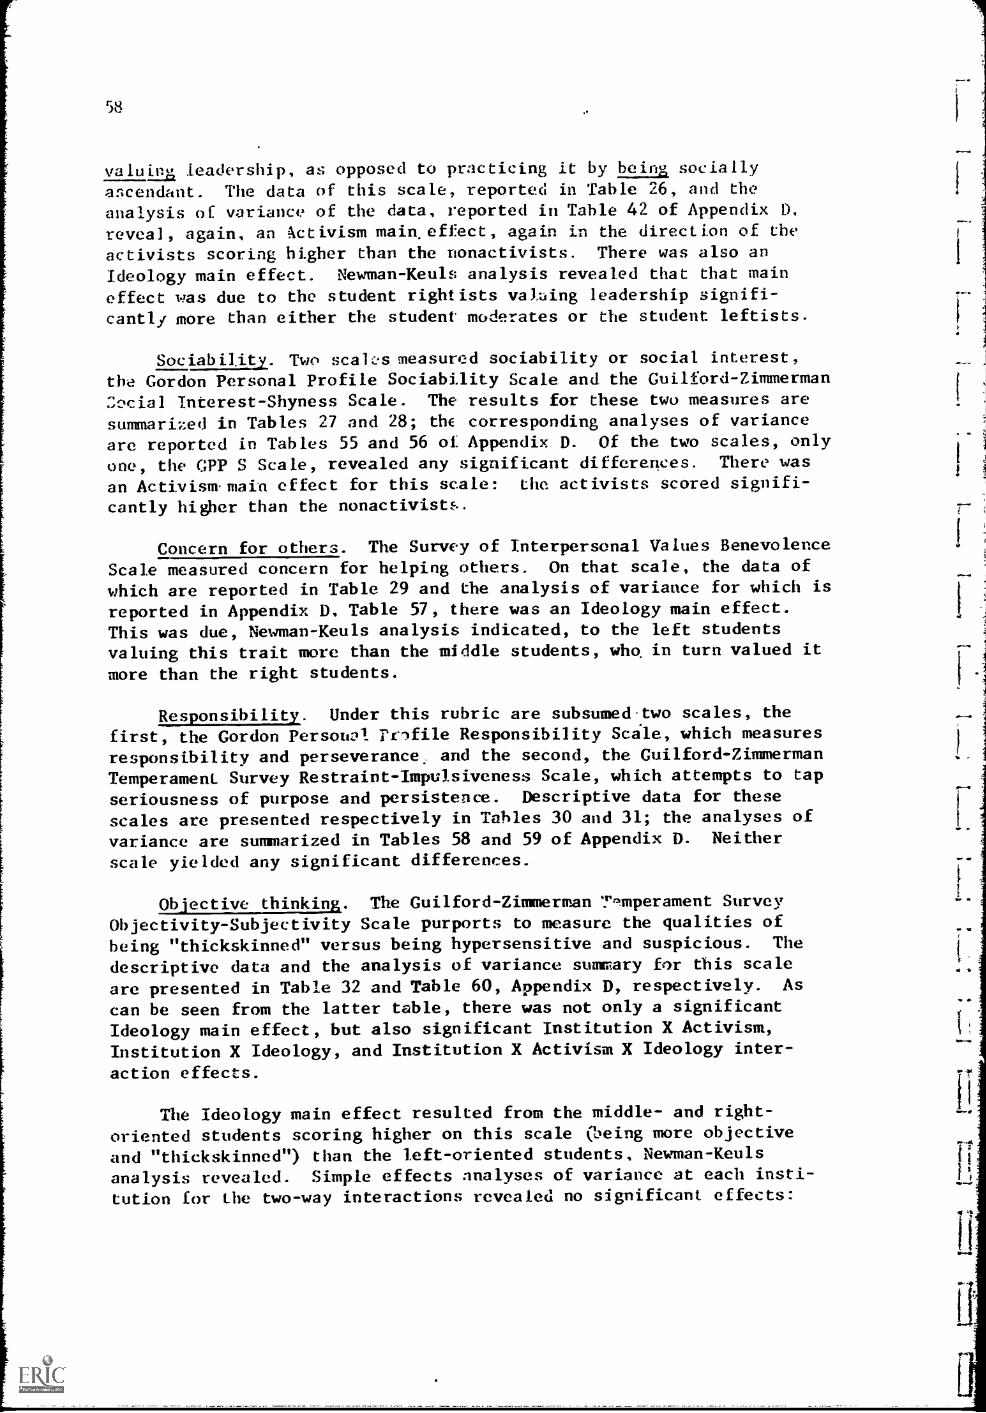
58
valuina leadership, as opposed to practicing it by beina socially
ascendant. The data of this scale, reported in Table 26, and theanalysis of variance of the data, reported in Table 42 of Appendix D.reveal, again, an Nctivism main, effect, again in the direction of the
activists scoring higher than the nonactivists. There was also an
Ideology main effect. Newman-Keuls analysis revealed that that main
effect was due to the student rightists val:Aing leadership signifi-cantly more than either the student moderates or the student leftists.
Sociability. Two scahs measured sociability or social interest,the Gordon Personal Profile Sociability Scale and the Guilford-Zimmerman
Zocial Interest-Shyness Scale. The results for these two measures aresummarized in Tables 27 and 28; the corresponding analyses of variance
are reported in Tables 55 and 56 of Appendix D. Of the two scales, only
one, the GPP S Scale, revealed any significant differences. There was
an Activism-main effect for this scale: the activists scored signifi-
cantly higher than the nonactivists.
Concern for others. The Survey of Interpersonal Values Benevolence
Scale measured concern for helping others. On that scale, the data of
which are reported in Table 29 and the analysis of variance for which is
reported in Appendix D. Table 57, there was an Ideology main effect.This was due, Newman-Keuls analysis indicated, to the left students
valuing this trait more than the middle students, who, in turn valued it
more than the right students.
Responsibility. Under this rubric are subsumed-two scales, the
first, the Gordon Persotrol rcIfile Responsibility Scile, which measuresresponsibility and perseverance, and the second, the Guilford-ZimmermanTemperament Survey Restraint-Impulsiveness Scale, which attempts to tap
seriousness of purpose and persistence. Descriptive data for thesescales are presented respectively in Tables 30 and 31; the analyses of
variance are summarized in Tables 58 and 59 of Appendix D. Neither
scale yielded any significant differences.
Objective thinking. The Guilford-Zimmerman nmperament SurveyObjectivity-Subjectivity Scale purports to measure the qualities ofbeing "thickskinned" versus being hypersensitive and suspicious. The
descriptive data and the analysis of variance summary for this scale
are presented in Table 32 and Table 60, Appendix D, respectively. As
can be seen from the latter table, there was not only a significant
Ideology main effect, but also significant Institution X Activism,Institution X Ideology, and Institution X Activism X Ideology inter-
action effects.
The Ideology main effect resulted from the middle- and right-oriented students scoring higher on this scale (being more objective
and "thickskinned") than the left-oriented students, Newman-Keuls
analysis revealed. Simple effects analyses of variance at each insti-
tution for the two-way interactions revealed no significant effects:
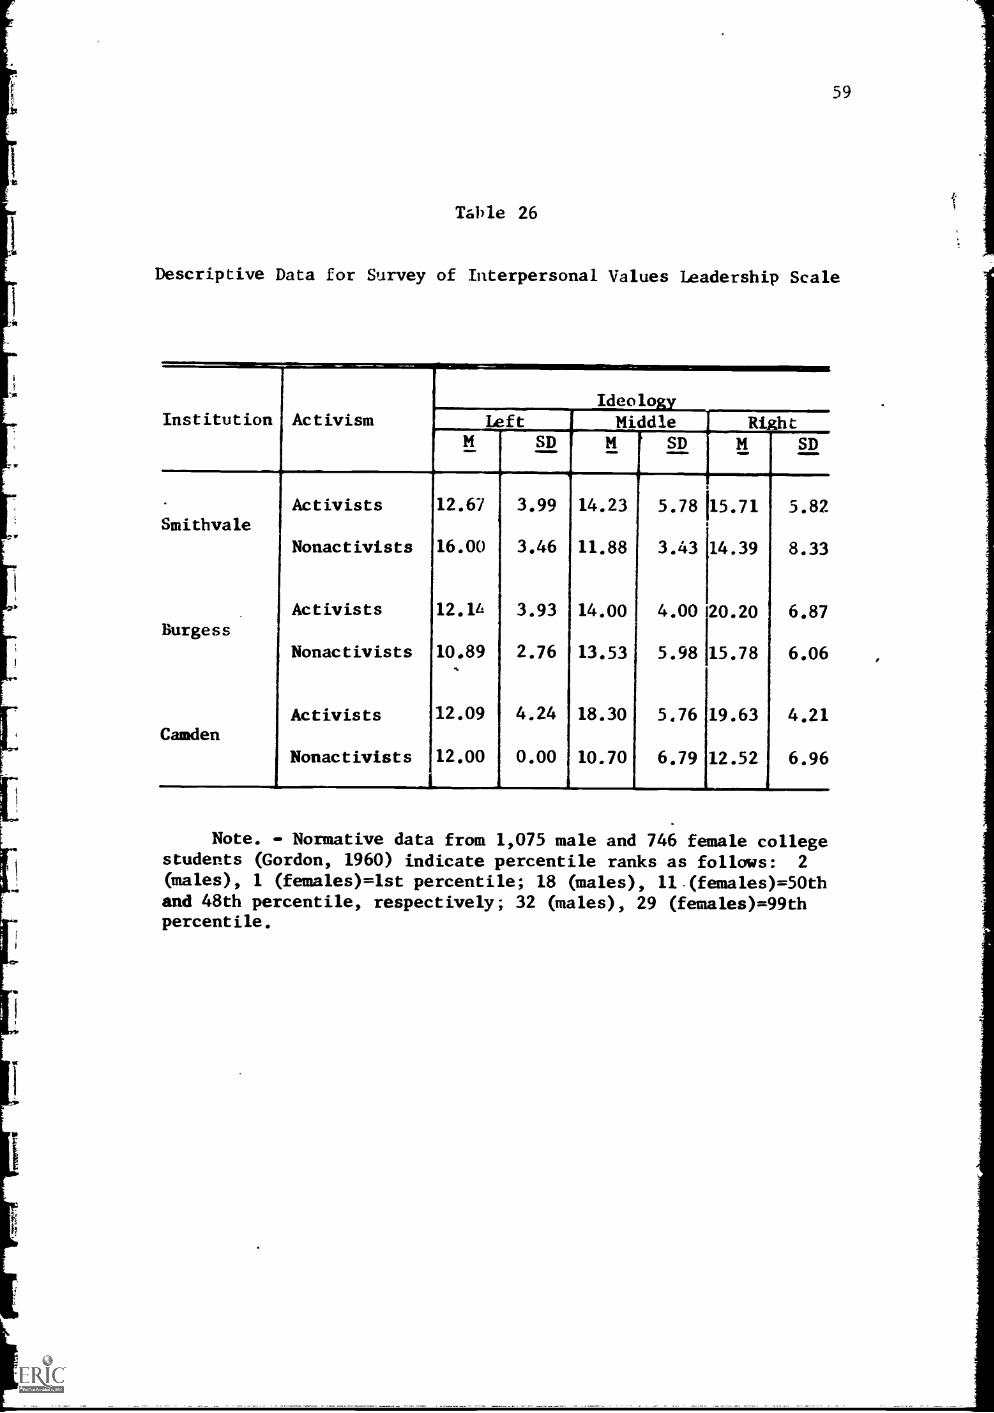
59
Tahle 26
Descriptive Data for Survey of Interpersonal Values Leadership Scale
Institution Activism LeftM SD
Activists 12.67 3.99Smithvale
Nonactivists 16.00 3.46
Activists 12.16 3.93Burgess
Nonactivists 10.89 2.76
Activists 12.09 4.24Camden
Nonactivists 12.00 0.00
IdeologyMiddleM SD
Ri
Mht
SD
14.23 5.78 115.71
11.88 3.43 14.39
14.00 4.00120.20
13.53 5.98 15.78
18.30 5.76
10.70 6.79
19.63
12.52
5.82
8.33
6.87
6.06
4.21
6.96
Note. - Normative data from 1,075 male and 746 female collegestudents (Gordon, 1960) indicate percentile ranks as follows: 2
(males), 1 (females)=1st percentile; 18 (males), 11 (females)=50thand 48th percentile, respectively; 32 (males), 29 (females)=99thpercentile.
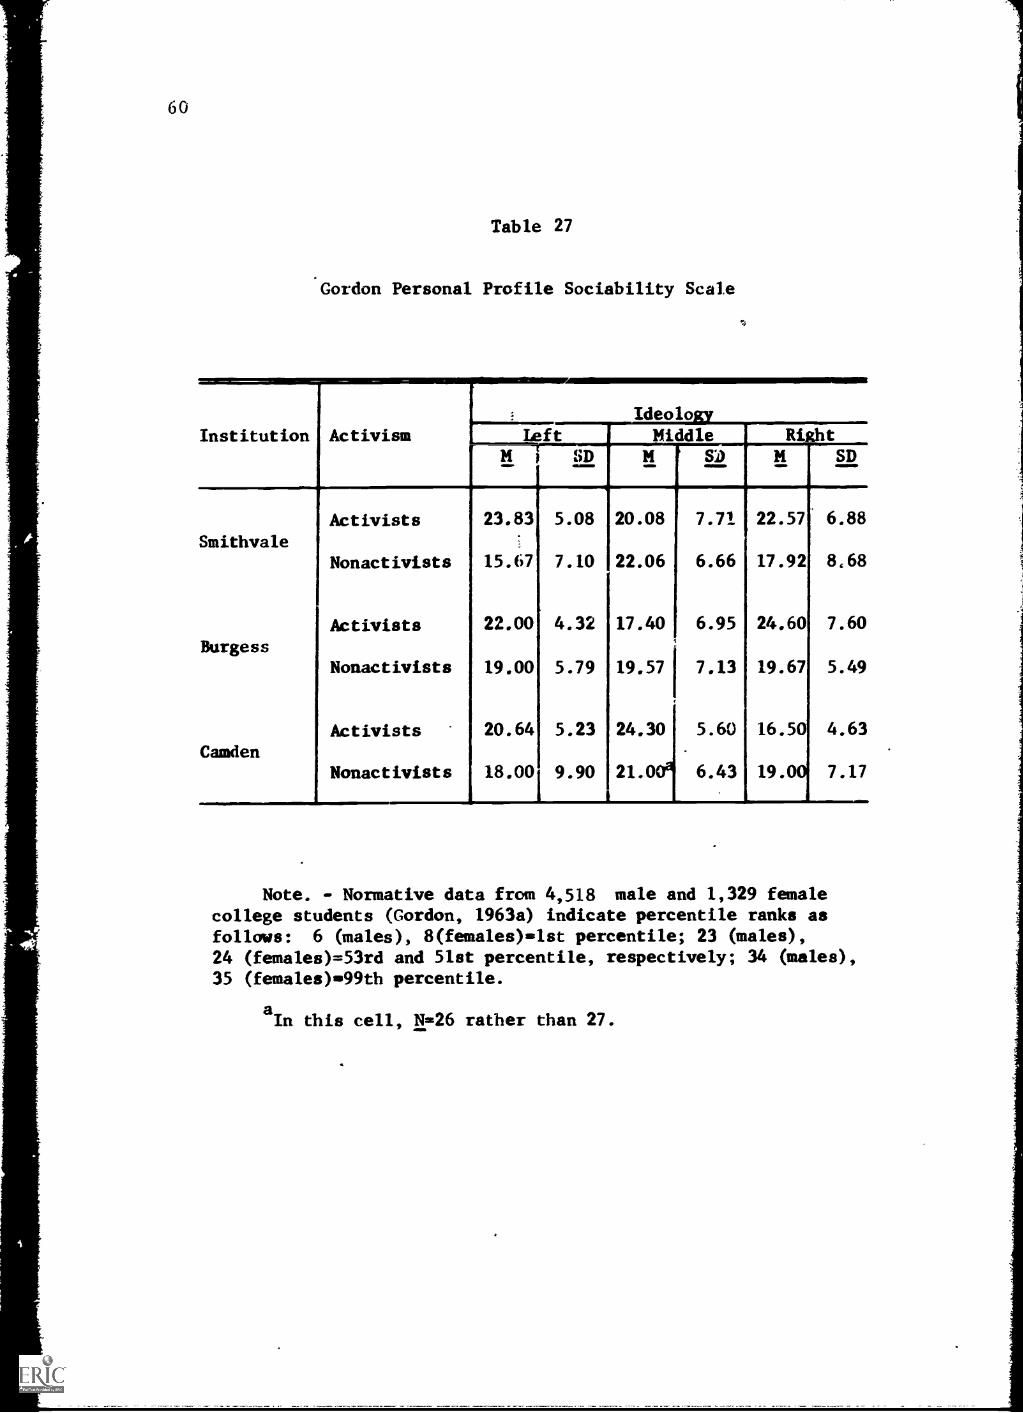
i
60
Table 27
Gordon Personal Profile Sociability Scale
t'y
Institution ActivismIdeolo
Left Middle RightM SD M SD
Activists 23.83 5.08 20.08 7.71 22.57 6.88
SmithvaleNonactivists 15.67 7.10 22.06 6.66 17.92 8,68
Activists 22.00 4.32 17.401 6.95 24.60 7.60
BurgessNonactivists 19.00 5.79 19.57 7.13 19.67 5.49
Activists 20.64 5.23 24.30 5.60 16.50 4.63
CamdenNonactivists 18.00 9.90 21.00P 6.43 19.00 7.17
Note. - Normative data from 4,518 male and 1,329 femalecollege students (Gordon, 1963a) indicate percentile ranks asfollows: 6 (males), 8(females)=1st percentile; 23 (males),24 (females)=53rd and 51st percentile, respectively; 34 (males),35 (females) -99th percentile.
aIn this cell, N=26 rather than 27.
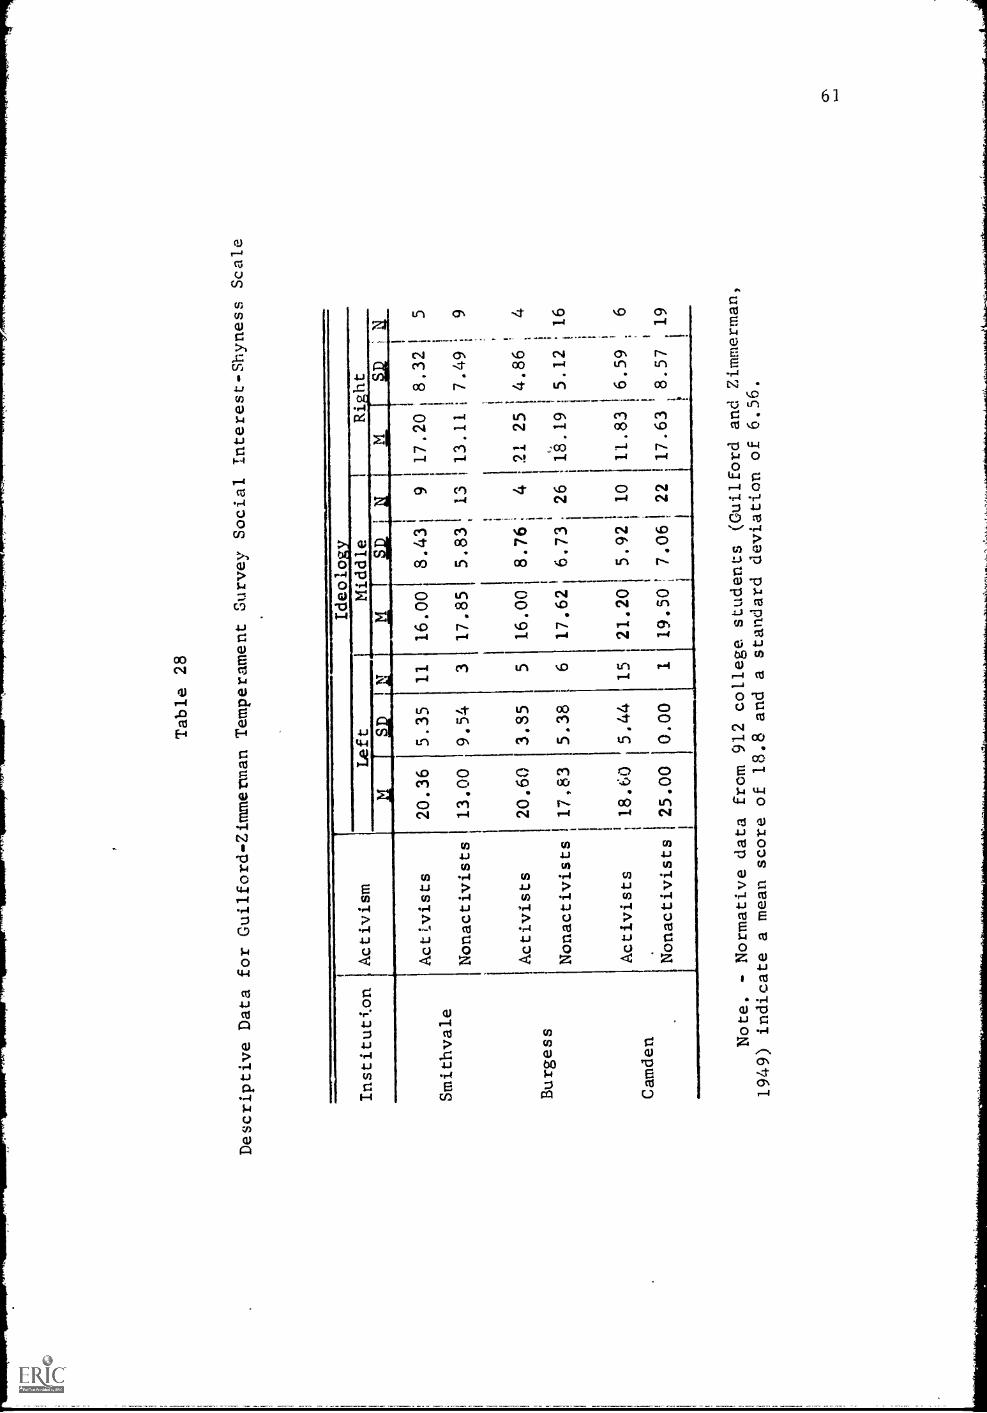
Table 28
Descriptive Data for Guilford-Zimmerman
Temperament Survey Social Interest-Shyness Scale
Institution
Activism
Ideolo_
Left
Middle
Ri:ht
S,
Im
wII
\M
Activists
20.36
5.35
11
16.00
8.43
917.20
8.321
5
Smithvale
Nonactivists
13.00
9.54
317.85
5.83
13
13.11
7.49;
9
Activists
20.60
3.85
516.00
8.76
421 25
4.86
Burgess
Nonactivists
17,83
5.38
617.62
6.73
26
18.19
5.12 ;16
Activists
18.60
5.44
15
21.20
5.92
10
11.83
6.59
6
Camden
! !i
Nonactivists
25.00
0.00
119.50
7.06
22
17.63
8.57
19
1
Note. - Normative data from
912 college students
(Guilford and Zimmerman,
1949) indicate a mean score of
18.8 and a standard deviation
of 6.56.
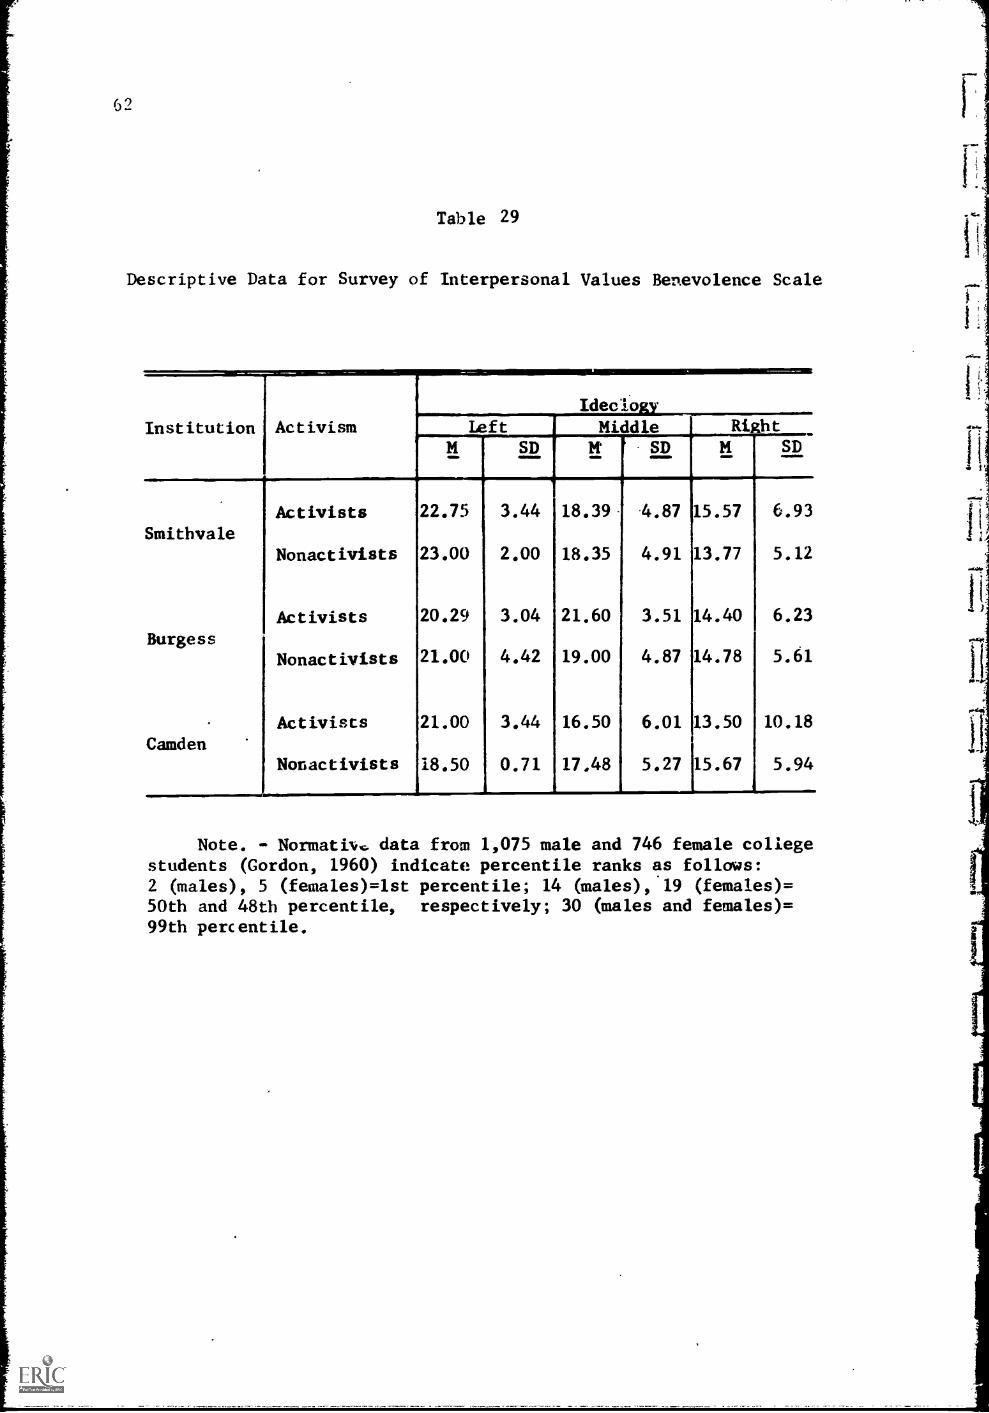
Table 29
Descriptive Data for Survey of Interpersonal Values Benevolence Scale
Institution Activism leftSD
Activists 22.75 3.44
SmithvaleNonactivists 23.00 2.00
Activists 20.29 3.04
BurgessNonactivists 21.00 4.42
Activists 21.00 3.44Camden
Nonactivists 18.50 0.71
.11
1
IdeologyMiddle RiRht
SD M SD
18.39 4.87 15.57 6.93
18.35 4.91 13.77 5.12
21.60 3.51 14.40 6.23
19.00 4.87 14.78 5.61
16.50 6.01 13.50 10.18
17,48 5.27 15.67 5.94
Note. - Normativ.. data from 1,075 male and 746 female collegestudents (Gordon, 1960) indicate percentile ranks as follows:2 (males), 5 (females)=1st percentile; 14 (males), 19 (females)=50th and 48th percentile, respectively; 30 (males and females)=99th percentile.
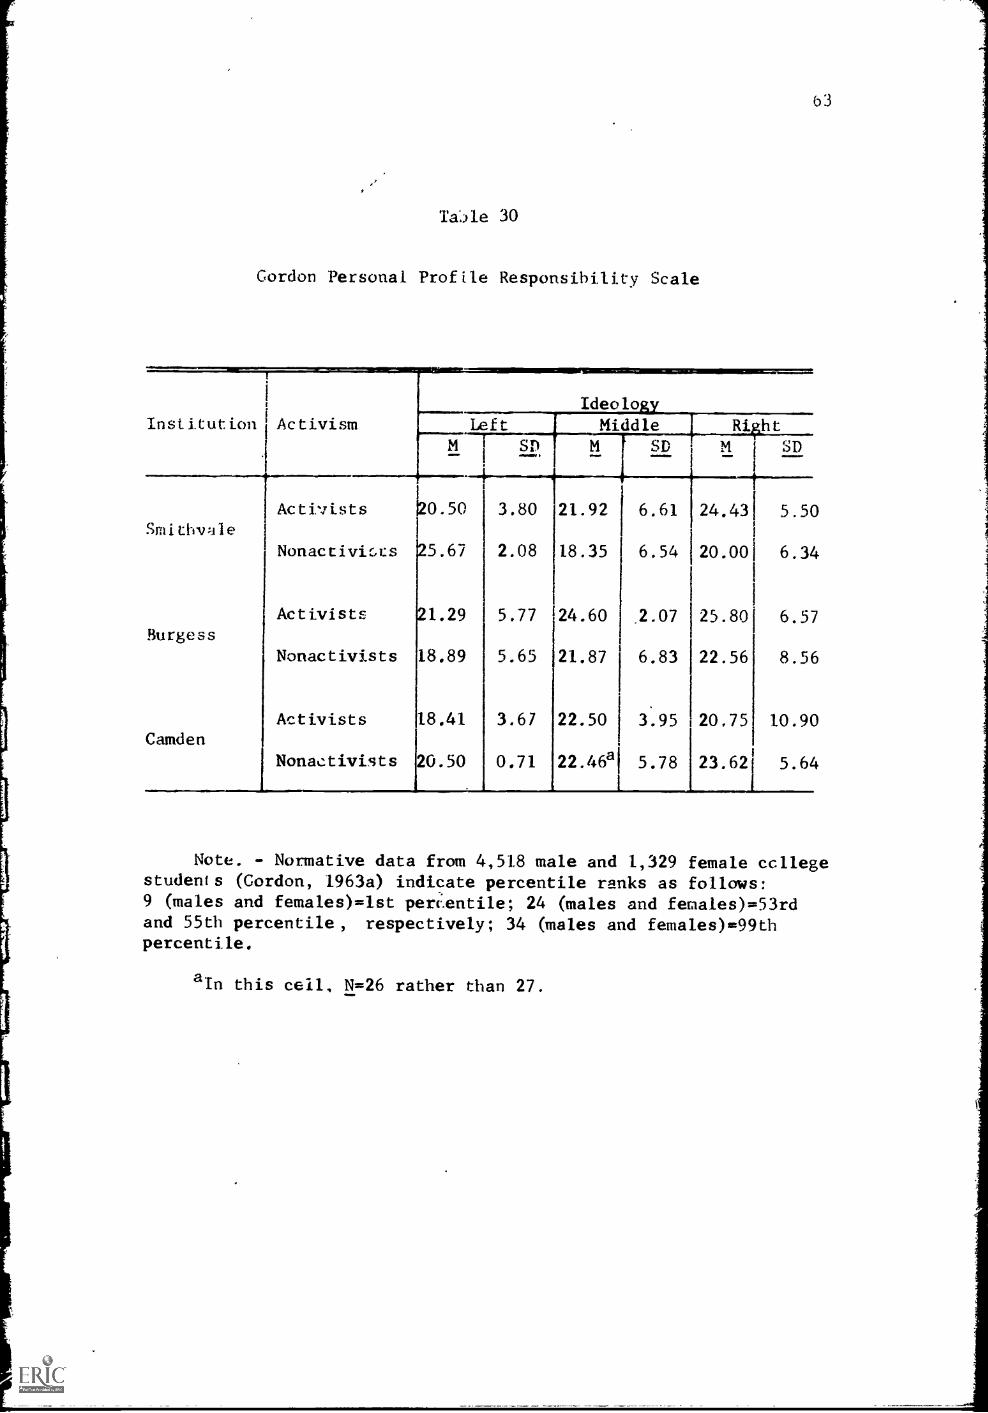
Tale 30
Gordon Personal Profile Responsibility Scale
Institution Activism
ActivistsSmithwile
Nonactivic.cs
ActivistsBurgess
Nonactivists
ActivistsCamden
Nonactivists
O3
60.50
5.67
1.29
18.89
18.41
20.50
3.80 21.92 6.61
5.77 24.60
5.65
3.67
0.71
.2.07
21.87 6.83
22.50 3.95
22.46a 5.78
M SD
24.43 5.50
20.00 6.34
25.80 6.57
22.56
20,75
23.62
8.56
10.90
5.64
Note. - Normative data from 4,518 male and 1,329 female ccllegestudents (Cordon, 1963a) indicate percentile ranks as follows:9 (males and females)=1st percientile; 24 (males and females)=53rdand 55th percentile, respectively; 34 (males and females)=99thpercentile.
aIn this cell, N=26 rather than 27.
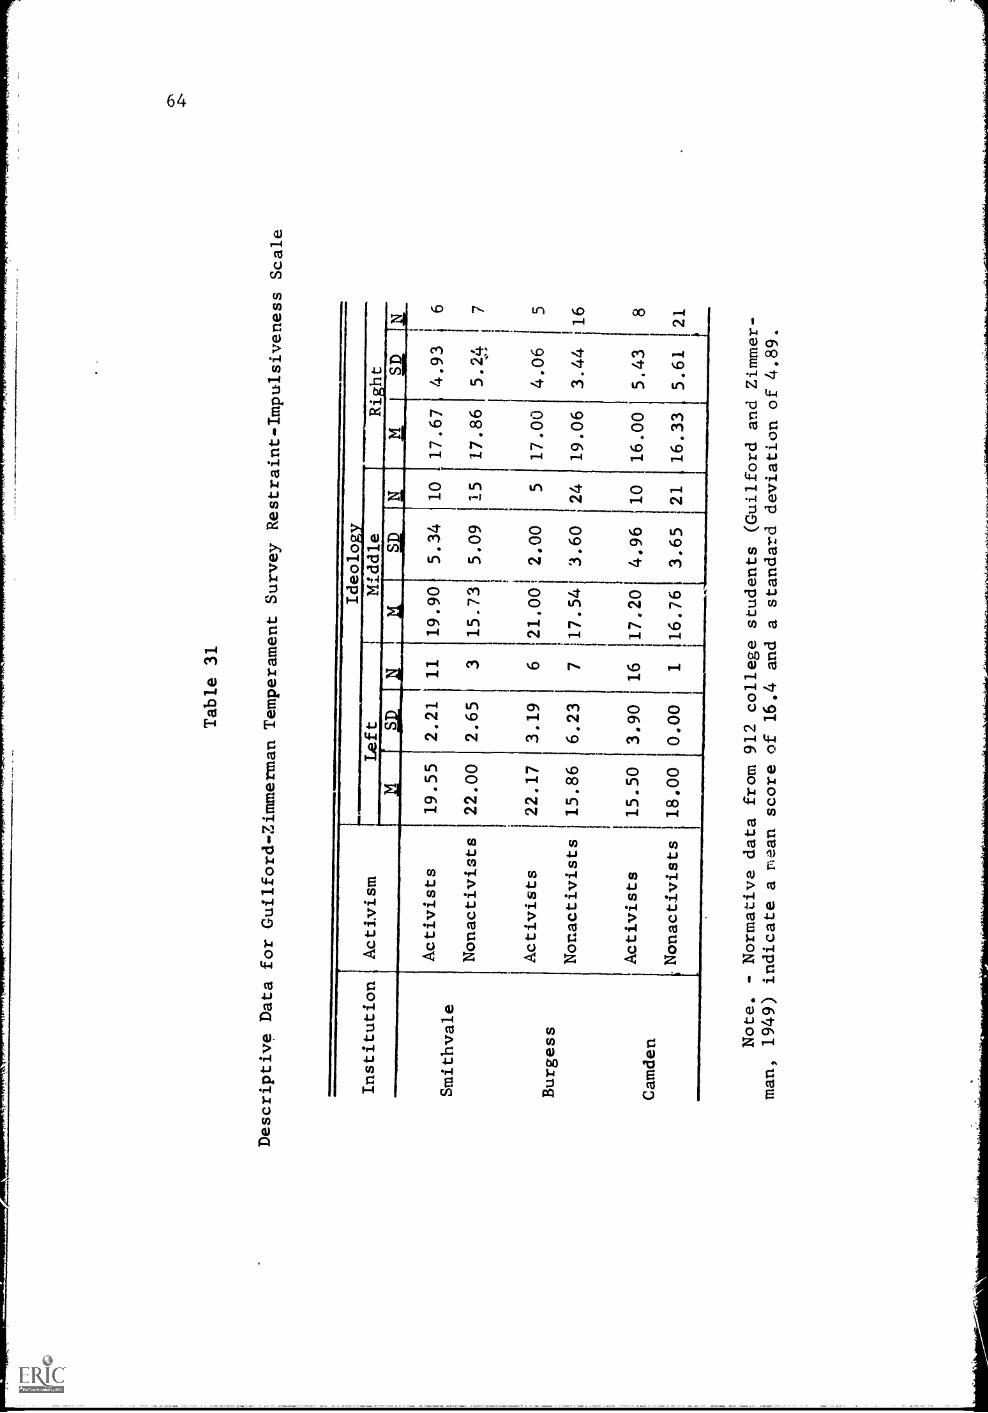
Table 31
Descriptive Data for Guilford-ZimmermanTemperament Survey Restraint-Impulsiveness
Scale
Institution
Activism
Ideology
Middle
Right
Left
SAD
jvl
SD,
Activists
19.55
2.21
11
19.90
5.34
10
17.67
4.93
6Smithvale
Nonactivists
22.00
2.65
315.73
5.09
15
17.86
5.24
7
Activists
22.17
3.19
621.00
2.00
517.00
4.06
5Burgess
Nonactivists
15.86
6.23
717.54
3.60
24
19.06
3.44
16
Activists
15.50
3.90
16
17.20
4.96
10
16.00
5.43
8Camden
Nonactivists
18.00
0.00
116.76
3.65
21
16.33
5.61
21
Note. - Normative data from 912 college students (Guilford and Zimmer-
man, 1949) indicate a mean score of 16.4 and a standard deviation of 4.89.
-F-
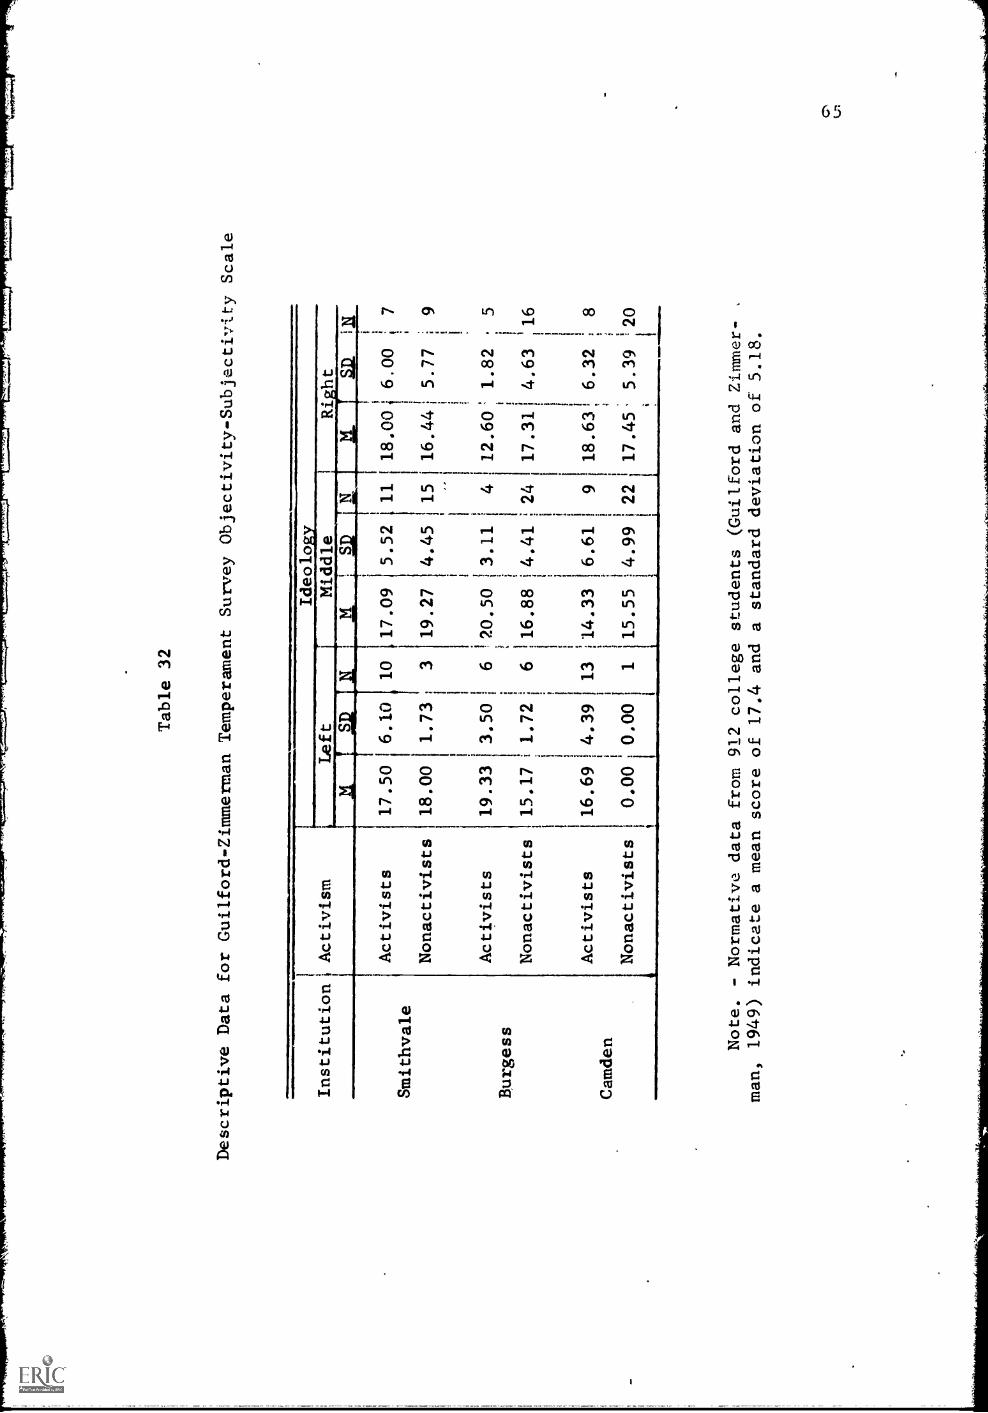
Table 32
Descriptive Data for Guilford-Zimmerman Temperament Survey Objectivity-Subjectivity
Scale
Smithvale
Burgess
Camden
11
Activists
Nonactivists
Activists
Nonactivists
Activists
Nonactivists
Institution
Activism
tLeft S
17.50
6.10
18.00
1.73
3
19.33
3.50
6
15.17
1.72
6
16.69
4.39
13
0.00
0.00
1
10
Ideology
Middle
M1
117.09
19.27
5.52
4.45
20.50
3.11
16.88
4.41
14.33
6.61
15.55
4.99
ht
M
11
18.001
6.00
7
15
16.44; 5.77
t9
412.60' 1.82
.5
24
17.311 4.63 :16
918.63
1
6.32
8
22
17.45' 5.39 120
Note. - Normative data from 912 college students (Guilford and Zimmer-
man, 1949) indicate a mean score of 17.4 and a standard deviation of 5.18.
66
apparently the ideology differences; and the activism differenceswere consistently in the same direction, but the magnitude of thedifferences were neither statistically significant nor consistent.The three-way interaction of the GZTS 0 Scale is presented in Figure7. Because of the attenuated cell Ns for this scale, the results ofthe interactions should be interpreted with caution.
"Factors" Differentiating Groups
In a multivariate,multigroup enperiment such as this one,another way to examine the same data is to determine the extent towhich, and the manner in which, the groups of subjects may be differ-entiated by a set of dependent variables operating together. Thequestion asked is, What combinatiors of dependent variables differenti-ate the groups? This can be answered by way of a multiple discriminantanalysis (Veldman, 1967, pp. 268-279). Such an analysis was performedon the seventeen questionnaire scales unrelated to the criteria (sincethe subjects were selected on the basis of their ideology and activism,to have included the PEC, ACT-A and ACT-D scales would have addedlittle information, as the groups would probably have been most differ-entiable on these three scales). Because the main interest was in theideology and the activrsm dimensions, rather than in the institutions,and in order to keep the multiple discriminant analysis from being toocumbersome, the subject groups were combined across institutions forpurposes of this analysis.
The multiple discriminant analysis resulted in five roots, or"factors," which accounted for 100% of the variance. The first tworoots, however, accounted for most of the variance and yielded signifi-cant chi-squares (X = 130.06, df = 21, 2. <.001 for Root 1;7,2 = 42.15,df = 19, 2. < .002 for Root 2). The remaining three roots did not yieldsignificant chi-squares. Correlations of the 17 variables with eachroot or discriminant function are presented in Table 33. Group centroidsfor the roots are presented in Table 34.
Root 1, which accounted for 63.33% of the variance, has been en-titled an "Authoritarianism" factor. As seen from Table 33, the SIVBenevolence Scale correlates most highly, but negatively, with thisfunction. The SIV Conformity Scale loads in a positive direction nextmost highly on this factor (it should be remembered that the SIV Scalesmeasure the value a person places on a quality). The remaining variablescorrelate negligibly with this function. A Newman-Keuls analysis of thegroup centroids on Root 1 (Table 34) indicates that the rightists, ingeneral, are highest on this function (see Figure 8). Both the rightactivists and the right nonactivists differed significantly from eachother and from the other four groups, as can be see,In in Figure 8. Nextin order were the middle groups and then the left groups. As is indi-cated in Figure 8, the left activists were significantly lower on thisfactor than all the other groups, whereas the left nonactivists did notdiffer significantly from the middle nonactivists. There were, in otherwords, three extreme groups on this factor: the right activists andright nonactivists were highest on this function; the left activists,lowest.
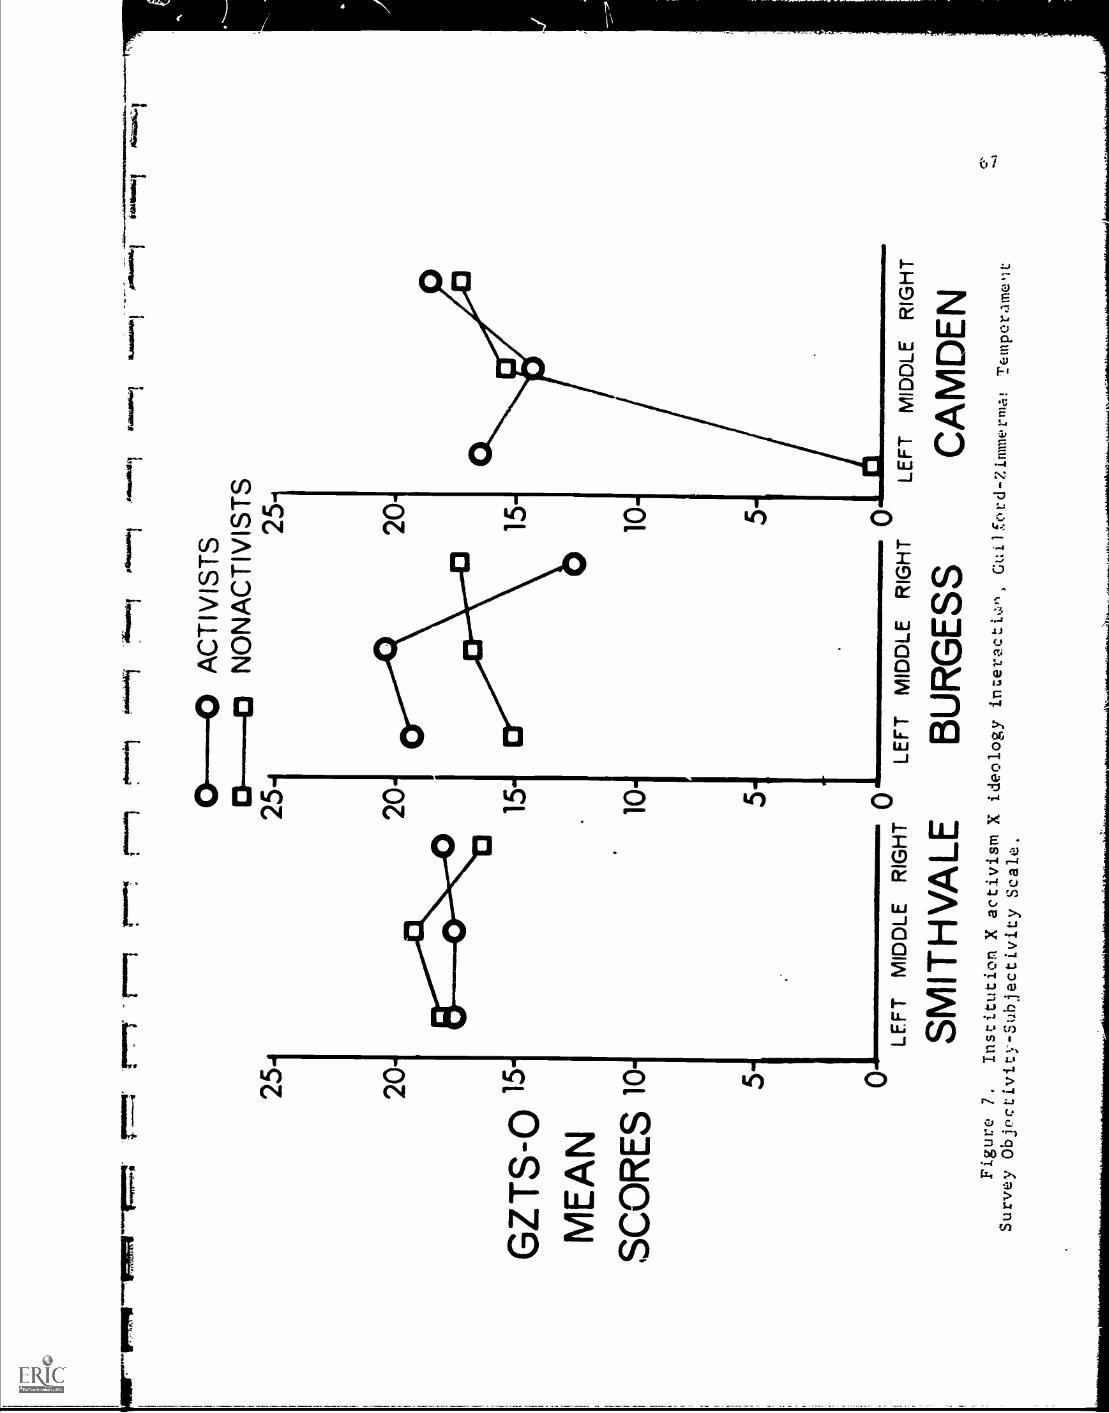
25 20-
GZ
TS
-O 1
5°
ME
AN
SC
OR
ES
10-
r-1
row
elre
wai
rtil
Ato
ftio
r11
ikaa
mem
n
0---
0 A
CT
IVIS
TS
13-0
NO
NA
CT
IVIS
TS
2525
20 15
20 15
1010
5-5
00
0LE
FT
MID
DLE
RIG
HT
LEF
T M
IDD
LE R
IGH
TLE
FT
MID
DLE
RIG
HT
SM
ITH
VA
LEB
UR
GE
SS
CA
MD
EN
Figure 7.
Institution X activism X
ideology inceracti,
Guilford-Zimmerma!
Temper.amplt
Survey Objectivity-Subjectivity
Scale.
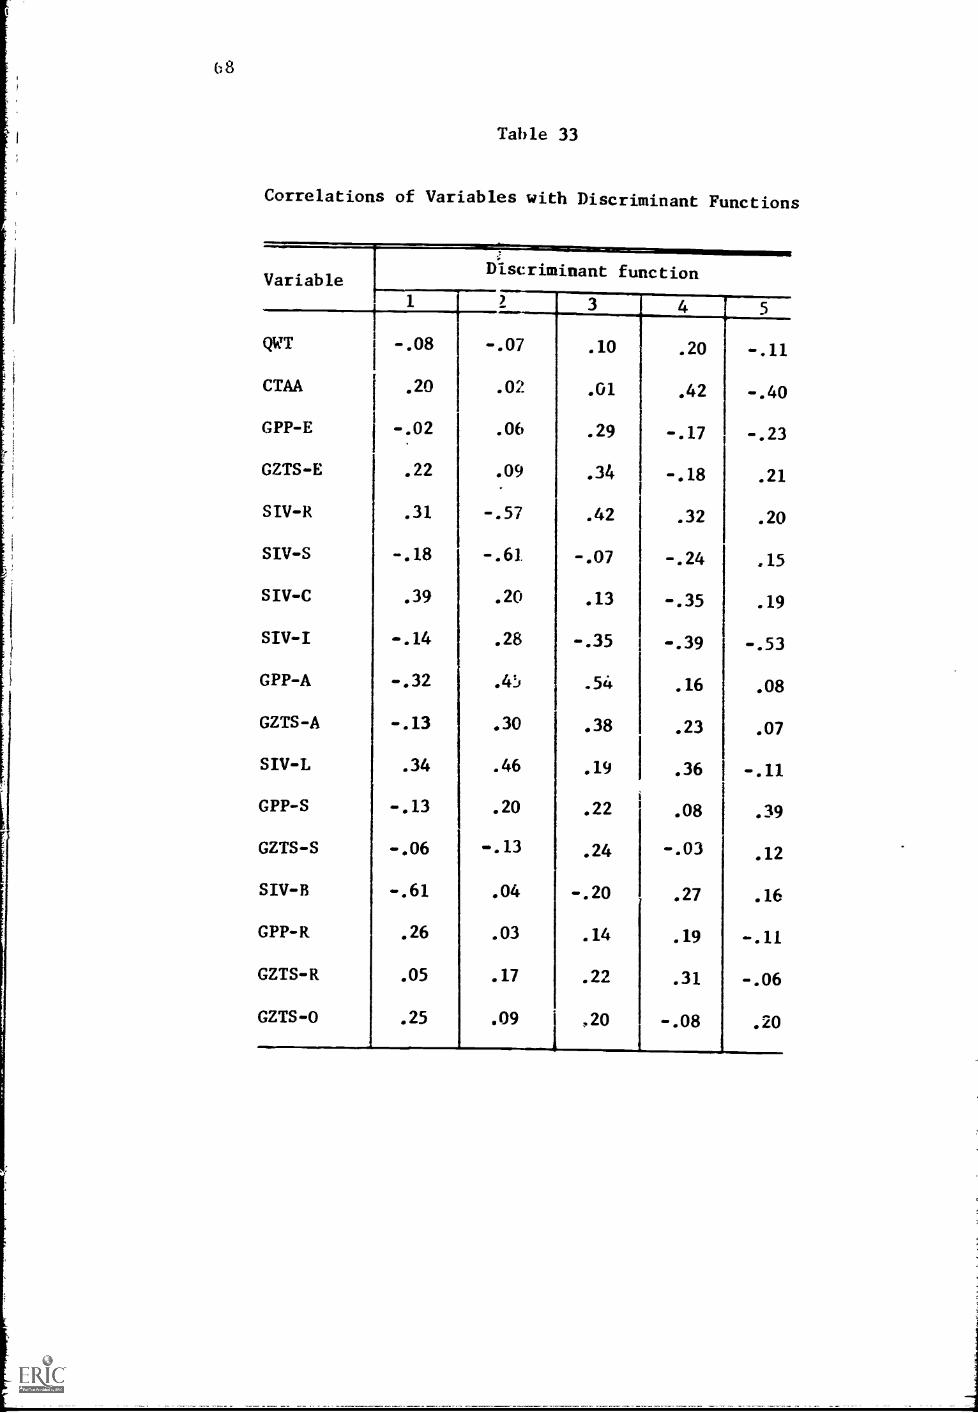
68
Table 33
Correlations of Variables with Discriminant Functions
VariableDiscriminant function
1i
3 4
QWT -.08 -.07 .10 .20 -.11
CTAA .20 .02 .01 .42 -.40
GPP-E -.02 .06 .29 -.17 -.23
GZTS-E .22 .09 .34 -.18 .21
SIV-R .31 -.57 .42 .32 .20
S1V-S -.18 -.61. -.07 -.24 .15
SIV-C .39 .20 .13 -.35 .19
SIV-I -.14 .28 -.35 -.39 -.53
GPP-A -.32 .4!, .54 .16 .08
GZTS-A -.13 .30 .38 .23 .07
SIV-L .34 .46 .19 .36 y -.11
GPP-S -.13 .20 .22 .08 .39
GZTS-S -.06 -.13 .24 -.03 .12
SIV-13 -.61 .04 -.20 .27 .16
GPP-R .26 .03 .14 .19 -.11
GZTS-R .05 .17 .22 .31 -.06
GZTS-0 .25 .09 1 ,20
i
-.08 .20
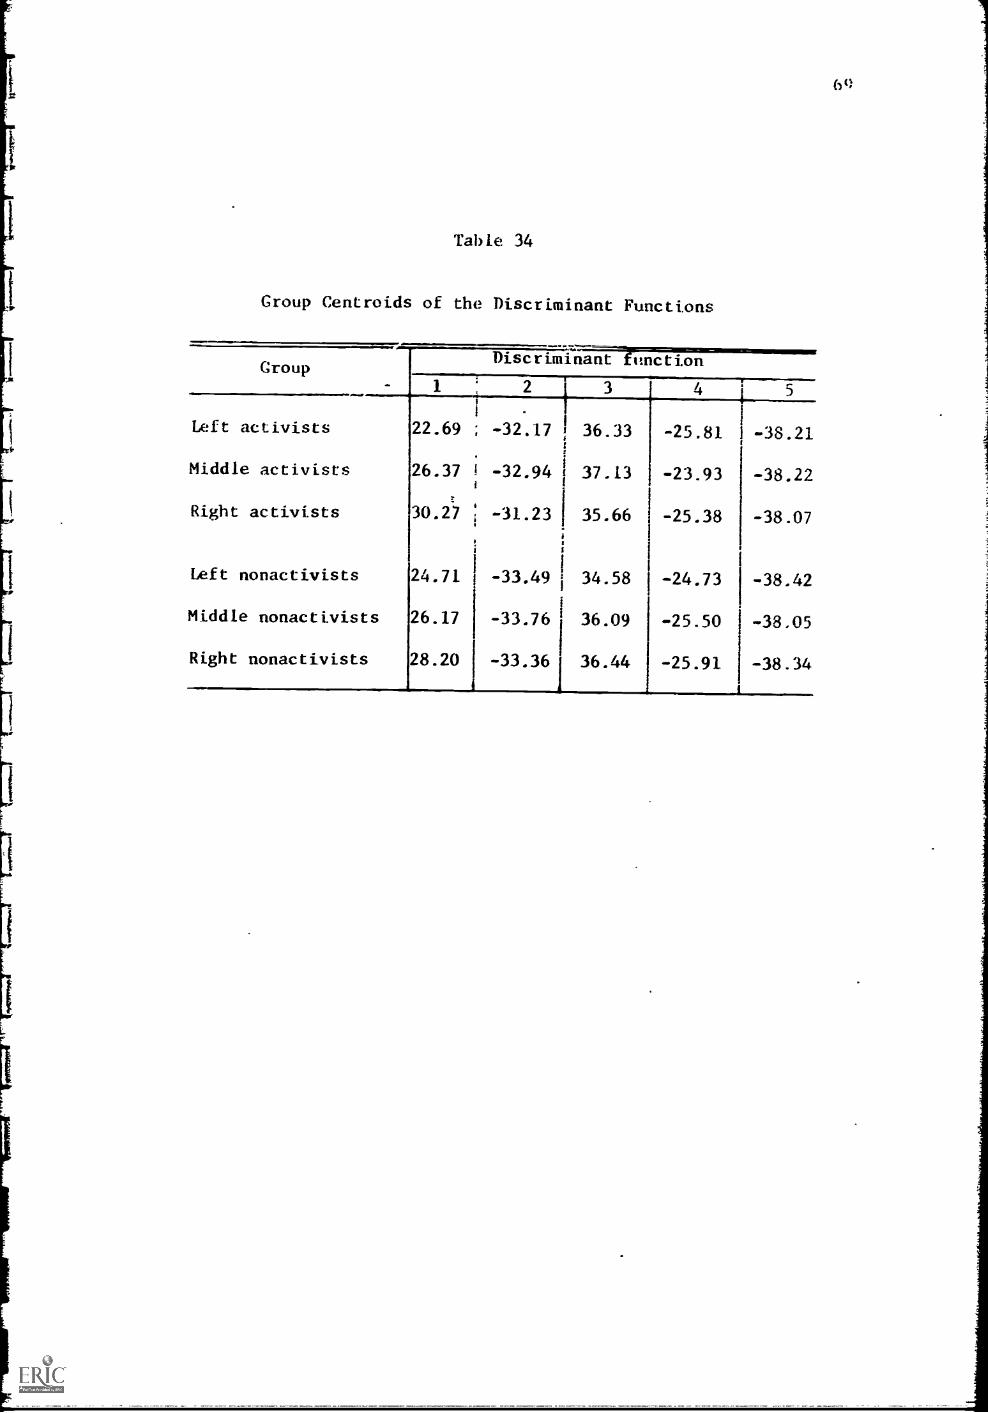
Table 34
Group Centroids of the Discriminant Functions
Group-.--
Discriminant unction
Left activists
Middle activists
Right activists
Left nonactivists
Middle nonactivists
Right nonactivists
1 2 3
22.69 ; -32.17 36.33
26.37 -32.94 37.13
30.27 -31.23 35.66
24.71 -33.49 34.58
26.17 -33.76 36.09
28.20 -33.361 36.44I
4 1 5
-25.81 -38.21
-23.93
- 25.38
-24.73
- 25.50
-25.91
-38.22
-38.07
-38.42
-38.05
-38.34
6(.1
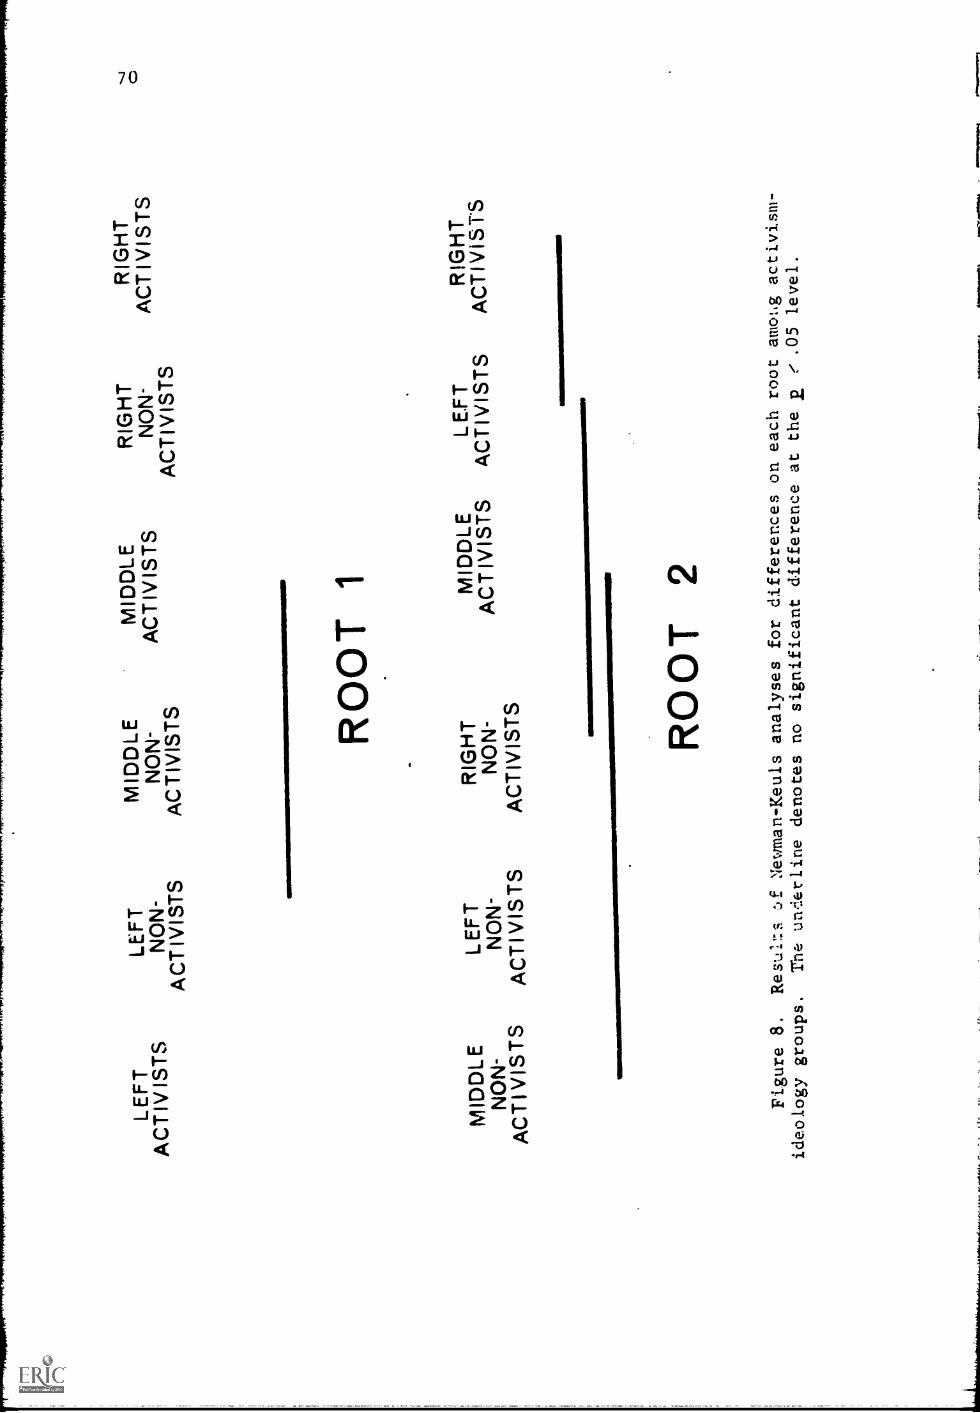
LEF
TLE
FT
AC
TIV
IST
SN
ON
-A
CT
IVIS
TS
MID
DLE
NO
N -
AC
TIV
IST
S
MID
DLE
MID
DLE
RIG
HT
RIG
HT
NO
N-
AC
TIV
IST
SN
ON
-A
CT
IVIS
TS
AC
TIV
IST
SA
CT
IVIS
TS
RO
OT
1
LEF
TR
IGH
TN
ON
-N
ON
-A
CT
I VIS
TS
AC
TIV
IST
S
MID
DLE
LEF
TA
CT
IVIS
TS
AC
TIV
IST
SR
IGH
TA
CT
IVIS
T'S
RO
OT
2
Figu
re 8
.R
esui
r.s.
New
man
-Keu
ls a
naly
ses
for
diff
eren
ces
on e
ach
root
ant
olig
act
ivis
m-
ideo
logy
gro
ups.
The
und
erlin
e de
note
s no
sig
nifi
cant
dif
fere
nce
atth
eE
e-
.05
leve
l.
71
Root 2 accounted for 16.55% of the variance. It has been calledan "Autonomy" factor. The SIV Recognition and Support Scales cor-relate highest and in a negative direction with the function, the SlyLeadership and Gordon Personal Profile Ascendancy Scales correlatenext highest and in a positive direction, and the GETS Ascendance-Submissiveness Scale correlates next highest and also positively withthis function, as is indicated in Table 33. In Table 34 are presentedthe group centroids of Root 2, and in Figure 8 are presented the re-sults of the Newman-Keuls analysis of the group differences. Theactivists in general were higher on this function (since the groupcentroids for Root 2 are negative numbers, the lower the absolute num-ber, the higher the group is in the factor). Of the activists, theright and left activists are higher than the other subgroups, whilenot differing significantly from each other on this factor.
Supplementary Results
It was suggested in Chapter I that one variable to examine instudying the activism phenomenon is the variable of commitment. It
was planned to evaluate that characteristic in the current study byobserving. differences in responses between leaders and followers. Aswas mentioned above, however, the left activist did not make leader-follower distinctions, and the plans to analyk.e tr.e data in this wayhad to be abandoned. Circumstances presented thk::r,Felves, however,
such that a much more direct, behavioral measure of commitment couldbe obtained among the members of one group, the left activists atCamden. As was mentioned in Chapter II, a considerable amount ofturmoil gripped the University of Camden campus during the period thatthis study was being conducted there. During the demonstrations, inwhich many of the left activists who were subjects in the presentstudy participated, the students were allowed to demonstrate outsideof a police-guarded university building, but if they chose to crossthe police lines, they faced arrest. The students were thus given aclear choice: to participate in a protest activity only, or to ex-press a commitment as well by voluntarily subjecting themselves toarrest.
It was felt that the act of submitting to voluntary arrest gavea good behavioral index of commitment. Consequently, when the ques-tionnaires were administered to the left activist subjects at Camden,the subjects were asked to indicate on their Code Number Instructions,by putting in a special code digit in the "Membership" space, if theyhad been arrested during the recent demonstrations.4 While the arrestdesignations are self-report data and are subject to the pitfalls con-cr.-rning those kin:1s of data, it was felt that a comparative analysis
4All students who were arrested were arraigned the same night andreleased early the next morning on their own recognizance, so thatnone of them was still in jail when the research questionnaires wereadministered.
72
of the characteristics of the voluntary arrestees versus the othermembers might still shed some tentative light on the commitment vari-able.
The data of the voluntary arrestees, compared with the data ofthe Camden left activists who were not arrested, are presented in Tables35 and 36. Only one of the differences between the voluntary arresteesand the other members was significant--the former scored higher on themeasure of their political activism than the latter.
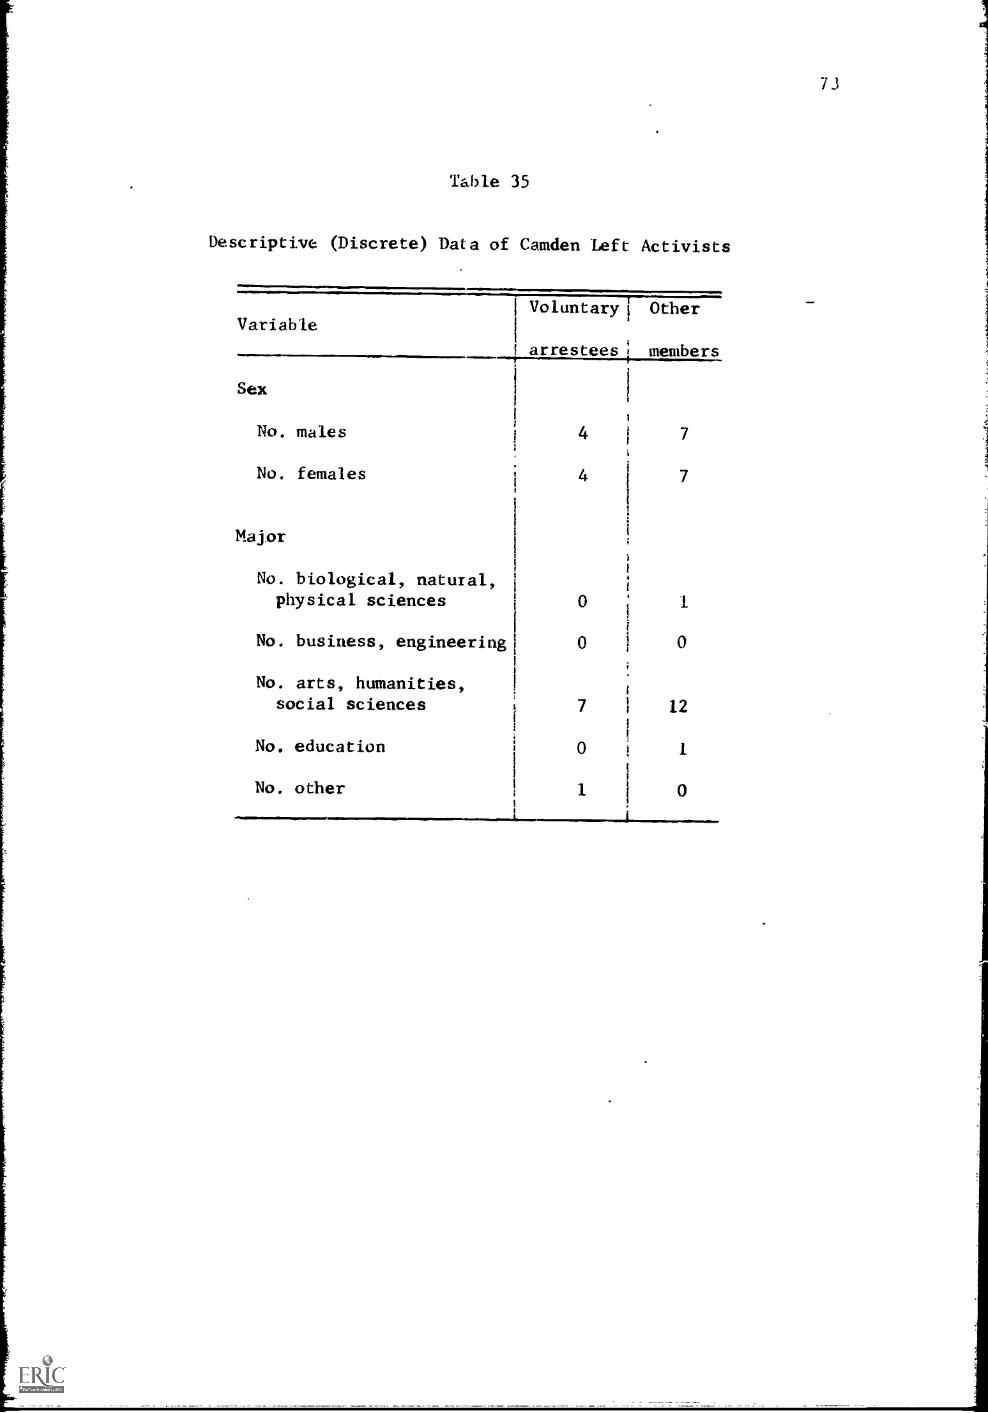
73
Table 35
Descriptive (Discrete) Data of Camden Left Activists
VariableVoluntary] Other
arrestees;
members
1
!
I
i
Sex
No. males 4
No. females 4i
7
7
Major
No. biological, natural,physical sciences 0
No. business, engineering 0 0
No. arts, humanities,social sciences 7 12
No. education 0 1
No. other 11
0
A
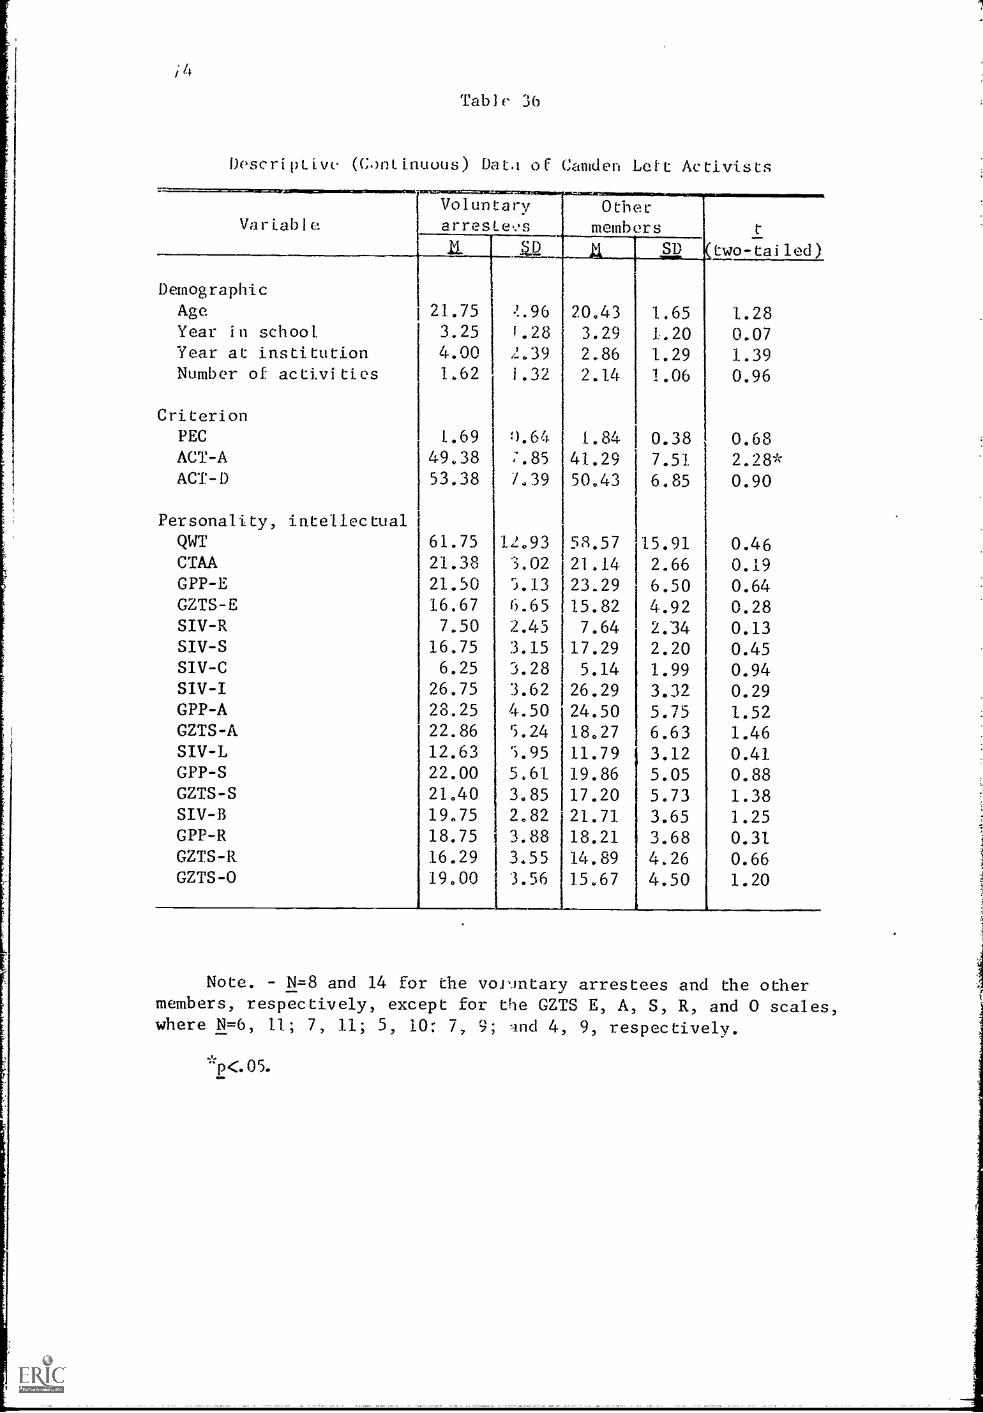
/4Talfly 36
Descriptive (GonLinuous) Data of Camden Lett Activists
Variable
_Voluntaryarreste..,s
Othermembers t
two-tailed)
Demographic
ii. ja SD
Age 21.75 )..96 20.43 1.65 1.28Year in school 3.25 1.28 3.29 1:.20 0.07Year at institution 4.00 2.39 2.86 1.29 1.39Number of activities 1.62 1.32 2.14 1.06 0.96
CriterionPEC 1.69 0.64 1.84 0.38 0.68ACT-A 49.38 ;.85 41.29 7.51 2.28*ACT-D 53.38 7.39 50,43 6.85 0.90
Personality, intellectual
NT 61.75 12.93 58.57 15.91 0.46CTAA 21.38 3.02 21.14 2.66 0.19GPP-E 21.50 'j.13 23.29 6.50 0.64GZTS-E 16.67 6.65 15.82 4.92 0.28SIV-R 7.50 2.45 7.64 2.34 0.13SIV-S 16.75 3.15 17.29 2.20 0.45SIV-C 6.25 3.28 5.14 1.99 0.94SIV-I 26.75 3.62 26.29 3.32 0.29GPP-A 28.25 4.50 24.50 5.75 1.52GZTS-A 22.86 5.24 18,27 6.63 1.46SIV-L 12.63 5.95 11.79 3.12 0.41GPP-S 22.00 5.61 19.86 5.05 0.88GZTS-S 21.40 3.85 17.20 5.73 1.38SIV-33 19.75 2.82 21.71 3.65 1.25GPP-R 18.75 3.88 18.21 3.68 0.31GZTS-R 16.29 3.55 14.89 4.26 0.66GZTS-0 19.00 3.56 15.67 4.50 1.20
Note. N=8 and 14 for the vol'intary arrestees and the other
members, respectively, except for the GZTS E, A, S, R, and 0 scales,where N=6, 11; 7, 11; 5, 10: 7, 9; lnd 4, 9, respectively.
"p<.05.
CHAPTER IV
DISCUSSION
As indicated in the Introduction, the aim of the present studywas to investigate more rigorously than has usually been the casethe personality, attitude, and intelligence attributes that may beassociated with student sociopolitical activism and nonactivismacross the whole range of political ideologies in institutions ofhigher education. It may be worthwhile, before discussing the mainfindings, to discuss the methods by which the subjects were chosenand the demographic characteristics of the finally selected sub-samples. The main findings are then examined and their impliciationsdiscussed.
Criterion Variables
It can be assumed that the stringent criteria for assignment ofstudents to each of the research cells resulted in relatively "pure"activism-ideology subgroups. The Politico-Econoliic ConservatismScale scores used as the ideology selection criterion was institutedto assure that the subgroups would cover the range of political ideo-logies. That the activists had to meet the additional standard ofbelonging to an activist organization of a certain political ideology,as well as scoring within the appropriate ideology range on the PECScale, doubly assured this for the activist groups. The politicalideology of the activist groups was thereby more accurately assessedand controlled than has usually been the case in previous research.On the other hand, this procedure entailed the exclusion of studentswhose ideology was incongruent with that of the activist organizationto which they belonged. That is to say, for example, that studentswho joined a left activist organization for non-left ideologicalreasons were not included in this study. The results that were ob-tained in this study, therefpre, reflect the motivational, personal-ity, intelligence; and demographic characteristics of ideologicallyconsistent activist students, not all activist students.
The expectation that members of politically active organizationswould engage in more sociopolitical activity than members of nonpolit-ical organizations was supported quantitatively by the results of the
75
Activity-Actual Scale.5 Activists also expressed a desire to engagein significantly more political activity than nonactivists, as meas-ured by the Activity-Desired Scale. Left-oriented students weremore politically active (and desired to engage in more politicalactivities) than the other ideology groups. This is congruent withthe findings of a similar, study conducted recently by the presentinvestigator at a large northeastern public university (Kerpelman,1969b). These consistent findings, plus the fact that there weremore left than right students in the original subsampl.es in the ac-tivist category than in the nonactivist category in the presentstudy (see Table 4), suggest a greater tendency toward political ac-tivity among left ideologists than among right ideologists at thesetypes of institutions. In light of this, the frequent confusion ofactivism with left activism is perhaps understandable. It may bethat the conservative philosophy eschews group political activismin favor of individual efforts. That there were many more ideologi-cally right than left students at all three institutions who did notbelong to a politically active organization (see Table 6) supportsthis assumption. Or it may be that student leftists find in contem-porary United States society more with which to be dissatisfied andabout which to actively protest. On the other hand, this findingmay simply be a function of the kinds and locations of the institu-tioas studied. Lipset and Altbach (1966) have reported that a largenumber of students and campuses are involved in right-wing studentactivity. Braungart (1966) and Peterson (1966) have indicated thatthis kind of activity tends to occur more frequently at church-related colleges and professionally oriented colleges. Since noneof the institutions studied either, in this research or in Kerpelman's(1969b) previous study fang into these categories, rightist activ-ists may have been underrepresented. Nevertheless, the kinds of in-stitutions studied in the present investigation are the kinds thattend to set the pace for American higher education, and consequentlyexamination of them is of value.
There were differences in overall level of political activityamong the institutions included in the present study. The studentsat the medium-sized private institution (Burgess University) were,on the whole, more politically active than those at the other twoinstitutions. This illustrates the finding (Astin, 1969) that,nationwide, there is a greater tendency for students at private uni-versities to engage in sociopolitical protests than for students atany other type of institution. Students at all three institutionsincluded in the present research were more politically active thanwere students at the institution studied earlier by Kerpelman (1969b),as measured, in both instances, by the Activity Scale. This may bemerely an .institutional difference, or it may indicate that the levelof political activism on American campuses is increasing with time,as suggested by Peterson (1968b).
5These results provide, as well, further evidence for the construct
validity of the ACT instrument.
77
In addition to ideology and activism, a third criterion variablein the present research was institution. Insofar as institution typemay influence the development of students' personality and politicalattitudes, the three institutions included in this research may beconsidered "natural" experiments. While perhaps exemplary, however,these institutions could not be considered representative of all in-stitutions of their kind. Since it was impossible within the scopeof this study to sample enough institutions within each institutiontype, generalizations about institution type must be considered ten-tative at best. It remains for a much larger national study, such asAstin (1968) has undertaken, to produce generalizations about institu-tions.
Demographic Characteristics
If these data are viewed as accurate observations of naturallyoccurring groups at each institution, i.e., if it can be assumedthat large sampling errors were not made, then certain comments arestimulated about the demographic characteristics of the studentgroups studied. One interesting result is that the frequent finding(Braungart, 1966; Watts and Whittaker, 1966) that student activists,and particularly student left activists, are overrepresented in thearts, humanities, and social sciences received only slight supporthere (see Table 9). In the present study, where data were obtainedfrom appropriate control groups, it was the case that, while leftactivists were slightly overrepresented in arts, humanities, andsocial sciences, and right activists were somewhat underrepresented,all other students, as well, seemed to prefer these majors.
Another striking thing to note in the demographic data is thatwhile the sexes were equally repreaented among left and middle sub-jects, there were twice as many males as females among right-wing
students. Even more striking was the fact that there were no femalesin the right activist groups on two campuses, and only three (versusfive males) on the remaining campus (Camden). Braungart's (1966)
survey of student left and right activists also found proportionallyfewer females in right activist groups than in left activist groups.
The nonactivists in this study were older, as were the studentswith a left political orientation (as Braungart, 1966, found), aswere students at the state university. Congruent with the latterfinding, the students at the state university who participated inthis study were also at a higher year level than those at the pri-vate institutions. Since the subjects in this research were re-cruited from campus extracurricular organizations, this result sug-gests that students who attend a less selective institution of highereducation and who are, presumably, somewhat less intellectually ablethan their counterparts at private institutions, may postpone en-gaging in campus extracurricular activities until later in theircollege careers when they have become more firmly established intheir studies.
78
The political activists tended to engage in a greater number of
campus extracurricular activities of any kind' than the nonactivists,
consistent with previous findings (Kerpelman, 1969b). Interestingly,
there was a tentative trend (tentative because of the statistical
weakness of the variable of number of activities) for the left-
oriented students at the state university to engage in fewer extra-
curricular activities overall than their middle- or right-oriented
fellow students. An examination of the saty* data obtained at
another state university (Kerpelman, 1969b) reveals the same trend.
These findings suggest two hypotheses. The first is that left-
oriented students at the large public universities may be more
single-mindedly political, i.e., if they join any campus organiza-
tion at all, they tend to join exclusively the campus political or-
ganizations. This, in turn, suggests that these students may be
much more committed and devote more of their energy to sociopolitical
activities than other students. The second hypothesis is that: the
left-oriented students at large public universities may be repelled
by the ordinary extracurricular activities that are available to LLeill
and thus shun them. Both hypotheses would make interesting starting
points for further research.
No conclusions can be reached concerning the ethnic, religious,
socioeconomic, and family background characteristics of the groups
studied in this research, for such was not the focus of this investi-
gation. Astin (1968, 1969) has been able to do this in his-large
national study of college students, as has Braungart (1966) on a more
limited scale. To have attempted to obtain enough subjects to have
been able to partial out and study the effects of these variables
within the boundaries of the present research design, however, would
have extended the scope of this project beyond its intended limits.
Main Results
The main results of this study are embodied in the questionnaire
findings. It is pertinent to comment, at this point, that while all
the questionnaires were self-report instruments, several of them
(such as the Survey of Interpersonal Values and the Gordon Personal
Profile) had anti-faking devices built in and utilized a forced-
choice format (which would make less obvious the traits being meas-
ured). Several others (the Quick Word Test and the Control Test AA)
assessed factual information or aptitudes. Consequently, almost all
the traits measured were probably not, to any great extent, influ-
enced by conscious effort on the part of the respondents to appear
consisted with a "public image." It is important to note this be-
cause, while the methodology of the present study did not allow
selection of all subjects without their being aware why they were
selected (as suggested by Geller and Howard, 1969), it is doubtful
that much "faking" of personality or other traits could have occurred
anyway. The anonymity stressed during the experimental procedure
probably also helped to minimize subjects' attempts to influence the
direction of their responses.
79
Perhaps the most important general result, from both a methodo-logical and a conceptual point of view, was the failure to find, inany of the instruments (except the ACT-A, already discussed) signifi-cant Activism by Ideology interactions. This suggests that previousresearch efforts that have attributed characteristics to particularactivist groups (usually left activists) probably have done so incor-rectly, due to the failure to separate the contributions of activismfrom the contributions of ideology. Only on the "Authoritarian"factor of the discriminant analysis, where combinations of variablesin interaction were analr,ed, did the left activists stand out fromthe other groups. On the "Autonomy" factor, interestingly, the leftactivists and the right activists stood together. In not one of thepersonality, attitude, or intellectual measures analyzed separatelyin this study, however, were left activists significantly differentfrom any other subgroups, nor were right activists, nor were anyactivism-ideology subgroups.6 The hypothesis implicit in this study,and posed elsewhere as well (Block, Haan, and Smith, 1969; Kerpelman,1969b; Lipset, 1968)--that characteristics that have been identifiedwith left activists may characterize the involved generally or left-ists generally--was on the whole supported, at least for those per-sonal and social characteristics measured in the present research.
Because of recent events, much attention has been focused onradical left students in higher education institutions in the UnitedStates. Yet the results of the present research are notable not somuch in regard to what they indicate about left activists, but ratherin what they do not indicate; for they do not indicate that studentleft activists are unique in any of the properties studied here. It
is possible that the students involved in the "new left" movement ofthe early sixties did indeed exclusively possess certain positivecharacteristics, but that now the movement's base has broadened sothat less able and less psychologically rich students are now in-cluded among the student left. Unfortunately, the tendency in theearlier research not to make appropriate comparisons or to use appro-priate measurements prevents a definitive answer to this point. It
is clear, though, that in the late 1960s, with appropriate compari-sons made and the appropriate measures utilized, student left activ-ists do -.lot have an exclusive claim to the high levela of intelli-gence, psychological richness, and the many other properties ascribedto them in previous research. All of this underlines the necessityof using caution in ascribing characteristics to particular studentgroups when only the dimension of activism or only the dimension ofideology is taken into account. This is not solely an academic dis-tinction, for the research that has been done, which is then dissem-inated via the scientific literature (cf. Katz, 1967) and thence
6The three three way interactions that resultul(on the SIV-C,and GZTS-0 Scales) did delineate activism-ideology subgroup differ-ences, but these differed among the institutions; there were no gener-al activism-ideology trends that held across the three institutions.
80
via the popular mews media (cf. Leo, 1967), has frequently not takenthis distinction into account, with a misleading picture of today'scollege students resulting.
Intellectual characteristics. What did the present study indi-cate to be the salient characteristics associated with activism, ideo-logy, and institution? First, the only significant differences inmeasured intellectual ability occurred among student from differentinstitutions. There were no significant differences along the activ-ism dimension, nor along the ideology dimension, nor were there anysignificant interactions. This point deserves emphasis, for an un-critical reading of the previous research literature (Bay, 1967;Flacks, 1967; Katz, 1967; Somers, 1965; Trent and Craise, 1967) mightgive a different impression.7 The failure in the present research tofind activism or ideology differences, or activism by ideology inter-actions, in measured intellectual ability suggests, further, that pre-viously used indirect indices of intelligence (such as reported gradepoint average and intellectual disposition questionnaires) are negli-gibly correlated, at best, with intelligence. As Geller and Howard(1969) have shown, student left activists tend to perceive themselvesas ranking higher in class standings than they are in reality, indi-cating that the self-report measures of academic achievement used inprevious studies may well have been invalid. As Heist and Yonge(1968) have pointed out about their frequently used measure of intel-lectual disposition, it is negligibly correlated with academic achieve-ment. These facts seem to indicate that it is inappropriate to gener-alize from indirect measures of intellectual ability to intelligence,as has been done so frequently in the past. Certainly the evidencefrom the present investigation contradicts previous statements concern-ing the intelligence of left activists and indicates that a higherlevel of intelligence is not the exclusive province of any particularideology subgroup or activist-nonactivist subgroup among collegestudents.
Emotional stability. The notion that left activists approachbeing "psychological noblemen," as posited by Bay (1967) and by Katz(1967), or the opposite notion put forth by less sympathetic sourcesthat left activists are maladjusted and playing out authority con-flicts (Bettelheim, 1969),are both probably exaggerations and over-simplifications. As measured by two scales of general emotional sta-bility in the present research, neither notion received empiricalsupport. There were no differences among any of the groups on thesemeasures. Of course, it is always possible that the two scales were
7Kerpelman's (1969b) finding of a higher level of intellectual abil-ity of all activists compared with all nonactivists in one institutionof higher education was not replicated in the present study. It per-haps resulted from the confounding of age and year level in school withthe activism dimension (the activists were higher on both variables), aspeculation that was entertained in the previous study. In'any case,that study also failed to find an activism by ideology interaction inintelligence.
not fine enough to differentiate among any of the groups.that other subscales of the same questionnaires did yieldity differences among ideology, activism, and institutionhowever, makes that conjecture unlikely.
81
The factpersonal-categories,
The failure to find differences on emotional stability in thepresent study replicates similar findings in a previous study (Kerpel-man, 1969b). In that study, GPP-E scores were in approximately thesame range as in the present research, and there were no group differ-ences. Whittaker and Watts (1968) found no differences in personaladjustment between left activists and a random sample of students,thus supporting these findings on at least part of the sample. Thesefactors add further credence to the postulation that there are no dif-ferences in overall emotional stability among student activists andnonactivists of left, middle, and right political ideology. It seemsappropriate, then, to turn to specific personality qualities that maycharacterize the groups.
Social acceptance. The various personality traits subsumed underthe rubric of social acceptance concern did result in interesting (andcomplex) differences among the groups. In an attempt to characterizethe group differences clearly, the less important institution effectshave been ignored for the purposes of this exposition. Left-orientedstudents can be characterized as valuing conformity and recognitionfrom others less, but valuing independence more. In not valuing con-formity, they stand together with middle-oriented students, whereas invaluing independence, they stand together with rightist students.
That rightist students can value both conformity and independencesimultaneously appears initially to be a contradiction. Yet the con-servative philosophy seems to call for an ability to tolerate such am-biguities, as exemplified by the glorification of individual enterprisetogether with a disdain for unusual or highly individualized behavioror appearance. The discriminant analysis results also support thethesis that the rightisLs must be able to tolerate contradiction--orat least to compartmentalize them so that they do not appear as contra-dictions. On both of the seemingly opposite significant factors re-sulting from the discriminant analysis, the "Authoritarianism" factorand the "Autonomy" factor, the right activists were the highest group.The term "obedient rebels," coined.by Schiff (1964) to characterizethese apparently contradictory tendencies in right activists, seemsto have, then, some empirical substance.
Leftists do not value conformity or recognition, but they dovalue independence, as both the individual scale results and the dis-criminant analysis (Root 1) results imply. That student leftistsvalue autonomy highly is consistent with the findings of other workerswho have examined left activists (Raan, Block, and Smith, 1968; Whit-taker and Watts, 1968). The consistency of these findings suggeststhat this constellation of nonauthoritarian qualities is perhaps morecharacteristic of left-oriented students than any other quality or
82
qualities. The independent thinking and nonconformity characteristics
hypothesized as properties of the student left (cf. Sampson, 1967) are
thus probably valid ones which likely have personality and attitudinal
bases.
Middle -of- the -road students, who evidently consistute the bulk of
the student bodies at institutions of higher education, appear, on the
whole, to be less autonomous. They look for recognition from others
more than do the rightists or leftists, and they value personal inde-
pendence least. They also, however, value conformity less than do the
rightists. The picture that emerges of the moderate students is oneof concern about social acceptance, but not at the price of conformity.
Politically active students as a whole (that is, left, middle,
and right combined) value support from others less than do politically
nonactive students. This seems logical, for to be a student activist,
either in a student left or student right organization, or in an elec-
ted student government body, almost invariably involves abrasive con-
frontations with others outside of the organization. If an individual
requires understanding, encouragement, kindness, and consideration
from other people, or from groups of other people, it is unlikely
that he could remain comfortable being a member of a politically active
organization for very long. This line of reasoning, supported by thedata, is contradictory to a more informal, impressionistic line of
thought that suggests that activist organizations function as substi-
tute families. While more refined measures may allow elucidation of
this contradiction in the future, the present data support the former
interpretation.
Ascendancy and assertiveness. A personality characteristic that
student political activists would seem to need is one of assertiveness
and activity in groups, and it was found in all the measures of this
characteristic that the activists did, indeed, possess this trait more
so than the nonactivists. It was also found that left and middle stu-
dents valued leadership less than did the right students. A behavioral
demonstration of this in the left activists occurred, as was discussed
in the Results chapter, in the (apparently independent) denial by each
left activist group of the importance or relevance of leadership desig-
nations within their organizations. It would seem that the preference
for participatory democracy among leftist students runs deep and is a
reflection of a motivational tendency to devalue leadership. Conversely,
the frequently ascribed predilection for strong authority among right-
ists (cf. Kerpelman, 1968) seems to be congruent with their motivational
tendency to value leadership and power as found here.
Sociability. Although both the political activists and the politi-
cal nonactivists alike belonged to social groups of one kind or another,
there was a difference between them in terms of their sociability or
gregariousness, the activists being more sociable. It can be speculated
that the activist students have chosen to join organizations. the pur-
poses of which are to improve the functioning of their institution and
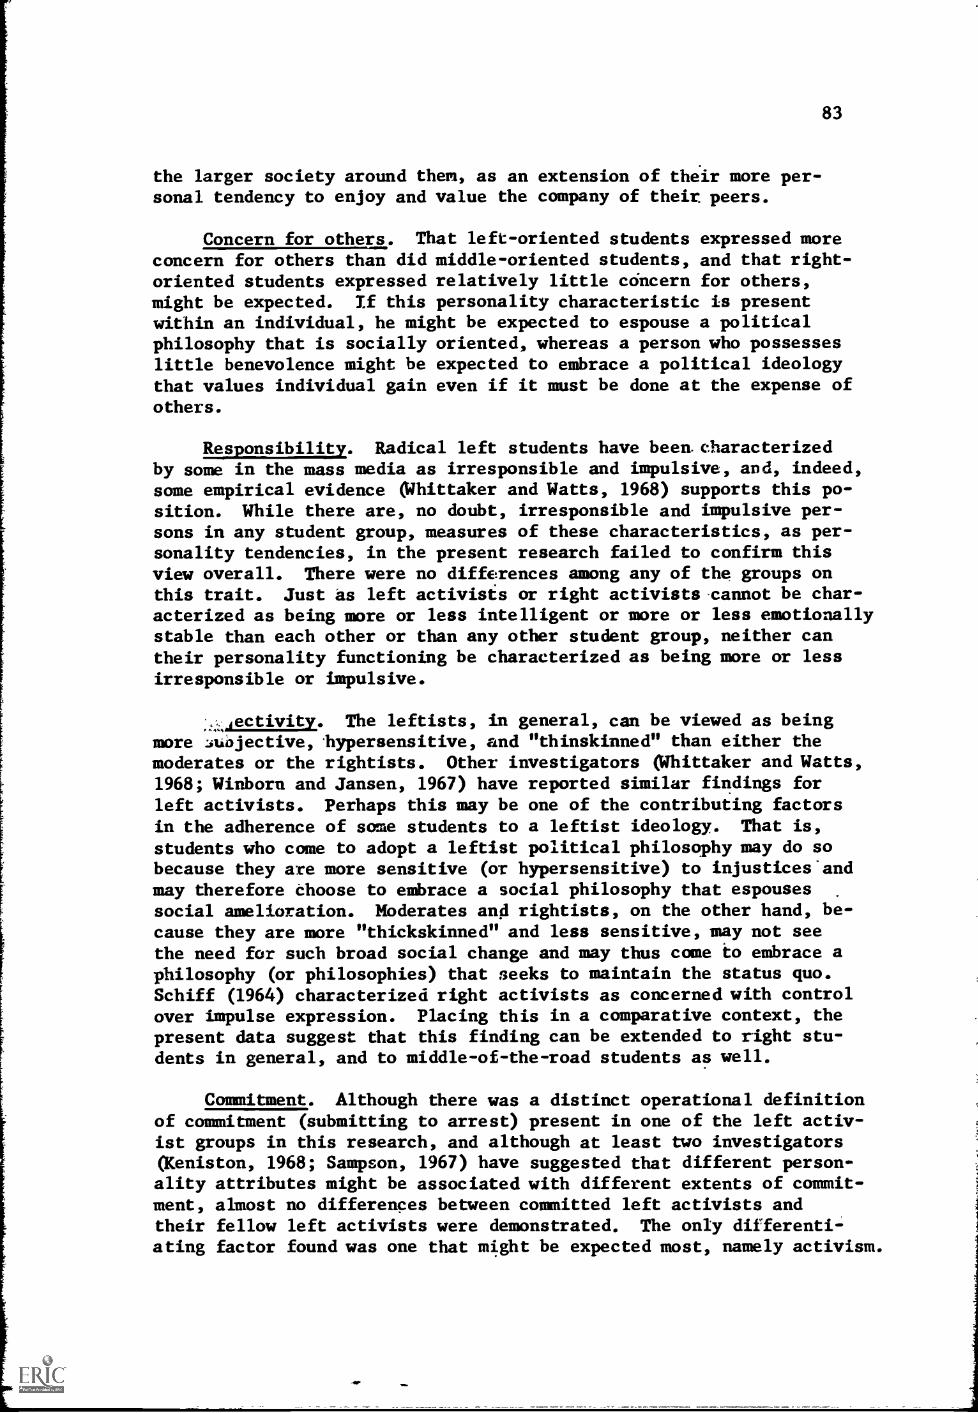
83
the larger society around them, as an extension of their more per-sonal tendency to enjoy and value the company of their. peers.
Concern for others. That left-oriented students expressed moreconcern for others than did middle-oriented students, and that right-oriented students expressed relatively little concern for others,might be expected. If this personality characteristic is presentwithin an individual, he might be expected to espouse a politicalphilosophy that is socially oriented, whereas a person who possesseslittle benevolence might be expected to embrace a political ideologythat values individual gain even if it must be done at the expense ofothers.
Responsibility. Radical left students have been. characterizedby some in the mass media as irresponsible and impulsive, and, indeed,some empirical evidence (Whittaker and Watts, 1968) supports this po-
sition. While there are, no doubt, irresponsible and impulsive per-sons in any student group, measures of these characteristics, as per-sonality tendencies, in the present research failed to confirm thisview overall. There were no differences among any of the groups onthis trait. Just as left activists or right activists cannot be char-acterized as being more or less intelligent or more or less emotionallystable than each other or than any other student group, neither cantheir personality functioning be characterized as being more or lessirresponsible or impulsive.
,,,,ectivity. The leftists, in general, can be viewed as beingmore :awjective, hypersensitive, and "thinskinned" than either themoderates or the rightists. Other investigators (Whittaker and Watts,1968; Winborn and Jansen, 1967) have reported similar findings forleft activists. Perhaps this may be one of the contributing factorsin the adherence of some students to a leftist ideology. That is,
students who come to adopt a leftist political philosophy may do sobecause they are more sensitive (or hypersensitive) to injustices-andmay therefore choose to embrace a social philosophy that espousessocial amelioration. Moderates and rightists, on the other hand, be-cause they are more "thickskinned" and less sensitive, may not seethe need for such broad social change and may thus come to embrace aphilosophy (or philosophies) that seeks to maintain the status quo.Schiff (1964) characterized right activists as concerned with controlover impulse expression. Placing this in a comparative context, thepresent data suggest that this finding can be extended to right stu-dents in general, and to middle-of-the-road students as well.
Commitment. Although there was a distinct operational definitionof commitment (submitting to arrest) present in one of the left activ-ist groups in this research, and although at least two investigators(Keniston, 1968; Sampson, 1967) have suggested that different person-ality attributes might be associated with different extents of commit-ment, almost no differences between committed left activists andtheir fellow left activists were demonstrated. The only differenti-ating factor found was one that might be expected most, namely activism.
84
The left activists who submitted to arrest were significantly morepolitically active overall than were the less committed left activ-ists. In this group, then, the st *idents who were most active inradical activities were willing to demonstrate their commitment bytheir actions. The failure to fitd arty other differences betweenhighly committed and less committed left activists points to the pit-falls of hypothesizing differences among groups, as Keniston (1968)and Sampson (1967) have done, in the absence of comparative data fromthe appropriate groups.
Methodological Implications
The two most obvious methodological implications of this studywould seem to be that appropriate comparison groups can and shouldbe examined in this, as in all other, research areas, and that rele-vant direct measures can and should be used as the basis of generali-zations about personality and attitude characteristics. These pointsseem so elementary, yet they are emphasized here because of the obvi-ous failure to implement these basic scientific practices in many ofthe previous research endeavors in this field. It is as if the in-vestigators' personal sympathies hive biased their methods of obtain-ing and interpreting the data, rather than letting the data speak forthemselves. It is hoped that the careful attention to methodology inthe current study will help to clarify some of the clouded issues inthis area of investigation.
The procedures instituted to guarantee institutional, organiza-tional, and individual confidentiality apparently went a long way infostering cooperation from the schools, the groups, and the students.The expected misgivings about participating in this research endeavoton the part of left activist and right activist students did not mate-rialize to any great extent. When, in contacting students, the projectwas dealt with openly and when anonymity was guaranteed, most studentswere willing to cooperate in this research. It should be added thatpayment for their services as subjects perhaps helped. In any case,though, the impossibility of tying particular responses to particularstudents no doubt made the research situation a more tolerable one forsome of the student activists, Utah right and left. Of course, longi-tudinal studies in which subjects are followed up after a period oftime cannot guarantee anonymity, but they can, with appropriate safe-guards, guarantee confidentiality.
A study such as this one cannot definitively answer the invariablemethodological question as to which came first, the personality charac-teristics or the political ideology and the propensity toward activism.This "chicken-egg" question has been debated by political scientists,sociologists, and psychologists for years. It is the author's opinionthat personality characteristics, which begin to develop at birth, dogive the individual predispositions to be more sympathetic to some po-litical philosophies than to others, and do determine the extent andnature of the activity he will engage in to implement those philosophies.
85
This view is opinion only, which studies of children's politicalsocialization (Greenstein, 1965; Hess and Torney, 1967; Sigel, 1969)
and longitudinal studies of the development of college students'
political behavior (Astin, 1968) may more adequately clarify.
Conceptual Implications
Given that social conditions are such as to arouse some stu-dents to protest or to engage in political activity focused upon
the sociopolitical situation, why .is it that only some students do
so? The personality characteristics that predispose some studentsto engage in sociopolitical activity seem to be, based on the re-
sults of the present study, the same no matter what the student's
political ideology is. Left activists, who aim at changing the
social and political structure mainly by working. upon it, middle
activists, who predominantly aim toward improving that structure by
working within it, and right activists, who seek by working withinthe structure to keep it from changing and even to revert it to pre-vious solutions to social awl political problems, are more similar
in their personality characteristics than they are different. Con-
versely, the personal and social properties of students who are notaroused to extraordinary political action also seem to be more simi-
lar than different, no matter what their political ideology. All
student activists, no matter what their ideology, are less needfulof support and nurturance, value leadership more, are more socially
ascendant and assertive, and are more sociable than students whoare not politically active, the results of this investigation indi-
cate.
It is obvious that there are many determinants of political
ideology--personality factors, socialization practices, philosophicalconcerns. This research has pointed to several personality and atti-tudinal variables that are differentially associated with left,middle, and right ideologies among students in institutions of higher
education: social acceptance concern, valuing leadership, benevolence,
and objectivity. Indeed, the ideologically left students, activist
and nonactivist alike, night be simplistically characterized as "soft-headed and soft-hearted," while ideologically right students may be
just as exaggeratedly characterized as "hard-headed and hard-hearted."
Given these comunalities within ideological groups, the related
questions still arise as to why some left students engage in radical
left political activity and others do not, why some middle-of-the-
road students seek campus office while others to not, and why some
-eight students identify themselves with conservative organizations
whereas others do not. Even though the present research examined an
extensive set of personality variables, it generally did not find any
personal characteristics that distinguish between the activists and
nonactivists within each ideology group. The student who tends toward
activism has characteristics which are not unique to any ideological
group. The factors that spur a person who espouses one or another
ideological position to action are thus probably specific environmental
86
factors. It remains for an investigation that is much larger inscope than this one--one that studies, in vivo, the attitudes andcharacteristics not only of students, but also of administrators,faculty, and trustees, as well as the impact of intra- and extra-institutional events that occur--to discover the stimuli for studentsociopolitical activity. Such a study might be a large-scale, inter-disciplinary, longitudinal study of the life of an institution ofhigher education--how crises are stimulated both from within andwithout, what the reactions to crises and the predispositions toreact are among the actors, and what the personal, social, and moti-vational interactions of the participants are. It seems likely thatthe phenomena associated with student activism can best be understoodfrom such a broad-based endeavor. And the time is ripe for this kindof endeavor.
REFERENCES
Adorno, Theodor W.,Frenkel-Brunswik, Else, Levinson, Daniel J.,andSanford, R. Nevitt. The authoritarian personality. New York:Harper, 1950.
Astin, Alexander. Personal and environmental determinants of studentactivism. Paper presented at the meeting of the American Psycho-logical Association, San Francisco, August 1968.
Astin, Alexander. In Kenneth Clark (Chairman), Factors underlyingstudent unrest on the college campus. Symposium presented at theAmerican Psychological Association, Washington, September 1969.
Bay, Christian. Political and apoliticAl students: Facts in searchof theory. Journal of Social Issues, 1967, 23, 76-91.
Bettelheim, Bruno. Student revolt: The hard core. Vital Speeches ofthe Day, 1969, 35, 405-410.
Block, Jeanne, Haan, Norma, and Smith, M. Brewster. Activism andapathy in contemporary adolescents. In James F. Adams (Ed.),Understanding adolescence: Current developments in adolescentpsychology. Boston: Allyn and Bacon, 1968, pp. 198-231.
Borgatta, Edgar*F. and Corsini, Raymond J, Buick Word Test manual.New York: Harcourt, Brace and World, 1964.
Braungart, Richard G. SOS and YAF: Backgrounds of student politicalactivists. Paper presented at the meeting of the American Socio-logical Association, Miami, August 1966.
Eisenhart, Churchill, Hastay, Millard, and Wallis, W. Allen (Eds.).Techniques of statistical analysis. New York: McGraw-Hill, 1947.
Fellows a' the Center for Advanced Study in the Behavioral Sciences.Student protests: A phenomenon for behavioral sciences research.Science, 1968, 161, 20-23.
Flacks, Richard. The liberated generation: An exploration of the rootsof student protest. Journal of Social Issues, 1967, 23, 52-75.
Geller, Jesse D. and Howard, Gary. Student activism and the war inVietnam. Unpublished manuscript, Yale University, 1969.
87
88
Gordon, Leonard V. Manual for Survey of Interpersonal Values.Chicago: Science Research Associates, 1960.
Gordon, Leonard V. Manual: Gordon Personal Profile (Rev. Ed.)New York: Harcourt, Brace and World, 1963. (a)
Gordon, Leonard V. Research briefs on Survey of Interpersonal Values.Chicago: Science Research Associates, 1963. (b)
Greenstein, Fred I. Children and politics. New Haven, Connecticut:Yale University, 1965.
Guilford, J. P. and Zimmerman, Wayne S. The Guilford-ZimmermanTemperament Survey manual. Beverly Hills, California: SheridanPsychological Services, 1949.
Haan, Norma, Smith, M. Brewster, and Block, Jeanne. Moral reasoningof young adults: Political-social behavior, family background,and personality correlates. Journal of Personality and SocialPsychology, 1968, 10, 183-201.
Halleck, S. L. Hypotheses about student unrest. Today's Education,1968, 57 (6) , 22-26.
Harvey, W. R. Least squares analysis of data with unequal subclassnumbers. Washington: United States Department of Agriculture,July 1960 (Publication ARS-20-8).
Heist, Paul. Intellect and commitment: The faces of discontent.In Owen A. Knorr and W. John Minter (Eds.), Order and freedomon the campus: The rights and responsibilities of faculty andstudents. Boulder, Colorado: Western Interstate Commission onHigher Education, 1965. Pp. 61-70.
Heist, Paul and Yonge, George. Omnibus Personality Inventory manual.New York: Psychological Corporation, 1968.
Hess, Robert D. and Torney, Judith V. The development of politicalattitudes in children. Chicago: Aldine, 1967.
Katz, Joseph. The student activists: Rights, needs, and powers ofundergraduates. Report prepared for the U. S. Office of Educa-tion, 1967.
Keniston, Kenneth. Young radicals: Notes on committed youth. NewYork: Harcourt, Brace and World, 1968.
Kerman, George. Rebels without a program. New York Times Magazine,January 1968.
Kerpelman, Larry C. Personality and attitude correlates of politicalcandidate preference. Journal of Social Psychology, 1968, 76,219-226.
89
Kerpelman, Larry C. Concurrent validity of a brief test of academicaptitude. Ljg1012ELLoloicalasnEducitionalandPscl, 1969., 111.,
891-894. (a)
Kerpelzan, Larry C.. Student political activism and ideology: Con-parative characteristics of activists and nonactivists.1 Journalof Counseling Psychology, 1969, 16, 8-13. (b)
Leo, John. Studies-agree that most campus activists are coviparativrelyintelligent, stable and unprejudiced. New York Times, .June 19,1967, C29.
Levinson, Daniel A. P. social attitude battery. Cambridge,Massachusetts: Harvard University, 1959. (Mimeo)
Lindquist, E. F. Design rshiloujgdeducation. Boston: Houghton-Mifflin, 1953.
Lipset, Seymour Martin. The activists: 'A profile. apjbkils Interest,Fall 1968, 39;i51.
Lipset, Seymour Martin, and.iltbach, Philip. Student politics and .
higher education in the United States. cORALlatLiitratillReview, 1966, .1°, 320-349.
Peterson, Richard E". Technical manual CollegtAtAffaPrinceton, New 'Jersey: Educational. Atlas Service
Peterson, Richard E. The sc of or siscd udsPrinceton, New lersey:. Educational Testing Service,.
Peterson, Richard E. Predictivevalidity of. a brief test 'of academicaptitude.. Educational and Psych,acil Neasuroaint,1968,441-444. (a),
Peterson, Richard'E.. The scope of organized .studieja_protest in 1967-68.. Princeton, New Jersey: Educational Testing Service, 1968.
Simpson, Edward E. ,Studerit activism and the decade of protest.Journal of Social Issues, 1967; 23, 1-33.
Schiff, Lawrence The obedient rebels: A study of college conversion'sto conservatism. Journal of Social Issues, 1964, 209.7445.
Sigel, Roberta S. (Ed.). Political socialization. New York: RandomHouse, 1969, in press.
Somers, Robert H. The mainsprings of the rebellion: A 'survey of.Berkeley students. in November, 1964.. In Seymour N. Lipiet andSheldon. S.- Wolin (Eds.), The Berkeley student' revolt: 'New York:Anchor, 1965, pi. 530-537.
1
90
Trent, James W. 'and Craise, Judith L. Commitment and conformity inthe American college. Journal of Social Issues, 1967, 23, 34-51.
Velman, Donald J. Fortran programming for the behavioral sciences.New York: Holt, Rinehart and Winston, 1967.
Walsh, John. ACE study on campus unrest: Questions for behavioral. scientists, Science, 1969, 165, 157-160.
Watts, William A., Lynch, Steve, and Whittaker, David. Alienationand activism in today's college-age youth: Socialization pat-terns and current family relationships. Journal of CounselingPsychology, 1969, 16, 1-7.
)WattS; William4. and Whittaker, David. Free speech advocates atBerkeley. Journal of Applied Behavioral Science, 1966, 2; 41-62.
.141estbrc David L. and Braungart, Richard G. ClasS and politics in thefamily backgrounds of student political activists. AmericanSociological Review, 1966, 31, 690-692.
Westby', David L. and "Braungart, Richard G. Utopian mentality andconservatism: The case of the Young Americans for Freedom.Paper presented at the meeting of the American SociologicalAsoCiation,' San'Francisco, August 1967.
Westby, David L. and Braungart, Richard G. The alienation of genera-' tionS'and status politics: Alternative explanations of student
political activism. In Roberta S. Sigel (Ed.), Politicalsocialization. New York: Random House, 1969, in press.
Whittaker, David and Watts, William A. Societal confrontation orwithdrawal: Group personality contrasts of two extreme youthsubcultures. Paper presented at the meeting of the WesternPsychological Association, San Diego, March 1968.
Winborn, Bob B. and Jansen, David G, Personality characteristics ofcampus social- political action leaders. Journal of CounselingPsychology, 1967, 14, 509-513.
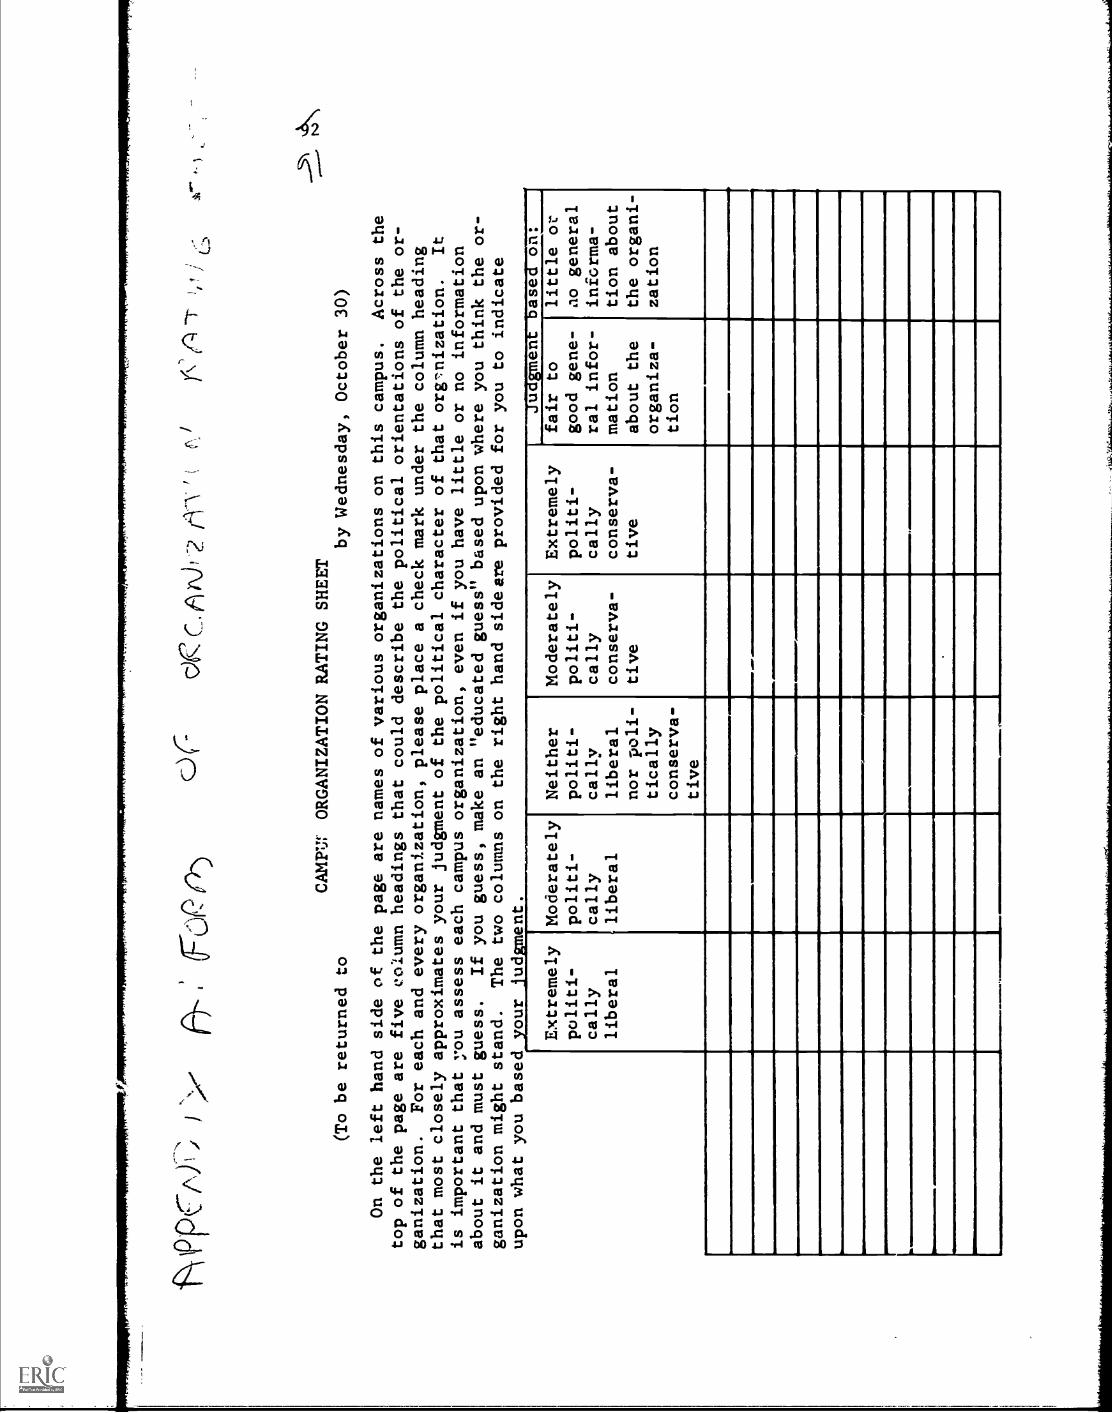
17\
IPP
f\fi
N:;V
(To be returned to
CAMPUr ORGANIZATION RATING SHEETby Wednesday, October 30)
,
On the left hand side of the page are names of various organizations on this campus.
Across the
top of the page are five column headings that could describe the political orientations of the or-
ganization.
For each and every organization, please place a check mark under the column heading
that most closely approximates your judgment of the political character of that org'nization.
It
is important that you assess each campus organization, even if you have little or no information
about it and must guess.
If you guess, make an "educated guess" based upon where you think the or-
ganization might stand.
The two columns on the right hand side Ere provided for you to indicate
Extremely
politi-
cally
liberal
Moderately
politi-
cally
liberal
Neither
politi-
cally
liberal
nor poli-
tically
conserva-
tive
Moderately
politi-
cally
conserva-
tive
Extremely
politi-
cally
conserva-
tive
ugmen
ase. on:
fair to
good gene-
ral infor-
mation
about the
organize-
tion
little or
ao general
informa-
tion about
the organi-
zation
1
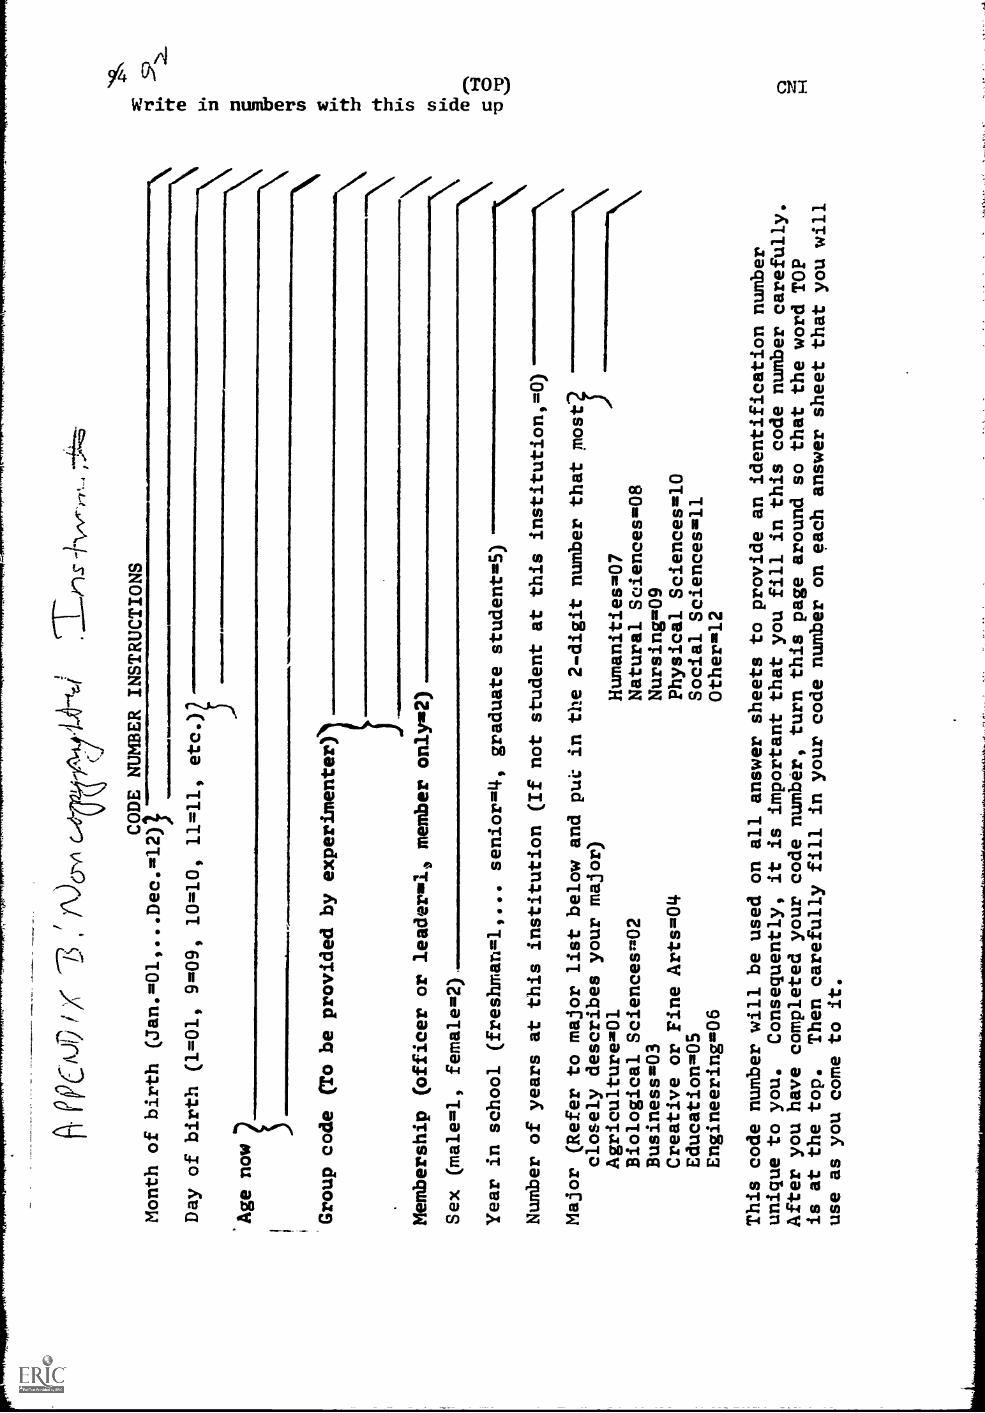
AP
ciui
),
A.)0- 6
c.-
CODE NUMBER INSTRUCTIONS
Month of birth (Jan.=01,...Dec.=12))
Day of birth (1=01, 9=09, 10=10, 11=11, etc.)
*Age now
Group code (To be provided by experimenter)
\\
Membership (oMeer or leader=10 member only=2)
Sex (male=1, female=2),
Year in school (freshman=1,... senior=4, graduate student=5)
Number of years at this institution (If not student at this institution,=0)
Major (Refer to major list below and put in the 2-digit number thatmost
closely describes your major)
Agriculture=01
Humanities=07
Biological Sciencesm02
Natural Sciences=08
Business=03
Nursing=09
Creative or Fine Arts=04
Physical Sciences=10
Education=05
Social Sciences=11
Engineering=06
Other=12
This code number will be used on all answer sheets to provide
an identification number
unique to you.
Consequently, it is important that you fill in this code number carefully.
After you have completed your code number, turn this
page around so that the word TOP
is at the top.
Then carefully fill in your code number
on each answer sheet that you will
use as you come to it.
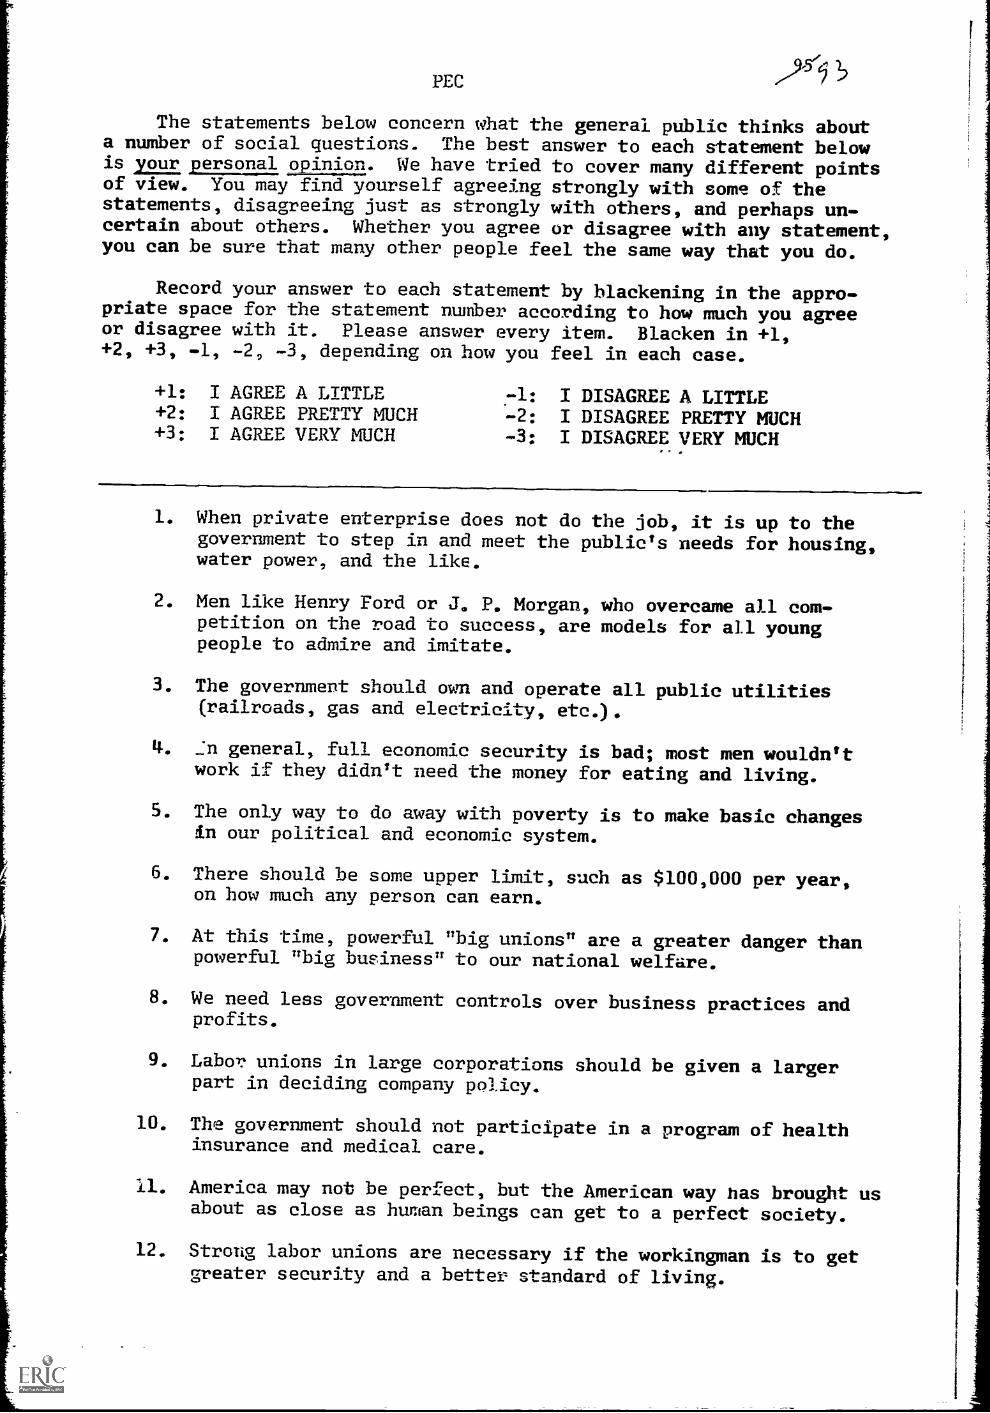
PEC
The statements below concern what the general public thinks abouta number of social questions. The best answer to each statement belowis your personal opinion. We have tried to cover many different pointsof view. You may find yourself agreeing strongly with some of thestatements, disagreeing just as strongly with others, and perhaps un-certain about others. Whether you agree or disagree with any statement,you can be sure that many other people feel the same way that you do.
Record your answer to each statement by blackening in the appro-priate space for the statement number according to how much you agreeor disagree with it. Please answer every item. Blacken in +1,+2, +3, -1, -2, -3, depending on how you feel in each case.
+1: I AGREE A LITTLE+2: I AGREE PRETTY MUCH+3: I AGREE VERY MUCH
I DISAGREE A LITTLE-2: I DISAGREE PRETTY MUCH-3: I DISAGREE VERY MUCH
1. When private enterprise does not do the job, it is up to thegovernment to step in and meet the public's needs for housing,water power, and the like.
2. Men like Henry Ford or J. P. Morgan, who overcame all com-petition on the road to success, are models for all youngpeople to admire and imitate.
3. The government should own and operate all public utilities(railroads, gas and electricity, etc.).
4. ..:11 general, full economic security is bad; most men wouldn'twork if they didn't need the money for eating and living.
5. The only way to do away with poverty is to make basic changesin our political and economic system.
6. There should be some upper limit, such as $100,000 per year,on how much any person can earn.
7. At this time, powerful "big unions" are a greater danger thanpowerful "big business" to our national welfare.
8. We need less government controls over business practices andprofits.
9. Labor unions in large corporations should be given a largerpart in deciding company policy.
10. The government should not participate in a program of healthinsurance and medical care.
11. America may not be perfect, but the American way has brought usabout as close as human beings can get to a perfect society.
12. Strong labor unions are necessary if the workingman is to getgreater security and a better standard of living.
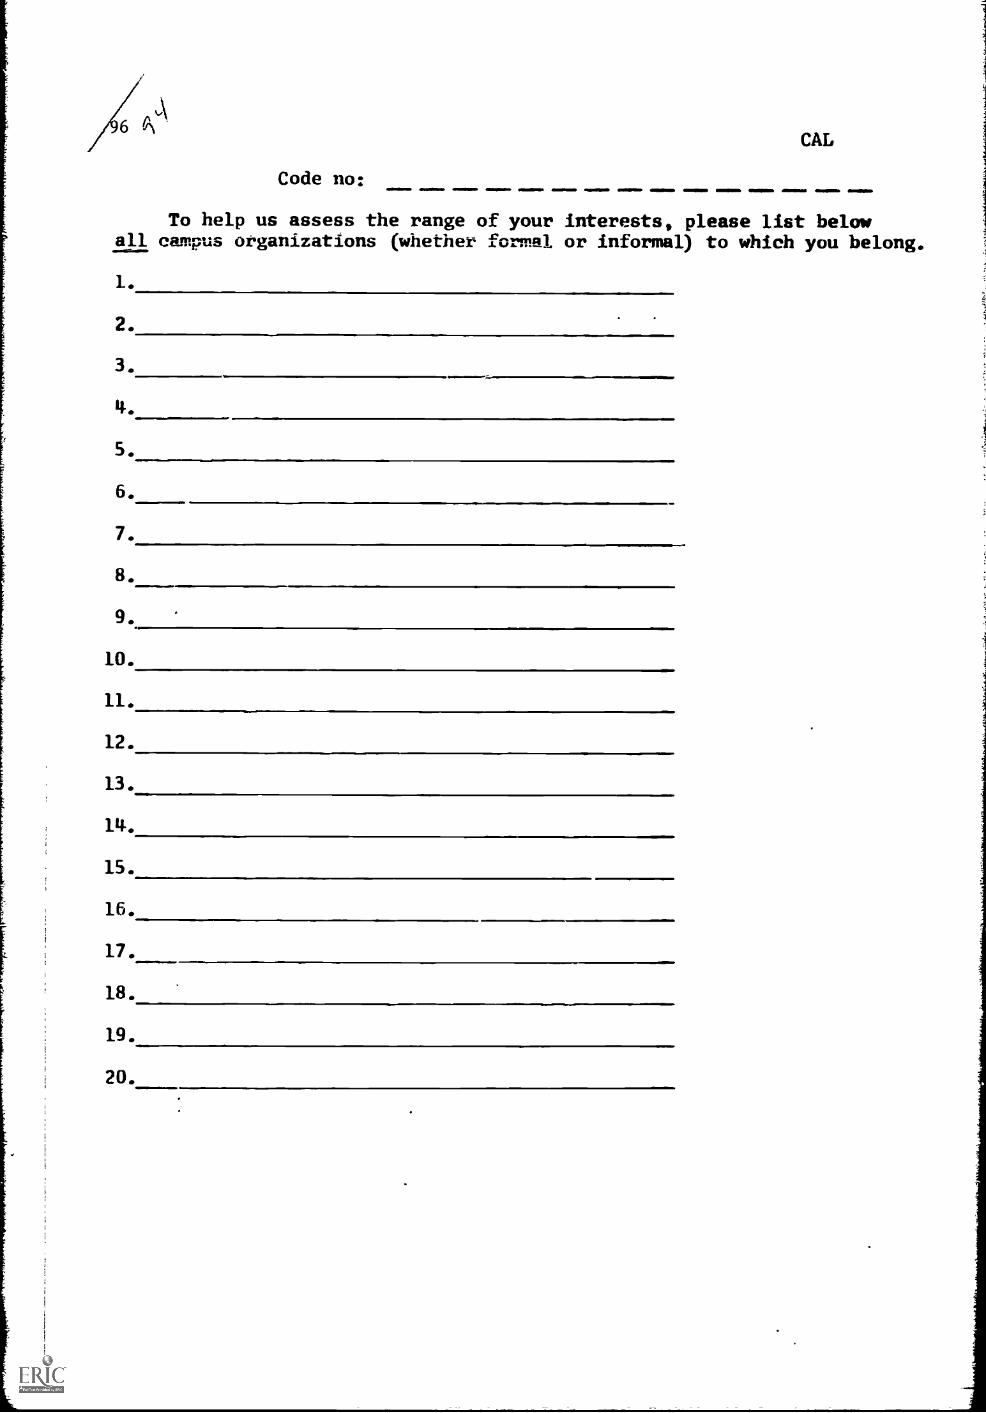
/\\Code no:
CAL
To help us assess the range of your interests, please list belowall campus organizations (whether formal or informal) to which you belong.
1.
2.
3.
it.
5.
6.
7.
8.
9.
10.
11.
12.
13.
14.
15.
16.
17.
18.
19.
20.
1
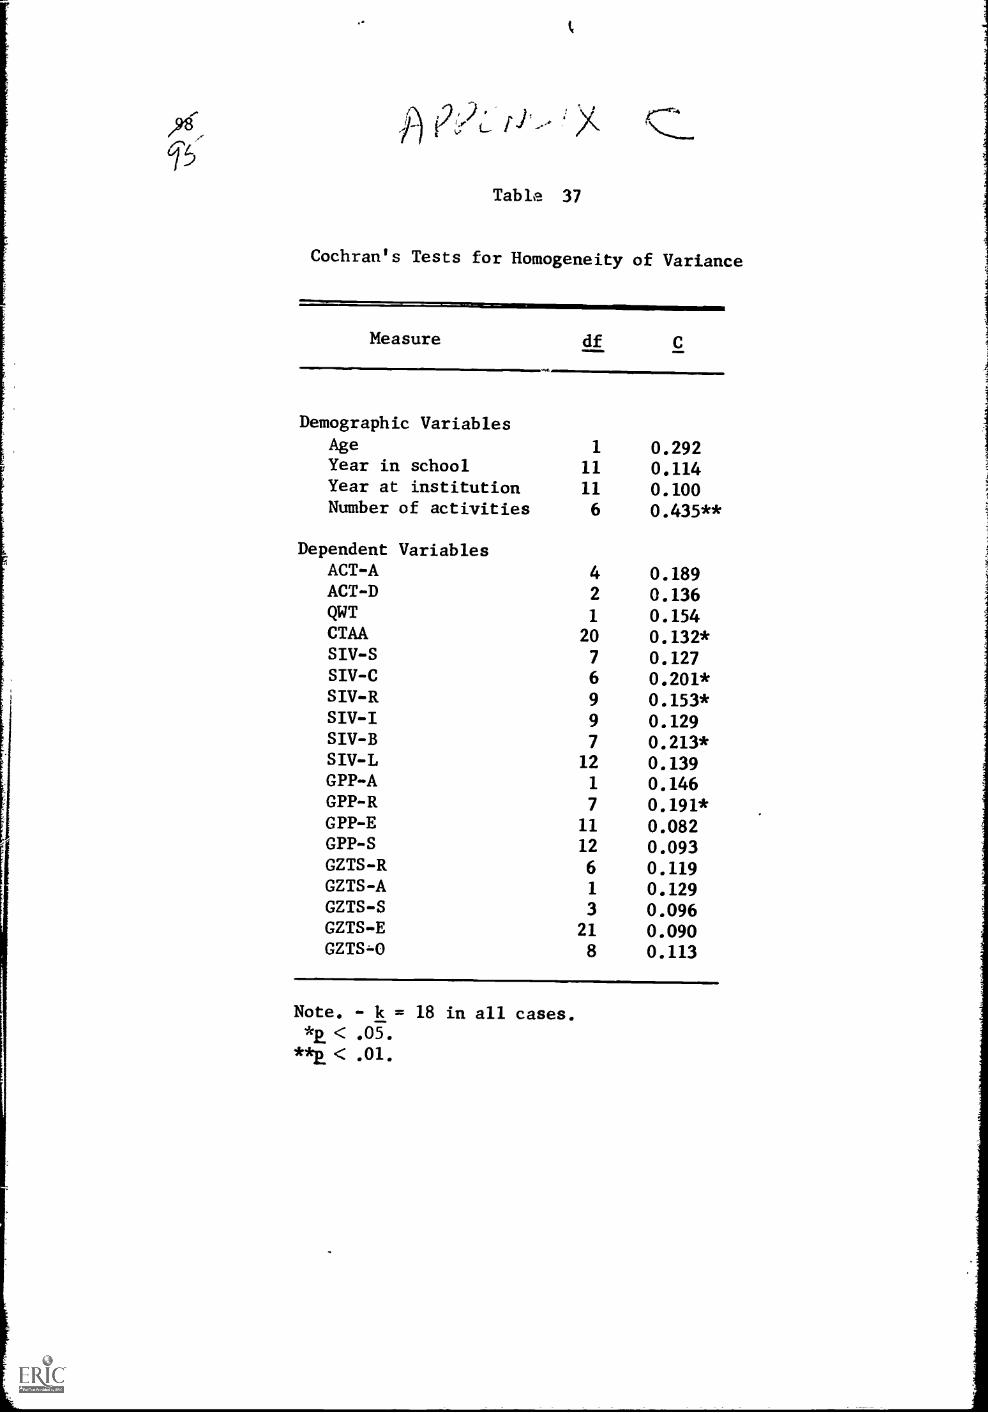
Table 37
Cochran's Tests for Homogeneity of Variance
Measure df
Demographic VariablesAge 1 0.292Year in school 11 0.114Year at institution 11 0.100Number of activities 6 0.435**
Dependent VariablesACT-A 4 0.189ACT-D 2 0.136QWT 1 0.154CTAA 20 0.132*SIV-S 7 0.127SIV-C 6 0.201*SIV-R 9 0.153*SIV-I 9 0.129SIV-B 7 0.213*SIV-L 12 0.139GPP-A 1 0.146GPP-R 7 0.191*GPP-E 11 0.082GPP-S 12 0.093GZTS-R 6 0.119GZTS-A 1 0.129GZTS-S 3 0.096GZTS-E 21 0.090GZTS-0 8 0.113
Note. - k = 18 in all cases.*p. < .05.
lorp. < .01.
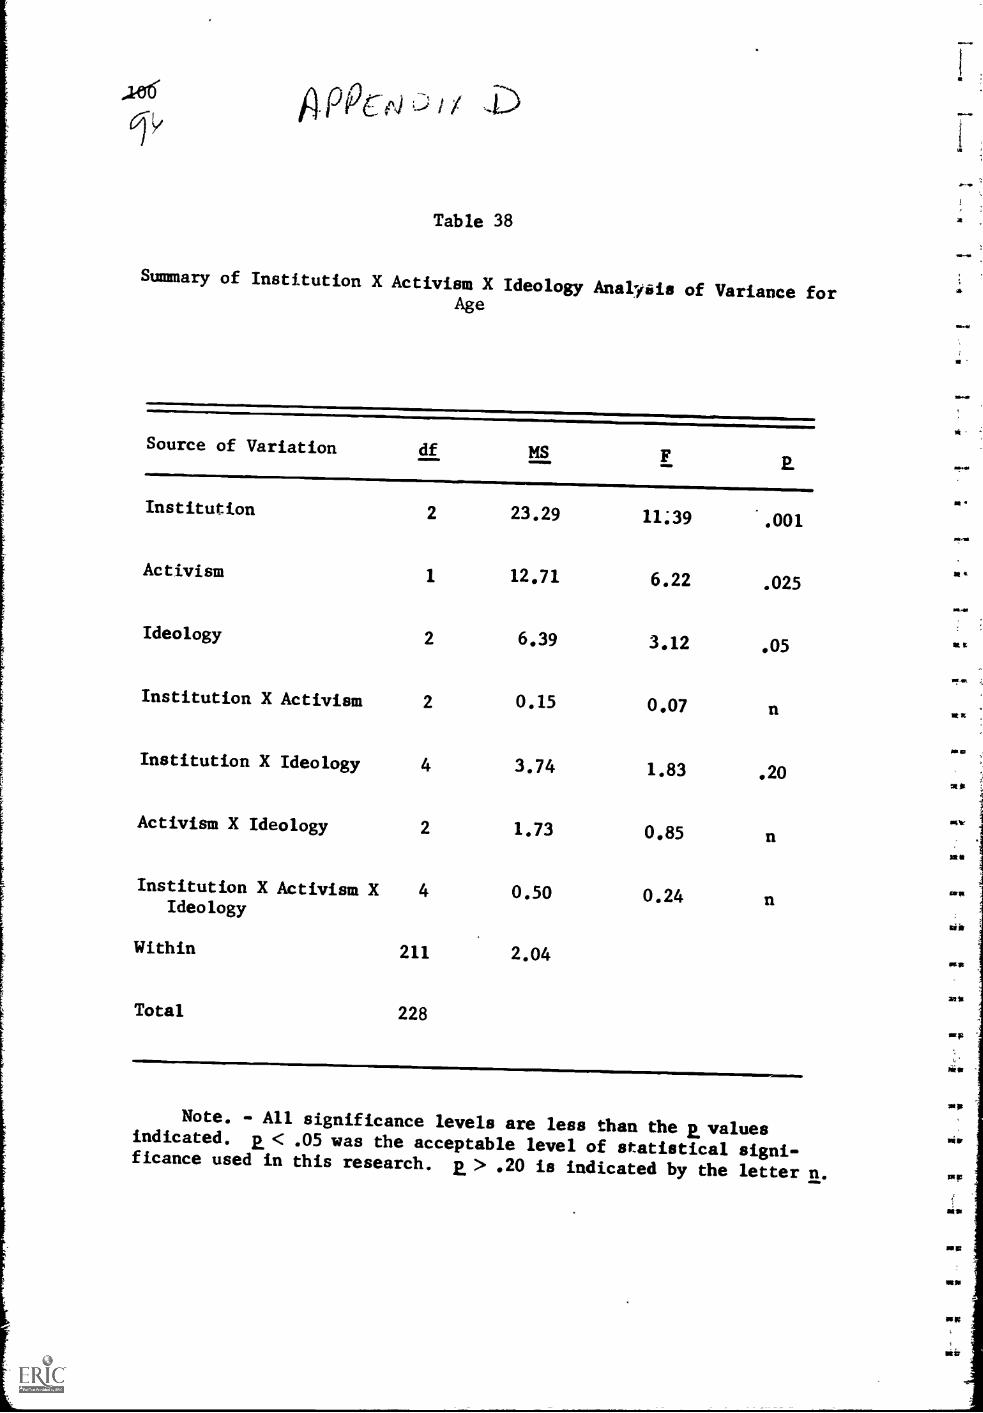
.10.6 P c trqGay
Table 38
Summary of Institution X Activism X Ideology Analyais of Variance forAge
Source of Variation df MS F Q
Institution 2 23.29 11:39 .001
Activism 1 12.71 6.22 .025
Ideology 2 6.39 3.12 .05
Institution X Activism 2 0.15 0.07 n
Institution X Ideology 4 3.74 1.83 .20
Activism X Ideology 2 1.73 0.85
Institution X Activism X 4 0.50 0.24Ideology
Within 211 2.04
Total 228
stx
of
KY
Ati
sp
*sr
Note. - All significance levels are less than the R. valuesindicated. a< .05 was the acceptable level of statistical signi-ficance used in this research, a > .20 is indicated by the letter n. Np
-N
MIR
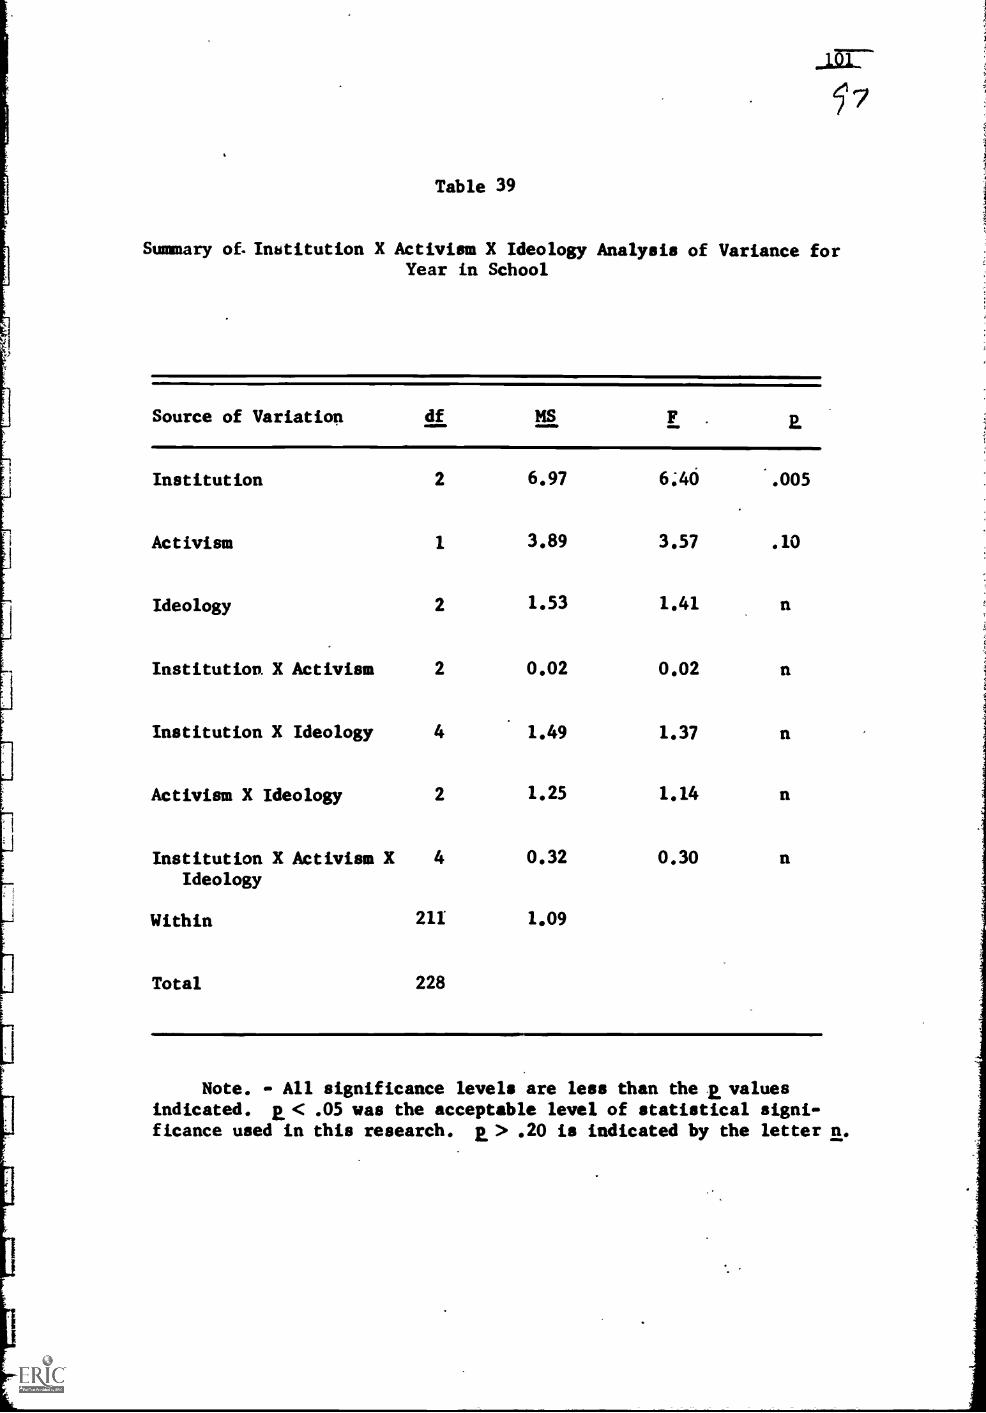
57
Table 39
Summary of.Inbtitution X Activism X Ideology Analysis of Variance forYear in School
Source of Variation df MS FP.
Institution 2 6.97 6;40 '.005
Activism 1 3.89 3.57 .10
Ideology 2 1.53 1.41 n
Institution. X Activism 2 0.02 0.02 n
Institution X Ideology 4 1.49 1.37 n
Activism X Ideology 2 1.25 1.14 n
Institution X Activism X 4 0.32 0.30 nIdeology
Within 211 1.09
Total 228
Note. - All significance levels are less than the a valuesindicated. p < .05 was the acceptable level of statistical signi-ficance used in this research. p > .20 is indicated by the letter n.
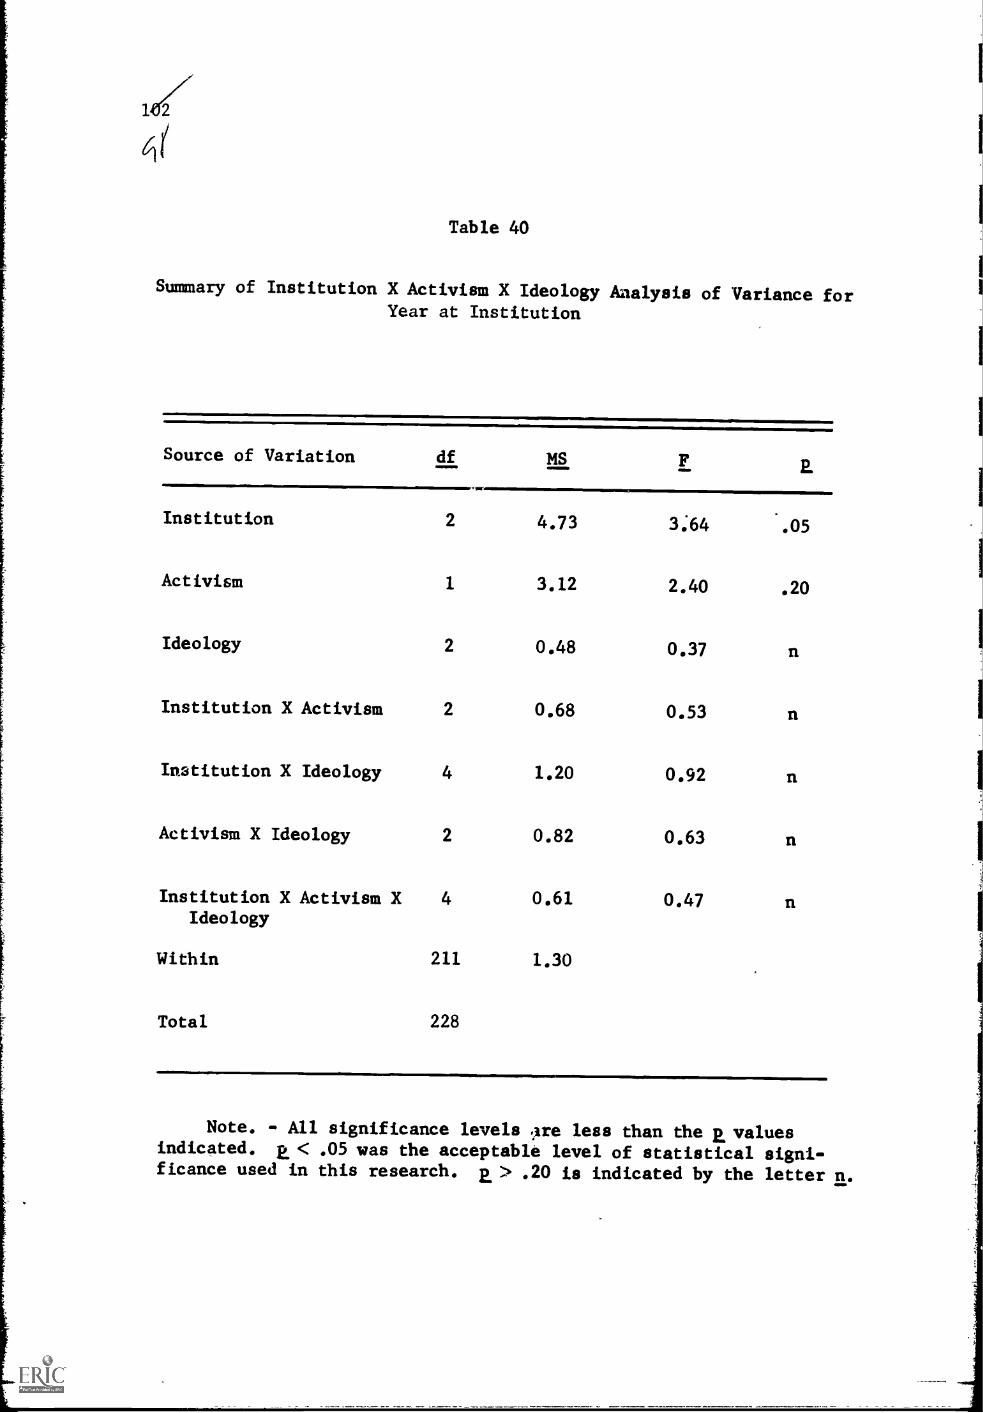
Table 40
Summary of Institution X Activism X Ideology Analysis of Variance forYear at Institution
Source of Variation df MS F E
Institution 2 4.73 3;64 .05
Activism 1 3.12 2.40 .20
Ideology 2 0.48 0.37 n
Institution X Activism 2 0.68 0.53 n
Institution X Ideology 4 1.20 0.92 n
Activism X Ideology 2 0.82 0.63 n
Institution X Activism X 4 0.61 0.47Ideology
Within 211 1.30
Total 228
Note. - All significance levels ,,ire less than the a valuesindicated. < .05 was the acceptable level of statistical signi-ficance used in this research. a > .20 is indicated by the letter n.
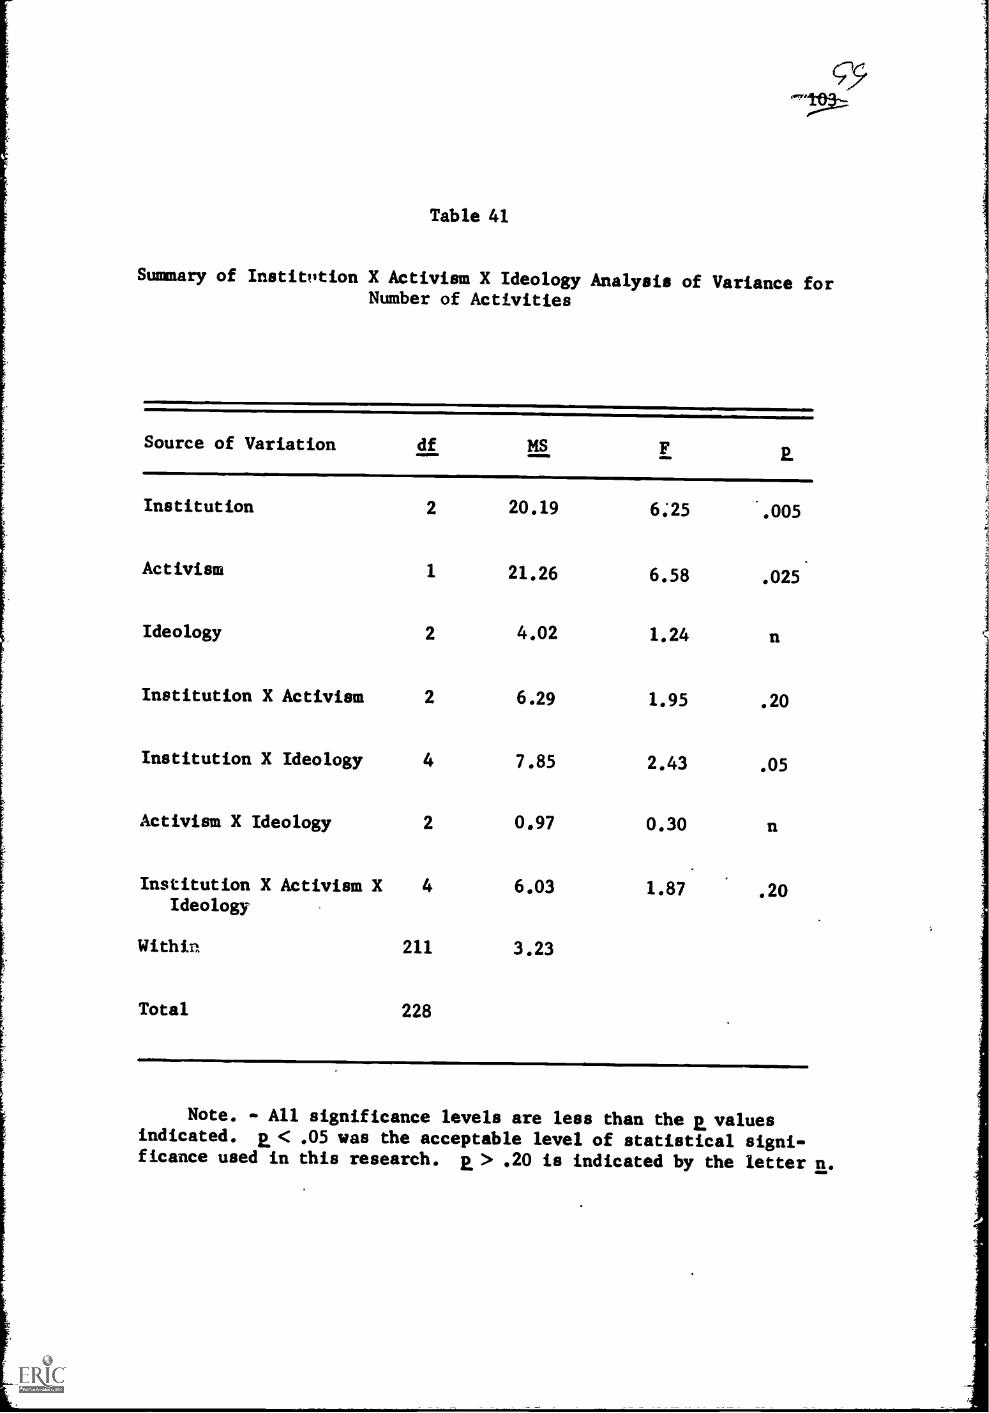
Table 41
Summary of Institution X Activism X Ideology Analysis of Variance forNumber of Activities
Source of Variation df MS a
Institution 2 20.19 6;25 '.005
Activism 1 21.26 6.58 .025
Ideology 2 4.02 1.24 n
Institution X Activism 2 6.29 1.95 .20
Institution X Ideology 4 7.85 2.43 .05
Activism X Ideology 2 0.97 0.30 n
Institution X Activism X 4 6.03 1.87 .20Ideology
Within 211 3.23
Total 228
Note. - All significance levels are less than the a valuesindicated. a < .05 was the acceptable level of statistical signi-ficance used in this research. a > .20 is indicated by the letter n.
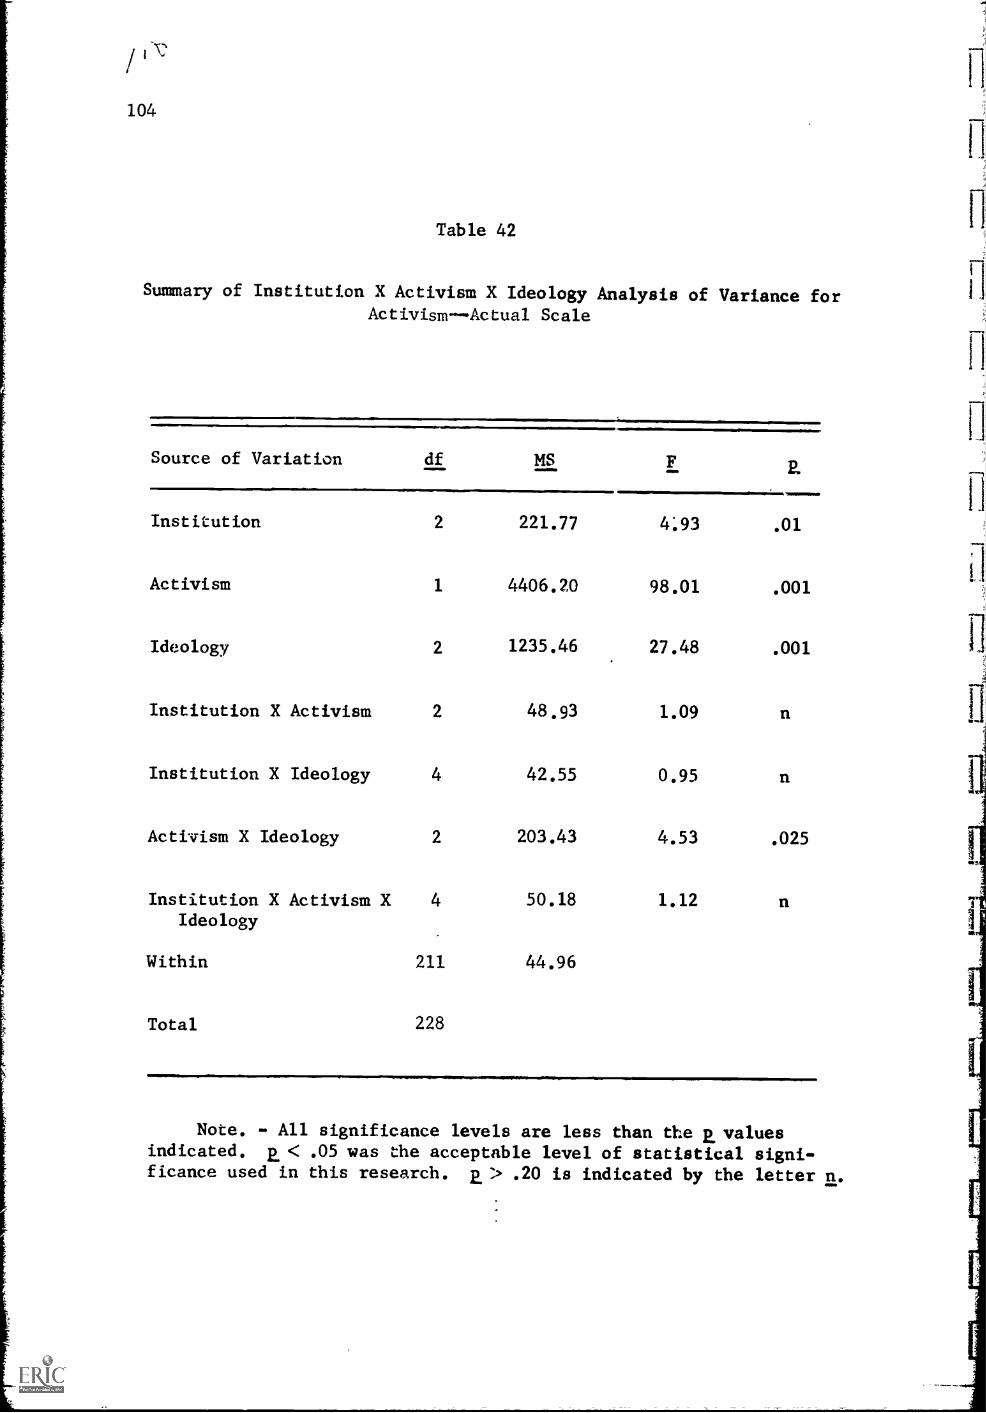
104
Table 42
Summary of Institution X Activism X Ideology Analysis of Variance forActivism--Actual Scale
Source of Variation df MS FP.
Institution 2 221.77 4:93 .01
Activism 1 4406.20 98.01 .001
Ideology 2 1235.46 27.48 .001
Institution X Activism 2 48,93 1.09
Institution X Ideology 4 42.55 0.95
Activism X Ideology 2 203.43 4.53 .025
Institution X Activism X 4 50.18 1.12Ideology
Within 211 44.96
Total 228
Note. - All significance levels are less than the p. valuesindicated. < .05 was the acceptable level of statistical signi-ficance used in this research. p. > .20 is indicated by the letter n.
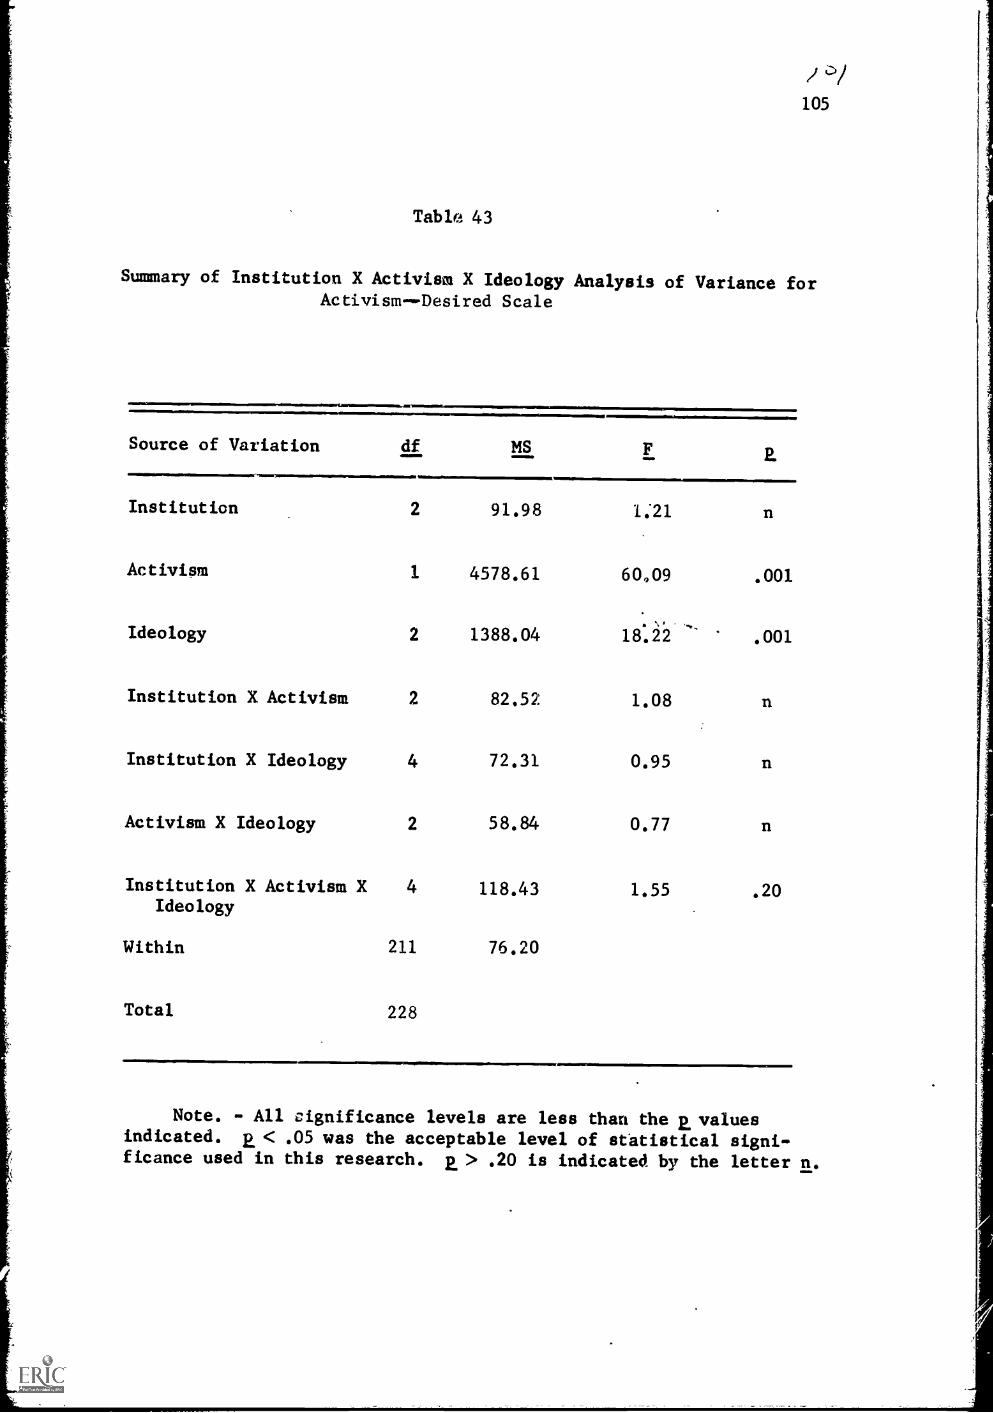
105
Table 43
Summary of Institution X Activism X Ideology Analysis of Variance forActivism--Desired Scale
Source of Variation df MS FE.
Institution 2 91.98 1:21 n
Activism 1 4578.61 6049 .001
Ideology 2 1388.04 181 i2 .001
Institution X Activism 2 82.52 1.08 n
Institution X Ideology 4 72.31 0.95 n
Activism X Ideology 2 58.84 0.77 n
Institution X Activism X 4 118.43 1.55 .20Ideology
Within 211 76.20
Total 228
Note. - All significance levels are less than the E valuesindicated. E.< .05 was the acceptable level of statistical signi-ficance used in this research. 2. > .20 is indicated by the letter n.
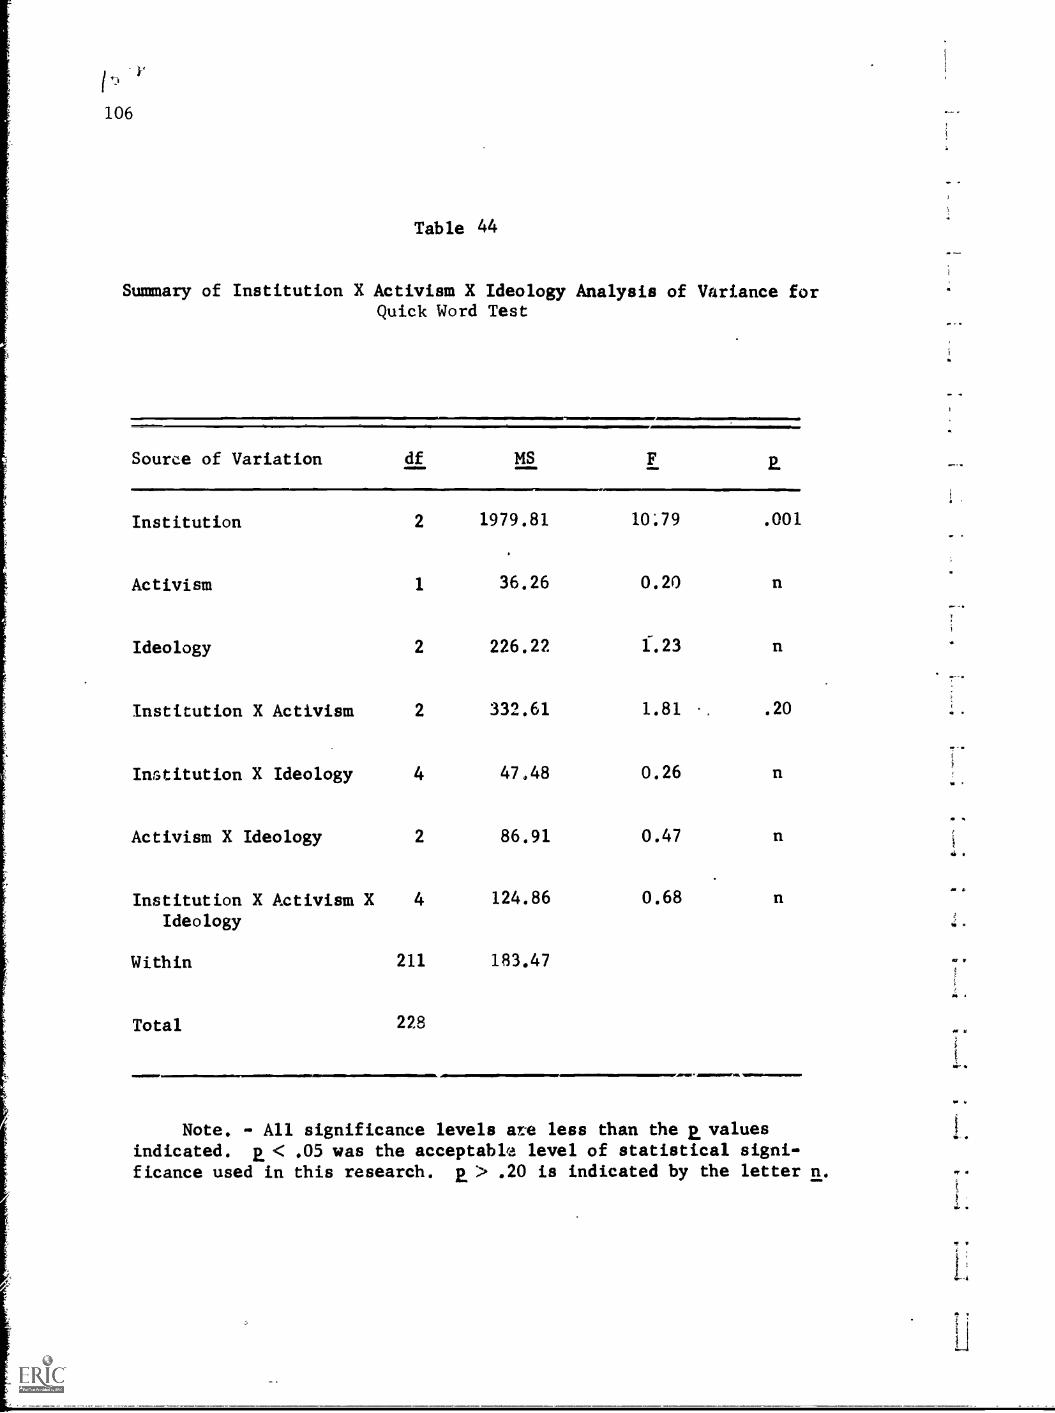
in
106
Table 44
Summary of Institution X Activism X Ideology Analysis of Variance forQuick Word Test
Source of Variation df MS
Institution 2 1979.81
Activism 1 36.26
Ideology 2 226.22
Institution X Activism 2 332.61
Institution X Ideology 4 47.48
Activism X Ideology 2 86.91
Institution X Activism X 4 124.86
Ideology
Within 211 183.47
Total 228
F 2.
10.79 .001
0.20 n
1.23 n
1.81 .20
0.26 n
0.47 n
0.68 n
Note. - All significance levels are less than the 2. values
indicated. 2. < .05 was the acceptable level of statistical signi-ficance used in this research. E, > .20 is indicated by the letter n.
at .
AP 4
4 .
If
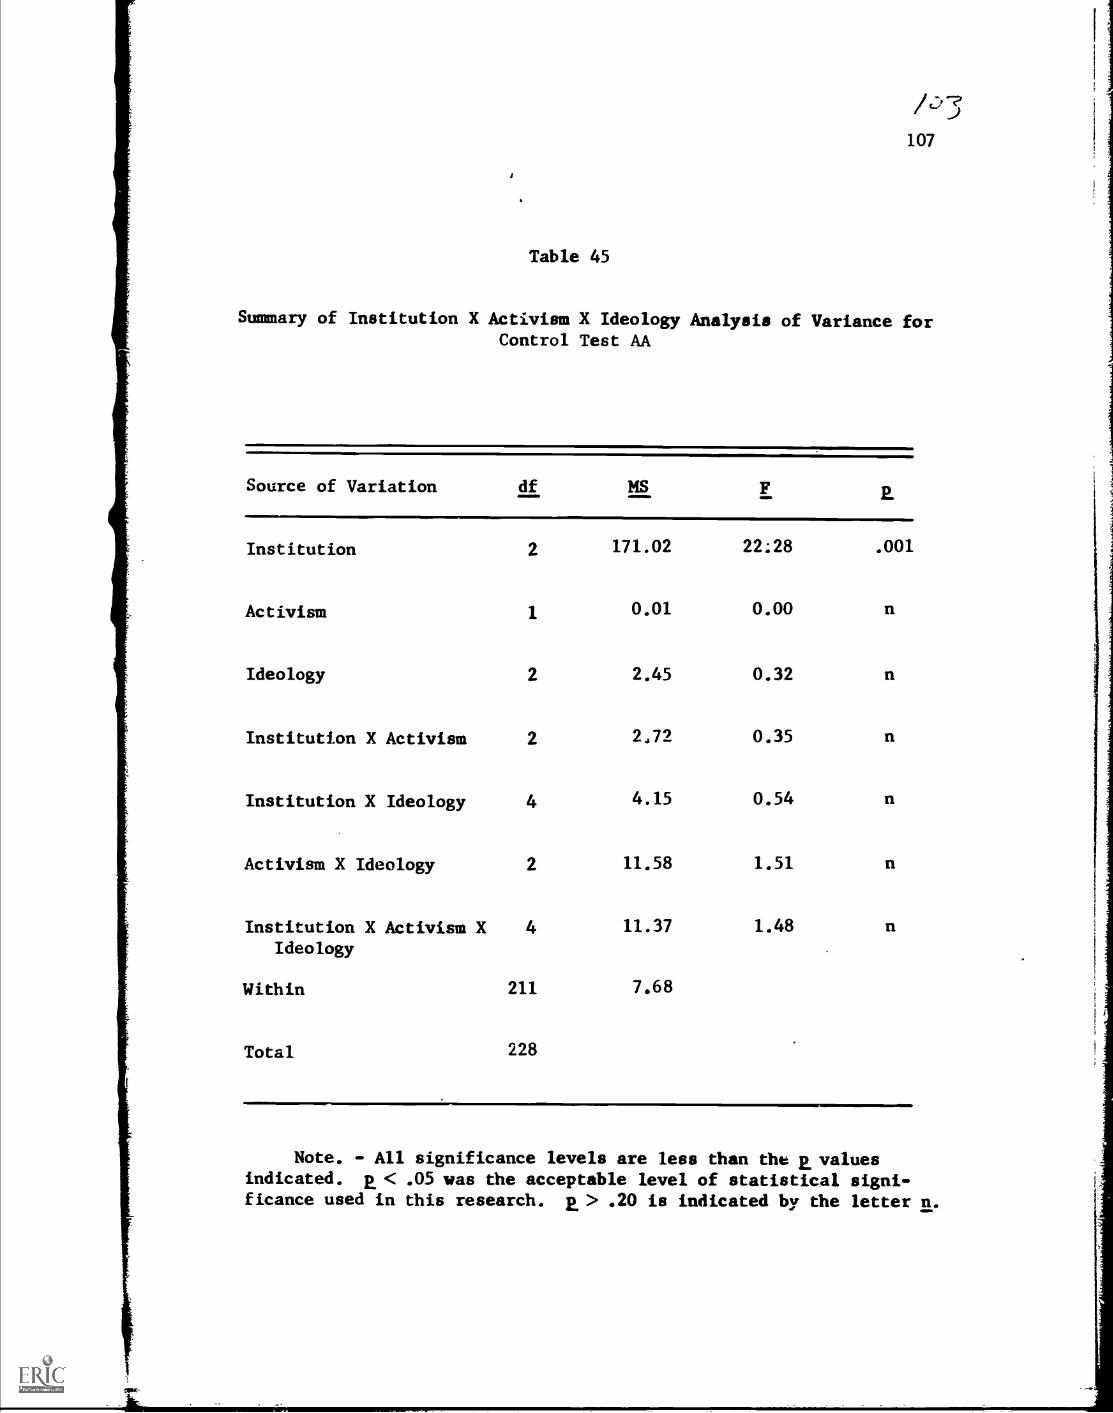
107
Table 45
Summary of Institution X Activism X Ideology Analysis of Variance forControl Test AA
Source of Variation df MS
Institution 2 171.02 22.28
Activism 1 0.01 0.00
Ideology 2 2.45 0.32
Institution X Activism 2 2.72 0.35
Institution X Ideology 4 4.15 0.54
Activism X Ideology 2 11.58 1.51
Institution X Activism X 4 11.37 1.48
Ideology
Within 211 7.68
Total 228
a
.001
Note. - All significance levels are less than tht a valuesindicated. 2 < .05 was the acceptable level of statistical signi-ficance used in this research. 2. > .20 is indicated by the letter n.
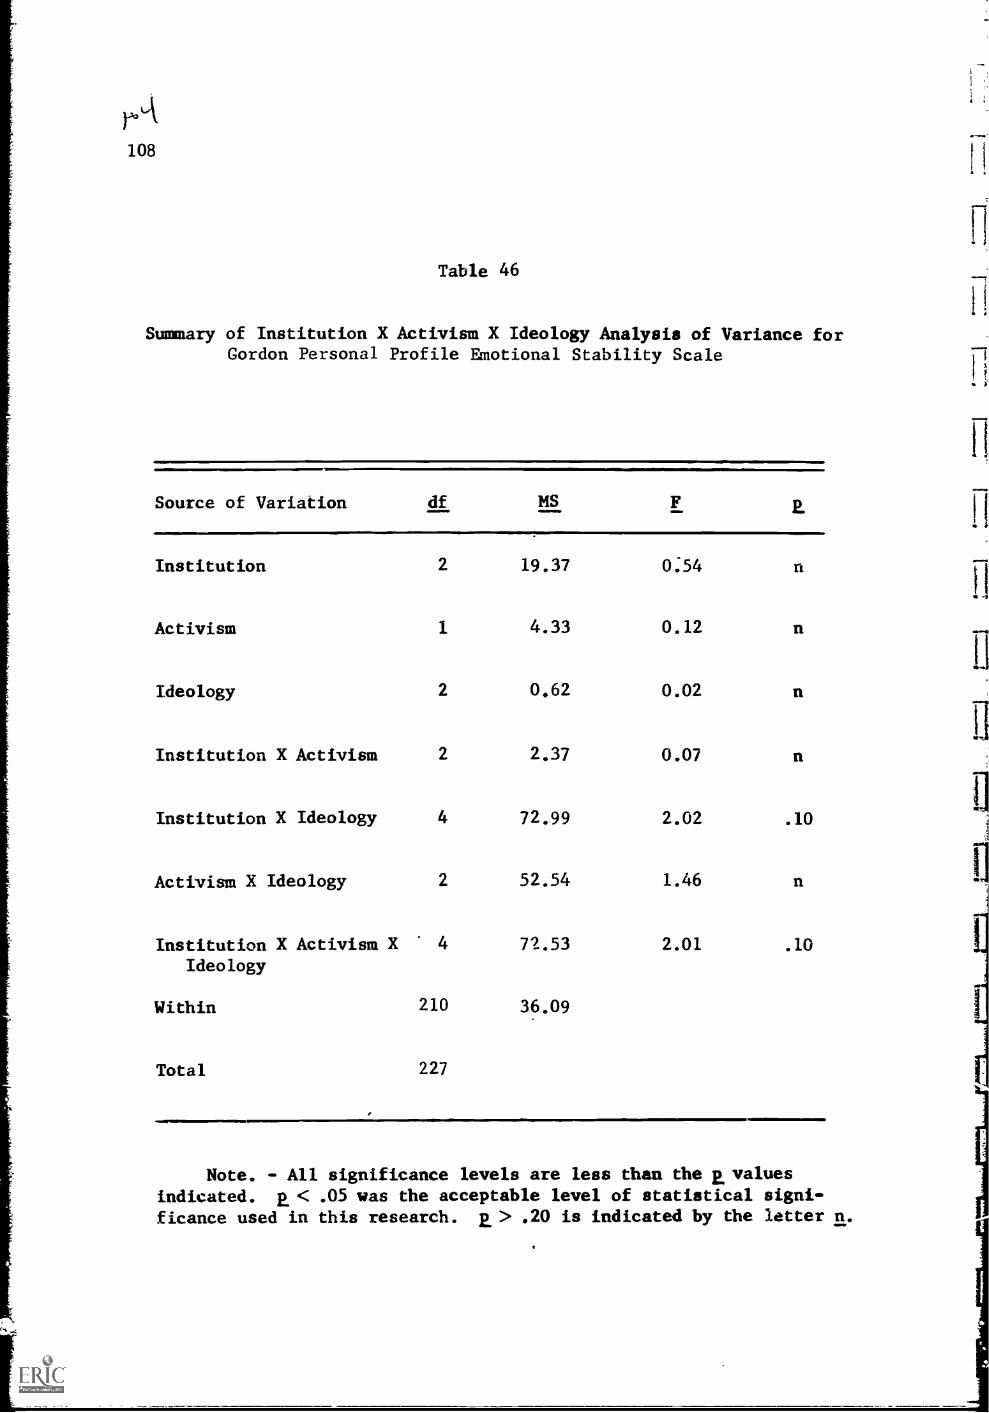
rA108
Table 46
Summary of Institution X Activism X Ideology Analysis of Variance forGordon Personal Profile Emotional Stability Scale
Source of Variation df MS F 2.
Institution 2 19.37 0.54 n
Activism 1 4.33 0.12 n
Ideology 2 0.62 0.02 n
Institution X Activism 2 2.37 0.07 n
Institution X Ideology 4 72.99 2.02 .10
Activism X Ideology 2 52.54 1.46 n
Institution X Activism X 4 72.53 2.01 .10
Ideology
Within 210 36.09
Total 227
Note. - All significance levels are less than the 2. valuesindicated. 2. < .05 was the acceptable level of statistical signi-ficance used in this research. 2. > .20 is indicated by the letter n.
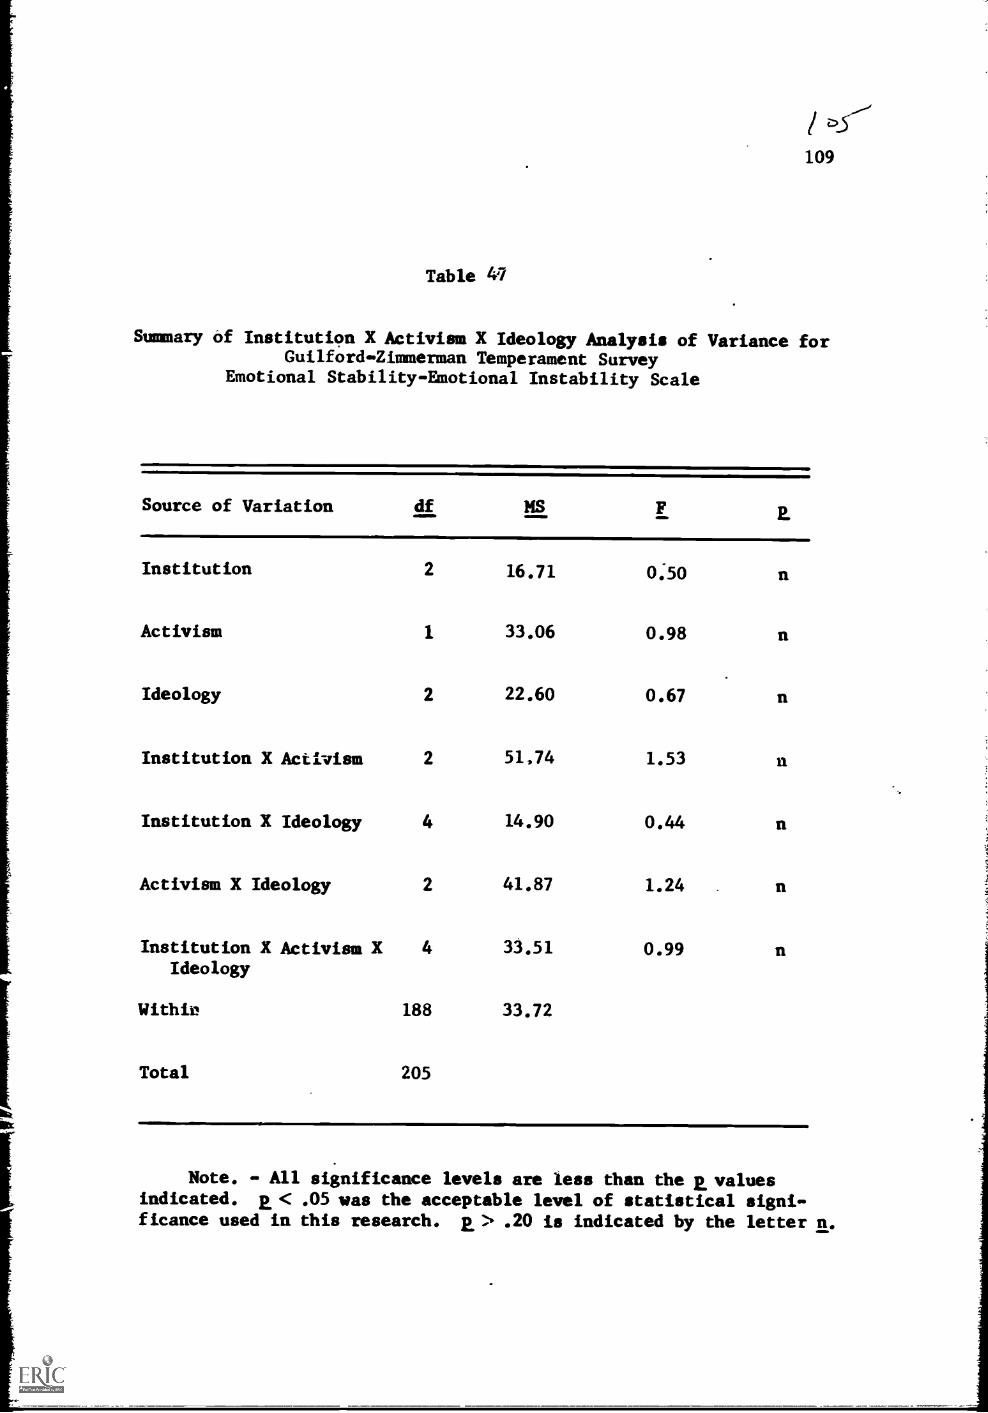
109
Table 41
Summary of Institution X Activism X Ideology Analysis of Variance forGuilford-Zimmerman Temperament Survey
Emotional Stability-Emotional Instability Scale
Source of Variation df MS F
Institution 2 16.71 0:50 n
Activism 1 33.06 0.98 n
Ideology 2 22.60 0.67 n
Institution X Activism 2 51,74 1.53 n
Institution X Ideology 4 14.90 0.44 n
Activism X Ideology 2 41.87 1.24 n
Institution X Activism X 4 33.51 0.99 nIdeology
Within 33.72
Total 205
IL
Note. - All significance levels are less than the E valuesindicated. a< .05 was the acceptable level of statistical signi-ficance used in this research. E> .20 is indicated by the letter n.
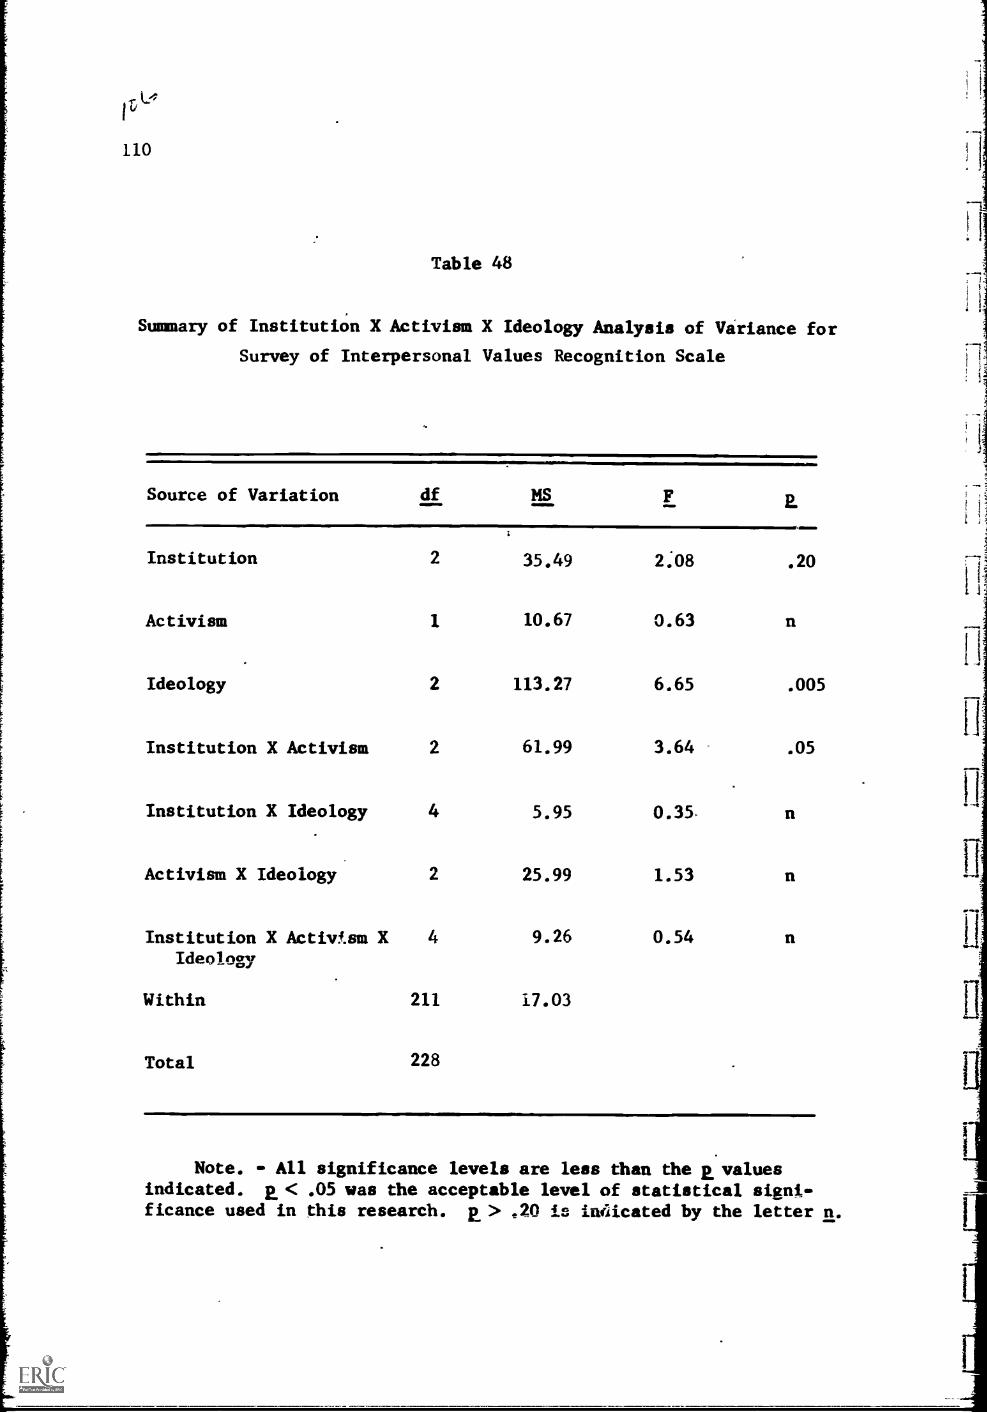
110
Table 48
Summary of Institution X Activism X Ideology Analysis of Variance for
Survey of Interpersonal Values Recognition Scale
Source of Variation df MS F E
Institution 2 35.49 2.08 .20
Activism 1 10.67 0.63 n
Ideology 2 113.27 6.65 .005
Institution X Activism 2 61.99 3.64 .05
Institution X Ideology 4 5.95 0.35.
Activism X Ideology 2 25.99 1.53
Institution X Activism X 4 9.26 0.54Ideology
Within 211 17.03
Total 228
Note. - All significance levels are less than the a valuesindicated. a < .05 was the acceptable level of statistical signi-ficance used in this research. E > 20 is indicated by the letter n.
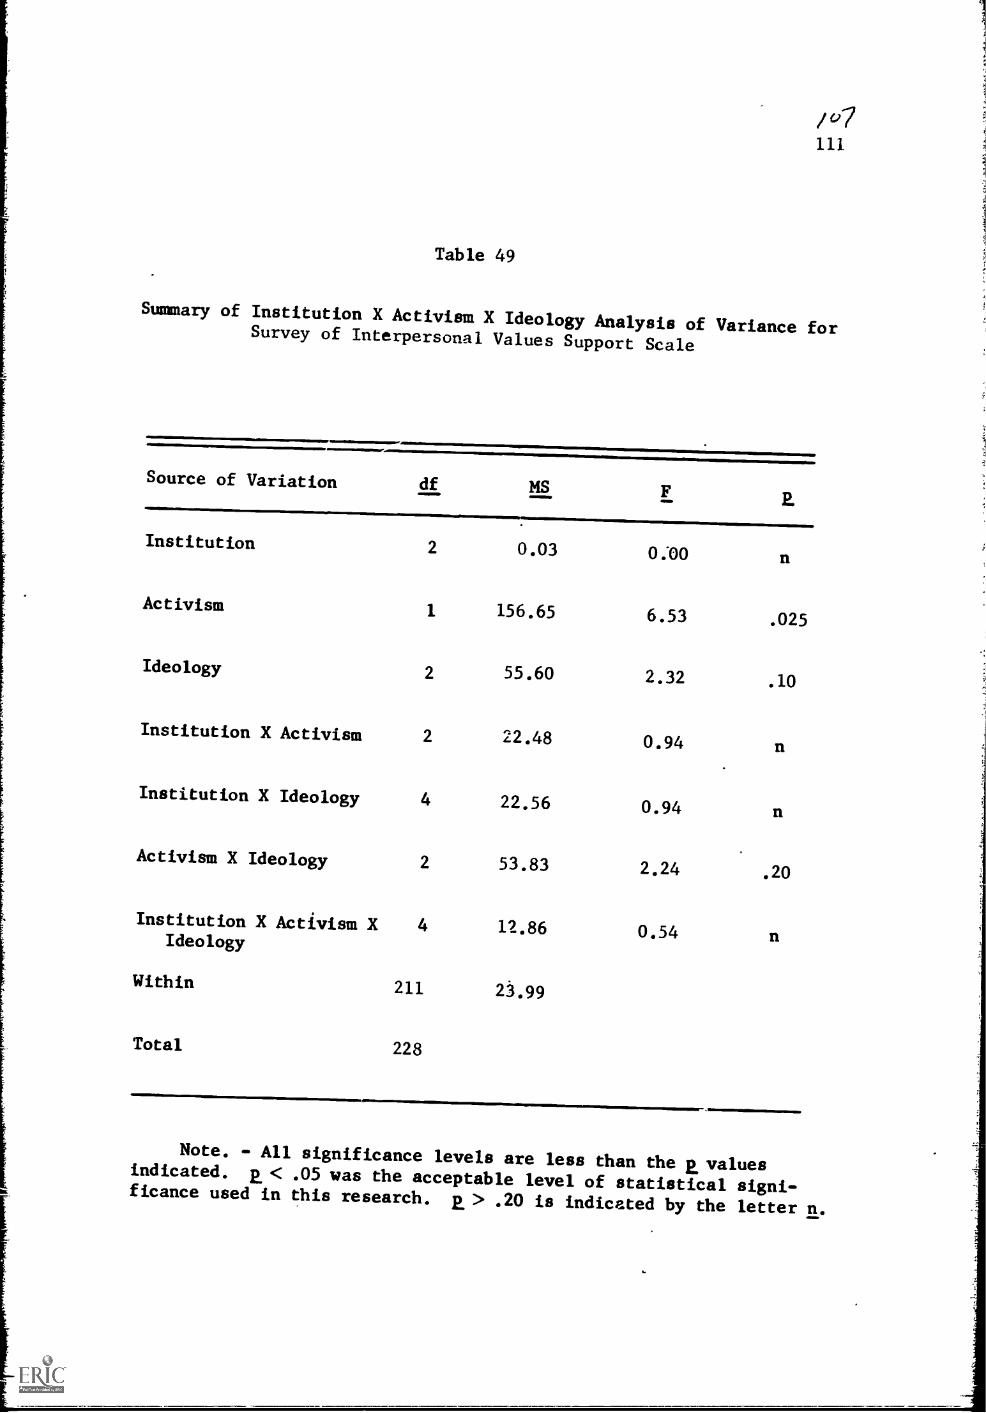
/07111
Table 49
Summary of Institution X Activism X Ideology Analysis of Variance forSurvey of Interpersonal Values Support Scale
Source of Variation df MS F2.
Institution 2 0.03 0.00 n
Activism 1 156.65 6.53 .025
Ideology 2 55.60 2.32 .10
Institution X Activism 2 22.48 0.94 n
Institution X Ideology 4 22.56 0.94 n
Activism X Ideology 2 53.83 2.24 .20
Institution X Activism X 4 12.86 0.54Ideology
Within 211 23.99
Total 228
Note. - All significance levels are less than the a valuesindicated. 2. < .05 was the acceptable level of statistical signi-ficance used in this research. E. > .20 is indicated by the letter n.
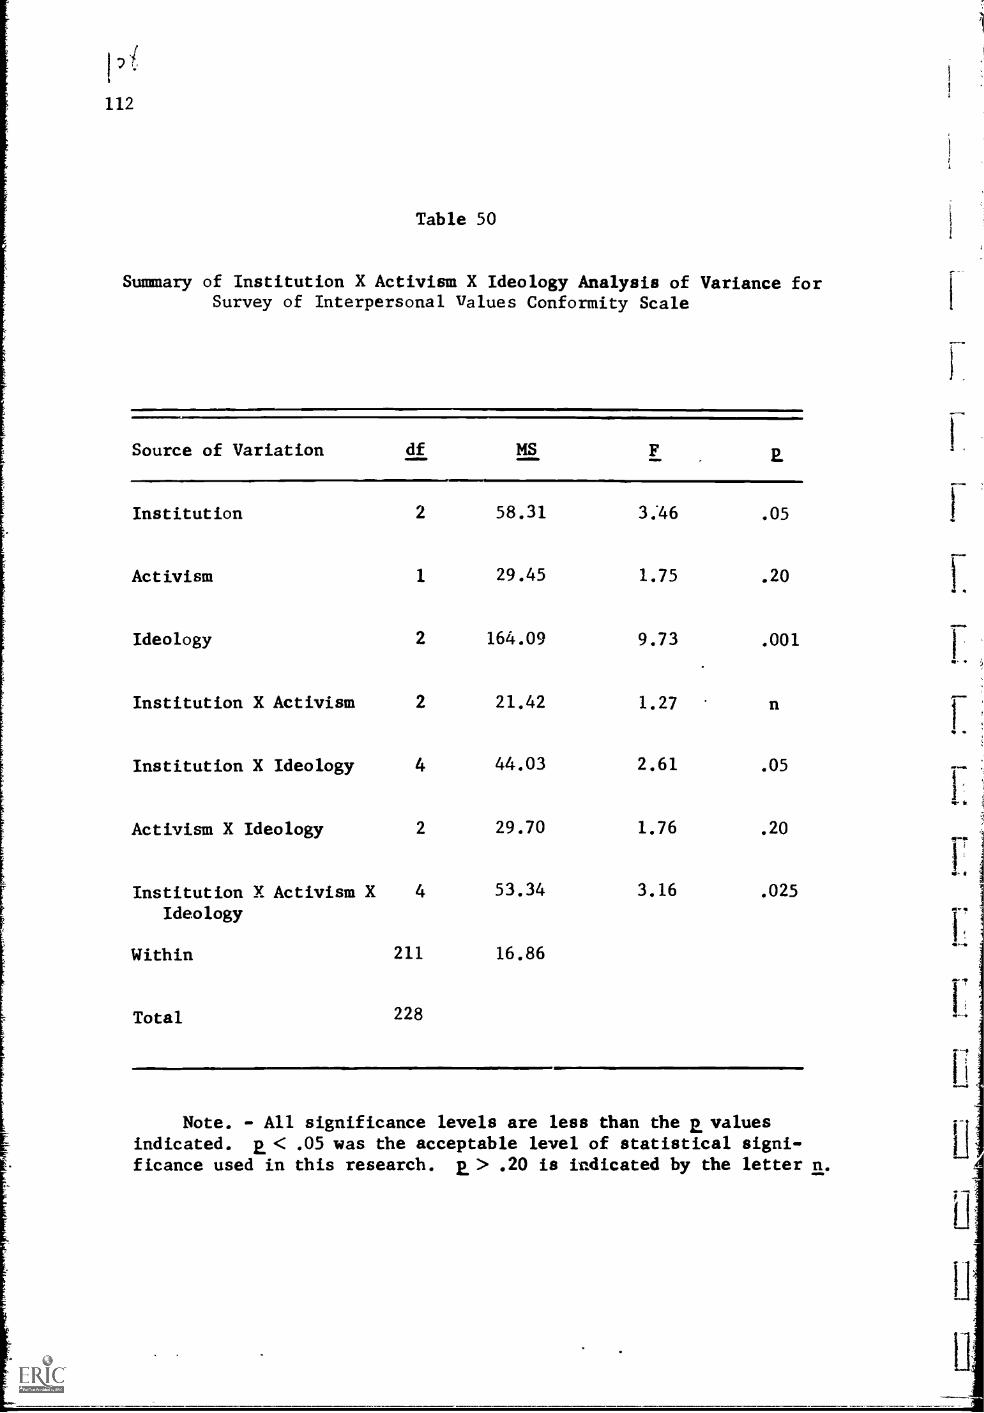
112
Table 50
Summary of Institution X Activism X Ideology Analysis of Variance forSurvey of Interpersonal values Conformity Scale
Source of Variation df MS F E.
Institution 2 58.31 3.46 .05
Activism 1 29.45 1.75 .20
Ideology 2 164.09 9.73 .001
Institution X Activism 2 21.42 1.27
Institution X Ideology 4 44.03 2.61 .05
Activism X Ideology 2 29.70 1.76 .20
Institution X Activism X 4 53.34 3.16 .025
Ideology
Within 211 16.86
Total 228
Note. - All significance levels are less than the a valuesindicated. p < .05 was the acceptable level of statistical signi-ficance used in this research. p > .20 is indicated by the letter n.
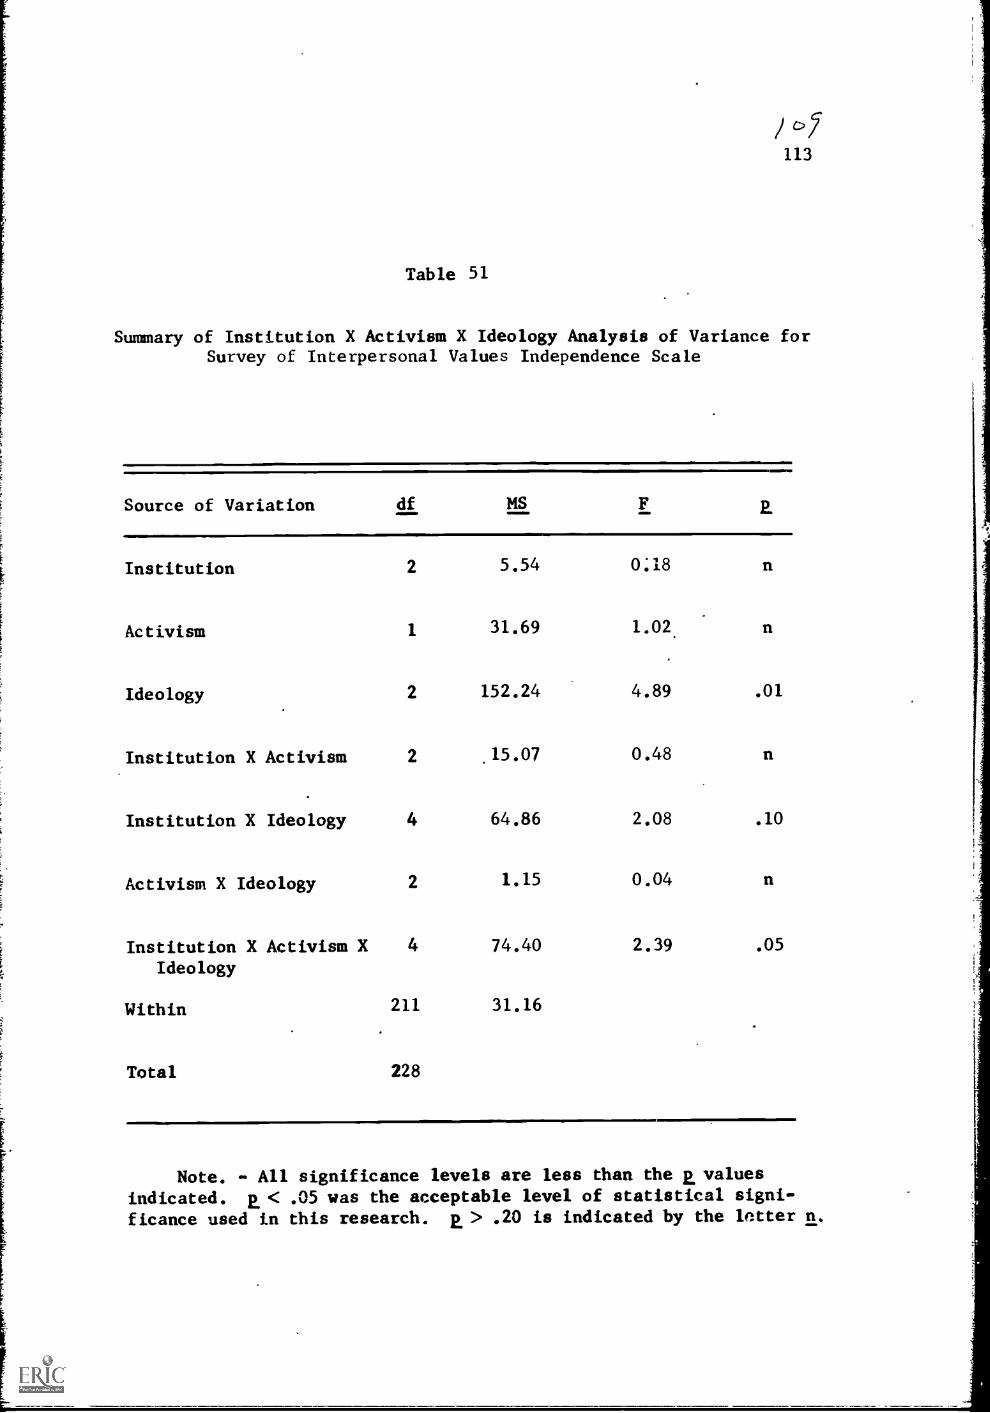
113
Table 51
Summary of Institution X Activism X Ideology Analysis of Variance forSurvey of Interpersonal Values Independence Scale
Source of Variation df MS E.
Institution 2 5.54 0:18 n
Activism 1 31.69 1.02. n
Ideology 2 152.24 4.89 .01
Institution X Activism 2 .15.07 0.48 n
Institution X Ideology 4 64.86 2.08 .10
Activism X Ideology 2 1.15 0.04 n
Institution X Activism X 4 74.40 2.39 .05
Ideology
Within 211 31.16
Total 228
Note. - All significance levels are less than the 2 values
indicated. a < .05 was the acceptable level of statistical signi-
ficance used in this research. a > .20 is indicated by the letter rt.
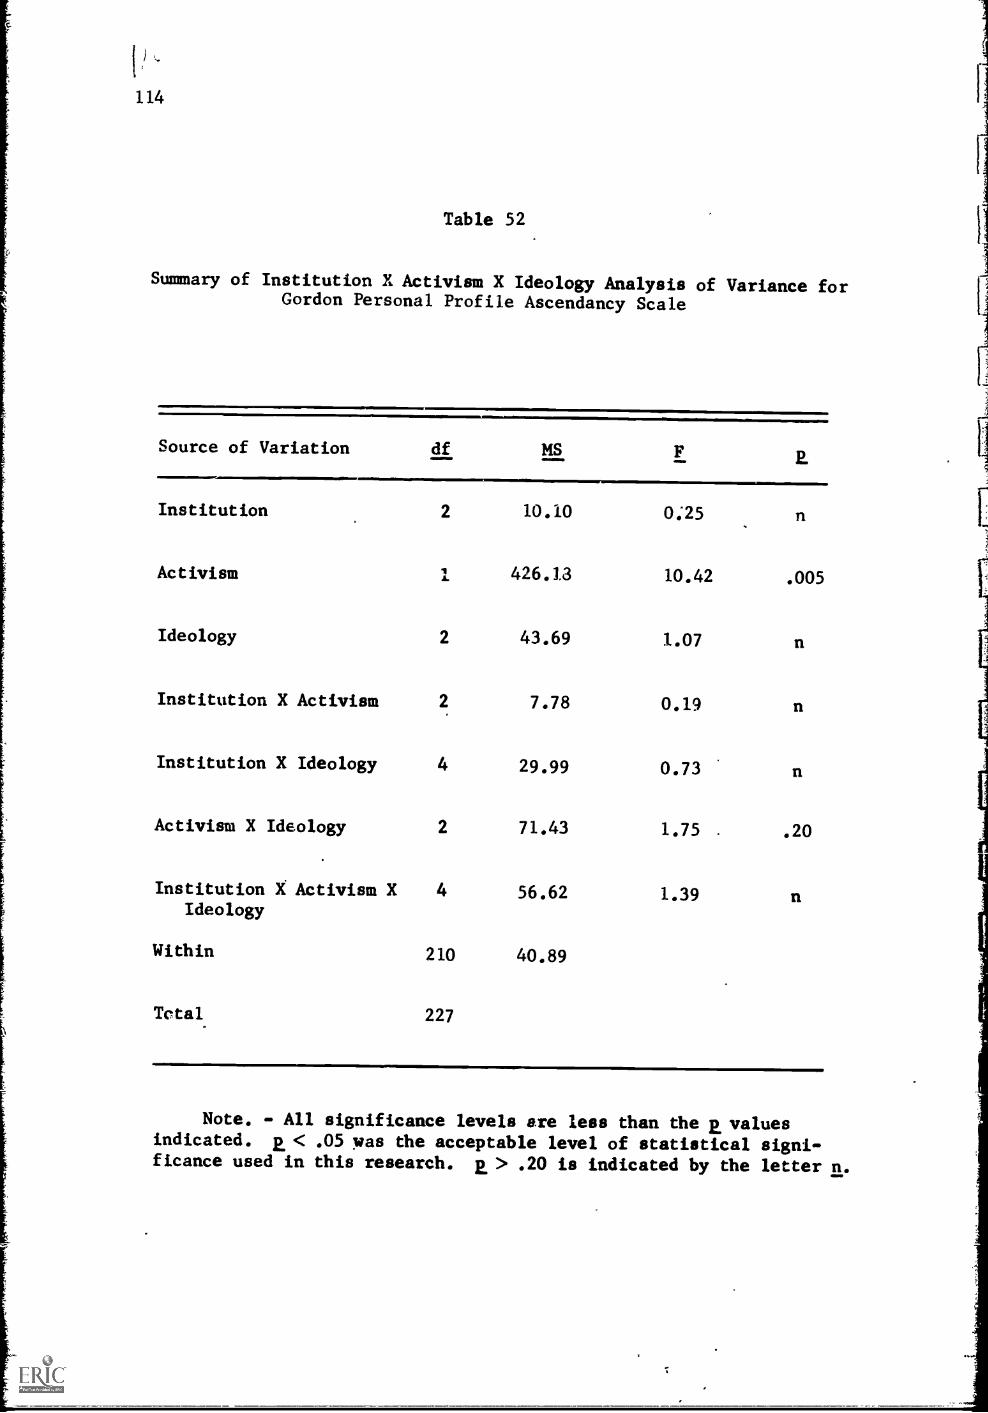
114
Table 52
Summary of Institution X Activism X Ideology Analysis of Variance forGordon Personal Profile Ascendancy Scale
Source of Variation df MS F E
Institution 2 10.10 0:25 n
Activism iL 426.13 10.42 .005
Ideology 2 43.69 1.07 n
Institution X Activism 2 7.78 0.19 n
Institution X Ideology 4 29.99 0.73 n
Activism X Ideology 2 71.43 1.75 .20
Institution X Activism X 4 56.62 1.39Ideology
Within 210 40.89
Tctal 227
Note. - All significance levels are less than the a valuesindicated. a < .05 was the acceptable level of statistical signi-ficance used in this research. a > .20 is indicated by the letter n.
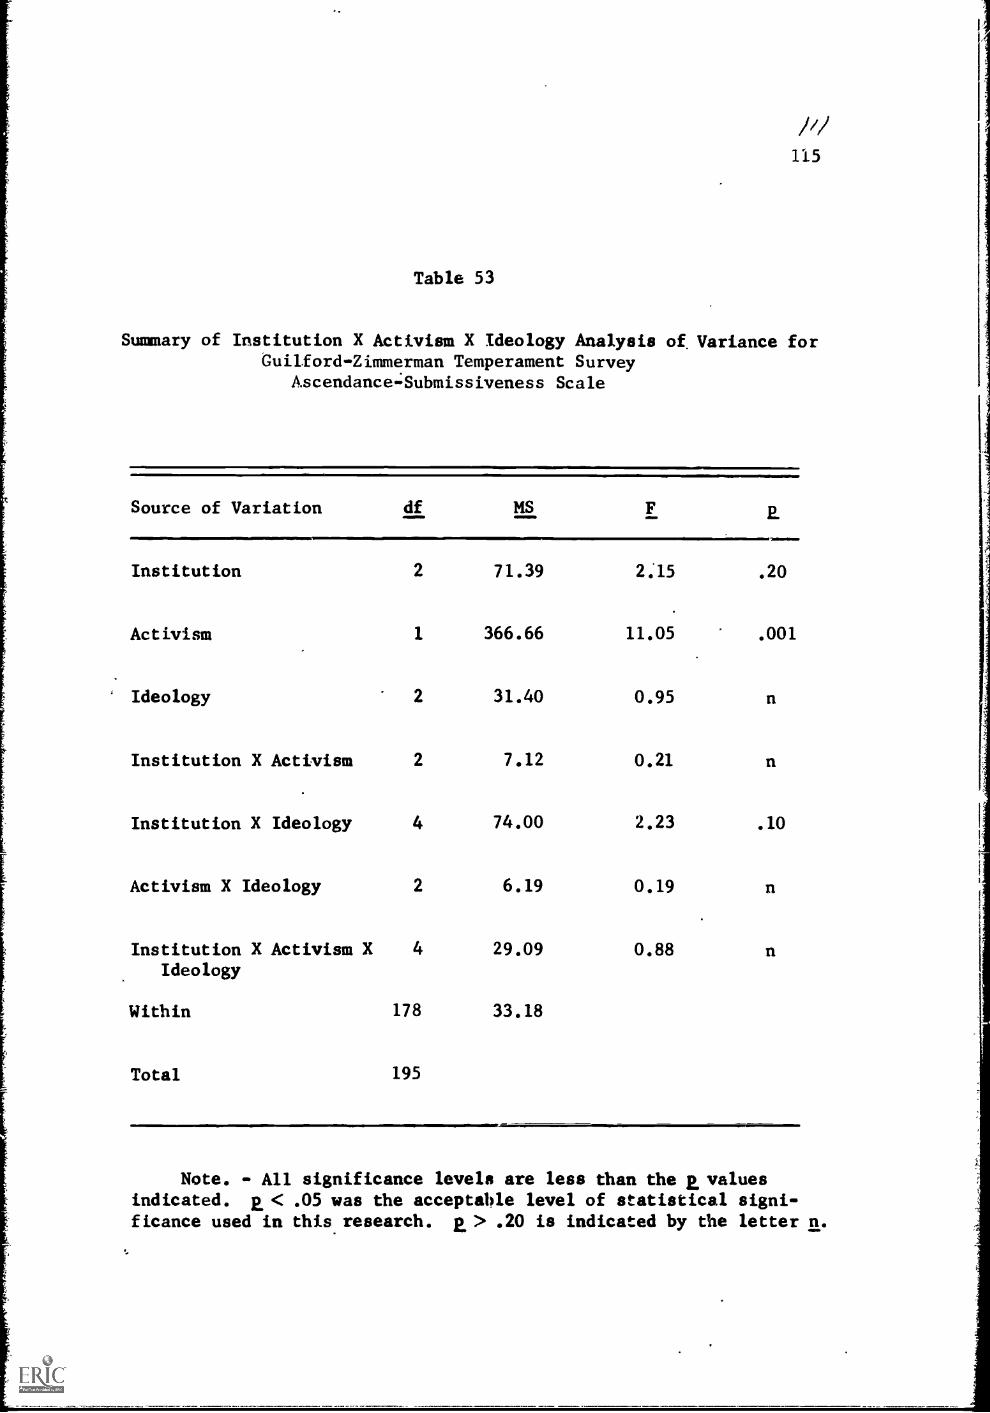
Table 53
Summary of Institution X Activism X Ideology Analysis of. Variance forGuilford-Zimmerman Temperament Survey
Ascendance.;Submissiveness Scale
Source of Variation df MS F E.
Institution 2 71.39 2.15 .20
Activism 1 366.66 11.05 .001
Ideology 2 31.40 0.95
Institution X Activism 2 7.12 0.21
Institution X Ideology 4 74.00 2.23 .10
Activism X Ideology 2 6.19 0.19
Institution X Activism X 4 29.09 0.88 nIdeology
Within 178 33.18
Total 195
Note. - All significance levels are less than the a valuesindicated. E < .05 was the acceptable level of statistical signi-ficance used in this research. E > .20 is indicated by the letter n.
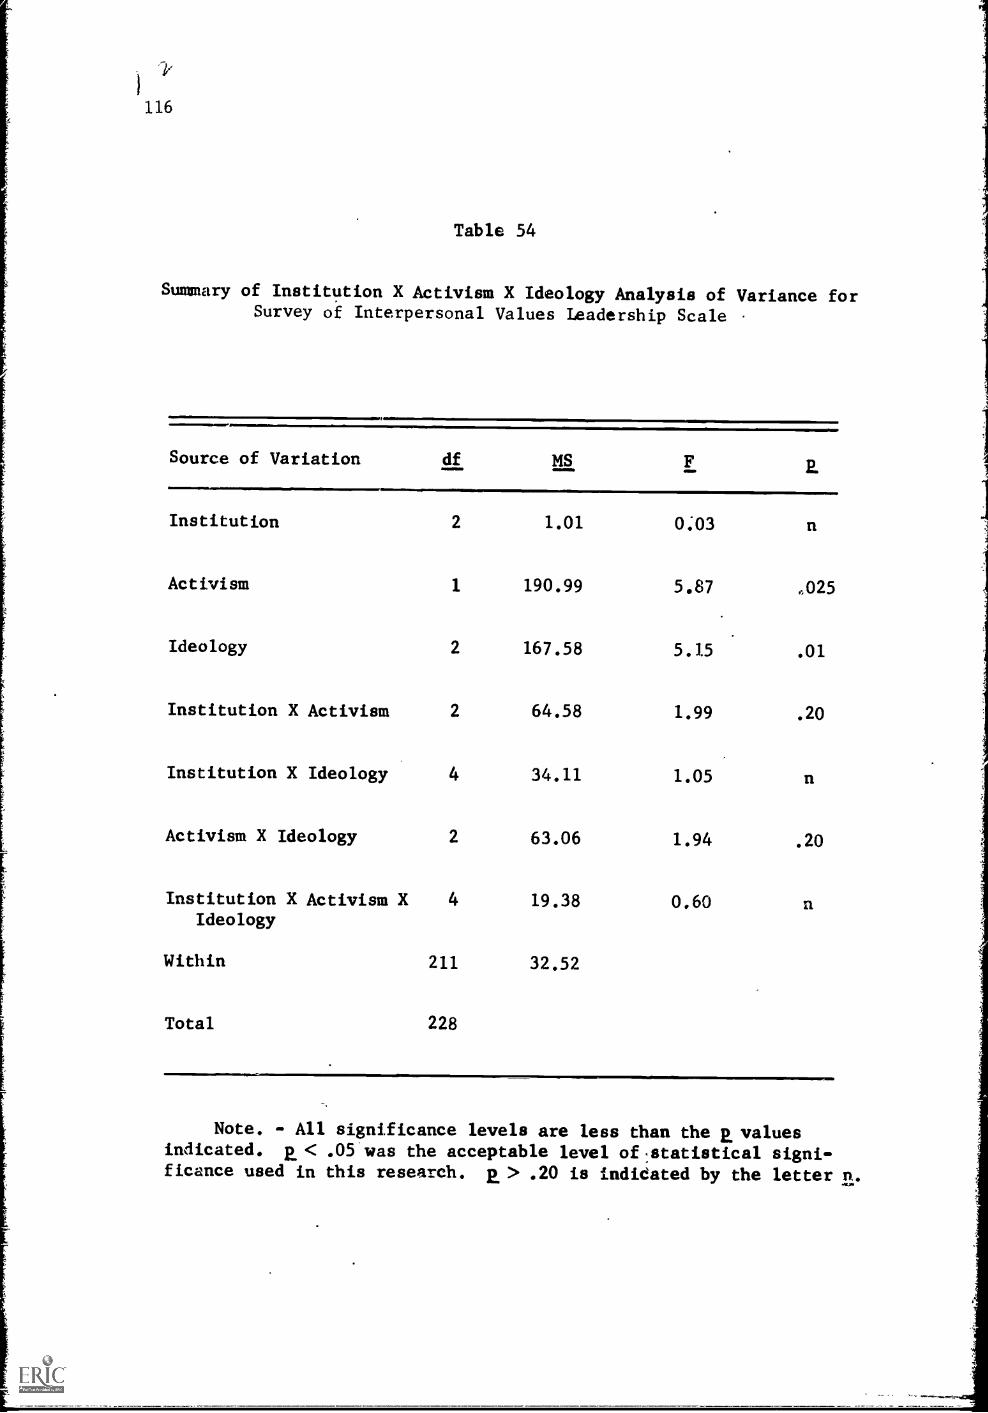
116
Table 54
Summary of Institution X Activism X Ideology Analysis of Variance forSurvey of Interpersonal Values Leadership Scale
Source of Variation df MSE.
Institution 2 1.01 0:03 n
Activism 1 190.99 5.87 .025
Ideology 2 167.58 5.15 .01
Institution X Activism 2 64.58 1.99 .20
Institution X Ideology 4 34.11 1.05 n
Activism X Ideology 2 63.06 1.94 .20
Institution X Activism X 4 19.38 0.60 nIdeology
Within 211 32.52
Total 228
Note. - All significance levels are less than the R. valuesindicated. B.< .05 was the acceptable level of:statistical signi-ficance used in this research. 2. > .20 is indidated by the letter n.
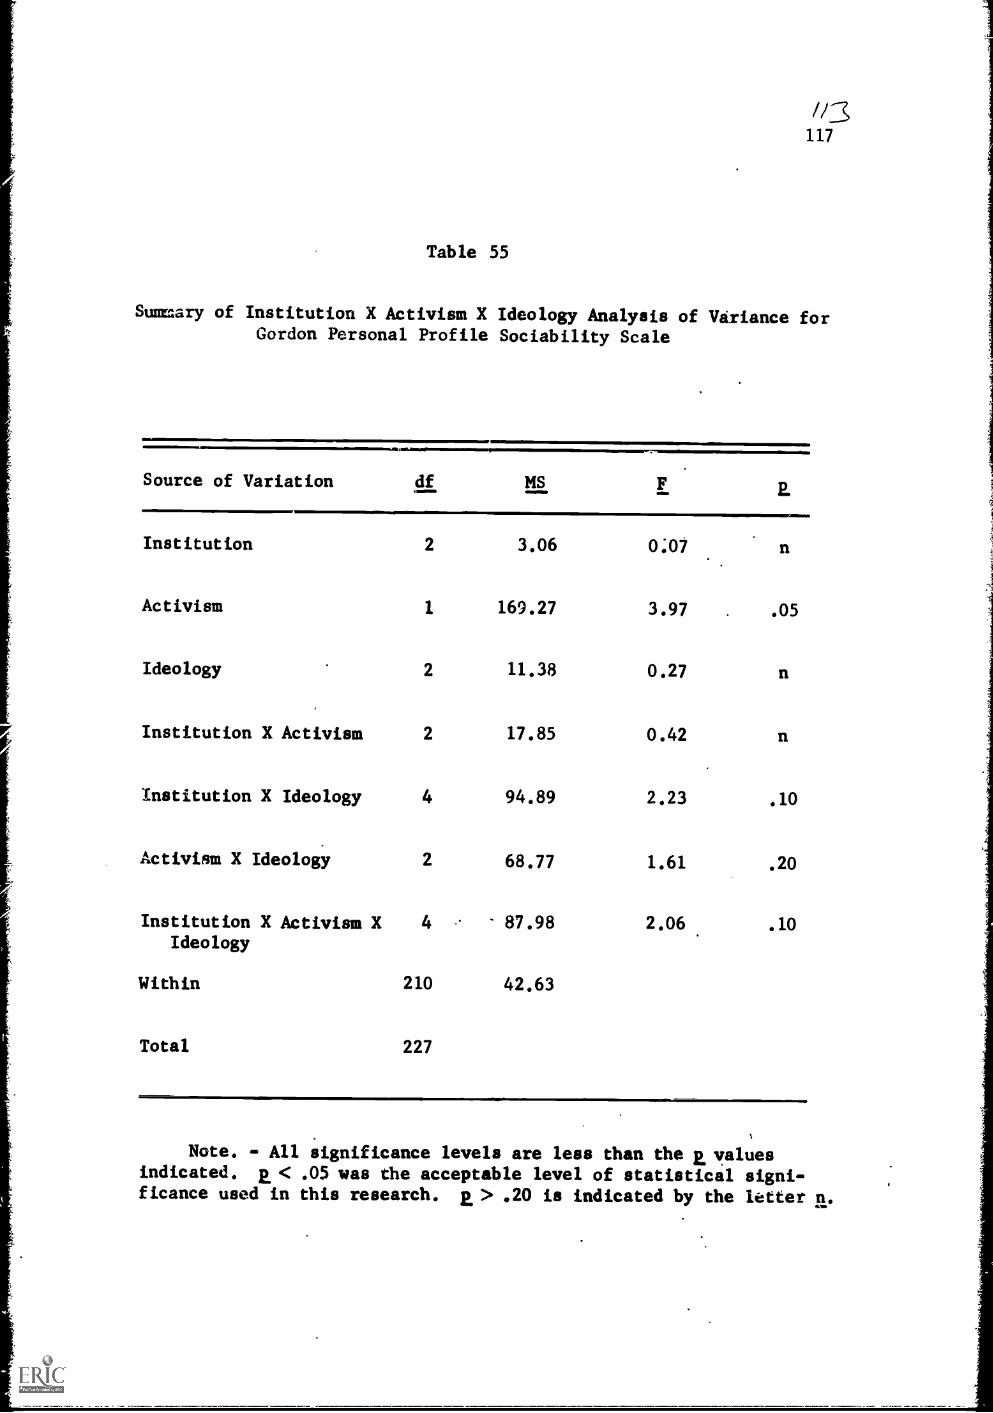
//3117
Table 55
Summary of Institution X Activism X Ideology Analysis of Vtriance forGordon Personal Profile Sociability Scale
Source of Variation df MS2.
Institution 2 3.06 0;07 n
Activism 1 169.27 3.97 .05
Ideology 2 11.38 0.27 n
Institution X Activism 2 17.85 0.42 n
institution X Ideology 4 94.89 2.23 .10
Activism X Ideology 2 68.77 1.61 .20
Institution X Activism X 4 87.98 2.06 .10Ideology
Within 210 42.63
Total 227
Note. - All significance levels are less than the p. valuesindicated. E < .05 was the acceptable level of statistical signi-ficance used in this research. a > .20 is indicated by the letter n.
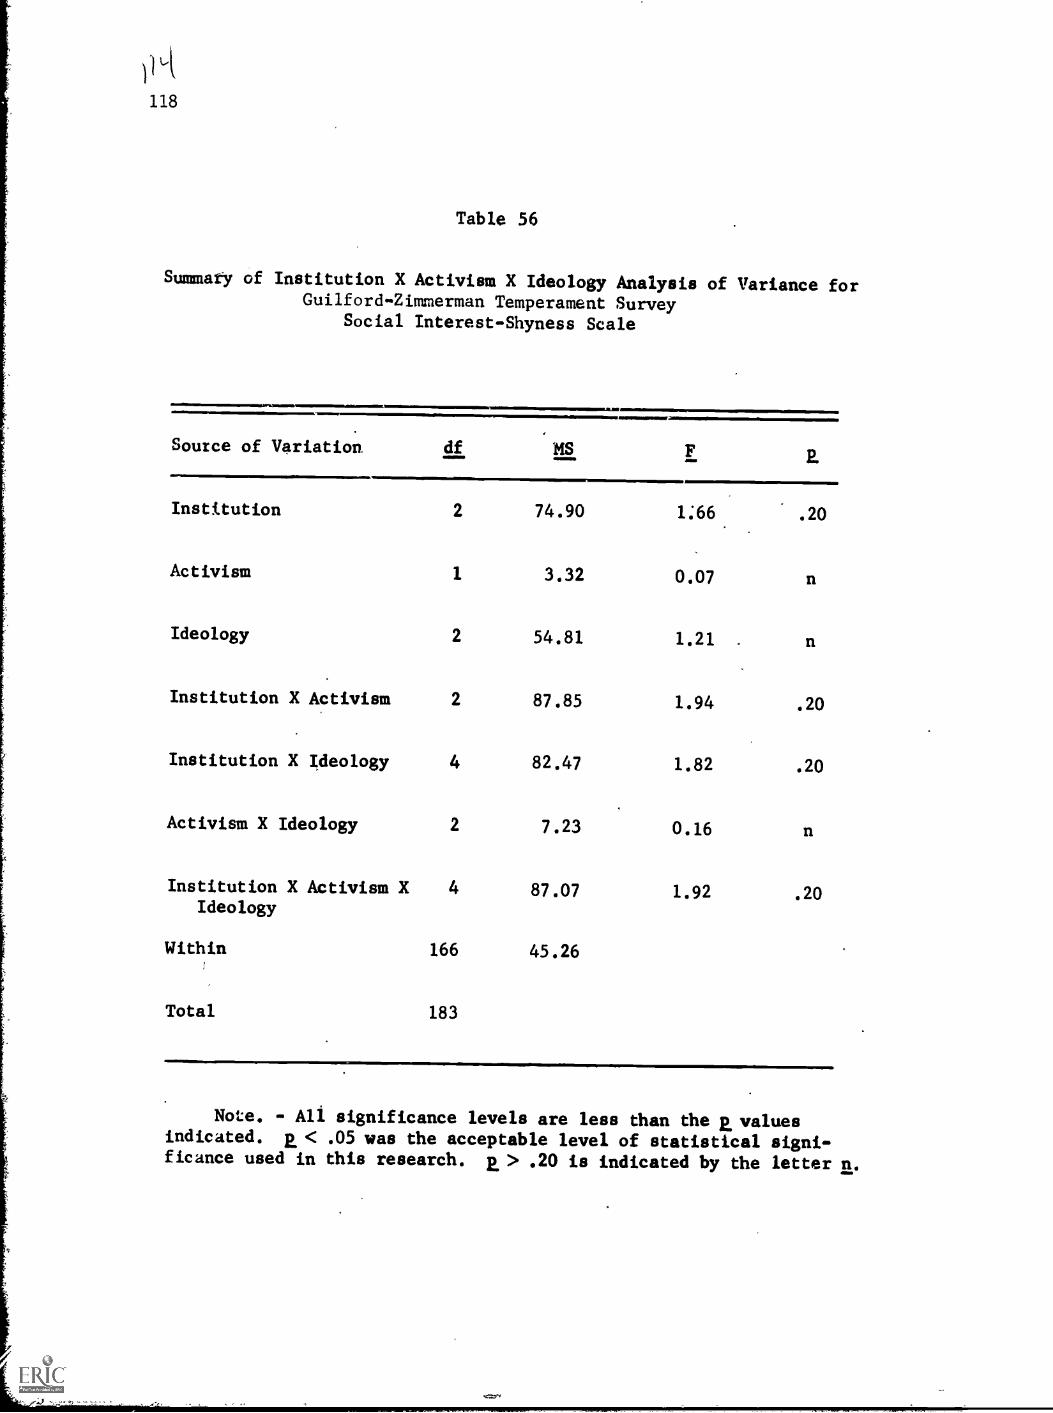
118
Table 56
Summary of Institution X Activism X Ideology Analysis of Variance forGuilford-Zimmerman Temperament Survey
Social Interest-Shyness Scale
Source of Variation df MS F2.
Institution 2 74.90 1.66 .20
Activism 1 3.32 0.07 n
Ideology 2 54.81 1.21 n
Institution X Activism 2 87.85 1.94 .20
Institution X Ideology 4 82.47 1.82 .20
Activism X Ideology 2 7.23 0.16 n
Institution X Activism X 4 87.07 1.92 .20Ideology
Within 166 45.26
Total 183
Note. - All significance levels are less than the a valuesindicated, a < .05 was the acceptable level of statistical signi-ficance used in this research. a > .20 is indicated by the letter n.
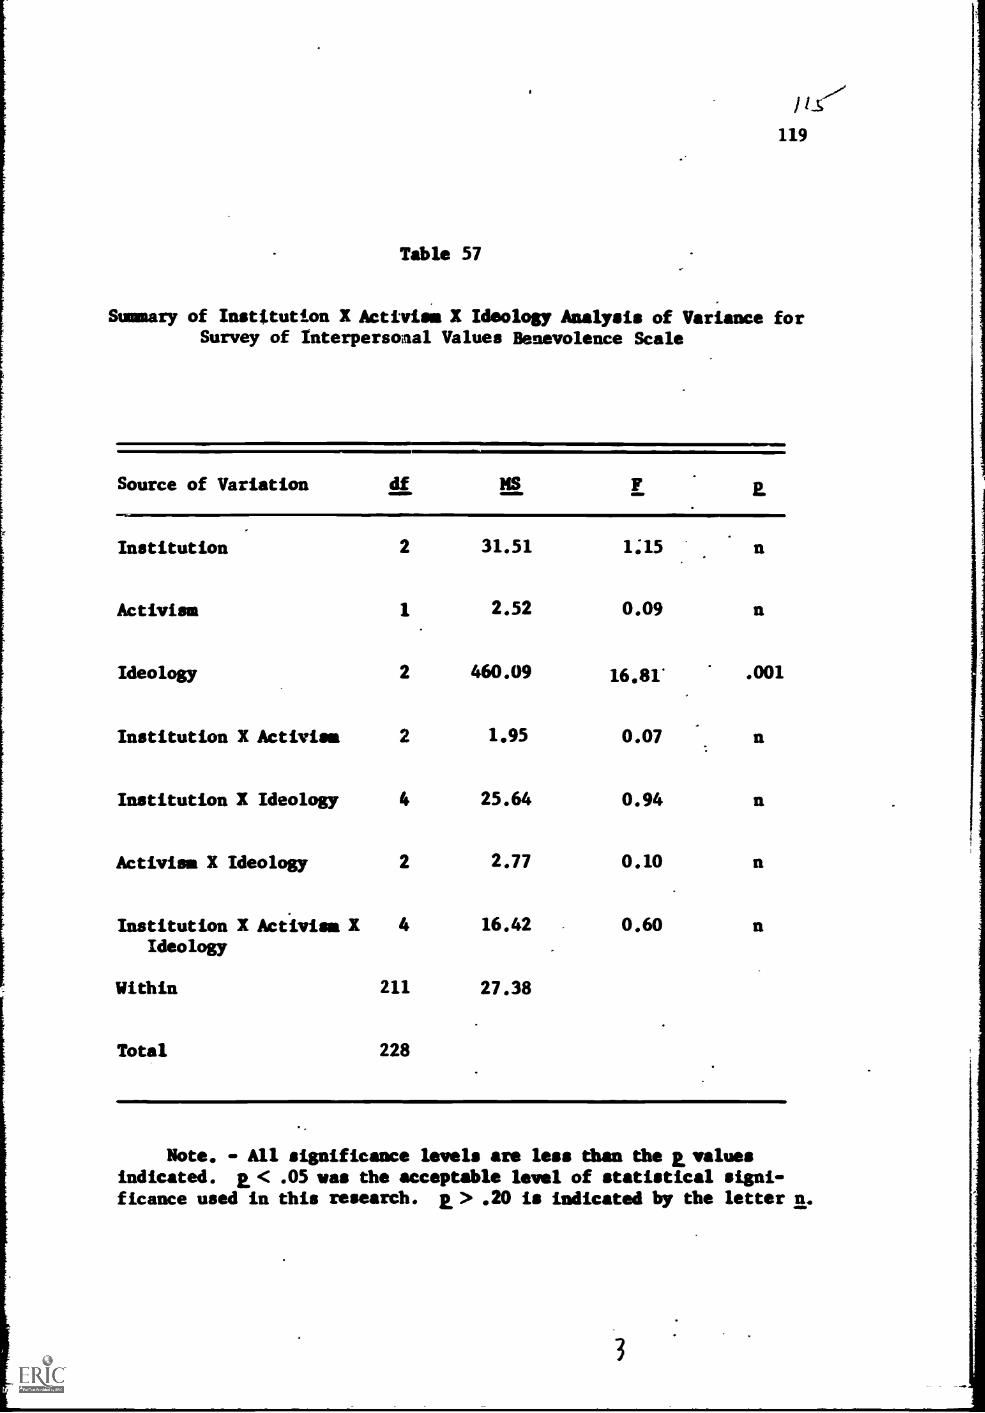
119
Table 57
Summary of Institution X Activism X Ideology Analysis of Variance forSurvey of Interpersonal Values Benevolence Scale
Source of Variation df MS F 2.
Institution 2 31.51 1:15 n
Activism 1 2.52 0.09 n
Ideology 2 460.09 16.81' .001
Institution X Activism 2 1.95 0.07 n
Institution X Ideology 4 25.64 0.94 n
Activism X Ideology 2 2.77 0.10 n
Institution X Activism X 4 16.42 0.60 nIdeology
Within 211 27.38
Total 228
Note. - All significance levels are less than the 2 valuesindicated. 2. < .05 was the acceptable level of statistical signi-ficance used in this research. 2 > .20 is indicated by the letter n.
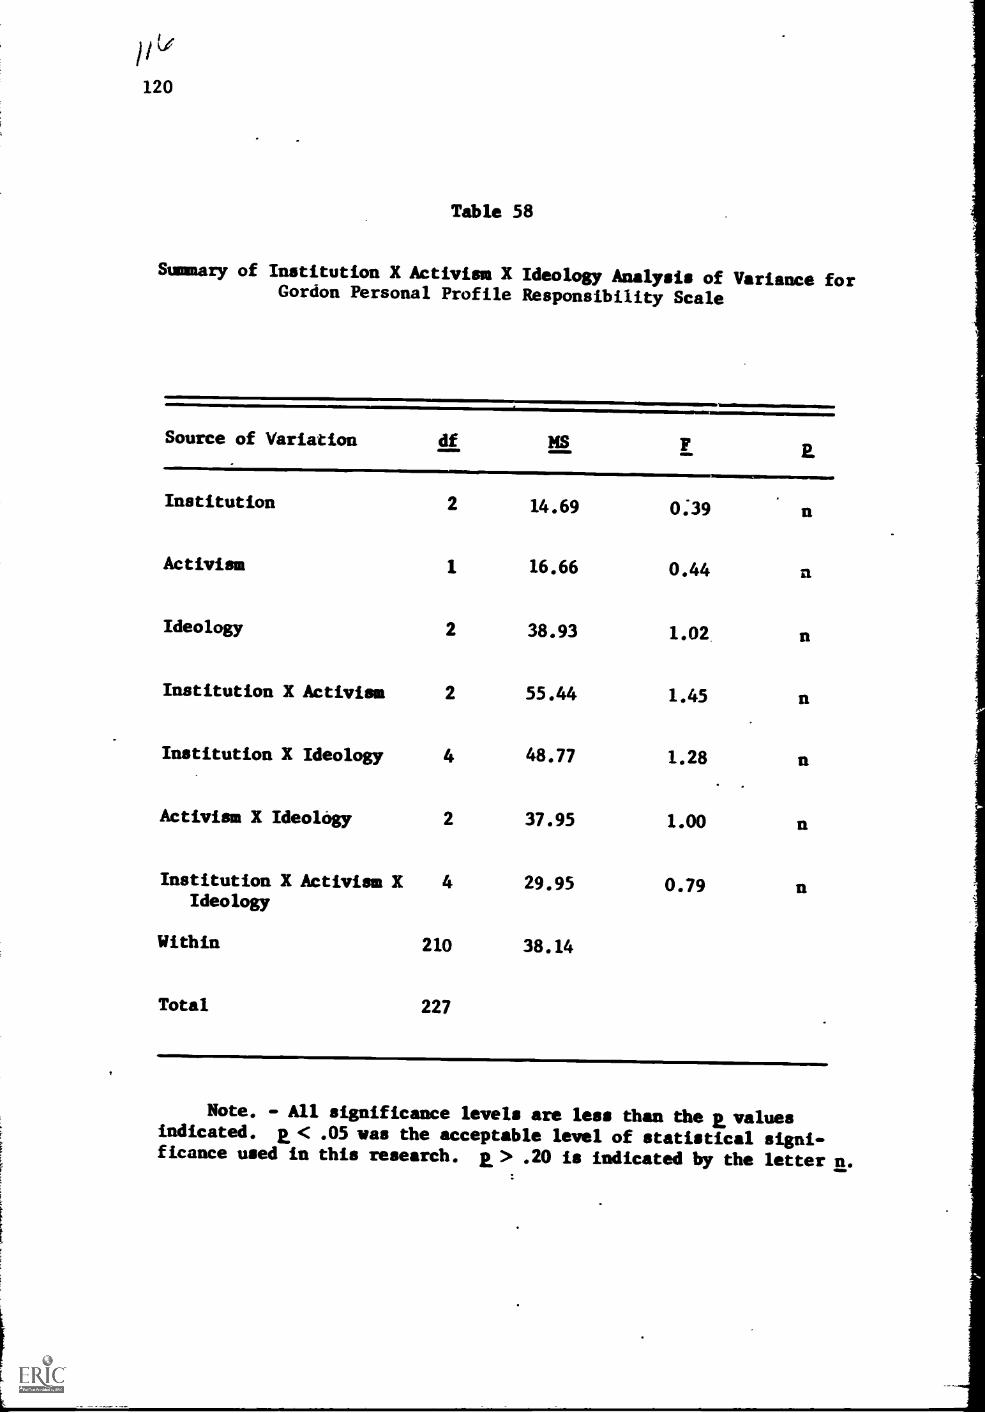
120
Table 58
Summary of Institution X Activism X Ideology Analysis of Variance forGordon Personal Profile Responsibility Scale
Source of Variation df MSE.
Institution 2 14.69 0.39 n
Activism 1 16.66 0.44 a
Ideology 2 38.93 1.02 n
Institution X Activism 2 55.44 1.45 n
Institution X Ideology 4 48.77 1.28 n
Activism X Ideology 2 37.95 1.00 n
Institution X Activism X 4 29.95 0.79Ideology
Within 210 38.14
Total 227
Note. - All significance levels are less than the a valuesindicated. a < .05 vas the acceptable level of statistical signi-ficance used in this research. a> .20 is indicated by the letter n.
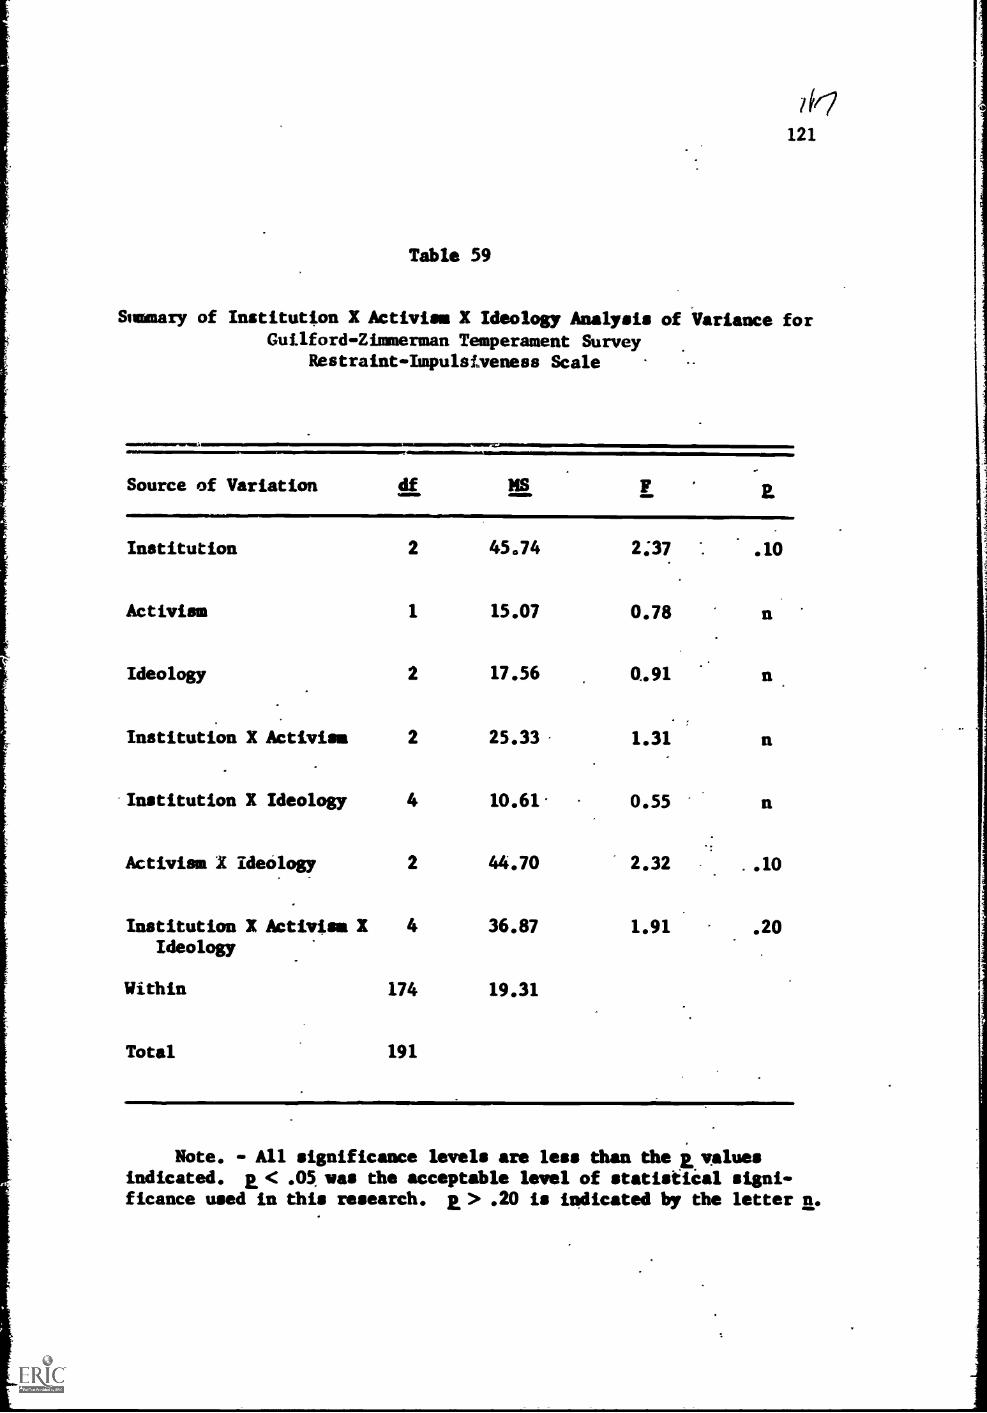
Table 59
Summary of Institution X Activism X Ideology Analysis of Variance for
Guilford-Zimmerman Temperament SurveyRestraint-Impulemeness Scale
Nrowilamm.:
Source of Variation df NS
Institution 2 45.74 2;37 ". .10
Activism 1 15.07 0.78 n
Ideology 2 17.56 0.91
Institution X Activism 2 25.33- 1.31 n
Institution X Ideology 4 10.61 0.55 n
Activism X Ideology 2 44.70 2.32 ..10
Institution X Activism X 4 36.87 1.91 .20Ideology
Within 174 19.31
Total 191
Note. - All significance levels are less than the E valuesindicated. a < .05 was the acceptable level of statistical signi-ficance used in this research. a > .20 is indicated by the letter n.
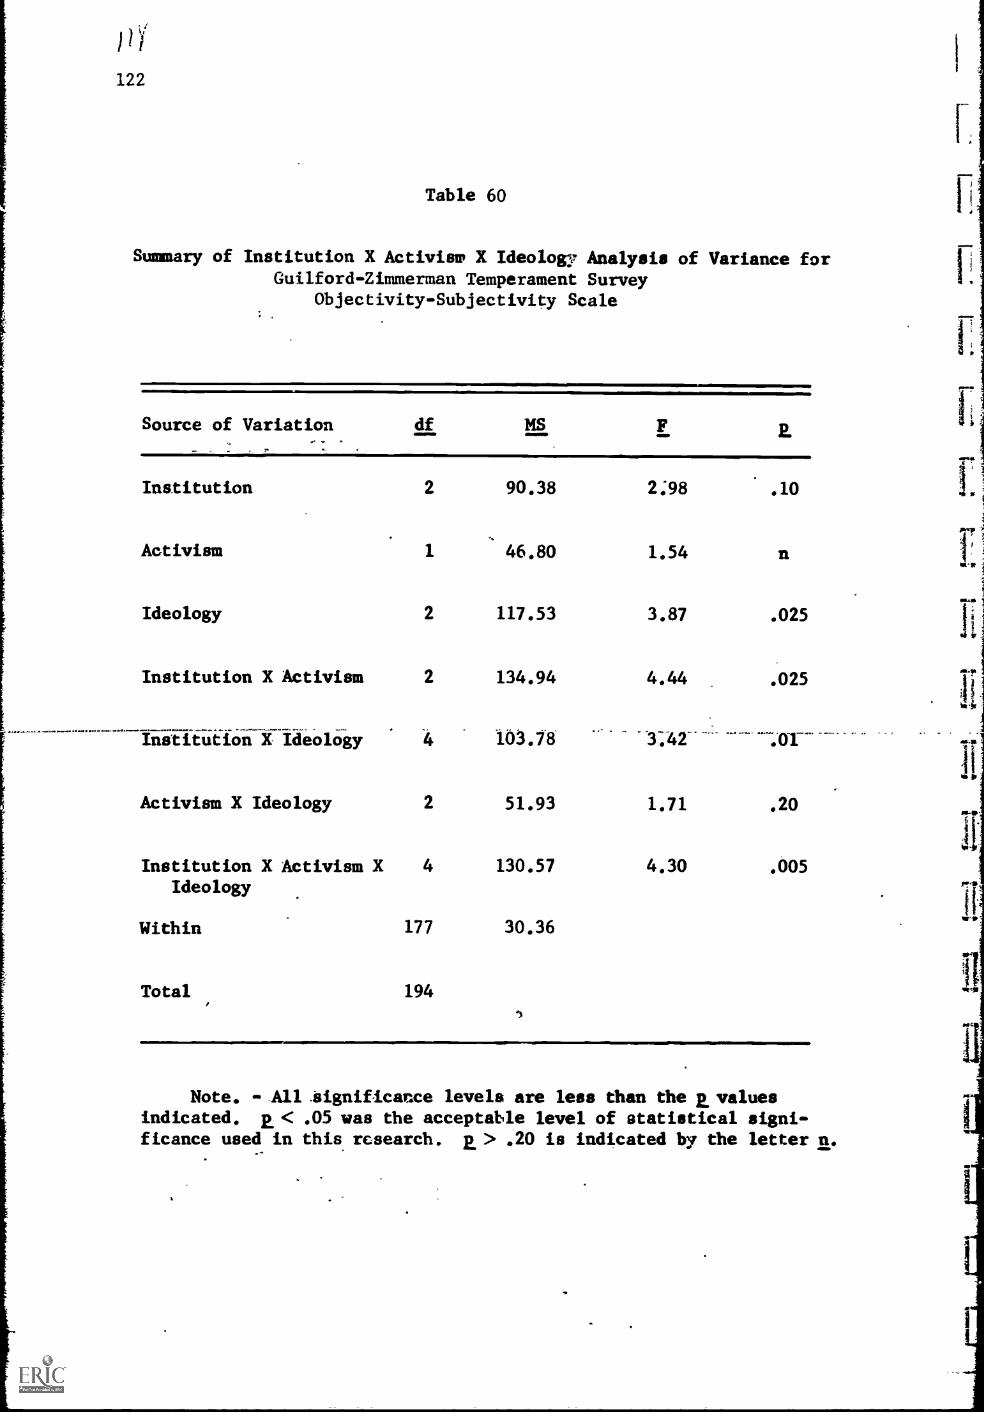
122
Table 60
Summary of Institution X Activism X Ideology Analysis of Variance forGuilford-Zimmerman Temperament Survey
Objectivity-Subjectivity Scale
Source of Variation df MSE.
Institution 2 90.38 2.98 .10
Activism 1 46.80 1.54 n
Ideology 2 117.53 3.87 .025
Institution X Activism 2 134.94 4.44 .025
Institution X Ideo o 4 103.78 -3:42- -Al--
Activism X Ideology 2 51.93 1.71 .20
Institution X Activism X 4 130.57 4.30 .005Ideology
Within 177 30.36
Total 194
Note. - All .tignificarace levels are less than the a valuesindicated. p < .05 was the acceptable level of statistical signi-ficance used in this research. a > .20 is indicated by the letter n.