document resume - eric - education resources … · 2014-03-18 · document resume ed 281 424 he...
TRANSCRIPT
DOCUMENT RESUME
ED 281 424 HE 020 295
AUTHOR Stambler, Howard V., Comp.TITLE Report to Congress on an Analysis of Financial
Disincentives to Career Choices in HealthProfessions.
INSTITUTION Health Resources and Services Administration(DHHS/PHS), Rockville, MD. Bureau of HealthProfessions.
PUB DATE Nov 86NOTE 68p.AVAILABLE FROM Health Resources and Services Administration, Bureau
of Health Professions, Rockville, MD 20857.PUB TYPE Reports - Evaluative/Feasibility (142)
EDRS PRICE MF01/PC03 Plus Postage.DESCRIPTORS *Career Choice; Dentistry; Economic Factors;
Financial Problems; Geographic Location; *HealthOccupations; Higher Education; Incentives; *LaborSupply; *Loan Repayment; Medicine; Optometry;Pharmacy; Podiatry; Public Health; Public Policy;Specialization; *Student Costs; *Student FinancialAid; Student Loan Programs; Tuition
IDENTIFIERS *Debt (Financial); Paying for College
ABSTRACTTrends in expenses, financial assistance, and
indebtedness for students studying health professions and the effectsof financial considerations on career choice were examined. Theobjective was to determine financial disincentives to graduates ofhealth professions schools that affect their choice of practicespecialty or their decision to practice in an underserved area.Information that is needed to determine whether there aredisincentives that affect the achievement of national health goalswere also identified. The influence of economic factors on careerchoices of minority students was considered as well. The followinghealth protessions that are eligible for the Health EducationAssistance Loan and/or the Health Professions Student Loan programwere covered: medicine, osteopathic medicine, dentistry, veterinarymedicine, optometry, podiatry, pharmacy, and public health.Additional loan and scholarship program awards were also considered.Data are provided by profession on the current status and recenttrends in educational expenses (e.g., tuition, fees); mechanisms usedby students to finance their education; debt levels; and trends infederal and nonfederal financial aid. Numerous tables and five pagesof references are included. (SW)
***********************************************************************Reproductions supplied by EDRS are the best that can be made
from the original document.***********************************************************************

...C.R, .t."--..riSSL.- ',...........,_
I.
4IP
0.
OD
-NMINa...rmy..... , .......... -
-
4
REPORT TO CONGRESS ON AN ANALYSTS OF
FINANCIAL DISINCENTIVES TO CAREER CHOICES IN
HEALTH PROFESSIONS
I
US. DEPARTMENTOP E0fICATIoNOats ol ham Research and improvementEDUCA NAL RESOURCES INPORMATION
CENTER (ERIC)Thrs docement has boon reproduced esrecfted from the person or orpeni2eirOnOnpnlennp rt0 41010/ changoa have
been made io improvetepropectron <misty
POP** oi,---.----.ww,:-----_,1mem do not nocessgudy represent (*kWOECO position at Poky
S
I
L
IS
-
I
dr
,
REPORT TO CONGRESS ON AN ANALYSIS OFFINANCIAL D/SINCENTIVES TO CAREER CHOICES IN
HEALTH PROFESSIONS
November 1986
U.S. Department of Health and Human ServicesPublic Health Service
Health Resources and Services AdministrationBureau of Health Professions
3
PREFACE
This report was prepared in response to directives of Section 221 of the
Health Professions Training Assistance Act of 1985, Public Law 99-129.The Act requires the Secretary of Health and Human Services to submit tothe Congress a report which contains an analysis of any financialdisincentive to graduates of health professions schools which affects thespecialty of practice they choose or the decision to practice theirprofession in an area which lacks an adequate number of health careprofessionals. Additionally, the Act states that this report shouldpresent recommendations for legislation and administrative action tocorrect any disincentives which are identified and which are contrary tonational health policy goals.
The report presented here describes the background and basic issuesrelated to possible disincentives, including recent trends in tuition andoverall educational costs, how health professions students finance theireducation, and student and graduate indebtedness. In addition, itdiscusses the possible implications of these trends and presents ananalysis and assessment of available data and evidence on therelationship between accumulated health professions educational debts andcareer decisions on specialty and practice settings. The particularimpact on persons from economically disadvantaged backgrounds and fromracial and ethnic minority groups which are underrepresented in thehealth professions is also considered. Based on the asseuments andanalysis of the available data, recommendations are also presented asrequired by the law. This report focuses primarily on the relationshipsbetween indebtedness incurred in financing a health professions educationand career choices. Therefore, the occupations covered include the onesthat are eligible for the Health Education Assistance Loan (HEAL) programand/or the Health Professions Student Loan 'IPSO program. These includemedicine (allopathic and osteopathic), dentistry, optometry, pharmacy,podiatric medicine, veterinary medicine and public health.
This report was prepared in the Health Resources and ServicesAdministration's Bureau of Health Professions, Thomas D. Hatch, Director,by the Bureau's Division of Medicine, Dr, Daniel Masica, Director;Division of Associated and Dental Health Professions, Dr. Thomas Louden,Acting Director; Division of Student Assistance, Michael Heningburg,Director; and Division of Disadvantaged Assistance, Dr. Clay E.Simpson, Jr., Director. It was planned, compiled and coordinatt'd by the
Bureau's Office of Data Analysis and Management, Howard V. Stamblpr,Director.
4i
Preface
CONTENTS
Page
I.
List of Tables ii
Executive Summary
Introduction 1
Summary and OverviPw 4
Student Financing Trends and Issues 4
Implications of Health Professions Graduate Indebtednessfor Career Choices 6
Recommendations 9
Developments in Educational Expenses 11
Developments in Financing Education 15Overview of Federally-Supported Student Financial AssistancP 15Profession specific Developments 22
Medicine 22Dentistry 27
Optometry 29Podiatric Medicine 29
Trends in Indebtedness 31
Effects of Costs, Changes in Financial Assistance and Indebtedness 35
Applicant Pool and Admissions 35
Practice 37
Early Practice Years and Residency Years 39
Career Plans of student and Recent Graduates 43
Economically Disadvantaged and Underrepresented MinorityStudents 46
References 53
LIST OF TABLES
Table Page
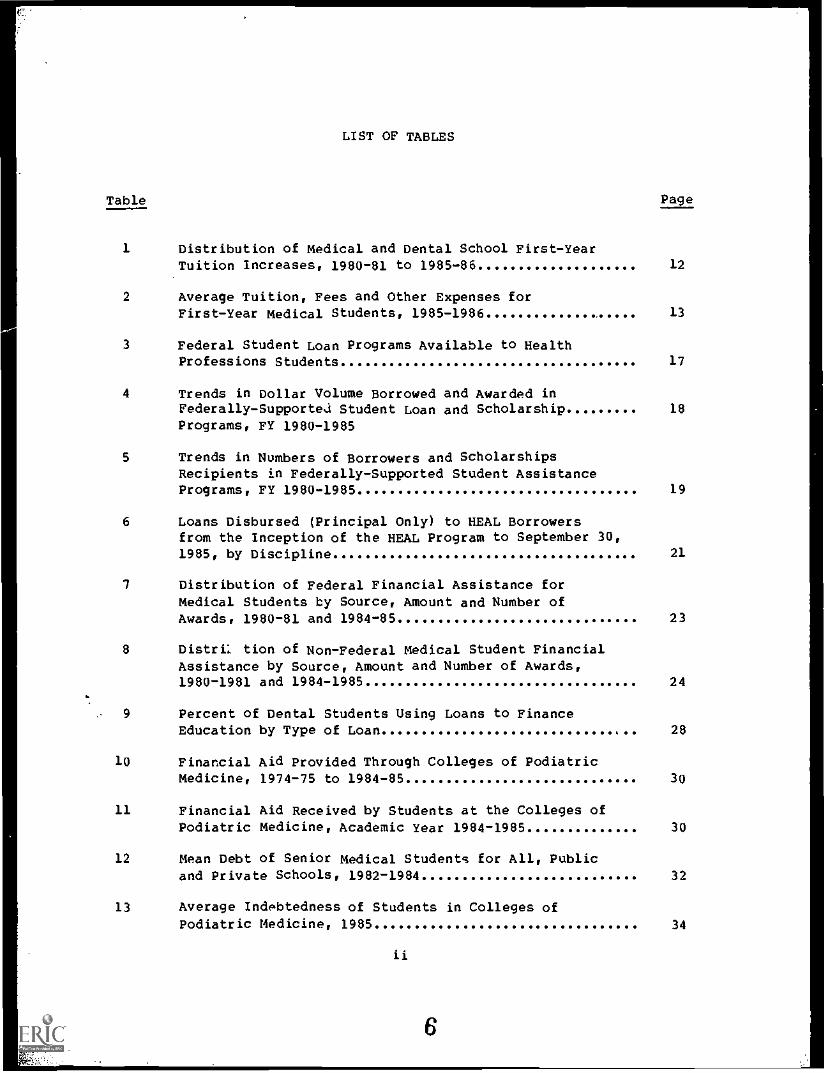
1 Distribution of Medical and Dental School First-YearTuition Increases, 1980-81 to 1985-86 12
2 Average Tuition, Fees and Other Expenses forFirst-Year Medical Students, 1985-1986 13
3 Federal Student Loan Programs Available to HealthProfessions Students 17
4 Trends in Dollar Volume Borrowed and Awarded inFederally-supportej Student Loan and Scholarship 18
Programs, FY 1980-1985
5 Trends in Numbers of Borrowers and ScholarshipsRecipients in Federally-Supported Student AssistancePrograms, FY 1980-1985
6 Loans Disbursed (Principal Only) to HEAL Borrowersfrom the Inception of the HEAL Program to September 30,1985, by Discipline
19
21
7 Distribution of Federal Financial Assistance forMedical Students by Source, Amount and Number ofAwards, 1980-81 and 1984-85 23
8 Distri: tion of Non-Federal Medical Student FinancialAssistance by Source, Amount and Number of Awards,1980-1981 and 1984-1985 24
9 Percent of Dental Students Using LoanS to FinanceEducation by Type of Loan 4 28
10 Financial Aid Provided Through Colleges of PodiatricMedicine, 1974-75 to 1984-85 30
11 Financial Aid Received by Students at the Colleges ofPodiatric Medicine, Academic Year 1984-1985 30
12 Mean Debt of Senior Medical Students for All, Publicand Private Schools, 1982-1984 32
13 Average Indebtedness of Students in Colleges ofPodiatric Medicine, 1985 34
ii
6
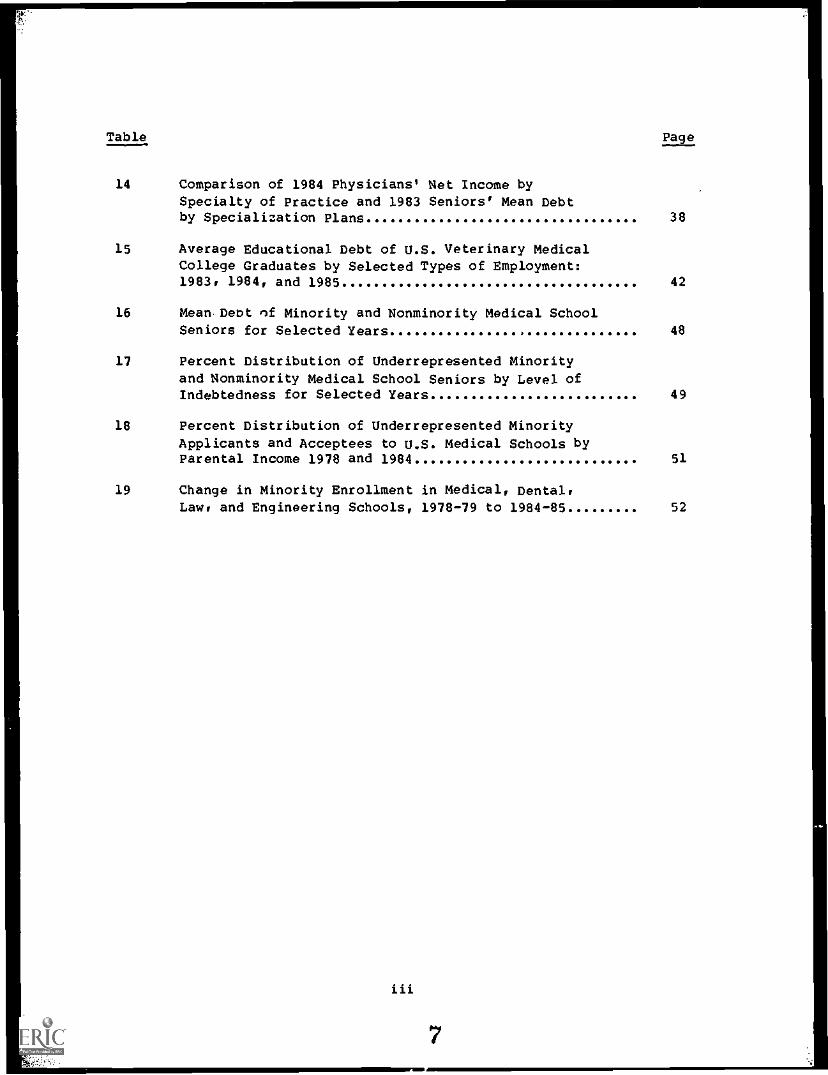
Table Page
14 Comparison of 1984 Physicians' Net Income bySpecialty of Practice and 1983 Seniors' Mean Debtby Specialization Plans 38
15 Average Educational Debt of U.S. Veterinary MedicalCollege Graduates by Selected Types of Employment:1983. 1984, and 1985 42
16 Mean Debt nf Minority and Nonminority Medical SchoolSeniors for Selected Years 48
17 Percent Distribution of Underrepresented Minority
and Nonminority Medical School Seniors by Level ofIndebtedness for Selected Years 49
18 Percent Distribution of Underrepresented Minority
Applicants and Acceptees to U.S. Medical Schools byParental Income 1978 and 1984 51
19 Change in Minority Enrollment in Medical, Dental.Law. and Engineering Schools, 1978-79 to 1984-85 52
iii
7
Report to Congress on an Analysis of FinancialDisincentives to Career Choices in the
Health Professions
Executive Summary
This Report to Congress on Financial Disincentives to l'areer Choices inthe Health Professions was prepared in response to directives of Section221 of the Health Professions Training Assistance Act of 1985, Public Law99-129. The Act requires the Secretary of Health and Human Services tosubmit tO the Congress a report which contains ". . . an analysis of anyfinancial disincentive to graduates of health professions schools whichaffects the specialty of practice thw choose or the decision to practicetheir profession in an area which lacks an adequate number of health careprofessionals." Additionally, the Act states that ". . . the reportshould present recommendations for legislation and administrative actionto correct any disincentives which are identified and which are contraryto the achievement of national health goals."
This report prepared by the Health Resources and ServicesAdministration's Bureau of Health Professions, describes the backgroundand basic issues related to possible disincentives, including recenttrends in tuition and overall educational costs, how health professionsstudents finance their eAucation, and student and graduate indebtedness.In addition, it discusses the possible implications of these trends andpresents an analysis and assessment of available data and evidence on therelationship between accumulated health professions educational debts andcareer decisions on specialty and practice settings. The particularimpact on persons from economically disadvantaged backgrounds and fromracial and ethnic minority groups is also considered. Based on theassessments and analysis of the available data, recommendations are alsopresented as required by tho law. Since the report focuses primarily onthe relationship between indebtedness incurred in financing a healthprofessions education and career choices, the occupations covered includethe ones that are eligible for the Health Education Assistance Loan(HEAL) program and/or the Health Professions Student Loan (HPSL)program. These include medicine (allopathic and osteopathic), dentistry,optometry, pharmacy, podiatric medicine, veterinary medicine and publichealth.
Major findings of the report are:
The educational expenses of students pursuing careersin the health professions continue to be greater thanthose of students in most other areas of professionaltraining. Moreover, there have been particularlysharp increases in these expenses in recant years.For example, average medical school tuition increased51 percent in private schools and 78 percent in publicschools during the past 5 years (in current dollars).
8
Similarly, dental school tuition increased by about 45percent over the past 5 years, while podiatricmedicine school tuition has increased approximately 30percent in the last 4 years.
o Increases in health profession school tuition andother expenses, coupled with constraints on theavailability of low cost alternatives to financinghealth professions education appear to havecontributed to the need for students to borrow moreoften in larger amounts and at higher interest ratesthan in the past. One study has estimated thattypically three-fourths of all students in allopathicand osteopathic medicine, dentistry, optometry andveterinary medicine programs borrow between 70 and 90percent of their professional education costs, withthe typical student in most of these professionsborrowing $6,000 or more annually, resulting in asizable debt load at the time of graduation. The moaneducational debt of 1985 graduates of schools ofveterinary medicine, dentistry, and podiatric medicineranged from a low of $22,252 in veterinary medicine to$49,213 in podiatric medicine.
o There is little hard empirical evidence thatindebtedness has served as a disincentive to careerchoices of graduates in recent years, in partreflecting the relative newness of the highindebtedness phenomenon. If educational costscontinue to escalate and the need to borrow largeramounts to finance education increases, it isconceivable that financial considerations may become amore prominent factor in determining career decisionsthan is presently discernable. However, increasingindebtedness levels are not expected to have asignificant numericEl impact on the overall numbers ofhealth personnel for the remainder of this century.Projections indicate substantial future increases inthe supply of health personnel until the year 2000.For example, the absolute number of physicians isprojected to increase by about 50 percent by the endof this century. Nonetheless, new studies andcontinued monitoring in this area would be useful formore conclusively defining the relationship betweeneducational indebtedness and career choice as well asfor detecting any significant changes in the trends.
Most studies to date do not support the contentionthat increases in total educational debt levels areresulting in a decrease in primary care practitionersand most have found other factors (such as student and
vi
practitioner sociodemographic characteristics) to be
more influential than indebtedness in determining
career choices.
However, there is evidence that the
type of debt accumulated (i.e., from federally-
subsidized vs. non-subsidized loan sources) may have
some effect on the likelihood of choosing a primary
care specialty.
For most health professions there are few definitive
studies and little evidence documenting the
relationship between indebtedness and location of
practice site.
There is some evidence that the income
earning potential of a location is important, but
there is no evidence that indebtedness affects the
location decision.
oThere is some evidence that the early practice years
of the new health professional with a relatively large
educational debt may be financially difficult.
Astudy simulating the debt burden pattern of graduates
of several different health professions disciplines
found that accumulated educational debt may be of such
a magnitude relative to expected earnings in the
initial years of practice that repayment of loans
could be difficult for substantial percentages of
these graduates.
However, earnings of health
professionals generally increase substantially as
their practices mature, so that such problems should
be relatively short-term.
oIncreases in applications and enrollment of persons
from disadvantaged and minority backgrounds were
greatest during the period of readily available
scholarships and low interest loans, suggesting that
participation of these groups in health professions
training programs may be sensitive to the availability
of programs that reduce out-of-pocket student costs.
However, there have been no studies that have directly
addressed the possible discouragement effects of
indebtedness on minority enrollment levels.
Similarly, no hard evidence exists on the numbers of
minority or low-income students who may have failed
even to apply to health professions education programs
because of the lack of low-cost financial assistance
and because of their belief that they might not be
able to repay the high debts.
There is some anecdotal
evidence from a recent series of nationwide workshops
on career choices of minority students that they have
been choosing alternative careers in engineering,
business, and computers which require less lengthy
training and are less expensive.
vii10

INTRODUCTION
Since the 1960s, the Federal Government, State Governments, professionalassociations, educational institutions and others have made substantialinvestments in programs to support the training of health professionspersonnel as a means of meeting national requirements and alleviatingproblems of inadequate access to health care and barriers to equitableaccess to careers in the health professions. Largely as a result ofthese past efforts, access to health care and health careers has becomemuch less of a problem today than it was two decades or even one decadeago. However, with recent steady increases in the costs of obtaining ahealth professions education, reductions in low cost means of financingsuch education, and rising levels of indebtedness incurred by students inthe pursuit of this education, concern has been expressed about barriersto careers in the health professions. At the same time, concern has been
voiced about the negative effect that high levels of indebtedness mighthave on decisions to locate in underserved areas and to choose careers inprimary care or other specialties in need of additional practitioners, inbasic biomedical research, or in teaching.
The purpose of this report, as mandated by Section 221 of P.L. 99-129, isto compile, assess, analyze and present available information on therelationship between indebtedness levels and career choice in order to"provide an analysis of any financial disincentive to graduates of healthprofessions schools which affects the specialty of practice chosen bysuch graduates or the decision of such graduates to practice theirprofession in an area which lacks an adequate number of health careprofessionals." Further, it presents recommendations for action "tocorrect any disincentives which are identified and which are contrary tothe achievement of national health goals" or to provide the informationneeded to identify more definitively whether such disincentives exist.
This report is divided into six major sections.
1. Summary and Overview2. Recommendations3. Developments in Educational Expenses4. Developments in Financing Education5. Trends in Indebtedness6. Effects of Costs, Changes in Financial Assistance and
Indebtedness
The Summary and Overview section provides a summary of the more detailedsections which follow including a background discussion of studentfinancing trends and issues, health professions graduates indebtednessand the implications and evidence of the effects of developments in theseareas on career choices. The sections on Developments in EducationalExpenses, Developments in Financing Education and Trends in Indebtednesspresent available data for each profession on the current status andrecent trends in educational expensea (tuition, fees, etc.), themechanisms used by students in each profession to finance theireducation, and tt'ends in the levels of debt incurred by health
- 1 -
1 1

professions students in the pursuit of their education. Because theFederal government has historically played a major role in the financingof health professions education, the section on Developments in FinancingEducation also includes a discussion of the current status and recenttrend in Federally-supported financial aid.
The last section of this report presents and assesses the evidence andpossible implications from specific studies in the literature on the:ffects of financial factors on career choices in these professions.
The ability to fully assess the problem and to draw definitive
conclusions about the implications of high levels of accumulatededucational debt for the health professions has been hampered by a numberof problems and limitations including the reliance on existing datasources. This report is based on data derived from a number of differentsources with widely differing analytic frameworks. As a result, thereare differences in the reporting and availability of data across thehealth professions which limit the presentations and discussions inseveral areas. There is a lack of comprehensive, consistent, basic trenddata on the educational expenses and indebtedness of health professionsstudents. For example, it is not possible to present empirical datawhich are compatible across professions on the change in tuition levelsand other educational expenses over the last several years. Similarly,there is little comprehensive trend data on the sources used by healthprofessions students to pay for their education or on reasons for thecareer choices made by health professions students. Further, little dataexist that comprehensively describe the patterns of use of variouseducational financing mechanisms by health professions students. In some
cases, the most recent comprehensive studies in this area presentinformation on students enrolled in health professions schools too longago to be relevant to today's perceived problems.
A second constraint is the lack of research studies for most healthprofessions which explore the relationship between levels of indebtednessand career choice. At present, medicine and dentistry appear to be theonly disciplines for which there have been studies attempting to quantifythese relationships, but even here the information is inconclusive.
Although there is particular concern about the effects of indebtedness onthe supplies of minoriti.es underrepresented in the health professions,there are no definitive studies which quantify the relationship betweendebt levels or any other economic factors and career choices of minoritystudents in most health professions.
Finally, high levels of indebtedness are a comparatively recent
phenomenon whose full effects are not likely to be evident for severalmore years. Moreover, because of a lag in the data much of the recentreliance on high interest loans and current levels of indebtedness arenot reflected in the few available studies examining the relationship
between indebtedness and career choices. Therefore, the currentavailable evidence is limited in its ability to describe the effects thatcontinued and rising high indebtedness may have on future healthprofessions students or on the Nation's access to care.
- 2 -
12
ILL
Despite these limitations, this report should be useful in providing ageneral assessment and description of the status of health professionsstudent financing and indebtedness based on data available as of the mid19800. Moreover, it should be useful in pointing to the areas whereadditional data and continued monitoring are needed in order tosubstantiate or refute the hypotheses which have been made concerning theeffects of these factors on career choices.
3 13
SUMMARY AND OVERVIEW
Student Flnancing Trends and Issues
There are substantial differences among the various health professions in
the cost of an education.
These result largely from variations in such
factors as duration of the educational process and differen'ls in the
levels of tuition and fees and other expenses.
These variations in cost
notwithstanding, health professions training programs generally are among
the most expensive of professional training.
Moreover, such costs have
increased over the years with particularly sharp increases in recent
years.
For example, average medical school tuition increased 51 percent
in private schools and 78 percent in public schools during the past five
years (in current dollars).
Similarly, dental school tuition increased
by about 45 percent over the past five years, while podiatric medicine
school tuition has increased approximately 30 percent in the last four
years.
Health professions students have traditionally used four principal ways
of financing their education:
loans, scholarships and grants, gifts and
their own or family resources.
/n recent years, there have been
substantial shifts in the use of these means of financing their
education, and students are currently meeting the costs through more
extensive borrowing.
One study has estimated that typically
three-fourths of all students in allopathic and osteopathic medicine,
dentistry, optometry and veterinary medicine programs borrow between 70
and 90 percent of their professional education costs and the typical
student in most of these professions is borrowing nearly $10,000 or more
annually, resulting in a sizable debt load at the time of graduation
(AIMS, 1985).
To som e extent, the increasing use of borrowing to finance health
professions education reflects changing views of what the appropriate
Federal role in providing student financial assistance should be.
The
Federal Government has provided substantial financial assistance to
health professions students and institutions in a variety of forms since
the 1960s as a means'of providing access to expensive health professions
training programs.
However, as it became apparent in the 1970s that
incentives to growth in the overall number of health professions trainees
were no longer necessary, Federal financial support to training
institutions was reduced thereby generating a need for schools to replace
these subsidies with funds from other sources including higher tuitions.
Further, based on budgetary constraints and the view that health
professions students should assume a greater portion of the cost of their
education, a large part of the current Federal funds specifically
provided for financial assistance to health professions is allocated to
unsubsidized loans.
The Health Education Assistance Loan (HEAL)
(a
guaranteed loan), is now the major non-subsidized loan available to
health professions students.
Although its original intent was to serve
as a loan of Last resort, student reliance upon HEAL loans as a financing
mechanism has expanded rapidly in the last few years.
Approximately 20
percent of enrolled health professions students had HEAL loans in 1985
compared with about 8 percent as recently as 1982.

By 1986. nearly one billion dollars in HEAL loans had been made since itsinception in 1979. Across the individual health professions, thesubstantial increase in reliance on unsubsidized loans is striking. Forexample, HEAL loans accounted for approximately one percent of allfinancial assistance awarazd to medical students in 1979-1980; just 4years later in 1983-1984, nearly 20 percent of financial aid awarded wasin the form of such loans. Similarly, the percentage of dental studentsusing REAL loans increased from 6 percent in 1979 to 26 percent in 1984,
and REAL loans accounted for more than half of all financial assistanceto podiatric medicine students in academic year 1984-1985.
In contrast to the direction the HEAL loan program has taken, the numberof Exceptional Financial Need Scholarships awarded declined by about50 percent from Fiscal Year 1980 to Fiscal Year 1985 and the number offirst time recipients of NRSC scholarships declined about 98 percent overthis period.
Thus, increases in health profession school tuition and other expenses,coupled with constraints on the availability of low cost alternatives tofinancing their education appear to have contributed to the need forstudents to borrow more often in larger amounts and at higher interestrates than in the past, resulting in a significant rise in overallindebtedness. As an example, over the relatively short four-year periodfrom 1980 to 1984, there has been a more than 50 percent increase in themean educational debts of senior medical students (from $17.200 to almost$27,000). The mean educational debt of 1985 graduates of schools ofveterinary medicine. dentistry. and podiatric medicine ranged from a lowof $22,252 in veterinary medicine to $49,213 in podiatric medicine.
With the increase in borrowing as a primary means of financing healthprofessions education, a number of student "inancing issues have arisenrelating to the impact of high indebtedness. They include: assessmentof the ability of health professions graduates to repay the debts
incurred, the expanded need for improved debt management on the part oflenders and insurers, and financial counseling of health professionsstudents. While these issues at present appear to be only indirectlyrelated or not clearly identified as to their impact on the issue ofcareer choice, it is clear that the interrelationship of these issuesneeds to be examined carefully. And, as long as borrowing remains animportant means of accessing a career in the health professions, debtmanagement issues will likely continue to be a large part of the totalpicture of student financing trends and issues.
- 5 - 15

Implications of Health Professions Graduate Indebtednessfor Career Choices
It has been postulated by some observers that high and rising levels ofaccumulated educational debt restrict health professionals ability tomake career choices. Some bolieve that such restrictions may have anegative influence on national health policy goals of promoting equitableaccess to careers in the health professions, increasing the supplies ofminorities who are underrepresented in the health professions, andincreasing the Nation's access to.primary care and to health careproviders in rural and underserved areas. It has been argued that allbut those persons with substantial available financial resources would bediscouraged from pursuing a career in the health professions. It hasalso been suggested that those graduates with heavy indebtedness would bemore inclined to locate in metropolitan areas where professional incomesare generally higher and where supplies of health professionals areusually ample; and, that they would choose to practice in the mostlucrative, non-primary care specialties which are less in need ofadditional practitioners. Some observers have also suggested thatstudents who use high interest loans to finance their education may facelarge repayments for a substantial number of years of their careers andmay pass the costs of their indebtedness on to their patients (Sandson,1983). Furthermore, the relatively low salaries of public healthpersonnel, researchers and faculty coupled with increasing educationaldebt is also thought by many to be a possible deterrent to practice inthese fields. These arguments are largely based on researcherassumptions about the expected relationship between economic factors andthe career choices made by those in the health professions rather than onthe findings of specific studies of these relationships.
Available evidence on the effects of indebtedness on career choices is,unfortunately, largely circumstantial and inconclusive with no clearcause and effect readily identifiable. Declines in the pool ofapplicants to health professions schools in recent years suggest thateducational costs and the consequent indebtedness may be factors, butthere is no definitive evidence that such is or is not the case. Thereis some evidence in several disciplines that applicants from low incomefamilies are becoming a smaller percentage of the total applicant pool.Again, however, there are no conclusive studies or hard evidence on therelationship of increasing indebtedness to this occurrence.
Determining influences on choice of a practice location is very complexand a number of studies have been done to assess the importance ofvarious factors in location decisions. There is evidence that the incomeearning potential of a location is important. However, there are fewdefinitive studies and little evidence documenting the relationshipbetween indebtedness and location of practice site. A study of 1980dental graduates found that those with the highest debt levels tended tochoose small towns and semirural areas as their planned practice location(Graham, 1981). Analyses of indebtedness and career plans among 1983medical school graduates found that high indebtedness was associated witha preference for an urban or suburban practice location and that students
-6- /6
who indicated they were willing to serve in an economically deprived areahad lower average debts than others. However, this finding wasattributed to the preferences of underrepresented minority students whowere more likely to indicate a willingness to serve in these areas andwho also had relatively lower average indebtedness (AAMC, 1985).
Most studies to date do not support the contention that increasededucational debt is resulting in a decrease in primary care practitionersand most have found that other factors (such as sex, marital status andtype of institution attended) are more influential than indebtedness oncareer plans. However, a study based on 1983 data for residentphysicians examined the relationship between indebtedness and physicianspecialty choice by differentiating among the various types of debt andfound that an.increase in the amount of debt from federally-subsidizedloans (OSL, NDSL and HPSL) had no effect on the specialty choice ofwhites but slightly increased the probability of non-whites selecting aprimary care specialty. On the other hand, increases in debt fromnonsubsidized HEAL loans were found to reduce the likelihood of aphysician choosing a primary care specialty, regardless of race.Although these analyses did show that the type of debt accumulated hadsome effect on specialty choice, the influence was small. Por example, a$10,000 increase in HEAL debt decreased the probability of selection of aprimary care specialty (by 7.5 percentage points), and a $10,000 increasein subsidized debt increased the probability of non-whites selectingprimary care by 5.3 percentage points.
The influence of increasing costs and indebtedness levels on the careerchoices of low-income students and minorities who are underrepresented inthe health professions has been of particular concern to some observers.It has been stated that the growing financial burden of students maycontribute to the continuing underrepresentation of some minority healthprofessionals and would in turn have a negative impact on efforts toalleviate the unmet health care needs of minorities and persons living inunderserved and less-well-served areas.
Increases in applications and enrollment of persons from disadvantagedand minority backgrounds were greatest during the period of readilyavailable scholarships and low interest loans, suggesting thatparticipation of these groups in health professions training programs maybe sensitive to the availability of programs that reduce out-of-pocketstudent costs. However, there have been no studies that have directlyaddressed the possible discouragement effects of indebtedness on minorityenrollment levels. Similarly, no hard evidence exists on the numbers ofminority or low-income students who may have failed even to apply tohealth professions education programs because of the lack of low-costfinancial assistance and because of their belief that they might not beable to repay the high debts. There is some anecdotal evidence from arecent series of nationwide workshops on career, choices of minoritystudents that they have been choosing alternative careers in engineering,business, and computers which are both less lengthy and less expensive.The current and future magnitude of such trends, if existent, and theeffects on minority representation in the health fields are unknown.
Another recent occurrence in health professions graduate career choices,
which is thought to be associated with high indebtedness levels but does
not appear to affect national health policy goals, is the increase in the
proportion of new graduates joining group practices and/or taking
salaried positions rather than starting a new solo practice with its
commensurate high startup costs.
However, in addition to possibly
reflecting an increasing availability of such positions, some of these
developments may simply reflect the selection of such practices by new
graduates to be followed later by the selection of independent practice.
In summary, the relatively high and increasing levels of indebtedness
carried by healta professions graduates into practice has caused concern
about the effects on both the career choices of these graduates and the
ability of graduates to repay the debts incurred.
Yet, there is a lack
of hard empirical evidence that indebtedness has served as a disincentive
to career choices of graduates in recent years, in part probably
reflecting the relative newness of the high indebtedness phenomenon as
well as the small magnitude of the effects found
If educational costs
continue to escalate and the need to borrow larger amounts to finance
education increases, it is conceivable that financial considerations may
become a more prominent factor in determining career decisions than may
be presently discernable.
However, increasing indebtedness levels are
not expected to have any significant impact on overall health personnel
supply levels for the remainder of this century.
Projections indicate
substantial future increases in the supply of health personnel until the
year 2000.
The absolute number of primary care physicians (a group of
particular concern) is projected to increase by over 50 percent by the
end of this century.
Nonetheless, new studies and continued monitoring
in this area would be useful for more conclusively defining the
relationship between educational indebtedness and career choice as well
as for detecting any significant changes in the trends.
RECOMMENDATIONS
Present data do not indicate a need for substantial policy changes or
research efforts which are substantially different from those which arecurrently in place or planned. However, some changes may be needed in
the future depending on whether or not trends change sharply.
Based upon the nature of the results of this analysis, it is clear thatfurther research would be useful to define empirically any relationshipbetween health professions educational indebtedness and career choice.Present levels of public and private research effort are sufficient to
detect any sharp changes and should be maintained.
There does not appear to be a need for a major expansion in the number ofsuch studies at this time but subjects for future research might includeefforts:
o To document the degree to which financial
considerations including both foregone and expectedearnings, deter or encourage applicants to healthprofessions training programs.
o To determine the degree to which financial needs
affect attrition from these programs.
o To document the relationship between expected
financial remuneration and choice of specialty.practice setting and geographic area. These studiesshould especially consider the evidence oneconomically disadvantaged and underrepresentedminority groups.
o To determine the patterns of use of various
educational financing mechanisms by disadvantaged andunderrepresented minority students and the potentialimpact of changes in these mechanisms on educationaldecisions by these groups.
o To track recent health professions graduates' income
histories during the early stages of their careersthrough periodic surveys. These surveys could examinethose factors that affect the proportion of income
that new professionals have or will have available fordebt repayment.
Regardless of long-term trends, present levels of indebtedness often posea financial hardship for professionals holding residencies or otherrelatively low-paying or entry jobs. Therefore, strong considerationshould be given to relieving the potential hardship of high levels ofdebt repayment during the early career years through policies which:
o Provide greater flexibility for repayment of loansduring residency training and early practice years byexpanding loan consolidation programs and graduatedrepayment option programs.
Other recommendations involve Federal government encouragement of effortsin the non-Fedaral sector:
o To encourage expansion of State and local programsdesigned to provide loan forgiveness programs forlow-income students who will serve in medicallyunderserved areas.
o To encourage the institutionalization of programs offinancial planning and debt management counseling.
- 10 -
20
DEVELOPMENTS IN EDUCATIONAL EXPENSES
To at least some extent, steadily rising costs ane declines in subsidies
have caused health professions schools, private ones in particular, tomake increases in tuition in recent years. For example, over 1980-1985period the vast majority of medical schools and dental schools increasedtheir first-year tuition by more than 50 percent (current dollars); 32percent of medical schools and 22 percent of dental schools more thandoubled their tuition in that five-year period (Table 1).
During the past five years average tuition increased, in current dollars,51 percent for private and 78 percent for public medical schoolstudents. In the Fall of 1985 the average tuition for State residentfirst-year medical students at public schools was $3,890, an increase of345 percent, in current dollars, over a ten-year period. With otherexpenses (fees, transportation, room and board, books), the expense for afirst-year student who was a State resident in 1985 was $11,621 (Table 2).
Tuition for non-State residents averaged $8,557 for the 1985-86 academicyear. Including other expenses averaging $7,731, a first-yearnonresident student attending a public medical school incurred a totalexpense of $16,688. The average first-year costs for private medicalschool students in 1985-86, including tuition, fees and other expenses,was $23,306 (AAMC, 1986).
Osteopathic students' educational expenses have also continued toincrease in both public and private schools. Between 1982 and 1984,first-year average tuition levels in private schools increased17 percent, from $10,389 to $12,225, while public school tuitionincreased from $2,727 to $2,872 for State residents and to $4,115 forstudents from other States. Average total educational expenses forfirst-year students attending private osteopathic schools in 1983-84increased 2.7 percent from the previous year to $19,200. Total costsrose more steeply in public osteopathic colleges, by 13 percent over1982-83. For State residents attending public osteopathic colleges in1983-84, average education expenses were $10,400 while non-State
residents attending public osteopathic schools, incurred totaleducational expenses of $12,300, about one-third less than the averagefirst-year costs of students attending private osteopathic schools(AACOM, 1986).
A 1981 study conducted for the Department of Health and Human Servicesindicated that the "average" medical student at that time could afford$35,000 a year for tuition and fees before the level of debt owed for amedical education makes medicine an unsatisfactory career choice. Thefigure was lower for those who planned to practice in a low-payingspecialty such as psychiatry (urban Institute, 1981).
The average tuition for first-year dental students in academic year1985-86 was $7,085 for residents and $9,703 for nonresidents (AmericanDental Association, January 1986). By way of contrast, in 1981-82 theaverage tuition was $4,742 for residents and $6,721 for nonresidonts(American Dental Association, 1981). When adjusted for inflation,resident and nonresident tuitions increased by 26 percent and 22 percent
21
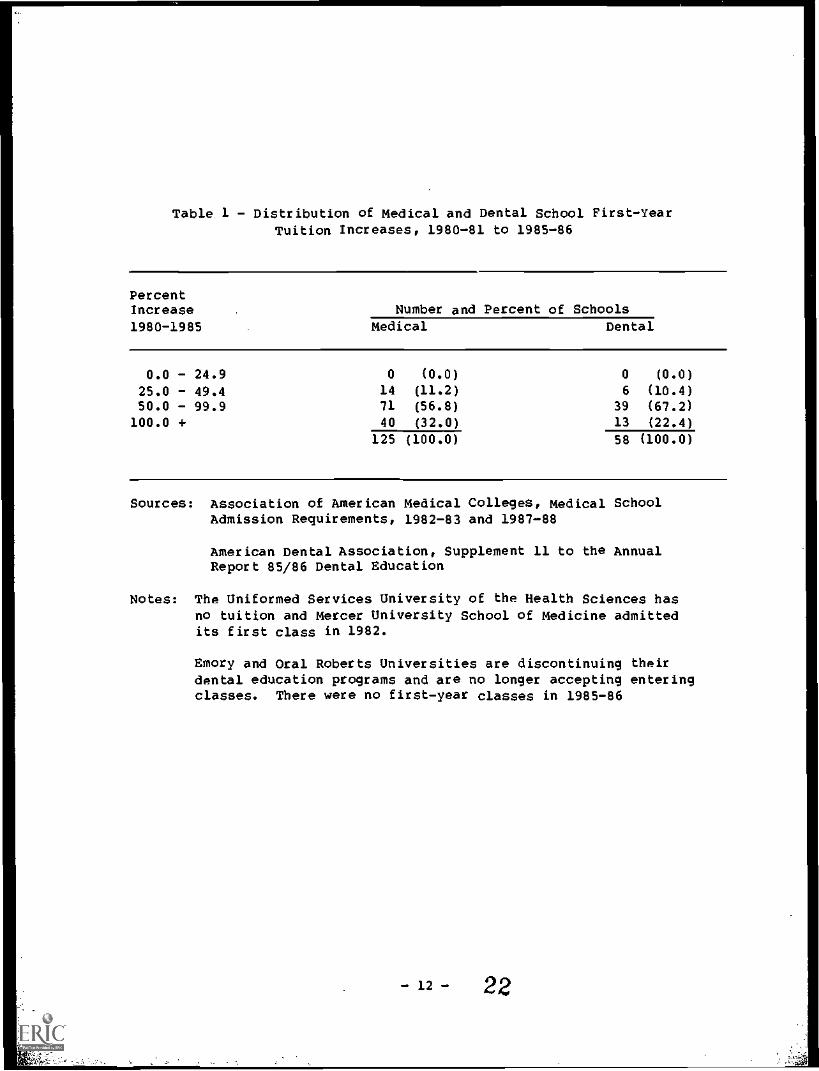
Table 1 - Distribution of Medical and Dental School First-YearTuition Increases, 1980-81 to 1985-86
PercentIncrease Number and Percent of Schools1980-1985 Medical Dental
0.0 - 24.9 0 (0.0) 0 (0.0)
25.0 - 49.4 14 (11.2) 6 (10.4)50.0 - 99.9 71 (56.8) 39 (67.2)
100.0 + 40 (32.0) 13 (22.4)
125 (100.0) 58 (100.0)
Sources: Association of American Medical Colleges, Medical SchoolAdmission Requirements, 1982-83 and 1987-88
American Dental Association, Supplement 11 to the AnnualReport 85/86 Dental Education
Notes: The Uniformed Services University of the Health Sciences hasno tuition and Mercer University School of Medicine admittedits first class in 1982.
Emory and Oral Roberts Universities are discontinuing theirdental education programs and are no longer accepting enteringclasses. There were no first-year classes in 1985-86
- 12 - 22
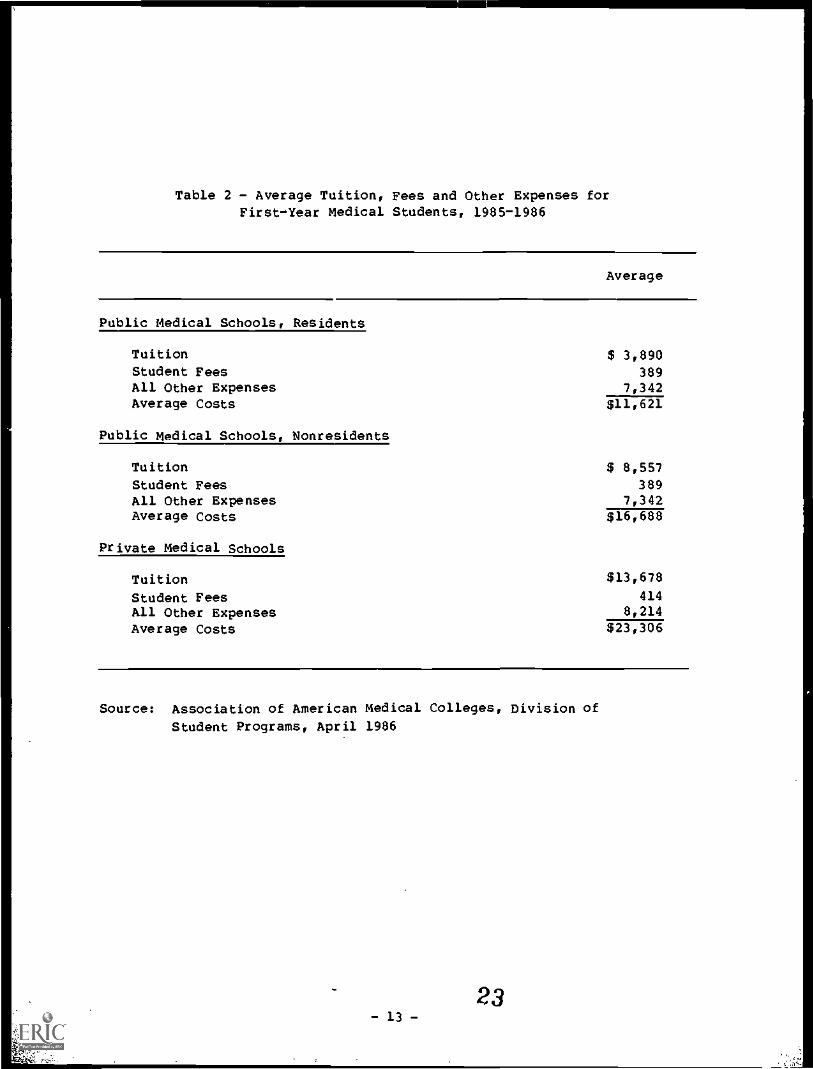
Table 2 - Average Tuition, Fees and Other Expenses forFirst-Year Medical Students, 1985-1986
Average
Public Medical Schools, Residents
Tuition $ 3,890Student Fees 389All Other Expenses 7,342Average Costs $11,621
Public Medical Schools, Nonresidents
Tuition $ 8,557Student Fees 389All Other Expenses 7,342Average Costs $16,688
Private Medical Schools
Tuition $13,678
Student Fees 414All Other Expenses 8,214
Average Costs $23,306
Source: Association of American Medical Colleges, Division of
Student Programs, April 1986
..
32- 13 -
respectively between 1981-82 and 1985-86. In unadjusted current dollarstotal dental school educational costs for residents rose from $27,000 in1981-82 to $37,000 in 1985-86. The same costs for nonresidents were$34,000 in 1981-82 and $48,000 in 1985-86. There is considerablevariation in costs by type of school attended. In 1985-86 residentstudents attending public dental schools averaged $23,000 in total dentaleducation costs; those in private State-related dental schools $52,000;and those in private dental schools $63,000 (American Dental Association,January 1986).
Optometric students' overall educational expenses, including tuition,fees, textbooks, instruments, room and board, and miscellaneouseducational costs (but not total living expenses), rose from $4,000 in
1977-78 to $6,810 in 1981-82 (a 70 percent increase) for residentstudents and from $5,400 in 1977-78 to $8,862 (62 percent) for non-residents of public institutions (ASCO, September 1984). At independentschools of optometry, these costs increased to $11,254 (up 73 percent)for residents and to $11,921 (up 67 percent) for nonresident students.
Tuition for optometric students increased an average of 52 percent forresident students and 64 percent for nonresident students at publicschools. During the same period, students at the independent collegesexperienced average tuition increases of 87 percent for residents and 73percent for nonresidents. Room and board costs also increased, an
average of 74 percent at public institutions and 53 percent atindependent schools. Such increases are above the rate of inflationduring this period.
There are seven active colleges of podiatric mediline currently inoperation, two of which were started in the last five years. All of thecolleges are private institutions and all except the two newest collegesare independently operated. The absence of significant State funding hasled the colleges to rely on tuition income for about 70 percent of theirtotal budgets. In 1985-86, the tuition rates at the seven collegesranged from $10,500 to $11,800 per year as compared to $7,500 to $8,900in 1982-83, an increase of approximately 30 percent (in adjusted dollars)in the last four years (AACPM, 1986). Specific data on other costs
associated with podiatric education are not available, but are likelyrelatively high since the colleges, with one exception, are located inmajor metropolitan areas.
DEVELOPMENTS IN FINANCING EDUCATION
Overview of Federally Supported Student Financial Assistance
A substantial portion of the financial assistance available to studentspursuing careers in the health professions continues to be provideddirectly or indirectly by the Federal Government. Recent trends in Stateand other sources of support are not currently available in acomprehensive form across health professions. However, where it is
available such information is presented in the occupation specificsections on financing which are presented later in this report.
The Federal Government's interest in the financing of health pgofessionseducation derives largely from its goal of assuring adequate access tohealth services. As such, perceptions of manpower shortages in the 1950sspurred legislation enacted in the 1960s which emphasized the training oflarger numbers of health personnel particularly by providing financialsupport to health professions training institutions in the form ofconstruction funds, start-up assistance and capitation incentives forincreasing class size. This legislation also stressed access of allpopulation groups to a health professions education through scholarships,low-cost subsidized loan availability, and programs which were targetedat providing support for minorities.
Beginning in the mid ?970s Federal financial support to healthprofessions training institutions in the form of capitation andconstruction grants was gradually reduced. It was felt that theincreased numbers of health professions graduates resulting fromprevious efforts were alleviating the perceived overall shortages ofhealth personnel. Instead emphasis shifted to improving the geographicand specialty distributions of health professionals. The phase out ofthe Health Professions Scholarship Program and the concomitant increasesin funding for the National Health Service Corps Scholarship program
(which has a service obligation aimed at improving the distribution ofhealth professionals) in part reflect that emphasis.
In more recent years, with apparent improvements in the distribution ofhealth personnel and more and more budgetary constraints, Federalfinancial aid efforts have increasingly incorporated the view that healthprofessions students should assume a larger part of the cost of theirprofessional education. Thus, while subsidized low-cost loan programscontinue to be available, the HPSL revolving loan program which istargeted to health professions students with exceptional financial needhas not received new Federal capital contributions since FY 1983. Newloans from this program are made from funds provided by the repayment ofold loans. On the other hand, a substantial part of the funds underFederal programs currently provided for health professions studentfinancial assistance are allocated to unsubsidized loans.
The discussion which follows presents the federally-supported studentfinancial assistance programs which are currently available to healthprofessions students and describes recent changes which have occurred inthese programs.
- 15 -
1.
25
Health professions students have access to Federal sources of financialaid designated especially for health professions training and to Federalsources available to all undergraduate and graduate students. Thoseprograms exclusively intended for health professions students include theHealth Professions Student Loans (HPSL), Health Education AssistanceLoans (HEAL) and Exceptional Financial Need First Year Scholarships (EFN)and a new program of scholarships for disadvantaged students withexceptional financial need (FADHPS). The National Health Service CorpsScholarships (NHSC ) and the Armed Forces Health Professions Scholarships(AFHPS) have also been used as resources in support of health professionseducation although they are intended primarily as means of alleviatinghealth manpower shortages in underserved areas and in the military ratherthan to provide general financial assistance.
Those Federal sources of financial aid which are available to allgraduate studedts, including health professions students, include theGuaranteed Student Loans (GSL), National Direct Student Loans (NDSL) andthe Auxiliary Loan for Assisting Students/Parent Loan to Undergraduate orGraduate Students (ALAS/PLUS). It is not possible to distinguish healthprofessions students from all other borrowers in the data reported fromthese sources.
The provisions of the federally-supported loan programs are summarized inTable 3. With the exception of the HEAL and ALAS/PLUS programs, all ofthe programs are subsidized by the Federal Government. The HEAL, GSL,and ALAS/PLUS carry a Federal guarantee of repayment. Additionally, inall programs except the HEAL and ALAS/PLUS programs, students mustdemonstrate that they are in need of financial assistance in order topursue their courses of study.
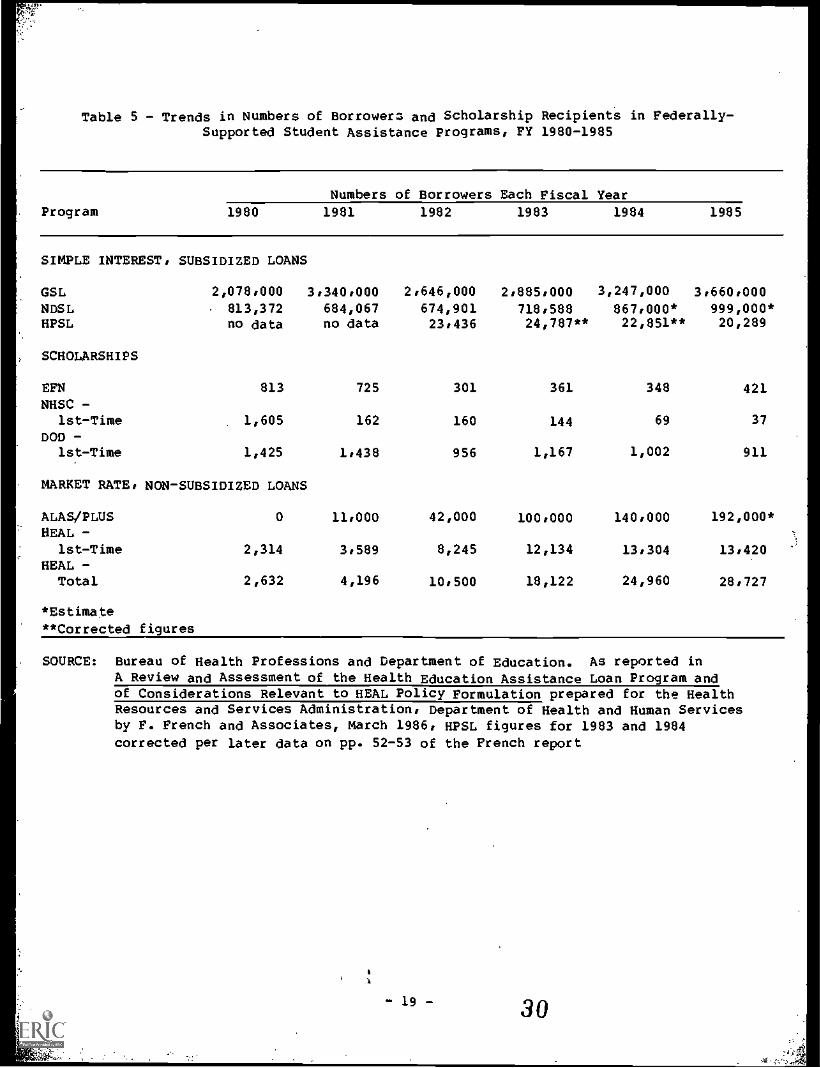
The data shown in Tables 4 and 5 illustrate the recent growth infederally-supported financial assistance in the form of unsubsidizedloans as well as the status of other sources. The number of EFNscholarships awarded declined from 813 in FY 1980 to 421 in FY 1985 andthe amount awarded dropped from about $10 million to approximately$7 million over this period. Declines in the number of scholarshipsreflect mandated increases in the scholarship amounts as well as thedecline in.funds available. A large part of the decline noted in Federalscholarships awarded over this period reflects the phasing down of theNational Health Service Corps Scholarship program which as previouslymentioned was not intended as a general source of student financial
assistance. The number of first-time recipients of these scholarshipsdeclined from 1,605 in FY 1980 to 37 in FY 1985. Similarly, the number
of borrowers receiving support from the subsidized HPSL program declinedby 3,147 from FY 1982 to FY 1985, while the total amount borrowed overthis period declined from $50 million to $44 million. As previouslymentioned, Federal capital contributions have not been made for thisprogram since 1983 and current lending levels are limited to the amountsstudents repay to schools' revolving funds. Approximately $49 millionhas been available each year from repayment of earlier loans.
In contrast to the direction that the HPSL and other resources used tofinance health professions education has taken, in general there has beenan increase in the use of loans as a means of financing professional
- 16-
26

Table 3 - Federal Student Loan Programs Available to Health Professions Students
Health EducationAssistance Loans(HEAL)
Health ProfessionsStudent Loan (HP8L)Program
Administered DHSS, MRS!:
by
Lender
Loan Limits
Eligible banks,schools, agencies,etc., using privatecapital.
$20,000 per year,$80,000 aggregate,to be used solelyfor tuition ndreasonable educa-tional expenses.
Interest Rate Unsubsidised interestat variable rates notto exceed tbe averagebond equivalent rateduring tbe priorcalendar quarter for91-day Treasury Sillssold at auction plus3%; interest accruesduring healtb pro-fessions acbooland residency.
Repayment 10-25 years, beginningRequirements 9-12 months after com-
pletion of training.Additional defermentfor up to 3 years forArmed Forces, PeaceCorps, VISTA, !MSC,or for full-timestudy at an eligibleschool.
SUNS, URSA
Eligible bealtb pro-fessions schonl.,using Federal andschool funds (9/1ratio) in revolvingfund.
Tuition plua $2,500per year. Noaggregate limit.Medical studentsgraduating after June30, 1979, must exhibit"exceptional financialseed."
92 beginning 12 montbsafter completion oftraining.
10 years, beginning 12months after leavingschool. Deferment upto 3 years for ArmedForces, Peace Corps,NH$C, Public Resit!)
Service, and until cos-p-etion of furtheradvanced professionaltraining, including in-ternship end residency.
GuaranteedLoan (GSL)Department
Student National Direct StudentPrIrii_t=_,AS/P1MoramLoanOIDSamSo Education Department o Educat on Department o
Education
Eligible banks, schools,etc., State agenciesand designated non-profit agencie. wingprivate capital.
for graduate/profee-sional $5,000 annual,$25,000 aggregate in-cluding enountborrowed as under-graduate; need. testdetermine. limitsfor families $30,000income.
72 for audent. whocurrently have 7% GSL.;92 for new loan..Begins 6-12 monthsafter graduation forsubsidized loans, im-mediately for non -qualified etudents.
10-year limit frombeginning of repay-ment (9-12 mos.) afterleaving school for 72GSL., 6 mos. for otbers).Up to $ years defermentfor Armed Forces, PublicHealth Service Commis-sioned Corps; PeaceCorps, etc.
Eligible schools usingFederal and school funds(9/1 ratio) in revolvingfund.
$12,000 aggregate limitfor higher education botbgraduate and undergraduate.
5% beginning 6 monthsafter graduation.
10-year limit beginning6 month. after leavingschool. Deferment up to3 years for Armed ForcesPeace Corps, furtber 1/2tine enrollment, 2 yearsfor internship orresidency.
Eligible banks,schools, etc.,State agenciesand designatednon-profitagencies usingprivate capital.
$3,000 per yearnot more than$15,000 cumula-tively.
122 annually pay-able by theborrower within60 days of tbeday tbe loan i.made.
Student borrowersmay qualify for 4deferment of re-payment of prin-cipal if they areenrolled fulltime. Payment ofinterest is: dueduring any defer-ment period.
SOURCE: Division of Student Assistance, Bureau of Health Professions, Health Resources and Services Admi:istration
2827
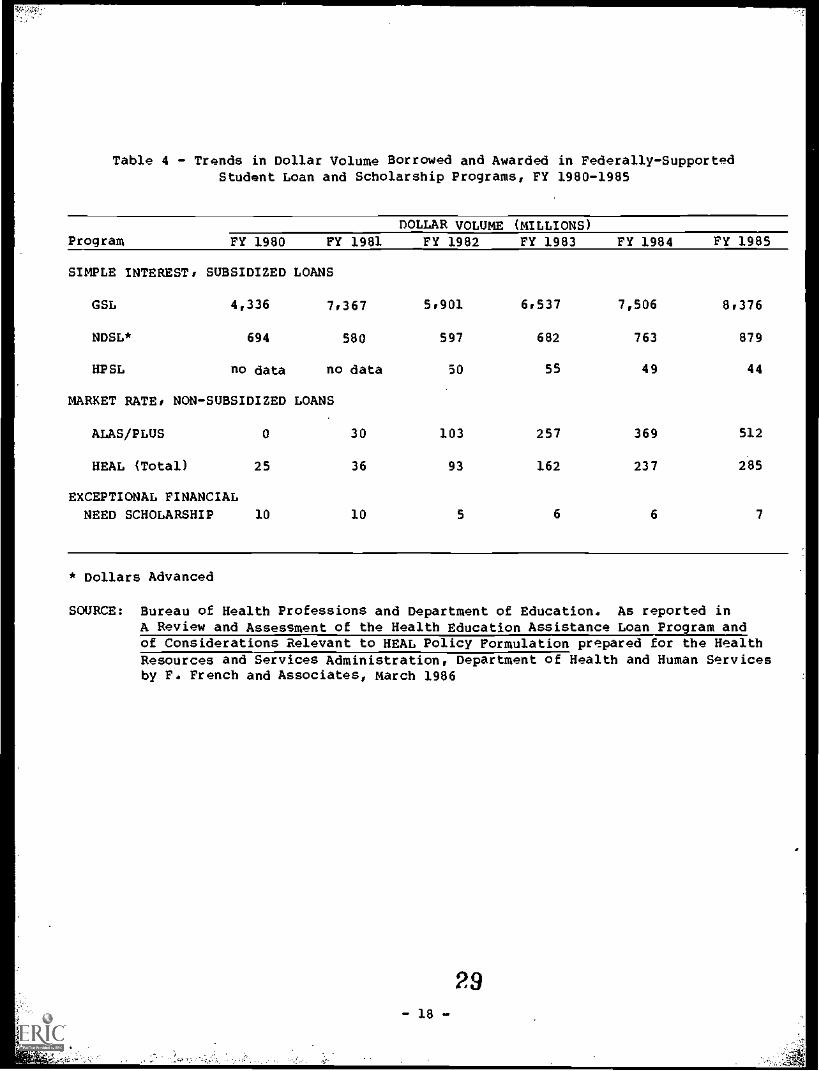
Table 4 - Trends in Dollar Volume Borrowed and Awarded in Federally-SupportedStudent Loan and Scholarship Programs, FY 1980-1985
DOLLAR VOLUME (MILLIONS)Program FY 1980 FY 1981 FY 1982 FY 1983 FY 1984 FY 1985
SIMPLE INTEREST, SUBSIDIZED LOANS
GSL 4,336 7,367 5,901 6,537 7,506 8,376
NDSL* 694 580 597 682 763 879
HPSL no data no data 50 55 49 44
MARKET RATE, NON-SUBSIDIZED LOANS
ALAS/PLUS 0 30 103 257 369 512
HEAL (Total) 25 36 93 162 237 285
EXCEPTIONAL FINANCIAL
NEED SCHOLARSHIP 10 10 5 6 6 7
* Dollars Advanced
SOURCE: Bureau of Health Professions and Department of Education. As reported inA Review and Assessment of the Health Education Assistance Loan Pro ram andof Considerations Relevant to HEAL Policy Formulation prepared for the HealthResources and Services Administration, Department of Health and Human Servicesby P. French and Associates, March 1986
- 18 -
29
6_
Table 5 - Trends in Numbers of Borrowera and Scholarship Recipients in Federally-Supported Student Assistance Programs, FY 1980-1985
ProgramNumbers of Borrowers Each Fiscal Year
1980 1981 1982 1983 1984 1985
SIMPLE INTEREST, SUBSIDIZED LOANS
GSL 2,078,000 3,340,000 2,646,000 2,885,000 3,247,000 3,660,000
NDSL 813,372 684,067 674,901 718,588 867,000* 999,000*HPSL no data no data 23,436 24,787** 22,851** 20,289
SCHOLARSHIPS
EFN 813 725 301 361 348 421NHSC -
1st-Time 1,605 162 160 144 69 37
DOD -1st-Time 1,425 1,438 956 1,167 1,002 911
MARKET RATE, NON-SUBSIDIZED LOANS
ALAS/PLUS 0 11,000 42,000 100,000 140,000 192,000*HEAL -
1st-Time 2,314 3,589 8,245 12,134 13,304 13,420HEAL -Total 2,632 4,196 10,500 18,122 24,960 28,727
*Estimate**Corrected figures
SOURCE: Bureau of Health Professions and Department of Education. As reported inA ReVieW and Assessment of the Health Education Assistance Loan Program andof Considerations Relevant to HEAL Policy Formulation prepared for the HealthResources and Services Administration, Department of Health and Human Servicesby F. French and Associates, March 1986, HPSL figures for 1983 and 1984corrected per later data on pp. 52-53 of the French report
- 19 - 30
education. The HEAL program in particular has grown phenomenally sinceits inception in 1979. In its first 3 years of operation there were7,891 borrowers with $69.2 million guaranteed. In Fiscal Year 1985 therewere 28,727 borrowers with $284.7 million in loans guaranteed.Variations in the cumulative numbers and amount of loans disbursed forindividual disciplines are illustrated in Table 6. By the end of FY1986, over one billion dollars in loans will have been guaranteed.
With the increasing reliance on loans as a principal means of financialassistance for health professions students has come increasing concernand attention on issues associated with high levels of indebtedness.
While this report focuses on the issue of the effects of highindebtedness levels on career choices of health professions graduatesthere are other issues and concerns related to increasing indebtednesslevels which are the subject of a number of recent studies. These issuesinclude the assessment of the abilities of health professions graduatesto repay the debts incurred and the expanded need for improvement in debtmanagement on the part of lenders as wall as insurers, and financialcounseling of health professions students. A number of studies whichhave a bearing on such issues have been identified and are listed asreferences at the end af this report. However, thA interrelationship
among the various issues related to high levels of student indebtednessare not clear at the present time and need to be examined carefully.
31- 20 -
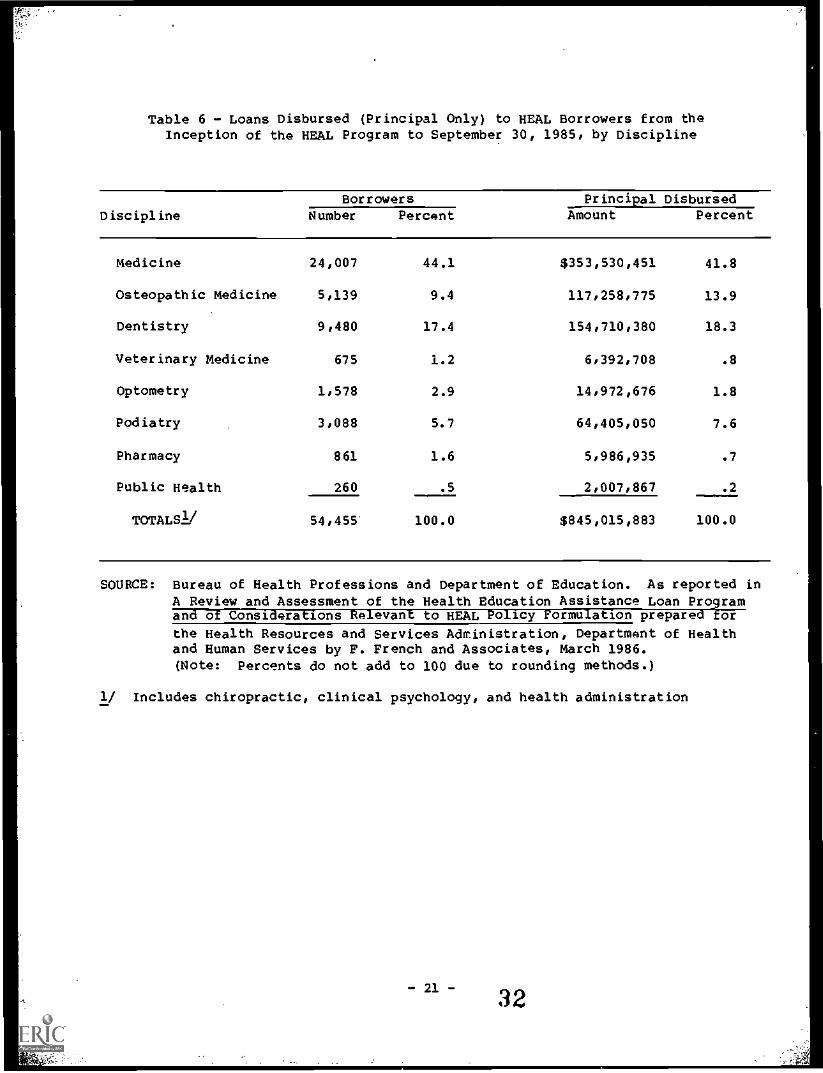
Table 6 - Loans Disbursed (Principal Only) to HEAL Borrowers from theInception of the HEAL Program to September 30, 1985, by Discipline
DisciplineBorrowers Principal Disbursed
Number Percent Amount Percent
Medicine 24,007 44.1 $353,530,451 41.8
Osteopathic Medicine 5,139 9.4 117,258,775 13.9
Dentistry 9,480 17.4 154,710,380 18.3
Veterinary Medicine 675 1.2 6,392,708 .8
Optometry 1,578 2.9 14,972,676 1.8
Podiatry 3,088 5.7 64,405,050 7.6
Pharmacy 861 1.6 5,986,935 .7
Public Health 260 .5 2,007,867 .2
TOTALS1/ 54,455 100.0 $845,015,883 100.0
SOURCE: Bureau of Health Professions and Department of Education. As reported inA Review and Assessment of the Health Education Assistance Loan Programand of Considerations Relevant to HEAL Policy Formulation prepared TEor
the Health Resources and Services Administration, Department of Healthand Human Services by F. French and Associates, March 1986.(Note: percents do not add to 100 due to rounding methods.)
1/ Includes chiropractic, clinical psychology, and health administration
- 21 - 32
Profession Specific Education Financing Developments
Medicine
As the cost of obtaining a medical education has increased, the totalamount of financial assistance awarded to medical students has alsoincreased. However, fewer students are currently receiving assistanceand the sources and forms of this assistance are changing. In 1984-85,68 percent of the 67,090 students enrolled in medical school receivedfinancial assistance, through 118,430 loan, scholarship and work studyawards totaling $506 million as compared with 78 percent of the 66,485enrolled students in 1981-82 who received 117,600 awards totaling $465million.
Although the number of awards and total dollars awarded for financialassistance from non-Federal sources have increased, the FederalGovernment remains the principal source of financial assistance formedical students. Financial assistance to medical students from Federalloan and scholarship programs has accounted for approximately 80 percent
of total student assistance funds over the past five years. However, theform of this assistance continues to change. Federal dollars for
scholarship awards declined from more than 68 percent to 55 percent ofavailable scholarship assistance, dollars for loans under Federalprograms stabilized at slightly more than 90 percent of all loan fundsavailable for student assistance between 1980-81 and 1984-85 (see Tables7 and 8).
During this five-year period medical students received about the samenumber of scholarships overall although the total funds for thesescholarships declined about 10 percent. The number of scholarshipsawarded from non-Federal sources increased by 3,882 while the number fromFederal sources declined by 3,886. On the other hand, the number ofloans awarded from both Federal and non-Federal sources increased by morethan one-fourth over this period.
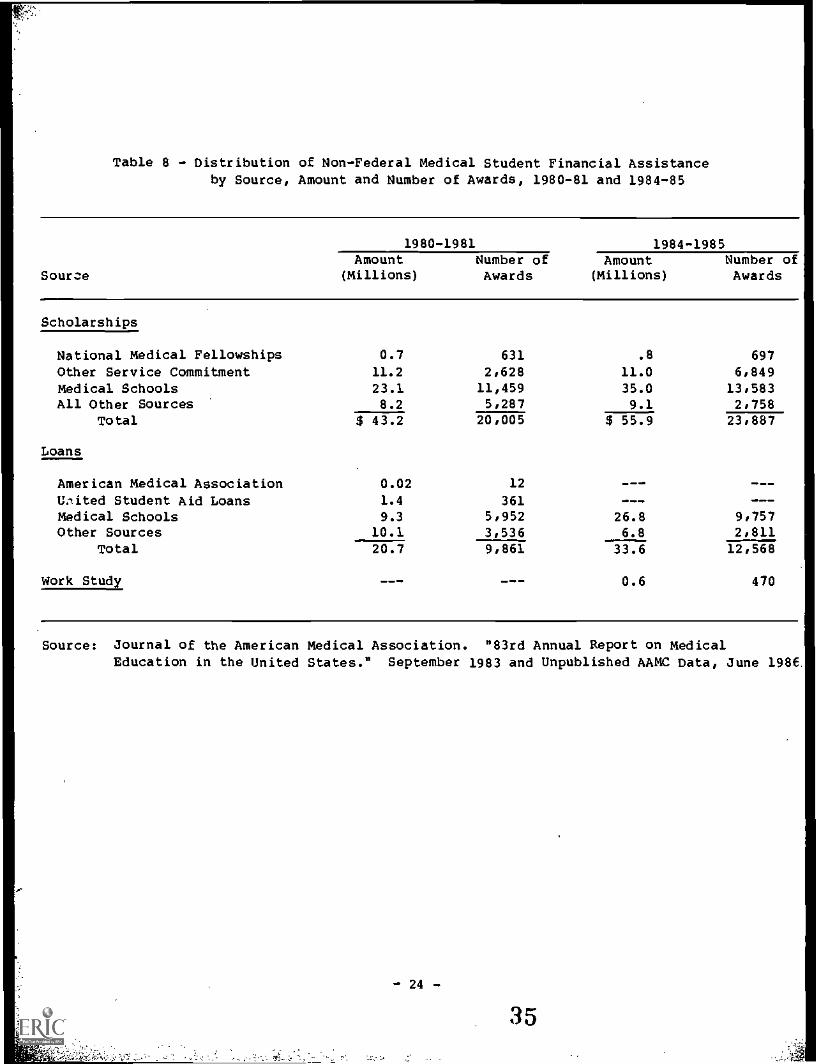
Approximately 62 percent of non-Federal financial assistance in 1984-85was provided in the form of scholarships and about 38 percent in loans.In contrast, dollars awarded for loans under Federal programs outnumberedthose awarded for scholarships by more than five to one. Most of theoverall decline in Federal scholarship assistance can be attributed to
reductions in the National Health Service Corps (NHSC) Scholarshipprogram. Although this program has been used as a resource in financingmedical education, it was designed to obtain the services of trainedhealth professionals in certain areas of critical need and was not
intended as a student financial assistance program. Between 1980-81 and1984-85, the average NHSC scholarship award increased from $12,300 to$16,100, while total funds available through this program decreased from$50 million to $4 millIon and the number of students receiving theseservice-related scholarships declined from 4,079 to 246 recipients. Partof the decline in NHSC service-related support has been offset by the
increase in smaller, non-Federal scholarships which usually award lessthan $2,500 a year for support.
- 22- 33
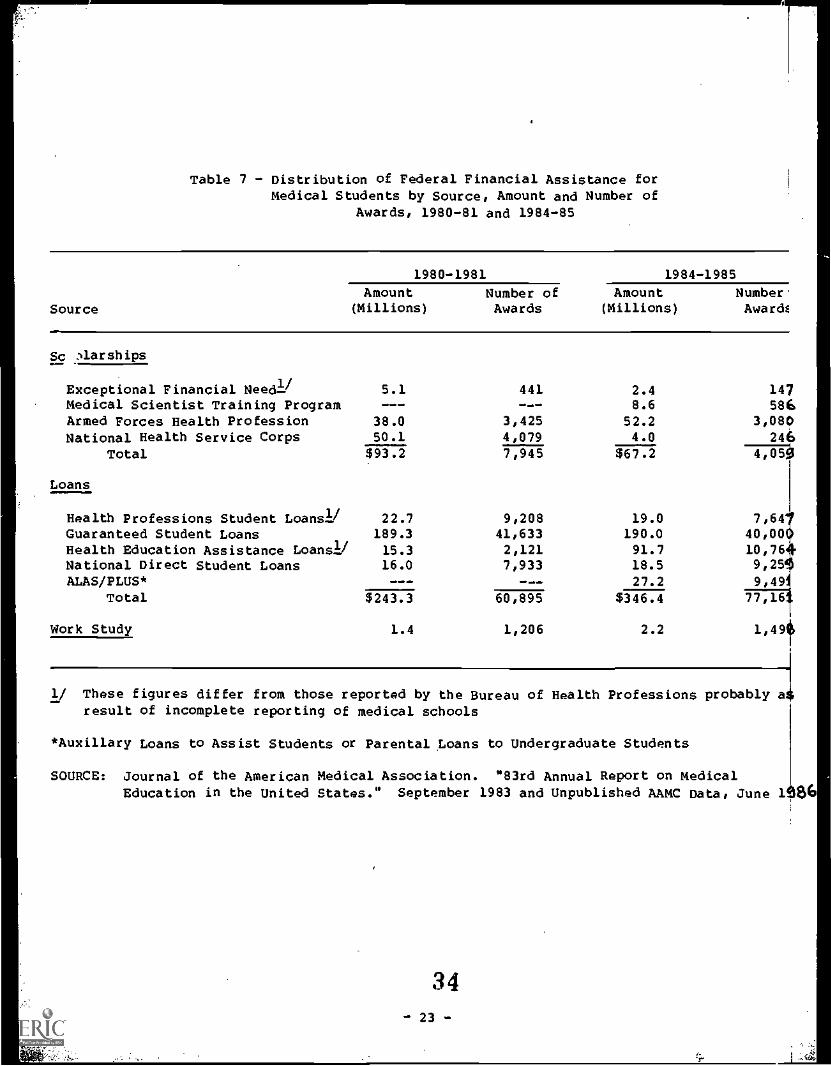
Table 7 - Distribution of Federal Financial Assistance forMedical Students by Source, Amount and Number of
Awards, 1980-81 and 1984-85
1980-1981 1984-1985
Amount Number of Amount Number.Source (Millions) Awards (Millions) Award4
Sc Aarships
Exceptional Financial NeedliMedical Scientist Training ProgramArmed Forces Health ProfessionNational Health Service Corps
Total
5.1---
38.050.1
441---
3,4254,079
2.48.6
52.24.0
147586
3,080246
$93.2 7,945 $67.2 Ei:151
Loans
Health Professions Student Loansli 22.7 9,208 19.0 7,64Guaranteed Student Loans 189.3 41,633 190.0 40,00Health Education Assistance Loans]] 15.3 2,121 91.7 10,76National Direct Student Loans 16.0 7,933 18.5 9,2ALAS/PLUS* --- --- 27.2 9,49
Total $243.3 60,895 $346.4 77,16
Work Study 1.4 1,206 2.2 1,49
1/ These figures differ from those reported by the Bureau of Health Professions probably aresult of incomplete reporting of medical schools
*Auxillary Loans to Assist Students or Parental ,Loans to Undergraduate Students
SOURCE: Journal of the American Medical Association. "83rd Annual Report on MedicalEducation in the United States." September 1983 and Unpublished AAMC Data, June lt106
34- 23 -
,
Table 8 - Distribution of Non-Federal Medical Student Financial Assistanceby Source, Amount and Number of Awards, 1980-81 and 1984-85
Scholarships
1980-1981 1984-1985Amount Number of Amount Number of
(Millions) Awards (Millions) Awards
National Medical Fellowships 0.7 631 .8 697
Other Service Commitment 11.2 2,628 11.0 6,849Medical Schools 23.1 11,459 35.0 13,583All Other Sources 8.2 5,287 9.1 2,758
Total $ 43.2 20,005 $ 55.9 23,887
Loans-American Medical Association 0.02 12 ...,,,,..., 010.
U:tited Student Aid Loans 1.4 361 --- moomw
Medical Schools 9.3 5,952 26.8 9,757Other Sources 10.1 3,536 6.8 2,811
Total 20.7 9,861 33.6 12,568
Work Study --- --- 0.6 470
Source: Journal of the American medical Association. "83rd Annual Report on medicalEducation in the United States." september 1983 and Unpublished AAMC Data, June 198f
Another Federal service-obligation scholarship program, the Armed ForcesHealth Professions (AFHP) program has increased the amount of scholarshipfunds awarded to medical students from $38 to $52 million over the pastfive years. Although the number of recipients has remained fairlystable, the average award increased so percent in current dollars between1980 and 1984, from $11,103 to $17,000 (JAMA, 1982 and 1985).
Non-Federal scholarships are provided by National Medical Fellowships,Inc., State governments and State medical societies, medical schools,philanthropic and other private organizations. These sources providedalmost 32 percent of all scholarship assistance in 1980-81 with awardstotaling $43 million dollars. In the 1984-85 academic year, thesesources provided 45 percent of scholarship aid totaling $56 million(Table 8).
Financial assistance from loans increased in current dollars from 66 to77 percent of total assistance awarded to medical students between1980-81 and 1984-85. Federally guaranteed loans were the major providersof this increase, although private and State funds for loans increasedsubstantially during this period.
Funds'awarded to medical students from the federally-subsidized HealthProfessions Student Loans (HPSL) decreased slightly from $23 million in1980-81 to $19 million in 1984-85 while the number of loans awardeddecreased from 9,210 to 7,6501/ These loans are limited to medicalstudents who demonstrate exceptional financial need and the average awardin 1984-85 was small, about $2,500.
Guaranteed student loan funds awarded to medical students increasedmoderately between 1980-81 and 1984-85 to $190 million. Beginning in theFall of 1981, students were required to prove eligibility for financialassistance if family income was over $30,000. The number of loans hasedged down since then, from 41,600 to 40,000. The interest rates onthese loans vary from 7 percent to 9 percent and medical students do notpay interest on them until after graduation; repayment may be deferredfor residency training for up to 2 years. The average amount of theseloans was about $4,500 in 1984-85 (JAM, 1983 and 1985).
The Health Education Assistance Loan (HEAL) program is the major non-subsidized Federal loan available to medical students. Borrowers mustpay an insurance premium charge and interest at or near commercial loanrates and the amounts borrowed are accrued and compounded during medicalschool and residency training or other deferment periods. Because of the
1/ These figures as reported by AAMC may differ somewhat from figuresreported by the Bureau of Health Professions for several reasonsincluding an incomplete number of schools reporting to the AAMC. Theintent of this section is to present a profile of student financialassistance according to the sources. Therefore, AAMC figures areused since BHPr data do not show assistance derived from non-Federalsources.
- 25 -
36

high rate of interest these loans carry and the implications of highrepayments which some students may be unaware of or not be able tomanage, there is concern about their rapid growth.
According to information from the AAMC, between academic years 1980-81and 1984-85, the amount of HEAL loans obligated to medical studentsincreased from $15 to $92 million while the number of students obtainingthese loans grew from 2,100 to 10,800.
As previously ikentioned, there has also been substantial growth innon-Federal loans from school funds, some State governments,philanthropic foundations and other private organizations. In 1980-81,such sources provided 11,000 loans totaling $22 million in financialassistance. By 1985, the amount of funds from these sources had grown to$61 million and more than 22,600 non-Federal awards were made.
Some observers believe that as tuition and fees continue to increase, theavailable methods of financing a medical education may again become acritical variable in determining career choice (Hall and Whybrow, 1984).One study has indicated that some of the Nation's more expensive schoolshave already included the ability to pay as an admission criterion andpoints to the possibility that more schools will place greater emphasis
on future students' ability to finance their medical education as part ofthe selection process (Shea and Fullilove, 1983). However, thisoccurrence could be balanced by other schools that have not and will notinclude the ability to pay as admision criteria.
Data from 1979-80 through 1983-84 show that in osteopathic medicine as inallopathic medicine, scholarships diminished as a source of financialassistance and more osteopathic students obtained loans to finance theireducation. The number of scholarships awarded decreased from 1,532 for12 schools reporting in 1979-80 to 1,279 for 14 reporting schools in1983-84, while the number of loans more than doubled, from 5,162 to10,730. Scholarship assistance awarded to osteopathic studentsrepresented 23 percent of total assistance awarded in 1979-80 anddecreased by more than one-half to 11 percent of 1983-84 assistance.
About three out of four scholarships awarded to osteopathic students in1979-80 were made through the National Health Service Corps (NHSC) or theArmed Forced Health Professions Scholarships (AFHPS) programs; only 46percent of the 1983-84 awards were from these sources. Most of thechange can be attributed to reductions in the NHSC program, whichdeclined from 33 percent to 8 percent of available scholarship assistanceduring this period. Although the number of AFHPS decreased slightly,
these scholarships accounted for 38 percent of all scholarships awardedand provided 67 percent of 1983-84 scholarship funds.
While the tota). number of Federal awards (AFHP and NHSC) decreased,scholarships from osteopathic associations, State governments and othernon-Federal sources doubled during this period, from 26 to 54 percent ofall awards of this 54 percent, 0 :eopathic associations provided6 percent of 1983-84 scholarships, State governments provided 14 percent,and other sources contributed 34 percent.
- 26 - 37
During the 1979-80 academic year 70 percent of the loans students madewere*obtained under federally-subsidized loan programsGuaranteedStudent Loans (GSLs) accounted for almost half of all loans, whileNational Direct Student Loans represented 12 percent and HealthProfessions Student Loans 10 percent. In 1983-84, Federal loan programsaccounted for 84 percent of student loans, but federally-subsidized loanshad decreased to 59 percent of total financial assistance while almost 25percent of student loans were nonsubsidized loans under the HealthEducation Assistance Loan (HEAL) program. HEAL loans accounted for 50percent of total loan funds borrowed in 1983-84.
Dentistry
Like other health professions students, dental students have increasinglyutilized loans to finance their education. More than 95 percent of allseniors borrowed from at least one loan source in 1984 (Solomon, 1984).Since 1978, the distribution of loan sources utilized by dental studentshas changed noticeably (Table 9). The percent of students using NationalDirect Student Loans more than doubled from 19 percent in 1978 to 39percent in 1984. In the same period, the percentage of students usingFederal health professions loans dropped from 44 percent to 38 percent,while Guaranteed Student Loans rose from 54 percent to 87 percent andHealth Education Assistance Loans rose from 6 percent (in 1979 when theprogram began), to 26 percent in 1984. Use of personal bank loansdeclined in this period from 14 percent to 8 percent and family and otherloans rose from 41 percent to 54 percent (Solomon, 1984).
Prom 1978 to 1984, the proportion of dental students receivingscholarships and grants has remained fairly stable at around 40 percent.However, the sources of these scholarships has changed during thisperiod. The percent of students receiving Armed Forces HealthProfessions scholarships decreased from 7 percent in 1978 to .2 percentin 1984. National Health Service Corps scholarships were awarded to 2percent of dental students in 1978 rising to 5 percent in 1982 butdropping to 3 percent in 1984. The percent of students receiving Statescholarships or grants dropped from 13 percent in 1978 to 9 percent in1984 while school scholarships or grants increased from 16 percent to 20percent (Solomon, 1984).
Families contribute significantly to finance the dental student'seducation. Among graduates in 1979-81, the average family contributionper student was $3,680 while family loans averaged $3,584. The averagesize of family gifts varies greatly with family income. In 1979-81, theaverage gift amount from families earning $10-20,000 per year was $1,973while the average gift amount for families earning over $80,000 per yearwas almost $11,000 per student (House, 1985).
Spouses contribute significantly to the financial pool of married dentalstudents. During the period 1979-81, among those students who hadspouses earning income, the mean earned spousal income was over $30,000.In contrast, among all students who worked, total earnings were only$9,000 and total other income was about $11,000 (House, 1985). Thus,'spousal income of married dental students is a very significant part oftotal married student income.
- 27 -
38
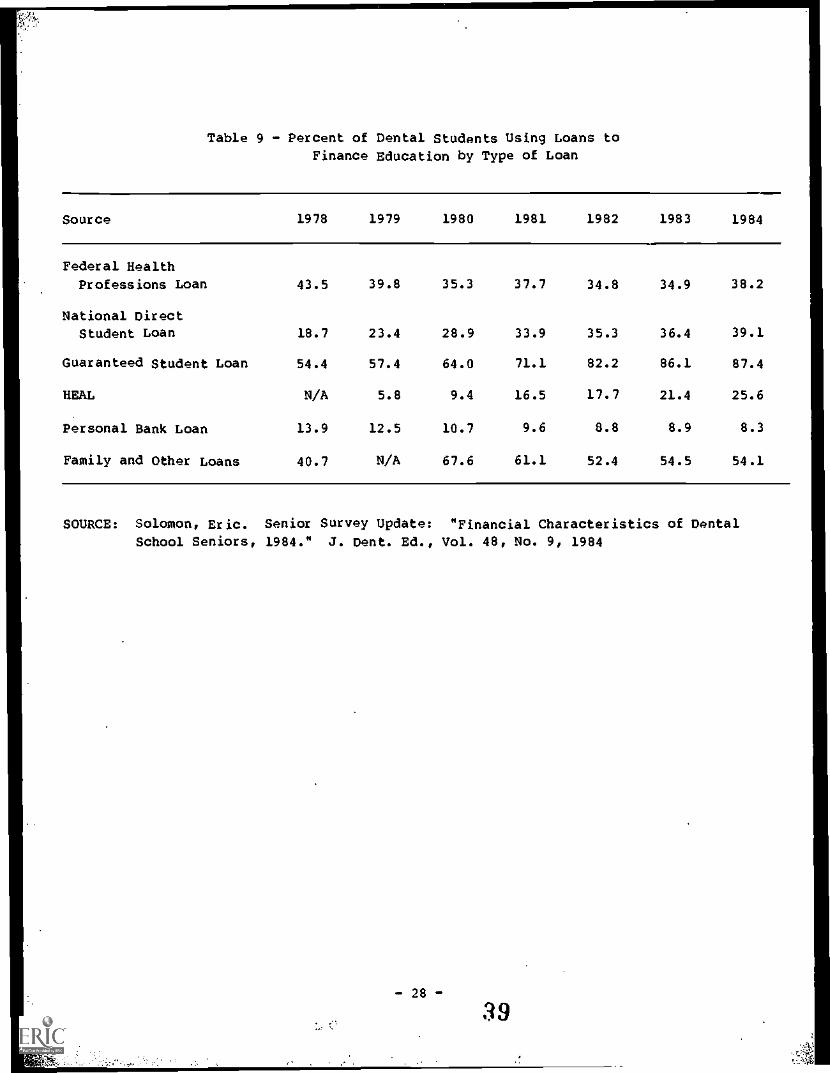
Table 9 - Percent of Dental Students Using Loans toFinance Education by Type of Loan
Source 1978 1979 1980 1981 1982 1983 1984
Federal Health
Professions Loan 43.5 39.8 35.3 37.7 34.8 34.9 38.2
National Direct
Student Loan 18.7 23.4 28.9 33.9 35.3 36.4 39.1
Guaranteed Student Loan 54.4 57.4 64.0 71.1 82.2 86.1 87.4
HEAL N/A 5.8 9.4 16.5 17.7 21.4 25.6
Personal Bank Loan 13.9 12.5 10.7 9.6 8.8 8.9 8.3
Family and Other Loans 40.7 N/A 67.6 61.1 52.4 54.5 54.1
SOURCE: Solomon, Eric. Senior Survey update: "Financial Characteristics of Dental
School Seniors, 1984." J. Dent. Ed., Vol. 48, No. 9, 1984
Optometry
During the 1977-82 period increasing numbers of students sought financialassistance (ASCO, September 1984). Borrowing increased in the publicinstitutions from an average of 33 percent of the student body in 1977-78to 49 percent in 1981-82. At independent schools, borrowers usinginstitutional resources increased from 38 percent to 61 percent of the
student body.
The total available loan, scholarship and other funds administered by theschools accounted for less than 30 percent of the average studentexpenses during the academic year. Students thus had to call on otherfunding sources as well as savings, earnings, and spouse's income for thelarger amount of required expenses.
According to recent data gathered from institutions in optometry byApplied Management Sciences (AMS, 1985) the level of borrowing as apercentage of total student educational costs ranged from 76 percent forfirst-year students to 88 percent for fourth-year students.
Podiatric Medicine
Table 10 summarizes the trends in financial aid received by podiatricmedical students. The proportion of students receiving aid increasedfrom 49 percent in 1974-75 to 93 percent in 1984-85 and the averageamount of aid per student increased ninefold from $1,500 to $13,500during the same 11-year period. Over 80 percent of student financial aidin 1984-85 came from Health Education Assistance Loans (HEAL) andGuaranteed Student Loans (GSL) (Table 11). Although GSL is the preferredprogram, borrowing limits have required podiatry students to obtain overhalf of their total aid from the HEAL program. The shift from GSL toHEAL occurred in 1983 for many students when an income cap of $30,000 wasinitiated by the GSL program.
- 29 -
40
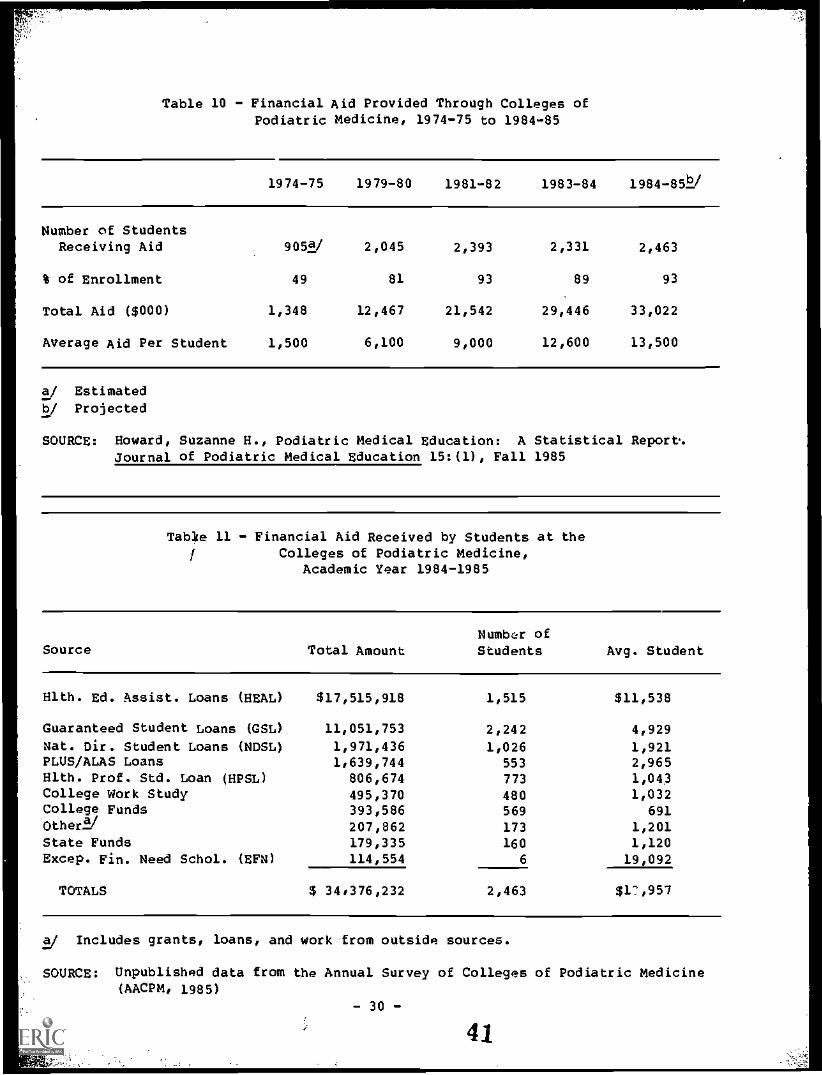
Table 10 - Financial Aid Provided Through Colleges ofPodiatric Medicine, 1974-75 to 1984-85
1974-75 1979-80 1981-82 1983-84 1984-85Y
Number of StudentsReceiving Aid 905s/ 2,045 2,393 2,331 2,463
% of Enrollment 49 81 93 89 93
Total Aid ($000) 1,348 12,467 21,542 29,446 33,022
Average Aid Per Student 1,500 6,100 9,000 12,600 13,500
a/ Estimatedb/ Projected
SOURCE: Howard, Suzanne H., Podiatric Medical Education: A Statistical Report'.Journal of Podiatric Medical Education 15:(1), Fall 1985
Table 11 - Financial Aid Received by Students at theColleges of Podiatric Medicine,
Academic Year 1984-1985
Source Total AmountNumbcIr of
Students Avg. Student
Hlth. Ed. Assist. Loans (HEAL) $17,515,918 1,515 $11,538
Guaranteed Student Loans (GSL) 11,051,753 2,242 4,929Nat. Dir. Student Loans (NDSL) 1,971,436 1,026 1,921PLUS/ALAS Loans 1,639,744 553 2,965Hlth. Prof. Std. Loan (HPSL) 806,674 773 1,043College Work Study 495,370 480 1,032college Funds 393,586 569 691Other2/ 207,862 173 1,201State Funds 179,335 160 1,120Excep. Fin. Need Schol. (EFN) 114,554 6 19,092
TOTALS $ 34,376,232 2,463 $17,957
a/ Includes grants, loans, and work from outside sources.
SOURCE: Unpublished data from the Annual Survey of Colleges of Podiatric Medicine(AACPM, 1985)
- 30 -
41
TRENDS IN INDEBTEDNESS
While the availability of loans has provided a means for financing arelatively expensive health professions education, the necessity ofborrowing increasingly larger amounts at higher rates in order to coverrising costs, is resulting in increasingly high levels of student andgraduate indebtedness. There is evidence of rising indebtedness in alldisciplines as the following discussion of discipline specific trendsindicates. The mean educational debts of senior medical studentsincreased from $17,200 to almost $27,000, in current dollars, between1980 and 1984. During this period, the number of students reporting debtrose from 77 to 88 percent of the senior class. The number of studentsreporting debts of $30,000 or more increased by half between 1983 and1984, reaching 36 percent of 1984 graduates (JAMA, 1985).
Private medical school students have significantly higher debts thanpublic medical school students. In 1981-82, medical students attendingprivate schools had median educational debts of $24,200. By 1983-84,their debts had increased 22 percent in current dollars, to $29,900.Median debt among public medical school students rose 19 percent duringthis period, from $19,000 to $22,700. The median debt accumulated bYstudents attending private medical schools in 1983-84 was 30 percentgreater than that of their public school counterparts (rable 12). It has
been estimated that a continuation of the current rate of increase in themean debt of private medical school graduates would result in averagedebt level in 1992 of $78.200 in current dollars.
The proportion of senior osteopathic students graduating with debt hasremained at about 92 percent over the last several years. However, thelevel of indebtedness has increased significantly. Within the one-yearperiod between 1983 and 1984, the average indebtedness of graduatingstudents increased 30 percent, from $31,000 to $40,000, while theproportion of students who indicated they owed $40,000 or more increasedfrom 25 to 43 percent of the senior class.
Students who attended private osteopathic medical schools have higherdebts than those attending public schools. In 1982-83, seniors whoattended public osteopathic medical schools had an average educationaldebt of $25,400 while the average debt of their private schoolcounterparts, at $33.500, was higher by one-third.
Between 1984 and 1985, the average debt for all graduating dental schoolseniors increased by more than 13 percent to $36,300. During that year,debt for seniors at public dental schools increased 8 percent, atState-related private dental schools by 13 percent and at other privatedental schools by 16 percent. Between 1978 and 1985, the average debt ofgraduating dental school seniors increased 70 percent in inflation-adjusted dollars.
A study of educational loan indebtedness at one Midwest school ofoptometry indicated that the level of indebtedness among graduates ofthat school is increasing steadily. In 1981, for example, the average
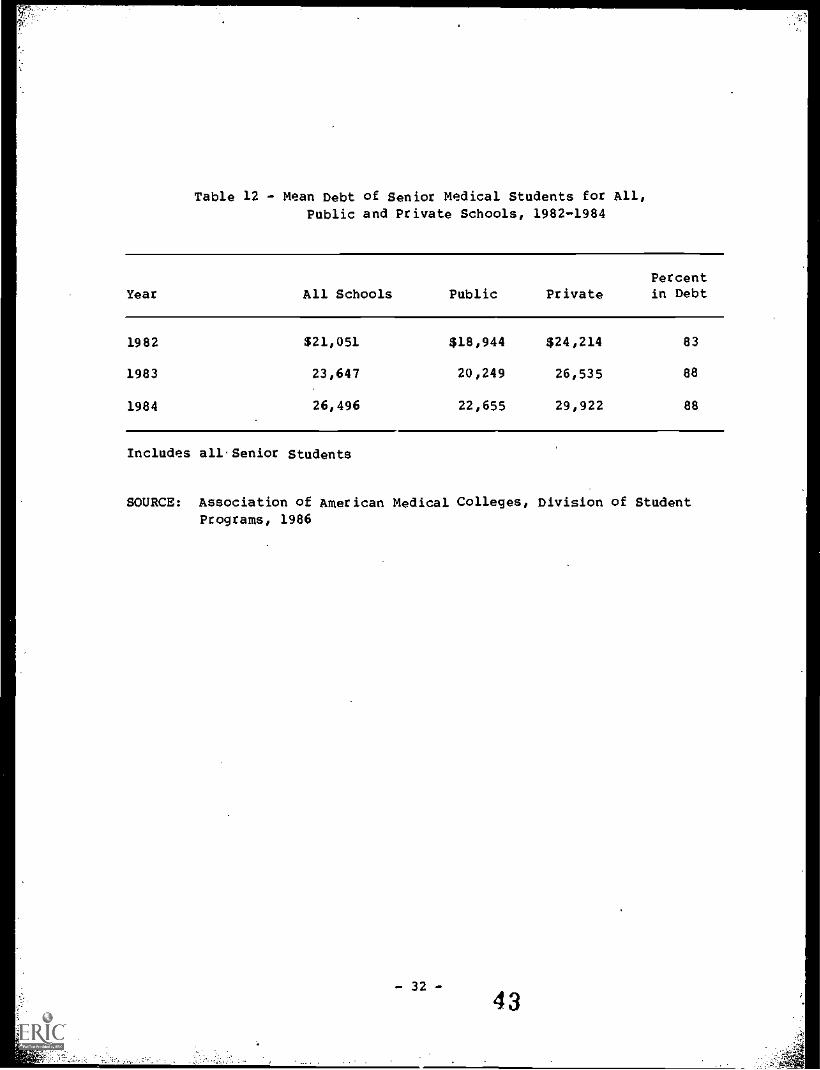
Table 12 - Mean Debt of Senior Medical Students for All,Public and Private Schools, 1982-1984
YearPercent
All Schools Public Private in Debt
1982 $21,051 $18,944 $24,214 83
1983 23,647 20,249 26,535 88
1984 26,496 22,655 29,922 88
Includes all.Senior Students
SOURCE: Association of American Medical Colleges, Division of Student
Programs, 1986
- 32 -
43
amount of loan indebtedness was $18,265, in 1983 the figure had risen to$24,710. In 1982, 95 percent of the graduates had educational loanindebtedness.
Table 13 shows the average level of accumulated debt incurred by podiatrystudents in 1985 by academic year. Student indebtedness increases from$5,500 at entry to nearly $50,000 at graduation (AACPM. 1986).
According to annual surveys of the graduating classes of schools ofveterinary medicine, the level of indebtedness of those students is alsoincreasing steadily. The mean educational indebtedness of 1985 graduateswas $22,252, up 8.3 percent from the level of $20,540 for the 1984graduates, which in turn represented a 8.7 percent increase over thelevel of $18,897 for 1983 graduates. The proportion of veterinarygraduates who are over $20.000 in debt has increased significantly from26 percent of all graduates in 1983 to 42 percent in 1985 (Wise, 1986).
Two recent studies have shown that student debts are increasing for thosewith public health degrees. Also, one study reported that the averagestudent graduated with a debt of $4.600 which is relatively low whencompared with disciplines discussed earlier. However, this figure didnot include debts they may have incurred in obtaining their basicmedical, engineering, or other degree. The same study also showed thatover 50 percent of the students depended on traineeships, scholarships,fellowships, and grants as the primary source for financing theireducation. The study concluded that, "Most of these monies come fromFederal programs, and I think we will continue to see schools of publichealth rely upon these funds" (Licwinko, 1982).
A study of health administrators employed in 1979-1983 reported that the1983 graduating class had an education7related indebtedness of $8,500, upmore than 50 percent since 1981 (Korn/Ferry, 1984).
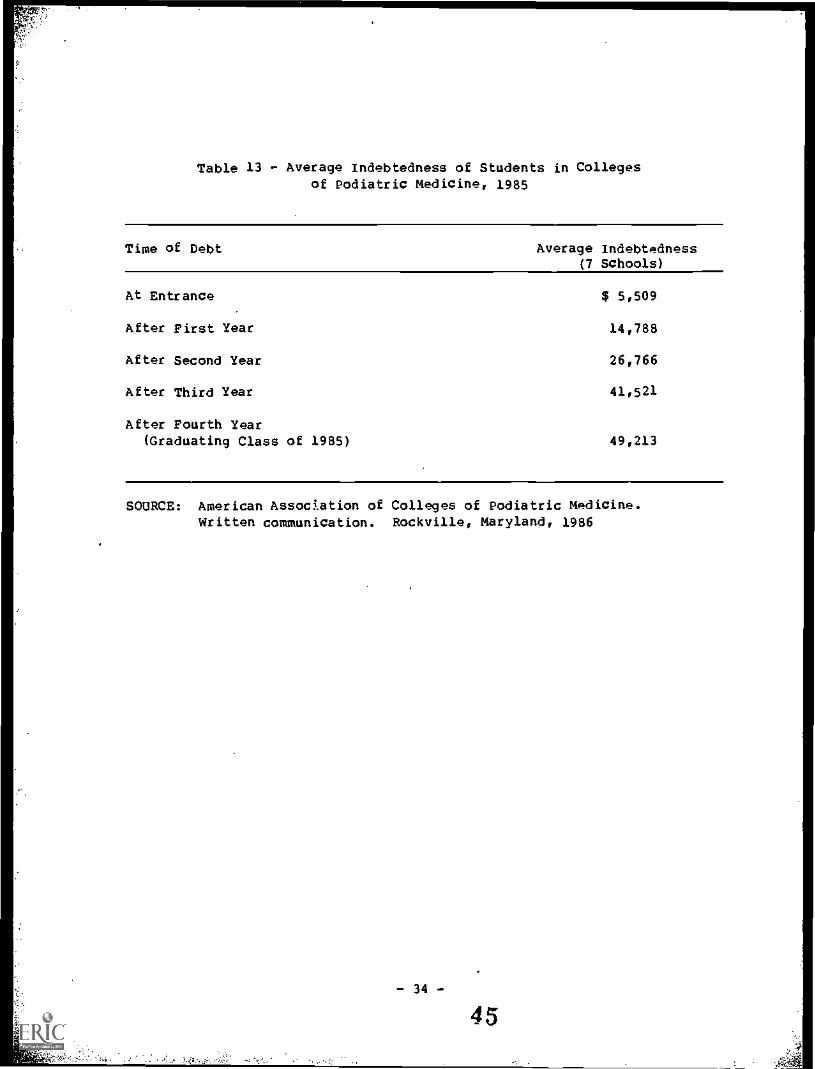
Table 13 - Average Indebtedness of Students in Collegesof Podiatric Medicine, 1985
Time of Debt Average Indebtedness(7 Schools)
At Entrance $ 5,509
After First Year 14,788
After Second Year 26,766
After Third Year 41,521
After Fourth Year(Graduating Class of 1985) 49,213
SOURCE: American Assockation of Colleges of Podiatric Medicine.Written communication. Rockville, Maryland, 1986
- 34 -
45
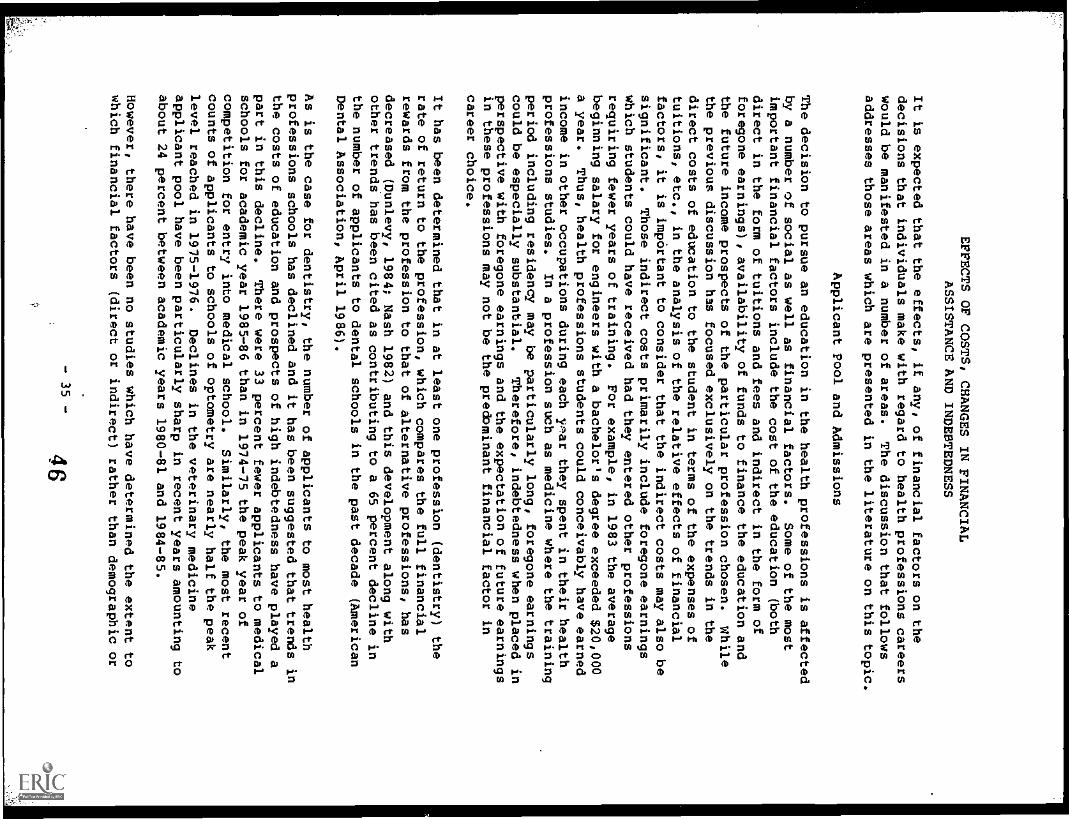
EFFECTS OF COSTS, CHANGES IN FINANCIAL
ASSISTANCE AND INDEBTEDNESS
It is expected that the effects, if any, of financial factors on the
decisions that individuals make with regard to health professions careers
would he manifested in a number of areas.
The discussion that follows
addresses those areas which are presented in the literature on this topic.
Applicant Pool and Admissions
The decision to pursue an education in the health professions is affected
by a number of social as well as financial factors.
Some of the most
important financial factors include the cost of the education (both
direct in the form of tuitions and fees and indirect in the form of
foregone earnings), availability of funds to finance the education and
the future income prospects of the particular profession chosen.
While
the previous discussion has focused exclusively on the trends in the
direct costs of education to the student in terms of the expenses of
tuitions* etc., in the analysis of the relative effects of financial
factors, it is important to consider that the indirect costs may also be
significant.
Those indirect costs primarily include foregone earnings
which students could have received had they entered other professions
requiring fewer years of training.
For example, in 1983 the average
beginning salary for engineers with a bachelor's degree exceeded $20,000
a year.
Thus, health professions students could conceivably have earned
income in other occupations during each yar they spent in their health
professions studies.
In a profession such as medicine where the training
period including residency may be particularly long, foregone earnings
could be especially substanial.
Therefore, indebtedness when placed in
perspective with foregone earnings and the expectation of future earnings
in these professions may not be the predominant financial factor in
career choice.
It has been determined that in at least one profession (dentistry) the
rate of return to the profession, which compares the full financial
rewards from the profession to that of alternative professions, has
decreased (Dunlevy, 1984; Nash 1982) and this development along with
other trends has been cited as contributing to a 65 percent decline in
the number of applicants to dental schools in the past decade (American
Dental Association, April 1986).
As is the case for dentistry, the number of applicants to most health
professions schools has declined and it has been suggested that trends in
the costs of education and prospects of high indebtedness have played a
part in this decline.
There were 33 percent fewer applicants to medical
schools for academic year 1985-86 than in 1974-75 the peak year of
competition for entry into medical school.
Similarly, the most recent
counts of applicants to schools of optometry are nearly half the peak
level reached in 1975-1976.
Declines in the veterinary medicine
applicant pool have been particularly sharp in recent years amounting to
about 24 percent between academic years 1980-81 and 1984-85.
However, there have been no studies which have determined the extent to
which financial factors (direct or indirect) rather than demographic or
- 35 -
46

other factors such as reports of possible surpluses in some professionshave affected these trends.
Rising educational costs have also raised concern about the effects onthe maintenance of the socioeconomic diversity of students enrolled inhealth professions training programs. It has been hypothesized thatincreased health professions education costs without sufficient low costalternatives to financing would prevent all but the most affluentindividuals from pursuing a career in these professions and would have anegative effect on efforts to increase the representation of qualifiedlow income and underrepresented minority individuals in traiaingprograms. While there are no studies to date which fully support thesehypotheses, there are some indications that changes may be occurring inthe economic composition of the applicant pool and of the matriculants tothese institutions in that a growing proportion of applicants andadmissions to health professions training programs are from high incomefamilies.
Data on the parental income of applicants taking the medical Careers'Aptitude Test (MCAT) show a decline in the number of students from lowand lower middle income families. Moreover, in comparison to the incomedistributions of families in the United States, a disproportionate shareof recent applicants are coming from more affluent families. In 1977, 3percent of the national applicant pool, compared to 2 percent of U.S.families at that time, had a family income of $50,000 or more. By 1985the proportion of medical school applicants in this category hadincreased to 38 percent while the fraction of all 1985 U.S. families withan income this high had increased to only 16 percent.
Although the total applicant pool has decreased, comparisons of 1981 and1985 medical school applicants indicate that low income nonminorityapplicants are disappearing from the applicant pool at a faster rate thanlow income underrepresented minority applicants. The changes over thisfour-year period show an 84 percent reduction in low-income nonminorityapplicants compared.to a 44 percent decline in low incomeunderrepresented minority applicants. During the same period, theproportion of families in the U.S. who earned less than $15,000 decreasedfrom 33 to 25 percent among white families and from 62 to 46 percentamong black families (Boerner, 1983 and Unpublished AAMC data). In
addition, there is an apparent trend toward increasingly higheracceptance rates for more affluent applicants and a concomitant declinein the acceptance rate for low income applicants. In 1974, one-third ofall applicants each came from families who earned less than $15,000, and31 percent of these applicants were accepted into medical school. Anadditional one-third of applicants were from families earning over$30,000 and 40 percent were accepted. About 18 percent of all 1981applicants came from families earning less than $15,000 and 15 percentwere accepted. Almost 46 percent were from families earning more than$30,000 and 51 percent of these applicants were accepted (Boerner,1983). Recent data also indicate a change in family income levels ofstudents in schools of optometry. A five-year trend survey performed atthe Southern California College of Optometry shows a significant increasein the number of students with families having incomes exceeding $30,000
- 36 -
47
and a decrease in the number of students with families having incomesbetween $12,000 and $29,000 (ASCO, September 1984). Moreover, in1979-80, for example, only 9 percent of the families of applicants forfinancial assistance had incomes of more than $30,000; by 1983-84 thatfigure had risen to 50 percent and of that 50 percent, 25 percent hadincomes exceeding $45,000.
A cause and tffect relationship between such changes in the applicantpool and educational costs and indebtedness has yet to be defined. In astudy of the effect of high tuition on applicants and enrolled medicalstudents at Georgetown University School of Medicine researchers foundthat overall the sudden rise in tuition and corresponding financial aidrequirements caused little change in socioeconomic diversity ofmatriculants (Ayers et al., 1981). A point of note is that the majorsupport for students at this school was from Federal scholarships with aservice commitment. Therefore, the effect of the curtailment inavailability of such support on future matriculants remains to be seen.
Practice
The income of health professionals may vary considerably according to thetype.of practice chosen (i.e., private practice, academia), the specialtychosen, and the area in which the practice is located. As a result ithas been hypothesized that with increasing levels of educationalindebtedness graduates from health professions training programs would bemore likely to choose those practice situations which offered the maximumremunerative potential.
Specialty of practice is one area in which substantial income variationsmay be found. AS illustrated in Table 14 net physician incomes in 1984varied from $71,100 for general family practice physicians to $151,800for surgeons. Medical specialists have higher incomes than generalistsdespite comparable work weeks and a slight difference in the number ofhours worked per week. Similarly, virtually all published reports whichpresent average net incomes among general dental practitioners andspecialists show that the average earnings of specialists at any specificage in the career path generally exceed those of general practitioners.
Because of the income differentials among practitioners of differentspecialties and the steadily increasing educational expenses andindebtedness of health professions students, there has been concern thatstudents may consider the relative financial returns of practice as amajor determinant of specialty choice. Such decisions would possiblyhave a negative effect on efforts to provide adequate access to primarycare. Studies to date do not support the contentions that levels ofindebtedness have a substantial effect on specialty choice.
Although practicing dentists who specialized reported that they hadhigher levels of debt at graduation than those who did not specialize(House, 1985), most studies in the area of medicine have found little, ifany, relationship between overall indebtedness and specialty choice.However, one study of medical residents who graduated in 1983 examinedthe relationship between debt and specialty choice by differentiating the
type of debt and found that an increase in federally-subsidized loans(GU*, Ma*, and HPSL) slightly increased the probability of selecting a
- 37-
48
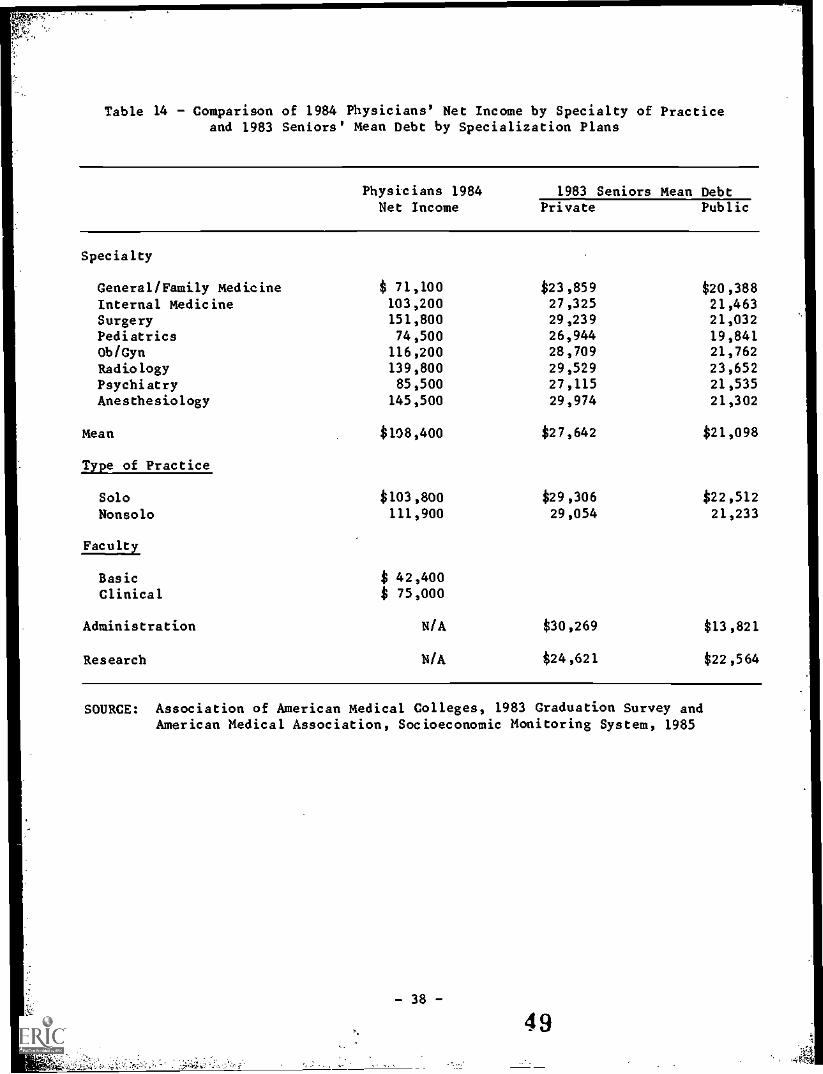
Table 14 - Comparison of 1984 Physicians' Net Income by Specialty of Practiceand 1983 Seniors' Mean Debt by Specialization Plans
Physicians 1984 1983 Seniors Mean DebtNet Income Private Public
Specialty
General/Family Medicine $ 71,100 $23,859 $20,388Internal Medicine 103,200 27,325 21,463Surgery 151,800 29,239 21,032Pediatrics 74,500 26,944 19,841Ob/Gyn 116,200 28,709 21,762
Radiology 139,800 29,529 23,652Psychiatry 85,500 27,115 21,535
Anesthesiology 145,500 29,974 21,302
Mean
Type of Practice
SoloNonsolo
Faculty
BasicClinical
Administration
Research
$108,400 $27,642 $21,098
$103,800111,900
$29,30629,054
$ 42,400$ 75,000
N/A $30,269
N/A $24,621
$22,51221,233
$13,821
$22,564
SOURCE: Association of American Medical colleges, 1983 Graduation Survey andAmerican Medical Association, Socioeconomic Monitoring System, 1985
primary care specialty among nonwhites but had no effect on the specialtychoice of whites. An increase in debt from HEAL loans had the oppositeeffect; it reduced the likelihood of choosing a primary care specialty,regardless of race. Finally, this study found that debt from sourcesother than nonsubsidized and subsidized Federal loans had a smallpositive effect on the probability of selecting primary care. Althoughthese analyses showed the type of debt accumulated had a significanteffect, their influence on specialty choice was small; a $10,000 increasein HEAL debt decreased the probability of choosing primary care by 7.5percentage points while a $10,000 increase in subsidized debt increasedthe probability of selecting primary care by 5.3 percentage points amongnonwhites (Bazzoli, 1984).
Incomes also vary by type of practice and practice location. E-L-
example, in 1984, physician solo practitioners earned less than non-solopractitioners, $103,800 and $111,900, respectively. Physicians locatedin metropolitan areas with populations under one million earned thehighest salaries, $115,100 compared with $106,400 for physicians whosepractices were located in metropolitan areas with more than one millionpopulation. Physicians in nonmetropolitan areas earned $90000 (AMA,1985).
Physicians who are employed in academic settings generally have incomesbelow most of their practitioner counterparts. The average annual incomeof basic science faculty in 1984 was $42,400. Clinical science facultyearned a substantially higher average annual income than basic sciencefaculty, over $75,000, because members of this group have access toearnings from their medical practice in addition to other universityresources (3ME, 1985).
Such variations in remuneration coupled with rising debt loads haveraised concerns about the health professionals' willingness to practicein areas of health care underservice, and in academia where incomas havetraditionally been lower than in some other areas. However, there is noevidence that indebtedness is substantially influencing such decisions.
Determining influences on choice of a practice is very complex and manystudies have been done to assess the importance of various factors inlocation decisions. There is evidence that the income earning potentialof a location is important. But there is no evidence that indebtednessaffects the location decision. For example, a recant study showed norelationship between level of indebtedness of dental school graduates andthe probability of locating in a dental manpower shortage area (House,1985).
Early Practice Years and Residency Years
Although substantially higher eainings can be expected as their practicesmature, the early years of practice of the new health professional withrelatively large educational debt may be financially difficult. A studysimulating the debt burden pattern of graduates from medical (MD and DO)dental, optometry, and veterinary medicine schools indicated that exceptfor MDs accumulated educational debt will be of such a magnitude relativeto expected earnings in the initial years of practice that repayment of
- 39-
50
the loans could be difficult for 40 to 75 percent of these graduates..Even under more optimistic alternative assumptions about the proportionof graduates/ income available to repay educational debt of graduates,these percentages range from 20 percent to 40 percent (AMS, 1985).1(
While the AMS study found MD physicians to be much less likely than otherprofessionals to be at economic risk during early practice years, theremay be difficulties with the repayment of loans during the residencyyears. About 98 percent of current medical school graduates pursuespecialty training in graduate medical education programs for an averageof about 4 years. While the payment of HEAL is deferred until residentsenter practice, interest accrues during residency and GSL and NDSL haveonly 2 year deferments so repayment often begins during residency.Repayment for some may be made difficult by the relatively low stipendsreceived by residents. For example, in 1982-83 residency stipends rangedfrom an average stipend of $18,700 for first-year residents to $22,000for fourth-year residents.
While effects such as low starting salaries are not long term, they arenonetheless noted as financial factors which may be influential duringthis period of the health professionals' career.
In addition to financial difficulties associated with the repayment ofloans during the early years of practice, some studies have noted another
short-term difficulty associated with financial factors--theestablishment of a private practice.
Income potential is greatest for dentists in private practice as ownersof a practice. Eighty-two percent of graduating dental school seniors in1985 expect to eventually own all or part of a private dental practice.(Solomon, 1985). Five years after graduation, 73 percent of 1979graduates were complete or part owners of a private practice. The higherthe level of annual educational debt payment, the more likely the dentistis to be an owner of a dental practice. However, the average annualpayment of educational debt by dentists who own all or part of a dentalpractice is only about one-fifth of the average annual payment for buyingthe practice. Thus, among dental practice owners, five years intopractice, educational debt is relatively unimportant in the context oftotal debt (House, 1985).
Some graduates of schools of optometry suggested in a 1982 survey thatindebtedness was a major factor preventing the achievement of a self-employed practice. The most frequently cited difficulty in establishinga practice was that large debts incurred from educational expensescreated a barrier in the financing of a practice (35 percent). The nextmost frequently cited difficulty related to problems in obtaining thenecessary capital to finance a practice (25 percent). These surveyresults suggest that the economics of financing a practice, and priorexisting debt, have made the attainment of a self-employed status moredifficult.
1/ The methodology of this study does not explicitly account for thegraduates' ability to deduct interest paid on their loans from theirincome taxes, and the effect that this may have on the percentagesderived is unknown.
-40-
51
The above survey covering the optometry classes of 1979, 1980, and 1981,shows that the trend among recent graduates is in the direction ofself-employment.
When the data are examined by year of graduation, the proportion of self-employed practitioners increases rather sharply from the first year aftergraduation (44 percent) to the third year after graduation (63 percent).Conversely, the proportion of graduates in a salaried position decreasesover time after graduation, in about the same proportion as the increasein the self-employed category. These survey data suggest that somegraduates enter a salaried position after graduation because ofeducational indebtedness or inability to raise needed capital.Subsequently, they overcome such obstacles and move toward theirprofessional preference, self-employment.
Table 15 shows average educational debt of U.S. veterinary medicalcollege graduates by selected types of employment for the three mostrecent years. In 1985, with the exception of advanced study,veterinarians exclusively in small animal practice had the highesteducational indebtedness. Those in large animal predominant practice hadthe lowest level of educational debt.
A survey of 1985 pharmacy graduates by the American Druggist Magazinereported that drug chains employed more than one-third (35 percent) ofthe new graduates. The proportion of new pharmacy graduates employed bydrug chains (28 percent of 1980 graduates) has been increasing graduallyin recent years. Conversely, the proportion of new graduates inindependent pharmacies has been decreasing in recent years, down to 21percent of 1985 graduates. The proportion of new pharmacy graduatesemployed by hospitals (26 percent of 1985 graduates) has remained stable
over the last few years. The increasing proportion of new pharmacygraduates employed by drag chains is likely due to higher salary levelsoffered by drug chains which in turn may cause fewer graduates to work inindependent pharmacies, hospitals, and other career fields, such asgovernment and teaching. There are, however, no studies whichdemonstrate the relationship of these trends to increasing indebtedness.
In the area of public health the relatively low salaries in the face ofincreasing student debts is also an issue. Graduates of schools ofpublic health in 1981 commanded an average entry-level salary of$24,500. In contzasting this with other fields, one study concludedthat, ". . . public health is still a field that pays only modestearnings in comparison to other fields of the health professions"(Licwinko, 1982). Median salaries in local health departments in 1982were: Public Health Nurse $16,000; Sanitarian $17,000; Health Educator$18,000; and Public Health Physician $48,000 (American public HealthAssociation, 1982). Even the physician salary is unattractive incontrast to the approximately $100,000 that physicians earn on theaverage in private practice settings (AMA, 1983).
A study of 1978 and 1979 graduates of schools of public health, concludedthat, "The actual rate of return of a public health degree over theentire working lifetime is probably limited or even negative. Due to the
- 41-
52
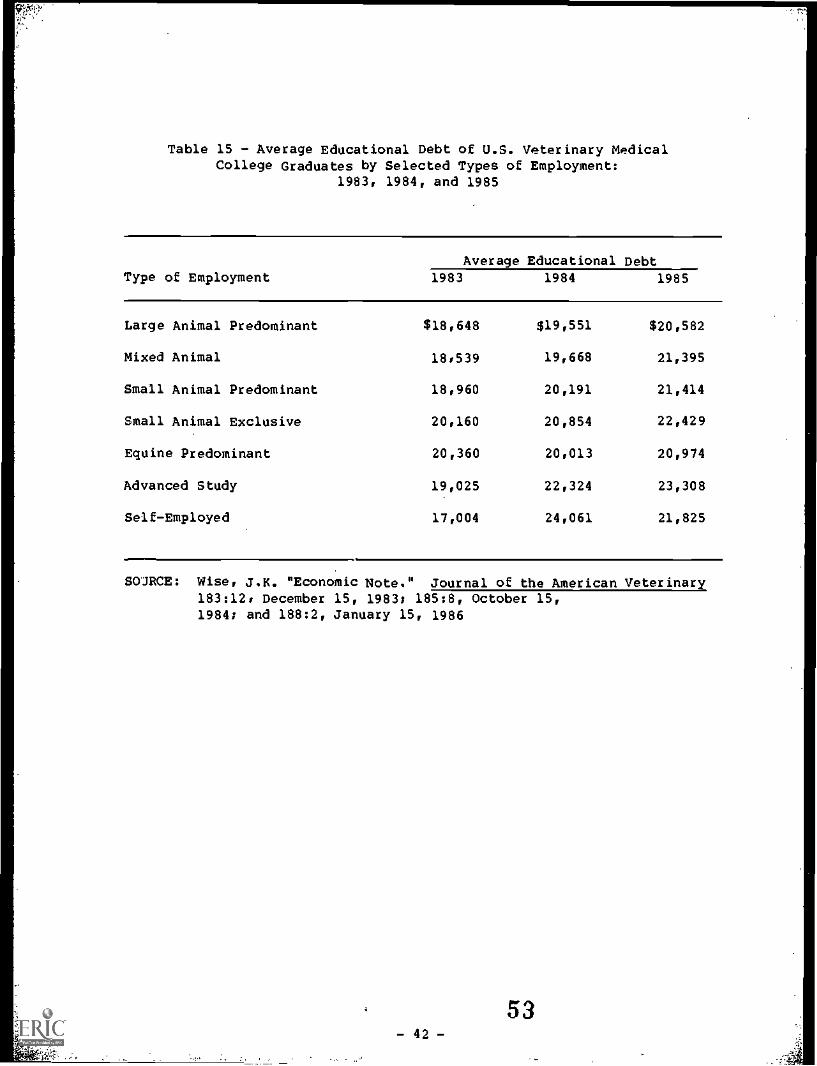
Table 15 - Average Educational Debt of U.S. Veterinary MedicalCollege Graduates by Selected Types of Employment:
1983, 1984, and 1985
Average Educational DebtType of Employment 1983 1984 1985
Large Animal Predominant $18,648 $19,551 $20,582
Mixed Animal 18,539 19,668 21,395
Small Animal Predominant 18,960 20,191 21,414
Small Animal Exclusive 20,160 20,854 22,429
Equine Predominant 20,360 20,013 20,974
Advanced Study 19,025 22,324 23,308
Self-Employed 17,004 24,061 21,825
SOJRCE: Wise, J.K. "Economic Note." Journal of the American Veterinary183:12* December 15, 1983; 185:8, October 15,1984; and 188:2, January 15, 1986
- 42 -
53
.
high portion of graduates who work in public and voluntary sectors,subsequent real increments to income over time may be gradual and peakearlier than in such professions as medicine, dentistry, law, andbusiness" (Hall, 1982).
These findings coupled with increases noted in indebtedness levels inrecent years have raised concerns that new graduates will be forced toseek more lucrative employment in the private sector and in clinicalpractice, making it increasingly difficult to recruit professionals intocertain public health specialties which are already in short supply.
Additional studies would be needed to define the effects, if any, ofcomparatively low salaries and rising indebtedness on the career patternsof public health personnel.
Career Plans of Students and Recent Graduates
The preceding discussion involves analyses which have largely drawn onretrospective data where motivations are inferred from observed behaviorand characteristics. Studies of the future plans of students or thosewho have just completed their training present another perspective byproviding information based on stated intentions or motivations. As istrue of most data in this area information is available almostexclusively for medical and dental students.
Some analysts assume that economic necessity may increasingly be adeterminant of a health professional's career choice, given the largegrowth in the supplies of health personnel and warnings about pendingoversupplies, increasing competition, income disparities amongspecialists, and the increasingly larger debts of recent healthprofessions graduates. However, the direction these forces may take isnot clear. For example, contradictory hypotheses explaining therelationship between medical students' indebtedness and their careerchoices anticipate that either high debt will influence students tospecialize in one of the higher paying specialties and practice in largemetropolitan areas, or, to select a specialty which requires a minimumnumber of years for specialty training, such as family practice, generalpediatrics, or general internal medicine. Similarly, among dentists thehypotheses are that the new graduate would choose to specialize in orderto earn more for debt payoff or, altheimatively, to enter practice soonerto begin paying debt earlier.
Although most studies to date do not support the contention thatincreased debt will decrease the number of physicians in primary care,there are indications from student surveys that career choices may beaffected in the future. The results of a study of students enrolled inmedical school during the 1983-84 academic year found that 45 percent offirst-year students, compared to 31 percent of fourth-year students,indicated that anticipated debt would be a determinant in their selectionof a specialty (AAMC, 1986). The study further found that studentsattending private medical schools and medical schools in the northeastU.S., where tuition charges are highest, were most likely to indicatethat expected debt would be a determinant of their specialty selection.
- 43 -. 0
5 4
This study suggests that indebtedness may have an increasingly largerrole in future medical school graduates specialty selection and othercareer decisions.
Several studies which have examined the relationship between fourth-yearmedical students' debt and their career choices have found variationsbetween medical school debt and career plans. However, debt variationswithin career categories are usually not large and may not explain howphysicians make their career choices. .Debt has not been found to be ascritical a determinant of career choices when other fact.Jrs, such asstudents' socio-demographic characteristics, are considered. Severalstudies have found strong relationships between students' personalcharacteristics and their career choices without finding as strong arelationship for indebtedness (AMA, 1983; French, 1981; and Hough, 1981).
The AMA conducted a study on the impact of rising educational debt onmedical school graduates specialization and career plans and found somesignificant variations between debt load, some career choices and thetype of school these graduates had attended: the lowest average del,($14,400) was incurred by those who intended careers in a governmentagency, but those graduates who expected careers as academic faculty hadthe highest average debt ($21,270). Because academic careers generallypay less than clinical practice, this finding did not support thehypothesis that those students with large debt may choose higher payingcareers. Although the difference between the highest and lowest averagedebt was statistically significant, the report concluded that thesevariations may not explain how future physicians choose their careers(American Medical Association, 1983).
A series of studies supported by the Department of Health and HumanServices (EIHHS) and conducted by the AAMC have also provided informationon the relationships between indebtedness and career plans among seniorstudents who graduated from U.S. medical schools between 1974 and 1984.The first study, conducted among 1974-75 senior students, found thatwomen, underrepresented minority group members, married students withchildren and those from rural areas or small towns had the largest amountof debt and were more inclined to plan to establish practice in amedically underserved area (Mantovani, et al., 1976).
The study of 1978 through 1982 senior students found that 1981 and 1982graduates who chose to practice in cities with 500,000 or more populationhad higher debts, about $22,000, than those stating preference for smalltowns at $18,000. Among 1978 through 1981 graduates, those planningteaching or research careers reported lower debt than those opting for
private practice, but there was little indication that highly indebtedseniors planned to go into the higher paying specialties. Among the 1982graduates there was some indication this had changed: graduates with thehighest average debt were planning to specialize in allergy-immunology($25,200), anesthesiology ($24,300), ophthalmclogy ($23,200), and topursue careers in full-time research ($24,300) or administration($26,700). The study findings further indicated that sex, maritalstatus, and attendance at a private school were more powerful predictorsof who would select primary care or a higher paying specialty thanindebtedness (AAMC, 1984).
-44 -
55
The study of indebtedness and career choice among 1983 medical schoolgraduates found that higher average debt was associated with a tendencyto choose a non-primary care ($35,300) rather than a primary carespecialty, to prefer an urban or suburban practice ($33,600) rather thana town or rural ($29,700) location. Higher debts were also associatedwith plans for a career in research ($28,600) or administration ($30,000)than in clinical practice ($23,600) among seniors attending privateschools. Students who indicated they were willing to serve in asocioeconomically deprived area had lower average debts than others.However, this finding was attributed to the high proportion ofunderrepresented minorities with relatively low debts indicating theywould serve in these areas rather than to any direct effects ofindebtedness (AAMC, 1985).
This study also found that seniors attending private medical schools whowere planning residencies with five or more years of training and thoseplanning a transitional year of graduate medical education had thehighest mean debts, $28,100 and $28,900, respectively. The analysis ofcareer activity preferences showed that public school students with thehighest mean debt planned to enter a nonclinical area. Private schoolseniors planning academic careers also had relatively high mean debt,$28,100, which was exceeded slightly by students who planned to enterprivate clinical practice, $29,300.
In a survey of 1983 osteopathic medical school seniors half the studentsstated that their financial situation was a factor in their decisionsconcerning their post-graduate plans and there are observable differencesin some cases between those with high and low indebtedness. However, theaverage indebtedness of these seniors differed by less than one percentbetween those choosing primary care and those selecting a non-primarycare specialty. The study notes that slightly less than one-half ofthese graduates were planning to enter primary care whereas traditionallythe percentage of osteopathic students entering primary care has beenmuch higher. However, the relationship of this occurrence to financialfactors is not demonstrated in the itudy. With regards to locationplans, about one-third of these seniors considered their financialsituation as on influence on location choice and most of these consideredit only a slight influence (AACOM, 1986).
Evidence from a survey of dental school graduates indicates that dentalschool seniors who plan to enter postgraduate programs carry higherlevels of debt than those not planning to take postgraduate training.However, "income potential" was mentioned by only eight percent of dentalgraduates planning to specialize as the most important factor in thedecision (Graham and DeMarias, 1976). While indebtedness appears to becorrelated positively with a tendency to specialize, the relationship isnot simple, and other factors are important in the decision.
Although data from the late 1970s and early 1980s indicated that dentalstudents' plans for post graduation employment were strongly affected byfinancial indebtedness (American Association of Dental Schools, 1980,1984), more recent data show a decreasing relationship. From 1983 to1985 the average debt of graduating dental students increased by over 25
- 45 -
i.56
. .
percent, while immediate postgraduation plans remained relativelystable. There does appear to be a drift toward group private practiceand away from solo private practice in both immediate and long rangeplans of graduating dental students. However, 4 years after graduation,among practitioners in an ownership position, more are solo practitionersthan planned. Only 44 percent of 1980 dental school graduates expectedto be in solo dental practice by 1985. By 1984, over 63 percent of 1980graduates had already established a solo dental practice (Solomon,November 1985).
Economically Disadvantaged and Underrepresented Minority Students
Since the 1960s there have been a number of programs established toprovide access to careers in the health professions for economicallydisadvantaged individuals and those minorities who are underrepresentedin the health professions work force and trakning institutions. Severalstudies have acknowledged the effectiveness of these programs inincreasing the number and proportion of minority and low-income healthprofessions students and practitioners during the 1960s and early 1970s(Keith, 1985; Bazzoli, et al., 1986; Shea and Fullilove, 1985).
One study examining the effectiveness of Federal health manpower programsof the 1960s and 19708 in increasing access to medical school found that,regardless of ethnic background or race, students from socioeconomically-disadvantaged families were able to enroll in even the most expansivemedical schools and graduate without much more debt than students fromfamilies with more resources. They concluded that because these programswere successful in enabling economically-disadvantaged individuals toenter medical school, their elimination would have a negative impact onlow-income individuals (Bazzoli et al., 1986).
Other researchers have voiced concern that a continuation of the current
trends in educational costs and financing mechanisms willdisproportionately affect low-income and underrepresented minoritystudents. It is argued that these individuals generally have fewereconomic resources available to them than do other students and theirenrollment is considered to be more affected by the types of financialassistance available (Hanft, 1985; Sullivan 1986). Declines in thepercentages of low-income applicants and acceptees to medical schoolshave been offered as evidence that a change in socioeconomic backgroundin medical schools may already be underway. However, in the absence ofstudies examining all factors which may be affecting these changes it isdifficult to determine the contribution of financial considerations.
Interest in increasing or even maintaining the level of underrepresentedminority enrollments in health professions training programs goes beyondthe issue of equity of access to these careers. Studies have shown thatpractitioners from underrepresented minority groups are more likely tolocate in low-income areas and to provide services to underserved areasand populations (Keith, 1985; U.S. DHHS, 1985). Therefore, increasingthe numbers of such practitioners appears to be beneficial to thenational goals of increasing access to health services for certainsagments of the population.
- 46 -

9.1!.
The continually rising educational costs and indebtedness are perceivedby some observers as a threat to progress in increasing or evenmaintaining the gains that have been made in improving the representationof these groups in training programs and in the work force. Althoughsome progress has been made, the goal of obtaining minority enrollment inhealth professions schools equivalent to their representation in the U.S.population has not been achieved and the representation of some minoritygroups among the supply of health professionals lags even further thanamong enrollments. For example. in 1983-84, Blacks accounted for 12percent of the U.S. population but only an estimated 3 percent of theNation's physicians and 6 percent of new medical school entrants.
Hispanics represented 6 percent of the Nation's population and 3 percentof 1983 first-year medical students. Moreover. Black physicians,dentists, and pharmacists and Hispanic dentists and pharmacists were allless than one-quarter of equivalency with their representation in theU.S. population in 1985 and, even at current rates of increase inenrollment, they are projected to be no higher than one-third equivalencyin the Year 2000 (U.S. DHHS, 1986).
Despite the apprehensions regarding the possible disproportionate effectsof financial factors on minority enrollments, data indicate that there iscurrently little difference in the overall average indebtedness ofminority and nonminority medical school graduates. Reports published bythe Association of American Medical Colleges (AAMC) indicate that thedisparity between the mean debt of underrepresented and nonminoritystudents has diminiEhed since 1981, with current debt levels closelyapproximating each other. In 1983, the mean debt of nonminority seniormedical students was slightly higher at $23,700 than that ofunderrepresented minorities, $22.300. The proportion of nonminoritystudents in debt increased from 73 percent to 86 percent of seniorstudents between 1978 and 1983 while the proportion of underrepresentedminorities in debt during this period remained about the same at 92percent (see Table 16).
The proportion of underrepresented senior minority medical students indebt for over 530.000 more than doubled during this period, from 11 to 25percent of senior students. For nonminority senior students, theincrease was even greater. from 6 percent to 25 percent of graduatingstudents (Table 17).
An analysis of minority and nonminority students attending private andpublic medical schools found that there were no differences betweenunderrepresented and nonminority senior year debt levels among those whoattended public schools. However, the moan debt level of underrepresentedminorities in private schools was lower than that of nonminorities. Thisfinding was partially attributed to the higher proportion ofunderrepresented minority students who attended medical school during thepeak years of the NHSC program and received these scholarships for allfour years of medical school (AAMC, 1985).
-
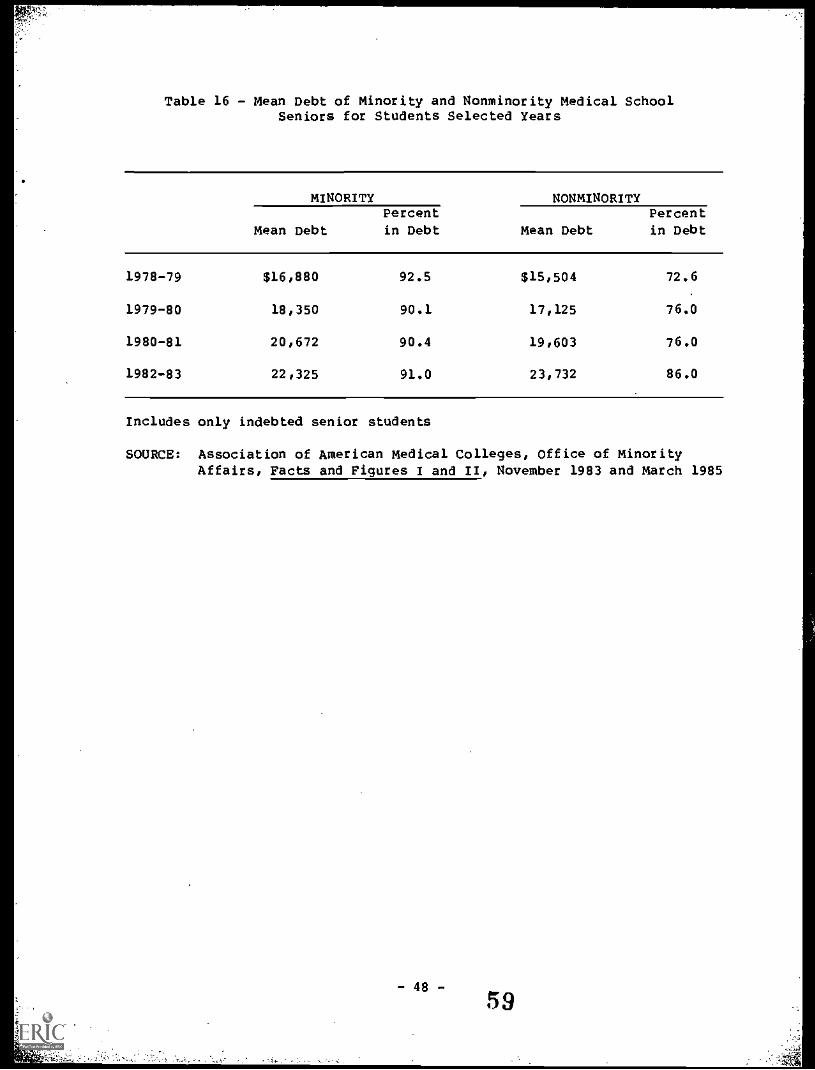
Table 16 - Mean Debt of Minority and Nonminority Medical SchoolSeniors for Students Selected Years
MINORITY NONMINORITY
Mean DebtPercent
in Debt Mean DebtPercentin Debt
1978-79 $16,880 92.5 $15,504 72.6
1979-80 18,350 90.1 17,125 76.0
1980-81 20,672 90.4 19,603 76.0
1982-83 22,325 91.0 23,732 86.0
Includes only indebted senior students
SOURCE: Association of American Medical Colleges, Office of MinorityAffairs, Pacts and Figures I and II, November 1983 and March 1985
- 48 -
59
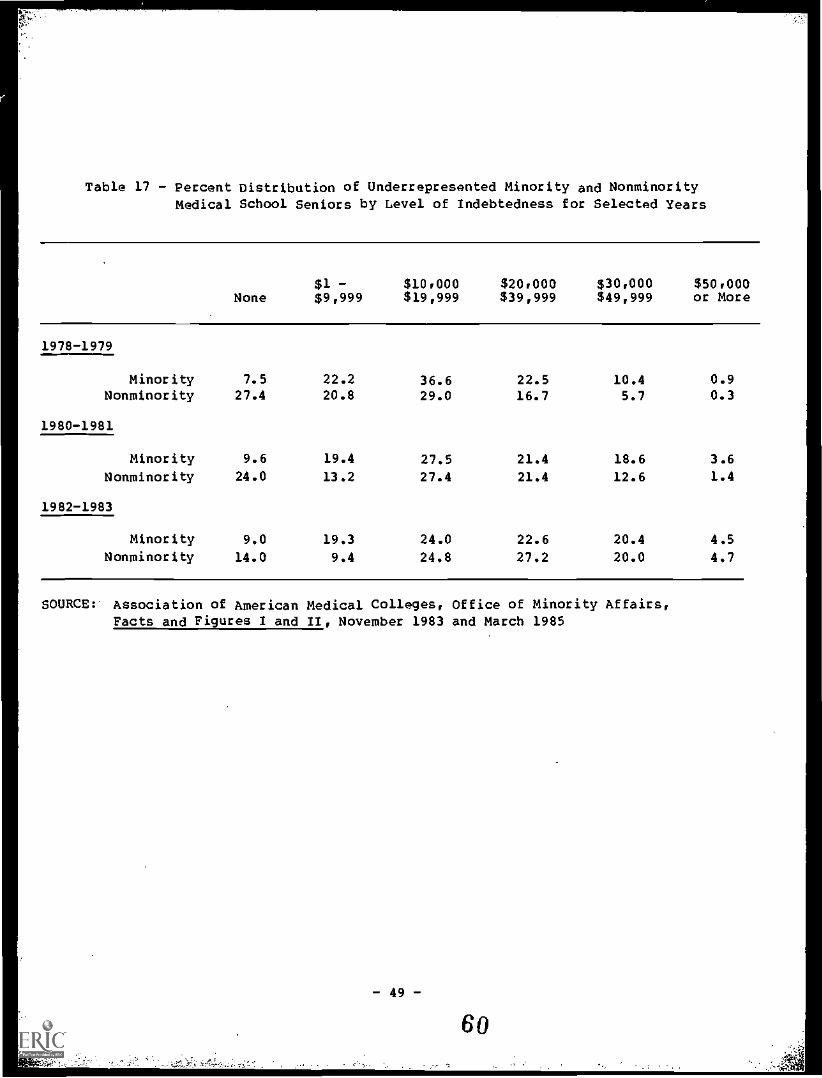
Table 17 - Percent Distribution of Underrepresented Minority and NonminorityMedical School Seniors by Level of Indebtedness for Selected Years
None$1 -$9,999
$10.000$19,999
$20.000$39,999
$30.000$49,999
$50.000or More
1978-1979
Minority 7.5 22.2 36.6 22.5 10.4 0.9Nonminority 27.4 20.8 29.0 16.7 5.7 0.3
1980-1981
Minority 9.6 19.4 27.5 21.4 18.6 3.6
Nonminority 24.0 13.2 27.4 21.4 12.6 1.4
1982-1983
Minority 9.0 19.3 24.0 22.6 20.4 4.5
Nonminority 14.0 9.4 24.8 27.2 20.0 4.7
SOURCE: Association of American Medical Colleges, Office of Minority Affairs,Facts and Figures I and II, November 1983 and March 1985
- 49-
60
While available data indicate a decline in the percentage of low-incomeminority applicants and acceptees to medical schools (see Table 113),1/the pool of minority applicants to medical schools has remained stable inrecent years in terms of overall numbers whereas the trend in the totalapplicant pool has been downward. Authors of a previous study finding no
discernible effect of tuition increases on the applicant pool forminorities suggested that the availability of financial aid kept the poolat a stable level (Yoder, 1983).
During a recent series of nationwide workshops on career choices ofminority students, minority student and counselor participants spoke ofthe influence these increased costs and potential debt can have at alleducational levels. It was the perception of participants at the careerchoices workshops that qualified minority students who might beinterested in health careers are instead choosing engineering, law,business, and computers (HRSA, 1986). The data on whetherunderrepresented minority Students are choosing these alternative careersis inconclusive because no information is available on whethersubstantial percentages of underrepresented minority students who wouldhave entered health professions schools are now entering business schoolsor becoming computer professionals. However, the percentage increases inBlacks, Hispanics, and American Indians matriculating in graduateengineering programs are appreciably higher than for medical and dentalschools (Table 19).
In the absence of studies which explore factors related to the demand forhealth professions training by minority individuals as well as theinfluence of available educational financing mechanisms, it is difficultto draw conclusions about the possible influence of economic factors ontheir career choices.
1/ To some extent the decreases in the proportion of applicants fromfamilies from the lowest income categories reflect the general shiftof the population into higher income categories over time. However,as mentioned earlier in this report, the shift to higher incomecategories has been much greater among the families of medical schoolapplicants than among U.S. families in general.
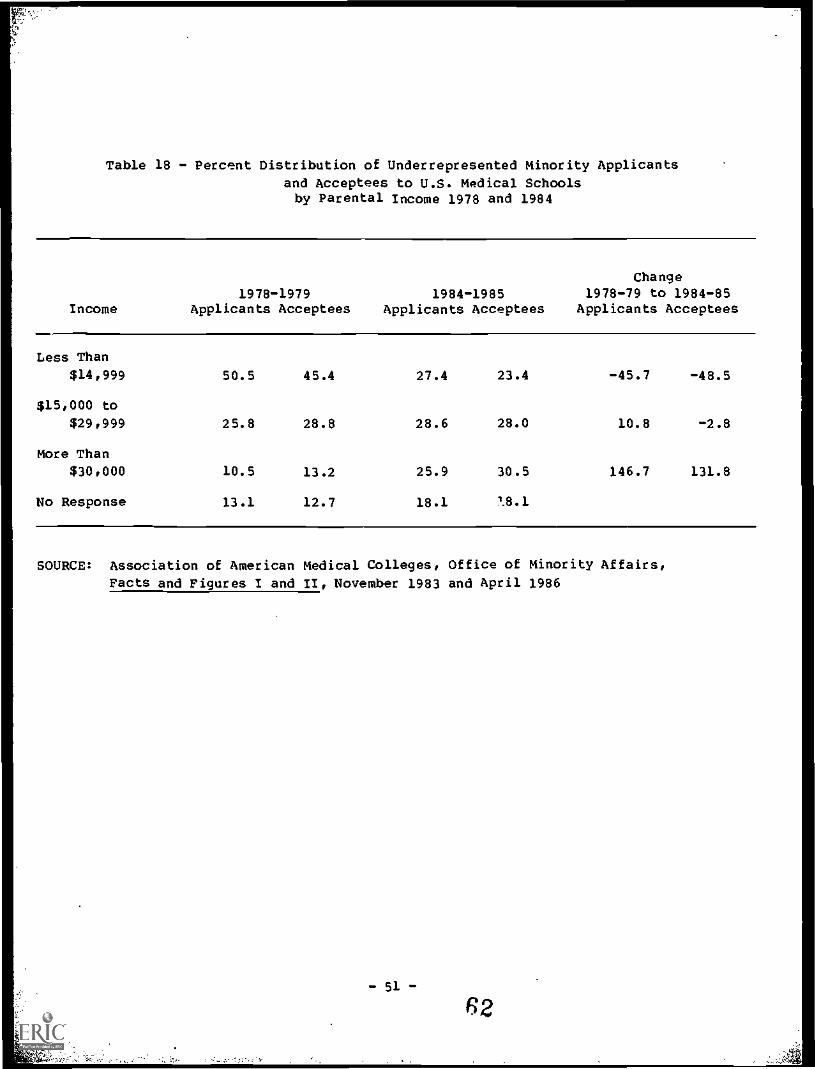
Table 18 - Percent Distribution of Underrepresented minority Applicants
and Acceptees to U.S. Medical Schoolsby Parental Income 1978 and 1984
Income
Change1978-1979 1984-1985 1978-79 to 1984-85
Applicants Acceptees Applicants Acceptees Applicants Acceptees
Less Than$14,999 50.5 45.4 27.4 23.4 -45.7 -48.5
$15,000 to
$29,999 25.8 28.8 28.6 28.0 10.8 -2.8
More Than
$30,000 10.5 13.2 25.9 30.5 146.7 131.8
No Response 13.1 12.7 18.1 18.1
SOURCE: Association of American Medical Colleges, Office of Minority Affairs,
Facts and Figures I and /I, November 1983 and April 1986
- 51 -
62
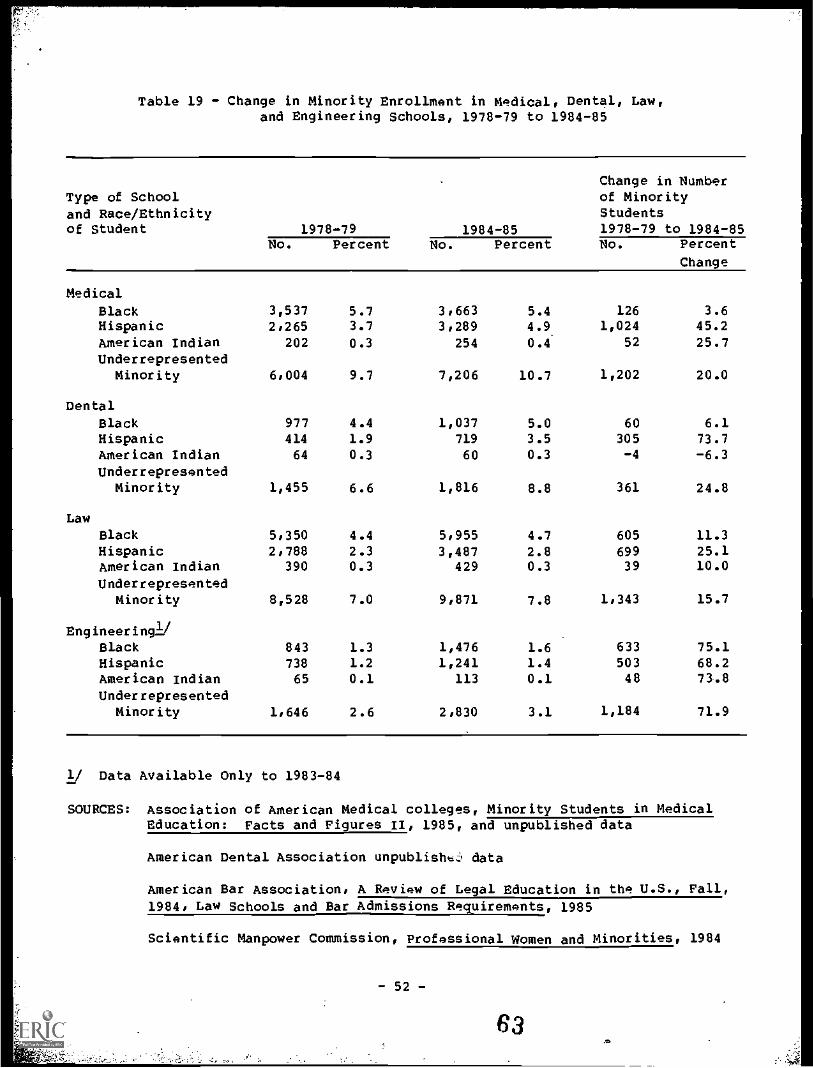
Table 19 - Change in Minority Enrollment in Medical, Dental, Law,and Engineering Schools, 1978-79 to 1984-85
Change in NumberType of School of Minority
and Race/Ethnicity Studentsof Student 1978-79 1984-85 1978-79 to 1984-85
No. Percent No. Percent No. Percent
Change
Medical
Black 3,537 5.7 3.663 5.4 126 3.6Hispanic 2.265 3.7 3,289 4.9 1,024 45.2
American /ndian 202 0.3 254 0.4 52 25.7Underrepresented
Minority 6,004 9.7 7,206 10.7 1,202 20.0
Dental
Black 977 4.4 1,037 5.0 60 6.1Hispanic 414 1.9 719 3.5 305 73.7American Indian 64 0.3 60 0.3 -4 -6.3
UnderrepresentedMinority 1,455 6.6 1,816 8.8 361 24.8
Law
Black 5,350 4.4 5,955 4.7 605 11.3Hispanic 2,788 2.3 3,487 2.8 699 25.1American Indian 390 0.3 429 0.3 39 10.0
UnderrepresentedMinority 8,528 7.0 9,871 7.8 1,343 15.7
Engineering!,Black 843 1.3 1,476 1.6 633 75.1Hispanic 738 1.2 1,241 1.4 503 68.2American Indian 65 0.1 113 0.1 48 73.8
UnderrepresentedMinority 1.646 2.6 2,830 3.1 1,184 71.9
1/ Data Available Only to 1983-84
SOURCES: Association of American Medical colleges, Minority Students in MedicalEducation: Facts and Figures II, 1985, and unpublished data
American Dental Association unpublish data
American Bar Association, A ReView of Legal Education in the U.S., Fall,1984, Law Schools and Bar Admissions Requirements, 1985
Scientific Manpower Commission, Professional Women and Minorities, 1984
- 52-
63.*,
REFERENCES
American Association of Colleges of Osteopathic Medicine. Analysis ofOsteopathic Physicians Characteristics and Indebtedness as They Relate toCareer Preferences and Actual Selection of Specialization Area,Rockville, MD, 1986
American Association of Colleges of Osteopathic Medicine. Annual
Statistical Report, 1985, Rockville, MD, 1986
American Association of Colleges of Osteopathic Medicine. The Debts ofOsteopathic Students, Rockville, MD, 1984
American Association of Colleges of Podiatric Medicine. Writtencommunication from Suzanne H. Howard: Director of Public Affairs.May 1, 1986
American Association of Dental Schools. "Choice of Post-GraduationEmployment by Dental students in 1978-1979 and the Relation to FinancialIndebtedness." J. Dent. Ed., Vol. 44, No. 1, 1980
American Association of Dental Schools. Dental Students Then and Now. ADemographic Analysis. Presented at the AADS Annual Session, Dallas,Texas, March 1984
American Dental Association. Supplement 13 to the Annual Report 1981/82Dental Education: Dental Tuition, Chicago: IL, December 1983
American Dental Association. Supplement 13 to the Annual Report 1985/86Dental Education: Dental School Tuition, Chicago, IL, January 1986
American Dental Association. Supplement 11 to the Annual Report 1985/86Dental Education: Trend Analysis, Chicago: IL, April 1986
American Druggist Magazines p. 17-20: August 1985
Pmerican Medical Association. "Educational Indebtedness and the CareerChoices of New Physicians," Report E (I-83), Chicago, IL, 1983
American Medical Association. "82nd Annual Report on Medical Educationin the U.S.," Journal of the American Medical Association, 248:December 24/31, 1982.
American Medical Association. "85th Annual Report on Medical Educationin the U.S.," Journal of the American Medical Association, 254:September 27, 1985
American Medical Association. "Residents in Debt," American MedicalAssociation Newsletter, November 1985
American Medical Association. "Socioeconomic Characteristics of MedicalPractice," Chicago, IL, 1985
- 53 -
64
American Medical Association. Socioeconomic Characteristics of MedicalPractice 1983. Chicago, IL, 1983
American Medical Association. "Research Continues on Student Debts,"American Medical News. July 1983
Applied Management Sciences, Inc. Factors Affecting Ability of Studentsin the Health Professions to Repay Loans: Final Report. TechnicalReport pursuant to contract No. HRSA 240-414-0085, June 1985
American Podiatric Medical Association. Health Care for Foot Problems inthe U.S.A. - Patterns of Professional Practice, Patient Utilization andCosts of Care. Unpublished data prepared by the Johns Hopkins HealthServices Research aol Development Center, February 1986.
American Podiatric Medical Association. Profile of Podiatric Medicine -1984. Washington, D.C. 1985
American Public Health Association. Survey of Employee Compensation inLocal Health Departments: United States - 1982. Washington, D.C., 1984
Association of American Medical Colleges. Unpublished data. Division ofStudent Programs, Washington, D.C., May 1986
Association of American Medical Colleges. Minority Students in MedicalEducation: Pacts and Figures. Office of Minority Affairs, Washington,D.C., March 1985
Association of American Medical Colleges. Minority Students in MedicalEducation: Facts and Figures II. Office of Minority Affairs,Washington, D.C., March.1985
Association of American Medical Colleges. Medical Student Indebtednessand Career Plans, phase I, Final Report, Washington, D.C., December 1985
Association of American Medical Colleges. Study of How Medical StudentsFinance Their Education. Phase I Report. Washington, D.C. 1984
Association of American Medical Colleges. Study of How Medical StudentsFinance Their Education. Final Report, Washington, D.C., 1986
Association of Schools and Colleges of Optometry. Final Report of aFollow-up Survey of Optometry Graduates to Determine Practice Patterns.Technical Report pursuant to contract No. HRA 232-81-0054, September 28,1983.
Association of Schools and Colleges of Optometry. Changing Trends in theFinancing of Optometric Education. Final Report of purchase order HRSA84-208, September 20, 1984.
Ayers, W.R. et al. "Impact of High Tuition on Medical School Applicantsand Enrollees." Journal of Medical Education. 56:795-802, October 1981
Bazzoli, G.J. "Does Educational Indebtedness Affect Physician SpecialtyChoice?" Journal of Health Economics. 4:1-19, 1985
Bazzoli, G., et al., "Race and Socioeconomic Status in Medical SchoolChoice and Indebtedness." Journal of Health Economics. 61:285-292,April 1986
Boerner, R. and Thomas-Forgues, M. "Datagram: Parental Income of 1981First-Year Medical School Applicants and Accepted Students." Journal ofMedical Education. 58:829-831, October 1983
Boerner, R., "Family Income of Medical School Applicants and Accepteesand of College Students." Journal of Medical Education. 52:948-949,
November 1977
Dunlevy, Harry A and Niessen, Linda C. An Economic Analysis of theReturn on Investment of a Dental Education. J. Dent. Ed., Vol. 48,No. 8, 1984
French, F., "The Financial Indebtedness of medical School Graduates."New England Journal of Medicine. 304:563-565, 1981
French, F. and Associates. A Review and Assessment of the HealthEducation Assistance Loan Programs and of Considerations Relevant to theHEAL Policy Formulation. Technical Report pursuant to Contract No. HRSA240-86-138 (P), March 1986
Fruen, M.A., "How the Medical Student Finances Educational Expenses" inMedical Education and Societal Needs a Planning_Report for the HealthProfessions. Institute of Medicine. July 1983
Geetsman, R.H., et al. "Relationship Between Expected Indebtedness andCareer Choice of Medical Students." Journal of Medical Education.61:555-559, July 1986
Graham, J.W. Indebtedness of Dental School Graduates and the Effects onthe Type and Location of Their Dental Practice. J. Am. Dent. Assoc.,Vol. 102, June 1981
Graham, J.W. and Demarias, D.R. Why Specialization. J. AM. Dent.Assoc., Vol. 92, May 1976
Hall, F.R. and Whybrow, P.C. "Financial Aid for Medical Students: A
Review and a Proposal." Journal of Medical Education. 59:380-385,May 1984
Hanft, R.S. "Minorities and the Health Professions in the 1980s."Health Affairs. 3:71-84, Winter 1984
Horch, D.H. Estimating Manageablim Student Loan Limits for the ClassGraduating in 1984 and the Class Entering in 1985. Graduate andProfessional School Financial Aid Service, February 1984
- 55-
66
Hough, D. and Bazzoli, G. "The Economic Environment of ResidentPhysicians." Journal of the American Medical Association.253:1758-1762, March 1985
House. D.R., Rettenmaier, A.J., Stone. B.M.. and Schaid-Wagner, K.Employment of Recent Dental Graduates: Phase II. RRC, Inc. October 1985
Institute of Medicine. Medical Education and Societal Needs: A PlanningReport for the Health Professions. Washington, July 1983
Keith, S.M., et al. "Effects of Affirmative Action in Medical Schools."New England Journal of Medicine. 313:1519-1525, December 1985
Korn/Ferry International and the Association of University Programs inHealth Administration. Health Administration Employment 1979-1983: ASurvey of Early Career Opportunities. New York, NY, 1984
Licwinko, M.L. "Employment Patterns for 1981 Graduates of Schools ofPublic Health and Their Demand in the Work Force." Unpublished report.Association of Schools of Public Health, 1983
Magee. J.H. "U.S. Schools of Public Health Data Report on Applicants,Students, Graduates and Expenditures 1983-84 with Trends Analysis for1974-75 through 1983-84." Association of Schools of Public Health,Washington, D.C., September 1985
Mantovani, R.E., et al. Medical Students Indebtedness and Career Plans.Washington , D.C., September 1976
National Association of Student Financial Aid Administrators. TheCharacteristics of GSL Borrowers and the Impact of Educational Debt.November 1985
Sandson, J. "A Crisis in medical Education: The High Cost of StudentFinancial Assistance." New England Journal of Medicine. 308:1286-1289,May 1983
Schroeder, S.A. "The Making of a Medical Generalist." 'Health Affairs.22-46, April 1986
Shea, S. and Fullilove. M.T. "Entry of Black and Other Minority Studentsinto U.S. Medical Schools." New England Journal of medicine.313:933-940, October 1985
Smith. W.C. "Datagram: Inflation and medical School Faculty Salaries."Journal of Medical Educational. 60:72-74, January 1985
Solomon, "Senior Survey Update: Financial Characteristics of DentalSchool Seniors, 1984." J. Dent. Ed., vol. 48, No. 9, 1984
Solomon, "Career Expectations and Realities for the Class of 1980."J. Dent. Ed., Vol. 49, November 11, 1985
- 56 -
67
Solomon, E. "Senior Survey Update: Student Debt Increases While PracticePlans Stabilize." J. Dent. Ed., Vol. 49, September 1985
Sullivan, L.W. "Minorities and Medical Education--The Crisis Worsens."Paper presented at the National Symposium on Strengthening SupportNetworks for Minorities in Health Science Careers. April 1986
Sullivan, L.W. "The Status of Blacks in Medicine." New England Journalof Medicine. 309:807-808. September 1983
Urban Institute. "The Effects of Reducing Federal Aid to UndergraduateMedical Education." Working Paper 1439-01, June 1981
U.S. Department of Health and Human Services. Fifth Report to thePresident and Congress on the Status of Health Personnel in the UnitedStates, March 1986
U.S. Department of Health and Human Services, Health Resources andServices Administration.(HRSA). Assessment of HCOP-Supported RetentionPrograms in Medical Schools. 232-014RO-0002(2), October 1984
U.S. Department of Health and Human Services, Health Resources andServices Administration: Estimates and Projections of Black and HispanicPhysicians, Dentists, and Pharmacists to 2010, DHHS Pub.No. HRS-P-DV 86-1, May 1986
U.S. Department of Health and Human Services, Health Resources andServices Administration (HRSA). Factors Affecting Career Choices ofMinority Students. Draft final report of proceedings of six workshops inWashington, D.C., Atlanta, New York, Chicago, San Antonio, and LosAngeles between 1985 and January 1986. HRSA 240-85-0021, June 1986
U.S. Department of Health and Human Services, Health Resources andServices Administration. Location Patterns of Minority and Other HealthPersonnel. DHHS Pub. No. HRS-P-OD 85-2, 1985
Wise, J.K. "Economic Note." Journal of the American Veterinary MedicalAssociation 183:12, December 15, 1983; 185:8, October 15, 1984; and188:2, January 15, 1986
Yoder, S.G. "The Influence of Economic Factors on Medical Students'Career Choices" in Medical Education and Societal Needs: A PlanningReport for the Health Professions, Institute of Medicine, July 1983
- 57-
68