document resume - eric · document resume. he 018 933. facilities ... ingenious design features...
TRANSCRIPT
ED 264 760
TITLE
INSTITUTION
PUB DATENOTEAVAILABLE FROM
PUB TYPE
EDRS PRICEDESCRIPTORS
IDENTIFIERS
DOCUMENT RESUME
HE 018 933
Facilities Inventory and Utilization Study, Fall of1984, for the State of North Carolina. HigherEducation Comprehensive Planning Program.North Carolina Commission on Higher EducationFacilities, Chapel Hill.Oct 85202p.; Some tables are in small print.University of North Carolina, State Commission onHigher Education Facilities, 910 Raleigh Road, P.O.Box 2688, Chapel Hill, NC 27515-2688.Statistical Data (110) -- Reports - Descriptive (141)
NFO1 /PC09 Plus Postage.Accessibility (for Disabled); Capital Outlay (forFixed Assets); Classrooms; *College Buildings;Community Colleges; *Facility Utilization Research;Higher Education; *Institutional Characteristics;Private Colleges; *Space Utilization; State Colleges;*State Surveys*North Carolina; Public Colleges
ABSTRACTResults of the 1984 North Carolina Higher Education
Facilities Inventory and Utilization Study are presented. Tabulardata and narratives appear under four headings: utilization ofinstructional space, interior space characteristics, buildingcharacteristics, and accessibility of facilities to the mobilityimpaired. Statistics for private institutions are shown by group(major research universities, general baccalaureate colleges, andjunior colleges), while individual state college data are provided.Information is included on: capacity/enrollment ratio, average weeklyroom hours of instruction in classrooms and class laboratories, andaverage weekly use of student stations in classrooms and classlaboratories. Interior space characteristics and accessibility forthe mobility impaired are covered for the following subprograms:instruction, research, and public service; academic support; studentservices and physical plant operations; and institutionaladministration and independent operations. Additional informationcovers: building ownership, capital investment for residential andnonresidential buildings, the condition of buildings, and estimatedcost to renovate or replace buildings. An institutional index isincluded. (SW)
***********************************************************************Reproductions supplied by EDRS are the best that can be made
from the original documant.***********************************************************************
eof.Yz:71
_
11.8. DEPANTAIENT OF ECNICAIIONNATIONAL INSTITUTE OF EDUCATION
EDUCATIONAL RESOURCES INFORMATION
CENTER (ERIC)document It been reproduced Fs
received from the Person of ofiRnifitionoripnaling it
0 Minor chances have boil mad. to Improvereproduction quality.
t* Points of view 3f 00k110113 synod in this doct*.moot do not noosourdY Ncursent abut, NIEposition et poky
0
"PERMISSION TO REPRODUCE THIS
MATERIAL HAS BEEN GPANTED BY
24.440a,
TO THE EDUCATIONAL RESOURCES
INFORMATION CENTER (ERIC)"

600 copies of this public document wore printed at a cost of $3.08529. 35 14 per copy
The Facilities Inventory and Utilization Study is published annually by:State Commission on Higher Education FacilitiesThe University of North Carolina-General Administration910 Raleigh RoadP.O. Box 2688Chapel Hill, North Carolina 27515-2688
.,1MIlh
HIGHER EDUCATION COMPREHENSIVE PLANNING PROGRAM
Facilities Inventory and Utilization Study
Fall of 1984
For
THE STATE OF NORTH CAROLINA
EIGHTEENTH EDITION
THE UNIVERSITY OF NORTH CAROLINAState Commission on Higher Education Facilities
Chapel Hill, North Carolina
October 1985
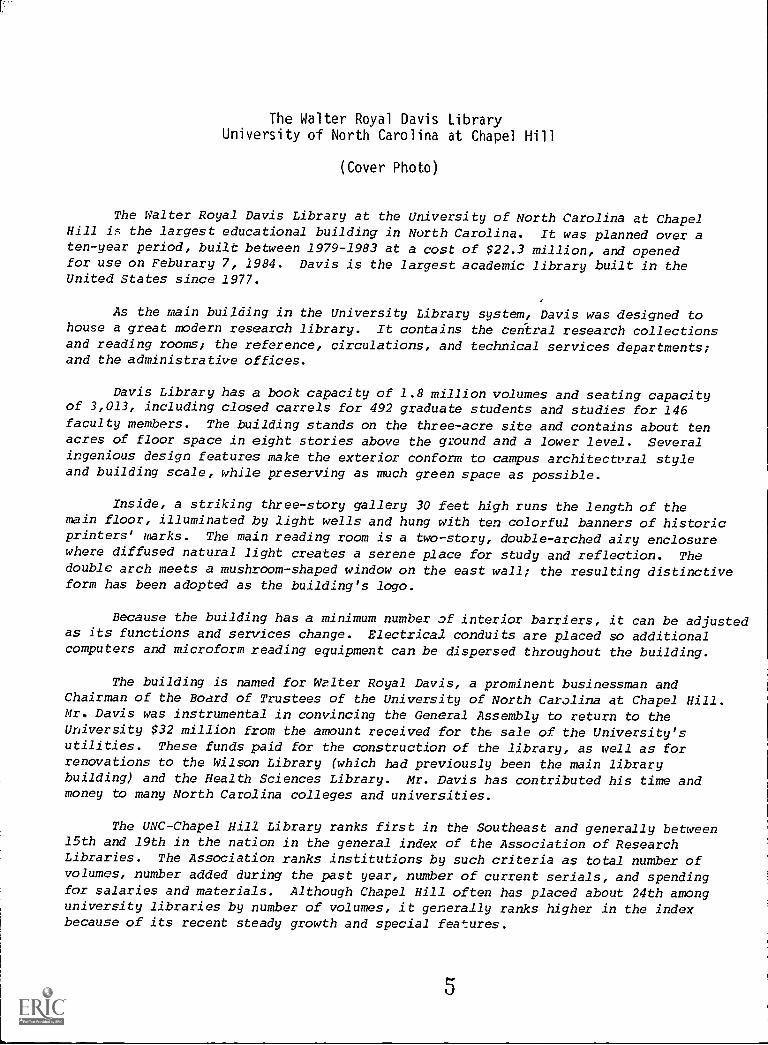
The Walter Royal Davis LibraryUniversity of North Carolina at Chapel Hill
(Cover Photo)
The Walter Royal Davis Library at the University of North Carolina at ChapelHill is the largest educational building in North Carolina. It was planned over aten-year period, built between 1979-1983 at a cost of $22.3 million, and openedfor use on Feburary 7, 1984. Davis is the largest academic library built in theUnited States since 1977.
As the main building in the University Library system, Davis was designed tohouse a great modern research library. It contains the Central research collectionsand reading rooms; the reference, circulations, and technical services departments;and the administrative offices.
Davis Library has a book capacity of 1.8 million volumes and seating capacityof 3,013, including closed carrels for 492 graduate students and studies for 146faculty members. The building stands on the three-acre site and contains about tenacres of floor space in eight stories above the ground and a lower level. Severalingenious design features make the exterior conform to campus architectural styleand building scale, while preserving as much green space as possible.
Inside, a striking three-story gallery 30 feet high runs the length of themain floor, illuminated by light wells and hung with ten colorful banners of historicprinters' marks. The main reading room is a two-story, double-arched airy enclosurewhere diffused natural light creates a serene place for study and reflection. Thedouble arch meets a mushroom-shaped window on the east wall; the resulting distinctiveform has been adopted as the building's logo.
Because the building has a minimum number of interior barriers, it can be adjustedas its functions and services change. Electrical conduits are placed so additionalcomputers and microform reading equipment can be dispersed throughout the building.
The building is named for Walter Royal Davis, a prominent businessman andChairman of the Board of Trustees of the University of North Carolina at Chapel Hill.Mr. Davis was instrumental in convincing the General Assembly to return to theUniversity $32 million from the amount received for the sale of the University'sutilities. These funds paid for the construction of the library, as well as forrenovations to the Wilson Library (which had previously been the main librarybuilding) and the Health Sciences Library. Mr. Davis has contributed his time andmoney to many North Carolina colleges and universities.
The UNC-Chapel Hill Library ranks first in the Southeast and generally between15th and 19th in the nation in the general index of the Association of ResearchLibraries. The Association ranks institutions by such criteria as total number ofvolumes, number added during the past year, number of current serials, and spendingfor salaries and materials. Although Chapel Hill often has placed about 24th amonguniversity libraries by number of volumes, it generally ranks higher in the indexbecause of its recent steady growth and special features.
5
The University of North Carolina
Philip P. Carson, Chairman William C. FridayBoard of Governors President
North Carolina StateCommission on Higher Education Facilities
Honorable Sneed High, ChairmanFayetteville
Mrs. Earl W. BrianRaleigh
Mr. William A. Dees, Jr.Goldsboro
Mr. Joseph W. Grier, Jr.Charlotte
Charles L. WheelerDirector
Dr. J. E. DanieleyElon College
Staff
Mr. R. Barton HayesHudson
Mr. John R. JordanRaleigh
Mr. A. E. SpearsCharlotte
Thomas H. HeathAssistant Director
David D. McFaddenInventory Project Supervisor
General Advisory Committee
Pres. William C. FridayUniversity of North Carolina
iii
Pres. Bruce E. WhitakerChowan College
Dr. Kenneth R. WilliamsChancellor EmeritusWinston-Salem State
University
Facilities Advisory Committee
Silas Vaughn, ChairmanPresidentMontreat-Anderson CollegeMontreat
Dr. W. Archie BlountDirector Emeritus of Institutional
Research and DevelopmentNorth Carolina A & T State
University
Dr. Gerald B. JamesPast PresidentRockingham Community CollegeWentworth
L. Felix JoynerVice President - FinanceUniversity of North CarolinaChapel Hill
Ned R. TrivetteVice Chancellor for Business
AffairsAppalachian State UniversityBoone
James A. WardUniversity Architect EmeritusDuke UniversityDurham
Facilities Technical Committee
Thomas H. Heath, ChairmanDavid D. McFaddenMaurice E. SalaniHigher Education Facilities
Philip AlbanoJulian WingfieldDepartment of Community Colleges
Ralph M. DyersN. C. Center for Independent
Higher Education
Mary Jones
William A. KirklandDuke University
James PierceN. C. Central University
Allen S. WatersUniversity of North Carolina
Project Staff
Thomas H. Heath, Supervisor
David D. McFadden
iv
Ann Cole
Major ResearchUniversities
N. C. State University
UNC at Chapel Hill
Other DoctoralUniversities
UNC at Greensboro
Comprehensiveb-iiversities
Appalachian State Univ.
East Carolina Univ.
N. C. A & T State Univ.
N. C. Central Univ.
UNC at Charlotte
Western Carolina Univ.
Gen. BaccalaureateUniversities
Elizabeth City State Univ.
Fayetteville State Univ.
Pembroke State Univ.
UNC at Asheville
UNC at Wilmington
Winston-Salem State Univ.
Specialized Institution
N. C. School of the Arts
Participating Institutions
THE UNIVERSITY OF NORTH CAROLINAWilliam C. Friday, President
Chancellor
Bruce R. Poulton
Christopher C. Fordham
Chancellor
William E. Moran
Chancellor
John E. Thomas
John M. Howell
Edward B. Fort
Leroy T. Walker, Acting
E. K. Fretwell, Jr.
Myron L. Coulter
Chancellor
Jimmy R. Jenkins
Charles Lyons, Jr.
Paul R. Givens
David G. Brown
William H. Wagoner
Cleon F. Thompson, Jr.
Chancellor
Jane E. Milley
v
Project Officer
Martha WelchAsst. Registrar
Karen CopelandFacilities Planning
Project Officer
A. Lawrence FincherV. C. Admin. & Plan.
Project Officer
Patricia M. LoganAdm. Asst., Bus. Affairs
Robert M. UsseryDir. Inst. Research
Jewel StewartDir. Inst. Res. & Plan.
James PierceDir. Inst. Studies
Wanda B. FisherDir. Inst. Research
Cecil BrooksAssoc. Dir. Inst. Res.
Project Officer
Leonard R. BallouDir. Inst. Research
Leonza Loftin, ActingDir. Inst. Res. & Plan.
Dalton BrooksDir. Inst. Research
Thomas R. CochranAssoc. Vice ChancellorRobert E. FryDir. Inst. Research
Evelyn A. TerryDir. Inst. Research
Project Officer
Robert Huber
Dir. Facilities Plan.
Teaching Hospital
N. C. Memorial Hospital
Executive Director
Eric B. Munson
Project Officer
Bill W. BarnesPlant Engineering
NORTH CAROLINA DEPARTMENT OF COMMUNITY COLLEGESRobert W. Scott, State President
Community Colleges,
Technical Institutes &Technical Colleges
Anson TC
Asheville-Buncombe TC
Beaufort County CC
Bladen TC
Blue Ridge TC
Brunswick TC
Caldwell CC & Ti
Cape Fear TI
Carteret TC
Catawba Valley TC
Central Carolina IC
Central Piedmont CC
Cleveland TC
Coastal Carolina CC
College of the Albemarle
Craven CC
Davidson County CC
Durham TI
Edgecombe TC
Fayetteville TI
Forsyth TI
President
Edwin R. Chapman
Harvey L. Haynes
James P. Blanton
Lynn G. King
William D. Killian
Joseph B. Carter
Eric B. McKeithan
E. Thomas Satterfield, Jr.
Donald W. Bryant
Robert E. Paap
Marvin R. Joyner
Richard Hagemeyer
James Petty
James L. Henderson, Jr.
J. Parker Chesson, Jr.
Thurman Brock
J. Bryan Brooks
Phail Wynn, Jr.
Charles B. McIntyre
Craig Allen
Bob H. Greene
vi
Project Officer
Anna BaucomMIS, Inst. ResearchK. Ray BaileyV. P. Admin. ServicesLuther J. DavisBus. Mgr.
Vince RevelsVice President
Jacqueline L. BeddingfieldDevel. & Grants Officer
L. Vernon WardBus. Mgr.
George W. ArmfieldV. P. Admin.
Matthew DonahueDean Curric. Programs
Keith E. FowlerPurchasing Officer
Ray Lane
Dir. Fiscal AffairsE. C. Price
Bus. Mgr.Sol HellingerDir. Aux. Svcs.
James E. GreenBus. Mgr.
Roger M. DaughtryBus. Mgr.
Gerald BrayDean Admin. Svcs.
S. Russell SuttonBus. Mgr.
B. G. Manning
Bus. Mgr.Ronald H. HilbertCoord., Plan'ng & Res.
Charlie R. HarrellBus. Mgr.
Sanford Cain
Dir. Facility Plan'ng Svc.Grace Corey, Dean
Gen. Studies Div.
Gaston College
Guilford TCC
Halifax CC
Haywood TC
Isothermal CC
James Sprunt TC
Johnston TC
Lenoir CC
Martin CC
Mayland TC
McDowell TC
Mitchell CC
Montgomery TC
Nash TC
Pamlico TC
Piedmont TC
Pitt CC
Randolph TC
Richmond TC
Roanoke-Chowan TC
Robeson TC
Rockingham CC
Rowan TC
Sampson TC
Sandhills CC
Southeastern CC
Southwestern TC
W. Wayne Scott
Raymond J. Needham
Phillip Taylor
Joseph H. Nanney
G. Herman PorterActing
Carl D. Price
John L. Tart
Jesse L. McDaniel
Travis Martin
0. M. Blake, Jr.
Robert M. Boggs
Charles C. Poindexter
Benny B. Hampton
J. Reid Parrott, Jr.
Paul H. Johnson
Edward W. Cox
Charles E. Russell
Merton H. Branson
Joseph W. Grimsley
David W. Sink
Fred G. Williams, Jr.
N. Jerry Owens
Richard L. Brownell
Clifton W. Paderick
Raymond A. Stone
Dan W. Moore
Norman K. Myers
vii
1()
David JohnsonDean, Even. Programs
Wanda DaughtryAsst. to President
L. Alan WrightDean of Business
R. Wayne HawkinsDean of Fiscal Affairs
Catherine G. JollyComptroller
Herman KightBus. Mgr.
Gary BlackmonPurchasing Officer
H. E. McKinneyBus. Mgr.Irene LeggettEquip. Coordinator
Kay GoinsSecy to Dean of Instr.
Charles E. McKinneyBus. Mgr.Kenneth Bradshaw, DeanStud. Development
Doris M. HaywoodBus. Mgr.
Margaret StricklandController
Gary B. CollierBus. Mgr.
William D. RentzVP Acad. & Student AffairsJoseph W. HunniecuttDean Admin. Svcs.
Larry K. Linker, Exec.V. P. Admin. Svcs.Ralph HarrisEvening Director
Robert C. VaughanDir. MIS
Eddie Mac LocklearV. P. Admin. & Personnel
Doris R. GarrettAdm. Asst. to Bus. Mgr.Ronald F. BostianExec. Dean
William M. RaussBus. Mgr.
George LewisAsst. to the President
Robert G. StanleyBus. Mgr.
John W. AsheBus. Mgr.
Stanly TC
Surry CC
TC of Alamance
Tri-County CC
Vance-Granville CC
Wake TC
Wayne CC
Western Piedmont CC
Wilkes CC
Wilson County TI
Major Research
Universities:
Duke University
Wake Forest University
Bowman Gray Sch. of Med.Wake Forest Univ.
Gen. BaccalaureateColleges
Atlantic Christian College
Barber-Scotia College
Belmont Abbey College
Bennett College
Campbell University
Catawba College
Davidson College
El on College
Charles H. Byrd
Swanson Richards
W. Ronald McCarter
Vincent W. Crisp
Ben F. Currin
Bruce I. Howell
Clyde A. Erwin, Jr.
James A. Richardson
David E. Daniel
Frank L. Eagles
PRIVATE INSTITUTIONS
President
H. Keith Brodie
Thomas J. Hearn, Jr.
Richard Janeway
President
James B. Hemby
Mabie P. McLean
John R. Dempsey
Isaac H. Miller, Jr.
Norman A. Wiggins
Stephen H. Wurster
John W. Kuykendall
J. Fred Young
Ifni. 11
Donnie N. LowderVP Fiscal & Admin. AffairsH. Clyde JohnsonDean of Admin. Svcs.
J. Dillon CherryBus. Mgr.
Carl S. MooreDir. Occup. Education
Bill HardisonBus. Mgr.Jam- A. CoxV. P. for Admin. Svcs.
Carl T. CoxV. P. Admin. Svcs.Larry ClarkDir. Office of : anning
Frank A. ShufordSupt. Bldg. & Equip.
Rufus S. SwainRes. Develop. Officer
Project Officer
William KirklandDir. Plant Accounting
John RiderAcad. Fac. Officer
Ross A. GriffithDir. Space Management
Bill R. HickmanFacilities Planner
Project Officer
F. Mark DavisDean
James DavidsonRegistrar
Michael ButtnerRegistrar
Onetta ThomasBus. Mgr.
James C. KinardDir. Physical Plant
Frank JacksonAsst. to VP Planing & Admin.
Grover MeetzeDir. Physical Plant
Margaret O'ConnellExec. Housekeeper
'4
Gardner-Webb College
Greensboro College
Guilford College
High Point College
Johnson C. Smith Univ.
Lenoir-Rhyne College
Livingstone College
Mars Hill College
Meredith College
Methodist College
Mount Olive College
N. C. Wesleyan College
Pfeiffer College
Piedmont Bible College
Queens College
Sacred Heart College
St. Andrews Presby. College
St. Augustine's College
Salem College
Shaw University
Warren Wilson College
Wingate College
Junior Colleges
Brevard College
Chowan College
Lees-McRae College
Craven E. Williams
William H. Likins
William R. Rogers
Jacob C. Martinson, Jr.
Robert Albright
John E. Trainer, Jr.
William Greene
Fred B. Bentley
John E. Weems
M. Elton Hendricks
W. Burkette Raper
S. Bruce Petteway
Cameron P. West
Donald K. Drake
Billy O. Wireman
Mary Michel Boulus
Alvin P. Perkinson
Prezell R. Robinson
Thomas V. Litzenburg
Stanley H. Smith
Reuben A. Holden
Paul R. Corts
President
William T. Greer, Jr.
Bruce E. Whitaker
Bradford L. Crain
ix
12
Wayne BrunnickBus. Mgr.
Charlotte DivitciRegistrarRichard L. CoeBus. Mgr.
Charles HartsoeBus. Mgr.
Furness ArmsteadAdmin. OfficerEd SmithDir. Security Office
Ozell CowanOff. Mgmt. Info. System
Larry N. SternDir. Inst. Research
Charles E. Taylor, Jr.V. P. Bus. & Fin.
Roy A. WhitmireBus. Mgr.
James A. CoatsBus. Mgr.
Ray KirklandV. P. Finance
E. Raymond HackettDir. Inst. Research
Cliff AshburnActing Bus. Mgr.David ZeesoPhysical Plant Director
Charles McKenzieBus. Mgr.
Jerry G. SurfaceBus. Mgr.
J. Mills HollowayV. P. Fin. Affairs
Thomas N. Macon, Jr.Chief Bus. Officer
Mack SowellDean Student Affairs
Julio GuisasolaDir. Physical Plant
Harry SherwoodDir. College Relations
Project Officer
Bobby L. HayesDir. Fin. Affairs
Ben C. Sutton
Bus. Mgr.Melvin C. LawV. P. Bus. Affairs
Louisburg College
Montreat-Anderson College
Peace Col lege
St. Mary's College
J. Allen Norris, Jr.
Silas M. Vaughn
S. David Frazier
John T. Rice
Walter N. McDonaldAsst. Academic DeanWalter HallComptroller
Gene LilleyBus. Mgr.
B. W. ConradBus. Mgr.
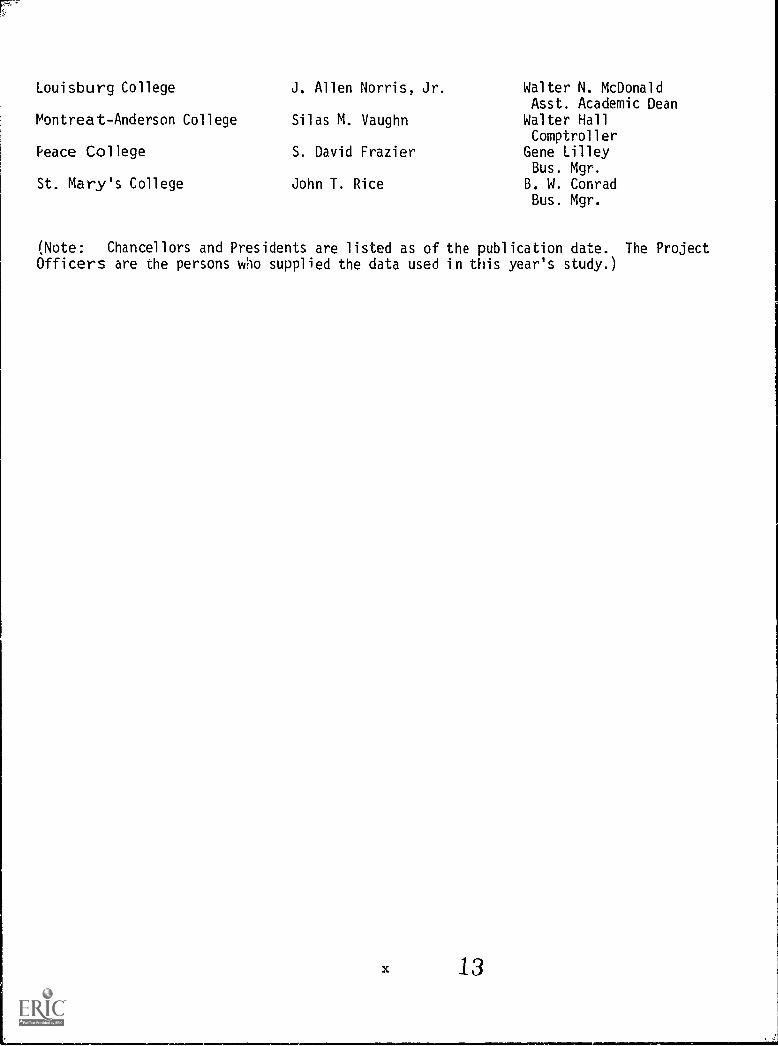
(Note: Chancellors and Presidents are listed as of the publication date. The ProjectOfficers are the persons who supplied the data used in this year's study.)
Foreword
This study, the eighteenth in the annual series of facilitiesinventory and utilization studies, reflects the status of space inNorth Carolina institutions of higher education at the end of theadd-drop period of the 1984 fall term at each college. It also givessome indications of the use being made of the space and provides, wherefeasible, norms and historical information for the past five years toenable institutions to make their own assessments of their facilities.
Statistics for private institutions are shown by group, ratherthan by institution, because of the agreement made with these insti-tutions when the project was initiated. Annually, each institution isforwarded its own data and can then make a self-assessment on the basisof these data, its historical record, group data, and the norms citedfor the various tables.
The purposes of this study include providing facilities data tofederal and state authorities, making data on North Carolina facilitiesavailable to other Commissions for comparative purposes, and providingparticipating institutions with data which may be helpful in the manage-ment of their facilities. This report presents selected summary infor-mation from the quantities of data assembled in the 1984 comprehensiveplanning studies.
Public senior institutions; community colleges, technicalcolleges, and technical institutes; and private institutions throughoutthe state have cooperated fully in time, energy, and funds to providedata for the studies. The participating institutions are listed in thepreceding section. The gathering and review of data for the studieshave been accomplished through the joint effort of the agencies providingmembership to the Facilities Technical Committee.
Special acknowledgement and appreciation are expressed to thefollowing individuals for the cooperation and contributions: PhilipAlbano and Julian Wingfield of the Department of Community Colleges,Ralph Byers of the N. C. Center for Independent Higher Education,William Kirkland of Duke University, James Pierce of N. C. CentralUniversity, and Allen Waters of The University of North Carolir&-GeneralAdministration. The Project Officers of the participating institutionsdeserve special recognition for the tremendous job they have done inproviding the basic data for this study.
The Commission staff also expresses appreciation to members ofthe Facilities Advisory Committee for their advice and counsel throughthe years.
Charles L. WheelerDirector
xi
14
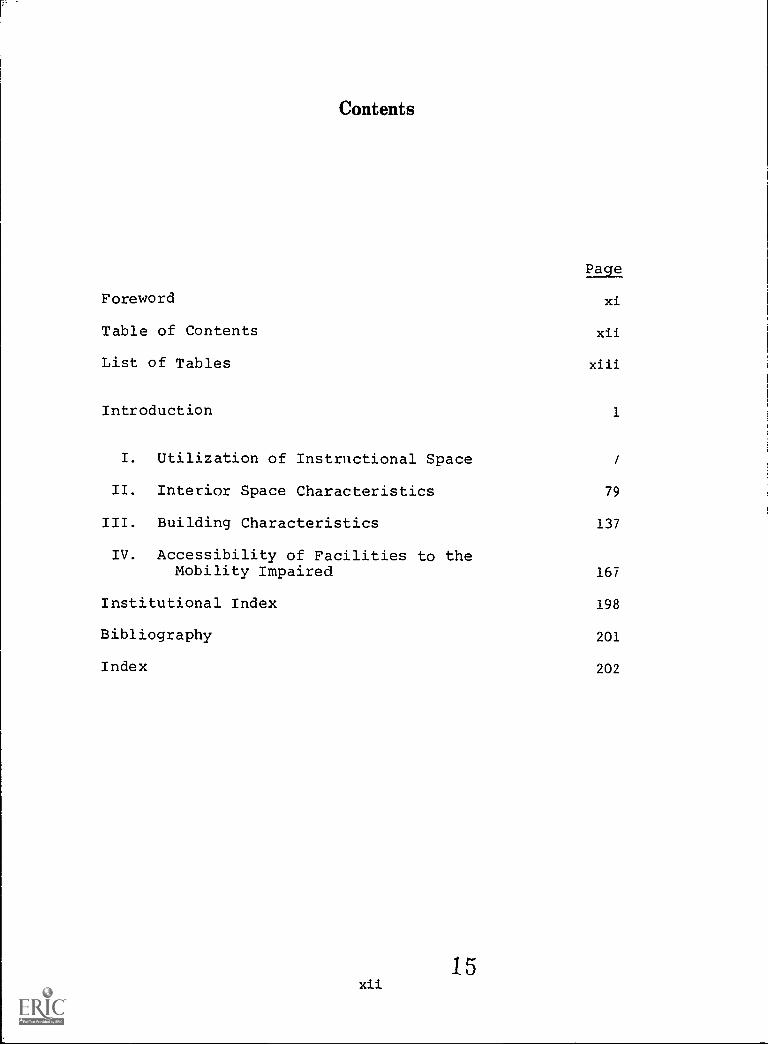
Contents
Page
Foreword xi
Table of Contents xii
List of Tables xiii
Introduction 1
I. Utilization of Instructional Space /
II. Interior Space Characteristics 79
III. Building Characteristics 137
IV. Accessibility of Facilities to theMobility Impaired 167
Institutional Index 198
Bibliography 201
Index 202
15xii
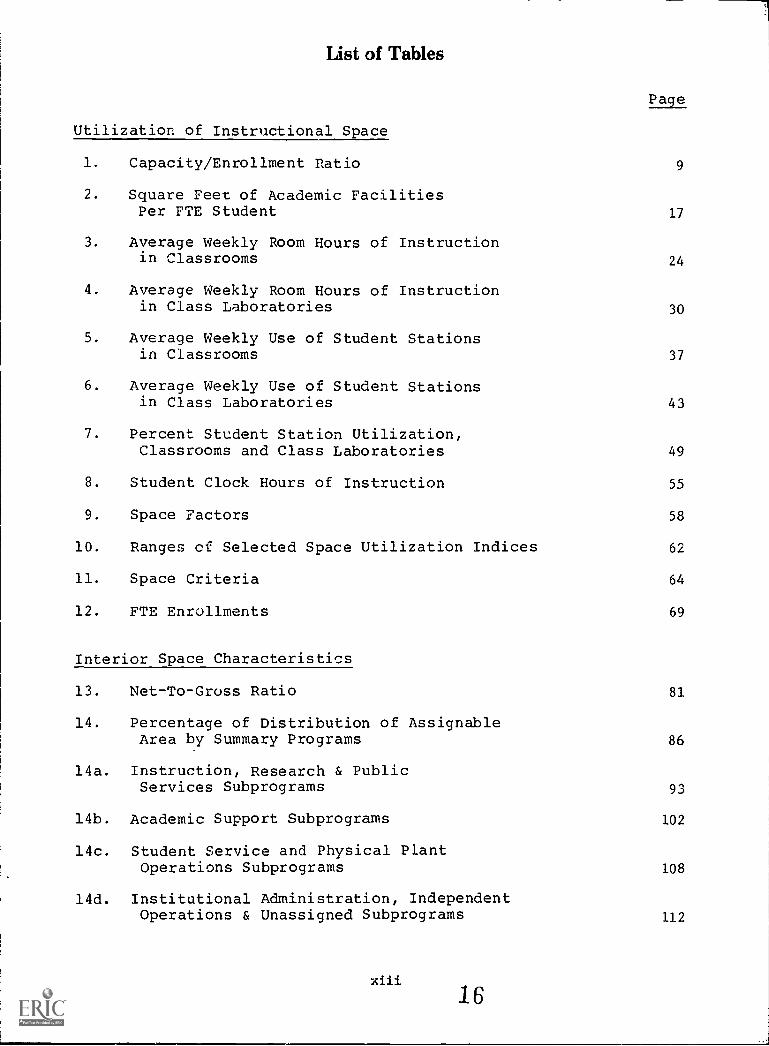
List of Tables
Utilization of Instructional Space
1. Capacity/Enrollment Ratio
2. Square Feet of Academic FacilitiesPer FTE Student
3. Average Weekly Room Hours of Instructionin Classrooms
4. Average Weekly Room Hours of Instructionin Class Laboratories
5. Average Weekly Use of Student Stationsin Classrooms
6. Average Weekly Use of Student Stationsin Class Laboratories
Page
9
17
24
30
37
43
7. Percent Student Station Utilization,Classrooms and Class Laboratories 49
8. Student Clock Hours of Instruction 55
9. Space Factors 58
10. Ranges of Selected Space Utilization Indices 62
11. Space Criteria 64
12. FTE Enrollments 69
Interior Space Characteristics
13. Net-To-Gross Ratio 81
14. Percentage of Distribution of AssignableArea by Summary Programs 86
14a. Instruction, Research & PublicServices Subprograms
14b. Academic Support Subprograms
14c. Student Service and Physical PlantOperations Subprograms
14d. Institutional Administration, IndependentOperations & Unassigned Subprograms
16
93
102
108
112
Page
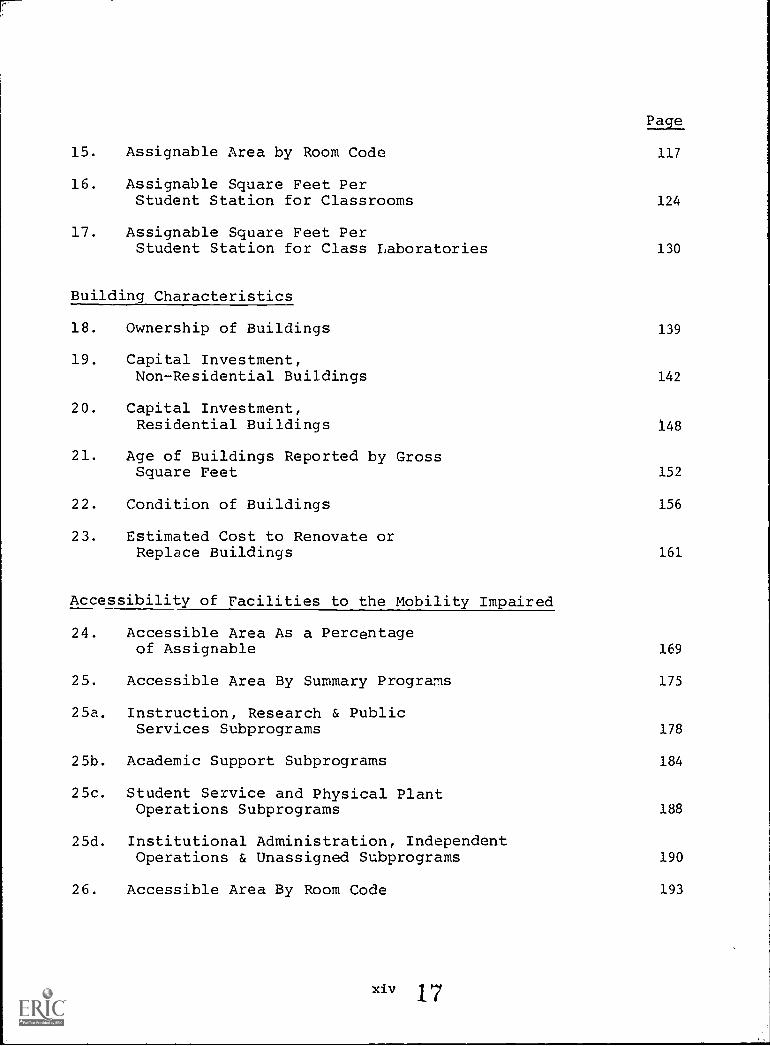
15. Assignable Area by Room Code 117
16. Assignable Square Feet PerStudent Station for Classrooms 124
17. Assignable Square Feet PerStudent Station for Class Laboratories 130
Building Characteristics
18. Ownership of Buildings
19. Capital Investment,Non-Residential Buildings
139
142
20. Capital Investment,Residential Buildings 148
21. Age of Buildings Reported by GrossSquare Feet 152
22. Condition of Buildings 156
23. Estimated Cost to Renovate orReplace Buildings 161
Accessibility of Facilities to the Mobility Impaired
24. Accessible Area As a Percentageof Assignable 169
25. Accessible Area By Summary Programs 175
25a. Instruction, Research & PublicServices Subprograms 178
25b. Academic Support Subprograms 184
25c. Student Service and Physical PlantOperations Subprograms 188
25d. Institutional Administration, IndependentOperations & Unassigned Subprograms 190
26. Accessible Area By Room Code 193
xiv 17
Introduction
The efficient use of campus facilities is of increasing con-cern to most colleges and universities. This concern is partiallya reflection of the high costs involved in constructing and main-taining buildings, but it also stems from a broader recognition ofthe importance of facilities planning. The effective allocation andutilization of space is essential if an institution of highereducation is to maximize its resources in accomplishing its objectivesin the areas of instruction, research, and public service.
The primary purpose of the Facilities Inventory and UtilizationStudy is to provide higher education administrators with a detailedstatistical profile of the facilities of their own campuses and ofthe other colleges and universities in North Carolina. The studyalso presents data which can provide the basis for comparative assess-ments of the extent to which space is used for instructional purposes.In short, this publication is intended as an important analytical toolfor use in facilities planning. It is published annually by theState Commission on Higher Education Facilities, which is part ofThe University of North Carolina-General Administration.
Institutions Included
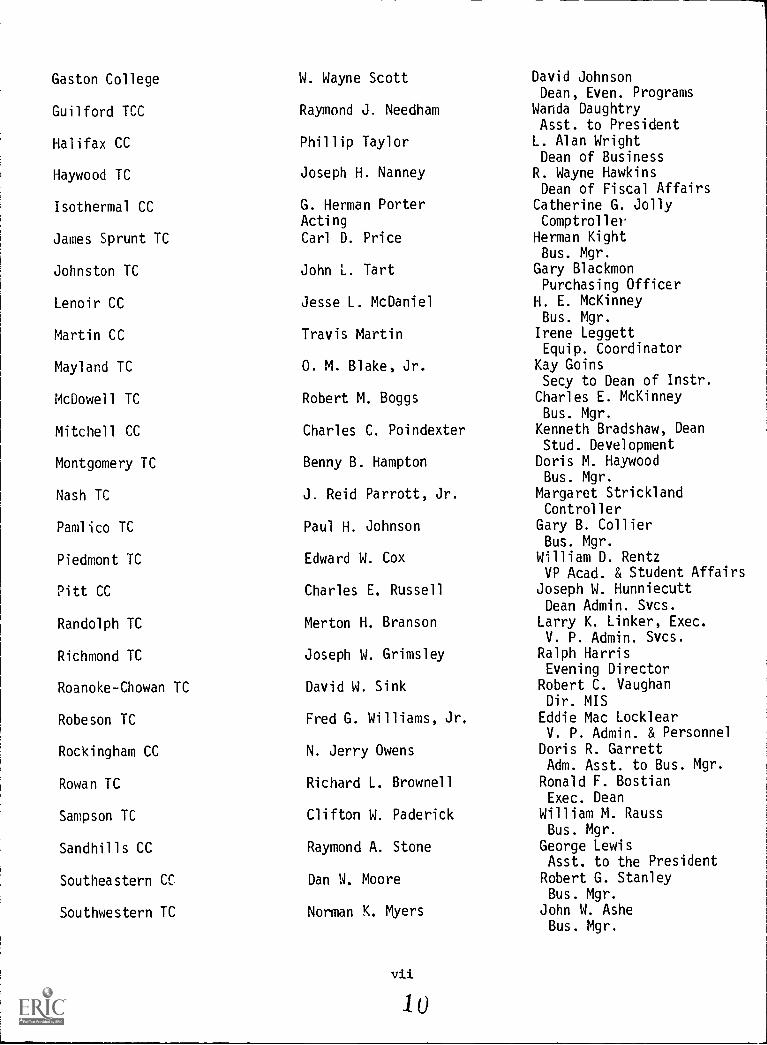
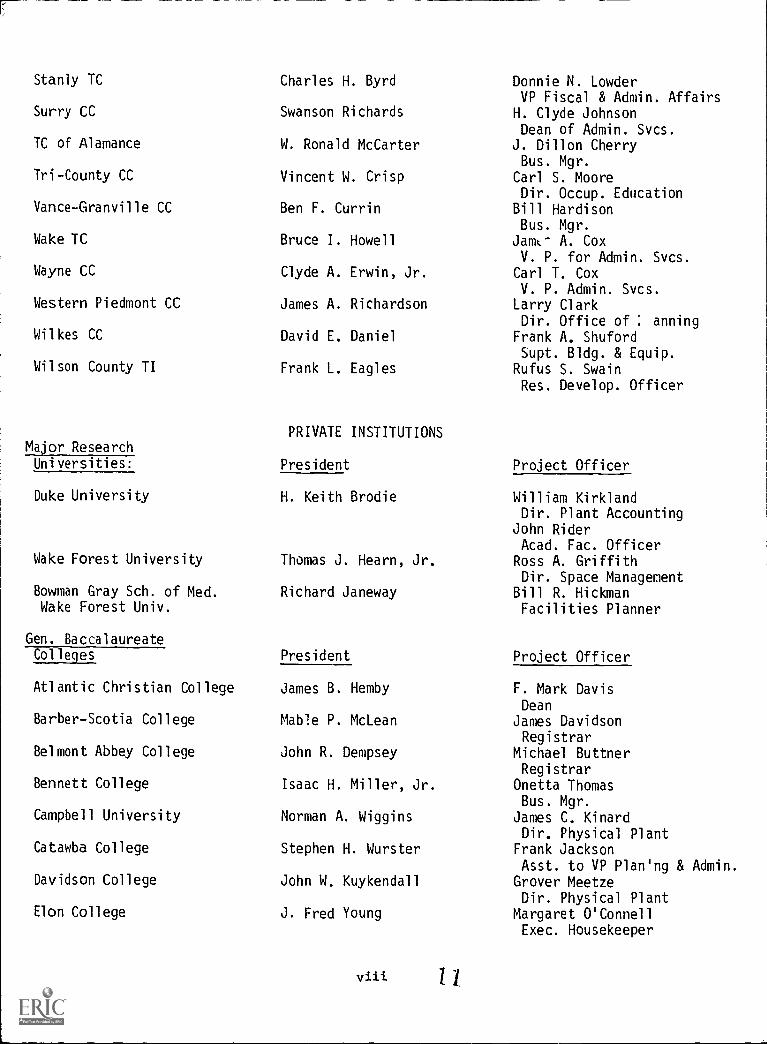
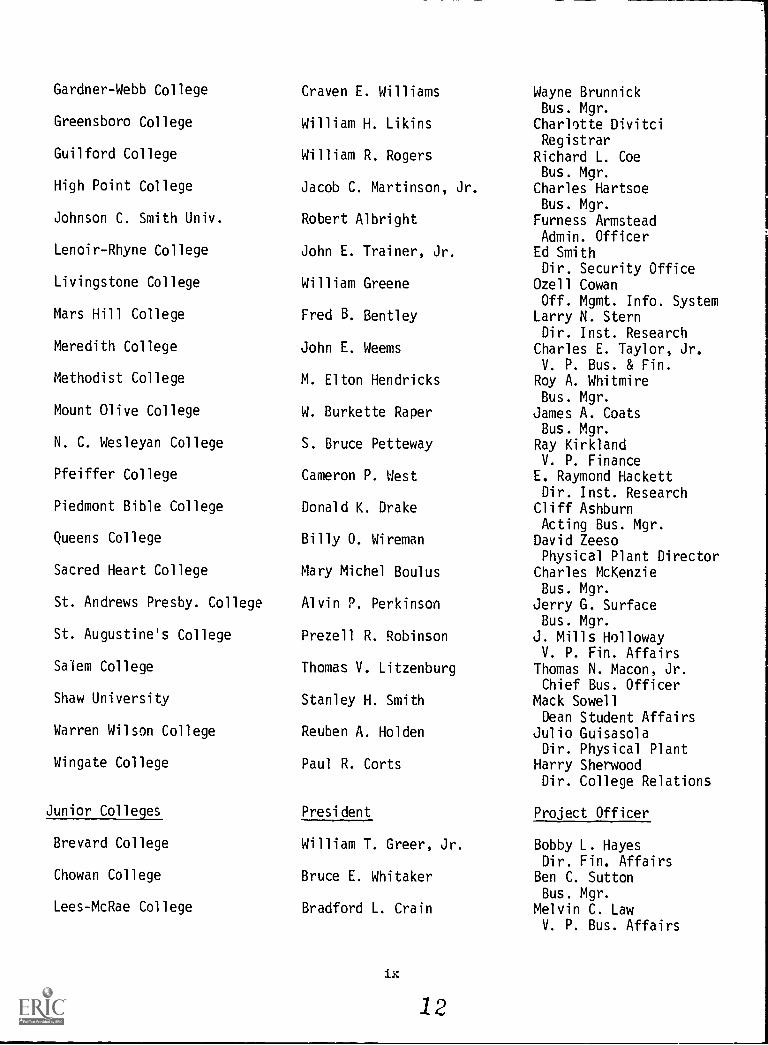
The study provides data for 114 institutions of higher educa-tion in North Carolina. This universe includes all of the sixteenpublic senior institutions which comprise The University of NorthCarolina, 40 private non-profit colleges and universities, and the5E public two-year institutions which represent the Community CollegeSystem. In addition, data are provided for North Carolina MemorialHospital, a part of The University of North Carolina. All proprietaryinstitutions are omitted from the study, as well as two Bible colleges(John Wesley College and Roanoke Bible College) and a theologicalseminary (Southeastern Baptist Theological Seminary). The partici-pating colleges and universities are listed by type of institution onpage v-x, along with the name of the President or Chancellor and theCommission's project officer for each school. An alphabetical listingof these institutions, including mailing addresses and other informa-tion, can be found on pages 198-200.
At the request of the participating private colleges anduniversities, individual data for these institutions are not printedin the study. Instead, totals are reported for the three principalcategories of private institutions: major research universities,general baccalaureate colleges, and junior colleges. Each privateinstitution is provided with facilities data for its own campus inorder to enable it to make comparisons with the relevant group totalsin the study.
1
18
Because of the unique facilities requirements of medicalschools, data for the Divisions of Health Affairs at East CarolinaUniversity and the University of North Carolina at Chapel Hill arelisted separately from their parent campuses. For similar reasons,the Higher Education Facilities Commission began in 1983 to listseparately the data for North Carolina State University's School ofVeterinary Medicine. It should be noted that the Veterinary Schoolwas first reflected in the study in 1982, but its data that yearwere not listed separately.
Types of Data Colleted
The study is divided into four sections which reflect thefour broad categories of facilities data which are reported: theutilization of instructional space, interior space characteristics,building characteristics, and accessibility of facilities to themobility impaired. The section on the utilization of instructionalspace provides ratios, percentages, and indices which relate theamount of instructional activity at an institution to various cate-gories of campus space. The section dealing with interior spacecharacteristics statistically describes campus space by its usesand the programs to which it is assigned. It also provides datarelating the size and capacities of classrooms and class laboratories.The building characteristics section focuses on such data elementsas building age, condition, and replacement cost. The final sectiondescribes the amount and type of campus space which is accessible topersons who are confined to wheelchairs.
This study is designed to provide only a "snapshot" ofinstitutional facilities at a particular point in time. Facilitiesdata reflect all buildings which were completed as of October 1 ofthe year of the study. Utilization data reflect only the courseswhich were under way as of the drop-add period of the fall term.The data do not take into account any instructional activity thatoccurred during the spring semester or quarter.
It should also be that different types of institutionswill often have very different space needs. As a result, two insti-tutions with facilities which are equally well-utilized may havesignificantly different utilization data. Thus, it is generallyunwise to attempt to make comparisons between two institutions whichare dissimilar in terms of their levels or the instructional programswhich they offer. Peer comparisons provide the most reliable meansof assessment.
Procedures Used in Collecting Data
The Higher Education Facilities Commission maintains anannually updated, computer-based facilities inventory of each institu-tion included in the study. A facilities inventory is comprised of
2
19
a Building Characteristic Report and a Room Characteristic Report.The Building Characteristic Report lists and provides detailed informa-tion about each building on an institution's campus. The RoomCharacteristic Report lists every room in each building and providesinformation about its size and capacity. Each room is also coded toreflect its use and the institutional programs which it supports.
Each fall every institution supplies the Commission with alist of changes in its facilities inventory occurring since theprevious fall. Most of the colleges and universities provide thesedata by annotating a copy of their previous year's inventory. Aninstitution may choose, however, to provide its facilities update databy supplying the Commission with a computer tape of its currentfacilities inventory.
Space utilization data are based on the annual submission byeach institution of a list of its fall term courses. For each course,the institution provides information indicating when and where theclass meets and the number of students enrolled. Many institutionsprovide these data on computer tape. The others supply their utili-zation data on computer printouts or on specially designed utilizationforms, and the Commission keys this information onto computer tape.Each institution's course data are run against its updated facilitiesinventory to generate the Instructional Space Utilization Report. Thereport indicates how effectively an institution uses its facilitiesand measures its need for classroom and laboratory space in relationto comparable institutions.
Schools which need help in updating their facilities inven-tories or compiling utilization data are given technical assistanceby the Commission staff. Questions are answered by telephone, or ifa problem is particularly complex, a campus visit is arranged, TheCommission staff also assists institutions by taking the measurementsof new buildings for which the institutions have provided blueprints.
Both the facilities inventory updates and the utilization datafrom each school are reviewed carefully by the Commission staff.Extensive computer edits are also used as a means of ensuring accuracyand consistency. When problems are discovered, the institutions arecontacted for additional information or corrections.
Every year each institution receives two copies of its updatedBuilding and Room Characteristic Reports and its Instructional SpaceUtilization Report. Also provided are two copies of the Building DataSummary Report, which analyzes in detail the institution's buildingdata, and ten statistical tables which describe the institution'sassignable area and its accessible space in terms of their use and theprograms to which they are assigned. The reports and tables are alsosupplied to the Finance Division of The University of North Carolina-General Administration (UNC constituent institutions only), the Depart-
3
20
ment of Community Colleges (two-year public institutions only), andto the Office of State Property of the Department of Administration(UNC constituent institutions only).
The Facilities InventorZ and Utilization Study is based on thedata contained in these tables and reports. It is distributed to thepresident or chancellor of each institution, the Commission's insti-tutional project officers, the Higher Education Facilities Commissionsin the other states, the libraries of the participating institutions,and the members of the Commission's advisory committees. Copies areavailable without charge to persons who request them.
Limitations and Special Situations
This study contains reliable and useful information concerningthe facilities of colleges and universities in North Carolina and theirutilization for instructional purposes. It is important, however, tonote two limitations in the data provided.
Although campus facilities would generally be viewed as in-cluding such things as parking lots, tennis courts, and radio controltowers, this study is limited to data relating to buildings. Forpurposes of the study, a building is defined as adly roofed structure.This definition does include trailers and other mobile units.
Because of technical problems in collecting course informationfrom medical schools and related programs, utilization data are notsupplied by the Divisions of Health Affairs at East Carolina Universityand the University of North Carolina at Chapel Hill, or by the BowmanGray School of Medicine, the Duke University Medical Center, the NorthCarolina Memorial Hospital, or the North Carolina State UniversitySchool of Veterinary Medicine. They are, therefore, excluded frommost of the utilization tables. Separate enrollment figures areprovided for these divisions, however, and Table 2 includes utiliza-tion data for the Veterinary School and the two Divisions of HealthAffairs at public institutions (although these data are excluded fromall totals) .
Special situations exist at several institutions which createproblems in reporting utilization data. The following changes in theutilization reporting procedures have been made to reflect thesesituations accurately and fairly in the data.
The campus of the School of the Arts is used to instructsecondary school students as well as students at the college level.To reflect this fact, the high school courses conducted on thatcampus were also considered in calculating student clock hours forthat institution. The high school students were not included inthe full-time equivalent enrollment figures for the School of theArts, however. This has the effect of significantly underestimating
4
21
the total utilization of academic space at the School of the Arts asreported in Table 2. It should also be noted that the programs con-ducted at the School of the Arts inherently require sianificantlymore space per student than at other constituent institutions of TheUniversity of North Carolina. Comparisons of this institution'sutilization with that of any other college or university would, there-fore, be misleading.
Western Carolina University conducts a number of courses onthe campus of the University of North Carolina at Asheville. Beginningin 1981, the student clock hours of UNC at Asheville reflected theseWCU courses, as well as courses for WCU students sponsored by UNC atAsheville and conducted on its campus. Full-time equivalent enroll-ments of the WCU-sponsored courses at UNC at Asheville are, however,credited to WCU rather than to UNC at Asheville.
Gardner-Webb College offers classes on the campus of MitchellCommunity College. These classes have been included in the utilizationdata for Mitchell but are not reflected in the full-time equivalentenrollment for that institution.
5
22

\
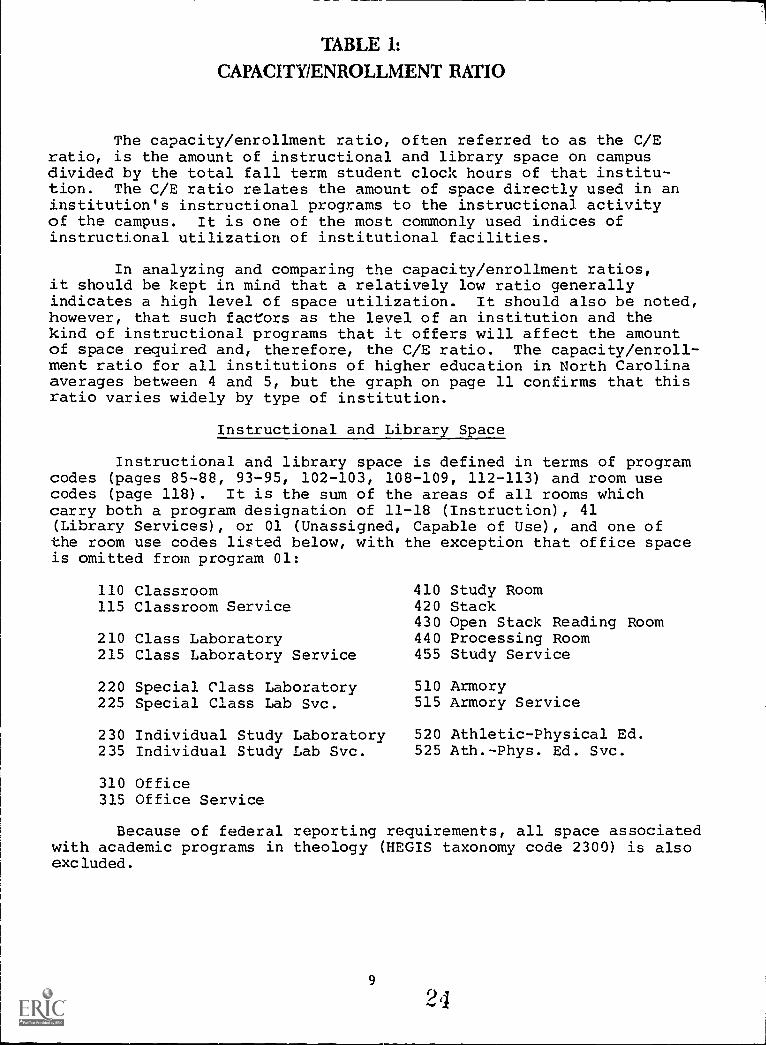
TABLE 1:
CAPACITY/ENROLLMENT RATIO
The capacity/enrollment ratio, often referred to as the C/Eratio, is the amount of instructional and library space on campusdivided by the total fall term student clock hours of that institu-tion. The C/E ratio relates the amount of space directly used in aninstitution's instructional programs to the instructional activityof the campus. It is one of the most commonly used indices ofinstructional utilization of institutional facilities.
In analyzing and comparing the capacity/enrollment ratios,it should be kept in mind that a relatively low ratio generallyindicates a high level of space utilization. It should also be noted,however, that such factors as the level of an institution and thekind of instructional programs that it offers will affect the amountof space required and, therefore, the C/E ratio. The capacity/enroll-ment ratio for all institutions of higher education in North Carolinaaverages between 4 and 5, but the graph on page 11 confirms that thisratio varies widely by type of institution.
Instructional and Library Space
Instructional and library space is defined in terms of programcodes (pages 85-88, 93-95, 102-103, 108-109, 112-113) and room usecodes (page 118). It is the sum of the areas of all rooms whichcarry both a program designation of 11-18 (Instruction), 41(Library Services), or 01 (Unassigned, Capable of Use), and one ofthe room use codes listed below, with the exception that office spaceis omitted from program 01:
110 Classroom115 Classroom Service
210 Class Laboratory215 Class Laboratory Service
220 Special Class Laboratory225 Special Class Lab Svc.
230 Individual Study Laboratory235 Individual Study Lab Svc.
310 Office315 Office Service
410 Study Room420 Stack430 Open Stack Reading Room440 Processing Room455 Study Service
510 Armory515 Armory Service
520 Athletic-Physical Ed.525 Ath.-Phys. Ed. Svc.
Because of federal reporting requirements, all space associatedwith academic programs in theology (HEGIS taxonomy code 2300) is alsoexcluded.
9
Student Clock Hours
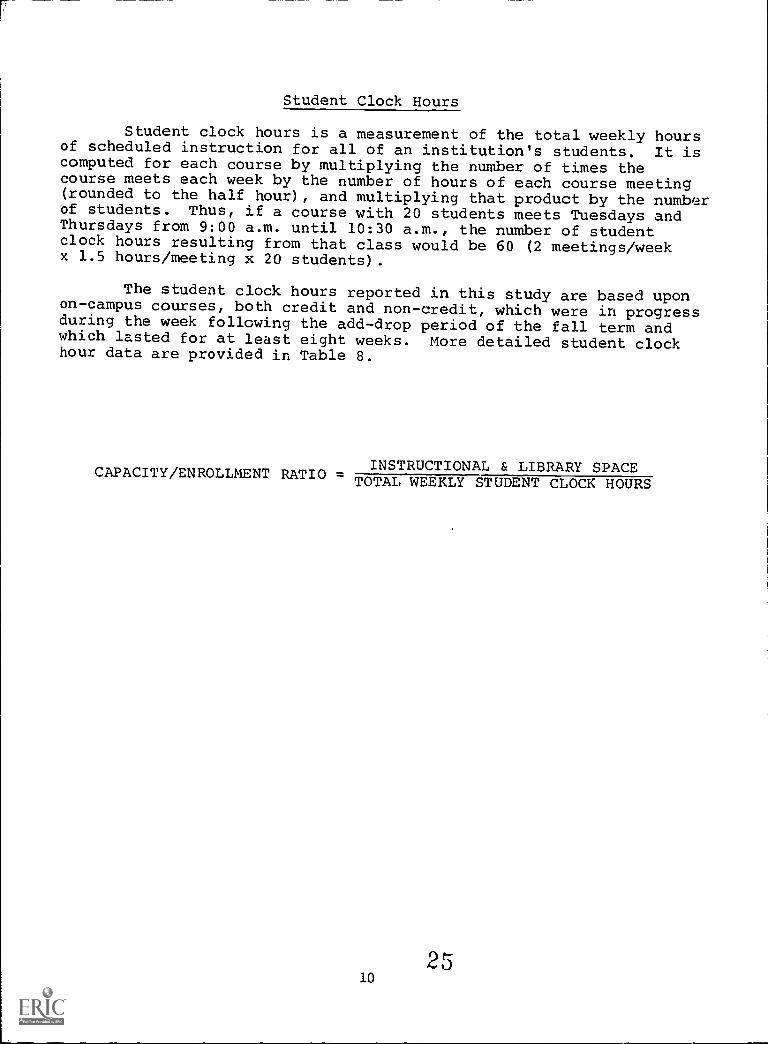
Student clock hours is a measurement of the total weekly hoursof scheduled instruction for all of an institution's students. It iscomputed for each course by multiplying the number of times thecourse meets each week by the number of hours of each course meeting(rounded to the half hour), and multiplying that product by the numberof students. Thus, if a course with 20 students meets Tuesdays andThursdays from 9:00 a.m. until 10:30 a.m., the number of studentclock hours resulting from that class would be 60 (2 meetings/weekx 1.5 hours/meeting x 20 students).
The student clock hours reported in this study are based uponon-campus courses, both credit and non-credit, which were in progressduring the week following the add-drop period of the fall term andwhich lasted for at least eight weeks. More detailed student clockhour data are provided in Table 8.
INSTRUCTIONAL & LIBRARY SPACECAPACITY/ENROLLMENT RATIO -TOTAL WEEKLY STUDENT CLOCK HOURS
2510
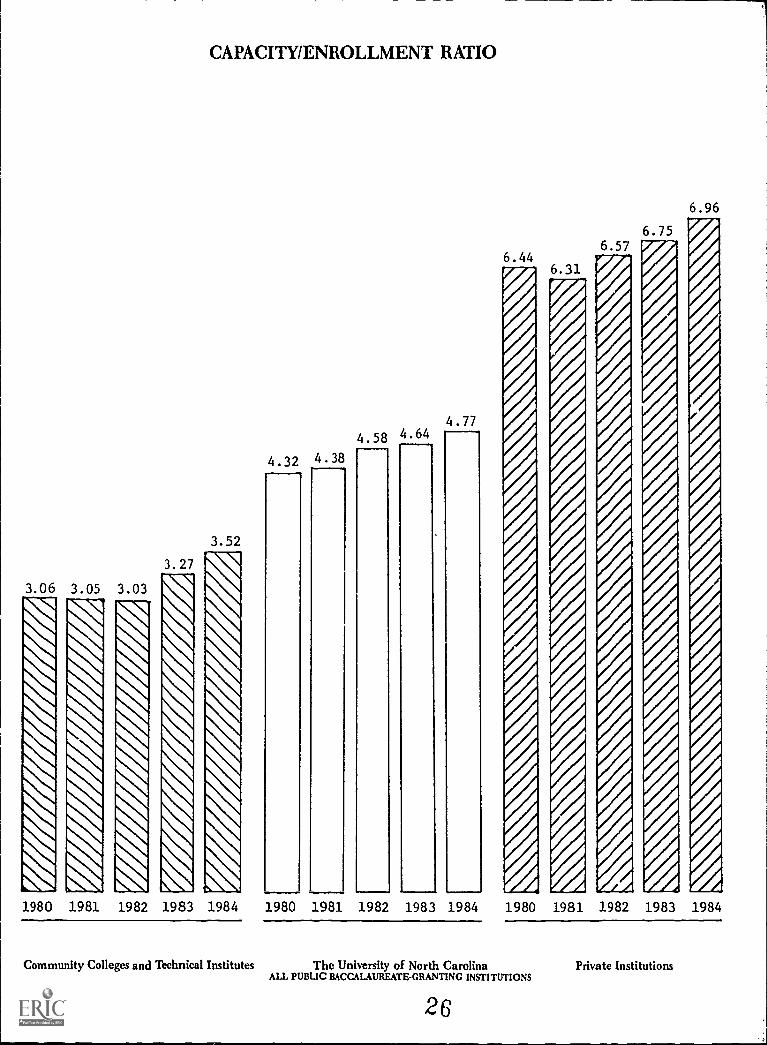
3.06 3.05 3.03
3.27
CAPACITY/ENROLLMENT RATIO
3.52
4.32 4.384.58 4 . 64
4.77
6.446.31
6.96
1980 1981 1982 1983 1984 1980 1981 1982 1983 1984 1980 1981 1982 1983 1984
Community Colleges and Technical Institutes The University of North CarolinaALL PUBLIC BACCALAUREATE-GRANTING INSTITUTIONS
26
Private Institutions
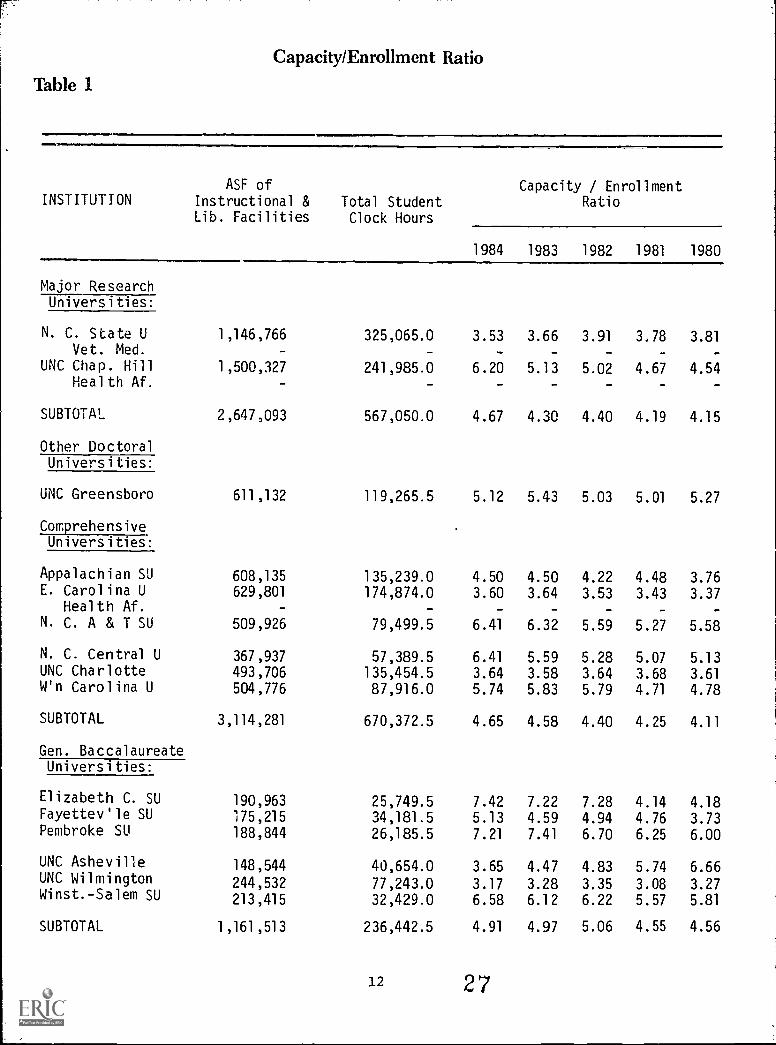
Table 1
.11.111/11.1711MMIA,
Capacity/Enrollment Ratio
,IMMMII....a..................aI...1=MPI=IIIMIMIIN!ILOIM.M.O
INSTITUTIONASF of
Instructional &Lib. Facilities
Total StudentClock Hours
Capacity / EnrollmentRatio
1984 1983 1982 1981 1980
Major ResearchUniversities:
N. C. State U 1,146,766 325,065.0 3.53 3.66 3.91 3.78 3.81Vet. Med.
UNC Chap. Hill 1,500,327 241,985.0 6.20 5.13 5.02 4.67 4.54Health Af.
SUBTOTAL 2,647,093 567,050.0 4.67 4.30 4.40 4.19 4.15
Other DoctoralUniversities:
UNC Greensboro 611,132 119,265.5 5.12 5.43 5.03 5.01 5.27
ComprehensiveUniversities:
Appalachian SU 608,135 135,239.0 4.50 4.50 4.22 4.48 3.76E. Carolina U 629,801 174,874.0 3.60 3.64 3.53 3.43 3.37
Health Af. - -
N. C. A & T SU 509,926 79,499.5 6.41 6.32 5.59 5.27 5.58
N. C. Central U 367,937 57,389.5 6.41 5.59 5.28 5.07 5.13UNC Charlotte 493,706 135,454.5 3.64 3.58 3.64 3.68 3.61W'n Carolina U 504,776 87,916.0 5.74 5.83 5.79 4.71 4.78
SUBTOTAL 3,114,281 670,372.5 4.65 4.58 4.40 4.25 4.11
Gen. BaccalaureateUniversities:
Elizabeth C. SU 190,963 25,749.5 7.42 7.22 7.28 4.14 4.18Fayettev'le SU 175,215 34,181.5 5.13 4.59 4.94 4.76 3.73Pembroke SU 188,844 26,185.5 7.21 7.41 6.70 6.25 6.00
UNC Asheville 148,544 40,654.0 3.65 4.47 4.83 5.74 6.66UNC Wilmington 244,532 77,243.0 3.17 3.28 3.35 3.08 3.27Winst.-Salem SU 213,415 32,429.0 6.58 6.12 6.22 5.57 5.81
SUBTOTAL 1,161,513 236,442.5 4.91 4.97 5.06 4.55 4.56
12 27
Capacity/Enrollment Ratio
Table 1
INSTITUTIONASF of
Instructional &Lib. Facilities
Total StudentClock Hours
Capacity / EnrollmentRatio
1984 1983 1982 1981 1980
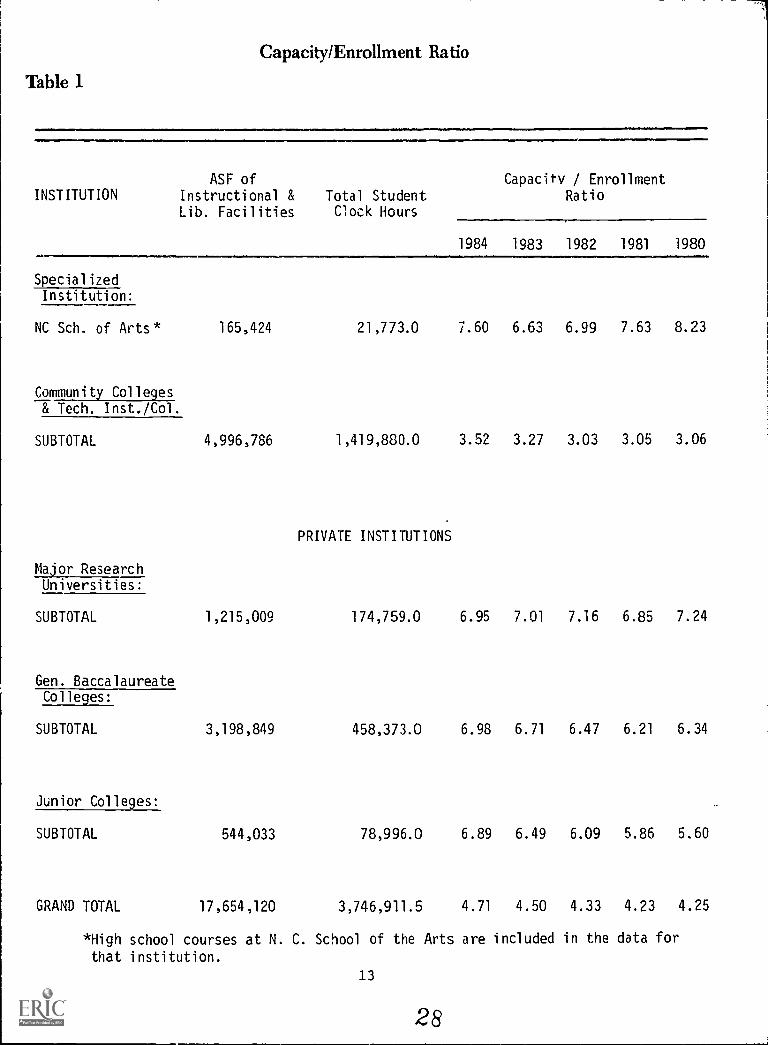
SpecializedInstitution:
NC Sch. of Arts* 165,424 21,773.0 7.60 6.63 6.99 7.63 8.23
Community Colleges& Tech. Inst./Col.
SUBTOTAL 4,996,786 1,419,880.0 3.52 3.27 3.03 3.05 3.06
PRIVATE INSTITUTIONS
Major ResearchUniversities:
SUBTOTAL 1,215,009 174,759.0 6.95 7.01 7.16 6.85 7.24
Gen. BaccalaureateColleges:
SUBTOTAL 3,198,849 458,373.0 6.98 6.71 6.47 6.21 6.34
Junior Colleges:
SUBTOTAL 544,033 78,996.0 6.89 6.49 6.09 5.86 5.60
GRAND TOTAL 17,654,120 3,746,911.5 4.71 4.50 4.33 4.23 4.25
*High school courses at N. C. School of the Arts are included in the data for
that institution.
13
28
Capacity/Enrollment Ratio
Table 1
ASF ofINSTITUTION Instructional &
Lib. FacilitiesTotal StudentClock Hours
Capacity / EnrollmentRatio
1984 1983 1982 1981 1980
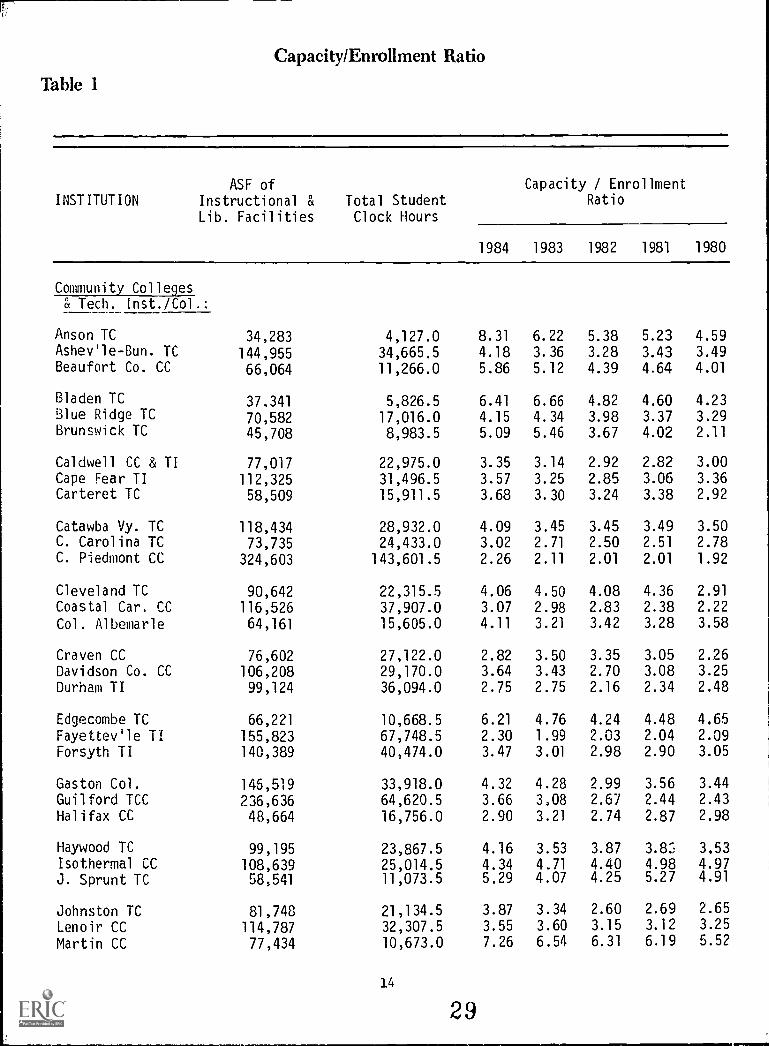
Community Colleges& Tech. Inst./Col.:
Anson TC 34,283 4,127.0 8.31 6.22 5.38 5.23 4.59Ashev'le -Bun. TC 144,955 34,665.5 4.18 3.36 3.28 3.43 3.49Beaufort Co. CC 66,064 11,266.0 5.86 5.12 4.39 4.64 4.01
Bladen TC 37,341 5,826.5 6.41 6.66 4.82 4.60 4.23Blue Ridge TC 70,582 17,016.0 4.15 4.34 3.98 3.37 3.29Brunswick TC 45,708 8,983.5 5.09 5.46 3.67 4.02 2.11
Caldwell CC & TI 77,017 22,975.0 3.35 3.14 2.92 2.82 3.00Cape Fear TI 112,325 31,496.5 3.57 3.25 2.85 3.06 3.36Carteret TC 58,509 15,911.5 3.68 3.30 3.24 3.38 2.92
Catawba Vy. TC 118,434 28,932.0 4.09 3.45 3.45 3.49 3.50C. Carolina TC 73,735 24,433.0 3.02 2.71 2.50 2.51 2.78C. Piedmont CC 324,603 143,601.5 2.26 2.11 2.01 2.01 1.92
Cleveland TC 90,642 22,315.5 4.06 4.50 4.08 4.36 2.91
Coastal Car. CC 116,526 37,907.0 3.07 2.98 2.83 2.38 2.22
Col. Albemarle 64,161 15,605.0 4.11 3.21 3.42 3.28 3.58
Craven CC 76,602 27,122.0 2.82 3.50 3.35 3.05 2.26
Davidson Co. CC 106,208 29,170.0 3.64 3.43 2.70 3.08 3.25
Durham TI 99,124 36,094.0 2.75 2.75 2.16 2.34 2.48
Edgecombe TC 66,221 10,668.5 6.21 4.76 4.24 4.48 4.65
Fayettev'le TI 155,823 67,748.5 2.30 1.99 2.03 2.04 2.09
Forsyth TI 140,389 40,474.0 3.47 3.01 2.98 2.90 3.05
Gaston Col. 145,519 33,918.0 4.32 4.28 2.99 3.56 3.44
Guilford TCC 236,636 64,620.5 3.66 3.08 2.67 2.44 2.43
Halifax CC 48,664 16,756.0 2.90 3.21 2.74 2.87 2.98
Haywood TC 99,195 23,867.5 4.16 3.53 3.87 3.8:3 3.53Isothermal CC 108,639 25,014.5 4.34 4.71 4.40 4.98 4.97J. Sprunt TC 58,541 11,073.5 5.29 4.07 4.25 5.27 4.91
Johnston TC 81,748 21,134.5 3.87 3.34 2.60 2.69 2.65
Lenoir CC 114,787 32,307.5 3.55 3.60 3.15 3.12 3.25
Martin CC 77,434 10,673.0 7.26 6.54 6.31 6.19 5.52
14
Capacity /Enrollment Ratio
Table 1
ASF ofINSTITUTION Instructional &
Lib. FacilitiesTotal StudentClock Hours
Capacity / EnrollmentRatio
1984 1983 1982 1981 1980
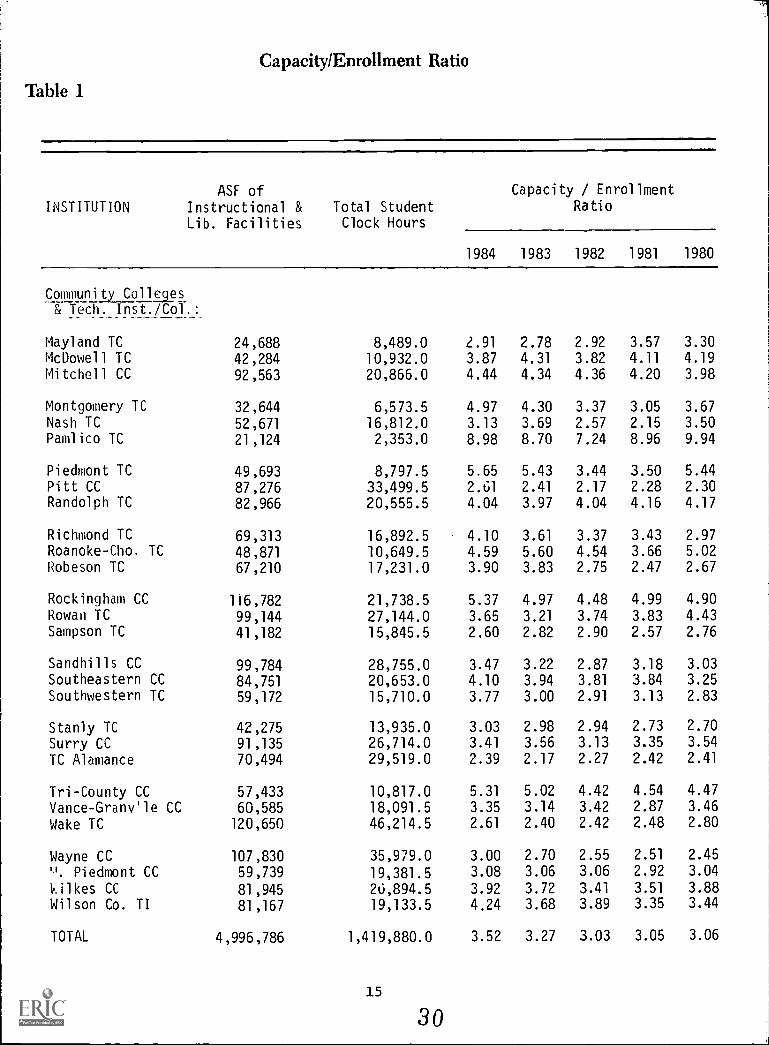
Community Colleges& Tech. Inst./Col.:
Mayland TC 24,688 8,489.0 2.91 2.78 2.92 3.57 3.30McDowell TC 42,284 10,932.0 3.87 4.31 3.82 4.11 4.19Mitchell CC 92,563 20,866.0 4.44 4.34 4.36 4.20 3.98
Montgomery TC 32,644 6,573.5 4.97 4.30 3.37 3.05 3.67
Nash TC 52,671 16,812.0 3.13 3.69 2.57 2.15 3.50Pamlico TC 21,124 2,353.0 8.98 8.70 7.24 8.96 9.94
Piedmont TC 49,693 8,797.5 5.65 5.43 3.44 3.50 5.44Pitt CC 87,276 33,499.5 2.61 2.41 2.17 2.28 2.30Randolph TC 82,966 20,555.5 4.04 3.97 4.04 4.16 4.17
Richmond TC 69,313 16,892.5 4.10 3.61 3.37 3.43 2.97Roanoke-Cho. TC 48,871 10,649.5 4.59 5.60 4.54 3.66 5.02Robeson TC 67,210 17,231.0 3.90 3.83 2.75 2.47 2.67
Rockingham CC 116,782 21,738.5 5.37 4.97 4.48 4.99 4.90Rowan TC 99,144 27,144.0 3.65 3.21 3.74 3.83 4.43Sampson TC 41,182 15,845.5 2.60 2.82 2.90 2.57 2.76
Sandhills CC 99,784 28,755.0 3.47 3.22 2.87 3.18 3.03
Southeastern CC 84,751 20,653.0 4.10 3.94 3.81 3.84 3.25
Southwestern TC 59,172 15,710.0 3.77 3.00 2.91 3.13 2.83
Stanly TC 42,275 13,935.0 3.03 2.98 2.94 2.73 2.70
Surry CC 91,135 26,714.0 3.41 3.56 3.13 3.35 3.54
TC Alamance 70,494 29,519.0 2.39 2.17 2.27 2.42 2.41
Tri-County CC 57,433 10,817.0 5.31 5.02 4.42 4.54 4.47
Vance-Gram/11e CC 60,585 18,091.5 3.35 3.14 3.42 2.87 3.46
Wake TC 120,650 46,214.5 2.61 2.40 2.42 2.48 2.80
Wayne CC 107,830 35,979.0 3.00 2.70 2.55 2.51 2.45
". Piedmont CC 59,739 19,381.5 3.08 3.06 3.06 2.92 3.04
kilkes CC 81,945 20,894.5 3.92 3.72 3.41 3.51 3.88
Wilson Co. TI 81,167 19,133.5 4.24 3.68 3.89 3.35 3.44
TOTAL 4,996,786 1,419,880.0 3.52 3.27 3.03 3.05 3.06
15
30

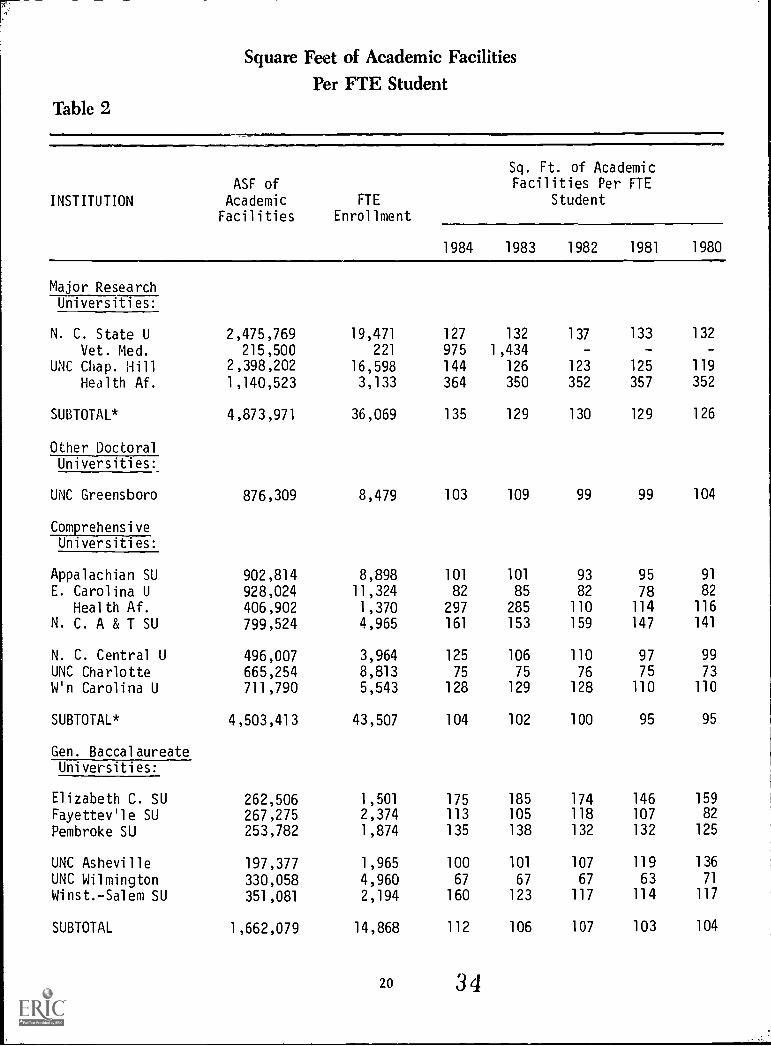
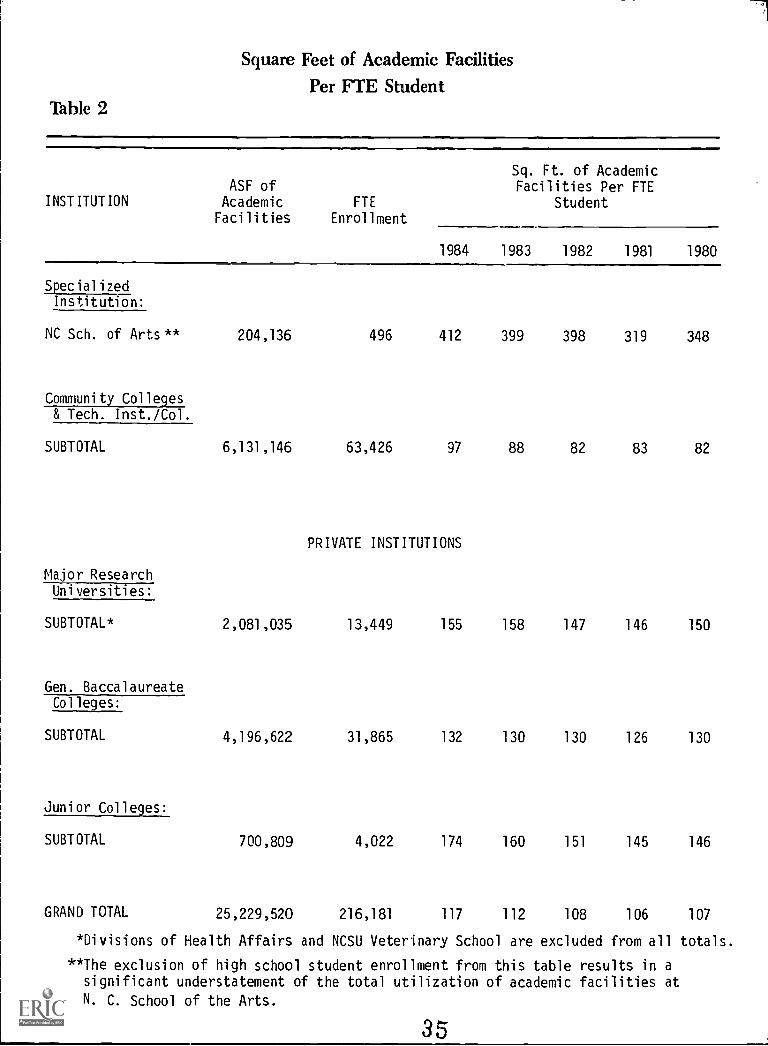
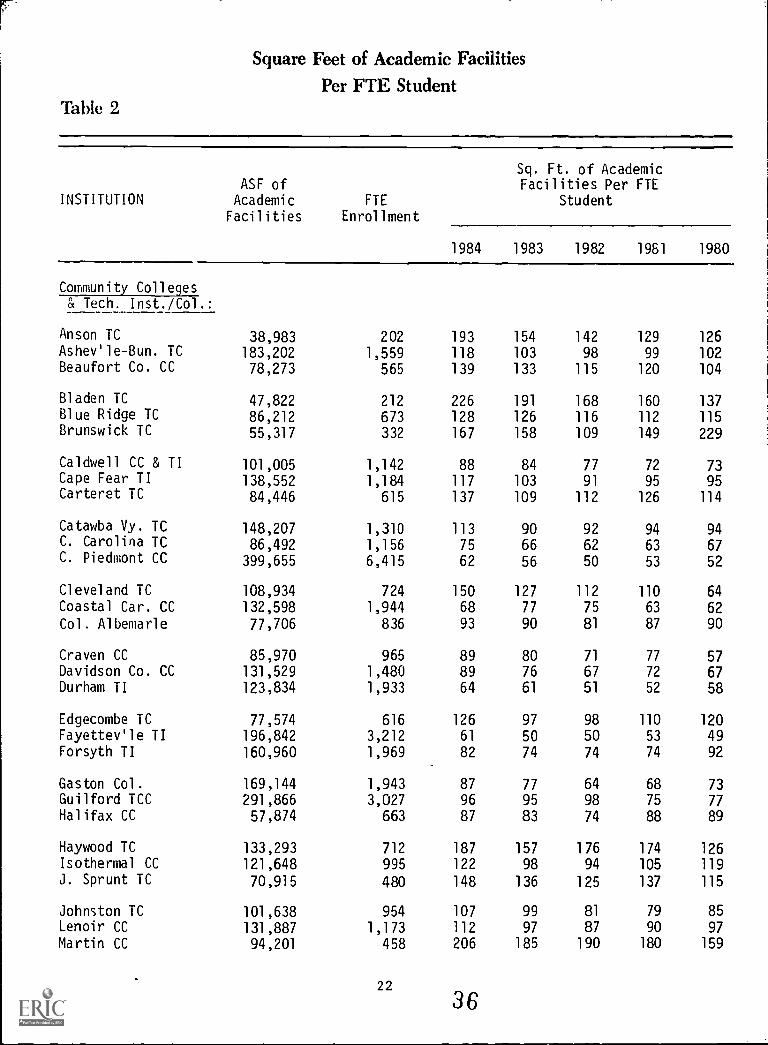
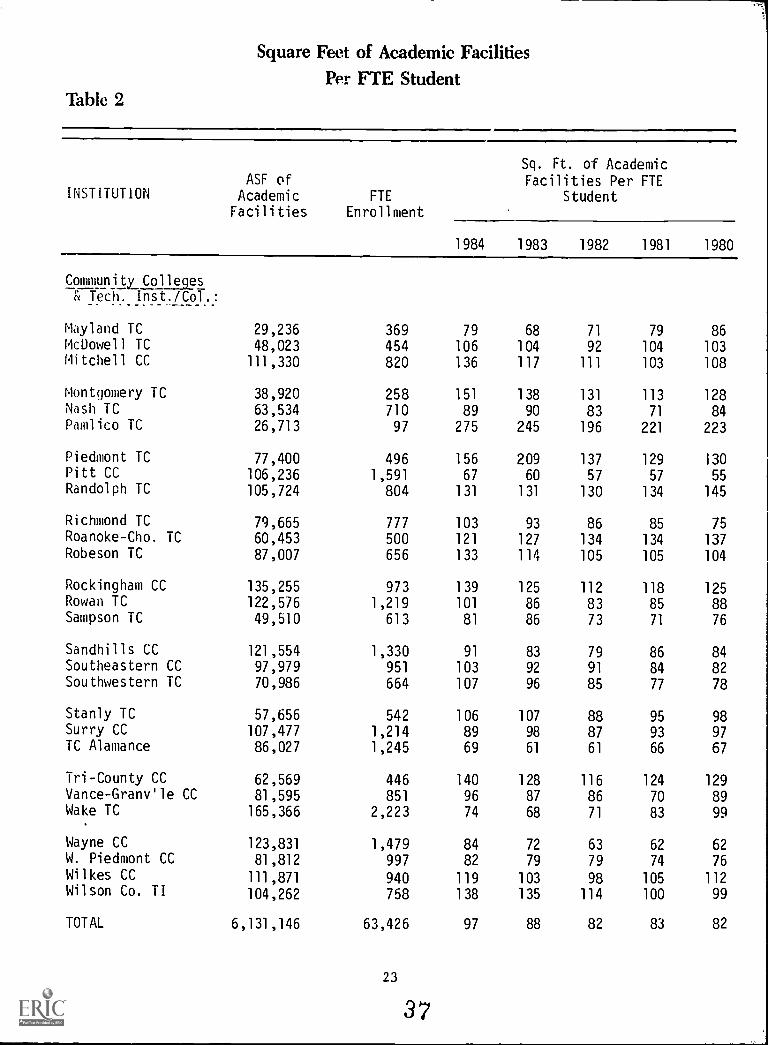
TABLE 2:
SQUARE FEET OF ACADEMIC FACILITIESPER FTE STUDENT
The ratio of an institution's square footage of academicfacilities to its full-time equivalent enrollment representsan important index of the instructional utilization of campusfacilities. It was first used by the U. S. Office of Education asa planning standard in the 1960's. In 1969, the Office of Educationpublished an extensive study entitled Federal Support for HigherEducation Construction: Current Programs and Future Needs whichprovided normative figures by level and control of iniiTaion.The figures, which are still widely used in determining facilitiesneeds, can be summarized as follows:
Institutional Level Public Private Total
University 132 150 136Four-year 93 103 98
Two-year 70 75 70All Institutions 103 115 107
Academic Facilities
"Academic facilities" is a broader concept than "instructionaland library space" (page 9). In general terms, it includes all spaceused for instruction, research, and the administration or supportof instruction or research.
Academic facilities can be more precisely defined in termsof program codes (pages 87-88, 93-95, 102-103, 108-109, 112-113)and room use codes (page 118). The term refers to an institution'stotal assignable area (page 81) less the square footage of all roomsbearing program codes 42 (Museums and Galleries), 52 (Social andCultural Development), 55 (Student Auxiliary Services), 56 (Inter-collegiate Athletics), 65 (Faculty and Staff Auxiliary Services),66 (Public Relations/Development), 91-92 (Independent Operations), and
02 (Incapable of Use). In addition, space with program code 63(General Administration and Logistical Service) is deleted if italso has room use code 750 (Central Food Stores) or 760 (CentralLaundry). Space with program 01 (Unassigned, Capale of Use) andany of the following room use codes is also excluded from academicfacilities: 523 (Athletic Facilities Spectator Seating), 630 (FoodFacilities), 635 (Food Facilities Service), 660 (MerchandisingFacilities), 665 (Merchandising Facilities Service), 750 (CentralFood Stores), 760 (Central Laundry), all of the 800's (Health CareFacilities), and all of the 900's (Residential Facilities). Lecauseof federal reporting requirements, all space associated with academicprograms in theology (HEGIS taxonomy code 2300) is also excluded.
17 31
FTE Enrollment
Full-time equivalent (FTE) enrollment is computed by assigninga percentage to each part-time student to reflect his course loadand then adding the result to the total full-time enrollment. FTEenrollment differs from the other frequently used standard forestimating student populations, headcount enrollment, in that thelatter treats full-time and part-time students identically. A moredetailed description of the procedure used in calculating FTEenrollment can be found on page 69.
The FTE enrollments which are reported for the institutionsof the Community College System exclude enrollment generated byoff-campus instruction and enrollment in non-credit courses. Theirtotal FTE enrollments--which take into account all credit instructionregardless of where it is conducted--are not listed in Table 2 be-cause they are irrelevant to space utilization analysis. They arereported, however, in Table 12.
SQ. FT. OF ACADEMIC FACILITIES PER FTE STUDENT =
SQUARE FEET OF ACADEMIC FACILITIESFTE ENROLLMENT
18 32
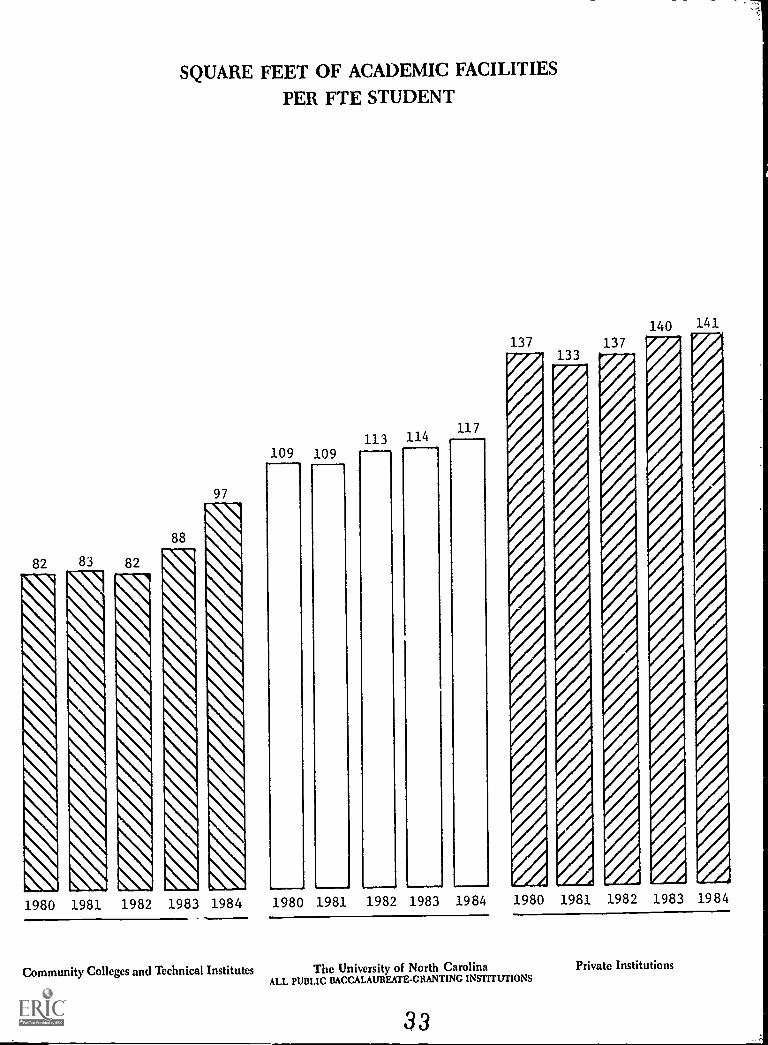
SQUARE FEET OF ACADEMIC FACILITIESPER FTE STUDENT
88
82 83 82
I I I
97
1980 1981 1982 1983 1984
109 109113 114
117
1980 1981 1982 1983 1984
137133
137140 141
1980 1981 1982 1983 1984
Community Colleges and Technical Institutes The University of North CarolinaALL PUBLIC BACCALAUREATEGRANTING INSTITUTIONS
a3
Private Institutions
1
Square Feet of Academic FacilitiesPer FTE Student
Table 2
INSTITUTION
Sq. Ft. of Academic
ASF of Facilities Per FTE
Academic FTE StudentFacilities Enrollment
1984 1983 1982 1981 1980
Major ResearchUniversities:
N. C. State U 2,475,769 19,471 127 132 137 133 132
Vet. Med. 215,500 221 975 1,434 - -
UNC Chap. Hill 2,398,202 16,598 144 126 123 125 119
Health Af. 1,140,523 3,133 364 350 352 357 352
SUBTOTAL* 4,873,971 36,069 135 129 130 129 126
Other DoctoralUniversities:
UNC Greensboro 876,309 8,479 103 109 99 99 104
ComprehensiveUniversities:
Appalachian SU 902,814 8,898 101 101 93 95 91
E. Carolina U 928,024 11,324 82 85 82 78 82
Health Af. 406,902 1,370 297 285 110 114 116
N. C. A & T SU 799,524 4,965 161 153 159 147 141
N. C. Central U 496,007 3,964 125 106 110 97 99
UNC Charlotte 665,254 8,813 75 75 76 75 73
W'n Carolina U 711,790 5,543 128 129 128 110 110
SUBTOTAL* 4,503,413 43,507 104 102 100 95 95
Gen. BaccalaureateUniversities:
Elizabeth C. SU 262,506 1,501 175 185 174 146 159
Fayettev'le SU 267,275 2,374 113 105 118 107 82
Pembroke SU 253,782 1,874 135 138 132 132 125
UNC Asheville 197,377 1,965 100 101 107 119 136
UNC Wilmington 330,058 4,960 67 67 67 63 71
Winst.-Salem SU 351,081 2,194 160 123 117 114 117
SUBTOTAL 1,662,079 14,868 112 106 107 103 104
20 34
Square Feet of Academic FacilitiesPer FTE Student
Table 2
INSTITUTIONASF of
AcademicFacilities
FTE
Enrollment
Sq. Ft. of AcademicFacilities Per FTE
Student
1984 1983 1982 1981 1980
Specialized
204,136 496 412 399 398 319 348
Institution:
NC Sch. of Arts**
Community Colleges& Tech. Inst./Col.
SUBTOTAL 6,131,146 63,426 97 88 82 83 82
PRIVATE INSTITUTIONS
Major ResearchUniversities:
SUBTOTAL* 2,081,035 13,449 155 158 147 146 150
Gen. BaccalaureateColleges:
SUBTOTAL 4,196,622 31,865 132 130 130 126 130
Junior Colleges:
SUBTOTAL 700,809 4,022 174 160 151 145 146
GRAND TOTAL 25,229,520 216,181 117 112 108 106 107
*Divisions of Health Affairs and NCSU Veterinary School are excluded from all totals.
**The exclusion of high school student enrollment from this table results in asignificant understatement of the total utilization of academic facilities at
N. C. School of the Arts.
35
Square Feet of Academic Facilities
Per FTE StudentTable 2
INSTITUTION
Sq. Ft. of AcademicASF of Facilities Per FTEAcademic FTE StudentFacilities Enrollment
1984 1983 1982 1981 1980
Community Colleges& Tech. Inst./Col.:
Anson TC 38,983 202 193 154 142 129 126Ashev'le -Bun. TC 183,202 1,559 118 103 98 99 102Beaufort Co. CC 78,273 565 139 133 115 120 104
Bladen TC 47,822 212 226 191 168 160 137Blue Ridge TC 86,212 673 128 126 116 112 115Brunswick TC 55,317 332 167 158 109 149 229
Caldwell CC & TI 101,005 1,142 88 84 77 72 73Cape Fear TI 138,552 1,184 117 103 91 95 95Carteret TC 84,446 615 137 109 112 126 114
Catawba Vy. TC 148,207 1,310 113 90 92 94 94C. Carolina TC 86,492 1,156 75 66 62 63 67C. Piedmont CC 399,655 6,415 62 56 50 53 52
Cleveland TC 108,934 724 150 127 112 110 64Coastal Car. CC 132,598 1,944 68 77 75 63 62
Col. Albemarle 77,706 836 93 90 81 87 90
Craven CC 85,970 965 89 80 71 77 57Davidson Co. CC 131,529 1,480 89 76 67 72 67Durham TI 123,834 1,933 64 61 51 52 58
Edgecombe TC 77,574 616 126 97 98 110 120Fayettev'le TI 196,842 3,212 61 50 50 53 49Forsyth TI 160,960 1,969 82 74 74 74 92
Gaston Col. 169,144 1,943 87 77 64 68 73Guilford TCC 291,866 3,027 96 95 98 75 77Halifax CC 57,874 663 87 83 74 88 89
Haywood TC 133,293 712 187 157 176 174 126Isothermal CC 121,648 995 122 98 94 105 119J. Sprunt TC 70,915 480 148 136 125 137 115
Johnston TC 101,638 954 107 99 81 79 85Lenoir CC 131,887 1,173 112 97 87 90 97
Martin CC 94,201 458 206 185 190 180 159
22
36
Square Feet of Academic FacilitiesPer FTE Student
Table 2
INSTITUTION
Sq. Ft. of AcademicASF of Facilities Per FTE
Academic FTE StudentFacilities Enrollment
1984 1983 1982 1981 1980
Communitz_Colleges--g4 Tech. Inst./Col.:
Mayland TC 29,236 369 79 68 71 79 86McDowell TC 48,023 454 106 104 92 104 103Mitchell CC 111,330 820 136 117 111 103 108
Montgomery TC 38,920 258 151 138 131 113 128Nash TC 63,534 710 89 90 83 71 84Pamlico IC 26,713 97 275 245 196 221 223
Piedmont TC 77,400 496 156 209 137 129 130Pitt CC 106,236 1,591 67 60 57 57 55Randolph TC 105,724 804 131 131 130 134 145
Richmond TC 79,665 777 103 93 86 85 75Roanoke-Cho. TC 60,453 500 121 127 134 134 137Robeson TC 87,007 656 133 114 105 105 104
Rockingham CC 135,255 973 139 125 112 118 125Rowan TC 122,576 1,219 101 86 83 85 88Sampson TC 49,510 613 81 86 73 71 76
Sandhills CC 121,554 1,330 91 83 79 86 84Southeastern CC 97,979 951 103 92 91 84 82Southwestern TC 70,986 664 107 96 85 77 78
Stanly TC 57,656 542 106 107 88 95 98Surry CC 107,477 1,214 89 98 87 93 97TC Alamance 86,027 1,245 69 61 61 66 67
Tri-County CC 62,569 446 140 128 116 124 129Vance- Granv'le CC 81,595 851 96 87 86 70 89Wake TC 165,366 2,223 74 68 71 83 99
Wayne CC 123,831 1,479 84 72 63 62 62W. Piedmont CC 81,812 997 82 79 79 74 76Wilkes CC 111,871 940 119 103 98 105 112Wilson Co. TI 104,262 758 138 135 114 100 99
TOTAL 6,131,146 63,426 97 88 82 83 82
23
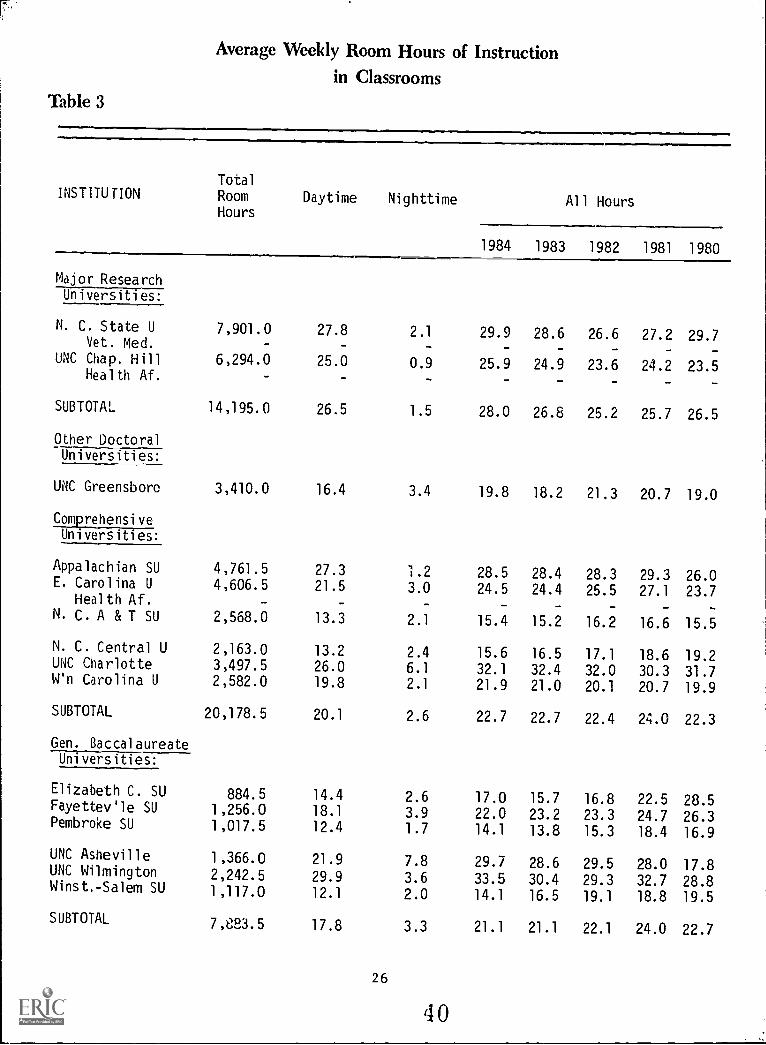
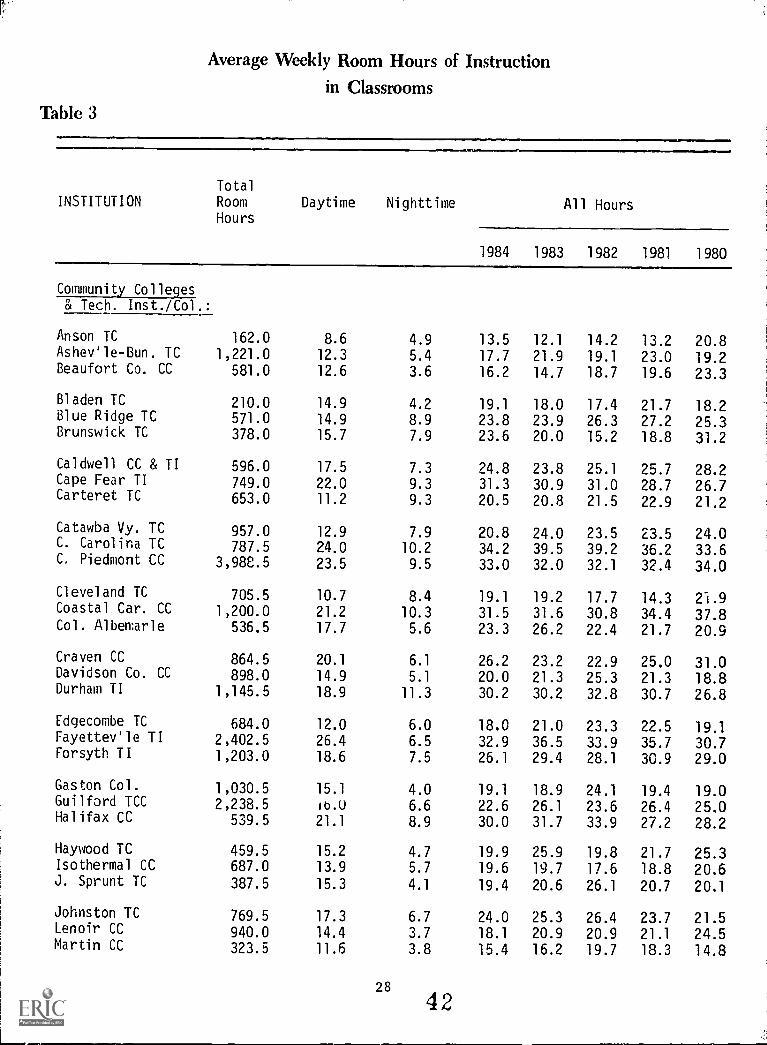
TABLE 3:
AVERAGE WEEKLY ROOM HOURS OF INSTRUCTIONIN CLASSROOMS
The average weekly room hours of instruction in classroomsis calculated by dividing the total room hours of instruction inclassrooms by the total number of classrooms. In more generalterms, it is the average number of hours that an institution'sclassrooms are used for instructional purposes each week.
The total room hours of instruction in classrooms is thenumber of hours each week that each classroom is used for regularlyscheduled classes. Thus, a classroom which is used Mondays,Wednesdays, and Fridays from 9:00 a.m. until 1:00 p.m. and onTuesdays and Thursdays from 8:30 a.m. until noon would generate19 room hours (4 hours/day x 3 days/week + 3.5 hours/day x 2 days/week). Table 3 indicates the total room hours of instruction inclassrooms; the total number of classrooms can be found in Table 16.
For purposes of this study, a classroom is defined as a roomused to conduct classes that do not require special-purpose equipmentfor student use. Thus, a classroom is by definition a general usefacility which could be used in teaching the lecture portion of anycourse. If a room is used for regularly scheduled classes but hasspecial equipment which tie it to a particular subject matter, thenthe room is a class laboratory and its use would not be taken intoaccount in this table.
Table 3 separates average weekly room hours of instructionin classrooms into daytime and nighttime use. Daytime utilizationis based on all classes with beginning times between and including5:00 a.m. and 4:59 p.m.; nighttime utilization is based on allother classes. The "All Hours" section of Table 3 indicates thesum of the daytime and nighttime figures for the last five years.
The average weekly room hours of classroom instruction canserve as an indicator of the adequacy of the number of classrooms atan institution. A frequently cited norm is 30 hours of instructionin classrooms per week, but the institutions in North Carolina andin many other states average significantly fewer hours.
AVG. WEEKLY ROOM HOURS OF INSTRUCTION IN CLASSROOMS =
TOTAL ROOM HOURS OF INSTRUCTION IN CLASSROOMSTOTAL NUMBER OF CLASSROOMS
24
38
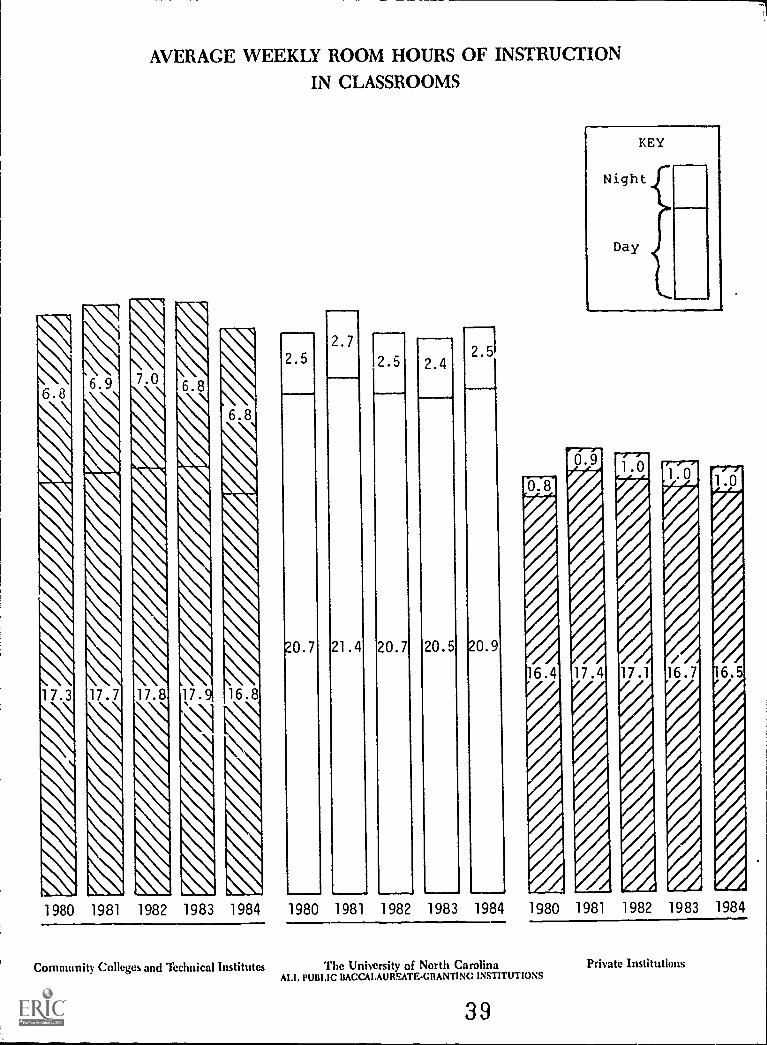
AVERAGE WEEKLY ROOM HOURS OF INSTRUCTION
IN CLASSROOMS
2.4
20.5
2.5
20.9
1980 1981 1982 1983 1984 1980 1981 1982 1983 1984 1980 1981 1982 1983 1984
Community Colleges and Technical Institutes The University of North CarolinaAI.I. PUBI.IC BACCALAUREATEGRANTING INSTITUTIONS
39
Private Institutions
Average Weekly Room Hours of Instructionin Classrooms
Table 3
INSTITUTIONTotal
Room
HoursDaytime Nighttime All Hours
1984 1983 1982 1981 1980
Major Research
Universities:
N. C. State U 7,901.0 27.8 2.1 29.9 28.6 26.6 27.2 29.7Vet. Med.
UNC Chap. Hill 6,294.0 25.0 0.9 25.9 24.9 23.6 24.2 23.5Health Af.
SUBTOTAL 14,195.0 26.5 1.5 28.0 26.8 25.2 25.7 26.5
Other DoctoralUniversities:
UNC Greensboro 3,410.0 16.4 3.4 19.8 18.2 21.3 20.7 19.0
ComprehensiveUniversities:
Appalachian SU 4,761.5 27.3 1.2 28.5 28.4 28.3 29.3 26.0E. Carolina U 4,606.5 21.5 3.0 24.5 24.4 25.5 27.1 23.7
Health Af. - - -
N. C. A & T SU 2,568.0 13.3 2.1 15.4 15.2 16.2 16.6 15.5
N. C. Central U 2,163.0 13.2 2.4 15.6 16.5 17.1 18.6 19.2UNC Charlotte 3,497.5 26.0 6.1 32.1 32.4 32.0 30.3 31.7W'n Carolina U 2,582.0 19.8 2.1 21.9 21.0 20.1 20.7 19.9
SUBTOTAL 20,178.5 20.1 2.6 22.7 22.7 22.4 24.0 22.3
Gen. BaccalaureateUniversities:
Elizabeth C. SU 884.5 14.4 2.6 17.0 15.7 16.8 22.5 28.5Fayettevale SU 1,256.0 18.1 3.9 22.0 23.2 23.3 24.7 26.3Pembroke SU 1,017.5 12.4 1.7 14.1 13.8 15.3 18.4 16.9
UNC Asheville 1,366.0 21.9 7.8 29.7 28.6 29.5 28.0 17.8UNC Wilmington 2,242.5 29.9 3.6 33.5 30.4 29.3 32.7 28.8Winst.-Salem SU 1,117.0 12.1 2.0 14.1 16.5 19.1 18.8 19.5
SUBTOTAL 7,823.5 17.8 3.3 21.1 21.1 22.1 24.0 22.7
26
4 0

Average Weekly Room Hours of Instructionin Classrooms
Table 3
INSTITUTIONTotal
RoomHours
Daytime Nighttime All Hours
1984 1983 1982 1981 1980
SpecializedInstitution:
NC Sch. of Arts 346.5 11.8 1.0 12.8 10.7 10.4 14.4 15.8
Community Colleges& Tech. Inst./Col.
SUBTOTAL 44,822.0 16.8 6.8 23.6 24.7 24.8 24.6 24.1
PRIVATE INSTITUTIONS
Major ResearchUniversities:
SUBTOTAL 5,405.5 17.8 0.4 18.2 17.7 17.1 17.8 17.7
Gen. BaccalaureateColleges:
SUBTOTAL 17,699.0 16.2 1.4 17.6 18.0 18.6 18.6 17.0
Junior Colleges:
SUBTOTAL 2,687.5 15.9 0.2 16.1 16.8 17.3 17.6 17.6
GRAND TOTAL 116,627.5 18.2 3.6 21.8 22.2 22.3 22.6 21.8
Average Weekly Room Hours of Instructionin Classrooms
Table 3
INSTITUTIONTotal
RoomHours
Daytime Nighttime All Hours
1984 1983 1982 1981 1980
Community Colleges& Tech. Inst./Col.:
Anson TC 162.0 8.6 4.9 13.5 12.1 14.2 13.2 20.8Ashev'le -Bun. TC 1,221.0 12.3 5.4 17.7 21.9 19.1 23.0 19.2Beaufort Co. CC 581.0 12.6 3.6 16.2 14.7 18.7 19.6 23.3
Bladen TC 210.0 14.9 4.2 19.1 18.0 17.4 21.7 18.2Blue Ridge TC 571.0 14.9 8.9 23.8 23.9 26.3 27.2 25.3Brunswick TC 378.0 15.7 7.9 23.6 20.0 15.2 18.8 31.2
Caldwell CC & TI 596.0 17.5 7.3 24.8 23.8 25.1 25.7 28.2Cape Fear TI 749.0 22.0 9.3 31.3 30.9 31.0 28.7 26.7Carteret TC 653.0 11.2 9.3 20.5 20.8 21.5 22.9 21.2
Catawba Vy. TC 957.0 12.9 7.9 20.8 24.0 23.5 23.5 24.0C. Carolina TC 787.5 24.0 10.2 34.2 39.5 39.2 36.2 33.6C. Piedmont CC 3,988.5 23.5 9.5 33.0 32.0 32.1 32.4 34.0
Cleveland TC 705.5 10.7 8.4 19.1 19.2 17.7 14.3 21.9Coastal Car. CC 1,200.0 21.2 10.3 31.5 31.6 30.8 34.4 37.8Col. Albemarle 536.5 17.7 5.6 23.3 26.2 22.4 21.7 20.9
Craven CC 864.5 20.1 6.1 26.2 23.2 22.9 25.0 31.0Davidson Co. CC 898.0 14.9 5.1 20.0 21.3 25.3 21.3 18.8Durham TI 1,145.5 18.9 11.3 30.2 30.2 32.8 30.7 26.8
Edgecombe TC 684.0 12.0 6.0 18.0 21.0 23.3 22.5 19.1Fayettev'le TI 2,402.5 26.4 6.5 32.9 36.5 33.9 35.7 30.7Forsyth TI 1,203.0 18.6 7.5 26.1 29.4 28.1 30.9 29.0
Gaston Col. 1,030.5 15.1 4.0 19.1 18.9 24.1 19.4 19.0Guilford TCC 2,238.5 ib.0 6.6 22.6 26.1 23.6 26.4 25.0Halifax CC 539.5 21.1 8.9 30.0 31.7 33.9 27.2 28.2
Haywood TC 459.5 15.2 4.7 19.9 25.9 19.8 21.7 25.3Isothermal CC 687.0 13.9 5.7 19.6 19.7 17.6 18.8 20.6J. Sprunt TC 387.5 15.3 4.1 19.4 20.6 26.1 20.7 20.1
Johnston TC 769.5 17.3 6.7 24.0 25.3 26.4 23.7 21.5Lenoir CC 940.0 14.4 3.7 18.1 20.9 20.9 21.1 24.5Martin CC 323.5 11.6 3.8 15.4 16.2 19.7 18.3 14.8
28
42

Average Weekly Room Hours of Instructionin Classrooms
Table 3
INSTI1UTIONTotal
RoomHours
Daytime Nighttime All Hours
1984 1983 1982 1981 1980
Community Colleges& Tech. Inst./Col.:
Mayland TC 338.5 20.1 10.6 30.7 32.0 25.8 29.2 32.8McDowell TC 250.0 9.5 8.4 17.9 13.9 14.4 16.1 16.3Mitchell CC 753.0 11.5 6.9 18.4 18.7 20.8 19.9 17.3
Montgomery TC 192.5 12.5 8.9 21.4 19.5 21.6 25.3 23.9Nash TC 554.5 13.8 8.3 22.1 23.3 20.9 21.3 20.9Pamlico TC 133.0 7.6 5.7 13.3 11.7 10.0 11.8 12.5
Piedmont TC 410.5 12.4 8.1 20.5 20.1 25.7 21.3 17.8Pitt CC 991.0 20.3 6.4 26.7 31.5 34.6 31.5 32.4Randolph TC 532.5 15.2 7.9 23.1 24.0 21.3 18.3 17.7
Richmond TC 570.5 17.6 7.2 24.8 26.2 31.7 30.4 31.7Roanoke-Cho. TC 407.5 13.9 3.1 17.0 13.3 18.9 16.5 14.8Robeson TC 501.5 14.9 6.9 21.8 18.7 28.9 313 27.0
Rockingham CC 606.5 14.2 5.4 19.6 21.9 22.1 19.0 18.6Rowan TC 859.5 12.6 8.4 21.0 24.1 17.8 18.5 17.9Sampson TC 571.5 22.5 9.3 31.8 25.7 27.0 26.8 25.2
Sandhills CC 896.5 21.9 3.7 25.6 25.7 28.3 24.9 25.4Southeastern CC 665.5 17.0 3.8 20.8 20.2 19.9 19.3 19.5Southwestern TC 503.0 16.3 5.5 21.8 31.9 24.2 19.9 23.5
Stanly TC 453.5 13.7 6.0 19.7 26.4 24.5 24.2 26.3Surry CC 640.5 16.5 6.4 22.9 22.5 23.7 23.8 24.5TC Alamance 964.0 22.9 9.2 32.1 29.3 27.7 27.3 25.5
Tri-County CC 351.5 10.8 7.7 18.5 20.4 20.8 20.8 19.6Vance- Granv'le CC 620.0 13.9 8.2 22.1 21.8 20.6 25.4 18.0Wake TC 1,284.0 21.1 5.1 26.2 27.0 26.0 26.2 24.3
Wayne CC 997.5 15.9 4.9 20.8 24.7 25.3 23.8 23.2W. Piedmont CC 536.0 17.9 9.0 26.9 22.8 2.?.5 24.0 20.2Wilkes CC 805.0 19.2 5.9 25.1 26.6 23.7 25.4 26.1Wilson Co. TI 563.5 17.2 6.3 23.5 25.1 23.7 26.5 25.1
TOTAL 44,822.0 16.8 6.8 23.6 24.7 24.8 24.6 24.1
29
43
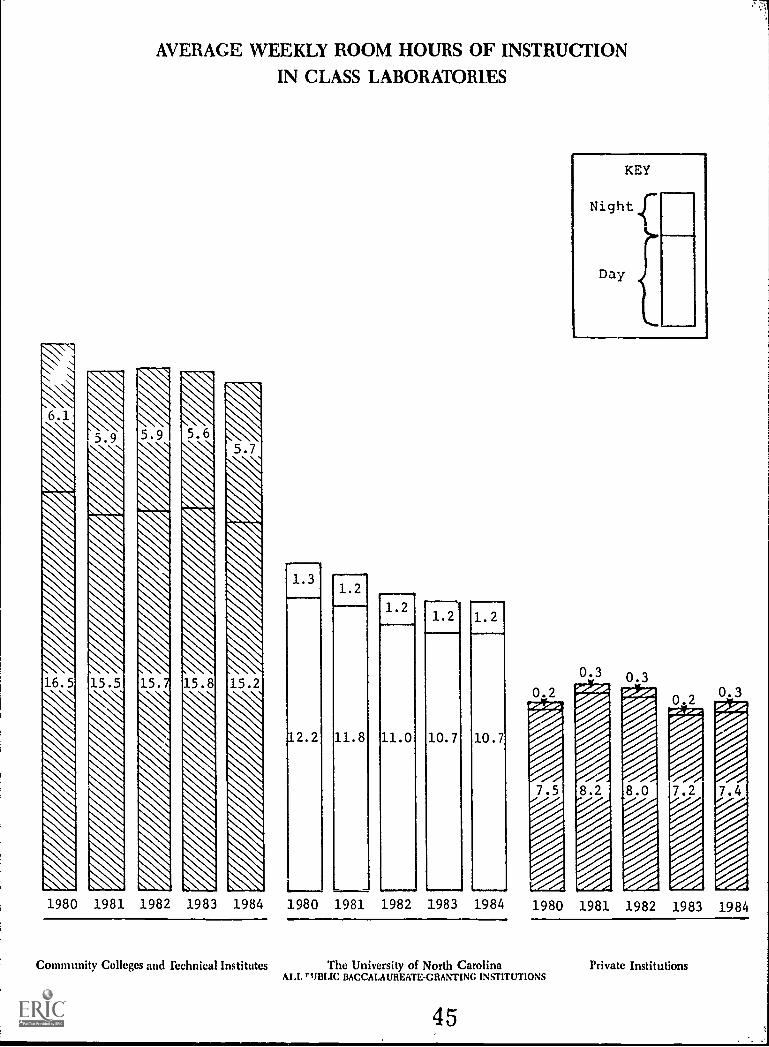
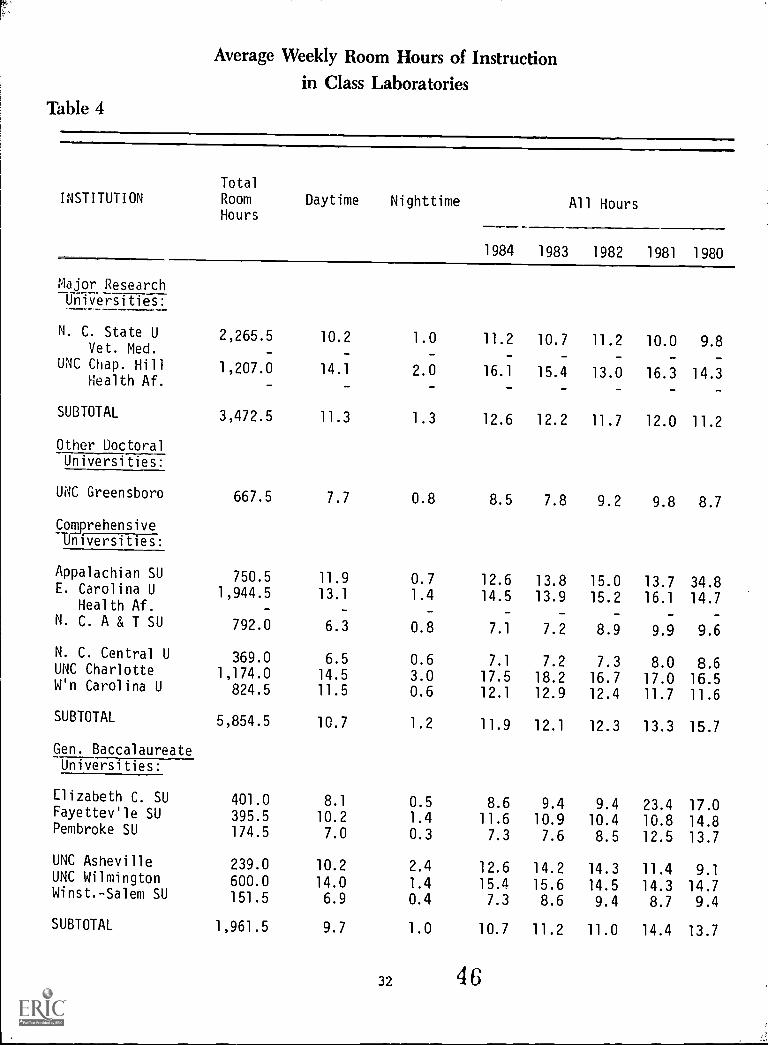
TABLE 4:
AVERAGE WEEKLY ROOM HOURS OF INSTRUCTIONIN CLASS LABORATORIES
The average weekly room hours of instruction in class labora-tories is calculated by dividing the total room hours of instructionin class laboratories by the total number of class laboratories. Inmore general terms, it is the average number of hours that an insti-tution's class laboratories are used for instructional purposes eachweek.
The total room hours of instruction in class laboratories isthe number of hours each week that each class laboratory is used forregularly scheduled classes. This figure is provided in Table 4; thetotal number of class laboratories can be found in Table 17. Table4 also separates the average room hour data into daytime and nighttimeuse of class laboratories. For specific definitions of "daytime"and "nighttime," and for a more detailed explanation of the calculationof total room hours, see page 24.
For purposes of this study, a class laboratory is defined asa room used primarily by regularly scheduled classes that requirespecial-purpose equipment for student participaUon, experimentation,observation, or practice in a field of study. This definition excludesrooms used for regularly scheduled classes which have no special-purpose equipment (i.e., classrooms) and also excludes rooms withspecial-purpose equipment which are not used for regularly scheduledclasses (i.e., other kinds of laboratories).
Table 4 can provide some indication of the adequacy of thenumber of class laboratories at a particular institution. Unfortunately,since the data reflect the utilization of all class laboratories, itis impossible to determine whether an institution's shortage (orsurplus) of these rooms is limited to certain types or is "across theboard." In such cases, an institution might be able to make a moreuseful measurement by determining the average weekly use of each typeof class laboratory.
Because each class laboratory is designed for use in aparticular field of study, most of them are not used as frequently asclassrooms. A commonly cited norm for the average use of classlabor,ories is 20 hours per week. Many of the institutions of theCommunity College System exceed this figure, at least in part becauseof the technical nature of most of their instructional programs. Theother colleges and universities in North Carolina generally fall wellbelow this norm.
AVG. WEEKLY ROOM HOURS OF INSTRUCTION IN CLASS LABORATORIES =
TOTAL ROOM HOURS OF INSTRUCTION IN CLASS LABORATORIESTOTAL NUMBER OF CLASS LABORATORIES
AVERAGE WEEKLY ROOM HOURS OF INSTRUCTIONIN CLASS LABORATORIES
L___1980 1981 1982 1983 1984 1980
1.21.2 1.2 1.2
11.8 11.0 10.7 10.7
1981 1982 1983 1984
KEY
Night
Day
1980 1981 1982 1983 1984
Community Colleges and Technical Institutes The University of North CarolinaALL rl/BI.IC BACCALAUREATEGRANTING INSTITUTIONS
45
Private Institutions
Average Weekly Room Hours of Instructionin Class Laboratories
Table 4
INSTITUTIONTotalRoomHours
Daytime Nighttime All Hours
1984 1983 1982 1981 1980
Major ResearchUniversities:
N. C. State U 2,265.5 10.2 1.0 11.2 10.7 11.2 10.0 9.8Vet. Med. - - -
UNC Chap. Hill 1,207.0 14.1 2.0 16.1 15.4 13.0 16.3 14.3Health Af. - _ - -
SUBTOTAL 3,472.5 11.3 1.3 12.6 12.2 11.7 12.0 11.2
Other DoctoralUniversities:
UNC Greensboro 667.5 7.7 0.8 8.5 7.8 9.2 9.8 8.7
ComprehensiveUniversities:
Appalachian SU 750.5 11.9 0.7 12.6 13.8 15.0 13.7 34.8E. Carolina U 1,944.5 13.1 1.4 14.5 13.9 15.2 16.1 14.7
Health Af. - -N. C. A & T SU 792.0 6.3 0.8 7.1 7.2 8.9 9.9 9.6
N. C. Central U 369.0 6.5 0.6 7.1 7.2 7.3 8.0 8.6UNC Charlotte 1,174.0 14.5 3.0 17.5 18.2 16.7 17.0 16.5Win Carolina U 824.5 11.5 0.6 12.1 12.9 12.4 11.7 11.6
SUBTOTAL 5,854.5 10.7 1.2 11.9 12.1 12.3 13.3 15.7
Gen. BaccalaureateUniversities:
Elizabeth C. SU 401.0 8.1 0.5 8.6 9.4 9.4 23.4 17.0Fayettev'le SU 395.5 10.2 1.4 11.6 10.9 10.4 10.8 14.8Pembroke SU 174.5 7.0 0.3 7.3 7.6 8.5 12.5 13.7
UNC Asheville 239.0 10.2 2.4 12.6 14.2 14.3 11.4 9.1UNC Wilmington 600.0 14.0 1.4 15.4 15.6 14.5 14.3 14.7Winst.-Salem SU 151.5 6.9 0.4 7.3 8.6 9.4 8.7 9.4
SUBTOTAL 1,961.5 9.7 1.0 10.7 11.2 11.0 14.4 13.7
32 4 6
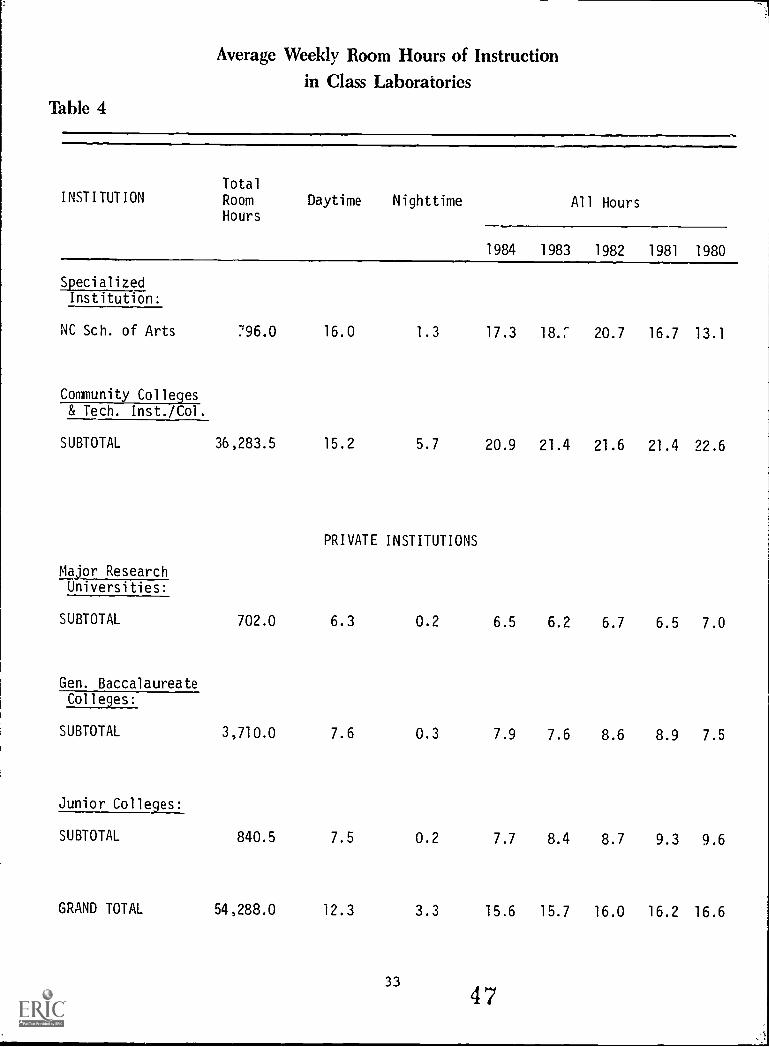
Average Weekly Room Hours of Instructionin Class Laboratories
Table 4
INSTITUTIONTotal
RoomHours
Daytime Nighttime All Hours
1984 1983 1982 1981 1980
SpecializedInstitution:
NC Sch. of Arts 796.0 16.0 1.3 17.3 18:2 20.7 16.7 13.1
Community Colleges& Tech. Inst./Col.
SUBTOTAL 36,283.5 15.2 5.7 20.9 21.4 21.6 21.4 22.6
PRIVATE INSTITUTIONS
Major ResearchUniversities:
SUBTOTAL 702.0 6.3 0.2 6.5 6.2 6.7 6.5 7.0
Gen. BaccalaureateColleges:
SUBTOTAL 3,710.0 7.6 0.3 7.9 7.6 8.6 8.9 7.5
Junior Colleges:
SUBTOTAL 840.5 7.5 0.2 7.7 8.4 8.7 9.3 9.6
GRAND TOTAL 54,288.0 12.3 3.3 15.6 15.7 16.0 16.2 16.6
33
47
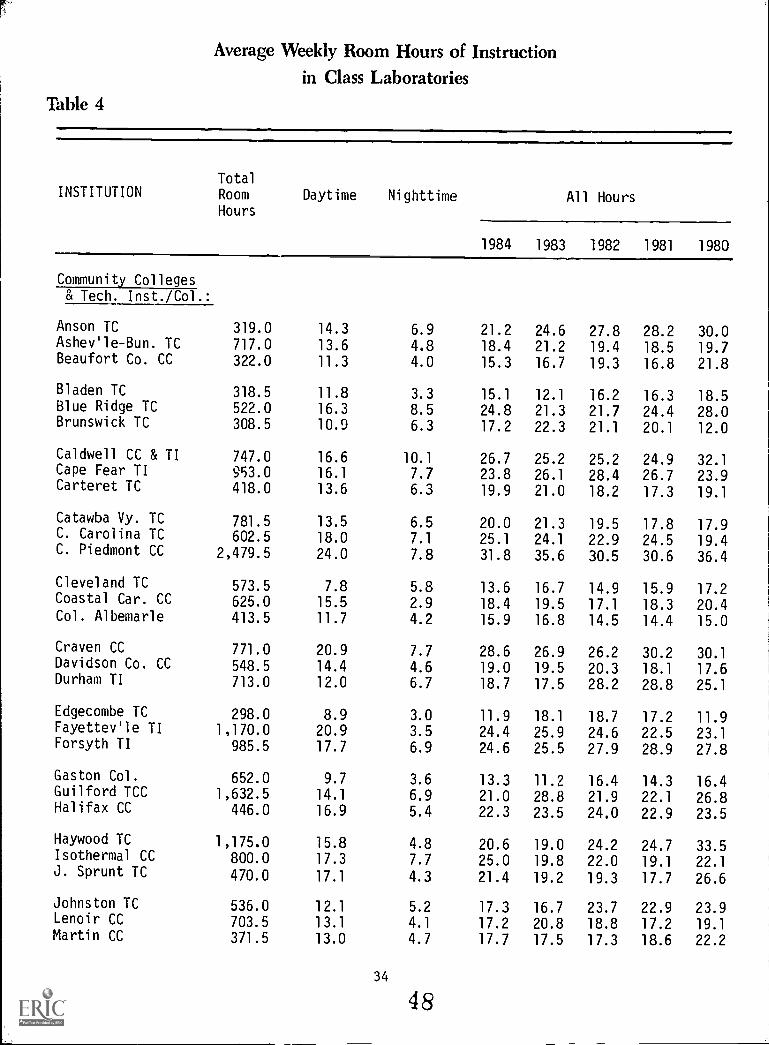
Average Weekly Room Hours of Instructionin Class Laboratories
Table 4
INSTITUTIONTotalRoom
HoursDaytime Nighttime All Hours
1984 1983 1982 1981 1980
Community Colleges& Tech. Inst./Col.:
Anson TC 319.0 14.3 6.9 21.2 24.6 27.8 28.2 30.0Ashev'le -Bun. TC 717.0 13.6 4.8 18.4 21.2 19.4 18.5 19.7Beaufort Co. CC 322.0 11.3 4.0 15.3 16.7 19.3 16.8 21.8
Bladen TC 318.5 11.8 3.3 15.1 12.1 16.2 16.3 18.5Blue Ridge TC 522.0 16.3 8.5 24.8 21.3 21.7 24.4 28.0Brunswick TC 308.5 10.9 6.3 17.2 22.3 21.1 20.1 12.0
Caldwell CC & TI 747.0 16.6 10.1 26.7 25.2 25.2 24.9 32.1Cape Fear TI 953.0 16.1 7.7 23.8 26.1 28.4 26.7 23.9Carteret TC 418.0 13.6 6.3 19.9 21.0 18.2 17.3 19.1
Catawba Vy. TC 781.5 13.5 6.5 20.0 21.3 19.5 17.8 17.9C. Carolina TC 602.5 18.0 7.1 25.1 24.1 22.9 24.5 19.4C. Piedmont CC 2,479.5 24.0 7.8 31.8 35.6 30.5 30.6 36.4
Cleveland TC 573.5 7.8 5.8 13.6 16.7 14.9 15.9 17.2Coastal Car. CC 625.0 15.5 2.9 18.4 19.5 17.1 18.3 20.4Col. Albemarle 413.5 11.7 4.2 15.9 16.8 14.5 14.4 15.0
Craven CC 771.0 20.9 7.7 28.6 26.9 26.2 30.2 30.1Davidson Co. CC 548.5 14.4 4.6 19.0 19.5 20.3 18.1 17.6Durham TI 713.0 12.0 6.7 18.7 17.5 28.2 28.8 25.1
Edgecombe TC 298.0 8.9 3.0 11.9 18.1 18.7 17.2 11.9Fayettev'le TI 1,170.0 20.9 3.5 24.4 25.9 24.6 22.5 23.1Forsyth TI 985.5 17.7 6.9 24.6 25.5 27.9 28.9 27.8
Gaston Col. 652.0 9.7 3.6 13.3 11.2 16.4 14.3 16.4Guilford TCC 1,632.5 14.1 6,9 21.0 28.8 21.9 22.1 26.8Halifax CC 446.0 16.9 5.4 22.3 23.5 24.0 22.9 23.5
Haywood TC 1,175.0 15.8 4.8 20.6 19.0 24.2 24.7 33.5Isothermal CC 800.0 17.3 7.7 25.0 19.8 22.0 19.1 22.1J. Sprunt TC 470.0 17.1 4.3 21.4 19.2 19.3 17.7 26.6
Johnston TC 536.0 12.1 5.2 17.3 16.7 23.7 22.9 23.9Lenoir CC 703.5 13.1 4.1 17.2 20.8 18.8 17.2 19.1Martin CC 371.5 13.0 4.7 17.7 17.5 17.3 18.6 22.2
34
48
Average Weekly Room Hours of Instructionin Class Laboratories
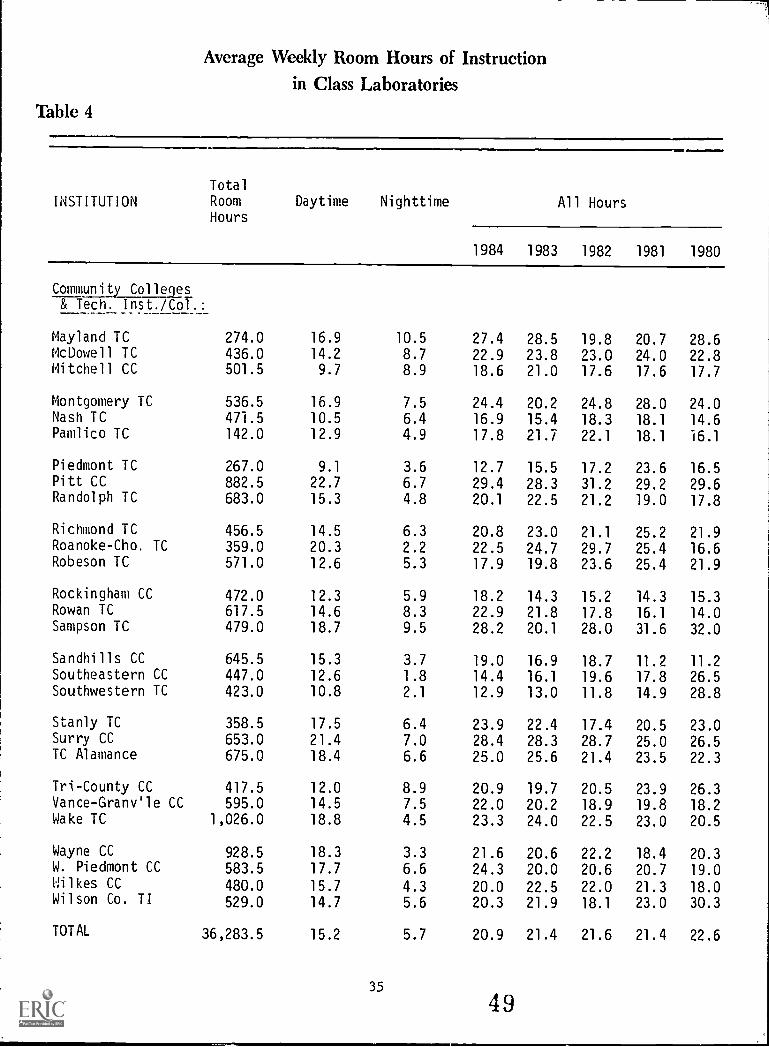
Table 4
INSTITUTION
TotalRoomHours
Daytime Nighttime All Hours
1984 1983 1982 1981 1980
Community Colleges& Tech. Inst./Col.:
Mayland TC 274.0 16.9 10.5 27.4 28.5 19.8 20.7 28.6McDowell TC 436.0 14.2 8.7 22.9 23.8 23.0 24.0 22.8Mitchell CC 501.5 9.7 8.9 18.6 21.0 17.6 17.6 17.7
Montgomery TC 536.5 16.9 7.5 24.4 20.2 24.8 28.0 24.0Nash TC 471.5 10.5 6.4 16.9 15.4 18.3 18.1 14.6Pamlico TC 142.0 12.9 4.9 17.8 21.7 22.1 18.1 16.1
Piedmont TC 267.0 9.1 3.6 12.7 15.5 17.2 23.6 16.5Pitt CC 882.5 22.7 6.7 29.4 28.3 31.2 29.2 29.6Randolph TC 683.0 15.3 4.8 20.1 22.5 21.2 19.0 17.8
Richmond TC 456.5 14.5 6.3 20.8 23.0 21.1 25.2 21.9Roanoke-Cho. TC 359.0 20.3 2.2 22.5 24.7 29.7 25.4 16.6Robeson TC 571.0 12.6 5.3 17.9 19.8 23.6 25.4 21.9
Rockingham CC 472.0 12.3 5.9 18.2 14.3 15.2 14.3 15.3Rowan TC 617.5 14.6 8.3 22.9 21.8 17.8 16.1 14.0Sampson TC 479.0 18.7 9.5 28.2 20.1 28.0 31.6 32.0
Sandhills CC 645.5 15.3 3.7 19.0 16.9 18.7 11.2 11.2Southeastern CC 447.0 12.6 1.8 14.4 16.1 19.6 17.8 26.5Southwestern TC 423.0 10.8 2.1 12.9 13.0 11.8 14.9 28.8
Stanly TC 358.5 17.5 6.4 23.9 22.4 17.4 20.5 23.0Surry CC 653.0 21.4 7.0 28.4 28.3 28.7 25.0 26.5TC Alamance 675.0 18.4 6.6 25.0 25.6 21.4 23.5 22.3
Tri-County CC 417.5 12.0 8.9 20.9 19.7 20.5 23.9 26.3Vance-Granvile CC 595.0 14.5 7.5 22.0 20.2 18.9 19.8 18.2Wake TC 1,026.0 18.8 4.5 23.3 24.0 22.5 23.0 20.5
Wayne CC 928.5 18.3 3.3 21.6 20.6 22.2 18.4 20.3W. Piedmont CC 583.5 17.7 6.6 24.3 20.0 20.6 20.7 19.0Wilkes CC 480.0 15.7 4.3 20.0 22.5 22.0 21.3 18.0Wilson Co. TI 529.0 14.7 5.6 20.3 21.9 18.1 23.0 30.3
TOTAL 36,283.5 15.2 5.7 20.9 21.4 21.6 21.4 22.6
35
49
TABLE 5:
AVERAGE WEEKLY USE OF STUDENT STATIONS
IN CLASSROOMS
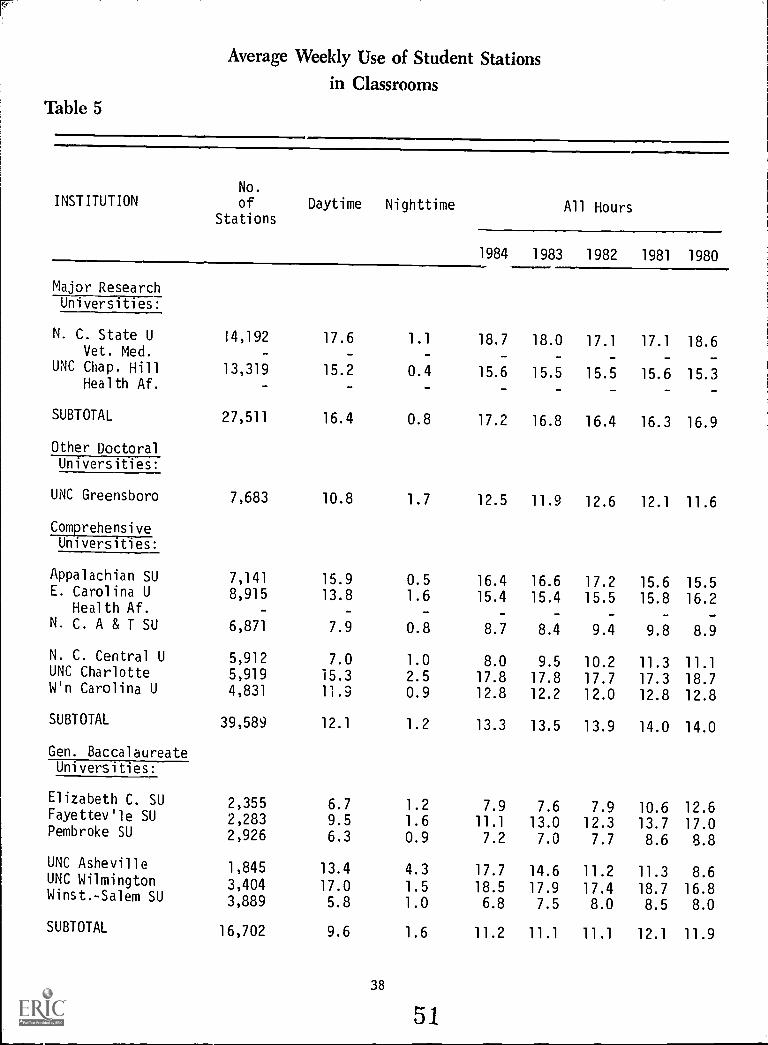
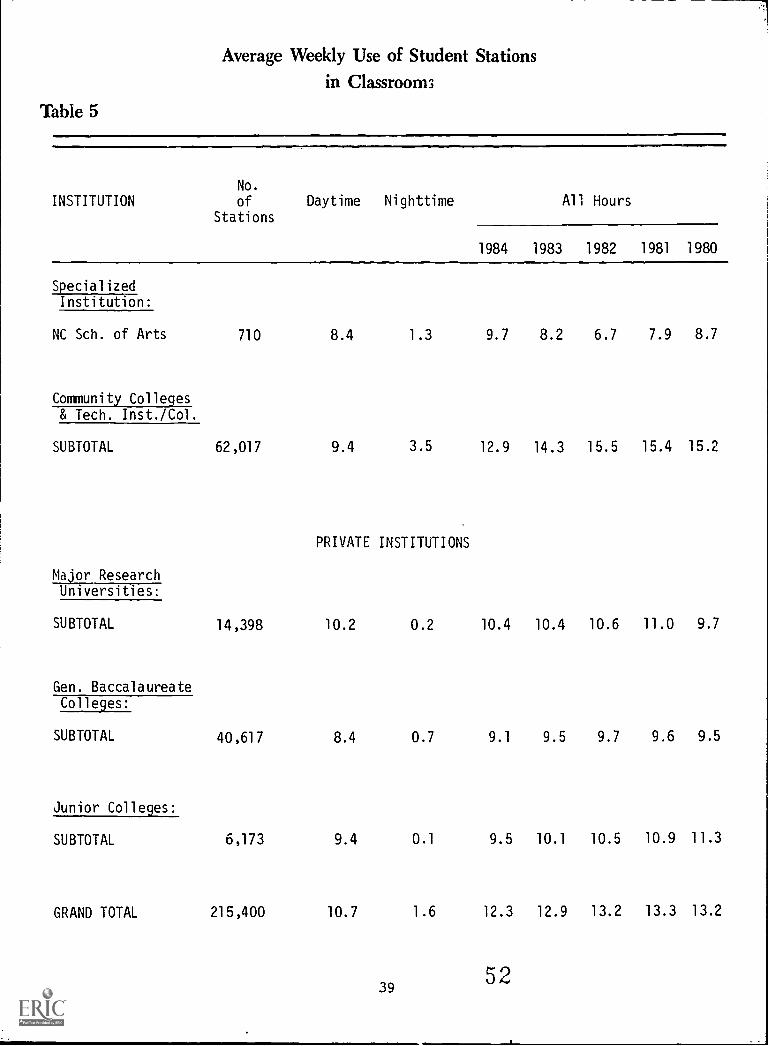
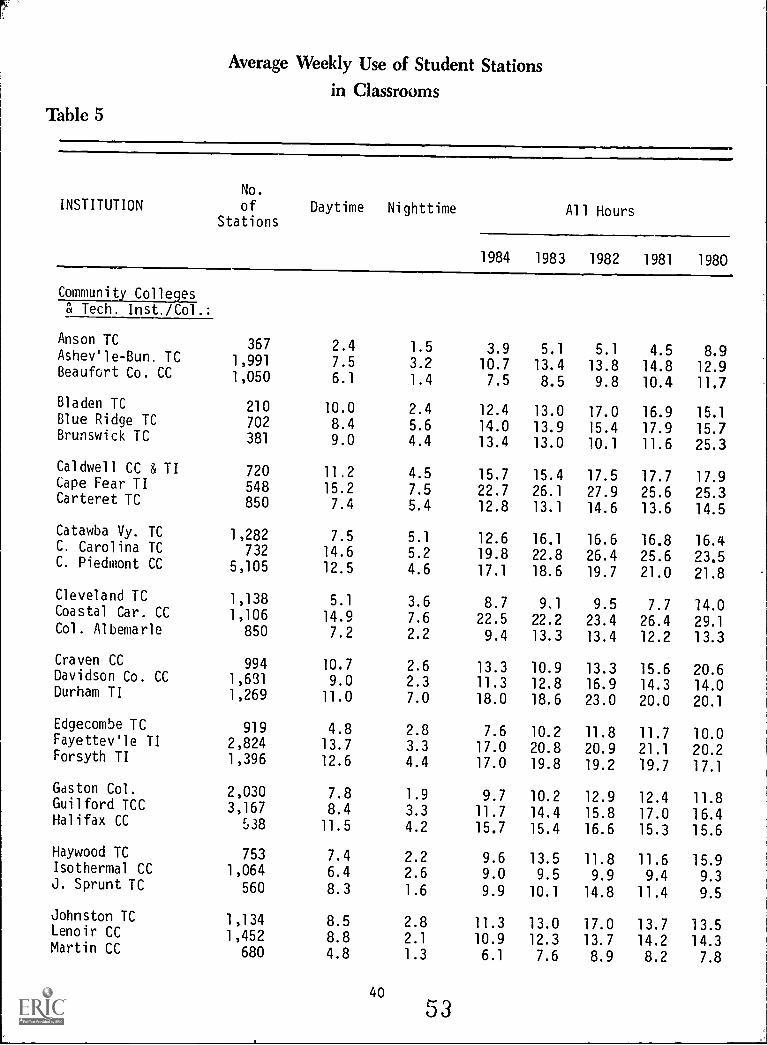
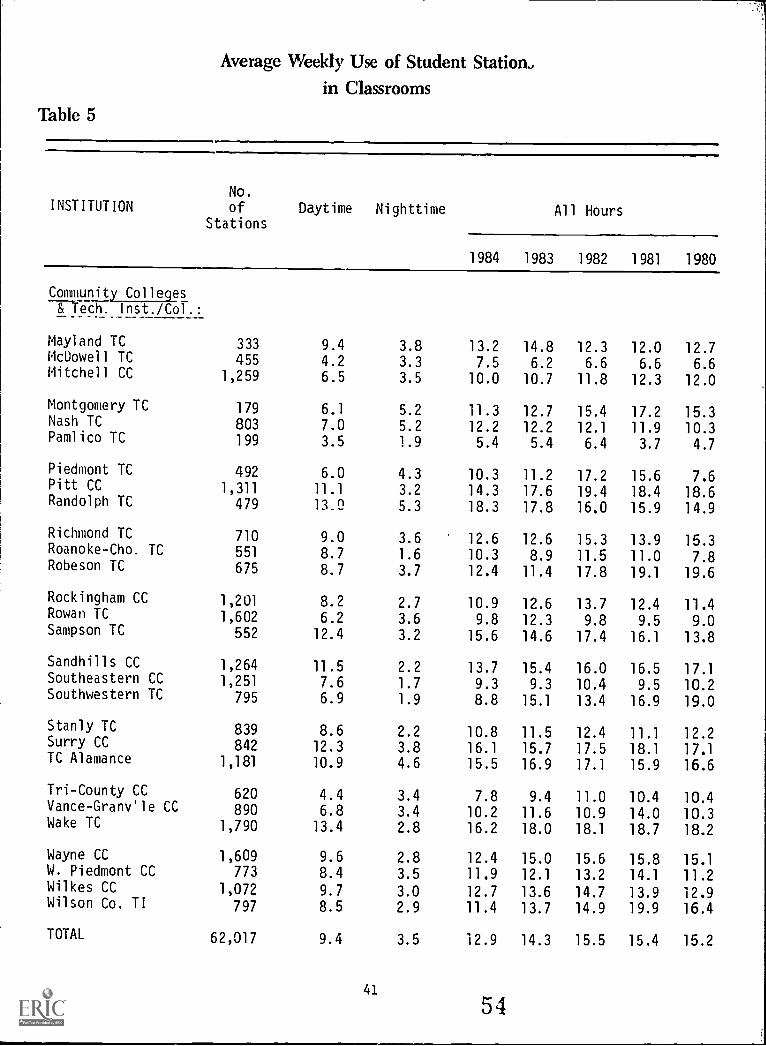
Average weekly use of student stations in classrooms is calcu-lated by dividing the total number of student clock hours generated inclassrooms by the total number of student stations in classrooms. Moregenerally, it can be thought of as the average number of hours eachweek that each classroom student station is used.
For the current year, Table 5 reports the total number ofclassroom student stations and breaks down the average weekly usefigure into daytime and nighttime utilization. (See page 24 forprecise definitions of classrooms and of daytime and nighttime utiliza-tion.) For purposes of comparison, this table also lists the averageweekly use of student stations for the previous four years.
The average weekly use of student stations can serve as anindicator of the adequacy of the number of student stations in class-rooms. A norm which has been frequently cited is 18 hours per week.This figure is based on the assumption that the average weekly use ofclassrooms is 30 hours (see Table 3) and that there is 60% utilizationof student stations when classrooms are in use (see Table 7). MostNorth Carolina colleges and universities fall considerably below thisnorm, suggesting a surplus of classroom student stations.
AVERAGE WEEKLY USE OF STUDENT STATIONS IN CLASSROOMS =
TOTAL STUDENT CLOCK HOURS IN CLASSROOMSTOTAL STUDENT STATIONS IN CLASSROOMS
37
50
Average Weekly Use of Student Stationsin Classrooms
Table 5
INSTITUTIONNo.
ofStations
Daytime Nighttime All Hours
1984 1983 1982 1981 1980
Major ResearchUniversities:
N. C. State U 14,192 17.6 1.1 18.7 18.0 17.1 17.1 18.6Vet. Med.
UNC Chap. Hill 13,319 15.2 0.4 15.6 15.5 15.5 15.6 15.3Health Af.
SUBTOTAL 27,511 16.4 0.8 17.2 16.8 16.4 16.3 16.9
Other DoctoralUniversities:
UNC Greensboro 7,683 10.8 1.7 12.5 11.9 12.6 12.1 11.6
ComprehensiveUniversities:
Appalachian SU 7,141 15.9 0.5 16.4 16.6 17.2 15.6 15.5E. Carolina U 8,915 13.8 1.6 15.4 15.4 15.5 15.8 16.2
Health Af. - - -
N. C. A & T SU 6,871 7.9 0.8 8.7 8.4 9.4 9.8 8.9
N. C. Central U 5,912 7.0 1.0 8.0 9.5 10.2 11.3 11.1UNC Charlotte 5,919 15.3 2.5 17.8 17.8 17.7 17.3 18.7W'n Carolina U 4,831 11.9 0.9 12.8 12.2 12.0 12.8 12.8
SUBTOTAL 39,589 12.1 1.2 13.3 13.5 13.9 14.0 14.0
Gen. BaccalaureateUniversities:
Elizabeth C. SU 2,355 6.7 1.2 7.9 7.6 7.9 10.6 12.6Fayettev'le SU 2,283 9.5 1.6 11.1 13.0 12.3 13.7 17.0Pembroke SU 2,926 6.3 0.9 7.2 7.0 7.7 8.6 8.8
UNC Asheville 1,845 13.4 4.3 17.7 14.6 11.2 11.3 8.6UNC Wilmington 3,404 17.0 1.5 18.5 17.9 17.4 18.7 16.8Winst.-Salem SU 3,889 5.8 1.0 6.8 7.5 8.0 8.5 8.0
SUBTOTAL 16,702 9.6 1.6 11.2 11.1 11.1 12.1 11.9
38
51
Average Weekly Use of Student Stationsin Classroom3
Table 5
INSTITUTIONNo.
ofStations
Daytime Nighttime All Hours
1984 1983 1982 1981 1980
SpecializedInstitution:
NC Sch. of Arts 710 8.4 1.3 9.7 8.2 6.7 7.9 8.7
Community Colleges& Tech. Inst./Col.
SUBTOTAL 62,017 9.4 3.5 12.9 14.3 15.5 15.4 15.2
PRIVATE INSTITUTIONS
Major ResearchUniversities:
SUBTOTAL 14,398 10.2 0.2 10.4 10.4 10.6 11.0 9.7
Gen. BaccalaureateColleges:
SUBTOTAL 40,617 8.4 0.7 9.1 9.5 9.7 9.6 9.5
Junior Colleges:
SUBTOTAL 6,173 9.4 0.1 9.5 10.1 10.5 10.9 11.3
GRAND TOTAL 215,400 10.7 1.6 12.3 12.9 13.2 13.3 13.2
3952
Average Weekly Use of Student Stationsin Classrooms
Table 5
INSTITUTIONNo.
ofStations
Daytime Nighttime All Hours
1984 1983 1982 1981 1980
Community Colleges& Tech. Inst./Col.:
Anson TC 367 2.4 1.5 3.9 5.1 5.1 4.5 8.9Ashev'le-Bun. TC 1,991 7.5 3.2 10.7 13.4 13.8 14.8 12.9Beaufort Co. CC 1,050 6.1 1.4 7.5 8.5 9.8 10.4 11.7
Bladen TC 210 10.0 2.4 12.4 13.0 17.0 16.9 15.1Blue Ridge TC 702 8.4 5.6 14.0 13.9 15.4 17.9 15.7Brunswick TC 381 9.0 4.4 13.4 13.0 10.1 11.6 25.3
Caldwell CC & TI 720 11.2 4.5 15.7 15.4 17.5 17.7 17.9Cape Fear TI 548 15.2 7.5 22.7 26.1 27.9 25.6 25.3Carteret TC 850 7.4 5.4 12.8 13.1 14.6 13.6 14.5
Catawba Vy. TC 1,282 7.5 5.1 12.6 16.1 16.6 16.8 16.4C. Carolina TC 732 14.6 5.2 19.8 22.8 26.4 25.6 23.5C. Piedmont CC 5,105 12.5 4.6 17.1 18.6 19.7 21.0 21.8
Cleveland TC 1,138 5.1 3.6 8.7 9.1 9.5 7.7 14.0Coastal Car. CC 1,106 14.9 7.6 22.5 22.2 23.4 26.4 29.1Col. Albemarle 850 7.2 2.2 9.4 13.3 13.4 12.2 13.3
Craven CC 994 10.7 2.6 13.3 10.9 13.3 15.6 20.6Davidson Co. CC 1,631 9.0 2.3 11.3 12.8 16.9 14.3 14.0Durham TI 1,269 11.0 7.0 18.0 18.6 23.0 20.0 20.1
Edgecombe TC 919 4.8 2.8 7.6 10.2 11.8 11.7 10.0Fayettevle TI 2,824 13.7 3.3 17.0 20.8 20.9 21.1 20.2Forsyth TI 1,396 12.6 4.4 17.0 19.8 19.2 19.7 17.1
Gaston Col. 2,030 7.8 1.9 9.7 10.2 12.9 12.4 11.8Guilford TCC 3,167 8.4 3.3 11.7 14.4 15.8 17.0 16.4Halifax CC 538 11.5 4.2 15.7 15.4 16.6 15.3 15.6
Haywood TC 753 7.4 2.2 9.6 13.5 11.8 11.6 15.9Isothermal CC 1,064 6.4 2.6 9.0 9.5 9.9 9.4 9.3J. Sprunt TC 560 8.3 1.6 9.9 10.1 14.8 11.4 9.5
Johnston TC 1,134 8.5 2.8 11.3 13.0 17.0 13.7 13.5Lenoir CC 1,452 8.8 2.1 10.9 12.3 13.7 14.2 14.3Martin CC 680 4.8 1.3 6.1 7.6 8.9 8.2 7.8
40
53
Average Weekly Use of Student Stationsin Classrooms
Table 5
INSTITUTIONNo.
ofStations
Daytime Nighttime All Hours
1984 1983 1982 1981 1980
Comulnity Colleges& Tech. Inst./Col.
Mayland TC 333 9.4 3.8 13.2 14.8 12.3 12.0 12.7McDowell TC 455 4.2 3.3 7.5 6.2 6.6 6.6 6.6Mitchell CC 1,259 6.5 3.5 10.0 10.7 11.8 12.3 12.0
Montgomery TC 179 6.1 5.2 11.3 12.7 15.4 17.2 15.3Nash TC 803 7.0 5.2 12.2 12.2 12.1 11.9 10.3Pamlico TC 199 3.5 1.9 5.4 5.4 6.4 3.7 4.7
Piedmont TC 492 6.0 4.3 10.3 11.2 17.2 15.6 7.6Pitt CC 1,311 11.1 3.2 14.3 17.6 19.4 18.4 18.6Randolph TC 479 13,0 5.3 18.3 17.8 16.0 15.9 14.9
Richmond TC 710 9.0 3.6 12.6 12.6 15.3 13.9 15.3Roanoke-Cho. TC 551 8.7 1.6 10.3 8.9 11.5 11.0 7.8Robeson TC 675 8.7 3.7 12.4 11.4 17.8 19.1 19.6
Rockingham CC 1,201 8.2 2.7 10.9 12.6 13.7 12.4 11.4Rowan TC 1,602 6.2 3.6 9.8 12.3 9.8 9.5 9.0Sampson TC 552 12.4 3.2 15.6 14.6 17.4 16.1 13.8
Sandhills CC 1,264 11.5 2.2 13.7 15.4 16.0 16.5 17.1Southeastern CC 1,251 7.6 1.7 9.3 9.3 10.4 9.5 10.2Southwestern TC 795 6.9 1.9 8.8 15.1 13.4 16.9 19.0
Stanly TC 839 8.6 2.2 10.8 11.5 12.4 11.1 12.2Surry CC 842 12.3 3.8 16.1 15.7 17.5 18.1 17.1TC Alamance 1,181 10.9 4.6 15.5 16.9 17.1 15.9 16.6
Tri-County CC 620 4.4 3.4 7.8 9.4 11.0 10.4 10.4Vance-Gram/Ile CC 890 6.8 3.4 10.2 11.6 10.9 14.0 10.3Wake TC 1,790 13.4 2.8 16.2 18.0 18.1 18.7 18.2
Wayne CC 1,609 9.6 2.8 12.4 15.0 15.6 15.8 15.1W. Piedmont CC 773 8.4 3.5 11.9 12.1 13.2 14.1 11.2Wilkes CC 1,072 9.7 3.0 12.7 13.6 14.7 13.9 12.9Wilson Co. TI 797 8.5 2.9 11.4 13.7 14.9 19.9 16.4
TOTAL 62,017 9.4 3.5 12.9 14.3 15.5 15.4 15.2
41
54
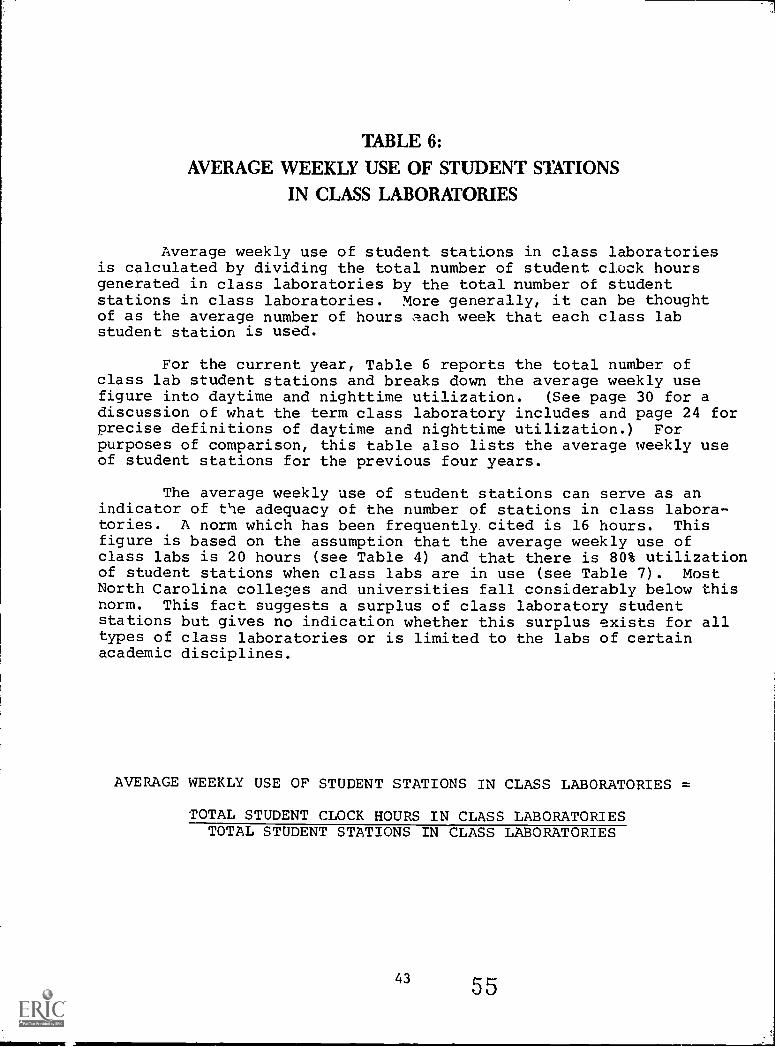
TABLE 6:
AVERAGE WEEKLY USE OF STUDENT STATIONS
IN CLASS LABORATORIES
Average weekly use of student stations in class laboratoriesis calculated by dividing the total number of student clock hoursgenerated in class laboratories by the total number of studentstations in class laboratories. More generally, it can be thoughtof as the average number of hours each week that each class labstudent station is used.
For the current year, Table 6 reports the total number ofclass lab student stations and breaks down the average weekly usefigure into daytime and nighttime utilization. (See page 30 for adiscussion of what the term class laboratory includes and page 24 forprecise definitions of daytime and nighttime utilization.) Forpurposes of comparison, this table also lists the average weekly useof student stations for the previous four years.
The average weekly use of student stations can serve as anindicator of the adequacy of the number of stations in class labora-tories. A norm which has been frequently. cited is 16 hours. Thisfigure is based on the assumption that the average weekly use ofclass labs is 20 hours (see Table 4) and that there is 80% utilizationof student stations when class labs are in use (see Table 7). MostNorth Carolina colleges and universities fall considerably below thisnorm. This fact suggests a surplus of class laboratory studentstations but gives no indication whether this surplus exists for alltypes of class laboratories or is limited to the labs of certainacademic disciplines.
AVERAGE WEEKLY USE OF STUDENT STATIONS IN CLASS LABORATORIES =
TOTAL STUDENT CLOCK HOURS IN CLASS LABORATORIESTOTAL STUDENT STATIONS IN CLASS LABORATORIES
43
MINIriammow
55
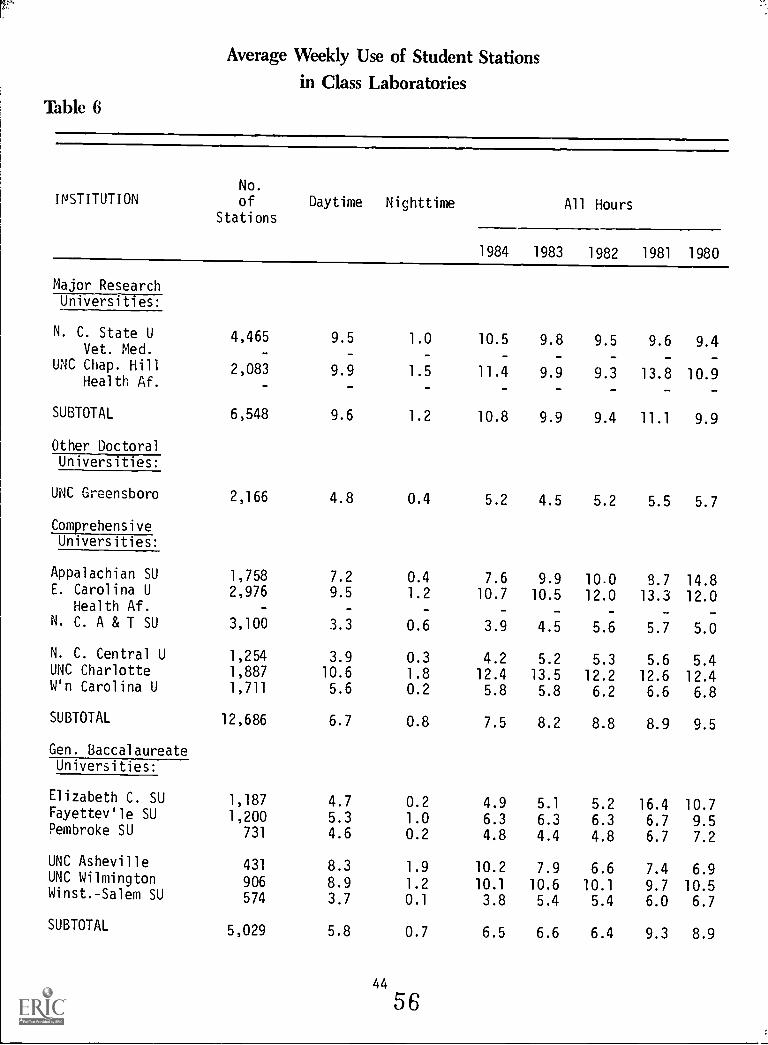
Average Weekly Use of Student Stationsin Class Laboratories
Table 6
INSTITUTIONNo.
ofStations
Daytime Nighttime All Hours
1984 1983 1982 1981 1980
Major ResearchUniversities:
N. C. State U 4,465 9.5 1.0 10.5 9.8 9.5 9.6 9.4Vet. Med.
UNC Chap. Hill 2,083 9.9 1.5 11.4 9.9 9.3 13.8 10.9Health Af.
SUBTOTAL 6,548 9.6 1.2 10.8 9.9 9.4 11.1 9.9
Other DoctoralUniversities:
UNC Greensboro 2,166 4.8 0.4 5.2 4.5 5.2 5.5 5.7
ComprehensiveUniversities:
Appalachian SU 1,758 7.2 0.4 7.6 9.9 10.0 8.7 14.8E. Carolina U 2,976 9.5 1.2 10.7 10.5 12.0 13.3 12.0
Health Af. - - -N. C. A & T SU 3,100 3.3 0.6 3.9 4.5 5.6 5.7 5.0
N. C. Central U 1,254 3.9 0.3 4.2 5.2 5.3 5.6 5.4UNC Charlotte 1,887 10.6 1.8 12.4 13.5 12.2 12.6 12.4W'n Carolina U 1,711 5.6 0.2 5.8 5.8 6.2 6.6 6.8
SUBTOTAL 12,686 6.7 0.8 7.5 8.2 8.8 8.9 9.5
Gen. BaccalaureateUniversities:
Elizabeth C. SU 1,187 4.7 0.2 4.9 5.1 5.2 16.4 10.7Fayettev'le SU 1,200 5.3 1.0 6.3 6.3 6.3 6.7 9.5Pembroke SU 731 4.6 0.2 4.8 4.4 4.8 6.7 7.2
UNC Asheville 431 8.3 1.9 10.2 7.9 6.6 7.4 6.9UNC Wilmington 906 8.9 1.2 10.1 10.6 10.1 9.7 10.5Winst.-Salem SU 574 3.7 0.1 3.8 5.4 5.4 6.0 6.7
SUBTOTAL 5,029 5.8 0.7 6.5 6.6 6.4 9.3 8.9
44
56
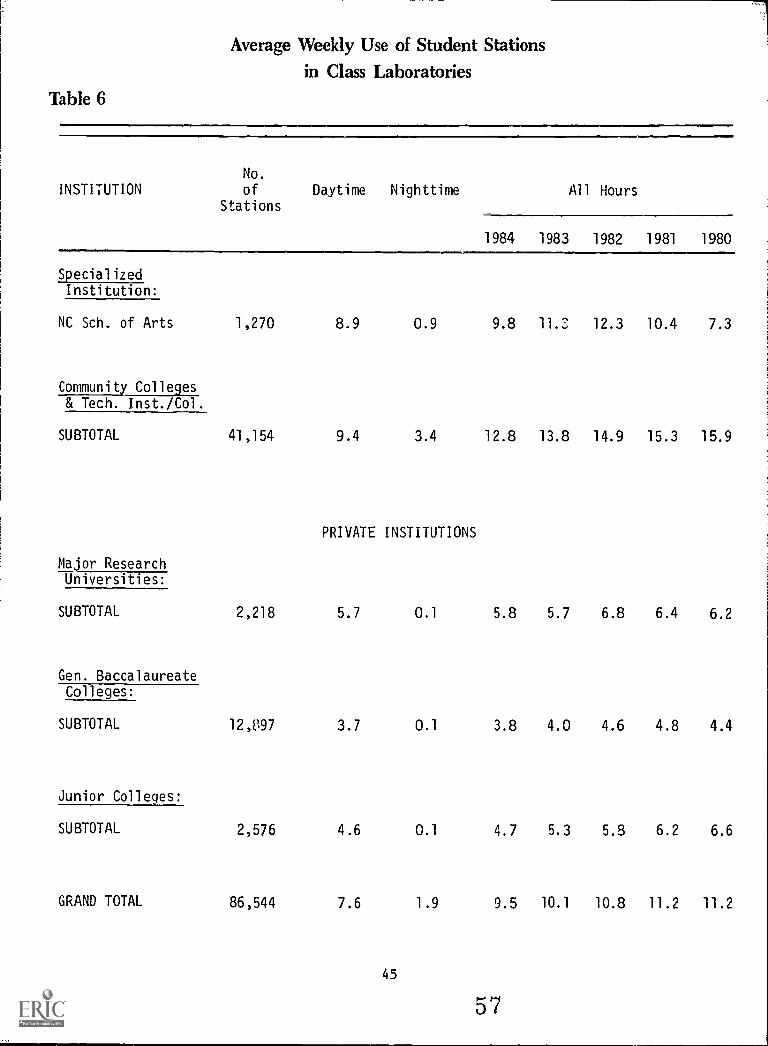
Average Weekly Use of Student Stationsin Class Laboratories
Table 6
INSTITUTION
No.
ofStations
Daytime Nighttime All Hours
1984 1983 1982 1981 1980
SpecializedInstitution:
NC Sch. of Arts 1,270 8.9 0.9 9.8 11.2 12.3 10.4 7.3
Community Colleges& Tech. Inst./Col.
SUBTOTAL 41,154 9.4 3.4 12.8 13.8 14.9 15.3 15.9
PRIVATE INSTITUTIONS
Major ResearchUniversities:
SUBTOTAL 2,218 5.7 0.1 5.8 5.7 6.8 6.4 6.2
Gen. BaccalaureateColleges:
SUBTOTAL 12,897 3.7 0.1 3.8 4.0 4.6 4.8 4.4
Junior Colleges:
SUBTOTAL 2,576 4.6 0.1 4.7 5.3 5.8 6.2 6.6
GRAND TOTAL 86,544 7.6 1.9 9.5 10.1 10.8 11.2 11.2
45
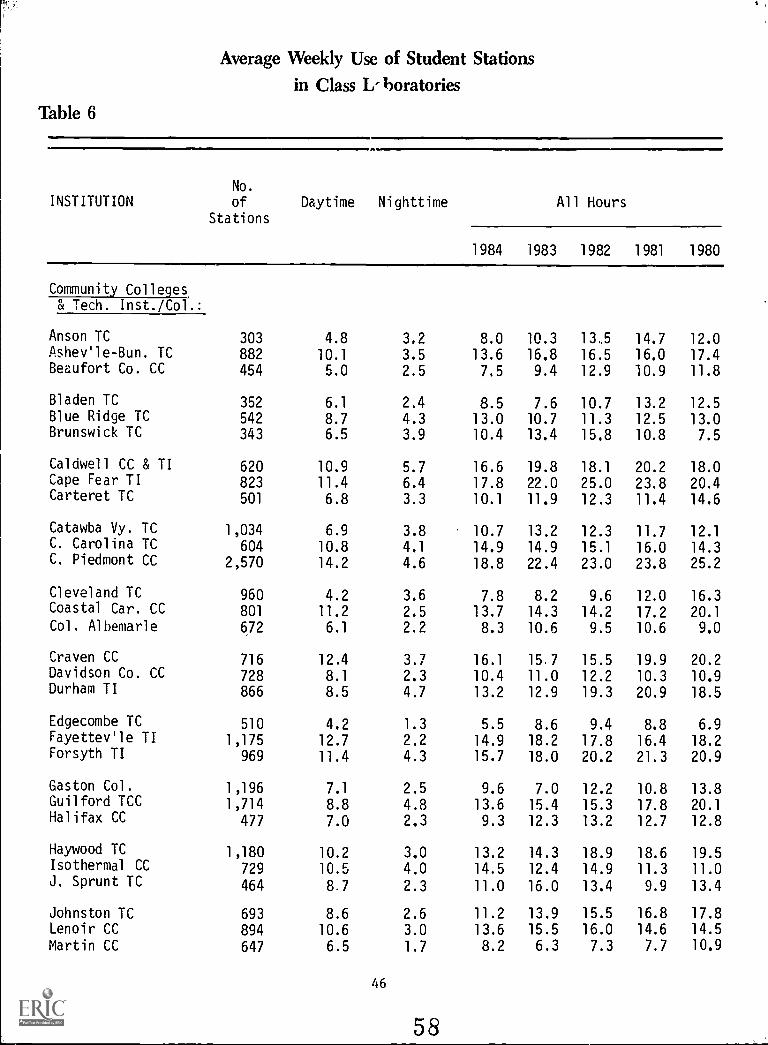
Average Weekly Use of Student Stations
in Class L-boratories
Table 6
INSTITUTIONNo.
of
StationsDaytime Nighttime All Hours
1984 1983 1982 1981 1980
Community Colleges& Tech. Inst./Col.:
Anson TC 303 4.8 3.2 8.0 10.3 13,5 14.7 12.0Ashev'le -Bun. TC 882 10.1 3.5 13.6 16.8 16.5 16.0 17.4Beaufort Co. CC 454 5.0 2.5 7.5 9.4 12.9 10.9 11.8
Bladen TC 352 6.1 2.4 8.5 7.6 10.7 13.2 12.5Blue Ridge TC 542 8.7 4.3 13.0 10.7 11.3 12.5 13.0Brunswick TC 343 6.5 3.9 10.4 13.4 15.8 10.8 7.5
Caldwell CC & TI 620 10.9 5.7 16.6 19.8 18.1 20.2 18.0Cape Fear TI 823 11.4 6,4 17.8 22.0 25.0 23.8 20.4Carteret TC 501 6.8 3.3 10.1 11.9 12.3 11.4 14.6
Catawba Vy. TC 1,034 6.9 3.8 10.7 13.2 12.3 11.7 12.1C. Carolina TC 604 10.8 4.1 14.9 14.9 15.1 16.0 14.3C. Piedmont CC 2,570 14.2 4.6 18.8 22.4 23.0 23.8 25.2
Cleveland TC 960 4.2 3.6 7.8 8.2 9.6 12.0 16.3Coastal Car. CC 801 11.2 2.5 13.7 14.3 14.2 17.2 20.1Col. Albemarle 672 6.1 2.2 8.3 10.6 9.5 10.6 9.0
Craven CC 716 12.4 3.7 16.1 15.7 15.5 19.9 20.2Davidson Co. CC 728 8.1 2.3 10.4 11.0 12.2 10.3 10.9Durham TI 866 8.5 4.7 13.2 12.9 19.3 20.9 18.5
Edgecombe TC 510 4.2 1.3 5.5 8.6 9.4 8.8 6.9Fayettev'le TI 1,175 12.7 2.2 14.9 18.2 17.8 16.4 18.2Forsyth TI 969 11.4 4.3 15.7 18.0 20.2 21.3 20.9
Gaston Col. 1,196 7.1 2.5 9.6 7.0 12.2 10.8 13.8Guilford TCC 1,714 8.8 4.8 13.6 15.4 15.3 17.8 20.1Halifax CC 477 7.0 2.3 9.3 12.3 13.2 12.7 12.8
Haywood TC 1,180 10.2 3.0 13.2 14.3 18.9 18.6 19.5Isothermal CC 729 10.5 4.0 14.5 12.4 14.9 11.3 11.0J. Sprunt TC 464 8.7 2.3 11.0 16.0 13.4 9.9 13.4
Johnston TC 693 8.6 2.6 11.2 13.9 15.5 16.8 17.8Lenoir CC 894 10.6 3.0 13.6 15.5 16.0 14.6 14.5
Martin CC 647 6.5 1.7 8.2 6.3 7.3 7.7 10.9
46
58
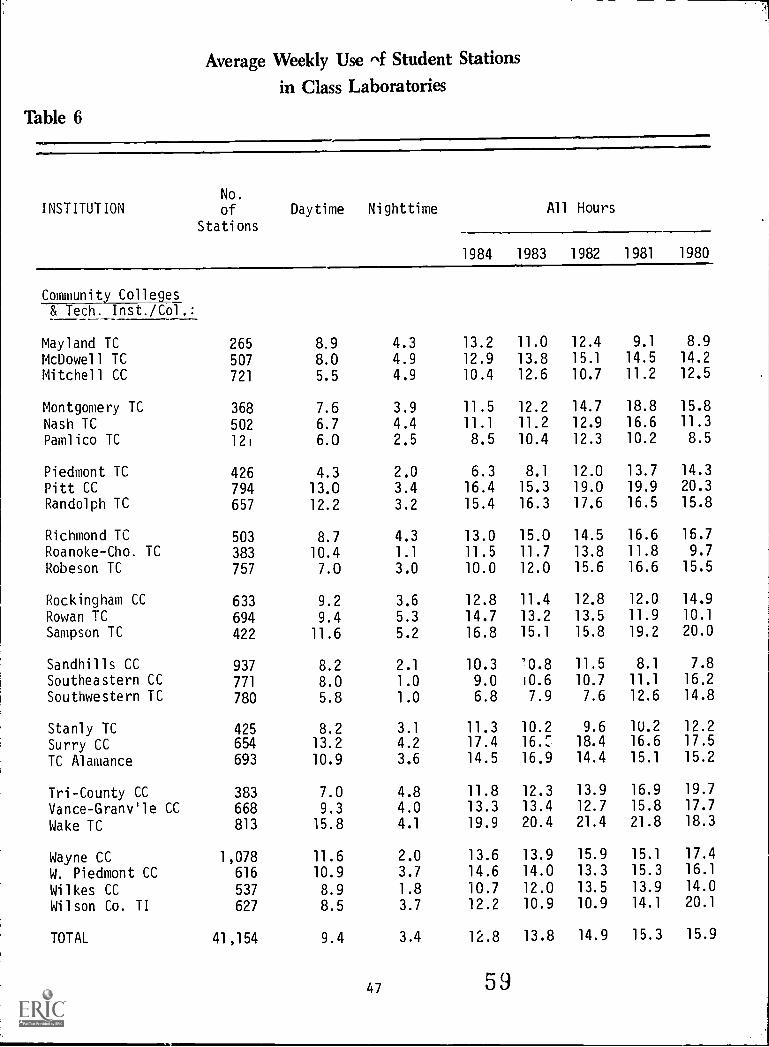
Average Weekly Use 4 Student Stations
in Class Laboratories
Table 6
INSTITUTIONNo.
ofStations
Daytime Nighttime All Hours
1984 1983 1982 1981 1980
Community Colleges& Tech. Inst./Col.:
Mayland TC 265 8.9 4.3 13.2 11.0 12.4 9.1 8.9
McDowell TC 507 8.0 4.9 12.9 13.8 15.1 14.5 14.2
Mitchell CC 721 5.5 4.9 10.4 12.6 10.7 11.2 12.5
Montgomery TC 368 7.6 3.9 11.5 12.2 14.7 18.8 15.8
Nash TC 502 6.7 4.4 11.1 11.2 12.9 16.6 11.3
Pamlico TC 121 6.0 2.5 8.5 10.4 12.3 10.2 8.5
Piedmont TC 426 4.3 2.0 6.3 8.1 12.0 13.7 14.3
Pitt CC 794 13.0 3.4 16.4 15.3 19.0 19.9 20.3
Randolph TC 657 12.2 3.2 15.4 16.3 17.6 16.5 15.8
Richmond TC 503 8.7 4.3 13.0 15.0 14.5 16.6 16.7
Roanoke-Cho TC 383 10.4 1.1 11.5 11.7 13.8 11.8 9.7
Robeson TC 757 7.0 3.0 10.0 12.0 15.6 16.6 15.5
Rockingham CC 633 9.2 3.6 12.8 11.4 12.8 12.0 14.9
Rowan TC 694 9.4 5.3 14.7 13.2 13.5 11.9 10.1
Sampson TC 422 11.6 5.2 16.8 15.1 15.8 19.2 20.0
Sandhills CC 937 8.2 2.1 10.3 '0.8 11.5 8.1 7.8
Southeastern CC 771 8.0 1.0 9.0 10.6 10.7 11.1 16.2
Southwestern TC 780 5.8 1.0 6.8 7.9 7.6 12.6 14.8
Stanly TC 425 8.2 3.1 11.3 10.2 9.6 1U.2 12.2
Surry CC 654 13.2 4.2 17.4 16.: 18.4 16.6 17.5
TC Alamance 693 10.9 3.6 14.5 16.9 14.4 15.1 15.2
Tri-County CC 383 7.0 4.8 11.8 12.3 13.9 16.9 19.7
Vance- Granv'le CC 668 9.3 4.0 13.3 13.4 12.7 15.8 17.7
Wake TC 813 15.8 4.1 19.9 20.4 21.4 21.8 18.3
Wayne CC 1,078 11.6 2.0 13.6 13.9 15.9 15.1 17.4
W. Piedmont CC 616 10.9 3.7 14.6 14.0 13.3 15.3 16.1
Wilkes CC 537 8.9 1.8 10.7 12.0 13.5 13.9 14.0
Wilson Co. TI 627 8.5 3.7 12.2 10.9 10.9 14.1 20.1
TOTAL 41,154 9.4 3.4 12.8 13.8 14.9 15.3 15.9
47 5 9
TABLE 7:
PERCENT STUDENT STATION UTILIZATION,CLASSROOMS AND CLASS LABORATORIES
The percent student station utilization indicates the averagepercentage of student stations that are occupied when classrooms orclass laboratories are in use. It is calculated by dividing thestudent clock hours generated in classrooms (or class labs) by thepotential student clock hours for classrooms (or class labs) andmultiplying by 100 to convert to a percentage. Potential studentclock hours is computed on a room-by-room basis by multiplying thenumber of student stations in each room by the room hours ofinstruction generated by the room (Tables 3 and 4). It indicates thenumber of student clock hours which would be generated if every roomwere filled to capacity (i.e., if the number of students equalledthe number of stations) each time a course met in the room.
It is important to keep in mind that the percent studentstation utilization assesses the utilization of rooms only when theyare in use. This figure is therefore a helpful indicator of howclose to capacity an institution's courses are to the rooms in whichthey are scheduled. It does not, however, indicate the over-allefficiency of utilization since it does not take into account howfrequently a room is used.
Frequently cited norms for percent student station utilizationare 60% for classrooms and 80% fc.: class laboratories. The higherpercentage for class labs reflects the assumption that these rooms,although used less frequently than classrooms because of theirspecialized equipment, are usually closer to being filled to capacitywhen they are in use. Data for North Carolina colleges and universities,however, indicate that the percent student station utilization in classlabs is not significantly higher than in classrooms. For both typesof rooms, the average percentage is less than 60%.
PERCENT STUDENT STATION UTILIZATION IN CLASSROOMS (OR CLASS LABS) =
STUDENT CLOCK HOURS IN CLASSROOMS (OR CLASS LABS)POTENTIAL STUDENT CLOCK HOURS IN CLASSROOMS (OR CLASS LABS)
49 6U
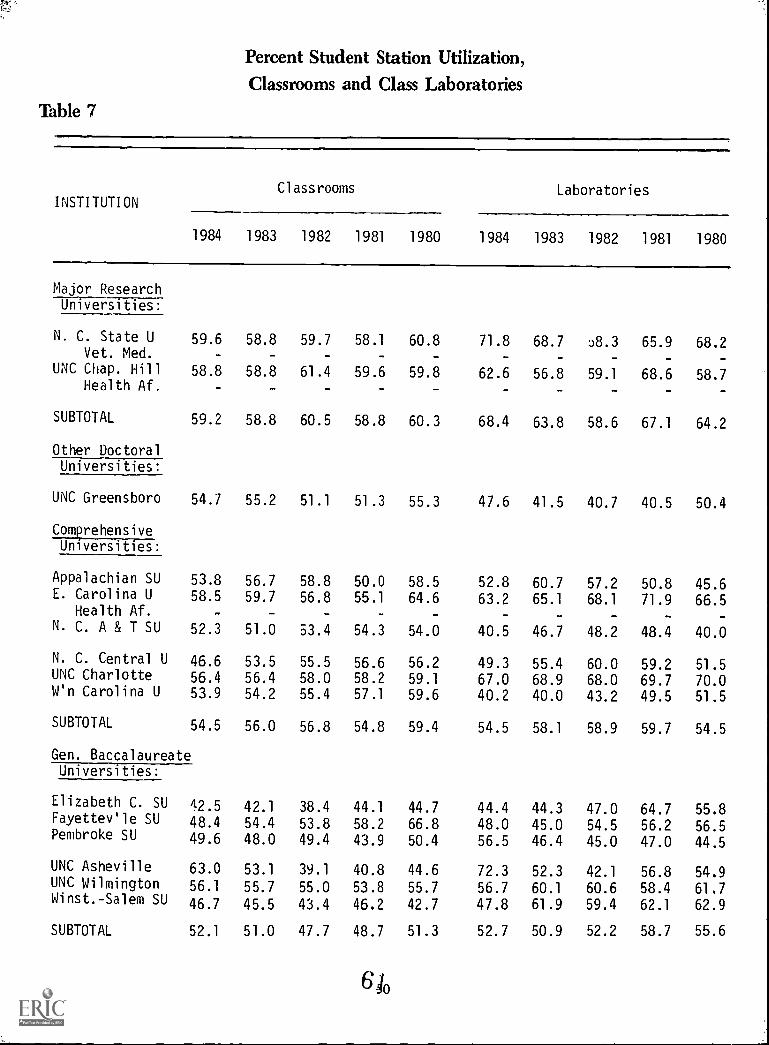
Percent Student Station Utilization,Classrooms and Class Laboratories
Table 7
INSTITUTIONClassrooms Laboratories
1984 1983 1982 1981 1980 1984 1983 1982 1981 1980
Major ResearchUniversities:
N. C. State U 59.6 58.8 59.7 58.1 60.8 71.8 68.7 J8.3 65.9 68.2Vet. Med. - -
UNC Chap. Hill 58.8 58.8 61.4 59.6 59.8 62.6 56.8 59.1 68.6 58.7Health Af.
SUBTOTAL 59.2 58.8 60.5 58.8 60.3 68.4 63.8 58.6 67.1 64.2
Other DoctoralUniversities:
UNC Greensboro 54.7 55.2 51.1 51.3 55.3 47.6 41.5 40.7 40.5 50.4
ComprehensiveUniversities:
Appalachian SU 53.8 56.7 58.8 50.0 58.5 52.8 60.7 57.2 50.8 45.6E. Carolina U 58.5 59.7 56.8 55.1 64.6 63.2 65.1 68.1 71.9 66.5
Health Af. - - - -N. C. A & T SU 52.3 51.0 53.4 54.3 54.0 40.5 46.7 48.2 48.4 40.0
N. C. Central U 46.6 53.5 55.5 56.6 56.2 49.3 55.4 60.0 59.2 51.5UNC Charlotte 56.4 56.4 58.0 58.2 59.1 67.0 68.9 68.0 69.7 70.0W'n Carolina U 53.9 54.2 55.4 57.1 59.6 40.2 40.0 43.2 49.5 51.5
SUBTOTAL 54.5 56.0 56.8 54.8 59.4 54.5 58.1 58.9 59.7 54.5
Gen. BaccalaureateUniversities:
Elizabeth C. SU 42.5 42.1 38.4 44.1 44.7 44.4 44.3 47.0 64.7 55.8Fayettev'le SU 48.4 54.4 53.8 58.2 66.8 48.0 45.0 54.5 56.2 56.5Pembroke SU 49.6 48.0 49.4 43.9 50.4 56.5 46.4 45.0 47.0 44.5
UNC Asheville 63.0 53.1 39.1 40.8 44.6 72.3 52.3 42.1 56.8 54.9UNC Wilmington 56.1 55.7 55.0 53.8 55.7 56.7 60.1 60.6 58.4 61.7Winst.-Salem SU 46.7 45.5 43.4 46.2 42.7 47.8 61.9 59.4 62.1 62.9
SUBTOTAL 52.1 51.0 47.7 48.7 51.3 52.7 50.9 52.2 58.7 55.6
640
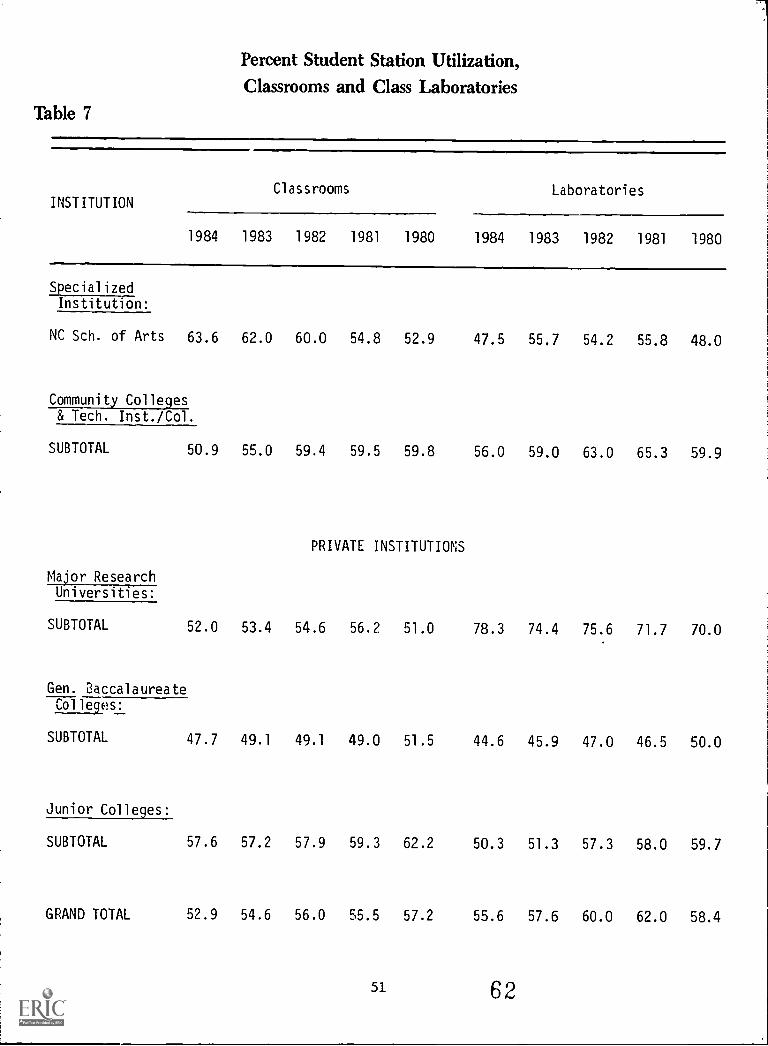
Percent Student Station Utilization,Classrooms and Class Laboratories
Table 7
INSTITUTIONClassrooms Laboratories
1984 1983 1982 1981 1980 1984 1983 1982 1981 1980
Special ized
Institution:
NC Sch. of Arts 63.6 62.0 60.0 54.8 52.9 47.5 55.7 54.2 55.8 48.0
Community Colleges& Tech. Inst./Col.
SUBTOTAL 50.9 55.0 59.4 59.5 59.8 56.0 59.0 63.0 65.3 59.9
PRIVATE INSTITUTIONS
Major ResearchUniversities:
SUBTOTAL 52.0 53.4 54.6 56.2 51.0 78.3 74.4 75.6 71.7 70.0
Gen. BaccalaureateColleges:
SUBTOTAL 47.7 49.1 49.1 49.0 51.5 44.6 45.9 47.0 46.5 50.0
Junior Colleges:
SUBTOTAL 57.6 57.2 57.9 59.3 62.2 50.3 51.3 57.3 58.0 59.7
GRAND TOTAL 52.9 54.6 56.0 55.5 57.2 55.6 57.6 60.0 62.0 58.4
51 62
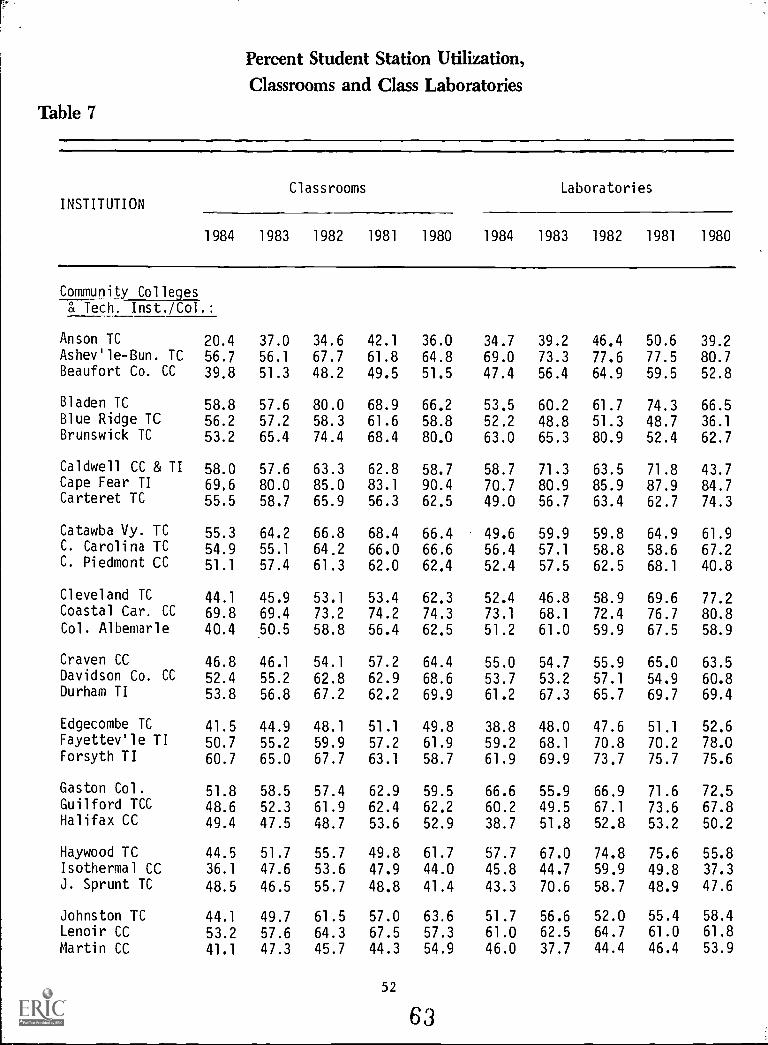
Percent Student Station Utilization,Classrooms and Class Laboratories
Table 7
INSTITUTIONClassrooms Laboratories
1984 1983 1982 1981 1980 1984 1983 1982 1981 1980
Community Collegesg( Tech. Inst./Col.:
Anson TC 20.4 37.0 34.6 42.1 36.0 34.7 39.2 46.4 50.6 39.2Ashev'le-Bun. TC 56.7 56.1 67.7 61.8 64.8 69.0 73.3 77.6 77.5 80.7Beaufort Co. CC 39.8 51.3 48.2 49.5 51.5 47.4 56.4 64.9 59.5 52.8
Bladen TC 58.8 57.6 80.0 68.9 66.2 53.5 60.2 61.7 74.3 66.5Blue Ridge TC 56.2 57.2 58.3 61.6 58.8 52.2 48.8 51.3 48.7 36.1Brunswick TC 53.2 65.4 74.4 68.4 80.0 63.0 65.3 80.9 52.4 62.7
Caldwell CC & TI 58.0 57.6 63.3 62.8 58.7 58.7 71.3 63.5 71.8 43.7Cape Fear TI 69,6 80.0 85.0 83.1 90.4 70.7 80.9 85.9 87.9 84.7Carteret TC 55.5 58.7 65.9 56.3 62.5 49.0 56.7 63.4 62.7 74.3
Catawba Vy. TC 55.3 64.2 66.8 68.4 66.4 49.6 59.9 59.8 64.9 61.9C. Carolina TC 54.9 55.1 64.2 66.0 66.6 56.4 57.1 58.8 58.6 67.2C. Piedmont CC 51.1 57.4 61.3 62.0 62.4 52.4 57.5 62.5 68.1 40.8
Cleveland TC 44.1 45.9 53.1 53.4 62.3 52.4 46.8 58.9 69.6 77.2Coastal Car. CC 69.8 69.4 73.2 74.2 74.3 73.1 68.1 72.4 76.7 80.8Col. Albemarle 40.4 ,50.5 58.8 56.4 62.5 51.2 61.0 59.9 67.5 58.9
Craven CC 46.8 46.1 54.1 57.2 64.4 55.0 54.7 55.9 65.0 63.5Davidson Co. CC 52.4 55.2 62.8 62.9 68.6 53.7 53.2 57.1 54.9 60.8Durham TI 53.8 56.8 67.2 62.2 69.9 61.2 67.3 65.7 69.7 69.4
Edgecombe TC 41.5 44.9 48.1 51.1 49.8 38.8 48.0 47.6 51.1 52.6FayettevIle TI 50.7 55.2 59.9 57.2 61.9 59.2 68.1 70.8 70.2 78.0Forsyth TI 60.7 65.0 67.7 63.1 58.7 61.9 69.9 73.7 75.7 75.6
Gaston Col. 51.8 58.5 57.4 62.9 59.5 66.6 55.9 66.9 71.6 72.5Guilford TCC 48.6 52.3 61.9 62.4 62.2 60.2 49.5 67.1 73.6 67.8Halifax CC 49.4 47.5 48.7 53.6 52.9 38.7 51.8 52.8 53.2 50.2
Haywood TC 44.5 51.7 55.7 49.8 61.7 57.7 67.0 74.8 75.6 55.8Isothermal CC 36.1 47.6 53.6 47.9 44.0 45.8 44.7 59.9 49.8 37.3J. Sprunt TC 48.5 46.5 55.7 48.8 41.4 43.3 70.6 58.7 48.9 47.6
Johnston TC 44.1 49.7 61.5 57.0 63.6 51.7 56.6 52.0 55.4 58.4Lenoir CC 53.2 57.6 64.3 67.5 57.3 61.0 62.5 64.7 61.0 61.8
Martin CC 41.1 47.3 45.7 44.3 54.9 46.0 37.7 44.4 46.4 53.9
52
63
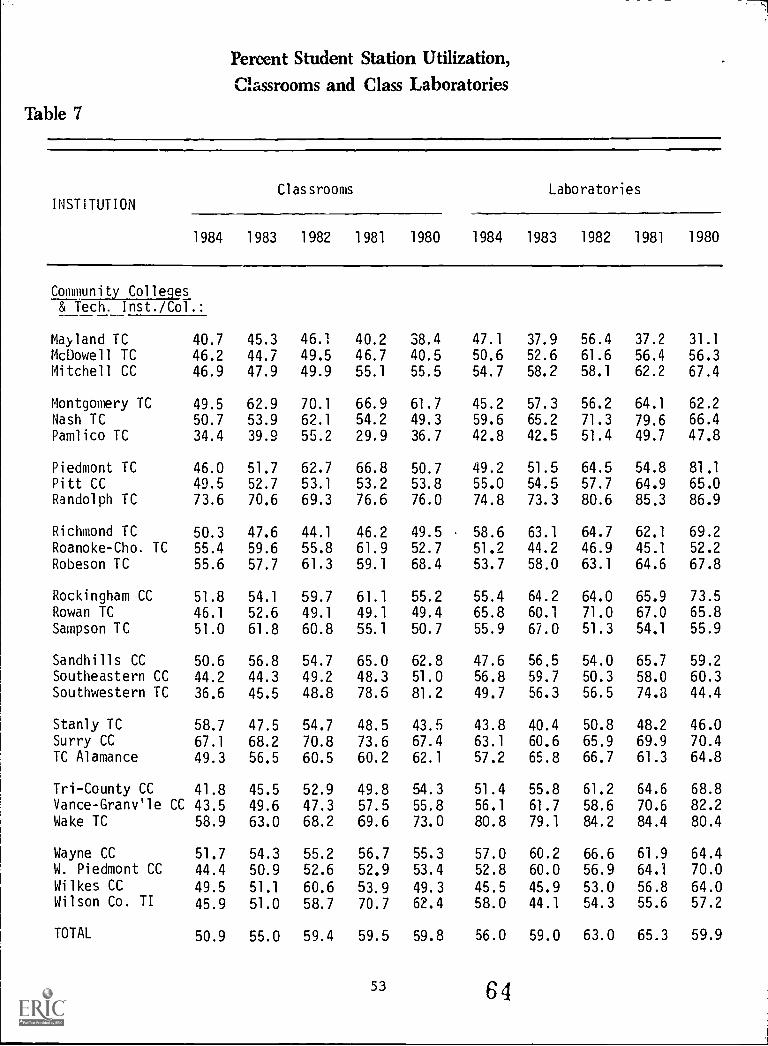
Percent Student Station Utilization,Classrooms and Class Laboratories
Table 7
INSTITUTIONClassrooms
1984 1983 1982 1981
Community Colleges& Tech. Inst./Col.:
Mayland TC 40.7 45.3 46.1 40.2McDowell TC 46.2 44.7 49.5 46.7Mitchell CC 46.9 47.9 49.9 55.1
Montgomery TC 49.5 62.9 70.1 66.9Nash TC 50.7 53.9 62.1 54.2Pamlico TC 34.4 39.9 55.2 29.9
Piedmont TC 46.0 51.7 62.7 66.8Pitt CC 49.5 52.7 53.1 53.2Randolph TC 73.6 70.6 69.3 76.6
Richmond TC 50.3 47.6 44.1 46.2Roanoke-Cho. TC 55.4 59.6 55.8 61.9Robeson TC 55.6 57.7 61.3 59.1
Rockingham CC 51.8 54.1 59.7 61.1Rowan TC 46.1 52.6 49.1 49.1Sampson TC 51.0 61.8 60.8 55.1
Sandhills CC 50.6 56.8 54.7 65.0Southeastern CC 44.2 44.3 49.2 48.3Southwestern TC 36.6 45.5 48.8 78.6
Stanly TC 58.7 47.5 54.7 48.5Surry CC 67.1 68.2 70.8 73.6TC Alamance 49.3 56.5 60.5 60.2
Tri-County CC 41.8 45.5 52.9 49.8Vance-Gram/le CC 43.5 49.6 47.3 57.5Wake TC 58.9 63.0 68.2 69.6
Wayne CC 51.7 54.3 55.2 56.7W. Piedmont CC 44.4 50.9 52.6 52.9Wilkes CC 49.5 51.1 60.6 53.9Wilson Co. TI 45.9 51.0 58.7 70.7
TOTAL 50.9 55.0 59.4 59.5
53
Laboratories
1980 1984 1983 1982 1981 1980
38.4 47.1 37.9 56.4 37.2 31.1
40.5 50.6 52.6 61.6 56.4 56.3
55.5 54.7 58.2 58.1 62.2 67.4
61.7 45.2 57.3 56.2 64.1 62.2
49.3 59.6 65.2 71.3 79.6 66.4
36.7 42.8 42.5 51.4 49.7 47.8
50.7 49.2 51.5 64.5 54.8 81.1
53.8 55.0 54.5 57.7 64.9 65.0
76.0 74.8 73.3 80.6 85.3 86.9
49.5 58.6 63.1 64.7 62.1 69.2
52.7 51.2 44.2 46.9 45.1 52.2
68.4 53.7 58.0 63.1 64.6 67.8
55.2 55.4 64.2 64.0 65.9 73.5
49.4 65.8 60.1 71.0 67.0 65.8
50.7 55.9 67.0 51.3 54.1 55.9
62.8 47.6 56.5 54.0 65.7 59.251.0 56.8 59.7 50.3 58.0 60.381.2 49.7 56.3 56.5 74.3 44.4
43.5 43.8 40.4 50.8 48.2 46.067.4 63.1 60.6 65.9 69.9 70.462.1 57.2 65.8 66.7 61.3 64.8
54.3 51.4 55.8 61.2 64.6 68.855.8 56.1 61.7 58.6 70.6 82.2
73.0 80.8 79.1 84.2 84.4 80.4
55.3 57.0 60.2 66.6 61.9 64.453.4 52.8 60.0 56.9 64.1 70.0
49.3 45.5 45.9 53.0 56.8 64.062.4 58.0 44.1 54.3 55.6 57.2
59.8 56.0 59.0 63.0 65.3 59.9
64
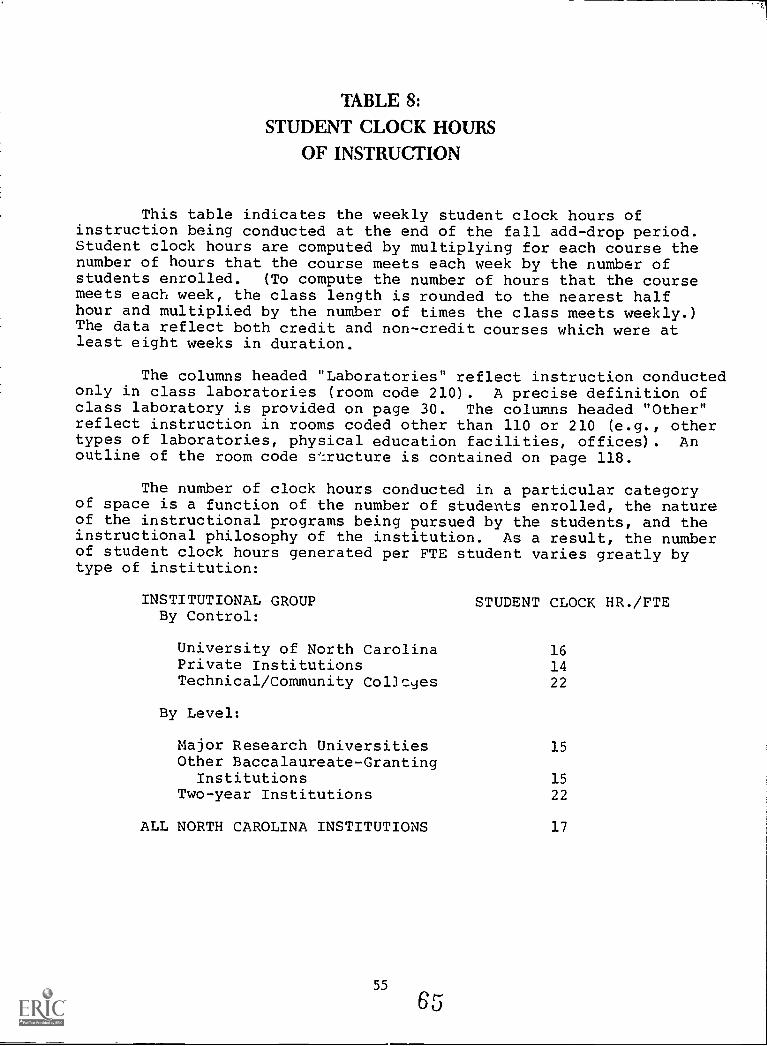
TABLE 8:
STUDENT CLOCK HOURSOF INSTRUCTION
This table indicates the weekly student clock hours ofinstruction being conducted at the end of the fall add-drop period.Student clock hours are computed by multiplying for each course thenumber of hours that the course meets each week by the number ofstudents enrolled. (To compute the number of hours that the coursemeets each week, the class length is rounded to the nearest halfhour and multiplied by the number of times the class meets weekly.)The data reflect both credit and non-credit courses which were atleast eight weeks in duration.
The columns headed "Laboratories" reflect instruction conductedonly in class laboratories (room code 210). A precise definition ofclass laboratory is provided on page 30. The columns headed "Other"reflect instruction in rooms coded other than 110 or 210 (e.g., othertypes of laboratories, physical education facilities, offices). Anoutline of the room code s':Iructure is contained on page 118.
The number of clock hours conducted in a particular categoryof space is a function of the number of students enrolled, the natureof the instructional programs being pursued by the students, and theinstructional philosophy of the institution. As a result, the numberof student clock hours generated per FTE student varies greatly bytype of institution:
INSTITUTIONAL GROUP STUDENT CLOCK HR./FTEBy Control:
University of North Carolina 16Private Institutions 14Technical/Community Col3cyes 22
By Level:
Major Research Universities 15Other Baccalaureate-Granting
Institutions 15Two-year Institutions 22
ALL NORTH CAROLINA INSTITUTIONS 17
55
65
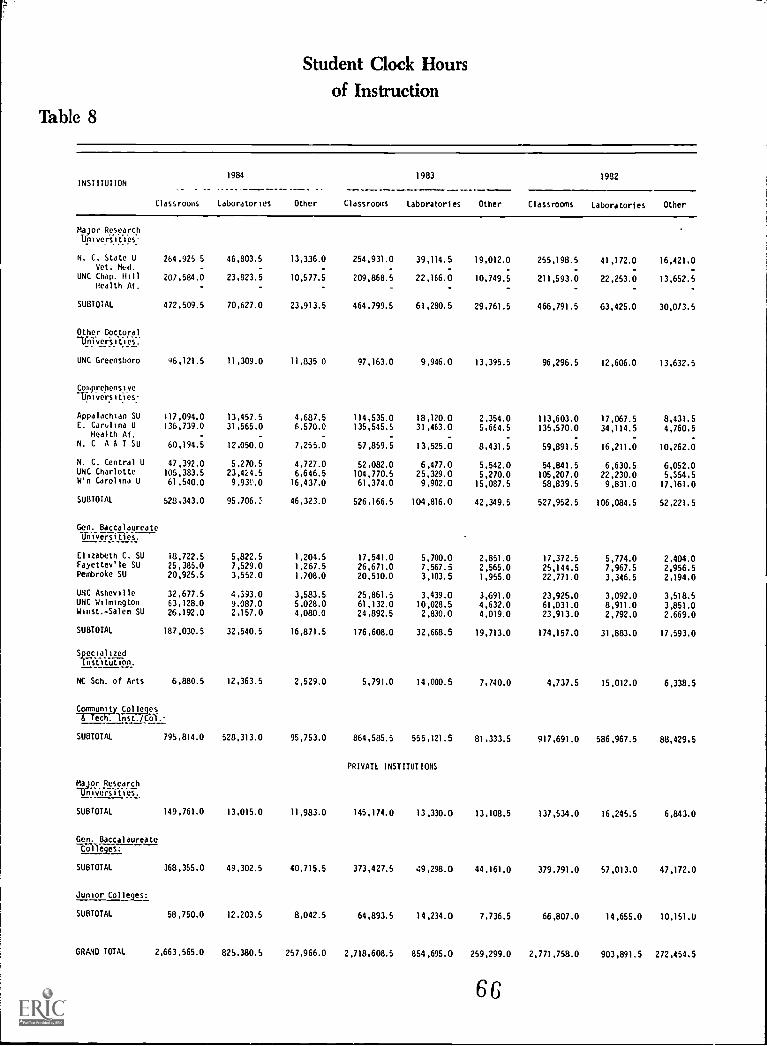
Student Clock Hoursof Instruction
Table 8
INSTITUTION1984 1983 1982
Classroons Laboratories Other Classrooms Laboratories Other Classrooms Laboratories Other
Major Research
bInveTs!k1Ps:
N. C. State U 264.925 5 46,803.5 13.336.0 254,931.0 39,114.5 19,012.0 255,198.5 41,172.0 16,421.0Vet. Med. - - - - - -
UNC Chap. Hill 207.584.0 23.823.5 10,577.5 209,868.5 22,166.0 10,749.5 211,593.0 22,253.0 13,652.5Health Af. - - - - - -
SUBTOTAL 472.509.5 70.627.0 23.913.5 464.799.5 61,280.5 29.761.5 466.791.5 63,425.0 30,0/3.5
Other GocLoral1111)*verS2 yes.
UNC Greensboro q6.121.5 11.309.0 11.835 0 97,163.0 9.946.0 13,395.5 96,296.5 12,606.0 13.632.5
Comprehensive-Universitys:
Appalachian SU 117,094.0 13.457.5 4.687.5 114,535.0 18.120.0 2.354.0 113,603.0 17,067.5 8,431.5E. Carolina U 136,739.0 31.565.0 6.570.0 135,545.5 31,463.0 5.664.5 135.570.0 34,114.5 4,760.5
Health Af. - - - - - -N. C A E I SU 60.194.5 12.050.0 7.255.0 57,859.5 13,525.0 8.431.5 59,891.5 16,211.0 10.262.0
N. C. Central U 47.392.0 5.270.5 4,727.0 52.082.0 6,477.0 5,542.0 54.841.5 6.630.5 6,052.0UNC Charlotte 105.383.5 23,424.5 6.646.5 104,770.5 25,329.0 5,270.0 105.207.0 22,230.0 5,554.5W'n Carolina U 61,540.0 9,935%0 16.437.0 61,374.0 9,902.0 15,087.5 58.839.5 9,831.0 17,161.0
SUBTOTAL 528.343.0 95.706.: 46.323.0 526.166.5 104,816.0 42,349.5 527.952.5 106,084.5 52.221.5
Gen. BaccalaureateWes7
Elizabeth C. SU 18.722.5 5,822.5 1.204.5 17.541.0 5,700.0 2,851.0 17.372.5 5,774.0 2.404.0Fayettev'le SU 25.385.0 7,529.0 1.267.5 26,671.0 7,567.5 2,565.0 25,144.5 7,967.5 2,956.5Pembroke SU 20,925.5 3.552.0 1.708.0 20,510.0 3,103.5 1,955.0 22.771.0 3,346.5 2.194.0
UNC Asheville 32.677.5 4.393.0 3,583.5 25.861.5 3,439.0 3,691.0 23,925.0 3,092.0 3,518.5UNC Wilmington 63.128.0 9.087.0 5.028.0 61,132.0 10,028.5 4,632.0 61.031.0 8,911.0 3,851.0Wiest. -Salem SU 26.192.0 2.157.0 4.080.0 24.892.5 2,830.0 4,019.0 23.913.0 2,792.0 2.669.0
SUBTOTAL 187.030.5 32.540.5 16.871.5 176.608.0 32,668.5 19,713.0 174.157.0 31,883.0 17.593.0
SpecializedInstlearon,
NC Sch. of Arts 6.880.5 12.363.5 2.529.0 5,791.0 14.000.5 7.740.0 4,737.5 15.012.0 6,338.5
C°1TnunitY C911UP
SUBTOTAL 795.814.0 528.313.0 95.753.0 864,585.5 555.121.5 81.333.5 917.691.0 586,967.5 88,429.5
PRIVATE INSTITUTIONS
Major Research-Universities
SUBTOTAL 149,761.0 13.015.0 11,983.0 145.174.0 13,330.0 13,108.5 137,534.0 16,245.5 6.843.0
Gen. BaccalaureateColleges:
SUBTOTAL 368,355.0 49,302.5 40.715.5 373,427.5 49,298.0 44.161.0 379.791.0 57.013.0 47,172.0
Junior Colleges:
SUBTOTAL 58.750.0 12.203.5 8,042.5 64,893.5 14,234.0 7.736.5 66,807.0 14,655.0 10.151.0
GRAND TOTAL 2,663.565.0 825.380.5 257.966.0 2,718.608.5 854,695.0 259,299.0 2,771,758.0 903,891.5 272.454.5
66
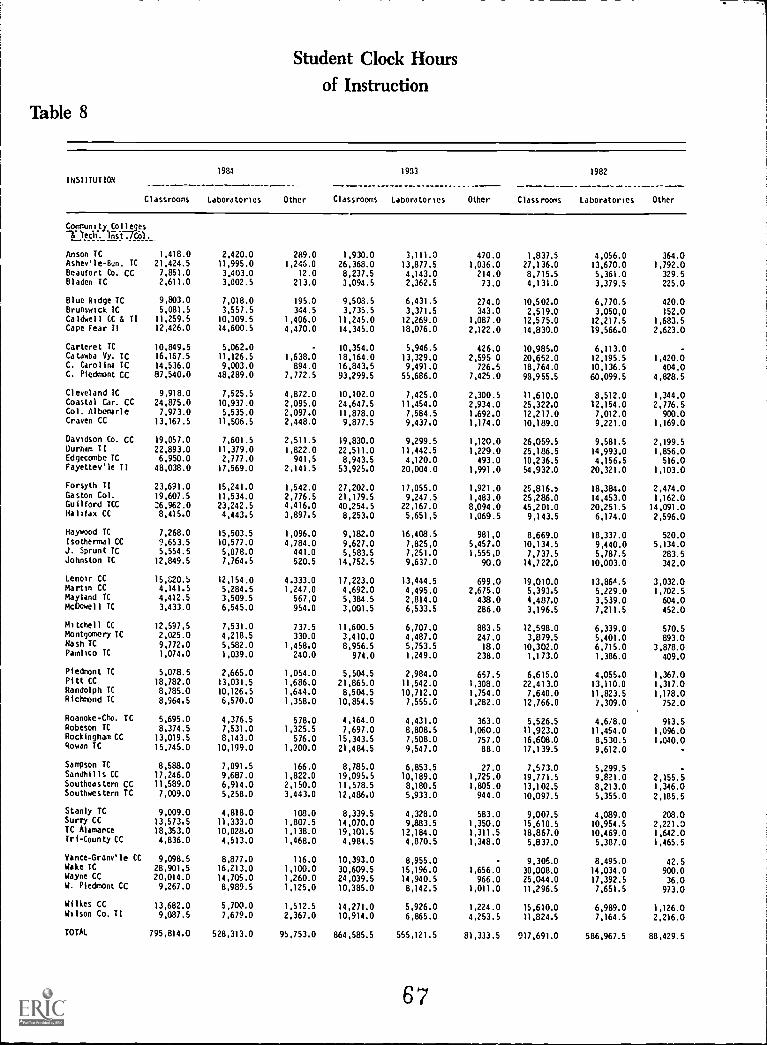
Student Clock Hoursof Instruction
Table 8
INSTITUTION
1984 1933 1982
Classrooms Laboratories Other Classrooms Laboratories Other Classrooms Laboratories Other
Community Colleges.
Anson TC 1,418.0 2,420.0 289.0 1,930.0 3,111.0 470.0 1,837.5 4,056.0 364.0Ashev'le-Bun. TC 21,424.5 11,995.0 1,246.0 26,368.0 13,877.5 1,036.0 27,136.0 13,670.0 1,792.0Beaufort Co. CC 7,851.0 3,403.0 12.0 8,237.5 4,143.0 214.0 8,715.5 5,361.0 329.5Bladen TC 2,611.0 3,002.5 213.0 3,094.5 2,362.5 73.0 4,131.0 3,379.5 225.0
Blue Ridge TC 9,803.0 7,018.0 195.0 9,508.5 6,431.5 274.0 10,502.0 6,770.5 420.0Brunswick TC 5,081.5 3,557.5 344.5 3,735.5 3,371.5 343.0 2,519.0 3,050,0 152.0Caldwell CC & II 11,259.5 10,309.5 1,406.0 11,245.0 12,269.0 1,087.0 12,575.0 12,217.5 1,683.5Cape Fear TI 12,426.0 14,600.5 4,470.0 14,345.0 18,076.0 2,122.0 14,830.0 19,566.0 2,623.0
Carteret TC 10,849.5 5,062.0 - 10,354.0 5,946.5 426.0 10,985.0 6,113.0 -
Catawba Vy. TC 16,167.5 11,126.5 1,638.0 18,164.0 13,329.0 2,595 0 20,652.0 12,195.5 1,420.0C. Carolina TC 14,536.0 9,003.0 894.0 16,843.5 9,491.0 726.5 18,764.0 10,136.5 404.0C. Piedmont CC 87,540.0 48,289.0 7,772.5 93,299.5 55,686.0 7,425.0 98,955.5 60,099.5 4,828.5
Cleveland TC 9,918.0 7,525.5 4,872.0 10,102.0 7,425.0 2,300.5 11,610.0 8,512.0 1,344.0Coastal Car. CC 24,875.0 10,937.0 2,095.0 24,647.5 11,454.0 2,934.0 25,322.0 12,154.0 2,776.5Col. Albemarle 7,973.0 5,535.0 2,097.0 11,878.0 7,584.5 1.692.0 12,217.0 7,012.0 900.0Craven CC 13,167.5 11,506.5 2,448.0 9,877.5 9,437.0 1,174.0 10,189.0 9,221.0 1,169.0
Davidson Co. CC 19,057.0 7,601.5 2,511.5 19,830.0 9,299.5 1,120.0 26,059.5 9,581.5 2,199.5Durham II 22,893.0 11,379.0 1,822.0 22,511.0 11,442.5 1,229.0 25,186.5 14,993.0 1,856.0Edgecombe TC 6,950.0 2,777.0 941,5 8,943.5 4,120.0 493.0 10,236.5 4,156.5 516.0Fayettev'le II 48,038.0 17,569.0 2,141.5 53,925.0 20,004.0 1,991.0 54,932.0 20,321.0 1,103.0
Forsyth TI 23,691.0 15,241.0 1,542.0 27,202.0 17,055.0 1,921.0 25,816.5 18,384.0 2,474.0Gaston Col. 19,607.5 11,534.0 2,776.5 21,179.5 9,247.5 1,483.0 25,286.0 14,453.0 1,162.0Guilford TCC 26,962.0 23,242.5 4,416.0 40,254.5 22,167.0 8,094.0 45,201.0 20,251.5 14,091.0Halifax CC 8,415.0 4,443.5 3,897.5 8,253.0 5,651,5 1,069.5 9,143.5 6,174.0 2,596.0
Haywood TC 7,268.0 15,503.5 1,096.0 9,182.0 16,408.5 981,0 8,669.0 18,337.0 520.0Isothermal CC '1,653.5 10,577.0 4,784.0 9,627.0 7,825,0 5,457.0 10,134.5 9,440.0 5,134.0J. Sprunt IC 5,554.5 5,078.0 441.0 5,583.5 7,251.0 1,555,0 7,737.5 5,787.5 283.5Johnston TC 12,849.5 7,764.5 520.5 14,752.5 9,637.0 90.0 14,722.0 10,003.0 342.0
Lenoir CC 15,620.5 12,154.0 4.333.0 17,223.0 13,444.5 699.0 19,010.0 13,864.5 3,032.0Martin CC 4,141.5 5,284.5 1,247.0 4,692.0 4,495.0 2,675.0 5,393.5 5,229.0 1,702.5Mayland TC 4,412.5 3,509.5 567,0 5,384.5 2,814.0 438.0 4,487.0 3,539.0 604.0McDowell TC 3,433.0 6,545.0 954.0 3,001.5 6,533.5 286.0 3,196.5 7,211.5 452.0
Mitchell CC 12,597,5 7,531.0 737.5 11,600.5 6,707.0 883.5 12,598.0 6,339.0 570.5Montgomery TC 2,025.0 4,218.5 330.0 3,410.0 4,487.0 247.0 3,879.5 5,401.0 893.0Nash IC 9,772.0 5,582.0 1,458.0 8,956.5 5,753.5 18.0 10,302.0 6,715.0 3,878.0Pamlico TC 1,074.0 1,039.0 240.0 974.0 1,249.0 238.0 1,173.0 1,386.0 409.0
Piedmont TC 5,078.5 2,665.0 1,054.0 5,504.5 2,984.0 657.5 6,615.0 4,055.0 1,367.0Pitt CC 18,782.0 13,031.5 1,686.0 21,865.0 11,542.0 1,308.0 22,413.0 13,110.0 1,317.0Randolph TC 8,785.0 10,126.5 1,644.0 8,504.5 10,712.0 1,754.0 7,640.0 11,823.5 1,178.0Richmond TC 8,964.5 6,570.0 1,358.0 10,854.5 7,555.0 1,282.0 12,766.0 7,309.0 752.0
Roanoke-Cho. IC 5,695.0 4,376.5 578.0 4,164.0 4,431.0 363.0 5,526.5 4,6,8.0 913.5Robeson IC 8,374.5 7,531.0 1,325.5 7,697.0 8,808.5 1,060.0 11,923.0 11,454.0 1,096.0Rockingham CC 13,019.5 8,143.0 576.0 15,343.5 7,508.0 757.0 16,608.0 8,530.5 1.040.0Rowan TC 15,745.0 10,199.0 1,200.0 21,484.5 9,547.0 88.0 17,139.5 9,612.0
Sampson TC 8,588.0 7,091.5 166.0 8,785.0 6,853.5 27.0 7,573.0 5,299.5 -Sandhills CC 17,246.0 9,687.0 1,822.0 19,095.5 10,189.0 1,725.0 19,771.5 9,821.0 2,155.5Southeastern CC 11,589.0 6,914.0 2,150.0 11,578.5 8,180.5 1,805.0 13,102.5 8,213.0 1,346.0Southwestern IC 7,009.0 5,258.0 3,443.0 12,486.0 5,933.0 944.0 10,097.5 5,355.0 2,185.5
Stanly IC 9,009.0 4,818.0 108.0 8,339.5 4,328.0 583.0 9,007.5 4,089.0 208.0Surry CC 13,573.5 11,333.0 1,807.5 14,070,0 9,883.5 1,350.0 15,610.5 10,954.5 2,221.0IC Alamance 18,353.0 10,028.0 1,138.0 19,101.5 12,184.0 1,311.5 18,867.0 10,469.0 1,642.0Tri-County CC 4,836.0 4,513.0 1,468.0 4,984.5 4,870.5 1,348.0 5,837.0 5,387.0 1,465.5
Vance-Granv'le CC 9,098.5 8,877.0 116.0 10,393.0 8,955.0 9,306.0 8,495.0 42.5Wake IC 28,901.5 16,213.0 1,100.0 30,609.5 15,196.0 1,656.0 30,008.0 14,034.0 900.0Wayne CC 20,014.0 14,705.0 1,260.0 24,039.5 14,940.5 966.0 25,044.0 17,392.5 36.0W. Piedmont CC 9,267.0 8,989.5 1,125,0 10,385.0 8,142.5 1,011.0 11,296.5 7,651.5 973.0
Wilkes CC 13,682.0 5,700.0 1,512.5 14,271.0 5,926.0 1,224.0 15,610.0 6,989.0 1,126.0Wilson Co. II 9,087.5 7,679.0 2,367.0 10,914.0 6,865.0 4,253.5 11,824.5 7,164.5 2,216.0
TOTAL 795,814.0 528,313.0 95,753.0 864,585.5 555,121.5 81,333.5 917,691.0 586,967.5 88,429.5
67
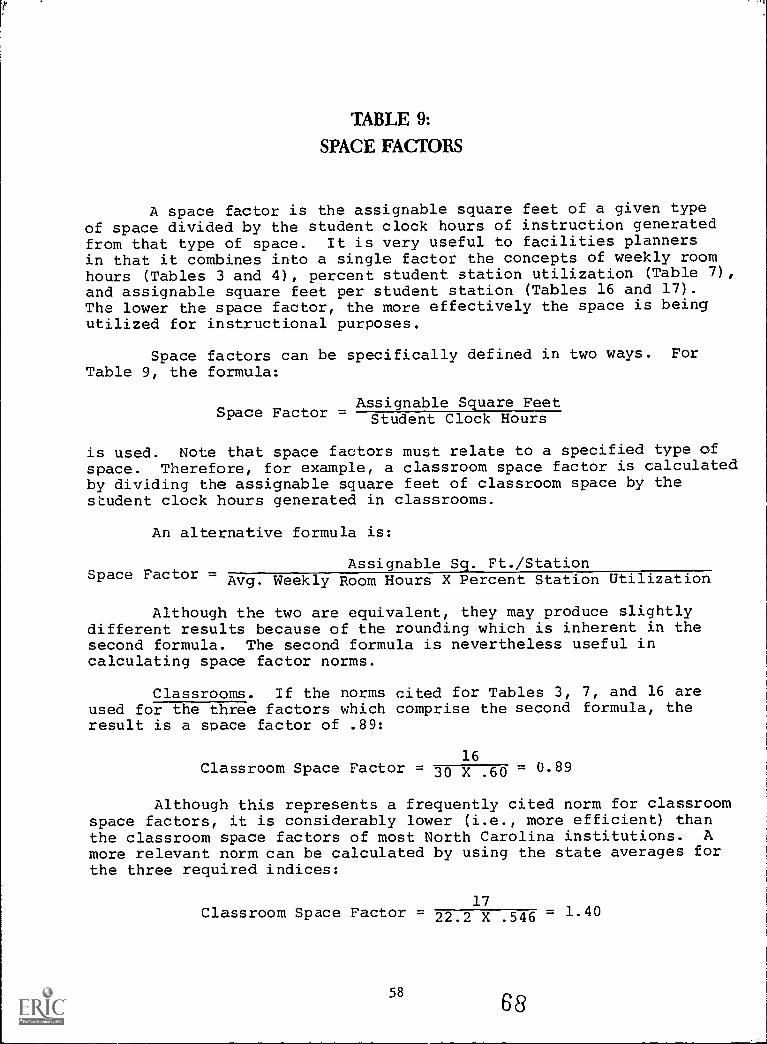
TABLE 9:
SPACE FACTORS
A space factor is the assignable square feet of a given typeof space divided by the student clock hours of instruction generatedfrom that type of space. It is very useful to facilities plannersin that it combines into a single factor the concepts of weekly roomhours (Tables 3 and 4), percent student station utilization (Table 7),
and assignable square feet per student station (Tables 16 and 17).The lower the space factor, the more effectively the space is beingutilized for instructional purposes.
Space factors can be specifically defined in two ways. ForTable 9, the formula:
Assignable Square FeetSpace Factor = Student Clock Hours
is used. Note that space factors must relate to a specified type ofspace. Therefore, for example, a classroom space factor is calculatedby dividing the assignable square feet of classroom space by thestudent clock hours generated in classrooms.
An alternative formula is:
Assignable Sq. Ft./StationSpace Factor = Avg. Weekly Room Hours X Percent Station Utilization
Although the two are equivalent, they may produce slightlydifferent results because of the rounding which is inherent in thesecond formula. The second formula is nevertheless useful incalculating space factor norms.
Classrooms. If the norms cited for Tables 3, 7, and 16 areused for the three factors which comprise the second formula, theresult is a space factor of .89:
16Classroom Space Factor = 30 X .60 = 0.89
Although this represents a frequently cited norm for classroomspace factors, it is considerably lower (i.e., more efficient) thanthe classroom space factors of most North Carolina institutions. Amore relevant norm can be calculated by using the state averages forthe three required indices:
Classroom Space Factor = 22.217X .546 1.40
58 68
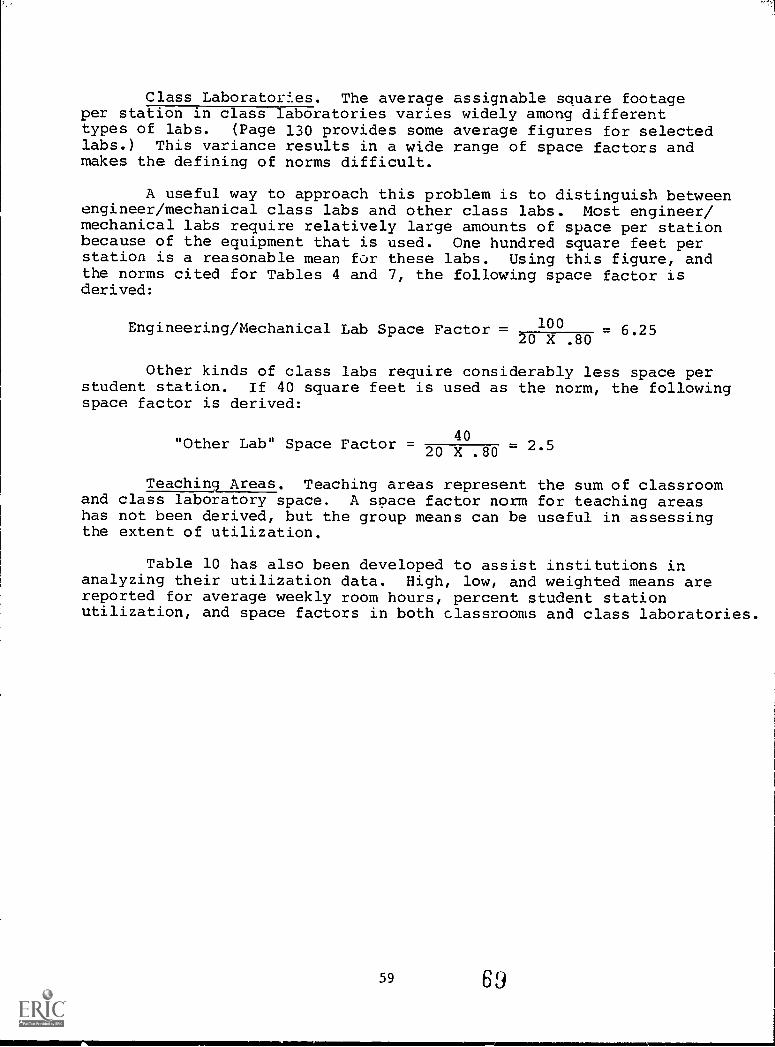
Class Laboratories. The average assignable square footageper station in class laboratories varies widely among differenttypes of labs. (Page 130 provides some average figures for selectedlabs.) This variance results in a wide range of space factors andmakes the defining of norms difficult.
A useful way to approach this problem is to distinguish betweenengineer/mechanical class labs and other class labs. Most engineer/mechanical labs require relatively large amounts of space per stationbecause of the equipment that is used. One hundred square feet perstation is a reasonable mean for these labs. Using this figure, andthe norms cited for Tables 4 and 7, the following space factor isderived:
0Engineering/Mechanical Lab Space Factor =20
1
X0.80
6.25
Other kinds of class labs require considerably less space perstudent station. If 40 square feet is used as the norm, the followingspace factor is derived:
04"Other Lab" Space Factor =20 X .80 2.5
Teaching Areas. Teaching areas represent the sum of classroomand class laboratory space. A space factor norm for teaching areashas not been derived, but the group means can be useful in assessingthe extent of utilization.
Table 10 has also been developed to assist institutions inanalyzing their utilization data. High, low, and weighted means arereported for average weekly room hours, percent student stationutilization, and space factors in both classrooms and class laboratories.
59 69
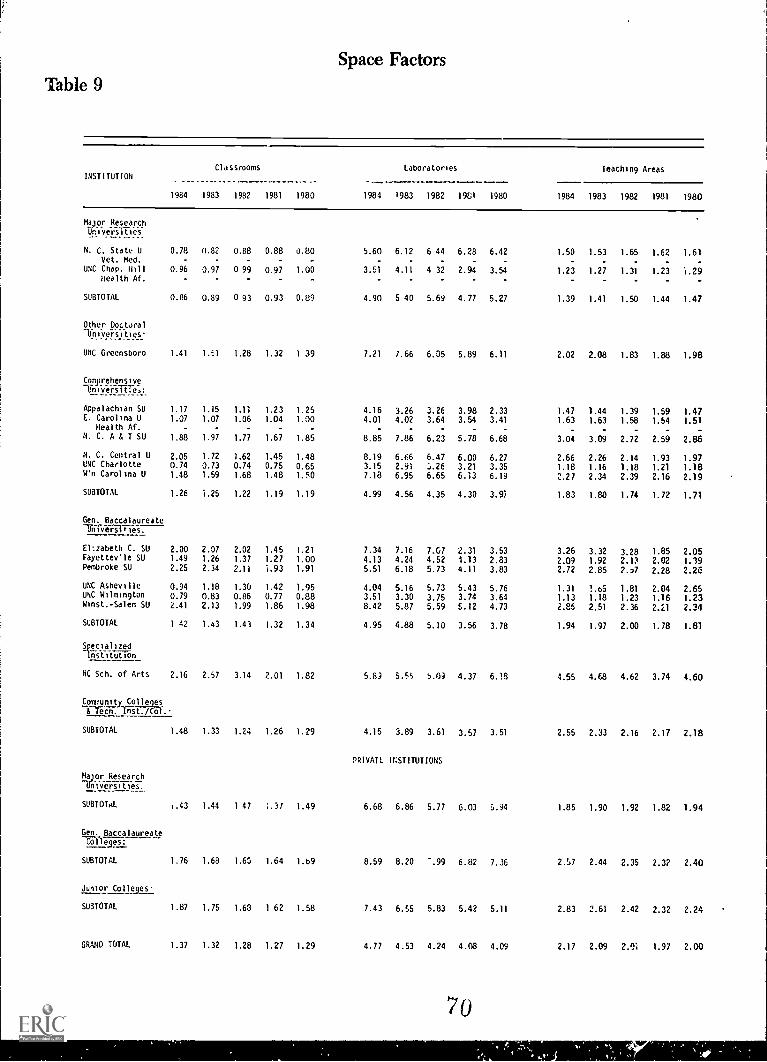
Table 9Space Factors
INSTITUTIONClassrooms Laboratories Teaching Areas
1984 1983 1982 1981 1980 1984 1983 1982 1981 1980 1984 1983 1982 1981 1980
Major ResearchUpiversitieS,
N. C. State U 0.78 0.82 0.88 0.88 0.80 5.60 6.12 6 44 6.28 6.42 1.50 1.53 1.65 1.62 1.61Vet. Med. - - - - - - - - -
UNC Chap. Hill 0.96 0.97 0 99 0.97 1.00 3.51 4.11 4 32 2.94 3.54 1.23 1.27 1.31 1.23 1.29Health Af. - - - - - - - - - - -
SUBTOTAL 0.86 0.89 0 93 0.93 0.89 4.90 5 40 5.69 4.77 5.27 1.39 1.41 1.50 1.44 1.47
Other poctora-Universities'
UNC Greensboro 1.41 1.51 1.28 i.32 1 39 7.21 7.66 6.05 5.89 6.11 2.02 2.08 1.83 1.88 1.98
Comprehensive-Uhi-yersille,:
Appalachian SU 1.17 1.15 1.11 1.23 1.25 4.16 3.26 3.26 3.98 2.33 1.47 1.44 1.39 1.59 1.47E. Carolina U 1.07 1.07 1.06 1.04 1.00 4.01 4.02 3.64 3.54 3.41 1.63 1.63 1.58 1.54 1.51
Health Af. - - - - - - - - -N. C. A & T SU 1.88 1.97 1.77 1.67 1.85 8.85 7.86 6.23 5.78 6.68 3.04 3.09 2.72 2.59 2.86
N. C. Central U 2.05 1.72 1.62 1.45 1.48 8.19 6.66 6.47 6.00 6.27 2.66 2.26 2.14 1.93 1.97UNC Charlotte 0.74 0.73 0.74 0.75 0.65 3.15 2.91 5.26 3.21 3.35 1.18 1.16 1.18 1.21 1.18W'n Carolina U 1.48 1.59 1.68 1.48 1.50 7.18 6.95 6.65 6.13 6.19 2.27 2.34 2.39 2.16 2.19
SUBTOTAL 1.26 1.25 1.22 1.19 1.19 4.99 4.56 4.35 4.30 3.91 1.83 1.80 1.74 1.72 1.79
Gen. BaccalaureatelinTigrTilTe7s.
Elizabeth C. SU 2.00 2.07 2.02 1.45 1.21 7.34 7.16 7.07 2.31 3.53 3.26 3.32 3.28 1.85 2.05Fayettev'le SU 1.49 1.26 1.37 1.27 1.00 4.13 4.24 4.52 1.13 2.83 2.09 1.92 2.1? 2.02 1.39Pembroke SU 2.25 2.34 2.11 1.93 1.91 5.51 6.18 5.73 4.11 3.83 2.72 2.85 2.37 2.28 2.26
UNC Asheville 0.94 1.18 1.30 1.42 1.95 4.04 5.16 5.73 5.43 5.76 1.31 1.05 1.81 2.04 2.65UNC Wilmington 0.79 0.83 0.86 0.77 0.88 3.51 3.30 3.75 3.74 3.64 1.13 1.18 1.23 1.16 1.23Winst.-Salem SU 2.41 2.13 1.99 1.86 1.98 8.42 5.87 5.59 5.12 4.73 2.86 2.51 2.36 2.21 2.34
SUBTOTAL 1 42 1.43 1.43 1.32 1.34 4.95 4.88 5.10 3.56 3.78 1.94 1.97 2.00 1.78 1.81
ISpecializednstitution
NC Sch. of Arts 2.16 2.57 3.14 2.01 1.82 5.89 5.55 5.09 4.37 6.18 4.55 4,68 4.62 3.74 4.60
Community Colleges
& Tech. liist../C61..
SUBTOTAL 1.48 1.33 1.24 1.26 1.29 4.15 3.89 3.61 3.57 3.51 2.55 2.33 2.16 2.17 2.18
PRIVATL 1KSTITUTIONS
UMajor Researchniver'sitie's.
SUBTOTAL 1.43 1.44 1 47 1.31 1.49 6.68 6.86 5.77 6.03 5.94 1.85 1.90 1.92 1.82 1.94
Gen. BaccalaureateColle2es:
SUBTOTAL 1.76 1.68 1.65 1.64 1.b9 8.59 8.20 ..99 6.82 7.36 2.S7 2.44 2.35 2.32 2.40
Junior Colleges.
SUBTOTAL 1.87 1.75 1.68 1 62 1.58 7.43 6.55 5.83 5.42 5.11 2.83 2.61 2.42 2.32 2.24
GRAND TOTAL 1.37 1.32 1.28 1.27 1,29 4.77 4.53 4.24 4.08 4.09 2.17 2.09 2.01 1.97 2.00
70
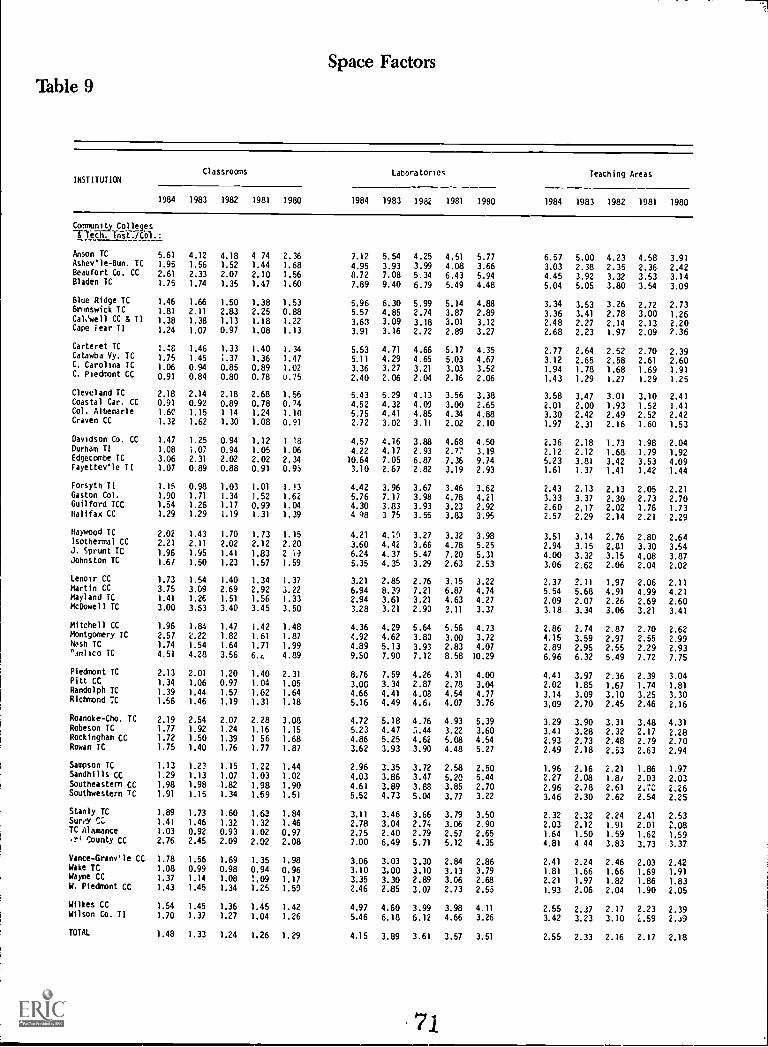
Space FactorsTable 9
INSTITUTIONClassrooms Laboratories Teaching Areas
1984 1983 1982 1981 1980 1984 1983 1982 1981 1980 1984 1983 1982 1981 1980
Community Colleges
-1-reaT. lost. /Col.:
Anson TC 5.61 4.12 4.18 4 74 2.36 7.12 5.54 4.25 4.51 5.77 6.57 5.00 4.23 4.58 3.91Ashev'le-Bun. TC 1.95 1.56 1.52 1.44 1.68 4.95 3.93 3.99 4.08 3.66 3.03 2.38 2.35 2.36 2.42Beaufort Co. CC 2.61 2.33 2.07 2.10 1.56 8.72 7.08 5.34 6.43 5.94 4.45 3.92 3.32 3.53 3.14Bladen TC 1.75 1.74 1.35 1.47 1.60 7.89 9.40 6.79 5.49 4.48 5.04 5.05 3.80 3.54 3.09
Blue Ridge TC 1.46 1.66 1.50 1.38 1.53 5.96 6.30 5.99 5.14 4.88 3.34 3.53 3.26 2.72 2.73Brunswick TC 1.81 2.11 2.83 2.25 0.88 5.57 4.85 2.74 3.87 2.89 3.36 3.41 2.78 3.00 1.26CalNell CC A TI 1.38 1.38 1.13 1.18 1.22 3.63 3.09 3.18 3.01 3.12 2.48 2.27 2.14 2.13 2.20Cape Fear TI 1.24 1.07 0.97 1.08 1.13 3.91 3.16 2.72 2.89 3.27 2.68 2.23 1.97 2.09 2.36
Carteret TC 1.48 1.46 1.33 1.40 1.34 5.53 4.71 4.66 5.17 4.35 2.77 2.64 2.52 2.70 2.39Catawba Vy. TC 1.75 1.45 1.37 1.36 1.47 5.11 4.29 4.65 5.03 4.67 3.12 2.65 2.58 2.61 2.60C. Carolina TC 1.06 0.94 0.85 0.89 1.02 3.36 3.27 3.21 3.03 3.52 1.94 1.78 1.68 1.69 1.91C. Piedmont CC 0.91 0.84 0.80 0.78 0.75 2.40 2.06 2.04 2.16 2.06 1.43 1.29 1.27 1.29 1.25
Cleveland TC 2.18 2.14 2.18 2.68 1.56 5.43 5.29 4.13 3.56 3.38 3.58 3.47 3.01 3.10 2.41Coastal Car. CC 0.91 0.92 0.89 0.78 0.74 4.52 4.32 4.09 3.00 2.65 2.01 2.00 1.93 1.52 1.41Col. Albemarle 1.60 1.15 1 14 1.24 1.10 5.75 4.41 4.85 4.34 4.88 3.30 2.42 2.49 2.52 2.42Craven CC 1.32 1.62 1.30 1.08 0.91 2.72 3.02 3.11 2.02 2.10 2.16 1.60 1.53
Davidson Co. CC 1.47 1.25 0.94 1.12 1 18 4.57 4.16 3.88 4.68 4.50 2.36 2.18 1.73 1.98 2.04Durham TI 1.08 1.07 0.94 1.05 1.06 4.22 4.17 2.93 2.7 3.19 2.12 2.12 1.68 1.79 1.92Edgecombe TC 3.06 2.31 2.02 2.02 2.34 10.64 1.05 6.87 7.36 9.74 5.23 3.81 3.42 3.53 4.09Fayettev'le TI 1.07 0.89 0.88 0.91 0.95 3.10 2.67 2.82 3.19 2.93 1.61 1.37 1.41 1.42 1.44
Forsyth TI 1.15 0.98 1.03 1.01 1.13 4.42 3.96 3.67 3.46 3.62 2.43 2.13 2.13 2.05 2.21Gaston Col. 1.90 1.71 1.34 1.52 1.62 5.76 7.17 3.98 4.78 4.21 3.33 3.37 2.30 2.73 2.70Guilford TCC 1.54 1.26 1.17 0.99 1.04 4.30 3.83 3.93 3.23 2.92 2.60 2.17 2.02 1.76 1.73Halifax CC 1.29 1.29 1.19 1.31 1.39 4 98 3 75 3.55 3.83 3.95 2.57 2.29 2.14 2.21 2.29
Haywood TC 2.02 1.43 1.70 1.73 1.15 4.21 4.'1'9 3.27 3.32 3.98 3.51 3.14 2.76 2.80 2.64Isothermal CC 2.21 2.11 2.02 2.12 2.20 3.60 4.42 3.66 4.78 5.25 2.94 3.15 2.81 3.30 3.54J. Sprunt IC 1.96 1.95 1.41 1.83 2 19 6.24 4.37 5.47 7.20 5.31 4.00 3.32 3.15 4.08 3.87Johnston TC 1.6/ 1.50 1.23 1.57 1.59 5.35 4,35 3.29 2.63 2.53 3.06 2.62 2.06 2.04 2.02
Lenoir CC 1.73 1.54 1.40 1.34 1.37 3.21 2.85 2.76 3.15 3.22 2.37 2.11 1.97 2.06 2.11Martin CC 3.75 3.09 2.69 2.92 3.22 6.94 8.39 7.21 6.87 4.74 5.54 5.68 4.91 4.99 4.21Mayland TC 1.41 1.26 1.51 1.56 1.33 2.94 3.61 3.21 4.63 4.27 2.09 2.07 2.26 2.69 2.60McDowell TC 3.00 3.53 3.40 3.45 3.50 3.28 3.21 2.90 3.11 3.37 3.18 3.34 3.06 3.21 3.41
Mitchell CC 1.96 1.84 1.47 1.42 1.48 4.36 4.29 5.64 5.56 4.73 2.86 2.74 2.87 2.70 2.62Montgomery TC 2.51 k.22 1.82 1.61 1.87 4.92 4.62 3.80 3.00 3.72 4.15 3.59 2.97 2.55 2.99Nash TC 1.74 1.54 1.64 1.71 1.99 4.89 5.13 3.93 2.83 4.07 2.89 2.95 2.55 2.29 2.93nsmlico IC 4.51 4.28 3.56 6.6 4.89 9.S0 7.90 7.12 8.58 10.29 6.96 6.32 5.49 7.72 7.75
Piedmont TC 2.13 2.01 1.20 1.40 2.31 8.76 7.59 4.26 4.31 4.00 4.41 3.97 2.36 2.39 3.04Pitt CC 1.34 1.06 0.97 1.04 1.05 3.00 3.34 2.87 2.78 3.04 2.02 1.85 1.67 1.74 1.81Randolph TC 1.39 1.44 1.57 1.62 1.64 4.66 4.41 4.08 4.54 4.77 3.14 3.09 3.10 3.25 3.30Richmond TC 1.56 1.46 1.19 1.31 1.18 5.16 4.49 4.6. 4.07 3.76 3.09 2.70 2.45 2.46 2.16
Roanoke-Cho. TC 2.19 2.54 2.07 2.28 3.08 4.72 5.18 4.76 4.93 5.39 3.29 3.90 3.31 3.48 4.31Robeson TC 1.77 1.92 1.24 1.16 1.15 5.23 4.47 '5.44 3.22 3.60 3.41 3.28 2.32 2.17 2.28Rockingham CC 1.72 1.50 1.39 1 56 1.68 4.86 5.25 4.62 5.08 4.54 2.93 2.73 2.48 2.79 2.70Rowan TC 1.75 1.40 1.76 1.77 1.87 3.62 3.93 3.90 4.48 5.27 2.49 2.18 2.53 2.63 2.94
Sampson TC 1.13 1.23 1.15 1.22 1.44 2.96 3.35 3.72 2.58 2.50 1.96 2.16 2.21 1.86 1.97Sandhills CC 1.29 1.13 1.07 1.03 1.02 4.03 3.86 3.47 5.20 5.44 2.27 2.08 1.8/ 2.03 2.03Southeastern CC 1.98 1.98 1.82 1.98 1.90 4.61 3.89 3.88 3.85 2.70 2.96 2.78 2.61 2.7C 2.26Southwestern TC 1.91 1.15 1.34 1.69 1.51 5.52 4.73 5.04 3.77 3.22 3.46 2.30 2.62 2.54 2.25
Stanly TC 1.89 1.73 1.60 1.63 1.84 3.11 3.46 3.66 3.79 3.50 2.32 2.32 2.24 2.41 2.53Suns, CF., 1.41 1.46 1.32 1.32 1.46 2.78 3.04 2.74 3.06 2.90 2.03 2.12 1.91 2.01 2.08TC Alamance 1.03 0.92 0.93 1.02 0.97 2.75 2.40 2.79 2.57 2.65 1.64 1.50 1.59 1.62 1.59.ri County CC 2.76 2.45 2.09 2.02 2.08 7.00 6.49 5.71 5.12 4.35 4.81 4 44 3.83 3.73 3.37
Vance- Granv'le CC 1.78 1.56 1.69 1.35 1.98 3.06 3.03 3.30 2.84 2.86 2.41 2.24 2.46 2.03 2.42Wake TC 1.08 0.99 0.98 0.94 0.96 3.10 3.00 3.10 3.13 3.79 1.81 1.66 1.66 1.69 1.91Wayne CC 1.37 1.14 1.08 1.09 1.17 3.35 3.30 2.89 3.06 2.68 2.21 1.97 1.82 1.86 1.83W. Piedmont CC 1.43 1.45 1.34 1.25 1.59 2.46 2.85 3.07 2.73 2.55 1.93 2.06 2.04 1.90 2.05
Wilkes CC 1.54 1.45 1.36 1.45 1.42 4.97 4.60 3.99 3.98 4.11 2.55 2.37 2.17 2.23 2.39Wilson Co. TI 1.70 1.37 1.27 1.04 1.26 5.46 6.18 6.12 4.66 3.26 3.42 3.23 3.10 2.59 2.s9
TOTAL 1.48 1.33 1.24 1.26 1.29 4.15 3.89 3.61 3.57 3.51 2.55 2.33 2.16 2.17 2.18
71
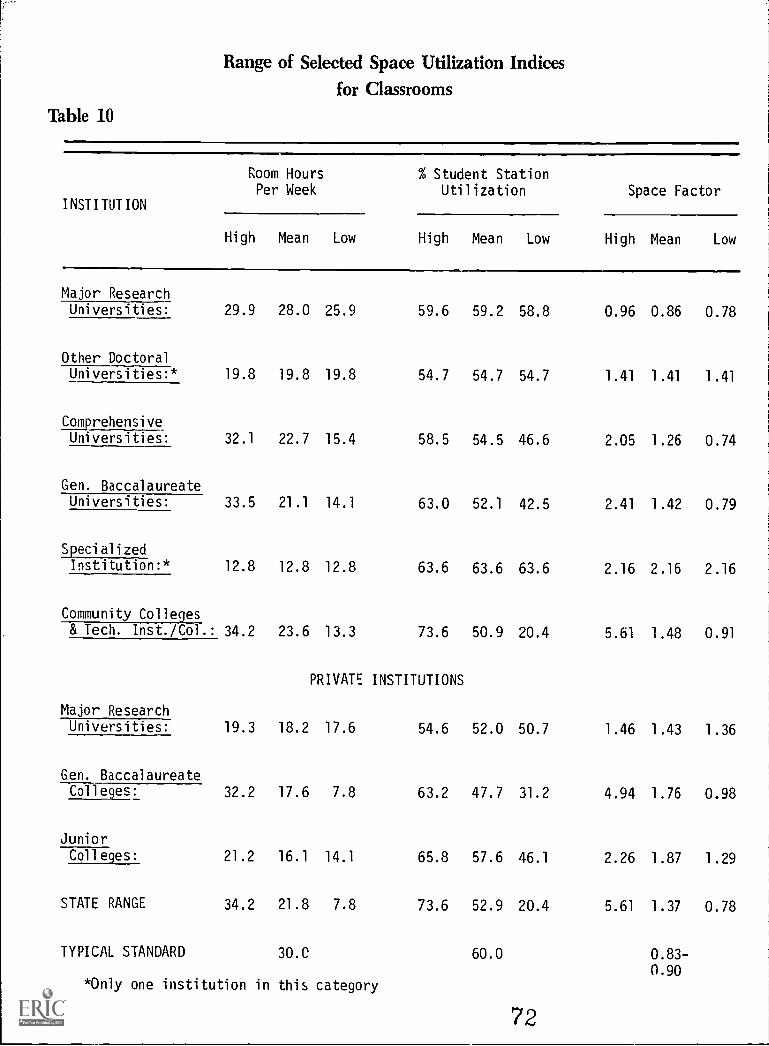
Range of Selected Space Utilization Indicesfor Classrooms
Table 10
INSTITUTION
Room HoursPer Week
% Student StationUtilization Space Factor
High Mean Low High Mean Low High Mean Low
Major ResearchUniversities: 29.9 28.0 25.9 59.6 59.2 58.8 0.96 0.86 0.78
Other DoctoralUniversities:* 19.8 19.8 19.8 54.7 54.7 54.7 1.41 1.41 1.41
ComprehensiveUniversities: 32.1 22.7 15.4 58.5 54.5 46.6 2.05 1.26 0.74
Gen. Baccalaureate33.5 21.1 14.1 63.0 52.1 42.5 2.41 1.42 0.79Universities:
Specialized
12.8 12.8 12.8 63.6 63.6 63.6 2.16 2.16 2.16Institution:*
Community Colleges& Tech. Inst./Col.: 34.2 23.6 13.3 73.6 50.9 20.4 5.61 1.48 0.91
PRIVATE INSTITUTIONS
Major Research
19.3 18.2 17.6 54.6 52.0 50.7 1.46 1.43 1.36Universities:
Gen. Baccalaureate
32.2 17.6 7.8 63.2 47.7 31.2 4.94 1.76 0.98Colleges:
Junior
21.2 16.1 14.1 65.8 57.6 46.1 2.26 1.87 1.29Colleges:
STATE RANGE 34.2 21.8 7.8 73.6 52.9 20.4 5.61 1.37 0.78
TYPICAL STANDARD 30.0 60.0 0.83-(1.90
*Only one institution in this category
72
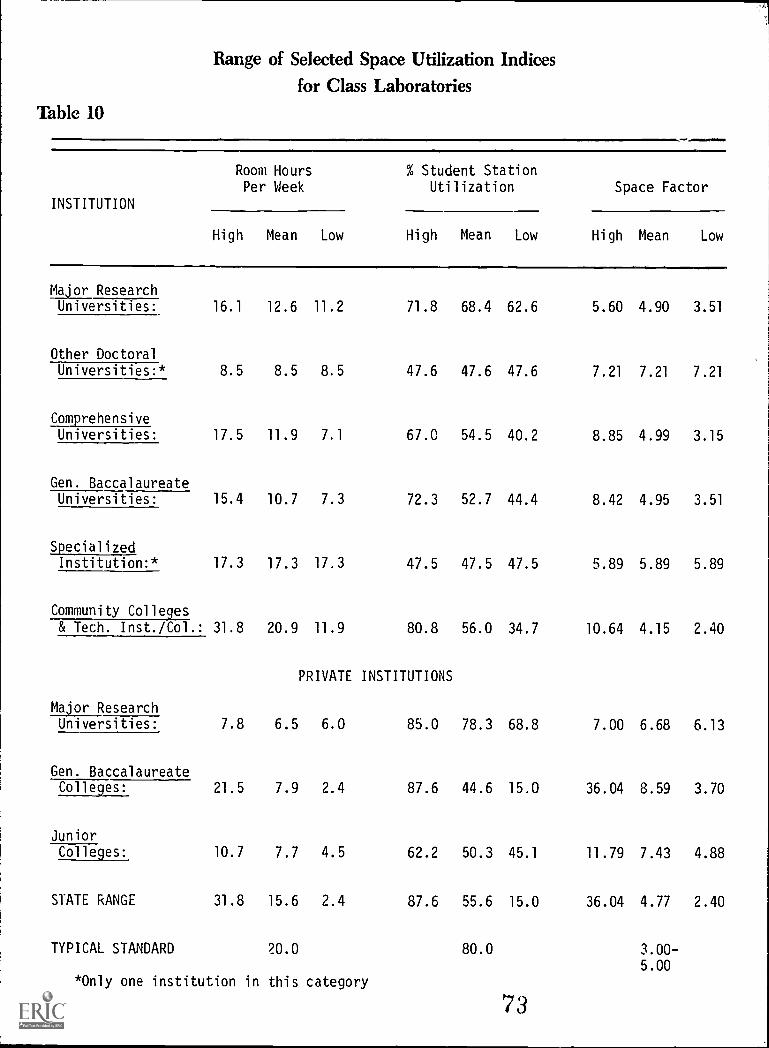
Range of Selected Space Utilization Indicesfor Class Laboratories
Table 10
INSTITUTION
Room HoursPer Week
% Student StationUtilization Space Factor
High Mean Low High Mean Low High Mean Low
Major ResearchUniversities: 16.1 12.6 11.2 71.8 68.4 62.6 5.60 4.90 3.51
Other Doctoral
Universities:* 8.5 8.5 8.5 47.6 47.6 47.6 7.21 7.21 7.21
ComprehensiveUniversities: 17.5 11.9 7.1 67.0 54.5 40.2 8.85 4.99 3.15
Gen. BaccalaureateUniversities: 15.4 10.7 7.3 72.3 52.7 44.4 8.42 4.95 3.51
Specialized17.3 17.3 17.3 47.5 47.5 47.5 5.89 5.89 5.89Institution:*
Community Colleges
& Tech. Inst./Col.: 31.8 20.9 11.9 80.8 56.0 34.7 10.64 4.15 2.40
PRIVATE INSTITUTIONS
Major ResearchUniversities: 7.8 6.5 6.0 85.0 78.3 68.8 7.00 6.68 6.13
Gen. BaccalaureateColleges: 21.5 7.9 2.4 87.6 44.6 15.0 36.04 8.59 3.70
JuniorColleges: 10.7 7.7 4.5 62.2 50.3 45.1 11.79 7.43 4.88
STATE RANGE 31.8 15.6 2.4 87.6 55.6 15.0 36.04 4.77 2.40
TYPICAL STANDARD 20.0 80.0 3.00-5.00
*Only one institution in this category
73
TABLE 11:
SPACE CRITERIA
The Higher Education Facilities Planning and ManagementManuals, which are published by the Western Interstate Commissionfor Higher Education, provide one of the best sources k.f informa-tion on space criteria. Since all higher education institutionshave been provided copies of the manuals, only highlights of spacecriteria will be provided in Table 11. It is recommended that themanuals be used for further information or assessments. In addi-tion, this Commission is always ready to respond to queries onfacilities matters.
7164

Space Criteria
Table 11
CLASSROOMS:
Room Utilization RatioStation Occupancy RatioAssignable Square Feet Per Student Station
LABORATORIES:
Room Utilization Ratio, Lower DivisionRoom Utilization Ratio, Upper Division
Station Occupancy Ratio, Lowe.: DivisionStation Occupancy Ratio, Upper Division
Assignable Square Feet Per Sta,:ion
Average
30 hours/week
65%18 ASF
Average
24 hours16 hours
807.
60%
Range
20-32 hours/veek45%-85%10-25 ASF
Range
22-26 hours14-18 hours
75%-85%55-65%
Criteria vary from 15 to 150Details are shown in Table 53ment Manual Two. Some examples
ASP depending on academic program and course levels.of Higher Education Facilities Planning and Manage-
are:
Biology, general 30-40 ASF Forestry 30-40 ASFFine Arts, general 30-50 ASF Architecture 40-50 ASFLetters 15-25 ASF Engineering, general 40-70 ASF
Accounting 20-35 ASF Business and Management 20-30 ASFAutomotive Technology 100-150 .ASF Sculpture, Ceramics 50-80 ASFNursing, practical 25-50 ASF Music (Liberal Arts) 15-20 ASF
LIBRARIES:
Stack Unit Floor Area Criteria
Type of Stack Area
AverageBound Volumes
per AssignableSquare Foot
AverageAssignableSquare Feetper Volume
Open-Stack Reading Rooms 8 - 10 0.125 - 0.10Open Stacks 10 - 12 0.10 - 0.083Closed Stacks 12 - 15 0.083 - 0.067High Density Compact Storage 40 - 60 0.025 - 0.017
65 75
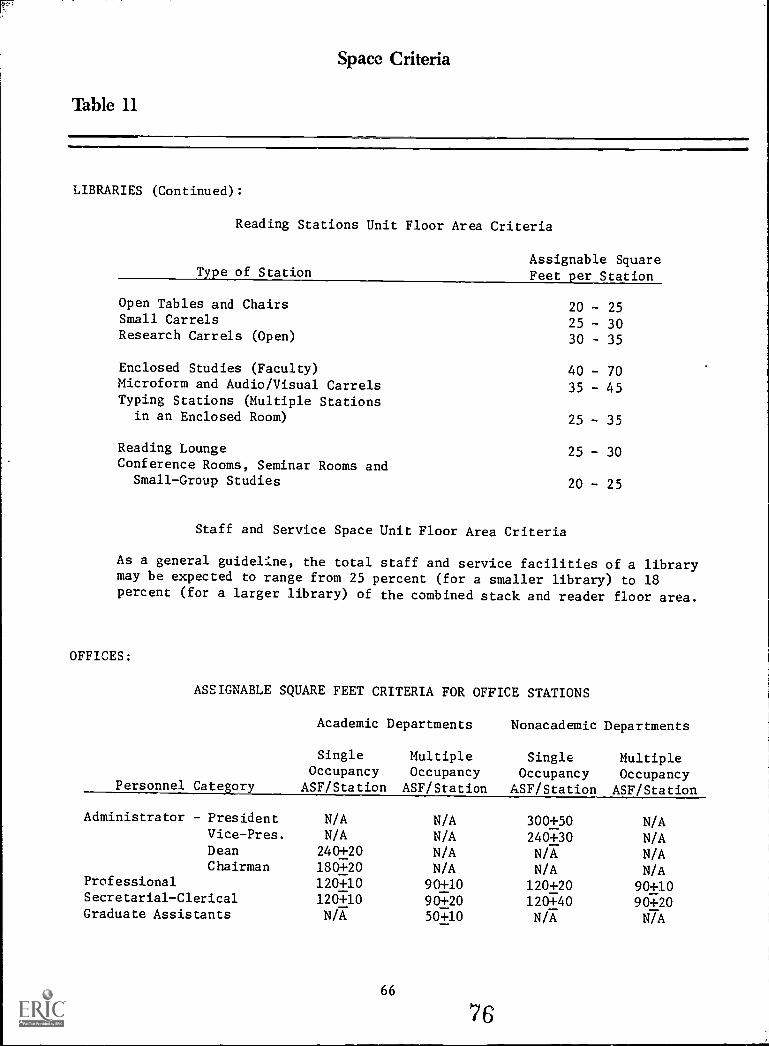
Space Criteria
Table 11
LIBRARIES (Continued):
Reading Stations Unit Floor Area Criteria
Type of StationAssignable SquareFeet per Station
Open Tables and Chairs 20 - 25Small Carrels 25 - 30Research Carrels (Open) 30 - 35
Enclosed Studies (Faculty) 40 - 70Microform and Audio/Visual Carrels 35 - 45Typing Stations (Multiple Stations
in an Enclosed Room) 25 - 35
Reading Lounge 25 - 30Conference Rooms, Seminar Rooms and
Small-Group Studies 20 - 25
Staff and Service Space Unit Floor Area Criteria
As a general guideline, the total staff and service facilities of a librarymay be expected to range from 25 percent (for a smaller library) to 18percent (for a larger library) of the combined stack and reader floor area.
OFFICES:
ASSIGNABLE SQUARE FEET CRITERIA FOR OFFICE STATIONS
Academic Departments Nonacademic Departments
Personnel Category
SingleOccupancy
ASF/Station
MultipleOccupancyASF/Station
SingleOccupancy
ASF/Station
MultipleOccupancyASF/Station
Administrator - President N/A N/A 300+50 N/AVice-Pres. N/A N/A 240+30 N/ADean 240+20 N/A N/A N/AChairman 180+20 N/A N/A N/A
Professional 120+10 90+10 120+20 90+10Secretarial-Clerical 120+10 90+20 120+40 90+20Graduate Assistants N/A 50+10 N/A N/A
66
76
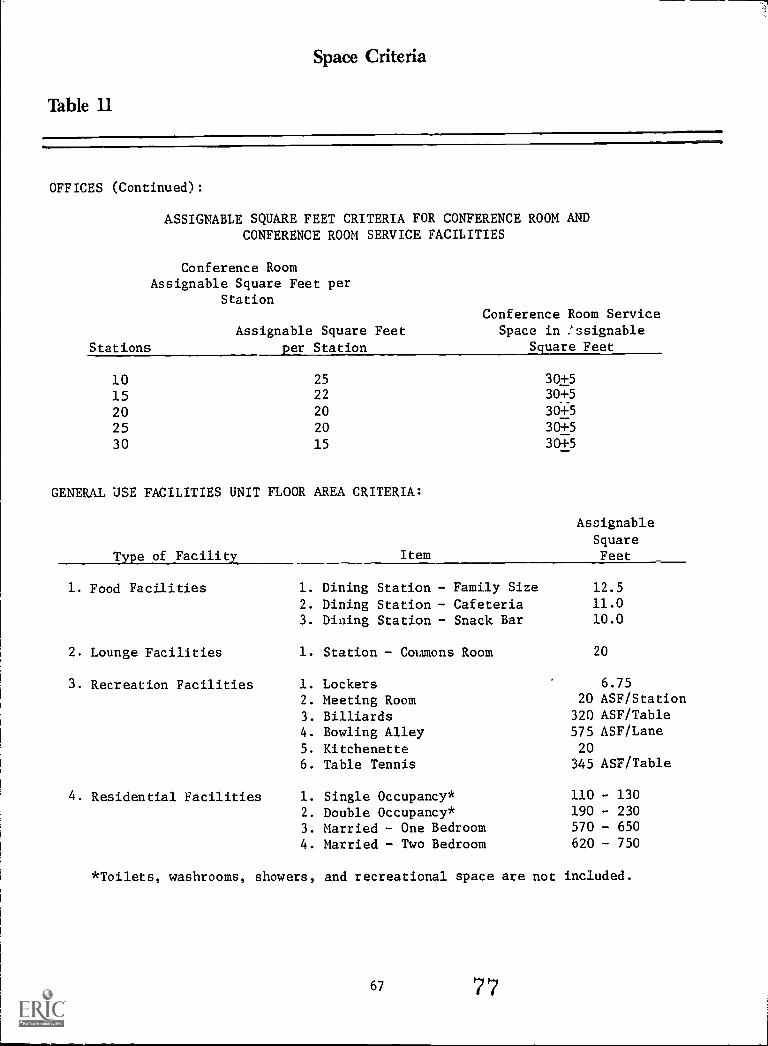
Space Criteria
Table 11
OFFICES (Continued):
ASSIGNABLE SQUARE FEET CRITERIA FOR CONFERENCE ROOM ANDCONFERENCE ROOM SERVICE FACILITIES
Conference RoomAssignable Square Feet per
Station
Assignable Square Feet
Stations per Station
Conference Room ServiceSpace in !ssignable
Square Feet
10 25 30+5
15 22 30+5
20 20 30+5
25 20 30+5
30 15 30+5
GENERAL USE FACILITIES UNIT FLOOR AREA CRITERIA:
Type of Facility Item
Assignable
SquareFeet
1. Food Facilities
2. Lounge Facilities
3. Recreation Facilities
4. Residential Facilities
1. Dining Station - Family Size
2. Dining Station Cafeteria3. Dining Station Snack Bar
1. Station - Coumons Room
1. Lockers2. Meeting Room3. Billiards4. Bowling Alley
5. Kitchenette6. Table Tennis
1. Single Occupancy*2. Double Occupancy*3. Married - One Bedroom4. Married - Two Bedroom
12.511.010.0
20
6.7520 ASF/Station320 ASF/Table
575 ASF/Lane20345 ASF/Table
110 - 130190 - 230570 - 650620 - 750
*Toilets, washrooms, showers, and recreational space are not included.
67 77
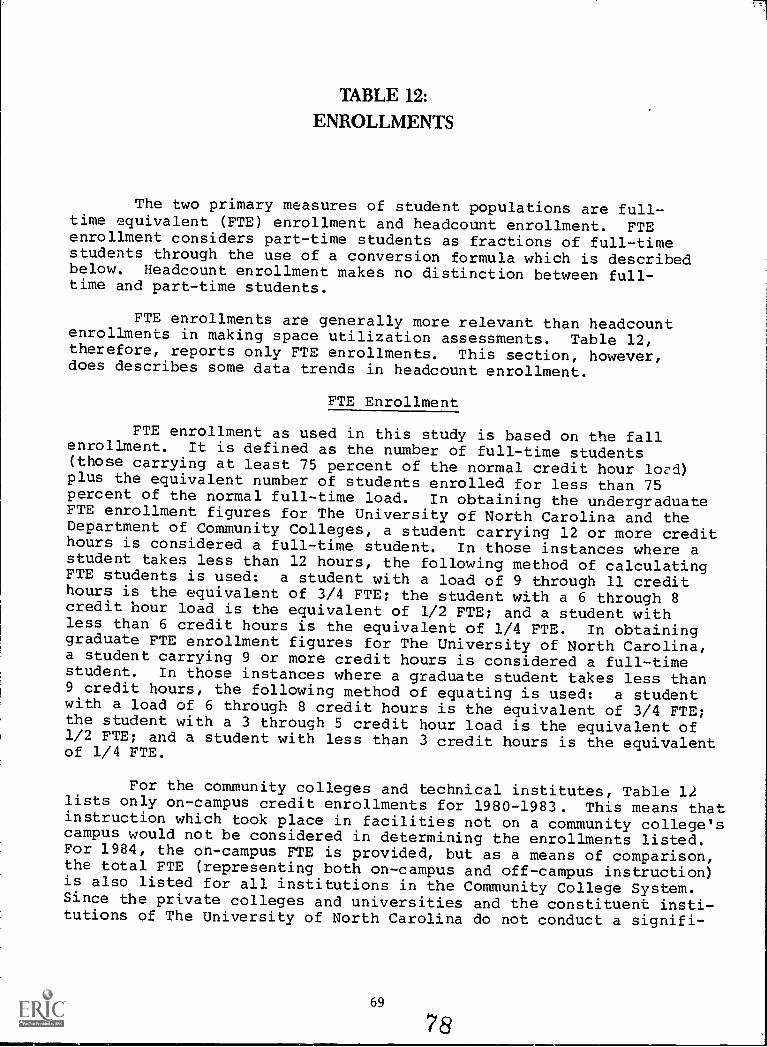
TABLE 12:
ENROLLMENTS
The two primary measures of student populations are full-time equivalent (FTE) enrollment and headcount enrollment. FTEenrollment considers part-time students as fractions of full-timestudents through the use of a conversion formula which is describedbelow. Headcount enrollment makes no distinction between full-time and part-time students.
FTE enrollments are generally more relevant than headcountenrollments in making space utilization assessments. Table 12,therefore, reports only FTE enrollments. This section, however,does describes some data trends in headcount enrollment.
FTE Enrollment
FTE enrollment as used in this study is based on the fallenrollment. It is defined as the number of full-time students(those carrying at least 75 percent of the normal credit hour load)plus the equivalent number of students enrolled for less than 75percent of the normal full-time load. In obtaining the undergraduateFTE enrollment figures for The University of North Carolina and theDepartment of Community Colleges, a student carrying 12 or more credithours is considered a full-time student. In those instances where astudent takes less than 12 hours, the following method of calculatingFTE students is used: a student with a load of 9 through 11 credithours is the equivalent of 3/4 FTE; the student with a 6 through 8credit hour load is the equivalent of 1/2 FTE; and a student withless than 6 credit hours is the equivalent of 1/4 FTE. In obtaininggraduate FTE enrollment figures for The University of North Carolina,a student carrying 9 or more credit hours is considered a full-timestudent. In those instances where a graduate student takes less than9 credit hours, the following method of equating is used: a studentwith a load of 6 through 8 credit hours is the equivalent of 3/4 FTE;the student with a 3 through 5 credit hour load is the equivalent of1/2 FTE; and a student with less than 3 credit hours is the equivalentof 1/4 FTE.
For the community colleges and technical institutes, Table 12lists only on-campus credit enrollments for 1980-1983. This means thatinstruction which took place in facilities not on a community college'scampus would not be considered in determining the enrollments listed.For 1984, the on-campus FTE is provided, but as a means of comparison,the total FTE (representing both on-campus and off-campus instruction)is also listed for all institutions in the Community College System.Since the private colleges and universities and the constituent insti-tutions of The University of North Carolina do not conduct a signifi-
69
78
cant number of instructional courses off-campus, the total FTEenrollments which are listed may also be considered as approximatingthese institutions' campus-based enrollments.
Trends in Headcount Enrollments
Total fall 1984 headcount enrollment in the United States de-creased by 0.1% from the previous year.* Most of this decline wasexperienced by the public two-year institutions (whose enrollmentdecreased by 1.1%) and private colleges and universities (down 0.9%).Headcount enrollment in the public baccalaureate granting institutionsincreased by 1.5%.
The over-all drop in headcount enrollment was the result ofa 0.9% decrease in the number of part-time students in 1984. Most ofthis decline was from the public two-year institutions which lost2.5% of their part-time students. Full-time enrollments among allcolleges and universities increased by 0.5% in 1984.
Although the drop in total headcount enrollment was slight,many institutions suffered significant enrollment decreases. Amongall colleges and universities, 39.2% experienced decreases in full-time enrollments of at least five percent in 1984, and 40 0% haddeclines of at least five percent in their part-time enrollments.
*All headcount enrollment data were obtained from an early surveyof fall 1984 enrollment conducted by the Association Council forPolicy Analysis and Research. Final enrollment data from theNational Center for Education Statistics were not available at thetime of publication.
70 79
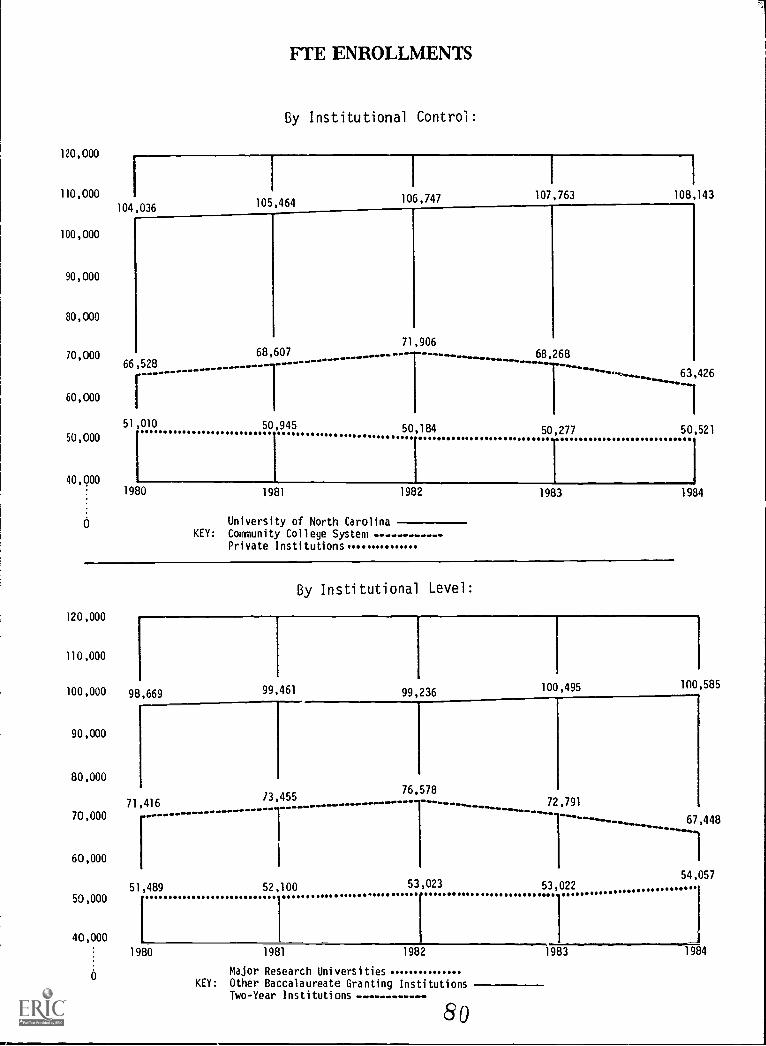
120,000
1)0,000
100,000
90,000
80,000
10,000
60,000
50,000
40,000
I104,036
1
FTE ENROLLMENTS
By Institutional Control:
I
105,464 106,747
I
107,763 108,143
68,60766,528 ........................... - - - ---
51,010
71,906
68,26800
50,945 50,184 50,277 50,521
1980 1981 1982 1983 1984
--.---,.. 63,426
University of North CarolinaKEY: Community College System
Private Institutions....
120,000
110,000
100,000
90,000
80,000
70,000
60,000
50,000
40,000
0
By Institutional Level:
98,669 99 461
71,416...
/3,455
............ -..........
51,489 52,100
1980 1981
99,236
1
100,495 100,585
1
76,578
..... ... 72,791
53,023 53,022
1
J1982 1983 1984
"-- --N,.--. 67,448
1
54,057
Major Research UniversitiesKEY: Other Baccalaureate Granting Institutions
Two-Year Institutions
80
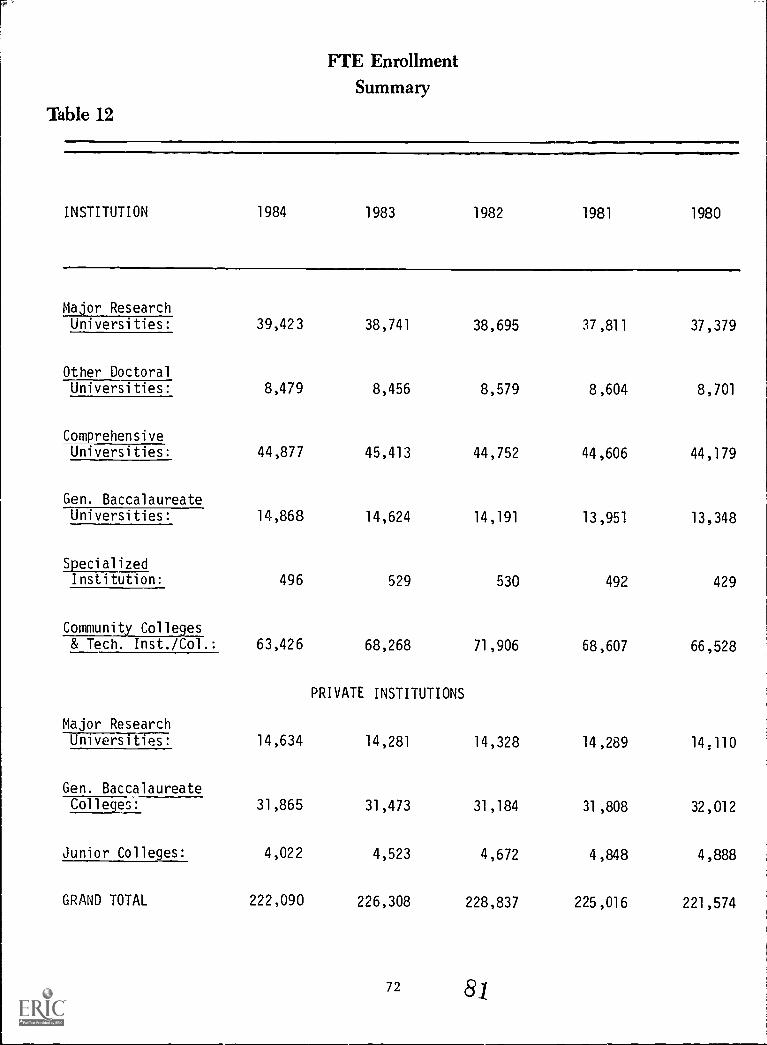
FTE EnrollmentSummary
Table 12
INSTITUTION 1984 1983 1982 1981 1980
Major ResearchUniversities: 39,423 38,741 38,695 37,811 37,379
Other DoctoralUniversities: 8,479 8,456 8,579 8,604 8,701
ComprehensiveUniversities: 44,877 45,413 44,752 44,606 44,179
Gen. BaccalaureateUniversities: 14,868 14,624 14,191 13,951 13,348
Specialized
496 529 530 492 429Institution:
Community Colleges& Tech. Inst./Col.: 63,426 68,268 71,906 68,607 66,528
PRIVATE INSTITUTIONS
Major ResearchUniversities: 14,634 14,281 14,328 14,289 14 110
Gen. BaccalaureateColleges: 31,865 31,473 31,184 31,808 32,012
Junior Colleges: 4,022 4,523 4,672 4,848 4,888
GRAND TOTAL 222,090 226,308 228,837 225,016 221,574
72 8j
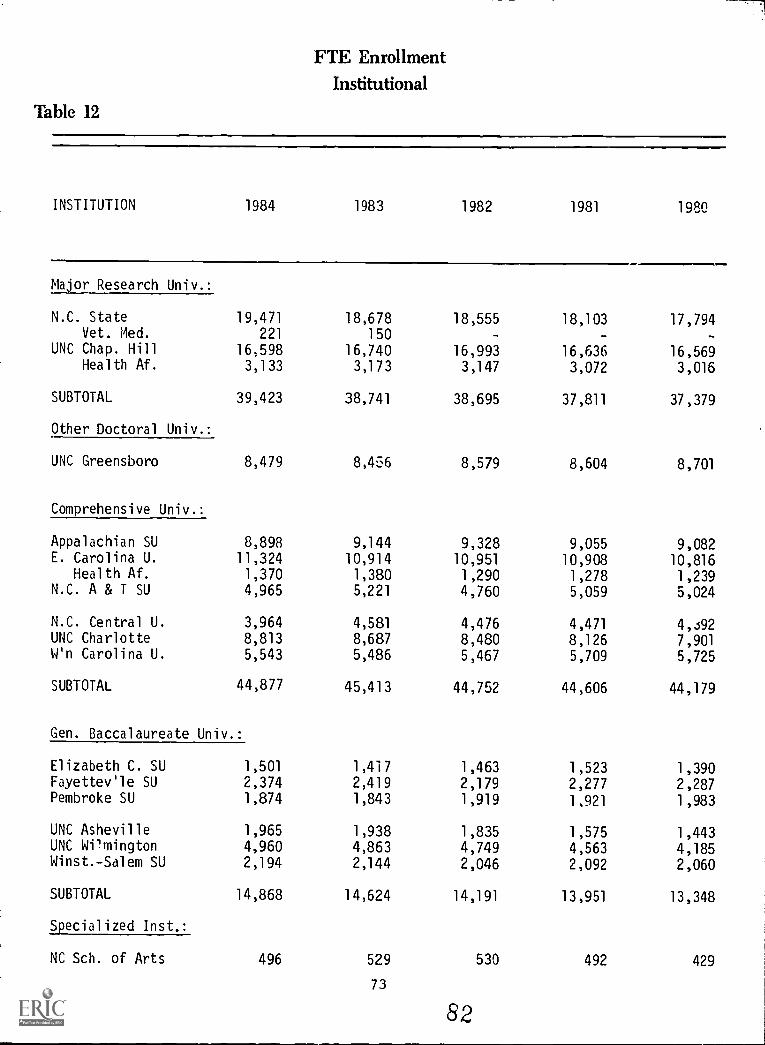
FTE EnrollmentInstitutional
Table 12
INSTITUTION 1984 1983 1982 1981 1980
Major Research Univ.:
N.C. State 19,471 18,678 18,555 18,103 17,794Vet. Med. 221 150
UNC Chap. Hill 16,598 16,740 16,993 16,636 16,569Health Af. 3,133 3,173 3,147 3,072 3,016
SUBTOTAL 39,423 38,741 38,695 37,811 37,379
Other Doctoral Univ.:
UNC Greensboro 8,479 8,456 8,579 8,604 8,701
Comprehensive Univ.:
Appalachian SU 8,898 9,144 9,328 9,055 9,082E. Carolina U. 11,324 10,914 10,951 10,908 10,816
Health Af. 1,370 1,380 1,290 1,278 1,239N.C. A & T SU 4,965 5,221 4,760 5,059 5,024
N.C. Central U. 3,964 4,581 4,476 4,471 4,392UNC Charlotte 8,813 8,687 8,480 8,126 7,901W'n Carolina U. 5,543 5,486 5,467 5,709 5,725
SUBTOTAL 44,877 45,413 44,752 44,606 44,179
Gen. Baccalaureate Univ.:
Elizabeth C. SU 1,501 1,417 1,463 1,523 1,390Fayettev'le SU 2,374 2,419 2,179 2,277 2,287Pembroke SU 1,874 1,843 1,919 1,921 1,983
UNC Asheville 1,965 1,938 1,835 1,575 1,443UNC Wi'mington 4,960 4,863 4,749 4,563 4,185Winst.-Salem SU 2,194 2,144 2,046 2,092 2,060
SUBTOTAL 14,868 14,624 14,191 13,951 13,348
Specialized Inst.:
NC Sch. of Arts 496 529 530 492 429
73
82
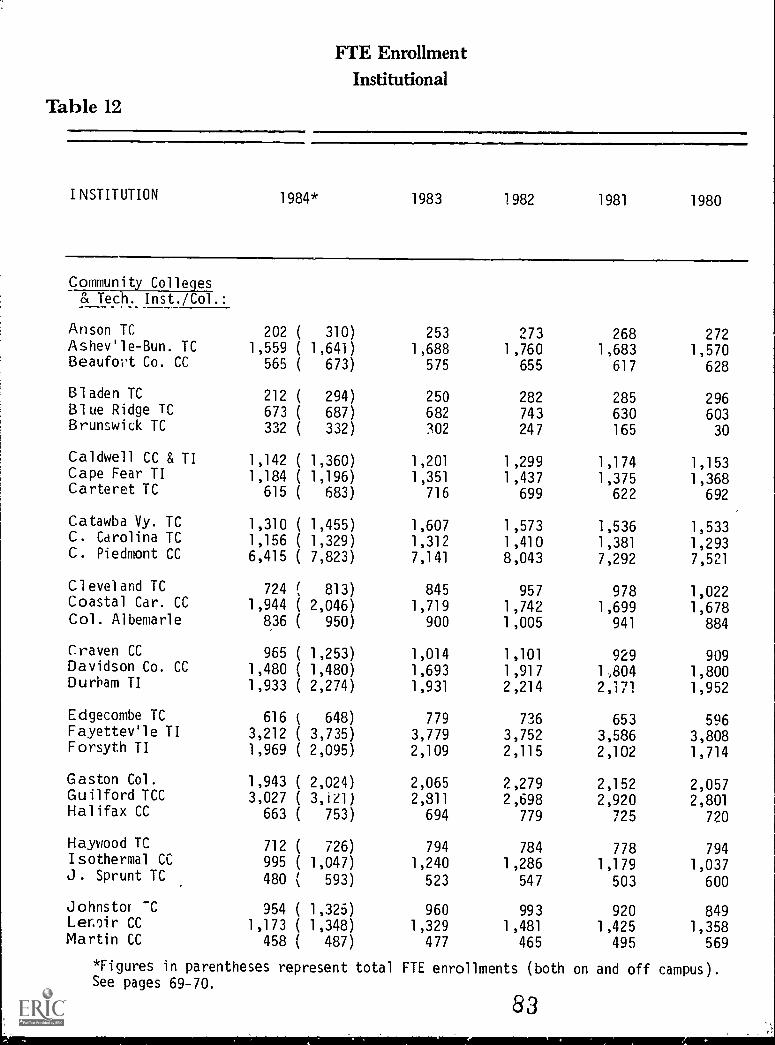
Table 12
INSTITUTION
FTE EnrollmentInstitutional
1984* 1983 1982 1981 1980
Community Collegesa, Tech. Inst./Col.:
Anson TC 202 ( 310) 253 273 268 272Ashev' le-Bun. TC 1,559 ( 1,641) 1,688 1,760 1,683 1,570BeaufM Co. CC 565 ( 673) 575 655 617 628
Bladen TC 212 ( 294) 250 282 285 296Blue Ridge TC 673 ( 687) 682 743 630 603Brunswick TC 332 ( 332) 302 247 165 30
Caldwell CC & TI 1,142 ( 1,360) 1,201 1,299 1,174 1,153Cape Fear TI 1,184 ( 1,196) 1,351 1,437 1,375 1,368Carteret TC 615 ( 683) 716 699 622 692
Catawba Vy. TC 1,310 ( 1,455) 1,607 1,573 1,536 1,533C. Carolina TC 1,156 ( 1,329) 1,312 1,410 1,381 1,293C. Piedmont CC 6,415 ( 7,823) 7,141 8,043 7,292 7,521
Cl evel and TC 724 ( 813) 845 957 978 1,022Coastal Car. CC 1,944 ( 2,046) 1,719 1,742 1,699 1,678Col. Albemarle 836 ( 950) 900 1,005 941 884
Craven CC 965 ( 1,253) 1,014 1,101 929 909Davidson Co. CC 1,480 ( 1,480) 1,693 1,917 1,804 1,800Durilam TI 1,933 ( 2,274) 1,931 2,214 2,171 1,952
E dgecombe TC 616 ( 648) 779 736 653 596Fayettev'le TI 3,212 ( 3,735) 3,779 3,752 3,586 3,808Forsyth TI 1,969 ( 2,095) 2,109 2,115 2,102 1,714
Gaston Col. 1,943 ( 2,024) 2,065 2,279 2,152 2,057Guilford TCC 3,027 ( 3,i21) 2,811 2,698 2,920 2,801Halifax CC 663 ( 753) 694 779 725 720
Haywood TC 712 ( 726) 794 784 778 794Isothermal CC 995 ( 1,047) 1,240 1,286 1,179 1,037J. Sprunt TC 480 ( 593) 523 547 503 600
Johnstor -C 954 ( 1,325) 960 993 920 849Lenoir CC 1,173 ( 1,348) 1,329 1,481 1,425 1,358Martin CC 458 ( 487) 477 465 495 569
*Figures in parentheses represent total FTE enrollments (both on and off campus).See pages 69-70.
83
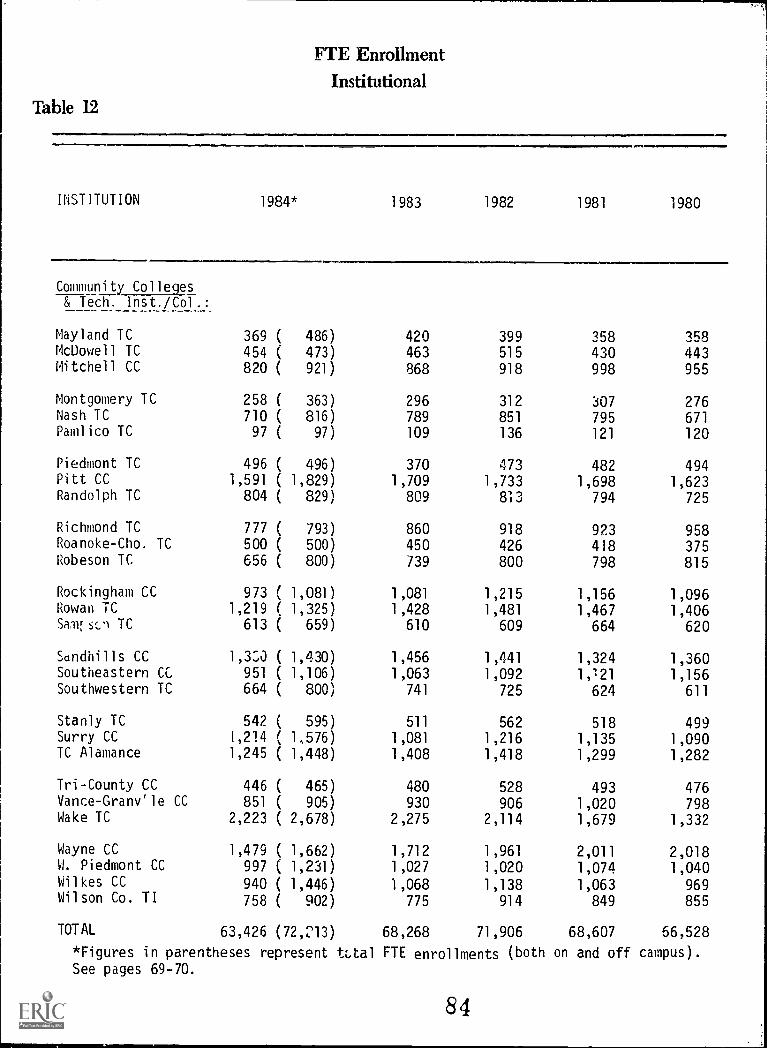
FTE EnrollmentInstitutional
Table 12 711INSTITUTION 1984* 1983 1982 1981 1980
Community Colleges& Tech. Inst./Col
Mayland TC 369 ( 486) 420 399 358 358McDowell TC 454 ( 473) 463 515 430 443Mitchell CC 820 ( 921) 868 918 998 955
Montgomery TC 258 ( 363) 296 312 307 276Nash TC 710 ( 816) 789 851 795 671Pamlico TC 97 ( 97) 109 136 121 120
Piedmont TC 496 ( 496) 370 473 482 494Pitt CC 1,591 ( 1,829) 1,709 1,733 1,698 1,623Randolph TC 804 ( 829) 809 813 794 725
Richmond TC 777 ( 793) 860 918 923 958Roanoke-Cho. TC 500 ( 500) 450 426 418 375Robeson TC 656 ( 800) 739 800 798 815
Rockingham CC 973 ( 1,081) 1,081 1,215 1,156 1,096Rowan TC 1,219 ( 1,325) 1,428 1,481 1,467 1,406Sarn;sci TC 613 ( 659) 610 609 664 620
Sandhills CC 1,3L0 ( 1,430) 1,456 1,441 1,324 1,360Southeastern CC 951 ( 1,106) 1,063 1,092 1,121 1,156Southwestern TC 664 ( 800) 741 725 624 611
Stanly TC 542 ( 595) 511 562 518 499Surry CC 1,214 ( 1,576) 1,081 1,216 1,135 1,090TC Alamance 1,245 ( 1,448) 1,408 1,418 1,299 1,282
Tri-County CC 446 ( 465) 480 528 493 476Vance-Grany'le CC 851 ( 905) 930 906 1,020 798Wake TC 2,223 ( 2,678) 2,275 2,114 1,679 1,332
Wayne CC 1,479 ( 1,662) 1,712 1,961 2,011 2,018W. Piedmont CC 997 ( 1,231) 1,027 1,020 1,074 1,040Wilkes CC 940 ( 1,446) 1,068 1,138 1,063 969Wilson Co. TI 758 ( 902) 775 914 849 855
TOTAL 63,426 (72,213) 68,268 71,906 68,607 66,528
*Figures in parentheses represent tt,tal FTE enrollments (both on and off campus).See pages 69-70.
84
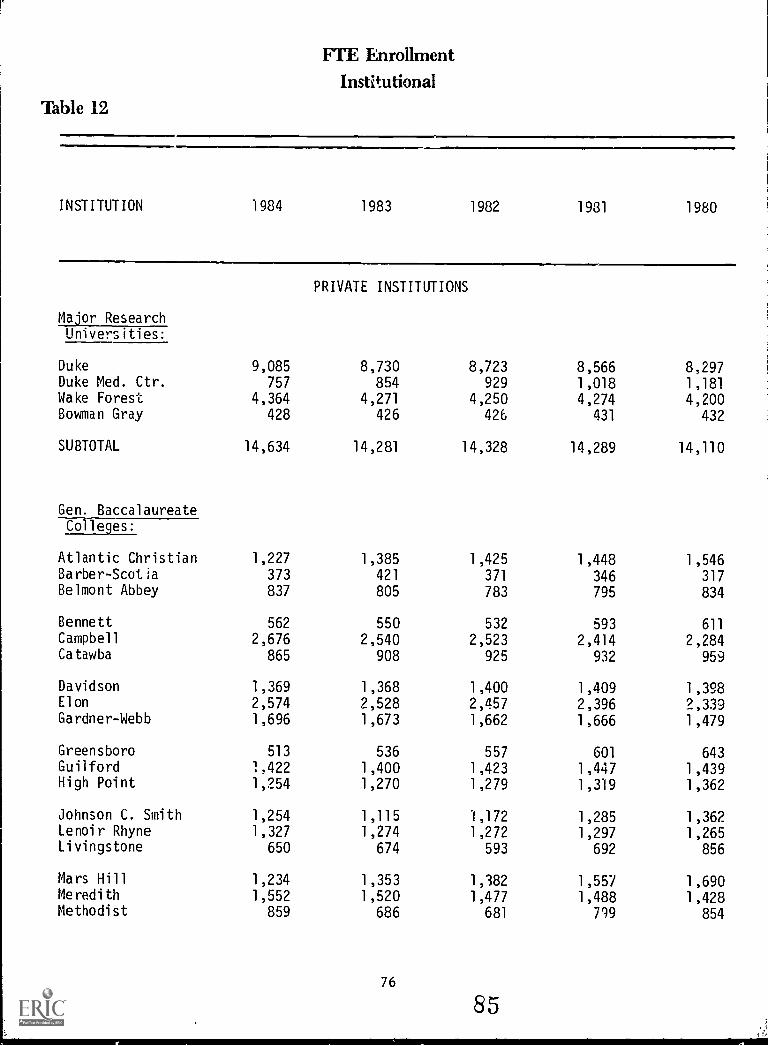
FTE EnrollmentInstitutional
Table 12
INSTITUTION 1984 1983 1982 1931 1980
Major Research
PRIVATE INSTITUTIONS
Universities:
Duke 9,085 8,730 8,723 8,566 8,297Duke Med. Ctr. 757 854 929 1,018 1,181Wake Forest 4,364 4,271 4,250 4,274 4,200Bowman Gray 428 426 426 431 432
SUBTOTAL 14,634 14,281 14,328 14,289 14,110
Gen. BaccalaureateColleges:
Atlantic Christian 1,227 1,385 1,425 1,448 1,546Barber-Scotia 373 421 371 346 317Belmont Abbey 837 805 783 795 834
Bennett 562 550 532 593 611Campbell 2,676 2,540 2,523 2,414 2,284Catawba 865 908 925 932 959
Davidson 1,369 1,368 1,400 1,409 1,398Elon 2,574 2,528 2,457 2,396 2,339Gardner-Webb 1,696 1,673 1,662 1,666 1,479
Greensboro 513 536 557 601 643Guilford 1,422 1,400 1,423 1,447 1,439High Point 1,254 1,270 1,279 1,319 1,362
Johnson C. Smith 1,254 1,115 1,172 1,285 1,362Lenoir Rhyne 1,327 1,274 1,272 1,297 1,265Livingstone 650 674 593 692 856
Mars Hill 1,234 1,353 1,382 1,557 1,690Meredith 1,552 1,520 1,477 1,488 1,428Methodist 859 686 681 799 854
76
85
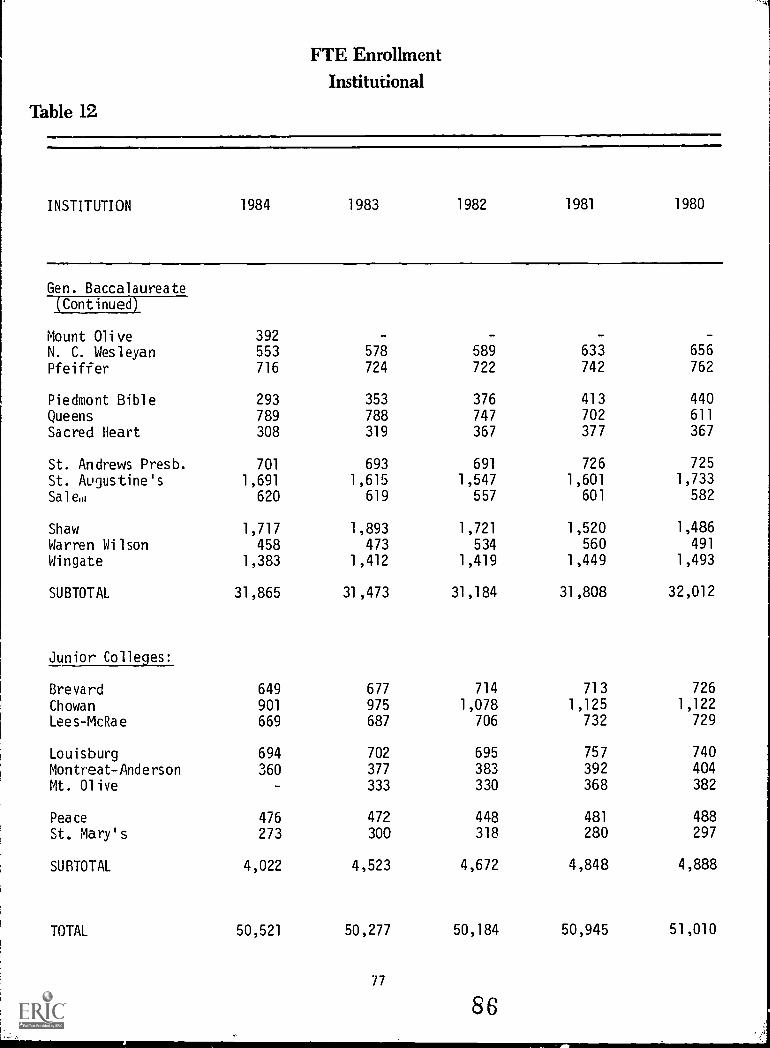
FTE EnrollmentInstitutional
Table 12
INSTITUTION 1984 1983 1982 1981 1980
Gen. BaccalaureateContinued
Mount Olive 392
N. C. Wesleyan 553 578 589 633 656
Pfeiffer 716 724 722 742 762
Piedmont Bible 293 353 376 413 440
Queens 789 788 747 702 611
Sacred Heart 308 319 367 377 367
St. Andrews Presb. 701 693 691 726 725
St. Augustine's 1,691 1,615 1,547 1,601 1,733
620 619 557 601 582
Shaw 1,717 1,893 1,721 1,520 1,486
Warren Wilson 458 473 534 560 491
Wingate 1,383 1,412 1,419 1,449 1,493
SUBTOTAL 31,865 31,473 31,184 31,808 32,012
Junior Colleges:
Brevard 649 677 714 713 726
Chowan 901 975 1,078 1,125 1,122
Lees-McRae 669 687 706 732 729
Louisburg 694 702 695 757 740
Montreat-Anderson 360 377 383 392 404
Mt. Olive 333 330 368 382
Peace 476 472 448 481 488
St. Mary's 273 300 318 280 297
SUBTOTAL 4,022 4,523 4,672 4,848 4,888
TOTAL 50,521 50,277 50,184 50,945 51,010
77
86
TABLE 13:
NET-TO-GROSS RATIO
The net-to-gross ratio is the net assignable area of a buildingor group of buildings divided by the gross area. It is generally usedas a measure of the efficiency of a building; the higher the net-to-gross ratio, the more space that can be assigned to the various pro-grams for which the building was intended.
Simply stated, the gross area of a building is the sum of thefloor areas of the outside faces of its exterior walls for all of thebuil.&ing's stories (or areas that have floor surfaces). A building'sassignable area is the sum of all areas on all floors which areassigned to, or available for assignment to, an occupant. Morespecifically, it is the building's gross area less its custodial,circulation, mechanical, and structural areas.
National facilities surveys have shown an average net-to-grossratio for college and university facilities of .67. Many buildings- -particularly those which are primarily composed of a few very largerooms, such as warehouses and theaters--may have significantly higherratios. Buildings which have ratios below .60 are Severally consideredinefficient, although such factors as historical preservation orunusual structural requirements may be the cause.
If a renovation can increase the amount of assignable space ina building, then part of the cost of the renovation can be justifiedpurely on a cost savings basis. Tables 19 and 20 suggest that newconstruction costs average $69 per gross square foot. Table 13indicates that the average net-to-gross ratio is .69. This meansthat new construction costs are approximately $100 per assignablesquare foot:
CONSTRUCTION COST/ASF = CONSTRUCTION COST/GSFNET-TO-GROSS RATIO
CONSTRUCTION COST/ASF =16-2 $100.69
Thus every assignable square foot created through a renovation can beviewed as saving the institution $100 in new construction costs.
81
88
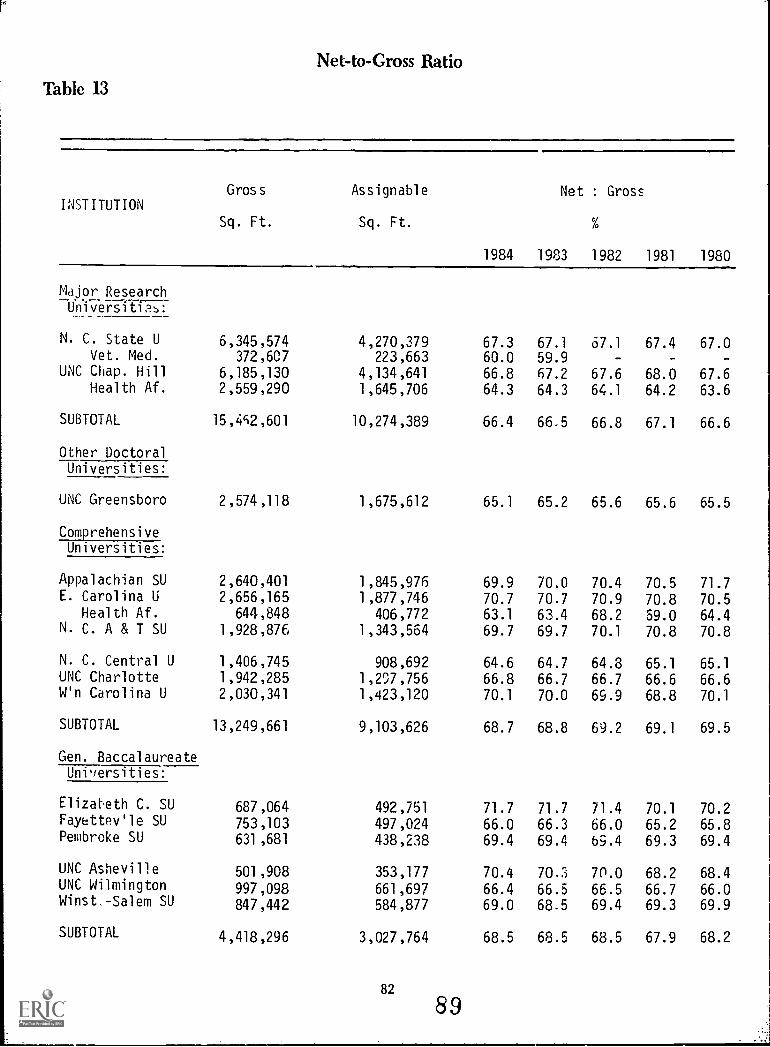
Net-to-Gross Ratio
Table 13
INSTITUTIONGross
Sq. Ft.
Assignable
Sq. Ft.
1984
Net : Gross
%
1983 1982 1981 1980
Major ResearchUniversities:
N. C. State U 6,345,574 4,270,379 67.3 67.1 67.1 67.4 67.0Vet. Med. 372,607 223,663 60.0 59.9
UNC Chap. Hill 6,185,130 4,134,641 66.8 67.2 67.6 68.0 67.6Health Af. 2,559,290 1,645,706 64.3 64.3 64.1 64.2 63.6
SUBTOTAL 15,e62,601 10,274,389 66.4 66.5 66.8 67.1 66.6
Other DoctoralUniversities:
UNC Greensboro 2,574,118 1,675,612 65.1 65.2 65.6 65.6 65.5
ComprehensiveUniversities:
Appalachian SU 2,640,401 1,845,976 69.9 70.0 70.4 70.5 71.7E. Carolina U 2,656,165 1,877,746 70.7 70.7 70.9 70.8 70.5
Health Af. 644,848 406,772 63.1 63.4 68.2 59.0 64.4N. C. A & T SU 1,928,876 1,343,564 69.7 69.7 70.1 70.8 70.8
N. C. Central U 1,406,745 908,692 64.6 64.7 64.8 65.1 65.1UNC Charlotte 1,942,285 1,207,756 66.8 66.7 66.7 66.6 66.6W'n Carolina U 2,030,341 1,423,120 70.1 70.0 69.9 68.8 70.1
SUBTOTAL 13,249,661 9,103,626 68.7 68.8 69.2 69.1 69.5
Gen. BaccalaureateUniversities:
Elizabeth C. SU 687,064 492,751 71.7 71.7 71.4 70.1 70.2FayettevIle SU 753,103 497,024 66.0 66.3 66.0 65.2 65.8Pembroke SU 631,681 438,238 69.4 69.4 69.4 69.3 69.4
UNC Asheville 501,908 353,177 70.4 70.3 70.0 68.2 68.4UNC Wilmington 997,098 661,697 66.4 66.5 66.5 66.7 66.0Winst.-Salem SU 847,442 584,877 69.0 68.5 69.4 69.3 69.9
SUBTOTAL 4,418,296 3,027,764 68.5 68.5 68.5 67.9 68.2
82
89
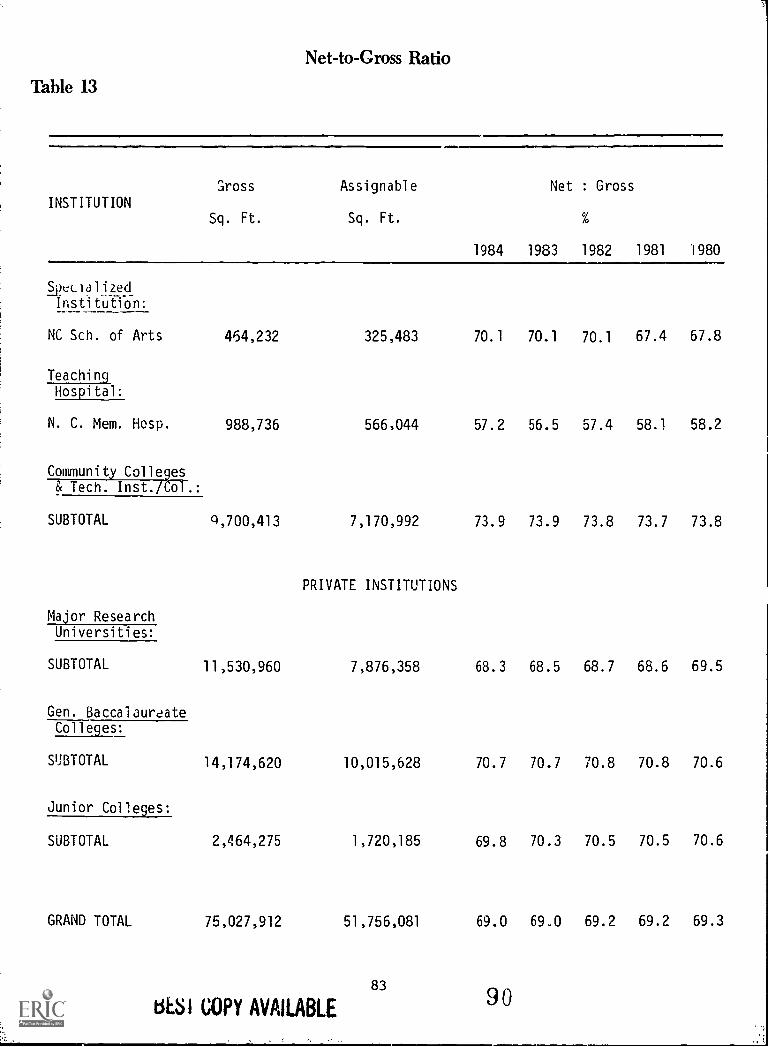
Net-to-Gross Ratio
Table 13
INSTITUTION
Gross
Sq. Ft.
Assignable
Sq. Ft.
1984
Net : Gross
%
1983 1982 1981 1980
S9ecializedInstitution:
NC Sch. of Arts 464,232 325,483 70.1 70.1 70.1 67.4 67.8
TeachingHospital:
N. C. Mem. Hosp. 988,736 566,044 57.2 56.5 57.4 58.1 58.2
Community Colleges& Tech. Inst./Col.:
SUBTOTAL q,700,413 7,170,992 73.9 73.9 73.8 73.7 73.8
PRIVATE INSTITUTIONS
Major ResearchUniversities:
SUBTOTAL 11,530,960 7,876,358 68.3 68.5 68.7 68.6 69.5
Gen. BaccalaureateColleges:
SUBTOTAL 14,174,620 10,015,628 70.7 70.7 70.8 70.8 70.6
Junior Colleges:
SUBTOTAL 2,464,275 1,720,185 69.8 70.3 70.5 70.5 70.6
GRAND TOTAL 75,027,912 51,756,081 69.0 69.0 69.2 69.2 69.3
83
8E.SI COPY AVAILABLE90
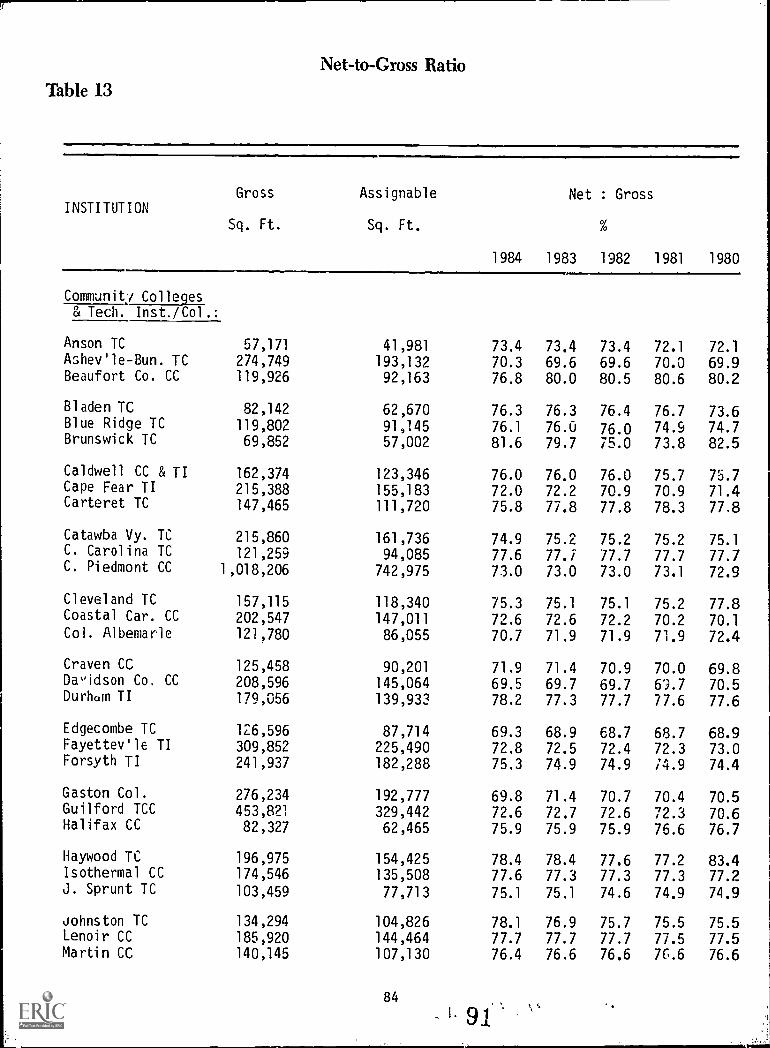
Net-to-Gross RatioTable 13
INSTITUTIONGross
Sq. Ft,
Assignable
Sq. Ft.
1984
Net : Gross
%
1983 1982 1981 1980
Communit,j Colleges& Tech. Inst./Col.:
Anson TC 57,171 41,981 73.4 73.4 73.4 72.1 72.1Ashevale-Bun. TC 274,749 193,132 70.3 69.6 69.6 70.0 69.9Beaufort Co. CC 119,926 92,163 76.8 80.0 80.5 80.6 80.2
Bladen TC 82,142 62,670 76.3 76.3 76.4 76.7 73.6Blue Ridge TC 119,802 91,145 76.1 76.0 76.0 74.9 74.7Brunswick TC 69,852 57,002 81.6 79.7 75.0 73.8 82.5
Caldwell CC & TI 162,374 123,346 76.0 76.0 76.0 75.7 75.7Cape Fear TI 215,388 155,183 72.0 72.2 70.9 70.9 71.4Carteret TC 147,465 111,720 75.8 77.8 77.8 78.3 77.8
Catawba Vy. TC 215,860 161,736 74.9 75.2 75.2 75.2 75.1C. Carolina TC 121,259 94,085 77.6 77.i 77.7 77.7 77.7C. Piedmont CC 1,018,206 742,975 73.0 73.0 73.0 73.1 72.9
Cleveland TC 157,115 118,340 75.3 75.1 75.1 75.2 77.8Coastal Car. CC 202,547 147,011 72.6 72.6 72.2 70.2 70.1Col. Albemarle 121,780 86,055 70.7 71.9 71.9 71.9 72.4
Craven CC 125,458 90,201 71.9 71.4 70.9 70.0 69.8Da,'idson Co. CC 208,596 145,064 69.5 69.7 69.7 69.7 70.5Durham TI 179,056 139,933 78.2 77.3 77.7 77.6 77.6
Edgecombe TC 126,596 87,714 69.3 68.9 68.7 68.7 68.9Fayettev'le TI 309,852 225,490 72.8 72.5 72.4 72.3 73.0Forsyth TI 241,937 182,288 75.3 74.9 74.9 /4.9 74.4
Gaston Col. 276,234 192,777 69.8 71.4 70.7 70.4 70.5Guilford TCC 453,821 329,442 72.6 72.7 72.6 72.3 70.6Halifax CC 82,327 62,465 75.9 75.9 75.9 76.6 76.7
Haywood TC 196,975 154,425 78.4 78.4 77.6 77.2 83.4Isothermal CC 174,546 135,508 77.6 77.3 77.3 77.3 77.2J. Sprunt TC 103,459 77,713 75.1 75.1 74.6 74.9 74.9
Johnston TC 134,294 104,826 78.1 76.9 75.7 75.5 75.5Lenoir CC 185,920 144,464 77.7 77.7 77.7 77.5 77.5Martin CC 140,145 107,130 76.4 76.6 76.6 76.6 76.6
84
' 91\
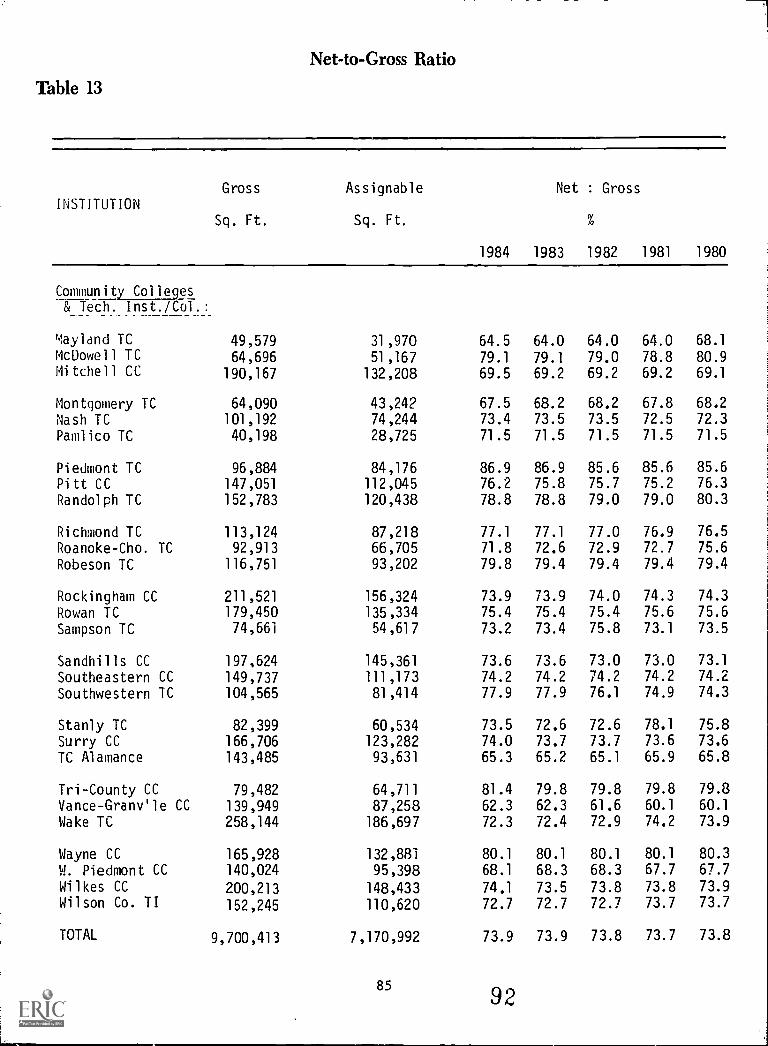
Net-to-Gross Ratio
Table 13
INSTITUTIONGross Assignable Net : Gross
Sq. Ft. Sq. Ft.
Community Colleges-8( Tech. Inst./Col.:
Mayland TC 49,579 31,970McDowell TC 64,696 51,167Mitchell CC 190,167 132,208
Montgomery TC 64,090 43,242
Nash TC 101,192 74,244Pamlico TC 40,198 28,725
Piedmont TC 96,884 84,176Pitt CC 147,051 112,045
Randolph TC 152,783 120,438
Richmond TC 113,124 87,218Roanoke-Cho. TC 92,913 66,705
Robeson TC 116,751 93,202
Rockingham CC 211,521 156,324
Rowan TC 179,450 135,334
Sampson TC 74,661 54,617
Sandhills CC 197,624 145,361
Southeastern CC 149,737 111,173
Southwestern TC 104,565 81,414
Stanly TC 82,399 60,534Surry CC 166,706 123,282
TC Alamance 143,485 93,631
Tri-County CC 79,482 64,711
Vance-Granvile CC 139,949 87,258Wake TC 258,144 186,697
Wayne CC 165,928 132,881
W. Piedmont CC 140,024 95,398Wilkes CC 200,213 148,433Wilson Co. TI 152,245 110,620
TOTAL 9,700,413 7,170,992
85
1984 1983 1982 1981 1980
64.5 64.0 64.0 64.0 68.1
79.1 79.1 79.0 78.8 80.9
69.5 69.2 69.2 69.2 69.1
67.5 68.2 68.2 67.8 68.2
73.4 73.5 73.5 72.5 72.3
71.5 71.5 71.5 71.5 71.5
86.9 86.9 85.6 85.6 85.6
76.2 75.8 75.7 75.2 76.3
78.8 78.8 79.0 79.0 80.3
77.1 77.1 77.0 76.9 76.5
71.8 72.6 72.9 72.7 75.6
79.8 79.4 79.4 79.4 79.4
73.9 73.9 74.0 74.3 74.3
75.4 75.4 75.4 75.6 75.6
73.2 73.4 75.8 73.1 73.5
73.6 73.6 73.0 73.0 73.1
74.2 74.2 74.2 74.2 74.2
77.9 77.9 76.1 74.9 74.3
73.5 72.6 72.6 78.1 75.8
74.0 73.7 73.7 73.6 73.6
65.3 65.2 65.1 65.9 65.8
81.4 79.8 79.8 79.8 79.8
62.3 62.3 61.6 60.1 60.1
72.3 72.4 72.9 74.2 73.9
80.1 80.1 80.1 80.1 80.3
68.1 68.3 68.3 67.7 67.7
74.1 73.5 73.8 73.8 73.9
72.7 72.7 72.7 73.7 73.7
73.9 73.9 73.8 73.7 73.8
92
TABLE 14:
PERCENTAGE DISTRIBUTION OF ASSIGNABLE AREA
BY SUMMARY PROGRAMS AND SUBPROGRAMS
All colleges and universities conduct a wide range of activitiesin pursuit of their missions as institutions of higher education.The Program Classification Structure, developed by the NationalCenter for Higher Education Management Systems in 1978, attempts tocategorize these activities.
The structure divides all of an institution's activities intoten major categories, called programs. Each program is divided intovarious subprograms. Virtual3y every activity and square foot ofassignable space can be related to one of these subprograms.
Table 14 reports for each institution the percentage of totalassignable area which is classified under each program. Tables 14a-14d indicate these percentages for the subprograms. Definitions ofthe programs and subprograms are provided in the narratives whichprecede the tables.
In Tables 14 and 14a-14d, the percentages relate the assignablesquare footage of the specified program or subprogram to the totalassignable area for the institution. For Table 14, these percentagesshould in theory add to exactly 100.0, but in some cases they do notbecause of rounding. In Tables 14a-14d, the sum of the percentagesreported for the subprograms comprising a certain program should intheory equal the percentage for that program as reported in Table 14.Again, they sometimes do not because of the rounding of the subprogrampercentages.
86
93
PROGRAM DEFINITIONS
The descriptions of programs and subprograms which preccdeTables 14-14d are excerpted from Program Classification Structure:Technical Report 106 by Douglas J. Collier.
10 Instruction Program. This program includes activities carriedout for the express purpose of eliciting some measure of educa-tional change in a learner or group of learners. An instruc-tional activity need not be eligible for credit in meetingspecified formal curricular requirements leading to a postsec-ondary degree or certificate.
20 Research Program. Any activity intended to produce one or moreresearch outcomes--including the creation of knowledge, theorganization of knowledge, and the application of knowledge--isincluded within this program. A research activity may be con-ducted with institutional funds or under the terms of agreementwith an ,4ency external to the institution.
30 Public Service. The Public Service Program includes activitiesestablished to make available to the public the various resourcesand capabilities of the institution for the specific purpose ofresponding to a community need or solving a community problem.
40 Academic Support Program. Any activity carried out in directsupport of one or more of the Instruction (10), Research (20),and Public Service (30) Programs is classified as AcademicSupport.
50 Student Service Program. The objective of the Student ServiceProgram is to contribute to the emotional and physical well-beingof the students, as well as to their intellectual, cultural, andsocial development outside of the context of the institution'sformal Instruction Program.
60 Institutional Administration Program. This program consists ofthose activities carried out to provide for both the day-to-dayfunctioning and the long-range viability of the institution asan operating organization. The ultimate goal of the InstitutionalAdministrative Program is to provide for the institution'sorganizational effectiveness and continuity.
70 Physical Plant Operations Program. Activities related to main-taining existing grounds and facilities, providing utilityservices, and planning and designing future plant expansions andmodifications are included within the Physical Plant OperationsProgram.
87 94
80 Student Financial Support Program. This program includes onlythe financial assistance provided to students in the form ofoutright grants, trainee stipends, and prizes, awarded by and/oradministered through the institution. Although it is part ofthe Program Classification Structure, this program applies onlyto funds and not to space or activities. It is riot, therefore,used in facilities inxlentories.
90 Independent Operations Program. Those institutional activitiesthat are owned or controlled by the institution as investments,and which are financed as part of the institution's currentoperations, comprise the Independent Operations Program.
00 Unassigned. Facilities that are not in use at the time of theinventory are classified under this program. It is unique tofacilities management and is not included in the ProgramClassification Structure.
988
5
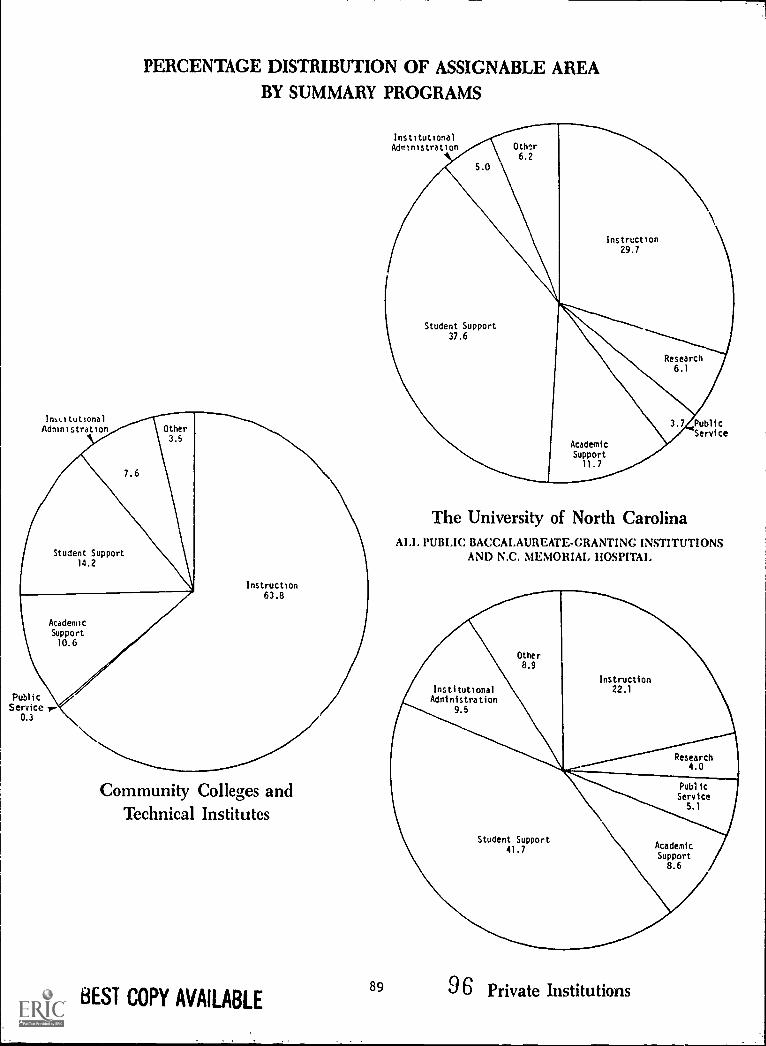
InitutionalAdministration
PERCENTAGE DISTRIBUTION OF ASSIGNABLE AREABY SUMMARY PROGRAMS
InstitutionalAdministration
PublicService
The University of North CarolinaALI. PUBLIC BACCALAUREATE-GRANTING INSTITUTIONS
AND N.C. MEMORIAL HOSPITAL
Instruction63.8
PublicService r
0.3
InstitutionalAdministration
9.5
Community Colleges andTechnical Institutes
BEST COPY AVAILABLE89 96 Private Institutions
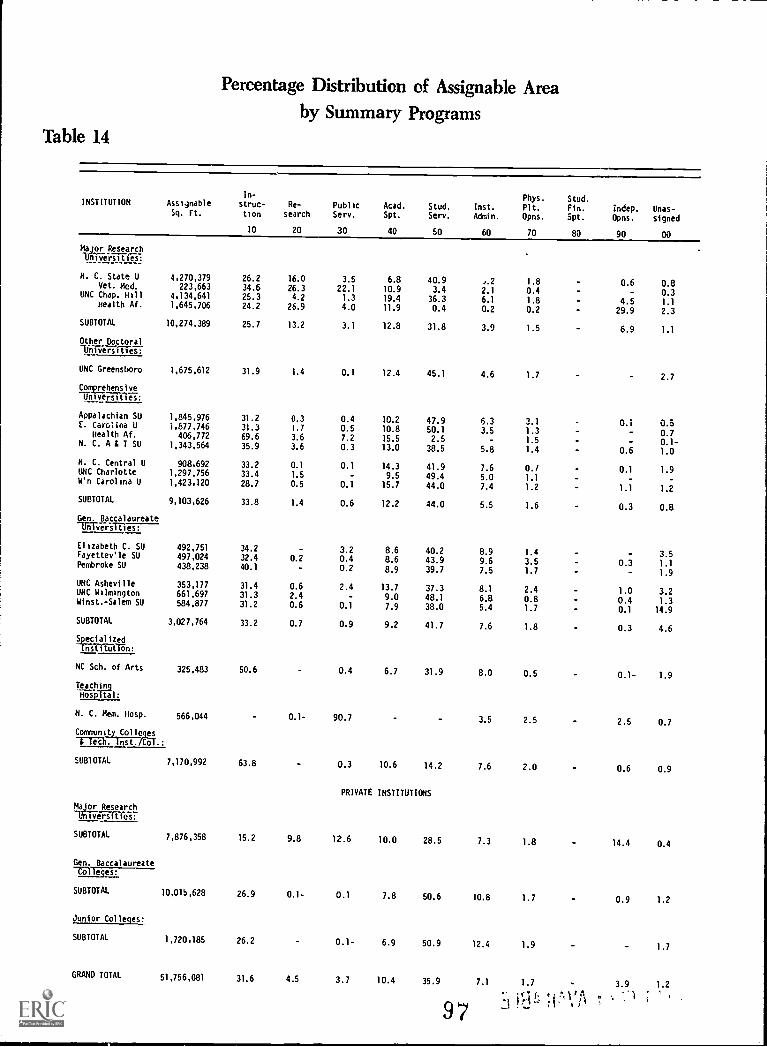
Percentage Distribution of Assignable Areaby Summary Programs
Table 14
INSTITUTION Assi.nableSq. Ft.
In-
struc-tion
10
Re-
search
20
PublicServ.
30
Acad.Spt.
40
Stud.Serv.
50
Inst.
Admin.
60
Phys. Stud.Plt. Fin.Opns. Spt.
70 80
indep.
Opns.
90
Unas-
signed
00
Major Research
N. C. State U 4,270,379 26.2 16.0 3.5 6.8 40.9 ,.2 1.8 0.6 0.8Vet. Med. 223,663 34.6 26.3 22.1 10.9 3.4 2.1 0.4 0.3UNC Chap. Hill 4,134,641 25.3 4.2 1.3 19.4 36.3 6.1 1.8 4.5 1.1Health Af. 1,645,706 24.2 26.9 4.0 11.9 0.4 0.2 0.2 29.9 2.3
SUBTOTAL 10,274,389 25.7 13.2 3.1 12.8 31.8 3.9 1.5 6.9 1.1
Other DoctoralFeT
UNC Greensboro 1,675,612 31.9 1.4 0.1 12.4 45.1 4.6 1.7 2.7
Con:I:pensiveThiveliiiies:
Appalachian SU 1.845,976 31.2 0.3 0.4 10.2 47.9 6.3 3.1 0.1 0.5E. Carolina U 1,877,746 31.3 1.7 0.5 10.8 50.1 3.5 1.3 - 0.7Health Af. 406,772 69.6 3.6 7.2 15.5 2.5 1.5 - 0.1-N. C. A i T SU 1.343.564 35.9 3.6 0.3 13.0 38.5 5.8 1.4 0.6 1.0
N. C. Central U 908,692 33.2 0.1 0.1 14.3 41.9 7.6 O./ 0.1 1.9UNC Charlotte 1,297,756 33.4 1.5 - 9.5 49.4 5.0 1.1 - -W'n Carolina U 1,423,120 28.7 0.5 0.1 15.7 44.0 7.4 1.2 1.1 1.2
SUBTOTAL 9,103,626 33.8 1.4 0.6 12.2 44.0 5.5 1.6 0.3 0.8
Gen. Baccalaureateuniversities:
Elizabeth C. SU 492.751 34.2 3.2 8.6 40.2 8.9 1.4 3.5Fayettev'le SU 497,024 32.4 0.2 0.4 8.6 43.9 9.6 3.5 0.3 1.1Pembroke SU 438.238 40.1 - 0.2 8.9 39.7 7.5 1.7 1.9
UNC Asheville 353.177 31.4 0.6 2.4 13.7 37.3 8.1 2.4 1.0 3.2UNC Wilmington 661,697 31.3 2.4 - 9.0 48.1 6.8 0.8 0.4 1.3Winst.-Salem SU 584,877 31.2 0.6 0.1 7.9 38.0 5.4 1.7 0.1 14.9
SUBTOTAL 3,027,764 33.2 0.7 0.9 9.2 41.7 7.6 1.8 0.3 4.6
§24;lalized-ITiltitT6n:
NC Sch. of Arts 325,483 50.6 0.4 6.7 31.9 8.0 0.5 0.1- 1.9
Teaching_
Hosprital:
N. C. Mem. Hosp. 566.044 0.1- 90.7 3.5 2.5 2.5 0.7
Community Collegesi fich.-1nst./Col.:
SUBTOTAL 7,170,992 63.8 - 0.3 10.6 14.2 7.6 2.0 0.6 0.9
PRIVATE INSTITUTIONS
M? or Researc
7,876,358 15.2 9.8 12.6 10.0 28.5 7.3 1.8 14.4 0.4
SUBTOTAL
Gen. Baccalaureate-Mieges:
SUBTOTAL 10,015,628 26.9 0.1- 0.1 7.8 50.6 10.8 1.7 0.9 1.2
Junior Colleges:
SUBTOTAL 1,720,185 26.2 0.1- 6.9 50.9 12.4 1.9 1.7
GRAND TOTAL 51,756,081 31.6 4.5 3.7 10.4 35.9 7.1 1.7 3.9 1.2
97It o "1 :?;
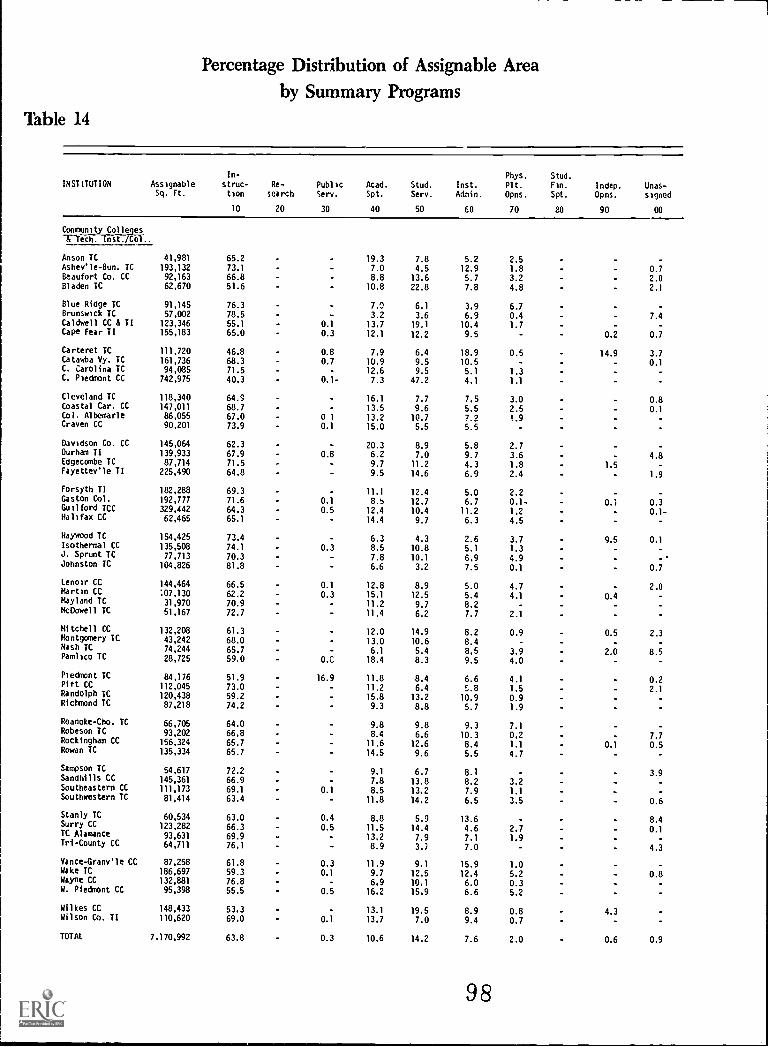
Percentage Distribution of Assignable Areaby Summary Programs
Table 14
INSTITUTION AssignableSq. Ft.
In-
strut-tion
10
Re- Publicsearch Serv.
20 30
Acad.
Spt.
40
Stud.
Serv.
50
Inst.
Admin.
CO
Phys. Stud.
Plt. Fin.
Opns. Spt.
70 80
Indep.
Opns.
90
Unas-signed
00
Community Colleges-&-Tech. fnst./C67..
Anson TC 41,981 65.2 19.3 7.8 5.2 2.5 -
Ashev'le -Bun. TC 193,132 73.1 7.0 4.5 12.9 1.8 0.7Beaufort Co. CC 92,163 66.8 8.8 13.6 5.7 3.2 2.0Bladen TC 62,670 51.6 10.8 22.8 7.8 4.8 2.1
Blue Ridge TC 91,145 76.3 7.0 6.1 3.9 6.7 -Brunswick TC 57,002 78.5 3.2 3.6 6.9 0.4 - 7.4Caldwell CC & TI 123,346 55.1 0.1 13.7 19.1 10.4 1.7 -Cape Fear II 155,183 65.0 0.3 12.1 12.2 9.5 0.2 0.7
Carteret TC 111,720 46.8 0.8 7.9 6.4 18.9 0.5 14.9 3.7Catawba Vy. TC 161,736 68.3 0.7 10.9 9.5 10.5 - 0.1C. Carolina TC 94,085 71.5 12.6 9.5 5.1 1.3 -C. Piedmont CC 742,975 40.3 0.1- 7.3 47.2 4.1 1.1
Cleveland TC 118,340 64.9 16.1 7.7 7.5 3.0 0.8Coastal Car. CC 147,011 68.7 13.5 9.6 5.5 2.5 0.1Col. Albemarle 86,055 67.0 0 1 13.2 10.7 7.2 1.9Craven CC 90,201 73.9 0.1 15.0 5.5 5.5
Davidson Co. CC 145,064 62.3 20.3 8.9 5.8 2.7Durham II 139,933 67.9 0.8 6.2 7.0 9.7 3.6 4.8Edgecombe TC 87,714 71.5 9.7 11.2 4.3 1.8 1.5Fayettevle II 225,490 64.8 9.5 14.6 6.9 2.4 1.9
Forsyth II 182,288 69.3 11.1 12.4 5.0 2.2Gaston Col. 192,777 71.6 0.1 8.5 12.7 6.7 0.1- 0.1 0.3Guilford TCC 329,442 64.3 0.5 12.4 10.4 11.2 1.2 0.1-Halifax CC 62,465 65.1 14.4 9.7 6.3 4.5
Haywood TC 154,425 73.4 6.3 4.3 2.6 3.7 9.5 0.1Isothermal CC 135,508 74.1 0.3 8.5 10.8 5.1 1.3J. Sprunt TC 77,713 70.3 7.8 10.1 6.9 4.9 -Johnston TC 104,826 81.8 6.6 3.2 7.5 0.1 0.7
Lenoir CC 144,464 66.5 0.1 12.8 8.9 5.0 4.7 2.0Martin CC :07,130 62.2 0.3 15.1 12.5 5.4 4.1 0.4Wayland TC 31,970 70.9 11.2 9.7 8.2 -McDowell TC 51,167 72.7 11.4 6.2 7.7 2.1
Mitchell CC 132,208 61.3 12.0 14.9 8.2 0.9 0.5 2.3Montgomery TC 43,242 68.0 - 13.0 10.6 8.4 -Nash TC 74,244 65.7 - 6.1 5.4 8.5 3.9 2.0 8.5Pamlico TC 28,725 59.0 0.0 18.4 8.3 9.5 4.0
Piedmont TC 84,176 51.9 16.9 11.8 8.4 6.6 4.1 0.2Pitt CC 112,045 73.0 - 11.2 6.4 S.8 1.5 2.1Randolph 7C 120,438 59.2 15.8 13.2 10.9 0.9Richmond TC 87,218 74.2 9.3 8.8 5.7 1.9
Roanoke-Cho. TC 66,705 64.0 9.8 9.8 9.3 7.1Robeson TC 93,202 66.8 8.4 6.6 10.3 0.2 7.7Rockingham CC 156,324 65.7 11.6 12.6 8.4 1.1 0.1 0.5Rowan TC 135,334 65.7 14.5 9.6 5.5 4.7
Sampson TC 54,617 72.2 9.1 6.7 8.1 - 3.9Sandhills CC 145,361 66.9 7.8 13.8 8.2 3.2Southeastern CC 111,173 69.1 0.1 8.5 13.2 7.9 1.1Southwestern TC 81,414 63.4 11.8 14.2 6.5 3.5 0.6
Stanly TC 60,534 63.0 0.4 8.8 5.9 13.6 - 8.4Surry CC 123,282 66.3 0.5 11.5 14.4 4.6 2.7 0.1TC Alamance 93,631 69.9 - 13.2 7.9 7.1 1.9Tri-County CC 64,711 76.1 - 8.9 3.7 7.0 - 4.3
Vance-Granv'le CC 87,258 61.8 0.3 11.9 9.1 15.9 1.0Wake TC 186,697 59.3 0.1 9.7 12.5 12.4 5.2 0.8Wayne CC 132,881 76.8 - 6,9 10.1 6.0 0.3W. Piedmont CC 95,398 55.5 0.5 16.2 15.9 6.6 5.2
Wilkes CC 148,433 53.3 13.1 19.5 8.9 0.8 4.3Wilson Co. TI 110,620 69.0 0.1 13.7 7.0 9.4 0.7
TOTAL 7,170,992 63.8 0.3 10.6 14.2 7.6 2.0 0.6 0.9
98
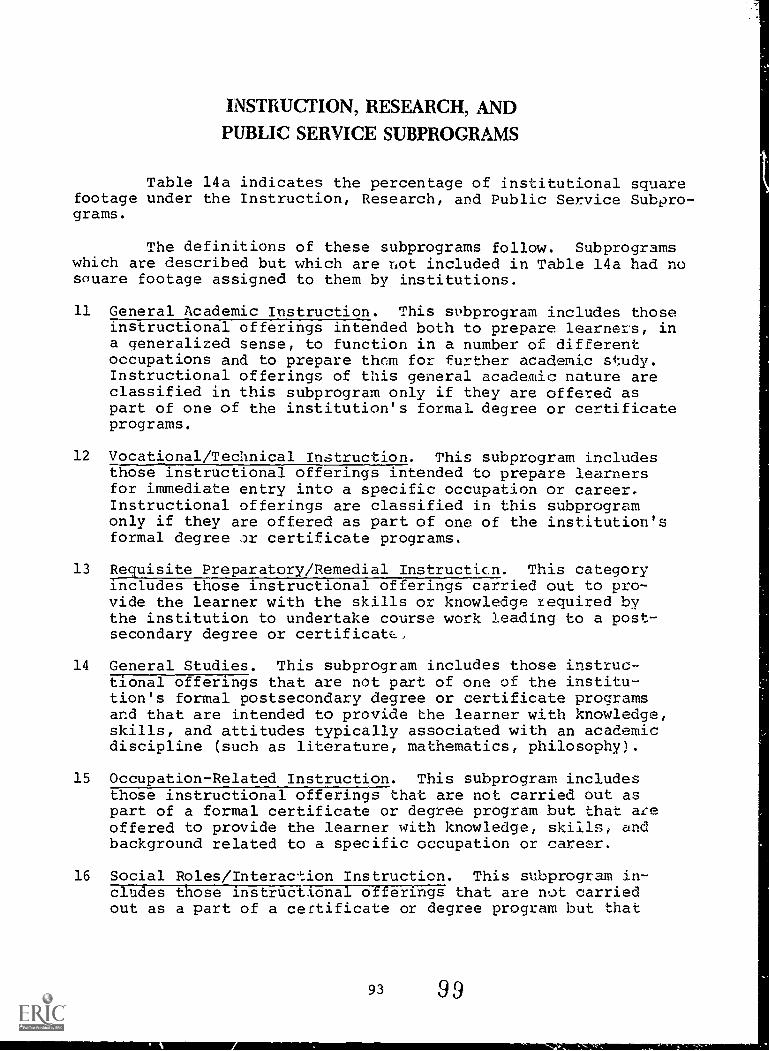
INSTRUCTION, RESEARCH, ANDPUBLIC SERVICE SUBPROGRAMS
Table 14a indicates the percentage of institutional squarefootage under the Instruction, Research, and Public Service Subpro-grams.
The definitions of these subprograms follow. Subprogramswhich are described but which are riot included in Table 14a had nosouare footage assigned to them by institutions.
11 General Academic Instruction. This subprogram includes thoseinstructional offerings intended both to prepare learners, ina generalized sense, to function in a number of differentoccupations and to prepare them for further academic study.Instructional offerings of this general academic nature areclassified in this subprogram only if they are offered aspart of one of the institution's formal degree or certificateprograms.
12 Vocational/Technical Instruction. This subprogram includesthose instructional offerings intended to prepare learnersfor immediate entry into a specific occupation or career.Instructional offerings are classified in this subprogramonly if they are offered as part of one of the institution'sformal degree certificate programs.
13 Requisite Preparatory/Remedial Instruction. This categoryincludes those instructional offerings carried out to pro-vide the learner with the skills or knowledge required bythe institution to undertake course work leading to a post-secondary degree or certificate..
14 General Studies. This subprogram includes those instruc-tional offerings that are not part of one of the institu-tion's formal postsecondary degree or certificate programsand that are intended to provide the learner with knowledge,skills, and attitudes typically associated with an academicdiscipline (such as literature, mathematics, philosophy).
15 Occupation-Related Instruction. This subprogram includesthose instructional offerings that are not carried out aspart of a formal certificate or degree program but that ateoffered to provide the learner with knowledge, skills, andbackground related to a specific occupation or career.
16 Social Roles/Interaction Instruction. This subprogram in-cludes those instructional offerings that are not carriedout as a part of a certificate or degree program but that
93 99
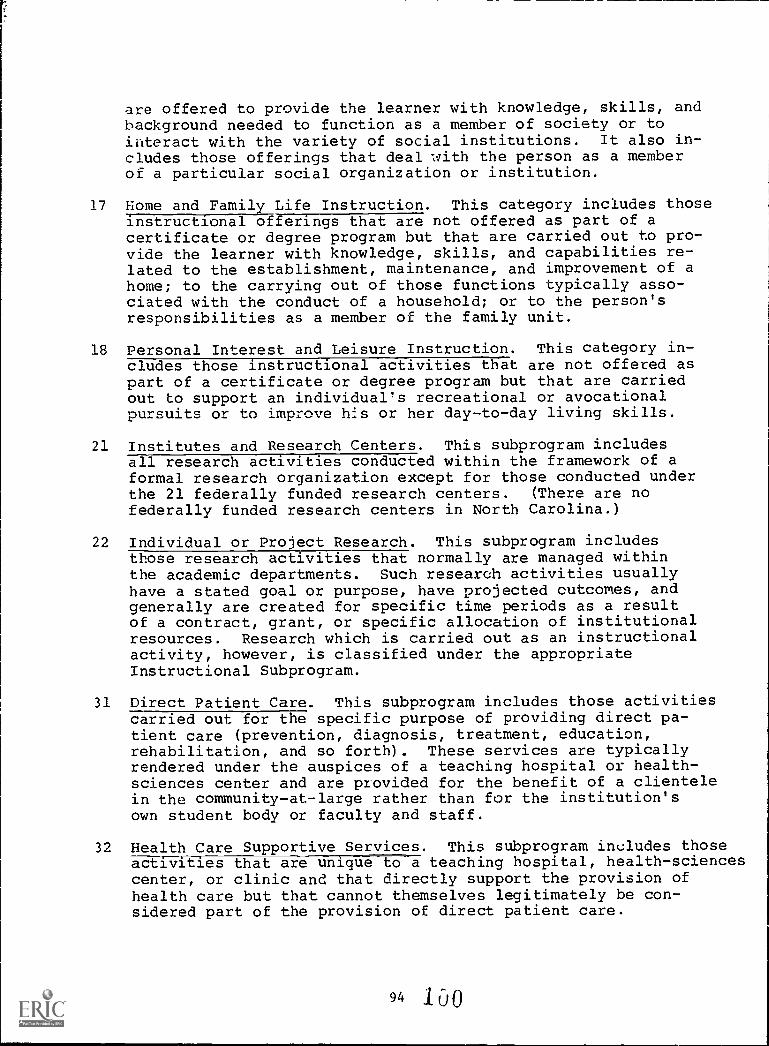
are offered to provide the learner with knowledge, skills, andbackground needed to function as a member of society or tointeract with the variety of social institutions. It also in-cludes those offerings that deal with the person as a memberof a particular social organization or institution.
17 Home and Family Life Instruction. This category includes thoseinstructional offerings that are not offered as part of acertificate or degree program but that are carried out to pro-vide the learner with knowledge, skills, and capabilities re-lated to the establishment, maintenance, and improvement of ahome; to the carrying out of those functions typically asso-ciated with the conduct of a household; or to the person'sresponsibilities as a member of the family unit.
18 Personal Interest and Leisure Instruction. This category in-cludes those instructional activities that are not offered aspart of a certificate or degree program but that are carriedout to support an individual's recreational or avocationalpursuits or to improve hls or her day-to-day living skills.
21 Institutes and Research Centers. This subprogram includesall research activities conducted within the framework of aformal research organization except for those conducted underthe 21 federally funded research centers. (There are nofederally funded research centers in North Carolina.)
22 Individual or Project Research. This subprogram includesthose research activities that normally are managed withinthe academic departments. Such research activities usuallyhave a stated goal or purpose, have projected outcomes, andgenerally are created for specific time periods as a resultof a contract, grant, or specific allocation of institutionalresources. Research which is carried out as an instructionalactivity, however, is classified under the appropriateInstructional Subprogram.
31 Direct Patient Care. This subprogram includes those activitiescarried out for the specific purpose of providing direct pa-tient care (prevention, diagnosis, treatment, education,rehabilitation, and so forth). These services are typicallyrendered under the auspices of a teaching hospital or health-sciences center and are provided for the benefit of a clientelein the community-at-large rather than for the institution'sown student body or faculty and staff.
32 Health Care Supportive Services. This subprogram includes thoseactivities that are unique to a teaching hospital, health-sciencescenter, or clinic and that directly support the provision ofhealth care but that cannot themselves legitimately be con-sidered part of the provision of direct patient care.
94 1 00
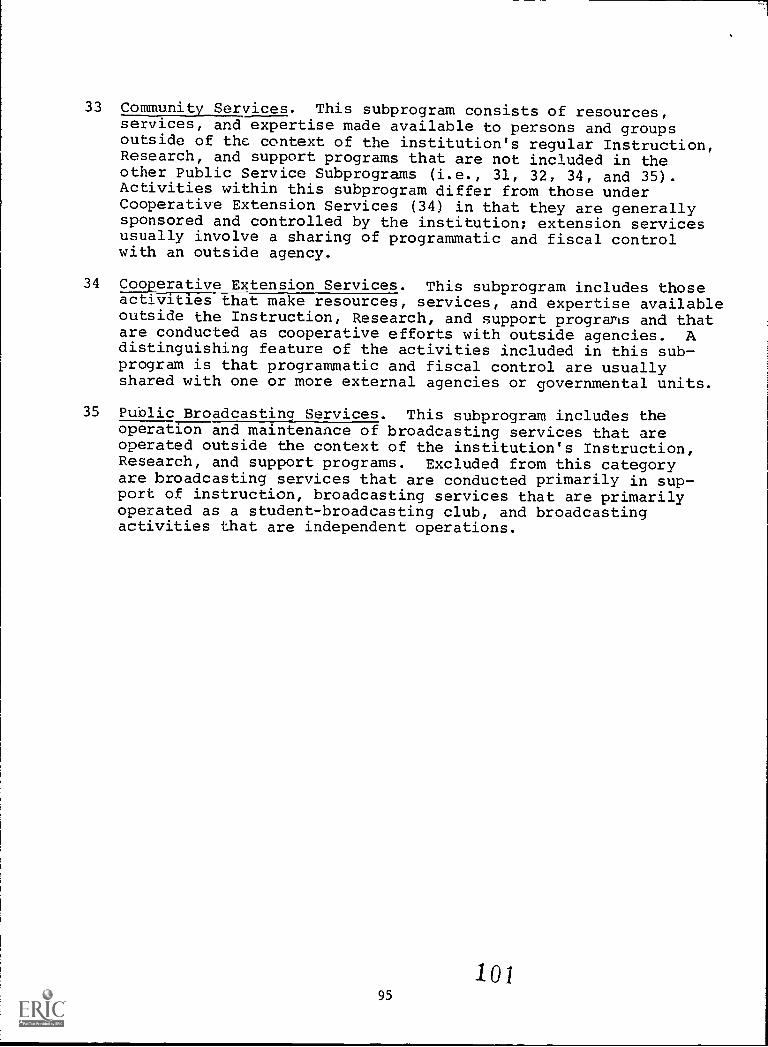
33 Community Services. This subprogram consists of resources,services, and expertise made available to persons and groupsoutside of the context of the institution's regular Instruction,Research, and support programs that are not included in theother Public Service Subprograms (i.e., 31, 32, 34, and 35).Activities within this subprogram differ from those underCooperative Extension Services (34) in that they are generallysponsored and controlled by the institution; extension servicesusually involve a sharing of programmatic and fiscal controlwith an outside agency.
34 Cooperative Extension Services. This subprogram includes thoseactivities that make resources, services, and expertise availableoutside the Instruction, Research, and support programs and thatare conducted as cooperative efforts with outside agencies. Adistinguishing feature of the activities included in this sub-program is that programmatic and fiscal control are usuallyshared with one or more external agencies or governmental units.
35 Public Broadcasting Services. This subprogram includes theoperation and maintenance of broadcasting services that areoperated outside the context of the institution's Instruction,Research, and support programs. Excluded from this categoryare broadcasting services that are conducted primarily in sup-port of instruction, broadcasting services that are primarilyoperated as a student-broadcasting club, and broadcastingactivities that are independent operations.
10195
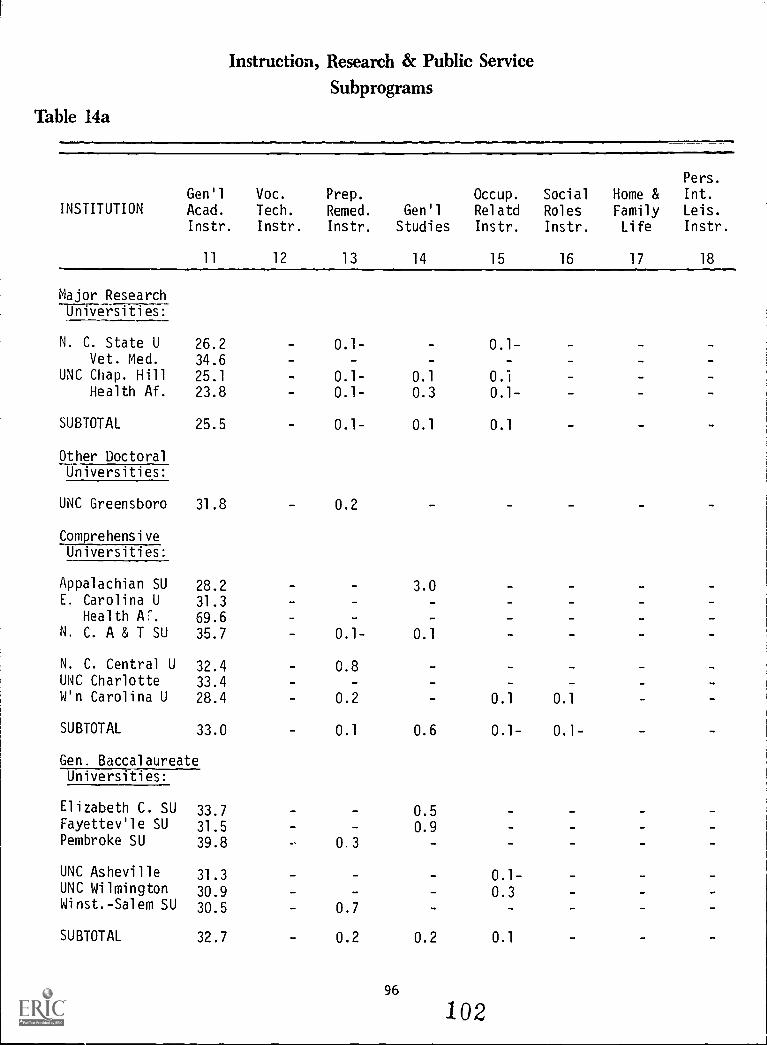
Instruction, Research & Public ServiceSubprograms
Table 14a
Gen'lINSTITUTION Acad.
Instr.
Voc.
Tech.
Instr.
Prep.
Remed.
Instr.
Gen'l
Studies
Occup.
RelatdInstr.
Social
Roles
Instr.
Home &FamilyLife
Pers.
Int.
Leis.
Instr.
11 12 13 14 15 16 17 18
Major ResearchUniversities:
N. C. State U 26.2 0.1- - 0.1-Vet. Med. 34.6
UNC Chap. Hill 25.1 - 0.1- 0.1 0.1
Health Af. 23.8 - 0.1- 0.3 0.1-
SUBTOTAL 25.5 0.1- 0.1 0.1
Other DoctoralUniversities:
UNC Greensboro 31.8 0.2
ComprehensiveUniversities:
Appalachian SU 28.2 3.0E. Carolina U 31.3
Health A. 69.6N. C. A & T SU 35.7 _ 0.1- 0.1 _
N. C. Central U 32.4 0.8UNC Charlotte 33.4W'n Carolina U 28.4 0.2 0.1 0.1
SUBTOTAL 33.0 0.1 0.6 0.1- 0.1-
Gen. BaccalaureateUniversities:
Elizabeth C. SU 33.7 - 0.5Fayettev'le SU 31.5 0.9Pembroke SU 39.8 0.3
UNC Asheville 31.3 - 0.1-UNC Wilmington 30.9 - 0.3Winst.-Salem SU 30.5 0.7
SUBTOTAL 32.7 0.2 0.2 0.1
96
102
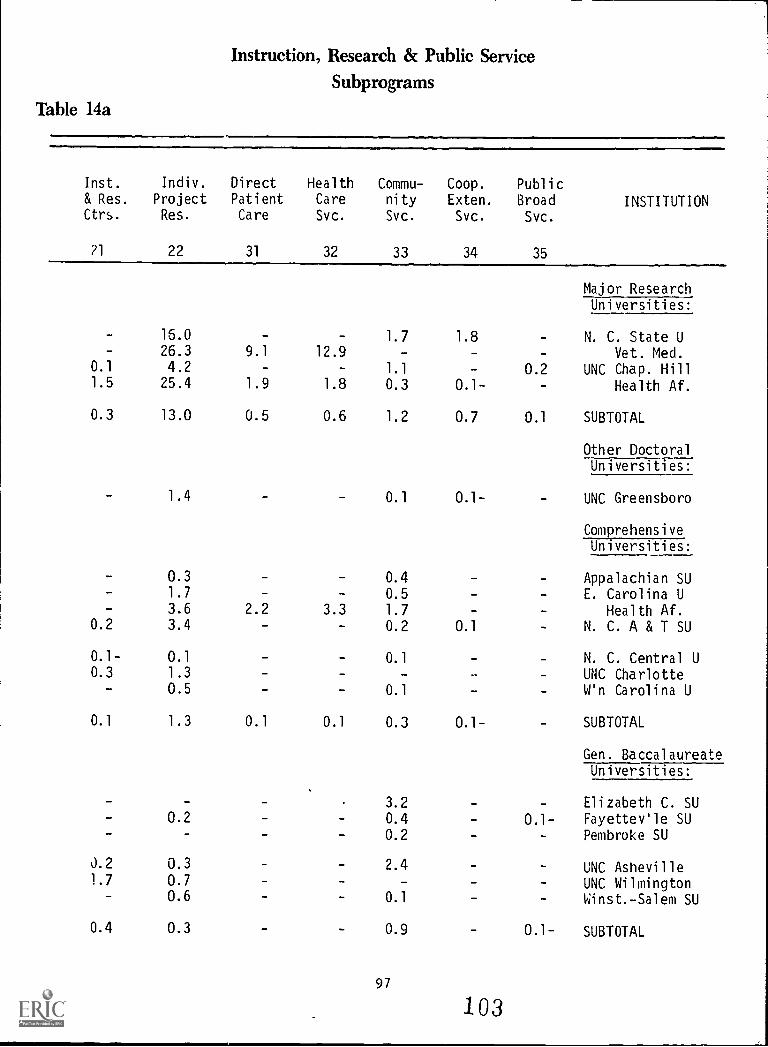
Instruction, Research & Public ServiceSubprograms
Table 14a
Inst.
& Res.
Ctrs.
21
Indiv.
ProjectRes.
22
DirectPatientCare
31
HealthCare
Svc.
32
Commu-nity
Svc.
33
Coop.
Exten.
Svc.
34
PublicBroadSvc.
35
INSTITUTION
Major ResearchUniversities:
16.0 - 1.7 1.8 N. C. State U26.3 9.1 12.9 - - Vet. Med.
0.1 4.2 1.1 - 0.2 UNC Chap. Hill1.5 25.4 1.9 1.8 0.3 0.1- Health Af.
0.3 13.0 0.5 0.6 1.2 0.7 0.1 SUBTOTAL
Other DoctoralUniversities:
1.4 0.1 0.1- UNC Greensboro
ComprehensiveUniversities:
0.3 0.4 - Appalachian SU1.7 0.5 - E. Carolina U3.6 2.2 3.3 1.7 Health Af.
0.2 3.4 0.2 0.1 N. C. A & T SU
0.1- 0.1 0.1 - N. C. Central U0.3 1.3 UNC Charlotte
0.5 0.1 - W'n Carolina U
0.1 1.3 0.1 0.1 0.3 0.1- SUBTOTAL
Gen. BaccalaureateUniversities:
- 3.2 Elizabeth C. SU0.2 - 0.4 - 0.1- Fayettev'le SU
- 0.2 Pembroke SU
0.2 0.3 2.4 - UNC Asheville1.7 0.7 UNC Wilmington
- 0.6 0.1 Winst.-Salem SU
0.4 0.3 - 0.9 0.1- SUBTOTAL
97
103
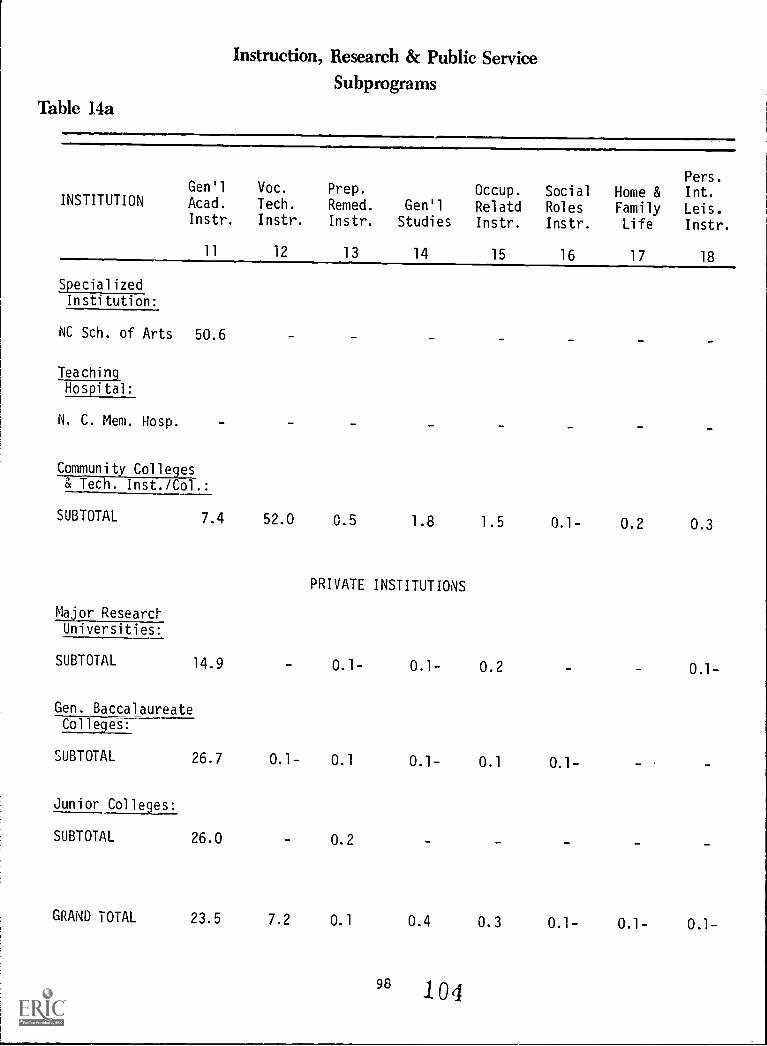
Table 14a
Instruction, Research & Public Service
Subprograms
Pers.Gen'l Voc. Prep. Occup. Social Home & Int.
INSTITUTION Acad. Tech. Remed. Gen'l Relatd Roles Family Leis.Instr. Instr. Instr. Studies Instr. Instr. Life Instr.
11 12 13 14 15 16 17 18
SpecializedInstitution:
NC Sch. of Arts 50.6
TeachingHospital:
N. C. Mem. Hosp.
Community Colleges"di Tech. Inst./Col.:
SUBTOTAL 7.4 52.0 0.5 1.8 1.5 0.1- 0.2 0.3
PRIVATE INSTITUTIONS
Major Research
Universities:
SUBTOTAL 14.9 - 0.1- 0.1- 0.2 - 0.1-
Gen. BaccalaureateColleges:
SUBTOTAL 26.7 0.1- 0.1 0.1- 0.1 0.1-
Junior Colleges:
SUBTOTAL 26.0 0.2
GRAND TOTAL 23.5 7.2 0.1 0.4 0.3 0.1- 0.1- 0.1-
98 104
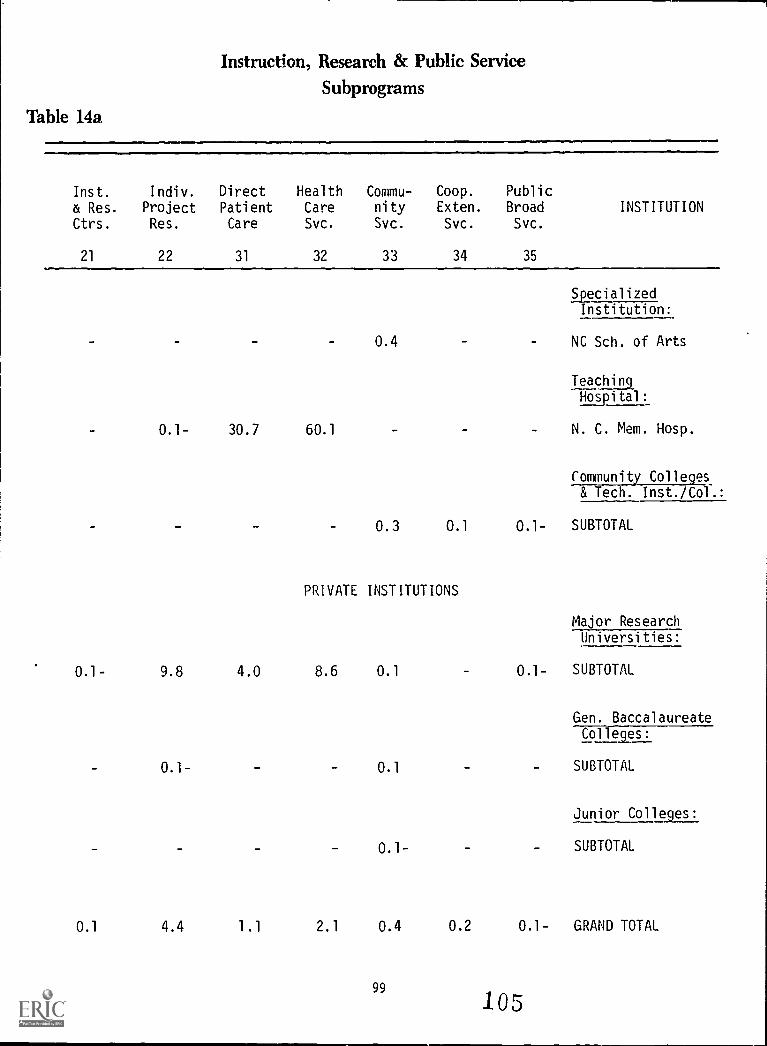
Instruction, Research & Public ServiceSubprograms
Table 14a
Inst. Indiv. Direct Health Commu- Coop. Public
& Res. Project Patient Care nity Exten. Broad
Ctrs. Res. Care Svc. Svc. Svc. Svc.
21 22 31 32 33 34 35
INSTITUTION
SpecializedInstitution:
0.4 NC Sch. of Arts
Teaching,
Hospital:
- 0.1- 30.7 60.1 N. C. Mem. Hosp.
Community Colleges& Tech. Inst./Col.:
0.3 0.1 0.1- SUBTOTAL
PRIVATE INSTITUTIONS
Major ResearchUniversities:
0.1- 9.8 4.0 8.6 0.1 0.1- SUBTOTAL
Gen. BaccalaureateColleges:
0.1- - 0.1 SUBTOTAL
Junior Colleges:
- - - 0.1- SUBTOTAL
0.1 4.4 1.1 2.1 0.4 0.2 0.1- GRAND TOTAL
99
105
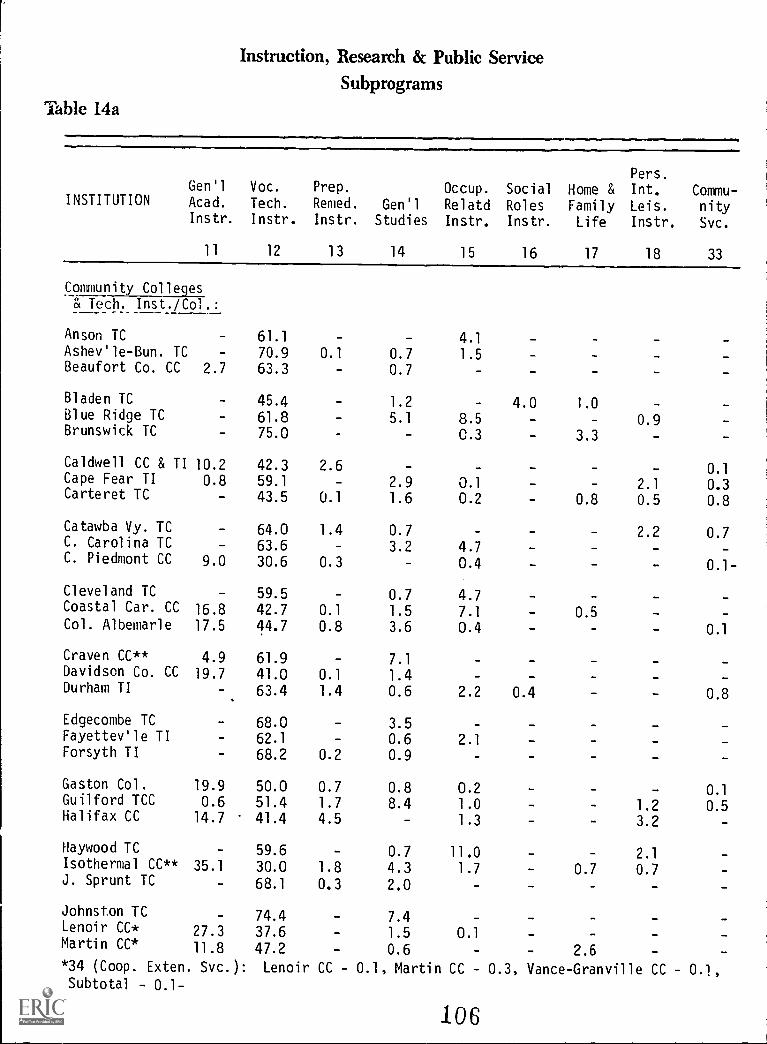
Instruction, Research & Public ServiceSubprograms
Table 14a
Gen'l Voc.INSTITUTION Acad. Tech.
Instr. Instr.
Prep.
Reined.
Instr.
Gen'l
Studies
Pers.Occup. Social Home & Int. Commu-Relatd Roles Family Leis. nityInstr. Instr. Life Instr. Svc.
11 12 13 14 15 16 17 18 33
Community Colleges« Tech. Inst./Col.:
Anson TC 61.1 4.1Ashev'le-Bun. TC 70.9 0.1 0.7 1.5Beaufort Co. CC 2.7 63.3 0.7
Bladen TC 45.4 1.2 4.0 1.0Blue Ridge TC 61.8 5.1 8.5 0.9Brunswick TC 75.0 0.3 - 3.3
Caldwell CC & TI 10.2 42.3 2.6 - - 0.1Cape Fear TI 0.8 59.1 2.9 0.1 - 2.1 0.3Carteret TC - 43.5 0.1 1.6 0.2 - 0.8 0.5 0.8
Catawba Vy. TC 64.0 1.4 0.7 - .. 2.2 0.7C. Carolina TC 63.6 3.2 4.7C. Piedmont CC 9.0 30.6 0.3 0.4 - - 0.1-
Cleveland TC 59.5 0.7 4.7Coastal Car. CC 16.8 42.7 0.1 1.5 7.1 - 0.5Col. Albemarle 17.5 44.7 0.8 3.6 0.4 _ 0.1
Craven CC** 4.9 61.9 7.1Davidson Co. CC 19.7 41.0 0.1 1.4 -Durham TI 63.4 1.4 0.6 2.2 0.4 0.8
Edgecombe TC 68.0 3.5 - -Fayettev'le TI 62.1 0.6 2.1 -Forsyth TI 68.2 0.2 0.9
Gaston Col. 19.9 50.0 0.7 0.8 0.2 - - 0.1Guilford TCC 0.6 51.4 1.7 8.4 1.0 - 1.2 0.5Halifax CC 14.7 41.4 4.5 1.3 3.2
Haywood TC 59.6 0.7 11.0 - 2.1Isothermal CC** 35.1 30.0 1.8 4.3 1.7 - 0.7 0.7J. Sprunt TC - 68.1 0.3 2.0
Johnston TC - 74.4 - 7.4Lenoir CC* 27.3 37.6 - 1.5 0.1Martin CC* 11.8 47.2 - 0.6 - 2.6 -
*34 (Coop. Exten. Svc.): Lenoir CC 0.1, Martin CC - 0.3, Vance-Granville CC - 0.1,Subtotal - 0.1-
106
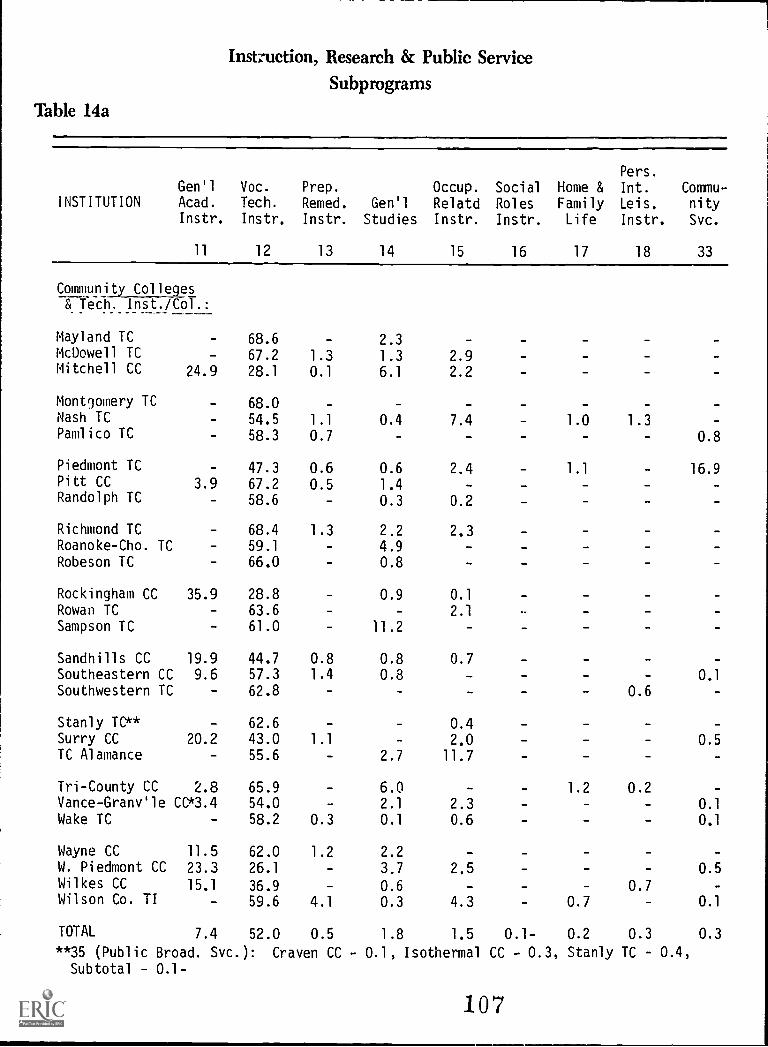
Instzuction, Research & Public ServiceSubprograms
Table 14a
Gen'lINSTITUTION Acad.
Instr.
Voc.
Tech.
Instr.
Prep.
Remed.
Instr.
Gen'l
Studies
Occup. Social
Relatd RolesInstr. Instr.
Home &FamilyLife
Pers.
Int. Commu-Leis. nityInstr. Svc.
11 12 13 14 15 16 17 18 33
Canuunitx Colleges& Tech. Inst./Col.:
Mayland TC 68.6 2.3McDowell TC 67.2 1.3 1.3 2.9Mitchell CC 24.9 28.1 0.1 6.1 2.2
Montgomery TC 68.0Nash TC 54.5 1.1 0.4 7.4 1.0 1.3Pamlico TC 58.3 0.7 0.8
Piedmont TC 47.3 0.6 0.6 2.4 1.1 16.9Pitt CC 3.9 67.2 0.5 1.4Randolph TC 58.6 0.3 0.2
Richmond TC 68.4 1.3 2.2 2.3Roanoke-Cho. TC 59.1 4.9Robeson TC 66.0 0.8
Rockingham CC 35.9 28.8 0.9 0.1
Rowan TC 63.6 2.1 .4P
Sampson TC 61.0 11.2
Sandhills CC 19.9 44.7 0.8 0.8 0.7Southeastern CC 9.6 57.3 1.4 0.8 - 0.1
Southwestern TC - 62.8 - 0.6
Stanly IC" - 62.6 0.4Surry CC 20.2 43.0 1.1 2.0 0.5TC Alamance 55.6 2.7 11.7
Tri-County CC 2.8 65.9 6.0 1.2 0.2Vance- Granv'le CC*3.4 54.0 2.1 2.3 - 0.1
Wake TC - 58.2 0.3 0.1 0.6 0.1
Wayne CC 11.5 62.0 1.2 2.2 -
W. Piedmont CC 23.3 26.1 3.7 2.5 - 0.5Wilkes CC 15.1 36.9 0.6 - 0.7Wilson Co. TI - 59.6 4.1 0.3 4.3 0.7 0.1
TOTAL 7.4 52.0 0.5 1.8 1.5 0.1- 0.2 0.3 0.3
* *35 (Public Broad. Svc.): Craven CC - 0.1, Isothermal CC - 0.3, Stanly TC 0.4,
Subtotal - 0.1-
107
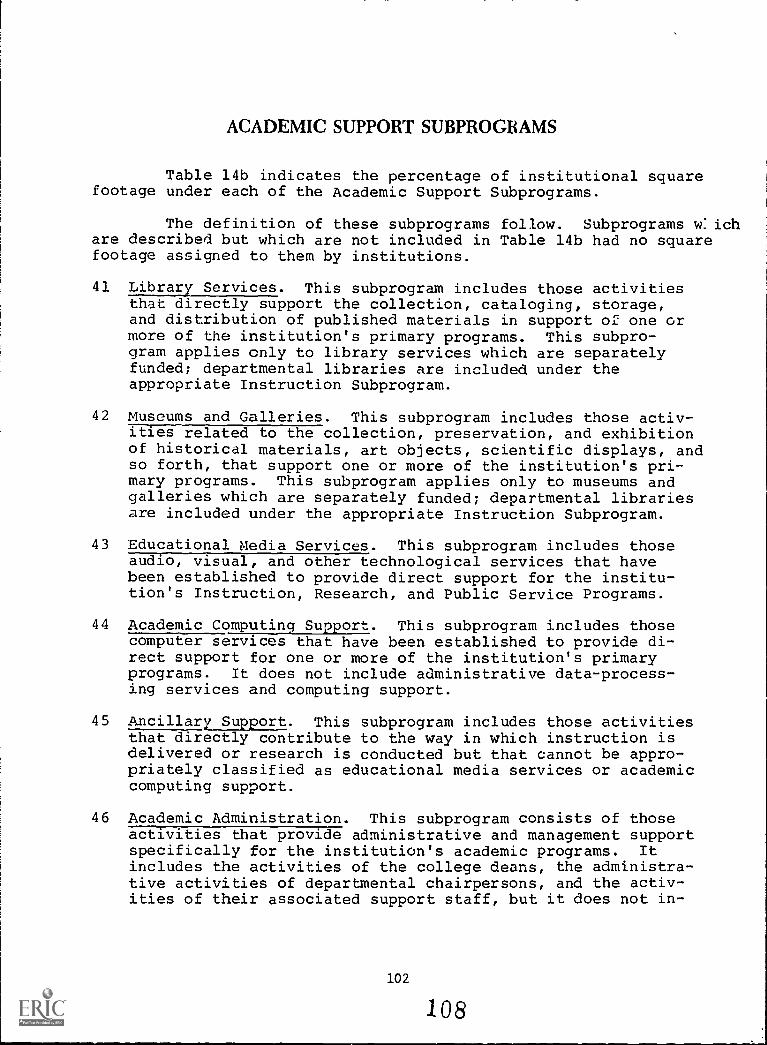
ACADEMIC SUPPORT SUBPROGRAMS
Table 14b indicates the percentage of institutional squarefootage under each of the Academic Support Subprograms.
The definition of these subprograms follow. Subprograms whichare described but which are not included in Table 14b had no squarefootage assigned to them by institutions.
41 Library Services. This subprogram includes those activitiesthat directly support the collection, cataloging, storage,and distribution of published materials in support of one ormore of the institution's primary programs. This subpro-gram applies only to library services which are separatelyfunded; departmental libraries are included under theappropriate Instruction Subprogram.
42 Museums and Galleries. This subprogram includes those activ-ities related to the collection, preservation, and exhibitionof historical materials, art objects, scientific displays, andso forth, that support one or more of the institution's pri-mary programs. This subprogram applies only to museums andgalleries which are separately funded; departmental librariesare included under the appropriate Instruction Subprogram.
43 Educational Media Services. This subprogram includes thoseaudio, visual, and other technological services that havebeen established to provide direct support for the institu-tion's Instruction, Research, and Public Service Programs.
44 Academic Computing Support. This subprogram includes thosecomputer services that have been established to provide di-rect support for one or more of the institution's primaryprograms. It does not include administrative data-process-ing services and computing support.
45 Ancillary Support. This subprogram includes those activitiesthat directly contribute to the way in which instruction isdelivered or research is conducted but that cannot be appro-priately classified as educational media services or academiccomputing support.
46 Academic Administration. This subprogram consists of thoseactivities that provide administrative and management supportspecifically for the institution's academic programs. Itincludes the activities of the college deans, the administra-tive activities of departmental chairpersons, and the activ-ities of their associated support staff, but it does not in-
102
108
clude the activities of those whose responsibilities are insti-tution-wide and involve duties outside of the academic realm.
47 Course and Curriculum Development. This subprogram includesonly those formal planning and development activities estab-lished either to improve or to add to the institution'scurriculum. Those activities that individual faculty memberscarry out to update and improve their current- course offeringsare included under the appropriate Instruction Subprogram.
48 Academic Personnel Development. This subprogram includesthose activities that provide the faculty with opportunitiesfog personal and professio.dal growth and development, aswell as those activities intended to evaluate and reward theprofessional performance of the faculty.
103 109
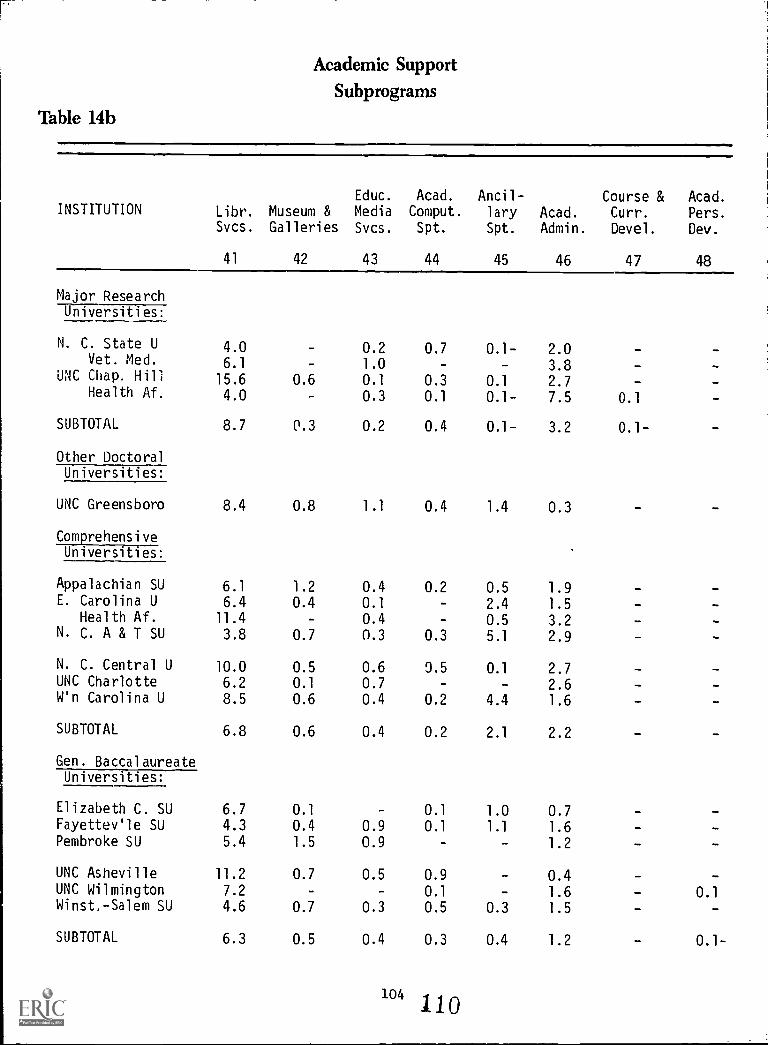
Academic SupportSubprograms
Table 14b
INSTITUTION Libr.
Svcs.Museum &Galleries
Educ.
Media
Svcs.
Acad.
Comput.
Spt.
Ancil-lary
Spt.
Acad.
Admin.
Course &Curr.
Devel.
Acad.
Pers.
Dev.
41 42 43 44 45 46 47 48
Major ResearchUniversities:
N. C. State U 4.0 0.2 0.7 0.1- 2.0Vet. Med. 6.1 1.0 3.8 -
UNC Chap. Hill 15.6 0.6 0.1 0.3 0.1 2.7Health Af. 4.0 0.3 0.1 0.1- 7.5 0.1
SUBTOTAL 8.7 0.3 0.2 0.4 0.1- 3.2 0.1-
Other DoctoralUniversities:
UNC Greensboro 8.4 0.8 1.1 0.4 1.4 0.3
ComprehensiveUniversities:
Appalachian SU 6.1 1.2 0.4 0.2 0.5 1.9E. Carolina U 6.4 0.4 0.1 2.4 1.5
Health Af. 11.4 - 0.4 0.5 3.2N. C. A & T SU 3.8 0.7 0.3 0.3 5.1 2.9
N. C. Central U 10.0 0.5 0.6 0.5 0.1 2.7UNC Charlotte 6.2 0.1 0.7 2.6W'n Carolina U 8.5 0.6 0.4 0.2 4.4 1.6
SUBTOTAL 6.8 0.6 0.4 0.2 2.1 2.2
Gen. BaccalaureateUniversities:
Elizabeth C. SU 6.7 0.1 0.1 1.0 0.7Fayettev'le SU 4.3 0.4 0.9 0.1 1.1 1.6Pembroke SU 5.4 1.5 0.9 1.2
UNC Asheville 11.2 0.7 0.5 0.9 0.4UNC Wilmington 7.2 0.1 1.6 - 0.1Winst.-Salem SU 4.6 0.7 0.3 0.5 0.3 1.5
SUBTOTAL 6.3 0.5 0.4 0.3 0.4 1.2 - 0.1-
1041 1 0
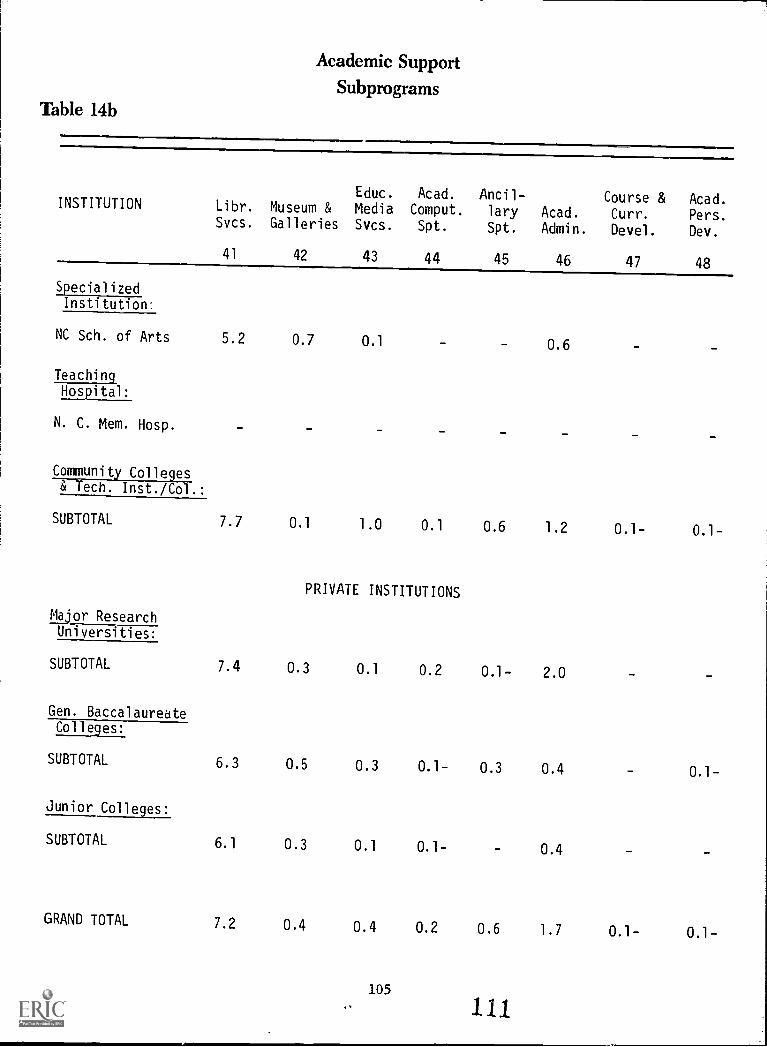
Academic SupportSubprograms
Table 14b
INSTITUTIONEduc. Acad. Ancil- Course & Acad.
Libr. Museum & Media Comput. lary Acad. Curr. Pers.Svcs. Galleries Svcs. Spt. Spt. Admin. Devel. Dev.
41 42 43 44 45 46 47 48
SpecializedInstitution:
NC Sch. of Arts
TeachingHospital:_
N. C. Mem. Hosp.
Community Colleges& Tech. Inst./Col.:
5.2 0.7 0.1 0.6
SUBTOTAL 7.7 0.1 1.0 0.1 0.6 1.2 0.1- 0.1-
PRIVATE INSTITUTIONS
Major Research
Universities:
SUBTOTAL 7.4 0.3 0.1 0.2 0.1- 2.0
Gen. BaccalaureateColleges:
SUBTOTAL 6.3 0.5 0.3 0.1- 0.3 0.4 0.1-
Junior Colleges:
SUBTOTAL 6.1 0.3 0.1 0.1- 0.4
GRAND TOTAL 7.2 0.4 0.4 0.2 0.6 1.7 0.1- 0.1-
105
111
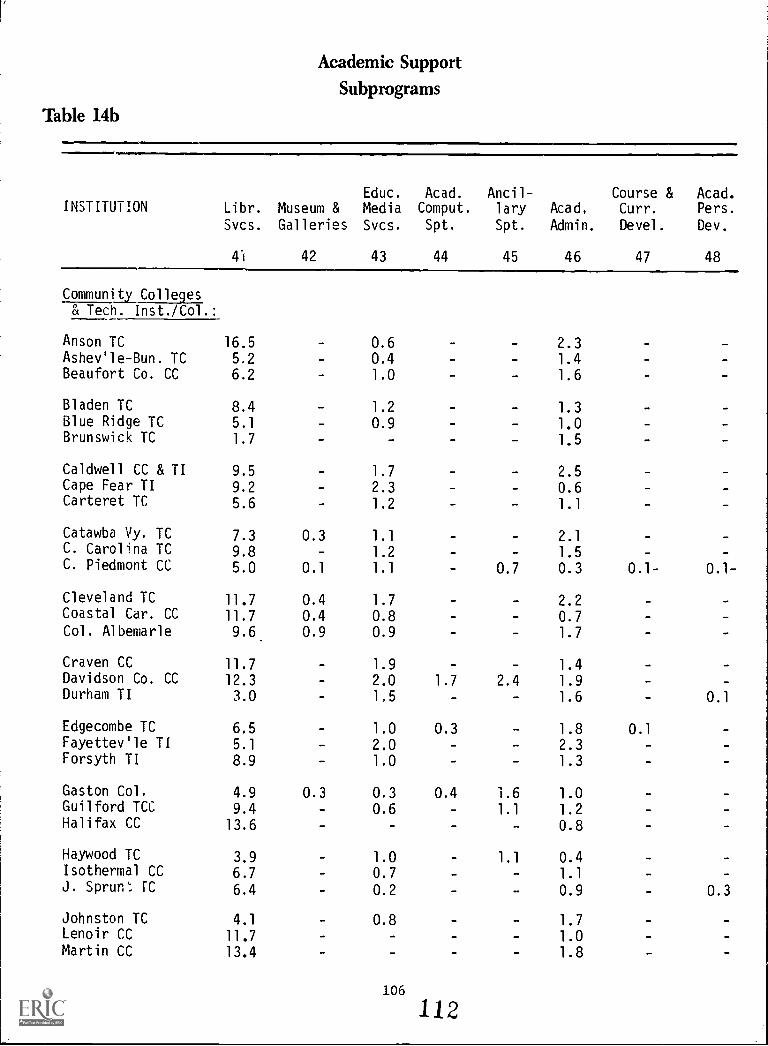
Academic SupportSubprograms
Table 14b
INSTITUTIONEduc. Acad. Ancil- Course & Acad.
Libr. Museum & Media Comput. lary Acad, Curr. Pers.
Svcs. Galleries Svcs. Spt. Spt. Admin. Devel. Dev.
4"1 42 43 44 45 46 47 48
Community Colleges& Tech. Inst./Col.:
Anson TC 16.5 0.6 2.3Ashev'le-Bun. TC 5.2 0.4 - 1.4Beaufort Co. CC 6.2 1.0 - 1.6
Bladen TC 8.4 - 1.2 - 1.3Blue Ridge TC 5.1 0.9 1.0Brunswick TC 1.7 - 1.5
Caldwell CC & TI 9.5 1.7 - 2.5Cape Fear TI 9.2 2.3 0.6Carteret TC 5.6 1.2 - 1.1
Catawba Vy. TC 7.3 0.3 1.1 2.1C. Carolina TC 9.8 1.2 1.5C. Piedmont CC 5.0 0.1 1.1 0.7 0.3 0.1- 0.1-
Cleveland TC 11.7 0.4 1.7 2.2Coastal Car. CC 11.7 0.4 0.8 0.7Col. Albemarle 9.6 0.9 0.9 1.7
Craven CC 11.7 1.9 1.4Davidson Co. CC 12.3 2.0 1.7 2.4 1.9Durham TI 3.0 1,5 1.6 0.1
Edgecombe TC 6,5 1.0 0.3 - 1.8 0.1Fayettev'le TI 5.1 2.0 - - 2.3Forsyth TI 8.9 1.0 1.3
Gaston Col. 4.9 0.3 0.3 0.4 1.6 1.0Guilford TCC 9.4 0.6 1.1 1.2Halifax CC 13.6 0.8
Haywood TC 3.9 1.0 1.1 0.4Isothermal CC 6.7 0.7 1.1J. Sprun: IC 6.4 0.2 0.9 0.3
Johnston TC 4.1 0.8 1.7Lenoir CC 11.7 - 1.0Martin CC 13.4 - 1.8
106
112
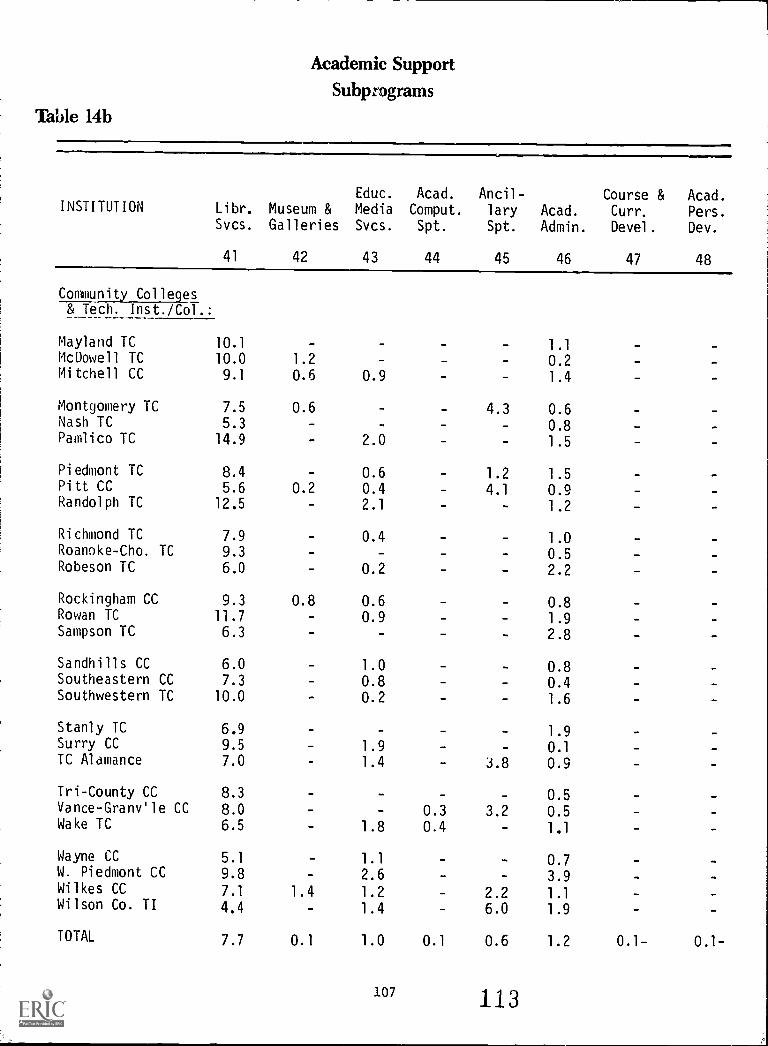
Academic SupportSubprograms
Table 14b
INSTITUTION Libr.
Svcs.
41
Museum &Galleries
42
Educ.
Media
Svcs.
43
Acad.
Comput.
Spt.
44
Ancil-lary
Spt.
45
Acad.
Admin.
46
Course &Curr.
Devel.
47
Acad.
Pers.
Dev.
48
Community Colleges& Tech. Inst./Col.:
Mayland TC 10.1 - 1.1McDowell TC 10.0 1.2 - 0.2Mitchell CC 9.1 0.6 0.9 - 1.4
Montgomery TC 7.5 0.6 4.3 0.6Nash TC 5.3 0.8Pamlico TC 14.9 2.0 - 1.5
Piedmont TC 8.4 0.6 1.2 1.5Pitt CC 5.6 0.2 0.4 4.1 0.9Randolph TC 12.5 2.1 1.2
Richmond TC 7.9 0.4 1.0Roanoke-Cho. TC 9.3 0.5Robeson TC 6.0 0.2 - 2.2
Rockingham CC 9.3 0.8 0.6 0.8Rowan TC 11.7 0.9 1.9Sampson TC 6.3 2.8
Sandhills CC 6.0 1.0 0.8Southeastern CC 7.3 0.8 0.4Southwestern TC 10.0 0.2 1.6
Stanly TC 6.9 1.9Surry CC 9.5 1.9 0.1TC Alamance 7.0 1.4 3.8 0.9
Tri-County CC 8.3 0.5Vance-Gram/le CC 8.0 0.3 3.2 0.5Wake TC 6.5 1.8 0.4 - 1.1
Wayne CC 5.1 1.1 0.7W. Piedmont CC 9.8 2.6 3.9Wilkes CC 7.1 1.4 1.2 2.2 1.1Wilson Co. TI 4.4 1.4 6.0 1.9
TOTAL 7.7 0.1 1.0 0.1 0.6 1.2 0.1- 0.1-
107 113
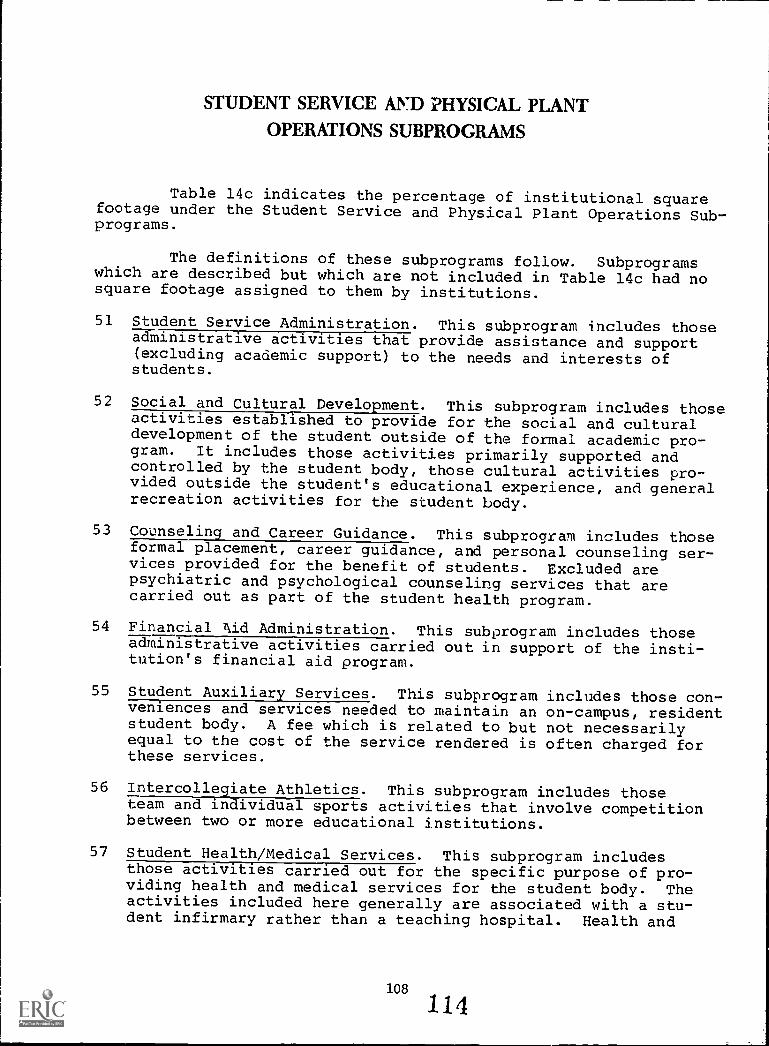
STUDENT SERVICE AND PHYSICAL PLANT
OPERATIONS SUBPROGRAMS
Table 14c indicates the percentage of institutional squarefootage under the Student Service and Physical Plant Operations Sub-programs.
The definitions of these subprograms follow. Subprogramswhich are described but which are not included in Table 14c had nosquare footage assigned to them by institutions.
51 Student Service Administration. This subprogram includes thoseadministrative activities that provide assistance and support(excluding academic support) to the needs and interests ofstudents.
52 Social and Cultural Development. This subprogram includes thoseactivities established to provide for the social and culturaldevelopment of the student outside of the formal academic pro-gram. It includes those activities primarily supported andcontrolled by the student body, those cultural activities pro-vided outside the student's educational experience, and generalrecreation activities for the student body.
53 Counseling and Career Guidance. This subprogram includes thoseformal placement, career guidance, and personal counseling ser-vices provided for the benefit of students. Excluded arepsychiatric and psychological counseling services that arecarried out as part of the student health program.
54 Financial did Administration. This subprogram includes thoseadministrative activities carried out in support of the insti-tution's financial aid program.
55 Student Auxiliary Services. This subprogram includes those con-veniences and services needed to maintain an on-campus, residentstudent body. A fee which is related to but not necessarilyequal to the cost of the service rendered is often charged forthese services.
56 Intercollegiate Athletics. This subprogram includes thoseteam and individual sports activities that involve competitionbetween two or more educational institutions.
57 Student Health/Medical Services. This subprogram includesthose activities carried out for the specific purpose of pro-viding health and medical services for the student body. Theactivities included here generally are associated with a stu-dent infirmary rather than a teaching hospital. Health and
108
114
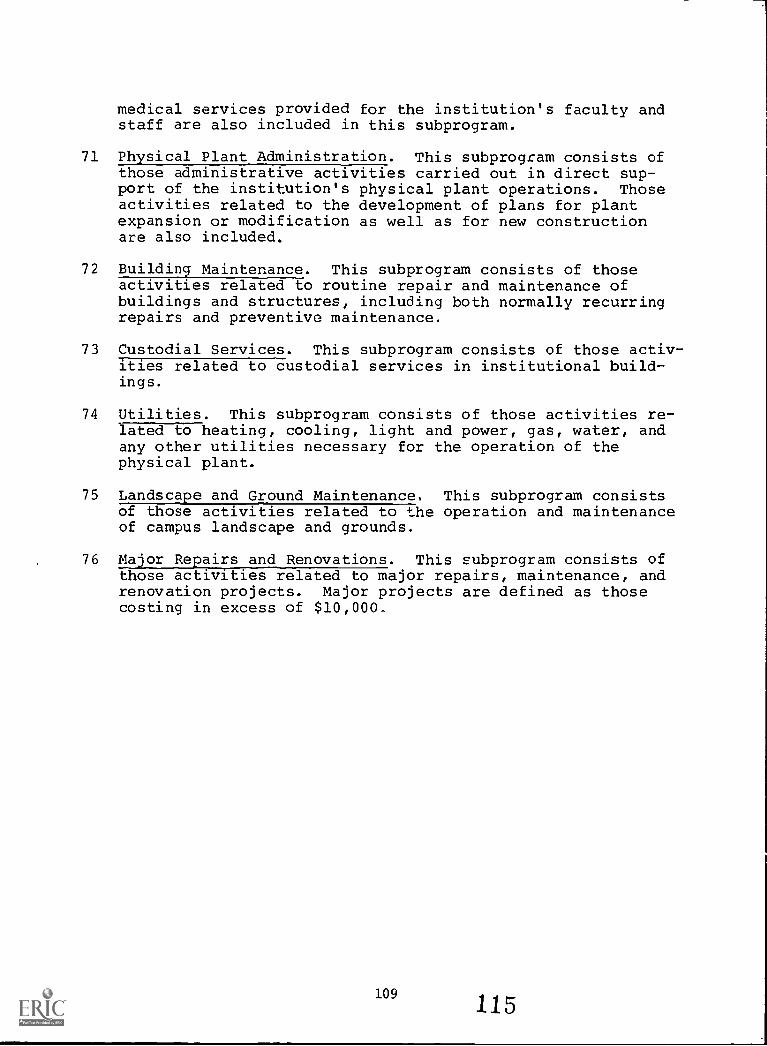
medical services provided for the institution's faculty andstaff are also included in this subprogram.
71 Physical Plant Administration. This subprogram consists ofthose administrative activities carried out in direct sup-port of the institution's physical plant operations. Thoseactivities related to the development of plans for plantexpansion or modification as well as for new constructionare also included.
72 Building Maintenance. This subprogram consists of thoseactivities related to routine repair and maintenance ofbuildings and structures, including both normally recurringrepairs and preventive maintenance.
73 Custodial Services. This subprogram consists of those activ-ities related to custodial services in institutional build-ings.
74 Utilities. This subprogram consists of those activities re-lated to heating, cooling, light and power, gas, water, andany other utilities necessary for the operation of thephysical plant.
75 Landscape and Ground Maintenance, This subprogram consistsof those activities related to the operation and maintenanceof campus landscape and grounds.
76 Major Repairs and Renovations. This subprogram consists ofthose activities related to major repairs, maintenance, andrenovation projects. Major projects are defined as thosecosting in excess of $10,000.
109115
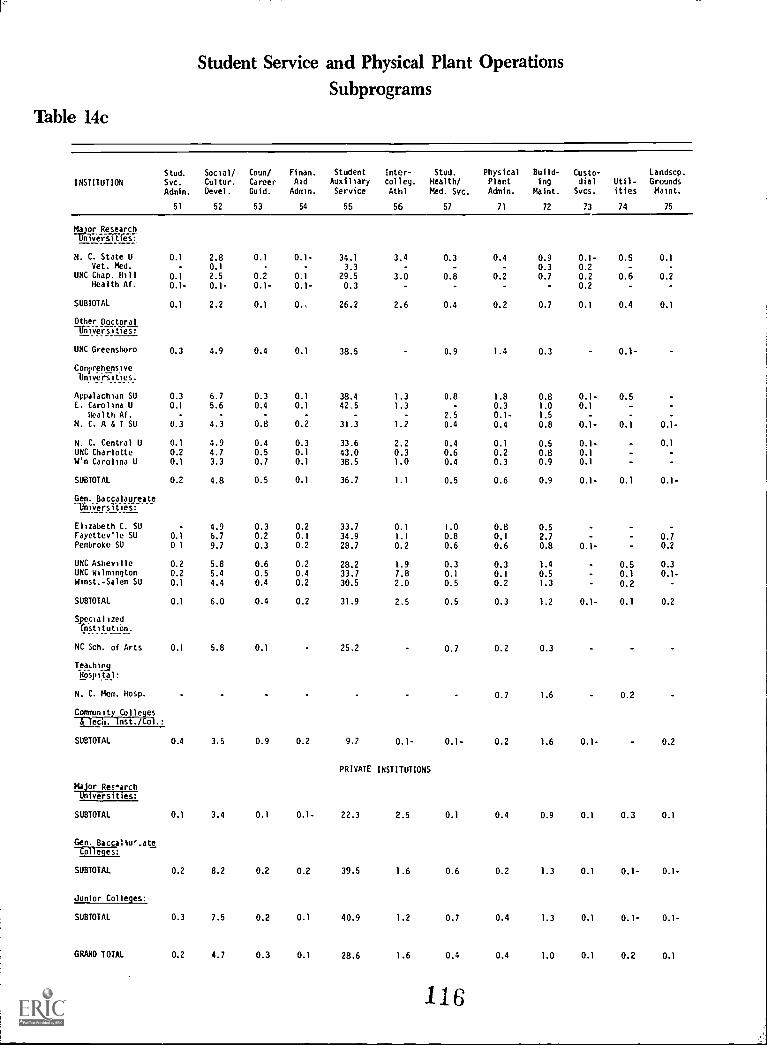
Student Service and Physical Plant OperationsSubprograms
Table 14c
INSTITUTIONStud.
Svc.
Admin.
51
Social/Cultur.
Devel.
52
Coun/
CareerGuid.
53
Finan.
AidAdmin.
54
StudentAuxiliaryService
55
Inter- Stud.colleg. Health/
Athl Med. Svc.
56 57
PhysicalPlantAdmin.
71
Build-ing
Maint.
72
Custo-dial
Svcs.
73
Util-ities
74
Landscp.GroundsMaint.
75
Ma or ResearchUniviriTtiers":-
N. C. State U 0.1 2.8 0.1 0.1- 34.1 3.4 0.3 0.4 0.9 0.1- 0.5 0.1Vet. Med. 0.1 3.3 0.3 0.2
UNC Chap. Hill 0.1 2.5 0.2 0.1 29.5 3.0 0.8 0.2 0.7 0.2 0.6 0.2Health Af. 0.1- 0.1- 0.1- 0.1- 0.3 0.2
SUBTOTAL 0.1 2.2 0.1 O., 26.2 2.6 0.4 0.2 0.7 0.1 0.4 0.1
Other Doctoralilliii-yeri-iiies:
UNC Greensboro 0.3 4.9 0.4 0.1 38.5 0.9 1.4 0.3 0.1-
ComprehensiveUnivers2t2es,
Appalachian SU 0.3 6.7 0.3 0.1 38.4 1.3 0.8 1.8 0.8 0.1- 0.5E. Carolina U 0.1 5.6 0.4 0.1 42.5 1.3 - 0.3 1.0 0.1
Health Af. - - 2.5 0.1- 1.5
N. C. A & 1 SU 0.3 4.3 0.8 0.2 31.3 1.? 0.4 0.4 0.8 0.1- 0.1 0.1-
N. C. Central U 0.1 4.9 0.4 0.3 33.6 2.2 0.4 0.1 0.5 0.1- 0.1
UNC Charlotte 0.2 4.7 0.5 0.1 43.0 0.3 0.6 0.2 0.8 0.1W'n Carolina U 0.1 3.3 0.7 0.1 38.5 1.0 0.4 0.3 0.9 0.1
SUBTOTAL 0.2 4.8 0.5 0.1 36.7 1.1 0.5 0.6 0.9 0.1- 0.1 0.1-
Gen. Baccalaureate-Universities:
Elizabeth C. SU - 4.9 0.3 0.2 33.7 0.1 1.0 0.8 0.5Fayettev'le SU 0.1 6.7 0.2 0.1 34.9 1.1 0.8 0.1 2.7 0.7Pembroke SU 0 1 9.7 0.3 0.2 28.7 0.2 0.6 0.6 0.8 OA- 0.2
UNC Asheville 0.2 5.8 0.6 0.2 28.2 1.9 0.3 0.3 1.4 0.5 0.3UNC Wilmington 0.2 5.4 0.5 0.4 33.7 7.8 0.1 0.1 0.5 0.1 0.1-Winst.-Salem SU 0.1 4.4 0.4 0.2 30.5 2.0 0.5 0.2 1.3 0.2
SUBTOTAL 0.1 6.0 0.4 0.2 31.9 2.5 0.5 0.3 1.2 0.1- 0.1 0.2
Specializedinstitution.
NC Sch. of Arts 0.1 5.8 0.1 25.2 0.7 0.2 0.3
TeadlingHospital:
N. C. Mem. Hosp. 0.7 1.6 0.2
Community Colleges-17Tech. Inst./Col.:
SUBTOTAL 0.4 3.5 0.9 0.2 9.7 0.1- 0.1- 0.2 1.6 0.1- 0.2
PRIVATE INSTITUTIONS
Major Res.archUniversities:
SUBTOTAL 0.1 3.4 0.1 0.1- 22.3 2.5 0.1 0.4 0.9 0.1 0.3 0.1
Gen. Baccaliur.ateColleges:
SUBTOTAL 0.2 8.2 0.2 0.2 39.5 1.6 0.6 0.2 1.3 0.1 0.1- 0.1-
Junior Colleges:
SUBTOTAL 0.3 7.5 0.2 0.1 40.9 1.2 0.7 0.4 1.3 0.1 0.1- 0.1-
GRAND TOTAL 0.2 4.7 0.3 0.1 28.6 1.6 0.4 0.4 1.0 0.1 0.2 0.1
116
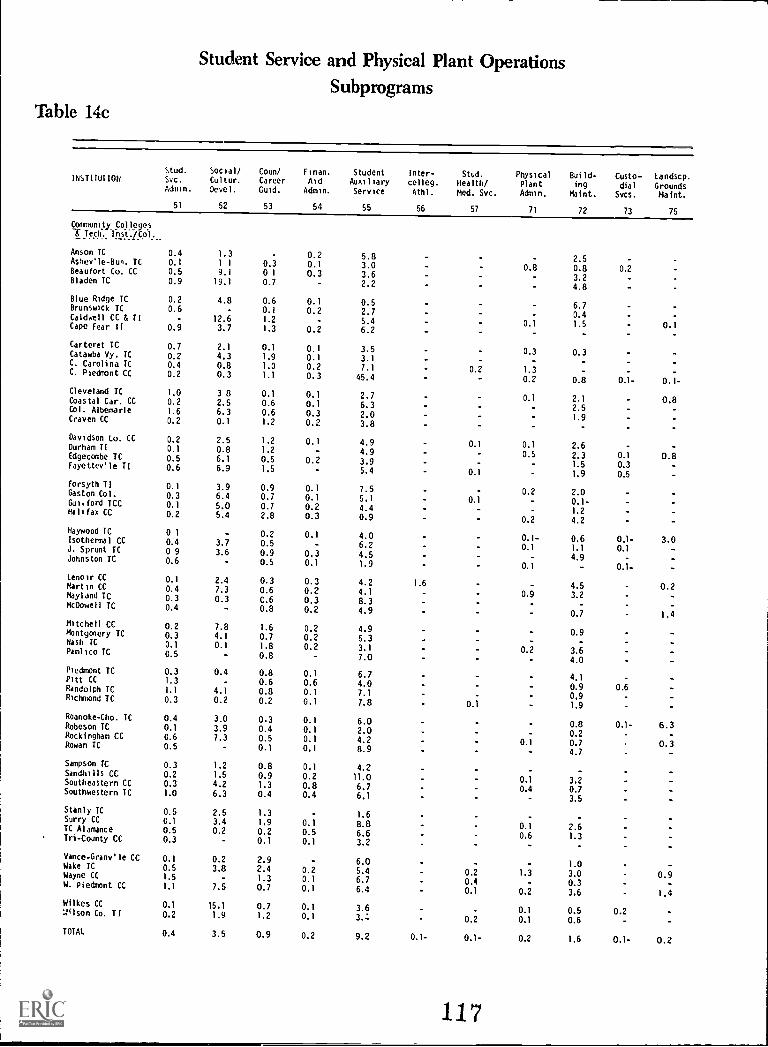
Student Service and Physical Plant OperationsSubprograms
Table 14c
IRSTIT0TI011Stud.Svc.
Admin.
Social/Cultur.
Bevel.
Coun/Career
Guid.
Finan.
AidAdmin.
Student
AuxiliaryService
Inter-
celleg.Athl.
Stud.
Health/Med. Svc.
Physical
PlantAdmin.
Build-ing
Maint.
Custo-dial
Svcs.
Landscp.
GroundsMaint.
51 52 53 54 55 56 57 71 72 73 75
Ccomonity CollegesT Tech.- 19st.iC91.-__
Anson IC 0.4 1.3 - 0.2 5.8 2.5Ashev'le-Bun. TC 0.1 1 1 0.3 0.1 3.0 0.8 0.8 0.2Beaufort Co. CC 0.5 9.1 0 1 0.3 3.6 3.2Bladen TC 0.9 19.1 0.7 2.2 4.8
Blue Ridge TC 0.2 4.8 0.6 0.1 0.5 6.7Brunswick TC 0.6 - 0.1 0.2 2.7 0.4Caldwell CC & T1 - 12.6 1.2 5.4 0.1 1.5 0.1Cape Fear fl 0.9 3.7 1.3 0.2 6.2
Carteret TC 0.7 2.1 0.1 0.1 3.5 0.3 0.3Catawba Vy. IC 0.2 4.3 1.9 0.1 3.1C. Carolina IC 0.4 0.8 1.0 0.2 7.1 0.2 1.3 -C. Piedoont CC 0.2 0.3 1.1 0.3 45.4 0.2 0.8 0.1- 0.1-
Cleveland IC 1.0 3 8 0.1 0.1 2.7 0.1 2.1 0.8Coastal Car. CC 0.2 2.5 0.6 0.1 6.3 2.5Col. Albemarle 1.6 6.3 0.6 0.3 2.0 1.9Craven CC 0.2 0.1 1.2 0.2 3.8
Davidson to. CC 0.2 2.5 1.2 0.1 4.9 0.1 0.1 2.6 -Durham T1 0.1 0.8 1.2 4.9 0.5 2.3 0.1 0.8Edgeccmbe TC 0.5 6.1 0.5 0.2 3.9 1.5 0.3Fayettev'le T1 0.6 6.9 1.5 5.4 0.1 1.9 0.5
Forsyth TI 0.1 3.9 0.9 0.1 7.5 0.2 2.0Gaston Col. 0.3 6.4 0.7 0.1 5.1 0.1 0.1-Gui.ford TCC 0.1 5.0 0.7 0.2 4.4 1.2Halifax CC 0.2 5.4 2.8 0.3 0.9 0.2 4.2
Haywood TC 0 1 - 0.2 0.1 4.0 0.1- 0.6 0.1- 3.0Isothermal CC 0.4 3.7 0.5 6.2 0.1 1.1 0.1J. Sprunt TC 0 9 3.6 0.9 0.3 4.5 4.9Johnston TC 0.6 - 0.5 0.1 1.9 0.1 0.1-
Lenoir CC 0.1 2.4 0.3 0.3 4.2 1.6 4.5 0.2Martin CC 0.4 7.3 0.6 0.2 4.1 0.9 3.2Mayland TC 0.3 0.3 C.6 0.3 8.3McDowell TC 0.4 - 0.8 0.2 4.9 0.7 1.4
Mitchell CC 0.2 7.8 1.6 0.2 4.9 0.9Montgomery TC 0.3 4.1 0.7 0.2 5.3Nash TC 0.1 0.1 1.8 0.2 3.1 0.2 3.6Pamlico TC 0.5 - 0.8 7.0 4.0
Piedmont IC 0.3 0.4 0.8 0.1 6.7 4.1Pitt CC 1.3 - 0.6 0.6 4.0 0.9 0.6Randolph IC 1.1 4.1 0.8 0.1 7.1 0.9Richmond IC 0.3 0.2 0.2 0.1 7.8 0.1 1.9
Roanoke-Cho. IC 0.4 3.0 0.3 0.1 6.0 0.8 0.1- 6.3Robeson TC 0.1 3.9 0.4 0.1 2.0 0.2Rockingham CC 0.6 7.3 0.5 0.1 4.2 0.1 0.7 0.3Rowan IC 0.5 - 0.1 0.1 8.9 4.7
Sampson TC 0.3 1.2 0.8 0.1 4.2 -Sandhills CC 0.2 1.5 0.9 0.2 11.0 0.1 3.2Southeastern CC 0.3 4.2 1.3 0.8 6.7 0.4 0.7Southwestern IC 1.0 6.3 0.4 0.4 6.1 3.5
Stanly TC 0.5 2.5 1.3 1.6-Surry CC 0.1 3.4 1.9 0.1 8.8 0.1 2.6TC Alamance 0.5 0.2 0.2 0.5 6.6 0.6 1.3Tri-County CC 0.3 - 0.1 0.1 3.2-
Vance-Granv'le CC 0.1 0.2 2.9 - 6.0 - - 1.0Wake TC 0.5 3.8 2.4 0.2 5.4 0.2 1.3 3.0 0.9Wayne CC 1.5 - 1.3 0.1 6.7 0.4 - 0.3W. Piedmont CC 1.1 7.5 0.7 0.1 6.4 0.1 0.2 3.6 1.4
Wilkes CC 0.1 15.1 0.7 0.1 3.6 0.1 0.5 0.2'..1ilson Co. T1 0.2 1.9 1.2 0.1 3.-: 0.2 0.1 0.6
TOTAL 0.4 3.5 0.9 0.2 9.2 0.1- 0.1- 0.2 1.6 0.1- 0.2
117
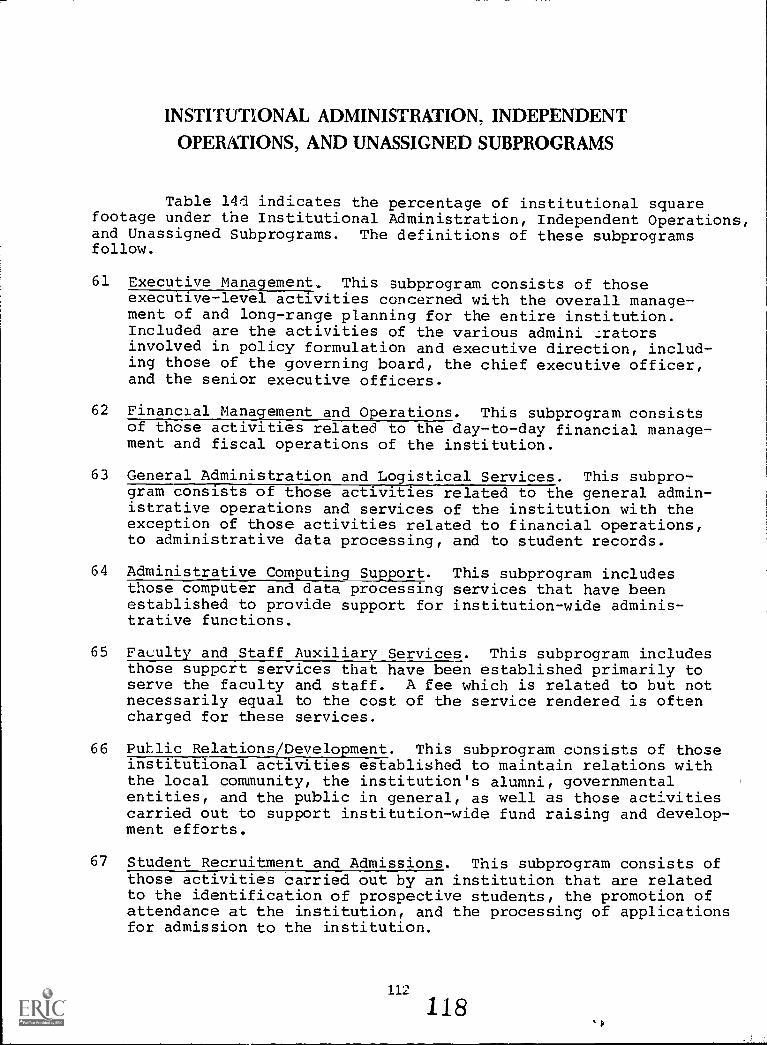
INSTITUTIONAL ADMINISTRATION, INDEPENDENT
OPERATIONS, AND UNASSIGNED SUBPROGRAMS
Table 14d indicates the percentage of institutional squarefootage under the Institutional Administration, Independent Operations,and Unassigned Subprograms. The definitions of these subprogramsfollow.
61 Executive Management. This subprogram consists of thoseexecutive-level activities concerned with the overall manage-ment of and long-range planning for the entire institution.Included are the activities of the various admini .:ratorsinvolved in policy formulation and executive direction, includ-ing those of the governing board, the chief executive officer,and the senior executive officers.
62 Financial Management and Operations. This subprogram consistsof those activities related to the day-to-day financial manage-ment and fiscal operations of the institution.
63 General Administration and Logistical Services. This subpro-gram consists of those activities related to the general admin-istrative operations and services of the institution with theexception of those activities related to financial operations,to administrative data processing, and to student records.
64 Administrative Computing_Support. This subprogram includesthose computer and data processing services that have beenestablished to provide support for institution-wide adminis-trative functions.
65 Faculty and Staff Auxiliary Services. This subprogram includesthose suppert services that have been established primarily toserve the faculty and staff. A fee which is related to but notnecessarily equal to the cost of the service rendered is oftencharged for these services.
66 Public Relations /Development. This subprogram consists of thoseinstitutional activities established to maintain relations withthe local community, the institution's alumni, governmentalentities, and the public in general, as well as those activitiescarried out to support institution-wide fund raising and develop-ment efforts.
67 Student Recruitment and Admissions. This subprogram consists ofthose activities carried out by an institution that are relatedto the identification of prospective students, the promotion ofattendance at the institution, and the processing of applicationsfor admission to the institution.
112
118
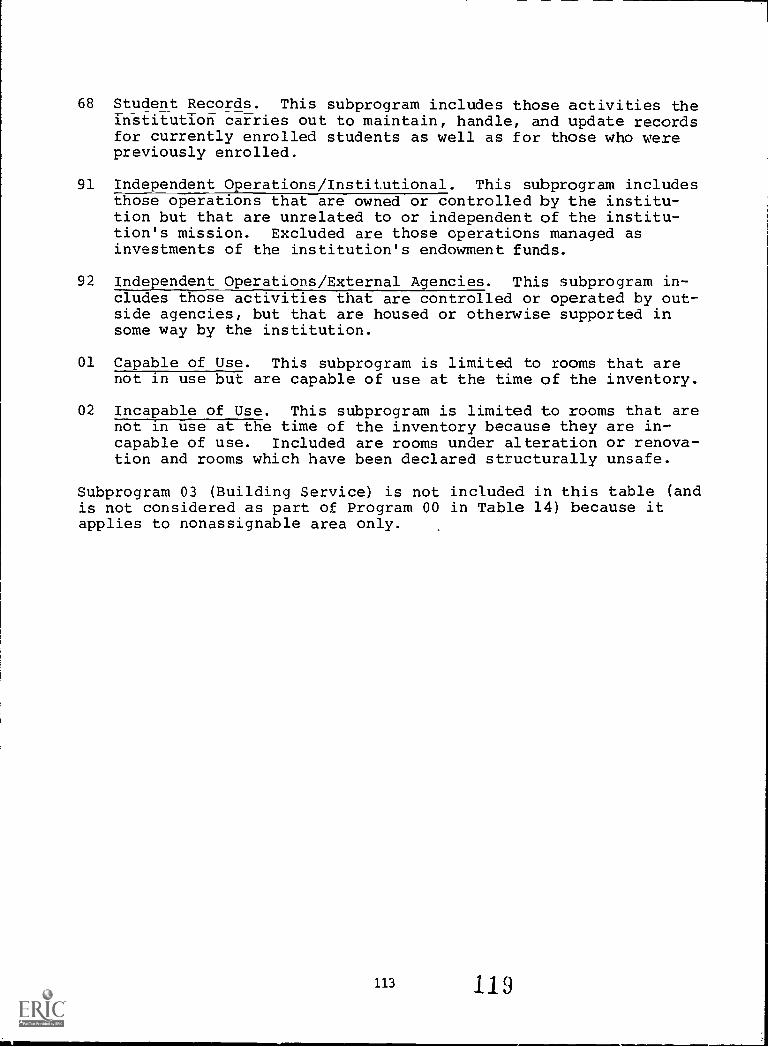
68 Student Records. This subprogram includes those activities theinstitution carries out to maintain, handle, and update recordsfor currently enrolled students as well as for those who werepreviously enrolled.
91 Independent Operations/Institutional. This subprogram includesthose operations that are owned or controlled by the institu-tion but that are unrelated to or independent of the institu-tion's mission. Excluded are those operations managed asinvestments of the institution's endowment funds.
92 Independent Operations/External Agencies. This subprogram in-cludes those activities that are controlled or operated by out-side agencies, but that are housed or otherwise supported insome way by the institution.
01 Capable of Use. This subprogram is limited to rooms that arenot in use but are capable of use at the time of the inventory.
02 Incapable of Use. This subprogram is limited to rooms that arenot in use at the time of the inventory because they are in-capable of use. Included are rooms under alteration or renova-tion and rooms which have been declared structurally unsafe.
Subprogram 03 (Building Service) is not included in this table (andis not considered as part of Program 00 in Table 14) because itapplies to nonassignable area only.
113 119
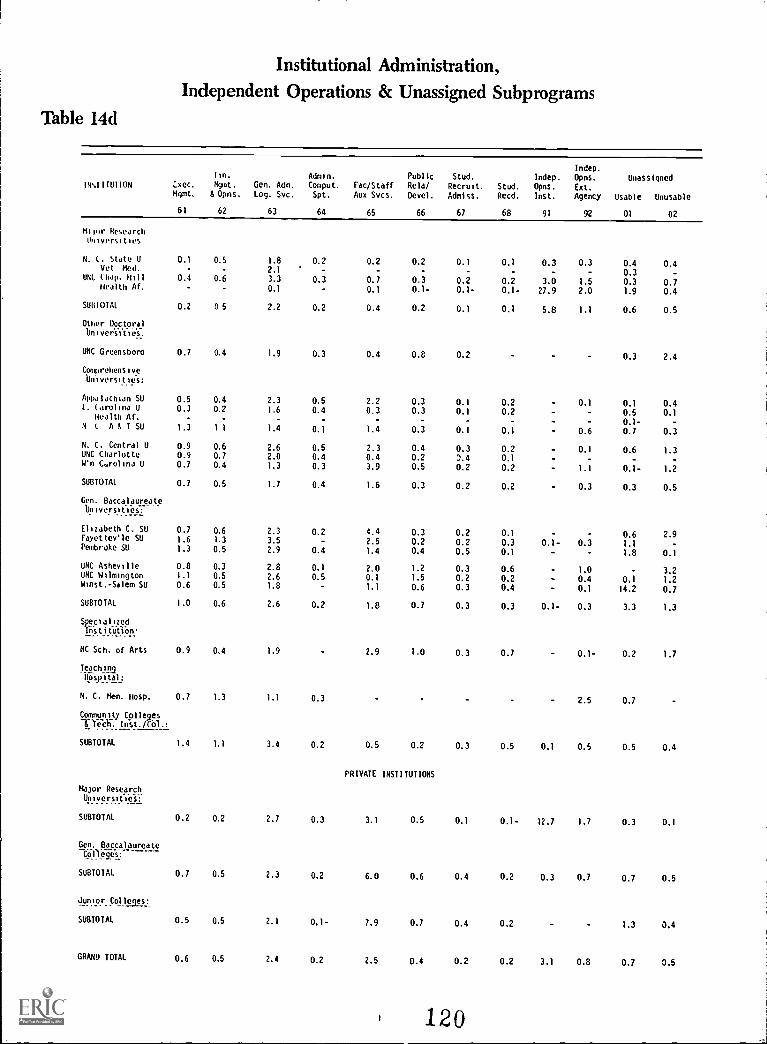
Institutional Administration,Independent Operations & Unassigned Subprograms
Table 14d
INs11111110N Cxec.Mgmt.
61
Fin.
Not.b Opns.
62
Gen. Adm.
Log. Svc.
63
Aden n.
Comput.
Spt.
64
Fac/StaffAux Svcs.
65
Public
Bela/
Bevel.
66
Stud.
Recruit,Admits.
67
Stud.
Recd.
68
Indep.
Opns.
Inst.
91
Indep,Opns.
Ext.
Agency
92
Unassigned
Usable Unusable
01 02
Miler ResearchUniversities
N. L. State U 0.1 0.5 1.8 0.2 0.2 0.2 0.1 0.1 0.3 0.3 0.4 0.4Vet Med. 2.1 - - 0.3 -UHL Chap. Hill 0.4 0.6 3.3 0.3 0.7 0.3 0.2 0.2 3.0 1.5 0.3 0.7Health Af. 0.1 0.1 0.1- 0.1- 0.1- 27.9 2.0 1.9 0.4
SUBTOTAL 0.2 0 5 2.2 0.2 0.4 0.2 0.1 0.1 5.8 1.1 0.6 0.5
Other Doctoralbniver'siCies.
UNC Greensboro 0.7 0.4 1.9 0.3 0.4 0.8 0.2 0.3 2.4
ComprehensiveUniversities:
Appalachian SU 0.5 0.4 2.3 0.5 2.2 0.3 0.1 0.2 0.1 0.1 0.4L. iarolina U 0.3 0.2 1.6 0.4 0.3 0.3 0.1 0.2 0.5 0.1Health Af. - - - 0.1- -N L AdT SU 1.3 1 1 1.4 0.1 1.4 0.3 0.1 0.1 0.6 0.7 0.3
N. C. Central U 0.9 0.6 2.6 0.5 2.3 0.4 0.3 0.2 0.1 0.6 1.3UNC Charlotte 0.9 0.7 2.0 0.4 0.4 0.2 0.4 0.1 - -W'n Corolina U 0.7 0.4 1.3 0.3 3.9 0.5 0.2 0.2 1.1 0.1- 1.2
SUBTOTAL 0.7 0.5 1.7 0.4 1.6 0.3 0.2 0.2 0.3 0.3 0.5
Gen. BaccalaureateUniversities=
Elizabeth C. SU 0.7 0.6 2.3 0.2 4.4 0.3 0.2 0.1 0.6 2.9Fayettev'le SU 1.6 1.3 3.5 2.5 0.2 0.2 0.3 0.1- 0.3 1.1 -Pembroke SU 1.3 0.5 2.9 0,4 1.4 0.4 0.5 0.1 1.8 0.1
UNC Asheville 0.8 0.3 2.8 0.1 2.0 1.2 0.3 0.6 1.0 - 3.2UNC Wilmington 1.1 0.5 2.6 0.5 0.1 1.5 0.2 0.2 0.4 0,1 1.2Winst.-Salem SU 0.6 0.5 1.8 1.1 0.6 0.3 0.4 0.1 14.2 0.7
SUBTOTAL 1.0 0.6 2.6 0.2 1.8 0.7 0.3 0.3 0.1- 0.3 3.3 1.3
SpecializedInstitution.
NC Sch. of Arts 0.9 0,4 1.9 2.9 1.0 0.3 0.7 0.1- 0.2 1.7
TeachingBosEital:
N. C. Hem. Hosp. 0.7 1.3 1.1 0.3 2.5 0.7
Community Colleges-&-Tecli. Ids t . /Col . :
SUBTOTAL 1.4 1.1 3.4 0.2 0.5 0.2 0.3 0.5 0.1 0.5 0.5 0.4
PRIVATE INSTITUTIONS
Major ResearchUniversities:
SUBTOTAL 0.2 0.2 2.7 0.3 3.1 0.5 0.1 0.1- 12.7 1.7 0.3 0.1
Gen, Baccalaureate
SUBTOTAL 0.7 0.5 2.3 0.2 6.0 0.6 0.4 0,2 0.3 0.7 0.7 0.5
Junior Colleges;
SUBTOTAL 0.5 0.5 2.1 0.1- 7.9 0.7 0.4 0,2 1.3 3.4
GRAND TOTAL 0.6 0.5 2.4 0.2 2.5 0.4 0.2 0.2 3.1 0.8 0.7 3.5
120
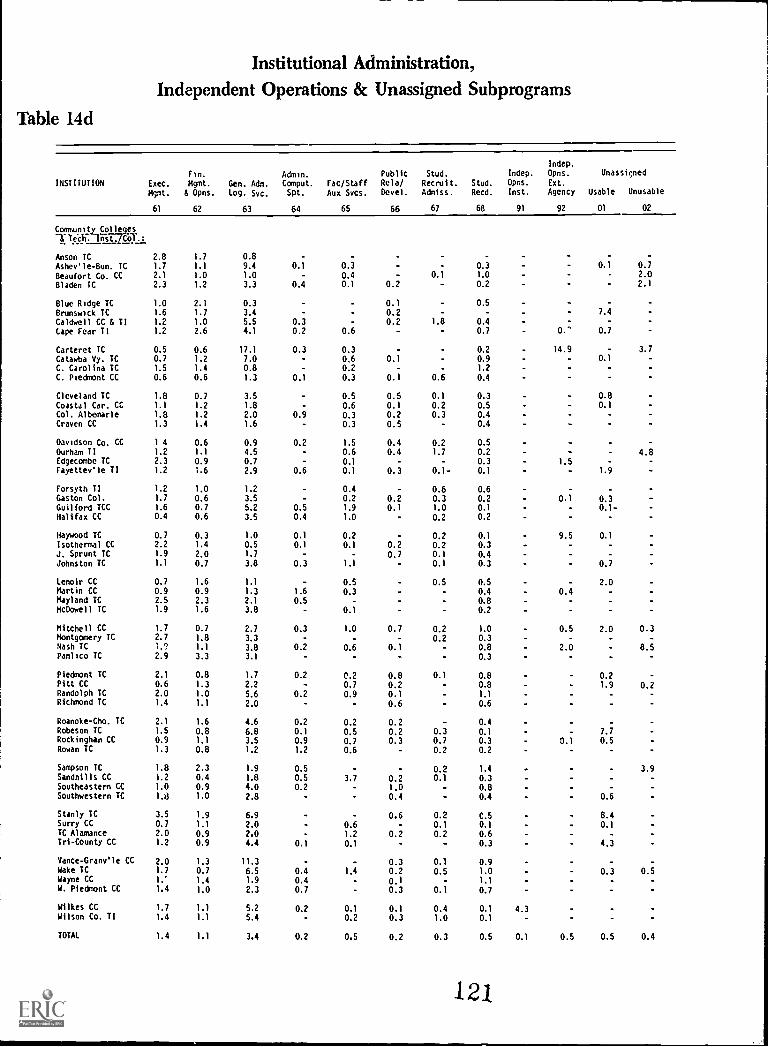
Institutional Administration,Independent Operations & Unassigned Subprograms
Table 14d
INSTITUTION Exec.
Mgmt.
Fin.
Mgmt.& Opns.
Gen. Adm.
Log. Svc.
Admin.Comput.
Spt.
Fac/StaffAux Svcs.
PublicRela/Devel.
Stud.
Recruit.Admiss.
Stud.
Recd.
Indep.
Opns.
Inst.
Indep.
Opns.
Ext.
Agency
Unassigned
Usable Unusable
61 62 63 64 65 66 67 68 91 92 01 02
Conr.unkty Collegeslecnirst7CMT.
Anson TC 2.8 1.7 0.8 - - - -
Ashev'le-Bun. IC 1.7 1.1 9.4 0.1 0.3 0.3 0.1 0.7
Beaufort Co. CC 2.1 1.0 1.0 0.4 0.1 1.0 2.0
Bladen TC 2.3 1.2 3.3 0.4 0.1 0.2 0.2 2.1
Blue Ridge TC 1.0 2.1 0.3 0.1 0.5
Brunswick TC 1.6 1.7 3.4 0.2 7.4
Caldwell CC & TI 1.2 1.0 5.5 0.3 0.2 1.8 0.4
Cape Fear TI 1.2 2.6 4.1 0.2 0.6 0.7 O.' 0.7
Carteret TC 0.5 0.6 17.1 0.3 0.3 - 0.2 14.9 3.7
Catawba Vy. TC 0.7 1.2 7.0 0.6 0.1 - 0.9 - 0.1
C. Carolina IC 1.5 1.4 0.8 0.2 - - 1.2
C. Piedmont CC 0.6 0.6 1.3 0.1 0.3 0.1 0.6 0.4
Cleveland TC 1.8 0.7 3.5 0.5 0.5 0.1 0.3 0.8Coastal Car. CC 1.1 1.2 1.8 0.6 0.1 0.2 0.5 0.1
Col. Albemarle 1.8 1.2 2.0 0.9 0.3 0.2 0.3 0.4Craven CC 1.3 1.4 1.6 0.3 0.5 - 0.4
Oavidson Co. CC 1 4 0.6 0.9 0.2 1.5 0.4 0.2 0.5
Ourham TI 1.2 1.1 4.5 0.6 0.4 1.7 0.2 4.8Edgecombe TC 2.3 0.9 0.7 0.1 0.3 1.5Fayettev'le TI 1.2 1.6 2.9 0.6 0.1 0.3 0.1- 0.1 1.8
Forsyth TI 1.2 1.0 1.2 0.4 0.6 0.6Gaston Col. 1.7 0.6 3.5 - 0.2 0.2 0.3 0.2 0.1 0.3Guilford TCC 1.6 0.7 5.2 0.5 1.9 0.1 1.0 0.1 0.1-Halifax CC 0.4 0.6 3.5 0.4 1.0 0.2 0.2
Haywood TC 0.7 0.3 1.0 0.1 0.2 0.2 0.1 9.5 0.1
Isothermal CC 2.2 1.4 0.5 0.1 0.1 0.2 0.2 0.3 -
J. Sprunt IC 1.9 2.0 1.7 0.7 0.1 0.4Johnston IC 1.1 0.7 3.8 0.3 1.1 0.1 0.3 0.7
Lenoir CC 0.7 1.6 1.1 0.5 0.5 0.5 2.0Martin CC 0.9 0.9 1.3 1.6 0.3 - 0.4 0.4Mayland IC 2.5 2.3 2.1 0.5 0.8McDowell TC 1.9 1.6 3.8 0.1 0.2
Mitchell CC 1.7 0.7 2.7 0.3 1.0 0.7 0.2 1.0 0.5 2.0 0.3Montgomery TC 2.7 1.8 3.3 0.2 0.3Nash TC 1.9 1.1 3.8 0.2 0.6 0.1 0.8 2.0 8.5Pamlico IC 2.9 3.3 3.1 0.3
Piedmont TC 2.1 0.8 1.7 0.2 0.2 0.8 0.1 0.8 0.2Pitt CC 0.6 1.3 2.2 0.7 0.2 0.8 1.9 0.2Randolph TC 2.0 1.0 5.6 0.2 0.9 0.1 1.1Richmond TC 1.4 1.1 2.0 0.6 0.6
Roanoke-Cho. TC 2.1 1.6 4.6 0.2 0.2 0.2 - 0.4Robeson TC 1.5 0.8 6.8 0.1 0.5 0.2 0.3 0.1 7.7Rockingham CC 0.9 1.1 3.5 0.9 0.7 0.3 0.7 0.3 3.1 0.5Rowan TC 1.3 0.8 1.2 1.2 0.6 0.2 0.2
Sampson TC 1.8 2.3 1.9 0.5 0.2 1.4 3.9Sandhills CC 1.2 0.4 1.8 0.5 3.7 0.2 0.1 0.3Southeastern CC 1.0 0.9 4.0 0.2 1.0 0.8Southwestern TC 1.8 1.0 2.8 0.4 0.4 0.6
Stanly IC 3.5 1.9 6.9 - 0.6 0.2 C.5 8.4Surry CC 0.7 1.1 2.0 0.6 0.1 0.1 0.1TC Alamance 2.0 0.9 2.0 1.2 0.2 0.2 0.6 -
Tri-County CC 1.2 0.9 4.4 0.1 0.1 - 0.3 4.3
Vance- Granv'le CC 2.0 1.3 11.3 0.3 0.1 0.9Wake IC 1.7 0.7 6.5 0.4 1.4 0.2 0.5 1.0 0.3 0.5Wayne CC 1.4 1.9 0.4 0.1 - 1.1
W. Piedmont CC 1.4 1.0 2.3 0.7 0.3 0.1 0.7
Wilkes CC 1.7 1.1 5.2 0.2 0.1 0.1 0.4 0.1 4.3Wilson Co. TI 1.4 1.1 5.4 - 0.2 0.3 1.0 0.1
TOTAL 1.4 1.1 3.4 0.2 0.5 0.2 0.3 0.5 0.1 0.5 0.5 0.4
121.
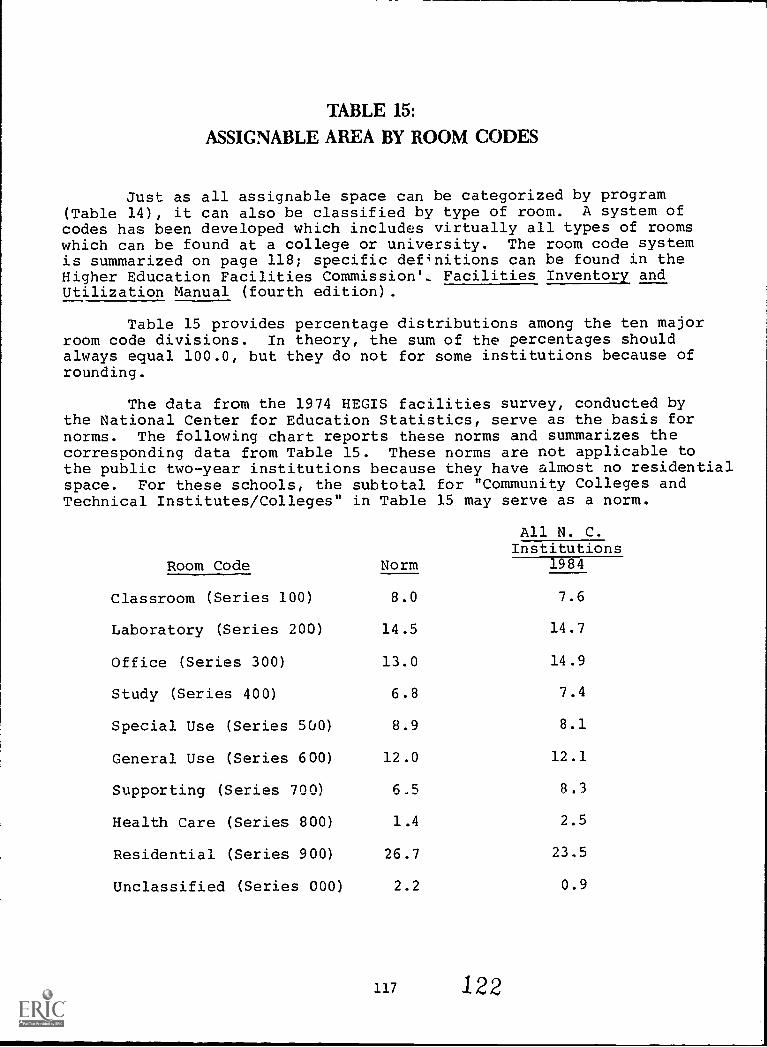
TABLE 15:
ASSIGNABLE AREA BY ROOM CODES
Just as all assignable space can be categorized by program(Table 14), it can also be classified by type of room. A system ofcodes has been developed which includes virtually all types of roomswhich can be found at a college or university. The room code systemis summarized on page 118; specific definitions can be found in theHigher Education Facilities Commission'- Facilities Inventory andUtilization Manual (fourth edition).
Table 15 provides percentage distributions among the ten majorroom code divisions. In theory, the sum of the percentages shouldalways equal 100.0, but they do not for some institutions because ofrounding.
The data from the 1974 HEGIS facilities survey, conducted bythe National Center for Education Statistics, serve as the basis fornorms. The following chart reports these norms and summarizes thecorresponding data from Table 15. These norms are not applicable tothe public two-year institutions because they have almost no residentialspace. For these schools, the subtotal for "Community Colleges andTechnical Institutes/Colleges"
Room Code
in Table 15
Norm
may serve as a norm.
All N. C.Institutions
1984
Classroom (Series 100) 8.0 7.6
Laboratory (Series 200) 14.5 14.7
Office (Series 300) 13.0 14.9
Study (Series 400) 6.8 7.4
Special Use (Series 500) 8.9 8.1
General Use (Series 600) 12.0 12.1
Supporting (Series 700) 6.5 8.3
Health Care (Series 800) 1.4 2.5
Residential (Series 900) 26.7 23.5
Unclassified (Series 000) 2.2 0.9
117 122
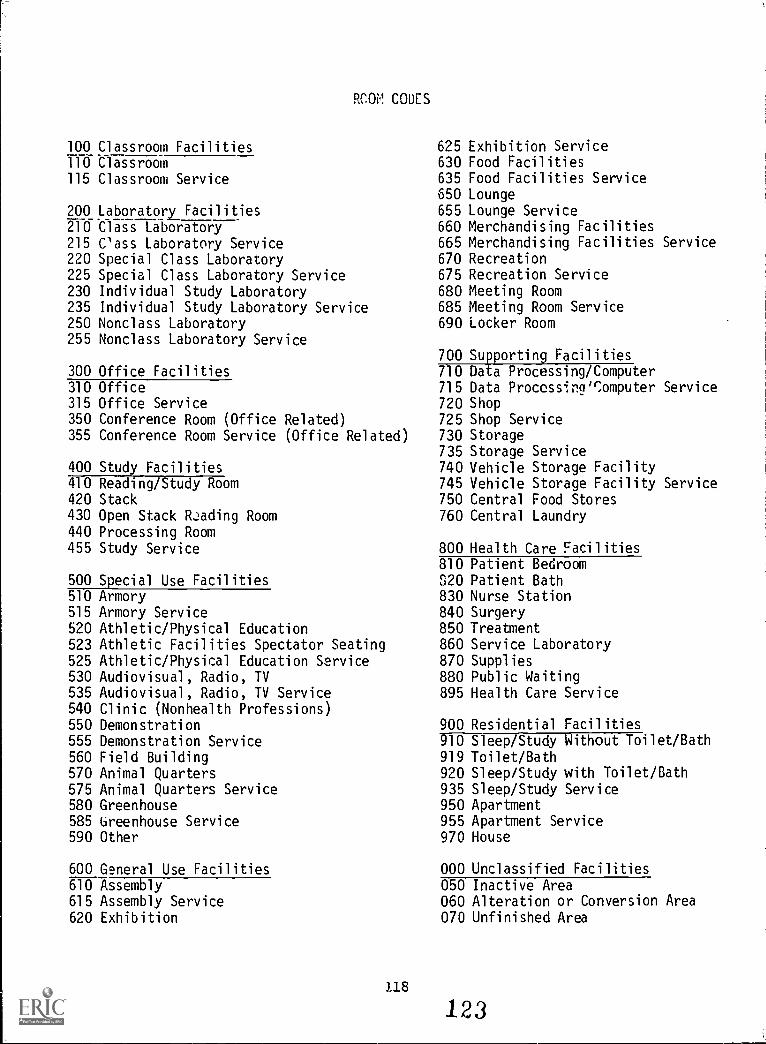
RCOP. CODES
100 Classroom Facilities110 Classroom115 Classroom Service
200 Laboratory Facilities210 Class Laboratory215 Cass Laboratory Service220 Special Class Laboratory225 Special Class Laboratory Service230 Individual Study Laboratory235 Individual Study Laboratory Service250 Nonclass Laboratory255 Nonclass Laboratory Service
300 Office Facilities310 Office315 Office Service350 Conference Room (Office Related)355 Conference Room Service (Office Related)
400 Study Facilities410 Reading/Study Room420 Stack430 Open Stack Reading Room440 Processing Room455 Study Service
500 Special Use Facilities510 Armory515 Armory Service520 Athletic/Physical Education523 Athletic Facilities Spectator Seating525 Athletic/Physical Education Service530 Audiovisual, Radio, TV535 Audiovisual, Radio, TV Service540 Clinic (Nonhealth Professions)550 Demonstration555 Demonstration Service560 Field Building570 Animal Quarters575 Animal Quarters Service580 Greenhouse585 Greenhouse Service590 Other
600 General Use Facilities610 Assembly615 Assembly Service620 Exhibition
118
625 Exhibition Service630 Food Facilities635 Food Facilities Service650 Lounge655 Lounge Service660 Merchandising Facilities665 Merchandising Facilities Service670 Recreation675 Recreation Service680 Meeting Room685 Meeting Room Service690 Locker Room
700 Supporting Facilities710 Data Processing/Computer715 Data Processing/Computer Service720 Shop725 Shop Service730 Storage735 Storage Service740 Vehicle Storage Facility745 Vehicle Storage Facility Service750 Central Food Stores760 Central Laundry
800 Health Care Facilities810 Patient BedroomS20 Patient Bath830 Nurse Station840 Surgery850 Treatment860 Service Laboratory870 Supplies880 Public Waiting895 Health Care Service
900 Residential Facilities910 Sleep/Study Without Toilet/Bath919 Toilet/Bath920 Sleep/Study with Toilet/Bath935 Sleep/Study Service950 Apartment955 Apartment Service970 House
000 Unclassified Facilities050 Inactive Area060 Alteration or Conversion Area070 Unfinished Area
123
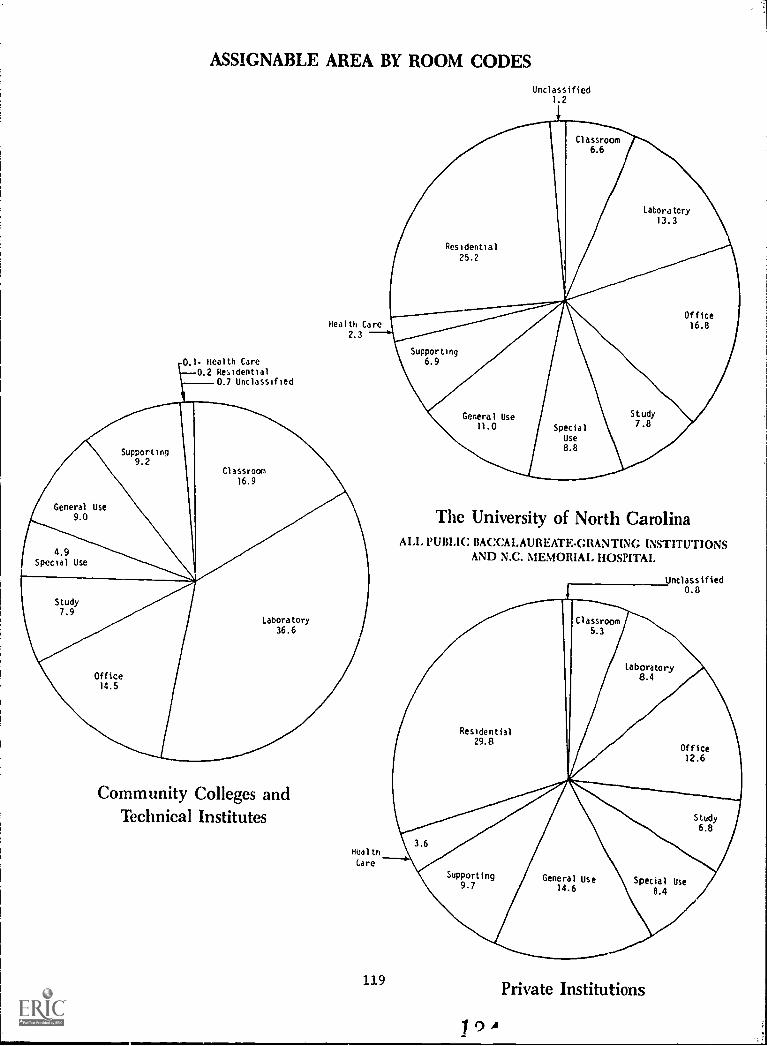
ASSIGNABLE AREA BY ROOM CODES
0.1- Health Care0.2 Residential
0 7 Unclassified
Health Care
2.3
Residential
25.2
Supporting6.9
General Use11.0
Unclassified1.2
Classroom6.6
SpecialUse
8.8
Laboratory
13.3
Study7.8
Office16.8
The University of North CarolinaALL PUBLIC BACCALAUREATE-GRANTING INSTITUTIONS
AND N.C. MEMORIAL HOSPITAL
Unclassified0.0
Community Colleges andTechnical Institutes
Heal th
Care
119
1 9 A
Private Institutions
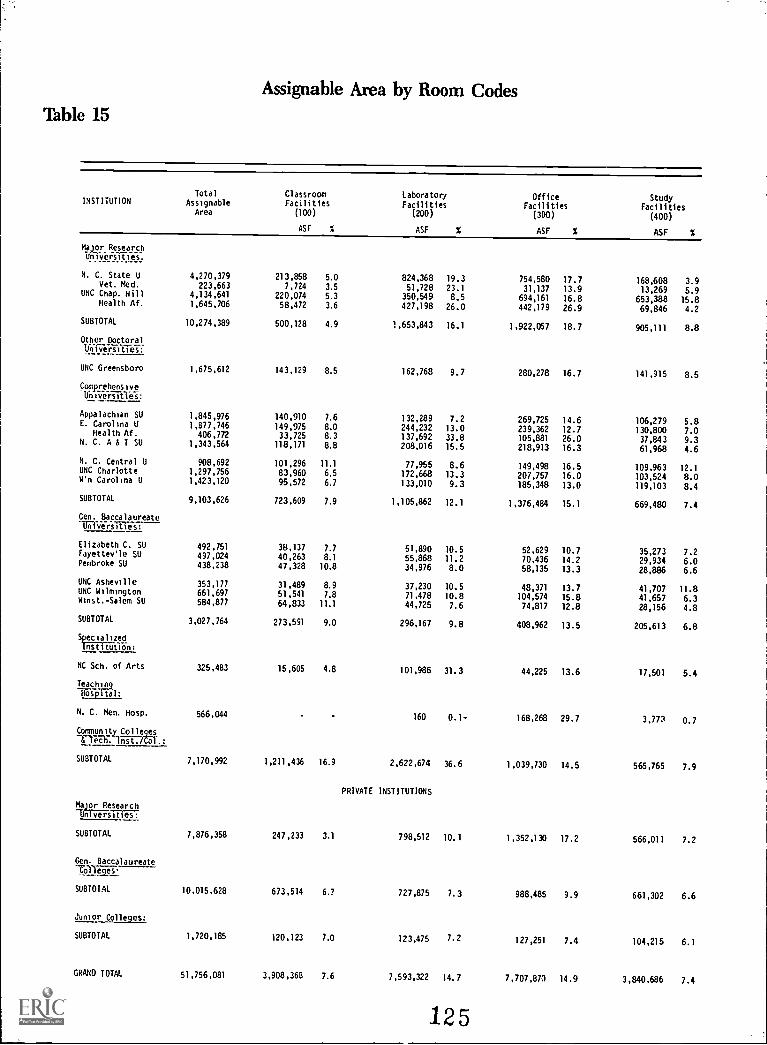
Assignable Area by Room CodesTable 15
INSTITUTIONTotal
AssignableArea
ClassroomFacilities
(100)
ASF %
LaboratoryFacilities
(200)
ASF S
OfficeFacilities
(300)
ASF S
StudyFacilities
(400)
ASF S
M4.19,e)?esed50UPIYTIPt)es.
N. C. State U 4,270,379 213,858 5.0 824,368 19.3 754,580 17.7 168,608 3.9Vet. Med. 223,663 7,724 3.5 51,728 23.1 31,137 13.9 13,269 5.9UNC Chap. Hill 4,134,641 220,074 5.3 350,549 8.5 694,161 16.8 653,388 15.8Health Af. 1,645,706 58,472 3.6 427,198 26.0 442,179 26.9 69,846 4.2
SUBTOTAL 10,274,389 500,128 4.9 1,653,843 16.1 1,922,057 18.7 905,111 8.8
Other DoctoralUniversities:
UNC Greensboro 1,675,612 143,129 8.5 162,768 9.7 280,278 16.7 141,915 8.5
Comprehensivelini-viFilli-e-i:
Appalachian SU 1,845,976 140,910 7.6 132,289 7.2 269,725 14.6 106,279 5.8E. Carolina U 1,877,746 149,975 8.0 244,232 13.0 239,362 12.7 130,800 7.0Health Af. 406,772 33,725 8.3 137,692 33.8 105,881 26.0 37,843 9.3N. C. A & T SU 1,343,564 118,171 8.8 208,016 15.5 218,913 16.3 61,968 4.6
N. C. Central U 908,692 101,296 11.1 77,955 8.6 149,498 16.5 109,963 12.1UNC Charlotte 1,297,756 83,960 6.5 172,668 13.3 207,757 16.0 103,524 8.0W'n Carolina U 1,423,120 95,572 6.7 133,010 9.3 185,348 13.0 119,103 8.4
SUBTOTAL 9,103,626 723,609 7.9 1,105,862 12.1 1,376,484 15.1 669,480 7.4
Gen. BaccalaureateIii Airsiliiis:
Elizabeth C. SU 492,751 38,137 7.7 51,890 10.5 52,629 10.7 35,273 7.2Fayettev'le SU 497,024 40,263 8.1 55,868 11.2 70,436 14.2 29,934 6.0Pembroke SU 438,238 47,328 10.8 34,976 8.0 58,135 13.3 28,886 6.6
UNC Asheville 353,177 31,489 8.9 37,230 10.5 48,371 13.7 41,707 11.8UHC Wilmington 661,697 51,541 7.8 71,478 10.8 104,574 15.8 41,657 6.3Winst.-Salem SU 584,877 64,833 11.1 44,725 7.6 74,817 12.8 28,156 4.8
SUBTOTAL 3,027,764 273,591 9.0 296,167 9.8 408,962 13.5 205,613 6.8Specialized
Institution:
NC Sch. of Arts 325.483 15,605 4.8 101,986 31.3 44,225 13.6 17,501 5.4
TeachHospital:
N. C. Mem. Hosp. 566.044 160 0.1- 168,268 29.7 3.773 0.7
Coctnunity Colleges
-&ra. ligT7651".:
SUBTOTAL 7,170,992 1,211,436 16.9 2,622,674 36.6 1,039,730 14.5 565,765 7.9
PRIVATE INSTITUTIONS
Major Research
Universities:
SUBTOTAL 7,876,358 247,233 3.1 798,512 10.1 1,352,130 17.2 566,011 7.2
Gen. Baccalaureate-01eAps.
SUBTOTAL 10,015,628 673,514 6.7 727.875 7.3 988,485 9.9 661,302 6.6
Junior Colleges:
SUBTOTAL 1,720,185 120,123 7.0 123,475 7.2 127,251 7.4 104,215 6.1
GRAND TOTAL 51,756,081 3,908,368 7.6 7,593,322 14.7 7,707,873 14.9 3,840,686 7.4
125
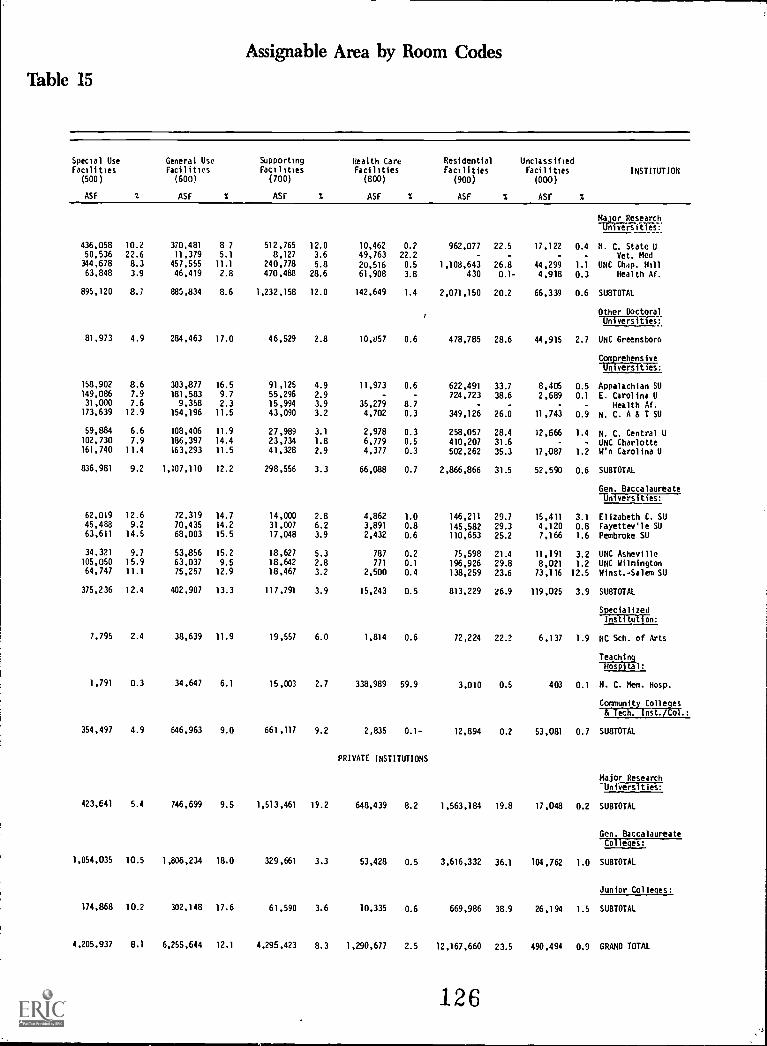
Assignable Area by Room Codes
Table 15
Special Use General Use Supporting Health Care Residential UnclassifiedFacilities Facilities Facilities Facilities Facilities Facilities
(500) (600) (700) (800) (900) (000)
ASF 1 ASF S ASF S ASF S ASF S ASF S
INSTITUTION
Major ResearchUniversities:
436,058 10.2 370,481 8 7 512,765 12.0 10,462 0.? 962,077 22.5 17,122 0.4 N. C. State U50,536 22.6 11,379 5.1 8,127 3.6 49,763 22.2 - - Vet. Med344,678 8.3 457,555 11.1 240,778 5.8 20,516 0.5 1,108,643 26.8 44,299 1.1 UNC Chdp. Hill63,848 3.9 46,419 2.8 470,488 28.6 61,908 3.8 430 0.1- 4,918 0.3 Health Af.
895,120 8.7 885,834 8.6 1,232,158 12.0 142,649 1.4 2,071,150 20.2 66,339 0.6 SUBTOTAL
Other DoctoralUniversities:
81,973 4.9 284,463 17.0 46,529 2.8 10,857 0.6 478,785 28.6 44,915 2.7 UNC Greensboro
CceprehensiveUniversities:
158,902 8.6 303,877 16.5 91,125 4.9 11,973 0.6 622,491 33.7 8,405 0.5 Appalachian SU149,086 7.9 181,583 9.7 55,296 2.9 - 724,723 38.6 2,689 0.1 E. Carolina U31,000 7.6 9,358 2.3 15,994 3.9 35,279 8.7 - - - Health Af.173,639 12.9 154,196 11.5 43,090 3.2 4,702 0.3 349,126 26.0 11,743 0.9 N. C. A 6 T SU
59,884 6.6 108,406 11.9 27,989 3.1 2,978 0.3 258,057 28.4 12,666 1.4 N. C. Central U102,730 7.9 186,397 14.4 23,734 1.8 6,779 0.5 410,207 31.6 - UNC Charlotte161,740 11.4 163,293 11.5 41,328 2.9 4,377 0.3 502,262 35.3 17,087 1.2 W'n Carolina U
836,981 9.2 1,107,110 12.2 298,556 3.3 66,088 0.7 2,866,866 31.5 52,590 0.6 SUBTOTAL
Gen. Baccalaureateljnlversities:
62,019 12.6 72.319 14.7 14,000 2.8 4,862 1.0 146,211 29.7 15,411 3.1 Elizabeth C. SU45,488 9.2 70,435 14.2 31,007 6.2 3,891 0.8 145,582 29.3 4,120 0.8 Fayettev'le SU63,611 14.5 68,003 15.5 17,048 3.9 2,432 0.6 110,653 25.2 7,166 1.6 Pembroke SU
34,321 9.7 53,856 15.2 18,627 5.3 787 0.2 75,598 21.4 11,191 3.2 UNC Asheville105,050 15.9 63,037 9.5 18,642 2.8 771 0.1 196,926 29.8 8,021 1.2 UNC Wilmington64,747 11.1 75,257 12.9 18,467 3.2 2,500 0.4 138.259 23.6 73,116 12.5 Winst.-Salem SU
375,236 12.4 402,907 13.3 117,791 3.9 15,243 0.5 813,229 26.9 119,025 3.9 SUBTOTAL
SpecializedInstitution:
7,795 2.4 38,639 11.9 19,557 6.0 1,814 0.6 72,224 22.2 6,137 1.9 NC Sch. of Arts
TeachingHospital!
1,791 0.3 34,647 6.1 15,003 2.7 338,989 59.9 3,010 0.5 403 0.1 N. C. Mem. Hosp.
Community Colleges6 Tech. 1nst. /Col.:
354,497 4.9 646,963 9.0 661,117 9.2 2,835 0.1- 12,894 0.2 53,081 0.7 SUBTOTAL
PRIVATE INSTITUTIONS
Major ResearchUniversities:
423,641 5.4 746,699 9.5 1,513,461 19.2 648,439 8.2 1,563,184 19.8 17,048 0.2 SUBTOTAL
Gen. BaccalaureateColleges:
1,054,035 10.5 1,806,234 18.0 329,661 3.3 53,428 0.5 3,616.332 36.1 104,762 1.0 SUBTOTAL
Junior Colleges:
174.868 10.2 302,148 17.6 61,590 3.6 10,335 0.6 669.986 38.9 26,194 1.5 SUBTOTAL
4,205,937 8.1 6,255,644 12.1 4,295,423 8.3 1.290,677 2.5 12,167,660 23.5 490,494 0.9 GRAND TOTAL
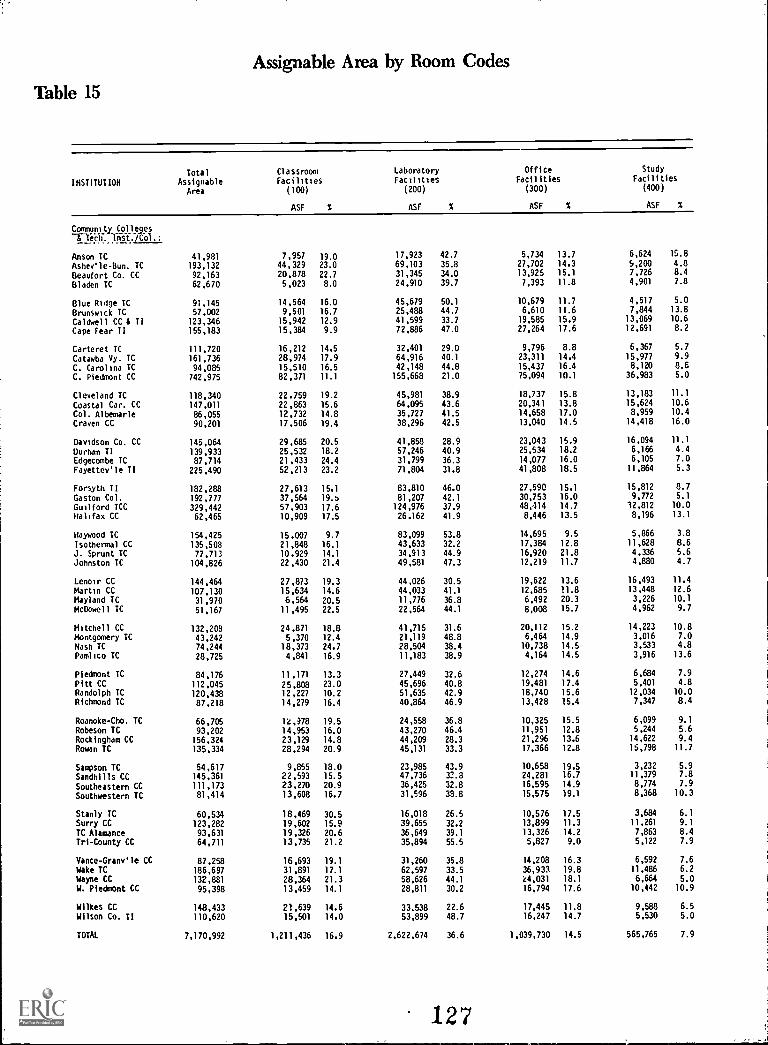
Assignable Area by Room Codes
Table 15
INSTITUTION
Total
AssignableArea
ClassroomFacilities
(100)
ASF X
LaboratoryFacilities
(200)
ASF X
OfficeFacilities
(300)
ASF X
Study
Facilities(400)
ASF %
Community Colleges-171iii. 61 . :
Anson TC 41,981 7,957 19.0 17,923 42.7 5,734 13.7 6,624 15.8
Ashev'le-Bun. TC 193,132 44,329 23.0 69,103 35.8 27,702 14.3 9,200 4.8
Beaufort Co. CC 92,163 20,878 22.7 31,345 34.0 13,925 15.1 7,726 8.4
Bladen TC 62,670 5,023 8.0 24,910 39.7 7,393 11.8 4,901 7.8
Blue Ridge TC 91,145 14,564 16.0 45,679 50.1 10,679 11.7 4,517 5.0
Brunswick TC 57,002 9,501 16.7 25,488 44.7 6,610 11.6 7,844 13.8
Caldwell CC i Ti 123,346 15,942 12.9 41,599 33.7 19,585 15.9 13,069 10.6
Cape Fear TI 155,183 15,384 9.9 72,886 47.0 27,264 17.6 12,691 8.2
Carteret TC 111,720 16,212 14.5 32,401 29.0 9,796 8.8 6,367 5.7
Catawba Vy. TC 161,736 28,974 17.9 64,916 40.1 23,311 14.4 15,977 9.9
C. Carolina TC 94,085 15,510 16.5 42,148 44.8 15,437 16.4 8,120 8.6
C. Piedmont CC 742,975 82,371 11.1 155,668 21.0 75,094 10.1 36,983 5.0
Cleveland TC 118,340 22.759 19.2 45,981 38.9 18,737 15.8 13,183 11.1
Coastal Car. CC 147,011 22,863 15.6 64,095 43.6 20,341 13.8 15,624 10.6
Col. Albemarle 86,055 12,732 14.8 35,727 41.5 14,658 17.0 8,959 10.4
Craven CC 90,201 17,506 19.4 38,296 42.5 13,040 14.5 14,418 16.0
Davidson Co. CC 145,064 29,685 20.5 41,858 28.9 23,043 15.9 16,094 11.1
Durham TI 139,933 25,532 18.2 57,246 40.9 25,534 18.2 6,166 4.4
Edgecombe TC 87,714 21,433 24.4 31,799 36.3 14,077 16.0 6,105 7.0
Fayettev'le TI 225,490 52,213 23.2 71,804 31.8 41,808 18.5 11,864 5.3
Forsyth Ti 182,288 27,613 15.1 83,810 46.0 27,590 15.1 15,812 8.7
Gaston Col. 192,777 37,564 19.0 81,207 42.1 30,753 16.0 9,772 5.1
Guilford TCC 329,442 57,903 17.6 124,976 37.9 48,414 14.7 12,812 10.0
Halifax CC 62,465 10,909 17.5 26.162 41.9 8,446 13.5 8,196 13.1
Haywood TC 154,425 15.007 9.7 83,099 53.8 14,695 9.5 5,866 3.8
Isothermal CC 135,508 21,848 16.1 43,633 32.2 17,384 12.8 11,628 8.6
J. Sprunt TC 77,713 10.929 14.1 34,913 44.9 16,920 21.8 4,336 5.6
Johnston TC 104,826 22,430 21.4 49,581 47.3 12,219 11.7 4,880 4.7
Lenoir CC 144,464 27,873 19.3 44,026 30.5 19,622 13.6 16,493 11.4
Martin CC 107,130 15,634 14.6 44,033 41.1 12,685 11.8 13,448 12.6
Mayland TC 31,970 6,564 20.5 11,776 36.8 6,492 20.3 3,226 10.1
McDowell TC 51,167 11,495 22.5 22,564 44.1 8,008 15.7 4,962 9.7
Mitchell CC 132,208 24,871 18.8 41,715 31.6 20,112 15.2 14,223 10.8
Montgomery TC 43,242 5,370 12.4 21,119 48.8 6,464 14.9 3,016 7.0
Nash TC 74,244 18,373 24.7 28,504 38.4 10,738 14.5 3,533 4.8
Pamlico TC 28,725 4,841 16.9 11,183 38.9 4,164 14.5 3,916 13.6
Piedmont TC 84,176 11,171 13.3 27,449 32.6 12,274 14.6 6,684 7.9
Pitt CC 112,045 25,808 23.0 45,696 40.8 19,481 17.4 5,401 4.8
Randolph TC 120,438 12,227 10.2 51,635 42.9 18,740 15.6 12,034 10.0
Richmond TC 87,218 14,279 16.4 40,864 46.9 13,428 15.4 7,347 8.4
Roanoke-Cho. TC 66,705 1Z,478 19.5 24,558 36.8 10,325 15.5 6,099 9.1
Robeson TC 93,202 14,953 16.0 43,270 46.4 11,951 12.8 5,244 5.6
Rockingham CC 156,324 23,129 14.8 44,209 28.3 21,296 13.6 14,622 9.4
Rowan TC 135,334 28,294 20.9 45,131 33.3 17,366 12.8 15,798 11.7
Sampson TC 54,617 9,855 18.0 23,985 43.9 10,658 19.5 3,232 5.9
Sandhills CC 145,361 22,593 15.5 47,736 32.8 24,281 16.7 11,379 7.8
Southeastern CC 111,173 23,270 20.9 36,425 32.8 16,595 14.9 8,774 7.9
Southwestern TC 81,414 13,608 16.7 31,596 38.8 15,575 19.1 8,368 10.3
Stanly TC 60,534 18,469 30.5 16,018 26.5 10,576 17.5 3,684 6.1
Surry CC 123,282 19,602 15.9 39,655 32.2 13,899 11.3 11,261 9.1
TC Alamance 93,631 19,326 20.6 36,649 39.1 13,326 14.2 7,863 8.4
Tri-County CC 64,711 13,735 21.2 35,894 55.5 5,827 9.0 5,122 7.9
Vance-Granv'le CC 87,258 16,693 19.1 31,260 35.8 14,208 16.3 6,592 7.6
Wake TC 186,697 31,891 17.1 62,597 33.5 36,933 19.8 11,486 6.2
Wayne CC 132,881 28,364 21.3 58,626 44.1 k4,031 18.1 6,664 5.0
W. Piedmont CC 95,398 13,459 14.1 28,811 30.2 16,794 17.6 10,442 10.9
Wilkes CC 148,433 21,639 14.6 33.538 22.6 17,445 11.8 9,588 6.5
Wilson Co. II 110,620 15,501 14.0 53,899 48.7 16,247 14.7 5,530 5.0
TOTAL 7,170,992 1,211,436 16.9 2,622,674 36.6 1,039,730 14.5 565,765 7.9
127101111 MIMIIMMIN
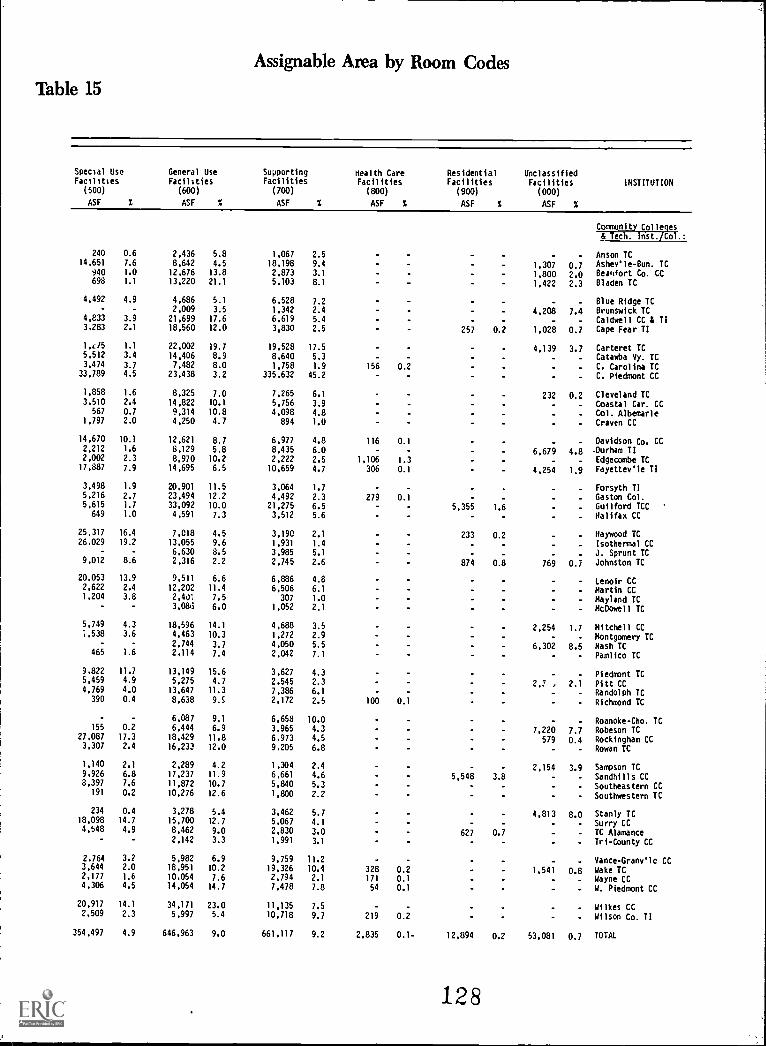
Assignable Area by Room Codes
Table 15
Special Use General UseFacilities Facilities
SupportingFacilities
Health CareFacilities
Residential UnclassifiedFacilities Facilities INSTITUTION
(500)
ASF %
(600)
ASF S
(700)
ASF
(800)
ASF
(900)
ASF S
(000)
ASF S
Community Colleges& Tech. Inst./Col.:
240 0.6 2,436 5.8 1,067 2.5 - - Anson TC14,651 7.6 8,642 4.5 18,198 9.4 1,307 0.7 Ashev'le-Bun. TC
940 1.0 12,676 13.8 2,873 3.1 :1=r1cco. CC698 1.1 13,220 21.1 5,103 8.1
4,492 4.9 4,686 5.1 6,528 7.2 . - Blue Ridge TC- 2,009 3.5 1,342 2.4 . 4,208 7.4 Brunswick TC
4,833 3.9 21,699 17.6 6,619 5.4 - - - Caldwell CC & TI3,283 2.1 18,560 12.0 3,830 2.5 257 0.2 1,028 0.7 Cape Fear TI
1.475 1.1 22,002 19.7 19,528 17.5 4,139 3.7 Carteret TC5,512 3.4 14,406 8.9 8,640 5.3 - - Catawba Vy. IC3,474 3.7 7,482 8.0 1,758 1.9 156 0.2 - C. Carolina TC33,789 4.5 23,438 3.2 335,632 45.2 - C. Piedmont CC
1,858 1.6 8,325 7.0 7,265 6.1 232 0.2 Cleveland TC3,510 2.4 14,822 10.1 5,756 3.9 - Coastal Car. CC
567 0.7 9,314 10.8 4,098 4.8 Col. Albemarle1,797 2.0 4,250 4.7 894 1.0 Craven CC
14,670 10.1 12,621 8.7 6,977 4.8 116 0.1 Davidson Co. CC2,212 1.6 8,129 5.8 8,435 6.0 6,679 4.8 Durham II2,002 2.3 8,970 10.2 2,222 2.5 1,106 1.3 Edgecombe TC17,887 7.9 14,695 6.5 10,659 4.7 306 0.1 4,254 1.9 Fayettevle TI
3,498 1.9 20,901 11.5 3,064 1.7 Forsyth TI5,216 2.7 23,494 12.2 4,492 2.3 279 0.1 Gaston Col.5,615 1.7 33,092 10.0 21,275 6.5 5,355 1.6 Guilford TCC649 1.0 4,591 7.3 3,512 5.6 . Halifax CC
25.317 16.4 7,018 4.5 3,190 2.1 233 0.2 Haywood TC26,029 19.2 13,055 9.6 1,931 1.4 - . Isothermal CC
- - 6,630 8.5 3,985 5.1 - - J. Sprunt TC9,012 8.6 2,316 2.2 2,745 2.6 874 0.8 769 0.7 Johnston TC
20,053 13.9 9,511 6.6 6,886 4.8 - Lenoir CC2,622 2.4 12,202 11.4 6,506 6.1 - Martin CC1,204 3.8 2,43' 7.5 307 1.0 - Mayland TC
- - 3,085 6.0 1,052 2.1 - McDowell TC
5,749 4.3 18,596 14.1 4,688 3.5 2,254 1.7 Mitchell CC1,538 3.6 4,463 10.3 1,272 2.9 - - Montgomery TC
- - 2,744 3.7 4,050 5.5 6,302 8.5 Nash TC465 1.6 2,114 7.4 2,042 7.1 - - Pamlico TC
9,822 11.7 13,149 15.6 3,627 4.3 Piedmont TC5,459 4.9 5,275 4.7 2.545 2.3 2,? , 2.1 Pitt CC4,769 4.0 13,647 11.3 7,366 6.1 Randolph TC
390 0.4 8,638 9.S 2,172 2.5 100 0.1 Richmond TC
- - 6,087 9.1 6,658 10.0 - - Roanoke-Cho. TC155 0.2 6,444 6.9 3,965 4.3 7,220 7.7 Robeson IC
27,087 17.3 18,429 11.8 6.973 4.5 579 0.4 Rockingham CC3,307 2.4 16,233 12.0 9.205 6.8 - Rowan IC
1,140 2.1 2,289 4.2 1,304 2.4 2,154 3.9 Sampson TC9,926 6.8 17,237 11.9 6,661 4.6 5,548 3.8 - Sandhills CC8,397 7.6 11,872 10.7 5,840 5.3 - - Southeastern CC
191 0.2 10,276 12.6 1,800 2.2 - Southwestern IC
234 0.4 3,278 5.4 3,462 5.7 4,813 8.0 Stanly TC18,098 14.7 15,700 12.7 5,067 4.1 Surry CC4,548 4.9 8,462 9.0 2,830 3.0 627 0.7 TC Alamance
- - 2,142 3.3 1,991 3.1 Tri-County CC
2,764 3.2 5,982 6.9 9,759 11.2 - - Vance-Granv'le CC3,644 2.0 18,951 10.2 19,326 10.4 328 0.2 1,541 0.8 Wake TC2,177 1.6 10,054 7.6 2,794 2.1 171 0.1 Wayne CC4,306 4.5 14,054 14.7 7,478 7.8 54 0.1 W. Piedmont CC
20,917 14.1 34,171 23.0 11,135 7.5 Wilkes CC2,509 2.3 5,997 5.4 10,718 9.7 219 0.2 Wilson Co. TI
354,497 4.9 646,963 9.0 661,117 9.2 2,835 0.1- 12,894 0.2 53,081 0.7 TOTAL
128
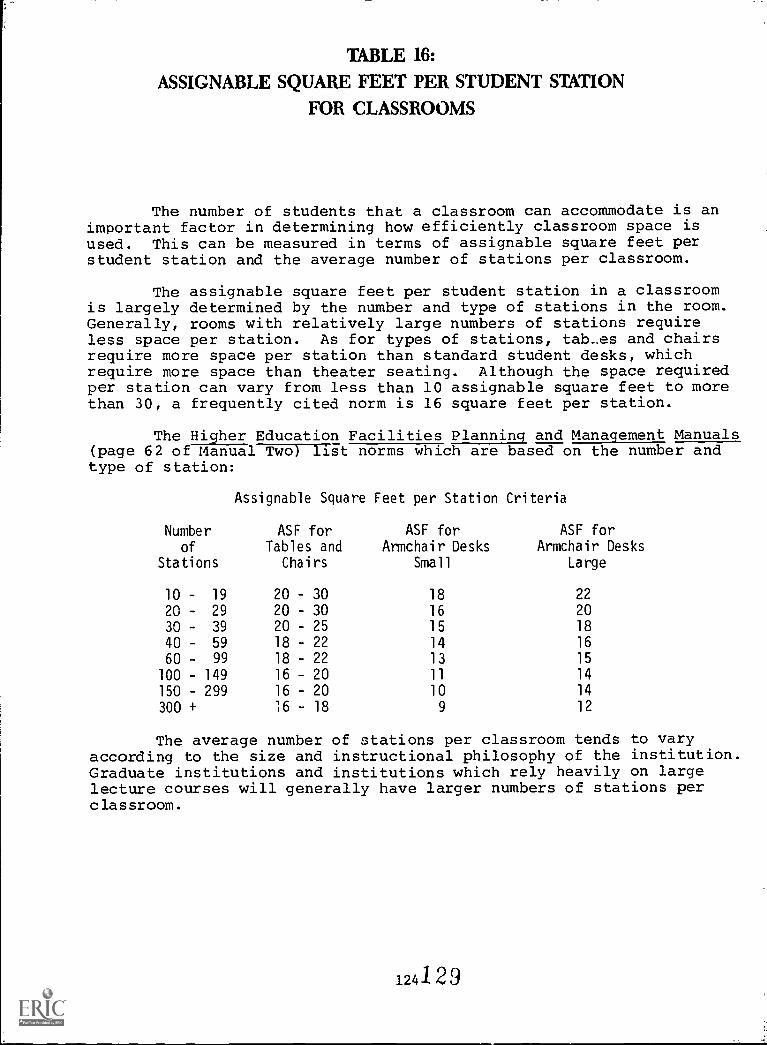
TABLE 16:
ASSIGNABLE SQUARE FEET PER STUDENT STATION
FOR CLASSROOMS
The number of students that a classroom can accommodate is animportant factor in determining how efficiently classroom space isused. This can be measured in terms of assignable square feet perstudent station and the average number of stations per classroom.
The assignable square feet per student station in a classroomis largely determined by the number and type of stations in the room.Generally, rooms with relatively large numbers of stations requireless space per station. As for types of stations, tab_es and chairsrequire more space per station than standard student desks, whichrequire more space than theater seating. Although the space requiredper station can vary from less than 10 assignable square feet to morethan 30, a frequently cited norm is 16 square feet per station.
The Higher Education Facilities Planning and Management Manuals(page 62 of Manual Two) list norms which are based on the number andtype of station:
Assignable Square Feet per Station Criteria
Numberof
Stations
ASF forTables and
Chairs
ASF forArmchair Desks
Small
ASF forArmchair Desks
Large
10 19 20 30 18 22
20 - 29 20 - 30 16 20
30 - 39 20 - 25 15 18
40 59 18 - 22 14 16
60 - 99 18 - 22 13 15
100 - 149 16 - 20 11 14
150 299 16 20 10 14
300 + 16 - 18 9 12
The average number of stations per classroom tends to varyaccording to the size and instructional philosophy of the institution.Graduate institutions and institutions which rely heavily on largelecture courses will generally have larger numbers of stations perclassroom.
124129
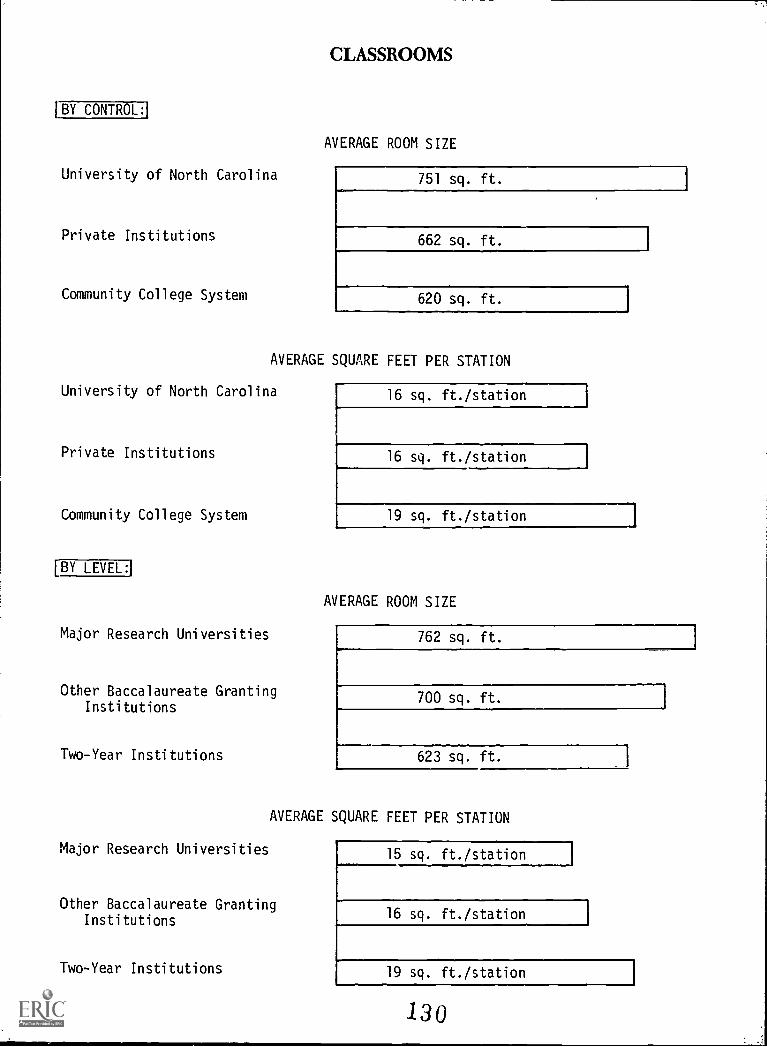
'BY CONTROL]
University of North Carolina
Private Institutions
Community College System
CLASSROOMS
AVERAGE ROOM SIZE
751 s4. ft.
662 s4. ft.
620 sq. ft.
AVERAGE SQUARE FEET PER STATION
University of North Carolina
Private Institutions
Community College System
[BY LEVEL:
Major Research Universities
Other Baccalaureate GrantingInstitutions
Two-Year Institutions
Major Research Universities
16 sq. ft./stationI
16 sq. ft./station1
19 sq. ft./station I
AVERAGE ROOM SIZE
762 sq. ft.
700 sq. ft.
623 s4. ft.
AVERAGE SQUARE FEET PER STATION
15 sq. ft./station I
16 sq. ft./station I
19 sq. ft./station I
Other Baccalaureate GrantingInstitutions
Two-Year Institutions
130
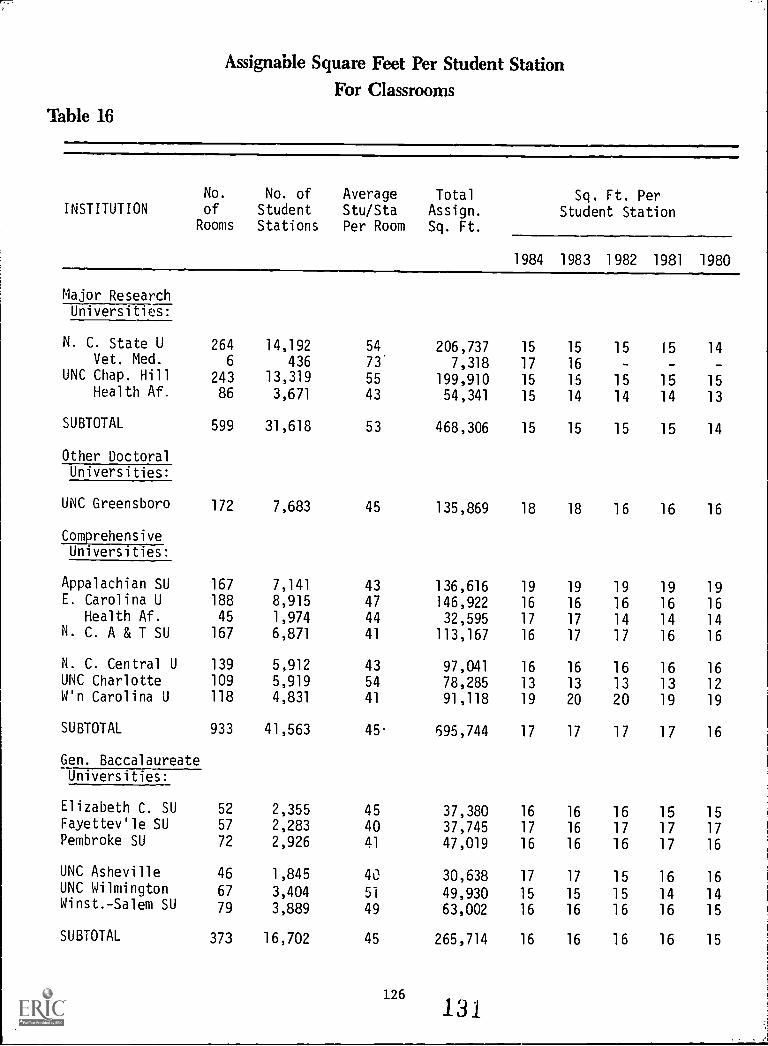
Assignable Square Feet Per Student StationFor Classrooms
Table 16
No. No. of Average TotalINSTITUTION of Student Stu/Sta Assign.
Rooms Stations Per Room Sq. Ft.
Sq. Ft. PerStudent Station
1984 1983 1982 1981 1980
Major ResearchUniversities:
N. C. State U 264 14,192 54 206,737 15 15 15 15 14Vet. Med. 6 436 73' 7,318 17 16 - - -
UNC Chap. Hill 243 13,319 55 199,910 15 15 15 15 15Health Af. 86 3,671 43 54,341 15 14 14 14 13
SUBTOTAL 599 31,618 53 468,306 15 15 15 15 14
Other DoctoralUniversities:
UNC Greensboro 172 7,683 45 135,869 18 18 16 16 16
ComprehensiveUniversities:
Appalachian SU 167 7,141 43 136,616 19 19 19 19 19E. Carolina U 188 8,915 47 146,922 16 16 16 16 16
Health Af. 45 1,974 44 32,595 17 17 14 14 14N. C. A & T SU 167 6,871 41 113,167 16 17 17 16 16
N. C. Central U 139 5,912 43 97,041 16 16 16 16 16UNC Charlotte 109 5,919 54 78,285 13 13 13 13 12W'n Carolina U 118 4,831 41 91,118 19 20 20 19 19
SUBTOTAL 933 41,563 45. 695,744 17 17 17 17 16
Gen. BaccalaureateUniversities:
Elizabeth C. SU 52 2,355 45 37,380 16 16 16 15 15Fayettev'le SU 57 2,283 40 37,745 17 16 17 17 17Pembroke SU 72 2,926 41 47,019 16 16 16 17 16
UNC Asheville 46 1,845 40 30,638 17 17 15 16 16UNC Wilmington 67 3,404 51 49,930 15 15 15 14 14Winst.-Salem SU 79 3,889 49 63,002 16 16 16 16 15
SUBTOTAL 373 16,702 45 265,714 16 16 16 16 15
126
131
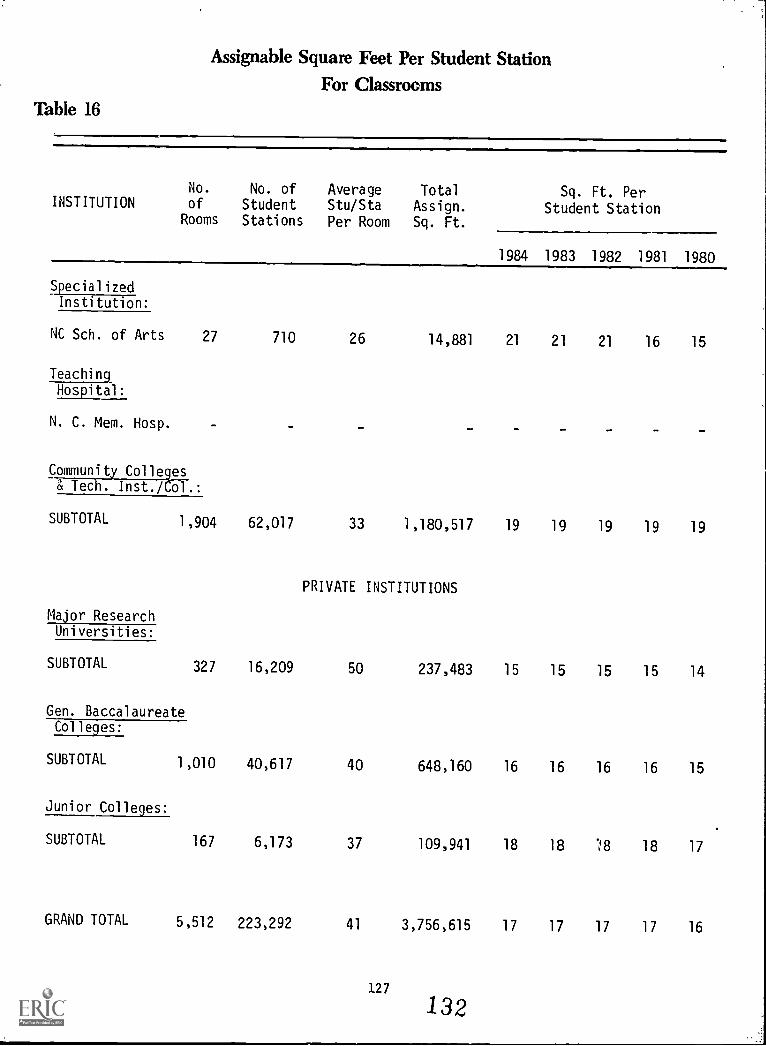
Assignable Square Feet Per Student StationFor Classrooms
Table 16
No.
INSTITUTION of
Rooms
No. ofStudentStations
AverageStu/StaPer Room
TotalAssign.Sq. Ft.
Sq. Ft. PerStudent Station
1984 1983 1982 1981 1980
SpecializedInstitution:
NC Sch. of Arts 27 710 26 14,881 21 21 21 16 15
Teaching.
Hospital:
N. C. Mem. Hosp.
Community Colleges& Tech. Inst./Col.:
SUBTOTAL 1,904 62,017 33 1,180,517 19 19 19 19 19
PRIVATE INSTITUTIONS
Major ResearchUniversities:
SUBTOTAL 327 16,209 50 237,483 15 15 15 15 14
Gen. BaccalaureateCol lees:
SUBTOTAL 1,010 40,617 40 648,160 16 16 16 16 15
Junior Colleges:
SUBTOTAL 167 6,173 37 109,941 18 18 .;13 18 17
GRAND TOTAL 5,512 223,292 41 3,756,615 17 17 17 17 16
127
132
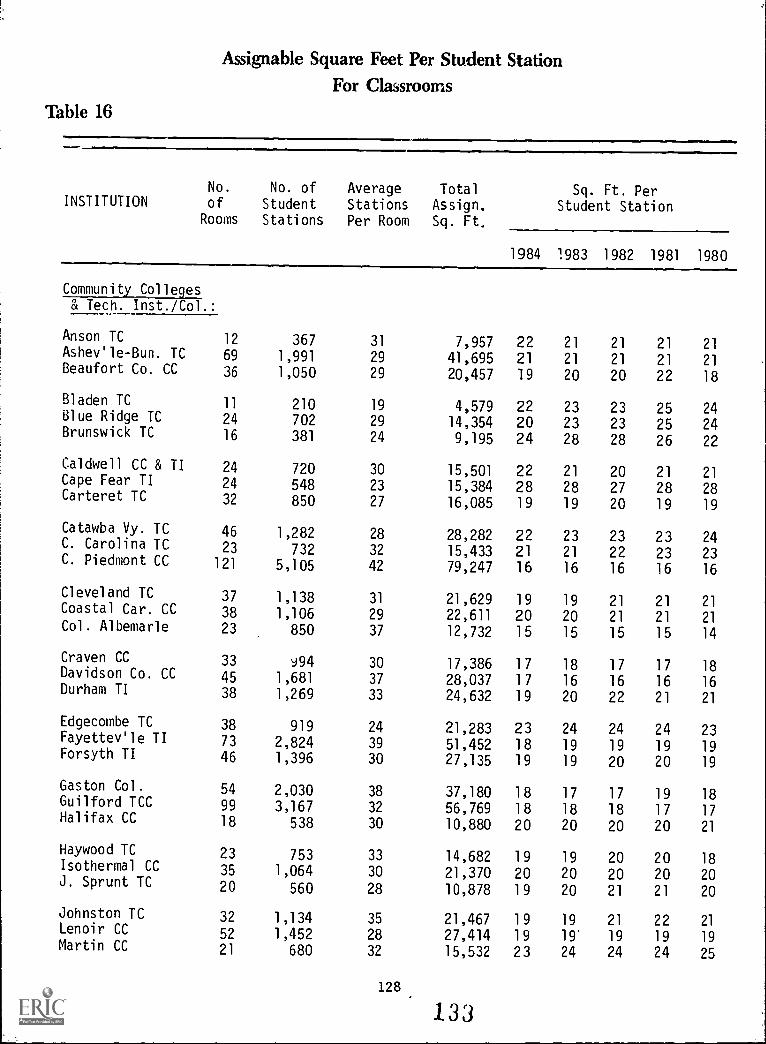
Assignable Square Feet Per Student StationFor Classrooms
Table 16
No. No. of Average TotalINSTITUTION of Student Stations Assign.
Rooms Stations Per Room Sq. Ft.
Sq. Ft. PerStudent Station
1984 1983 1982 1981 1980
Community Colleges& Tech. Inst./Col.:
Anson TC 12 367 31 7,957 22 21 21 21 21Ashev'le-Bun. TC 69 1,991 29 41,695 21 21 21 21 21Beaufort Co. CC 36 1,050 29 20,457 19 20 20 22 18
Bladen TC 11 210 19 4,579 22 23 23 25 24Blue Ridge TC 24 702 29 14,354 20 23 23 25 24Brunswick TC 16 381 24 9,195 24 28 28 26 22
Caldwell CC & TI 24 720 30 15,501 22 21 20 21 21Cape Fear TI 24 548 23 15,384 28 28 27 28 28Carteret IC 32 850 27 16,085 19 19 20 19 19
Catawba Vy. TC 46 1,282 28 28,282 22 23 23 23 24C. Carolina TC 23 732 32 15,433 21 21 22 23 23C. Piedmont CC 121 5,105 42 79,247 16 16 16 16 16
Cleveland TC 37 1,138 31 21,629 19 19 21 21 21Coastal Car. CC 38 1,106 29 22,611 20 20 21 21 21Col. Albemarle 23 850 37 12,732 15 15 15 15 14
Craven CC 33 994 30 17,386 17 18 17 17 18Davidson Co. CC 45 1,681 37 28,037 17 16 16 16 16Durham TI 38 1,269 33 24,632 19 20 22 21 21
Edgecombe TC 38 919 24 21,283 23 24 24 24 23Fayettev'le TI 73 2,824 39 51,452 18 19 19 19 19Forsyth TI 46 1,396 30 27,135 19 19 20 20 19
Gaston Col. 54 2,030 38 37,180 18 17 17 19 18Guilford TCC 99 3,167 32 56,769 18 18 18 17 17Halifax CC 18 538 30 10,880 20 20 20 20 21
Haywood TC 23 753 33 14,682 19 19 20 20 18Isothermal CC 35 1,064 30 21,370 20 20 20 20 20J. Sprunt TC 20 560 28 10,878 19 20 21 21 20
Johnston TC 32 1,134 35 21,467 19 19 21 22 21Lenoir CC 52 1,452 28 27,414 19 19. 19 19 19Martin CC 21 680 32 15,532 23 24 24 24 25
128
133
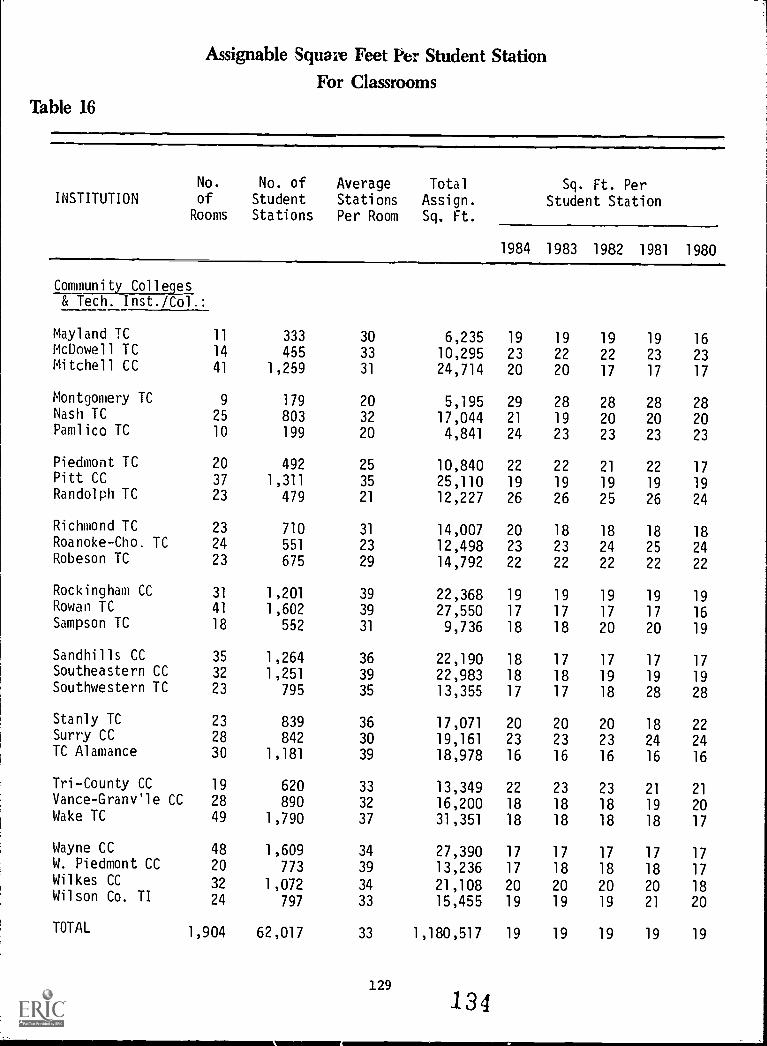
Assignable Square Feet Per Student StationFor Classrooms
Table 16
No. No. of Average TotalINSTITUTION of Student Stations Assign.
Rooms Stations Per Room Sq. Ft.
Sq. Ft. PerStudent Station
1984 1983 1982 1981 1980
Community Colleges& Tech. Inst./Col.:
Mayland TC 11 333 30 6,235 19 19 19 19 16McDowell TC 14 455 33 10,295 23 22 22 23 23Mitchell CC 41 1,259 31 24,714 20 20 17 17 17
Montgomery TC 9 179 20 5,195 29 28 28 28 28Nash TC 25 803 32 17,044 21 19 20 20 20Pamlico TC 10 199 20 4,841 24 23 23 23 23
Piedmont TC 20 492 25 10,840 22 22 21 22 17Pitt CC 37 1,311 35 25,110 19 19 19 19 19Randolph TC 23 479 21 12,227 26 26 25 26 24
Richmond TC 23 710 31 14,007 20 18 18 18 18Roanoke-Cho. TC 24 551 23 12,498 23 23 24 25 24Robeson TC 23 675 29 14,792 22 22 22 22 22
Rockingham CC 31 1,201 39 22,368 19 19 19 19 19Rowan TC 41 1,602 39 27,550 17 17 17 17 16Sampson TC 18 552 31 9,736 18 18 20 20 19
Sandhills CC 35 1,264 36 22,190 18 17 17 17 17Southeastern CC 32 1,251 39 22,983 18 18 19 19 19Southwestern TC 23 795 35 13,355 17 17 18 28 28
Stanly TC 23 839 36 17,071 20 20 20 18 22Surry CC 28 842 30 19,161 23 23 23 24 24TC Alamance 30 1,181 39 18,978 16 16 16 16 16
Tri-County CC 19 620 33 13,349 22 23 23 21 21Vance- Granv'le CC 28 890 32 16,200 18 18 18 19 20Wake TC 49 1,790 37 31,351 18 18 18 18 17
Wayne CC 48 1,609 34 27,390 17 17 17 17 17W. Piedmont CC 20 773 39 13,236 17 18 18 18 17Wilkes CC 32 1,072 34 21,108 20 20 20 20 18Wilson Co. TI 24 797 33 15,455 19 19 19 21 20
TOTAL 1,904 62,017 33 1,180,517 19 19 19 19 19
129
134
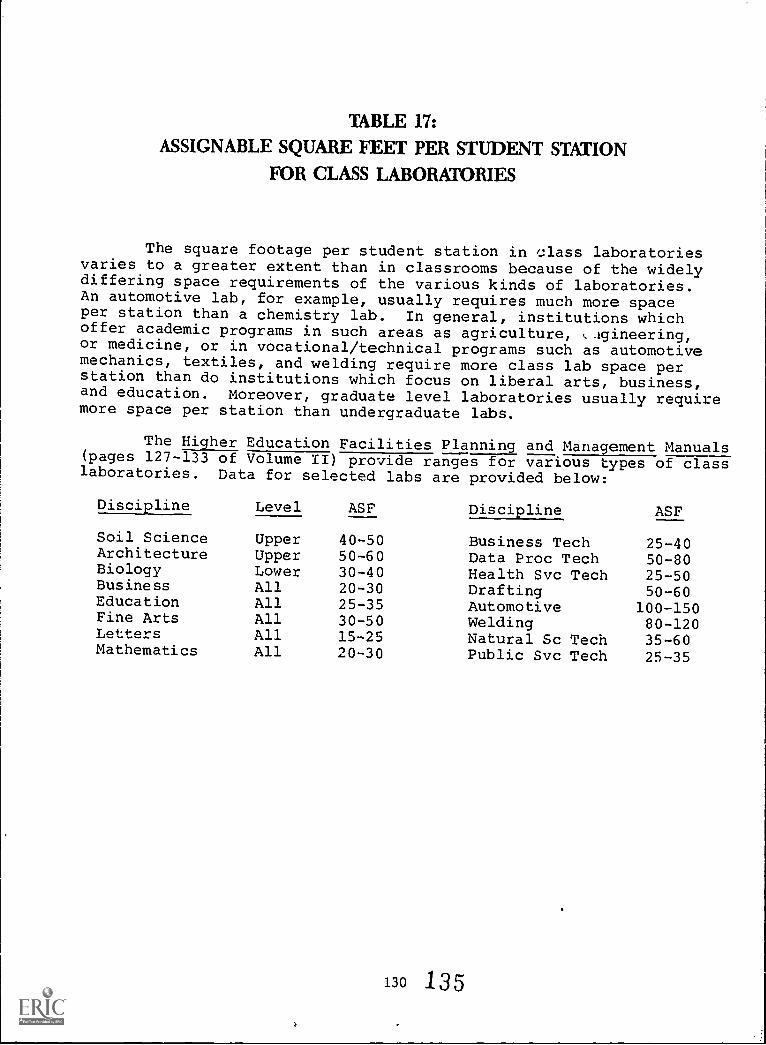
TABLE 17:
ASSIGNABLE SQUARE FEET PER STUDENT STATIONFOR CLASS LABORATORIES
The square footage per student station in ,..:lass laboratoriesvaries to a greater extent than in classrooms because of the widelydiffering space requirements of the various kinds of laboratories.An automotive lab, for example, usually requires much more spaceper station than a chemistry lab. In general, institutions whichoffer academic programs in such areas as agriculture, ,gineering,or medicine, or in vocational/technical programs such as automotivemechanics, textiles, and welding require more class lab space perstation than do institutions which focus on liberal arts, business,and education. Moreover, graduate level laboratories usually requiremore space per station than undergraduate labs.
The Higher Education Facilities Planning and Management Manuals(pages 127-133 of Volume II) provide ranges for various types of classlaboratories. Data for selected labs are provided below:
Discipline Level ASF Discipline ASF
Soil Science Upper 40-50 Business Tech 25-40Architecture Upper 50-60 Data Proc Tech 50-80Biology Lower 30-40 Health Svc Tech 25-50Business All 20-30 Drafting 50-60Education All 25-35 Automotive 100-150Fine Arts All 30-50 Welding 80-120Tazarc All 15-25 Natural Sc Tech 35-60Mathematics All 20-30 Public Svc Tech 25-35
130 135
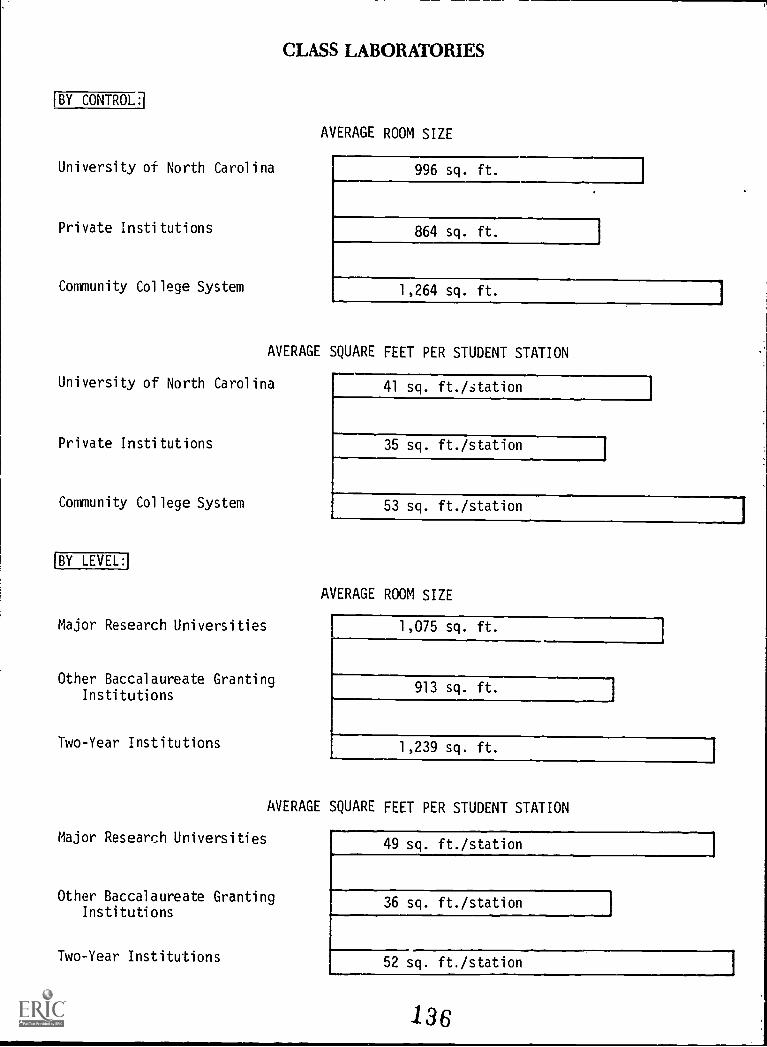
[BY CONTROL:]
University of North Carolina
Private Institutions
Community College System
CLASS LABORATORIES
AVERAGE ROOM SIZE
996 sq. ft.
864 sq. ft.
1
1,264 sq. ft.
AVERAGE SQUARE FEET PER STUDENT STATION
University of North Carolina
Private Institutions
Community College System
(BY LEVEL:I
Major Research Universities
Other Baccalaureate GrantingInstitutions
Two-Year Institutions
Major Research Universities
41 sq. ft. /station
35 sq. ft./station1
1
53 sq. ft./station
AVERAGE ROOM SIZE
1,075 sq. ft.
913 sq. ft.
i
1,239 sq. ft.1
AVERAGE SQUARE FEET PER STUDENT STATION
Other Baccalaureate GrantingInstitutions
Two-Year Institutions
49 sq. ft./station
36 sq. ft./station j52 sq. ft./station
136
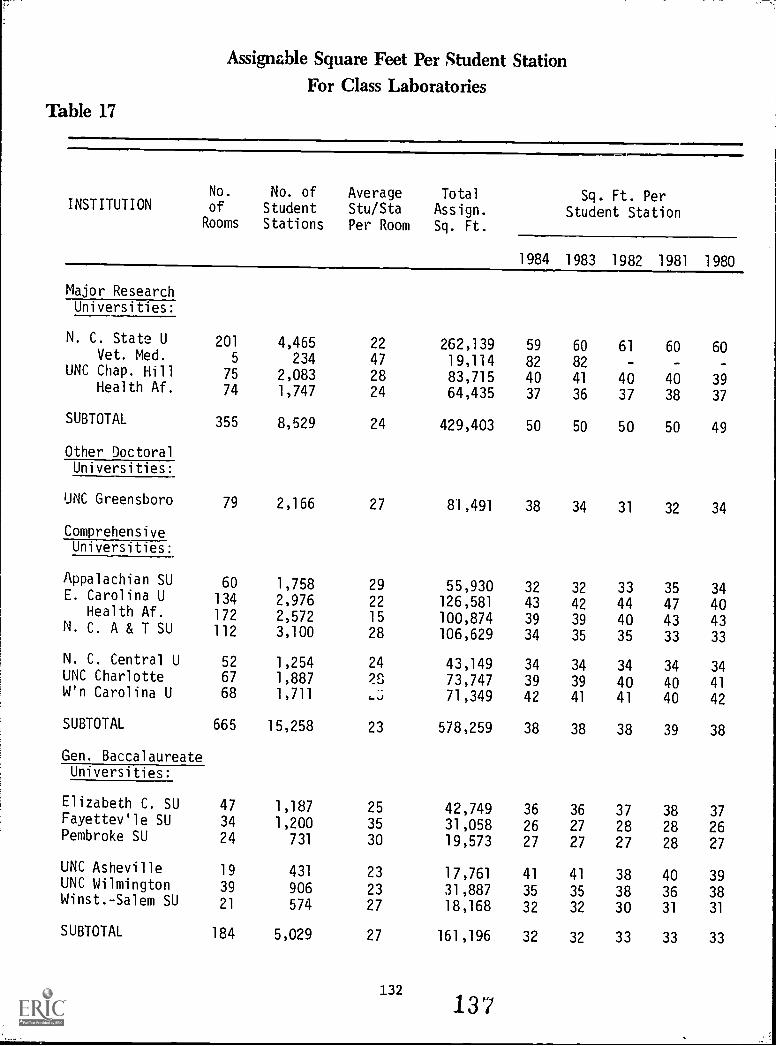
Assignable Square Feet Per Student StationFor Class Laboratories
Table 17
No. No. of Average TotalINSTITUTION of Student Stu/Sta Assign.
Rooms Stations Per Room Sq. Ft.
Sq. Ft. PerStudent Station
1984 1983 1982 1981 1980
Major ResearchUniversities:
N. C. State U 201 4,465 22 262,139 59 60 61 60 60Vet. Med. 5 234 47 19,114 82 82 - - -
UNC Chap. Hill 75 2,083 28 83,715 40 41 40 40 39Health Af. 74 1,747 24 64,435 37 36 37 38 37
SUBTOTAL 355 8,529 24 429,403 50 50 50 50 49
Other DoctoralUniversities:
UNC Greensboro 79 2,166 27 81,491 38 34 31 32 34
ComprehensiveUniversities:
Appalachian SU 60 1,758 29 55,930 32 32 33 35 34E. Carolina U 134 2,976 22 126,581 43 42 44 47 40
Health Af. 172 2,572 15 100,874 39 39 40 43 43N. C. A & T SU 112 3,100 28 106,629 34 35 35 33 33
N. C. Central U 52 1,254 24 43,149 34 34 34 34 34UNC Charlotte 67 1,887 26 73,747 39 39 40 40 41W'n Carolina U 68 1,711 ,...., 71,349 42 41 41 40 42
SUBTOTAL 665 15,258 23 578,259 38 38 38 39 38
Gen. BaccalaureateUniversities:
Elizabeth C. SU 47 1,187 25 42,749 36 36 37 38 37Fayettev'le SU 34 1,200 35 31,058 26 27 28 28 26Pembroke SU 24 731 30 19,573 27 27 27 28 27
UNC Asheville 19 431 23 17,761 41 41 38 40 39UNC Wilmington 39 906 23 31,887 35 35 38 36 38Winst.-Salem SU 21 574 27 18,168 32 32 30 31 31
SUBTOTAL 184 5,029 27 161,196 32 32 33 33 33
132
137
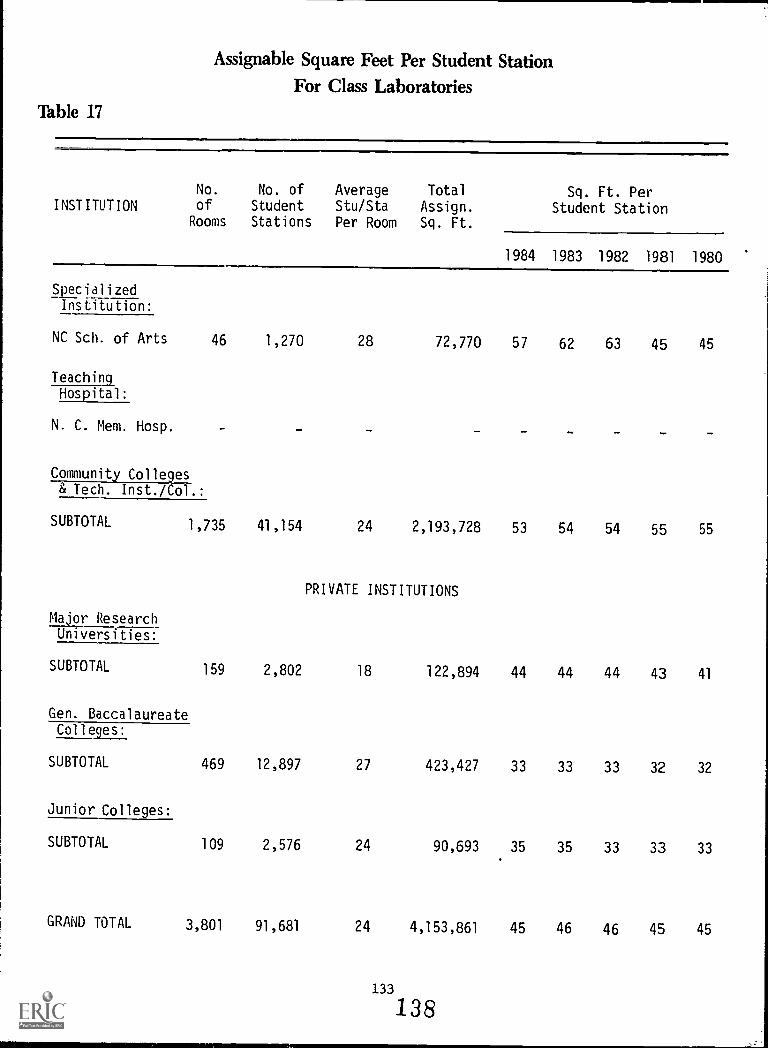
Assignable Square Feet Per Student StationFor Class Laboratories
Table 17
INSTITUTIONRooms
No.
ofNo. of
Student
Stations
AverageStu/StaPer Room
Total
Assign.Sq. Ft.
Sq. Ft. PerStudent Station
1984 1983 1982 1981 1980
Speci_alized
InstTfiltion:
NC Sch. of Arts 46 1,270 28 72,770 57 62 63 45 45
Teaching.
Hospital:
N. C. Mem. Hosp.
Community Colleges& Tech. Inst./Col.:
SUBTOTAL 1,735 41,154 24 2,193,728 53 54 54 55 55
PRIVATE INSTITUTIONS
Major ResearchUniversities:
SUBTOTAL 159 2,802 18 122,894 44 44 44 43 41
Gen. BaccalaureateColleges:
SUBTOTAL 469 12,897 27 423,427 33 33 33 32 32
Junior Colleges:
SUBTOTAL 109 2,576 24 90,693 35 35 33 33 33
GRAND TOTAL 3,801 91,681 24 4,153,861 45 46 46 45 45
133
138
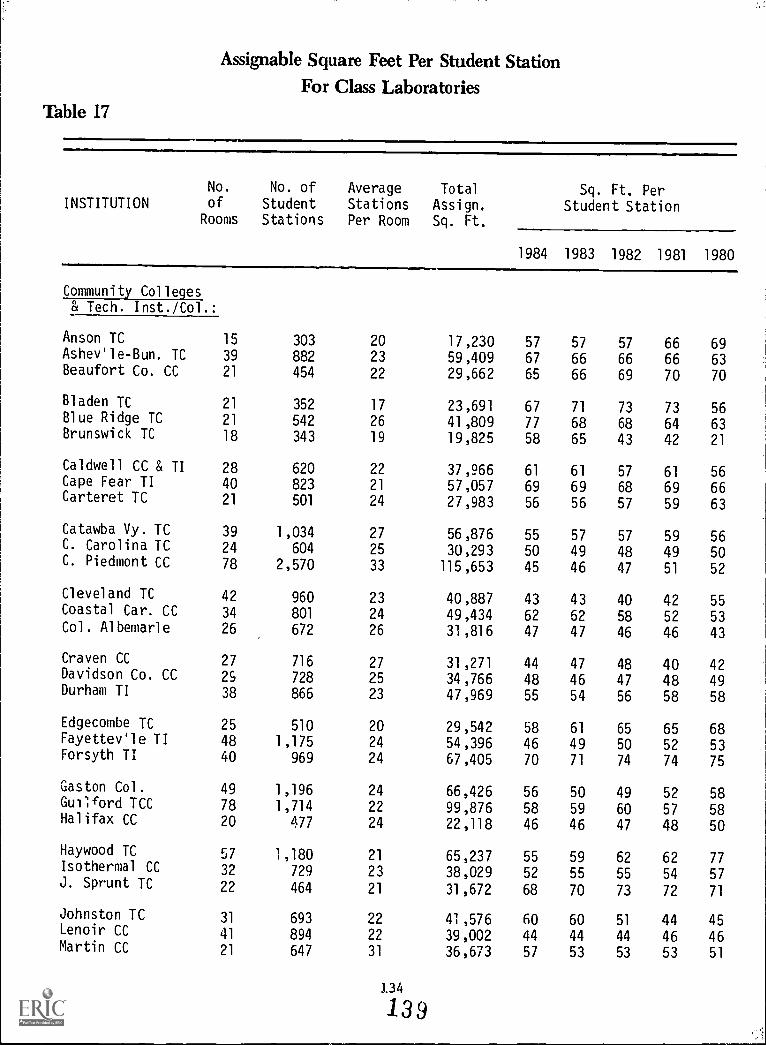
Assignable Square Feet Per Student StationFor Class Laboratories
Table 17
No. No. of Average TotalINSTITUTION of Student Stations Assign.
Rooms Stations Per Room Sq. Ft.
Sq. Ft. PerStudent Station
1984 1983 1982 1981 1980
Community Colleges& Tech. Inst./Col.:
Anson TC 15 303 20 17,230 57 57 57 66 69Ashev'le -Bun. TC 39 882 23 59,409 67 66 66 66 63Beaufort Co, CC 21 454 22 29,662 65 66 69 70 70
Bladen TC 21 352 17 23,691 67 71 73 73 56Blue Ridge TC 21 542 26 41,809 77 68 68 64 63Brunswick TC 18 343 19 19,825 58 65 43 42 21
Caldwell CC & TI 28 620 22 37,966 61 61 57 61 56Cape Fear TI 40 823 21 57,057 69 69 68 69 66Carteret TC 21 501 24 27,983 56 56 57 59 63
Catawba Vy. TC 39 1,034 27 56,876 55 57 57 59 56C. Carolina TC 24 604 25 30,293 50 49 48 49 50C. Piedmont CC 78 2,570 33 115,653 45 46 47 51 52
Cleveland TC 42 960 23 40,887 43 43 40 42 55Coastal Car. CC 34 801 24 49,434 62 62 58 52 53Col. Albemarle 26 672 26 31,816 47 47 46 46 43
Craven CC 27 716 27 31,271 44 47 48 40 42Davidson Co. CC 2S 728 25 34,766 48 46 47 48 49Durham TI 38 866 23 47,969 55 54 56 58 58
Edgecombe TC 25 510 20 29,542 58 61 65 65 68Fayettev'le TI 48 1,175 24 54,396 46 49 50 52 53Forsyth TI 40 969 24 67,405 70 71 74 74 75
Gaston Col. 49 1,196 24 66,426 56 50 49 52 58Guilford TCC 78 1,714 22 99,876 58 59 60 57 58Halifax CC 20 477 24 22,118 46 46 47 48 50
Haywood TC 57 1,180 21 65,237 55 59 62 62 77Isothermal CC 32 729 23 38,029 52 55 55 54 57J. Sprunt TC 22 464 21 31,672 68 70 73 72 71
Johnston TC 31 693 22 41,576 60 60 51 44 45Lenoir CC 41 894 22 39,002 44 44 44 46 46Martin CC 21 647 31 36,673 57 53 53 53 51
134
139
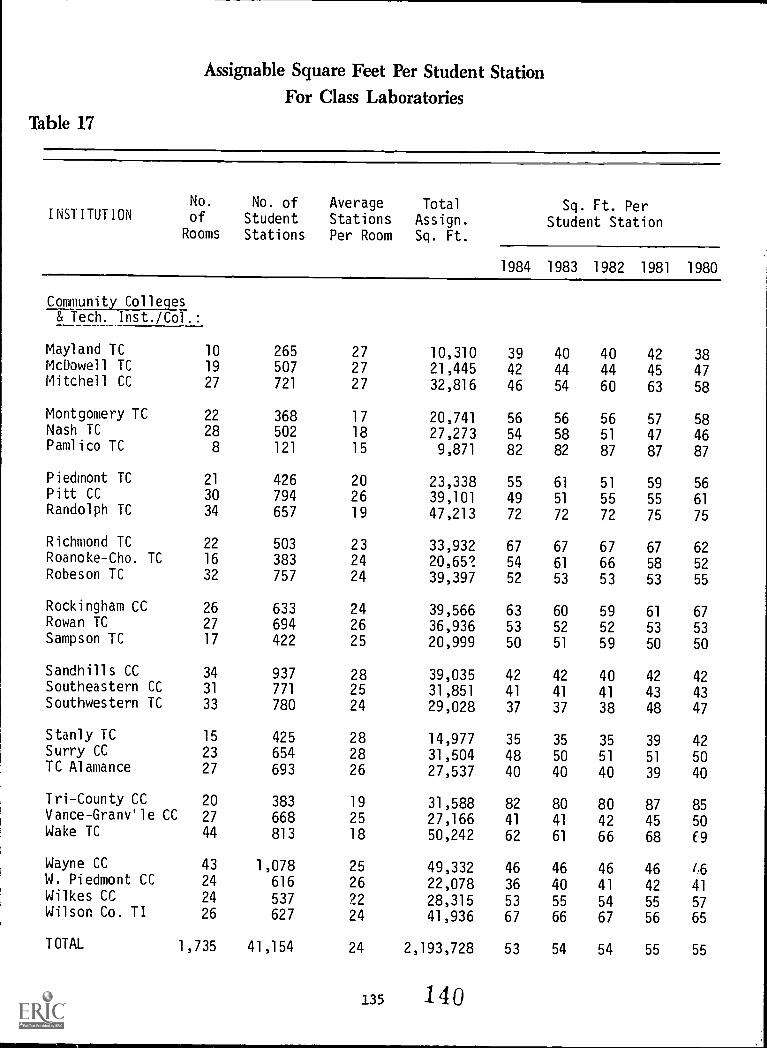
Assignable Square Feet Per Student StationFor Class Laboratories
Table 17
INSTITUTIONNo. No. of Average Totalof Student Stations Assign.Rooms Stations Per Room Sq. Ft.
Sq. Ft. PerStudent Station
1984 1983 1982 1981 1980
Community Colleges& Tech. Inst./Col.:
Mayland TC 10 265 27 10,310 39 40 40 42 38McDowell TC 19 507 27 21,445 42 44 44 45 47Mitchell CC 27 721 27 32,816 46 54 60 63 58
Montgomery TC 22 368 17 20,741 56 56 56 57 58Nash TC 28 502 18 27,273 54 58 51 47 46Pamlico TC 8 121 15 9,871 82 82 87 87 87
Piedmont TC 21 426 20 23,338 55 61 51 59 56Pitt CC 30 794 26 39,101 49 51 55 55 61Randolph TC 34 657 19 47,213 72 72 72 75 75
Richmond TC 22 503 23 33,932 67 67 67 67 62Roanoke-Cho. TC 16 383 24 20,65? 54 61 66 58 52Robeson TC 32 757 24 39,397 52 53 53 53 55
Rockingham CC 26 633 24 39,566 63 60 59 61 67Rowan TC 27 694 26 36,936 53 52 52 53 53Sampson TC 17 422 25 20,999 50 51 59 50 50
Sandhills CC 34 937 28 39,035 42 42 40 42 42Southeastern CC 31 771 25 31,851 41 41 41 43 43Southwestern TC 33 780 24 29,028 37 37 38 48 47
Stanly TC 15 425 28 14,977 35 35 35 39 42Surry CC 23 654 28 31,504 48 50 51 51 50TC Alamance 27 693 26 27,537 40 40 40 39 40
Tri-County CC 20 383 19 31,588 82 80 80 87 85Vance- Granv'le CC 27 668 25 27,166 41 41 42 45 50Wake TC 44 813 18 50,242 62 61 66 68 f9
Wayne CC 43 1,078 25 49,332 46 46 46 46 1,6W. Piedmont CC 24 616 26 22,078 36 40 41 42 41Wilkes CC 24 537 22 28,315 53 55 54 55 57Wilson Co. TI 26 627 24 41,936 67 66 67 56 65
TOTAL 1,735 41,154 24 2,193,728 53 54 54 55 55
135 1 4 0
1
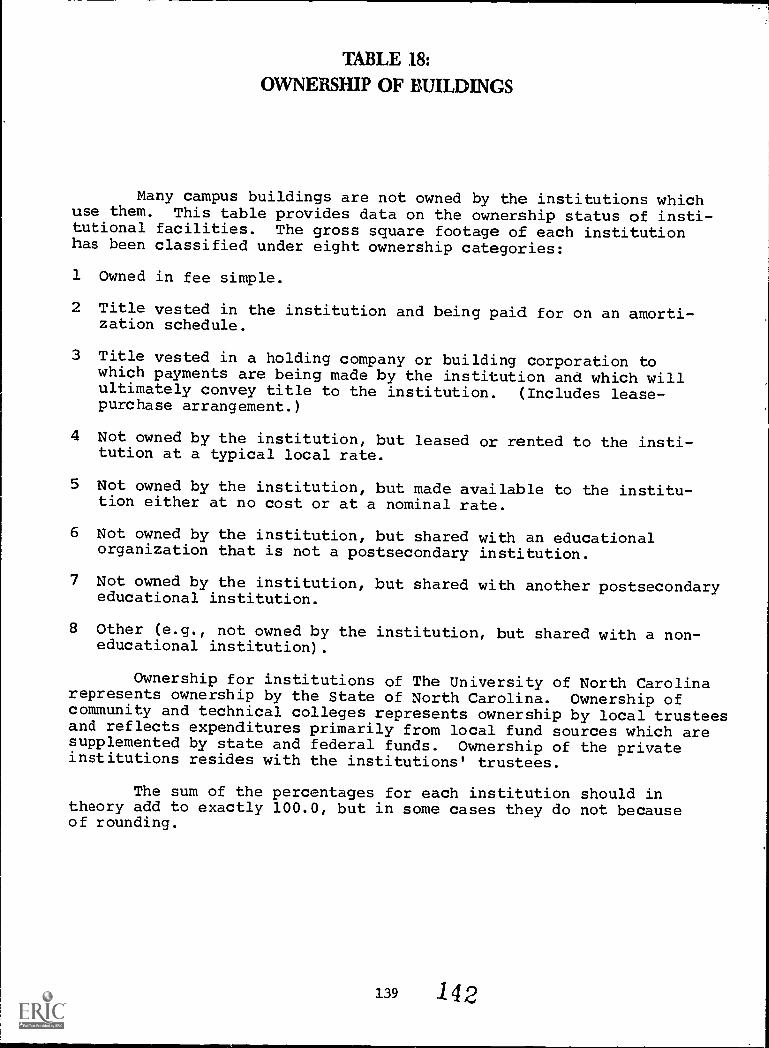
TABLE 18:
OWNERSHIP OF BUILDINGS
Many campus buildings are not owned by the institutions whichuse them. This table provides data on the ownership status of insti-tutional facilities. The gross square footage of each institutionhas been classified under eight ownership categories:
1 Owned in fee simple.
2 Title vested in the institution and being paid for on an amorti-zation schedule.
3 Title vested in a holding company or building corporation towhich payments are being made by the institution and which willultimately convey title to the institution. (Includes lease-purchase arrangement.)
4 Not owned by the institution, but leased or rented to the insti-tution at a typical local rate.
5 Not owned by the institution, but made available to the institu-tion either at no cost or at a nominal rate.
6 Not owned by the institution, but shared with an educationalorganization that is not a postsecondary institution.
7 Not owned by the institution, but shared with another postsecondaryeducational institution.
8 Other (e.g., not owned by the institution, but shared with a non-educational institution).
Ownership for institutions of The University of North Carolinarepresents ownership by the State of North Carolina. Ownership ofcommunity and technical colleges represents ownership by local trusteesand reflects expenditures primarily from local fund sources which aresupplemented by state and federal funds. Ownership of the privateinstitutions resides with the institutions' trustees.
The sum of the percentages for each institution should intheory add to exactly 100.0, but in some cases they do not becauseof rounding.
139 142
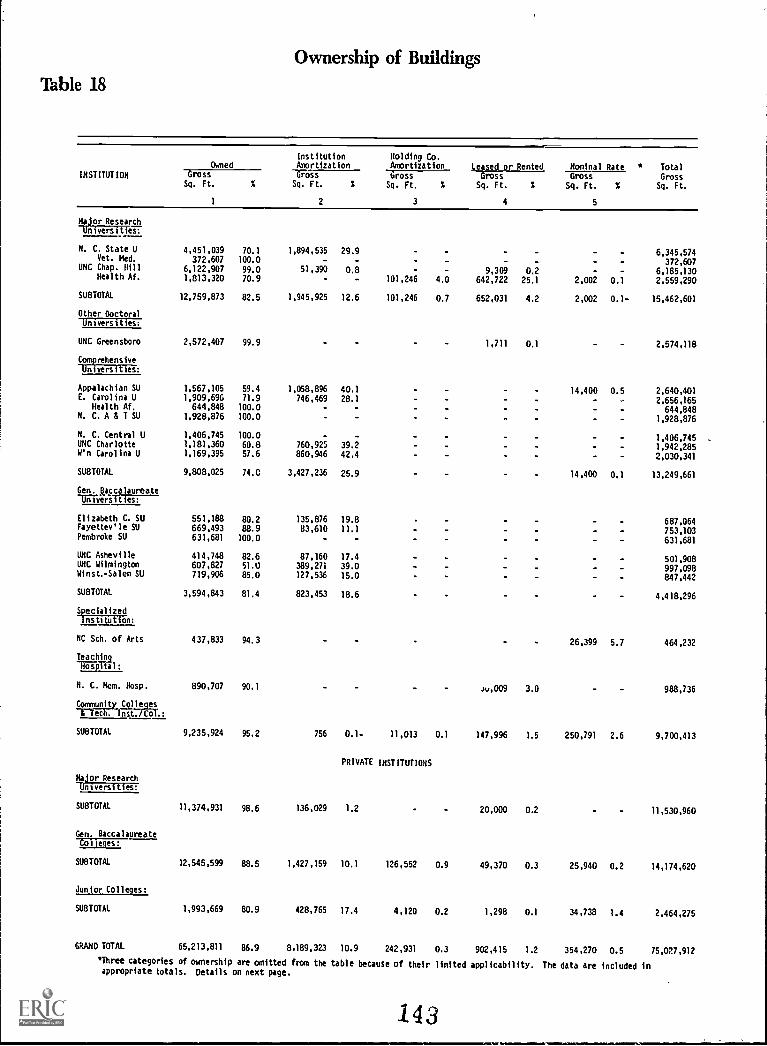
Ownership of Buildings
Table 18
INSTITUTION
OwnedInstitutionAmortization
Holding Co.Amortization Leased or Rented Nominal Rate * Total
GrossSq. Ft.
GrossSq. Ft.
1
5nisSq. Ft.
2
%
GrossSq. Ft. %
3
GrossSq. Ft. %
4
GrossSq. Ft. %
5
Major ResearchUniversities:
N. C. State U 4,451,039 70.1 1,894,535 29.9 6,345,574Vet. Med. 372,607 100.0 - - - - - 372,607
UNC Chap. Hill 6,122,907 99.0 51,390 0.8 - 9,309 0.2 - - 6,185,130Health Af. 1,813,320 70.9 - - 101,246 4.0 642,722 25.1 2,002 0.1 2,559,290
SUBTOTAL 12,759,873 82.5 1,945,925 12.6 101,246 0.7 652,031 4.2 2,002 0.1- 15,462,601
Other Doctoralaiversities:
UNC Greensboro 2,572,407 99.9 1,711 0.1 2,574,118
ComRrehensiveUniversities:
Appalachian SU 1,567,105 59.4 1,058,896 40.1 14,400 0.5 2,640,401E. Carolina U 1,909,696 71.9 746,469 28.1 2,656,165
Health Af. 644,848 100.0 644,848N. C. A & T SU 1,928,876 100.0 1,928,876
N. C. Central U 1,406,745 100.0 1,406,745UNC Charlotte 1,181,360 60.8 760,925 39.2 1,942,285W'n Carolina U 1,169,395 57.6 860,946 42.4 2,030,341
SUBTOTAL 9,808,025 74.0 3,427,236 25.9 14,400 0.1 13,249,661
Gen. Baccalaureate07"CiversTil
Elizabeth C. SU 551,188 80.2 135,876 19.8 687,064Fayettev'le SU 669,493 88.9 83,610 11.1 753,103Pembroke SU 631,681 100.0 631,681
UNC Asheville 414,748 82.6 87,160 17.4 501,908UNC Wilmington 607,827 51.0 389,27i 39.0 997,098Winst.-Salem SU 719,906 85.0 127,536 15.0 847,442
SUBTOTAL 3,594,843 81.4 823,453 18.6 4,418,296
SpecializedInstitution:
NC Sch. of Arts 437,833 94.3 26,399 5.7 464,232
Teaching-"Rc7s-prEil:
N. C. Hem. Hosp. 890,707 90.1 - iv,009 3.0 988,736
Communit Colic es-L7ec . -IFs1:.761.:
SUBTOTAL 9,235,924 95.2 756 0.1- 11,013 0.1 147,996 1.5 250,791 2.6 9,700,413
PRIVATE INSTITUTIONS
Major ResearchUniversities:
SUBTOTAL 11,374,931 98.6 136,029 1.2 20,000 0.2 11,530,960
Gen. Baccalaureate
17.11FIE7
SUBTOTAL 12,545,599 88.5 1,427,159 10.1 126,552 0.9 49,370 0.3 25,940 0.2 14,174,620
Junior Colleges:
SUBTOTAL 1,993,669 80.9 428,765 17.4 4,120 0.2 1,298 0.1 34,738 1.4 2,464,275
GRAND TOTAL 65,213,811 86.9 8.189,323 10.9 242,931 0.3 902,415 1.2 354,270 0.5 75,027,912
*Three categories of ownership are omitted from the table because of their limited applicability. The data are included inappropriate totals. Details on next page.
143
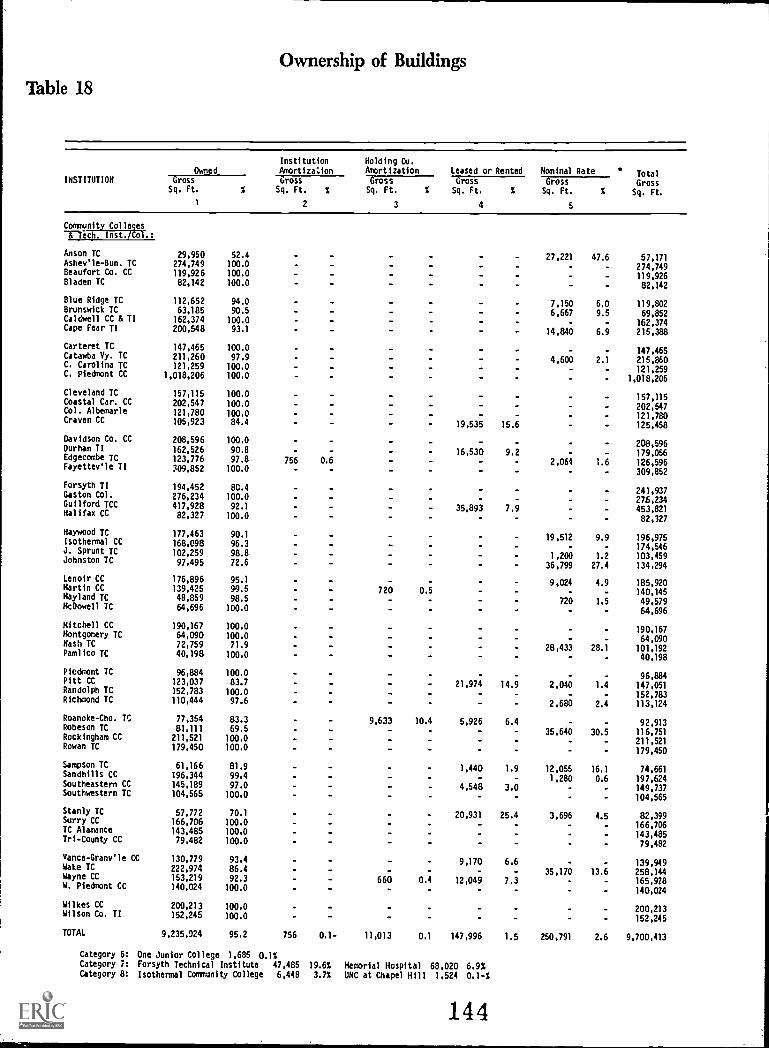
Ownership of Buildings
Table 18
Institution
Owned AmortizationHolding Co.Amortization Leased or Rented Nominal Rate * Total
GrossSq. Ft.
INSTITUTION Gross GrossSq. Ft. % Sq. Ft. S
1 2
uross GrossSq. Ft. % Sq. Ft. S
3 4
Bros-'- s
Sq. Ft. %
5
Community Colleges-X-Tech. Inst./Col.:
Anson TC 29,950 52.4 - 27,221 47.6 57,171Ashev'le-Bun. TC 274,749 100.0 - - 274,749Beaufort Co. CC 119,926 100.0 - 119,926Bladen IC 82,142 100.0 82,142
Blue Ridge TC 112,652 94.0 7,150 6.0 119,802Brunswick TC 63,185 90.5 6,667 9.5 69,852Caldwell CC & TI 162,374 100.0 162,374Cape Fear TI 200,548 93.1 14,840 6.9 215,388
Carteret TC 147,465 100.0 147,465Catawba Vy. TC 211,260 97.9 4,600 2.1 215,860C. Carolina TC 121,259 100.0 121,259C. Piedmont CC 1,018,206 100.0 1,018,206
Cleveland TC 157,115 100.0 157,115Coastal Car. CC 202,547 100.0 202,547Col. Albemarle 121,780 100.0 121.780Craven CC 105,923 84.4 19,535 15.6 125,458
Davidson Co. CC 208,596 100.0 - - - 208,596Durham TI 162,526 90.8 16,530 9.2 179,056Edgecombe TC 123,776 97.8 756 0.6 2,064 1.6 126,596Fayettev'le TI 309,852 100.0 309,852
Forsyth TI 194,452 80.4 241,937Gaston Col. 276,234 100.0 276,234Guilford TCC 417,928 92.1 35,893 7.9 453,821Halifax CC 82,327 100.0 82,327
Haywood TC 177,463 90.1 - - 19,512 9.9 196,975Isothermal CC 168,098 96.3 -- 174,546J. Sprunt TC 102,259 98.8 - 1,200 1.2 103,459Johnston TC 97,495 72.6 - 36,799 27.4 134,294
Lenoir CC 176,896 95.1 - 9,024 4.9 185,920Martin CC 139,425 99.5 720 0.5 140,145Mayland TC 48,859 98.5 - - 720 1.5 49,579McDowell TC 64,696 100.0 - 64,696
Mitchell CC 190,167 100.0 190,167Montgomery TC 64,090 100.0 - 64,090Nash TC 72,759 71.9 28,433 28.1 101,192Pamlico TC 40,198 100.0 40.198
Piedmont TC 96,884 100.0 96,884Pitt CC 123,037 83.7 21,974 14.9 2,040 1.4 147,051Randolph TC 152,783 100.0 152,783Richmond IC 110,444 97.6 2,680 2.4 113,124
Roanoke-Cho. IC 77,354 83.3 9,633 10.4 5,926 6.4 92,913Robeson TC 81,111 69.5 - - - 35,640 30.5 116,751Rockingham CC 211,521 100.0 - - 211.521Rowan TC 179,450 100.0
179,450
Sampson TC 61,166 81.9 1,440 1.9 12,055 16.1 74,661Sandhills CC 196,344 99.4 1,280 0.6 197,624Southeastern CC 145,189 97.0 4,548 3.0 149,737Southwestern IC 104,565 100.0 104,565
Stanly TC 57,772 70.1 20,931 25.4 3,696 4.5 82,399Surry CC 166,706 100.0 166,706IC Alamance 143,485 100.0 143,485Tri-County CC 79,482 100.0 79,482
vance-Granv'le CC 130,779 93.4 9,170 6.6 139,949Wake TC 222,974 86.4 35,170 13.6 258,144Wayne CC 153,219 92.3 660 0.4 12,049 7.3 165,928W. Piedmont CC 140,024 100.0 140,024
Wilkes CC 200,213 100.0 200,213Wilson Co. TI 152,245 100.0 152,245
TOTAL 9,235,924 95.2 756 0.1- 11,013 0.1 147,996 1.5 250,791 2.6 9,700,413
Category 6: One Junior College 1,685 0.1%Category 7: Forsyth Technical Institute 47,485 19.6% Memorial Hospital 68,020 6.9%Category 8: Isothermal Community College 6,448 3.7% UNC at Chapel Hill 1,524 0.1-%
144
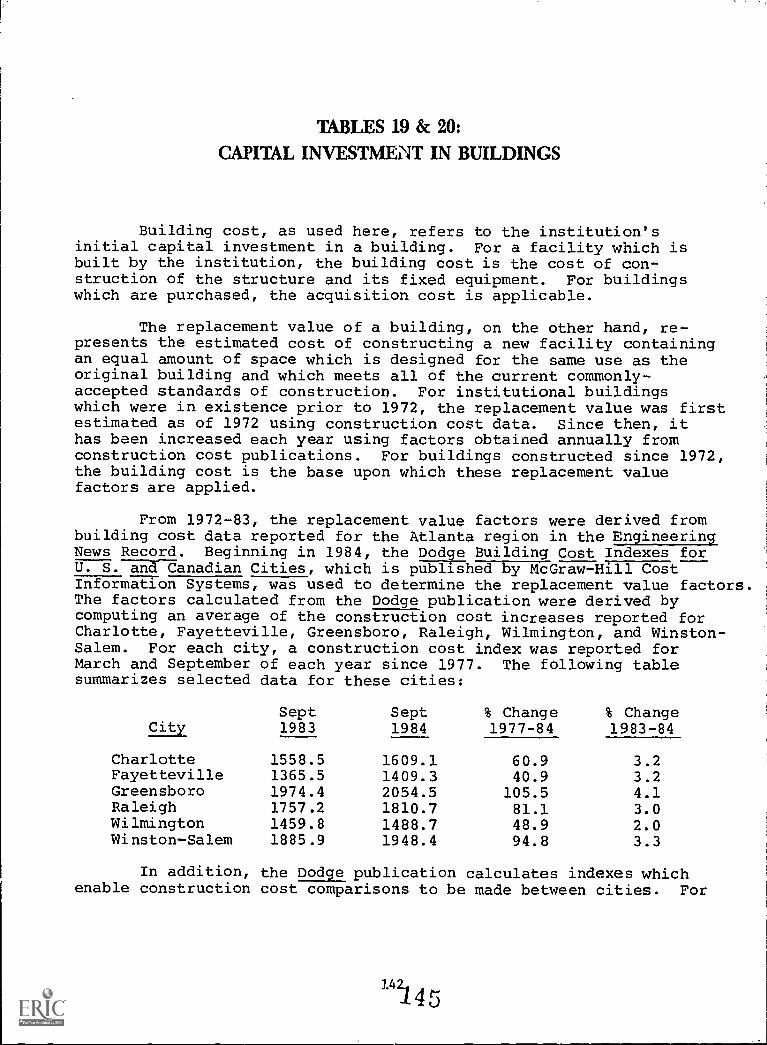
TABLES 19 & 20:
CAPITAL INVESTMENT IN BUILDINGS
Building cost, as used here, refers to the institution'sinitial capital investment in a building. For a facility which isbuilt by the institution, the building cost is the cost of con-struction of the structure and its fixed equipment. For buildingswhich are purchased, the acquisition cost is applicable.
The replacement value of a building, on the other hand, re-presents the estimated cost of constructing a new facility containingan equal amount of space which is designed for the same use as theoriginal building and which meets all of the current commonly-accepted standards of construction. For institutional buildingswhich were in existence prior to 1972, the replacement value was firstestimated as of 1972 using construction cost data. Since then, ithas been increased each year using factors obtained annually fromconstruction cost publications. For buildings constructed since 1972,the building cost is the base upon which these replacement valuefactors are applied.
From 1972-83, the replacement value factors were derived frombuilding cost data reported for the Atlanta region in the EngineeringNews Record. Beginning in 1984, the Dodge Building Cost Indexes forU. S. an& Canadian Cities, which is pal -s-hed by McGraw-Hin-T(5aInformaTon Systems, was used to determine the replacement value factors.The factors calculated from the Dodge publication were derived bycomputing an average of the construction cost increases reported forCharlotte, Fayetteville, Greensboro, Raleigh, Wilmington, and Winston-Salem. For each city, a construction cost index was reported forMarch and September of each year since 1977. The following tablesummarizes selected data for these cities:
SeptCity 1983
Charlotte 1558.5Fayetteville 1365.5Greensboro 1974.4Raleigh 1757.2Wilmington 1459.8Winston-Salem 1885.9
Sept % Change % Change1984 1977-84 1983-84
1609.1 60.9 3.21409.3 40.9 3.22054.5 105.5 4.11810.7 81.1 3.01488.7 48.9 2.01948.4 94.8 3.3
In addition, the Dodge publication calculates indexes whichenable construction cost comparisons to be made between cities. For
14z.
4r5
such comparisons, an index of 100 represents the average constructioncosts of the following twenty cities:
Atlanta Cincinnati Kansas City PhiladelphiaBaltimore Cleveland Los Angeles PittsburghBirmingham Dallas Minneapolis St. LouisBoston Denver New Orleans San FranciscoChicago Detroit New York Seattle
If a city has an index that is less than 100, then its constructioncosts are generally lower than the average for the twenty cities; ifit is greater than 100, the costs are greater than the average. Thefollowing list reports the Dodge comparison indexes for the six NorthCarolina cities as of September 1984:
Charlotte 80.6Fayetteville 70.2Greensboro 73.6Raleigh 72.6Wilmington 75.1Winston-Salem 77.8
The following are the factors which have been used to increasethe estimated replacement values each year. They reflect the increasesin construction costs which have occurred since 1972.
YearAnnualIncrease Year
AnnualIncrease
1972 8.6% 1979 11.3%1973 6.7% 1980 3.9%1974 5.2% 1981 9.3%1975 8.0% 1982 5.0%1976 11.3% 1983 7.2%1977 6.8% 1984 3.1%1978 6.8%
Because building cost represents an institution's capitalinvestment in a facility, only buildings which are owned by an insti-tution (i.e., those falling under ownership categories 1-3 on page139) are included in calculating total cost. Replacement value, onthe other hand, is a reflection of all buildings on an institution'scampus, regardless of their ownership status.
The data are categorized as non-residential (Table 19) andresidential (Table 20). Buildings with twenty percent or more oftheir space in each category are considered combination buildings andappear in both tables. The tables accurately reflect the number ofbuildings with non-residential space and the number with residentialspace, but the sum will exceed the total number of buildings on thecampuses which have combination buildings. Other data are distributedbetween the two tables on the basis of the ratio of the assignablesquare feet in the category to the total assignable square feet in thebuilding. Thus, campus totals may be determined accurately by summingthe appropriate data in the two tables, with the exception noted.
146
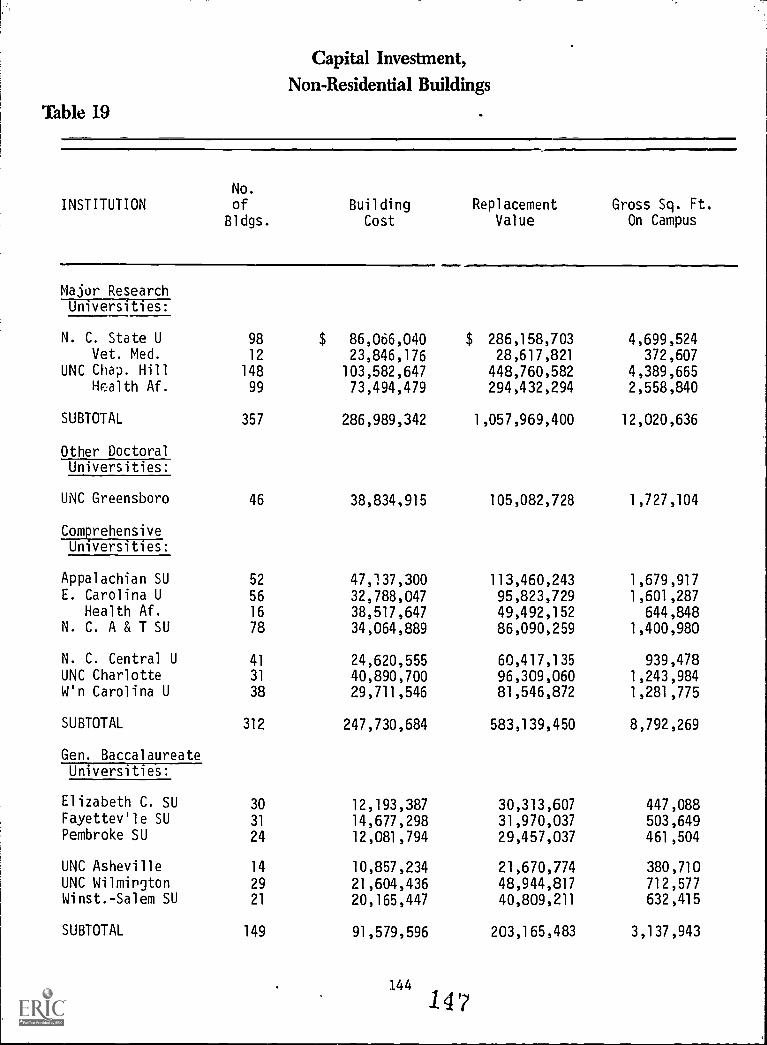
Capital Investment,Non-Residential Buildings
Table 19
INSTITUTIONNo.
of Building Replacement Gross Sq. Ft.Bldgs. Cost Value On Campus
Major ResearchUniversities:
N. C. State U 98 $ 86,066,040 $ 286,158,703 4,699,524Vet. Med. 12 23,846,176 28,617,821 372,607
UNC Chap. Hill 148 103,582,647 448,760,582 4,389,665Health Af. 99 73,494,479 294,432,294 2,558,840
SUBTOTAL 357 286,989,342 1,057,969,400 12,020,636
Other DoctoralUniversities:
UNC Greensboro 46 38,834,915 105,082,728 1,727,104
ComprehensiveUniversities:
Appalachian SU 52 47,137,300 113,460,243 1,679,917E. Carolina U 56 32,788,047 95,823,729 1,601,287
Health Af. 16 38,517,647 49,492,152 644,848N. C. A & T SU 78 34,064,889 86,090,259 1,400,980
N. C. Central U 41 24,620,555 60,417,135 939,478UNC Charlotte 31 40,890,700 96,309,060 1,243,984W'n Carolina U 38 29,711,546 81,546,872 1,281,775
SUBTOTAL 312 247,730,684 583,139,450 8,792,269
Gen. BaccalaureateUniversities:
Elizabeth C. SU 30 12,193,387 30,313,607 447,088Fayettev'le SU 31 14,677,298 31,970,037 503,649Pembroke SU 24 12,081,794 29,457,037 461,504
UNC Asheville 14 10,857,234 21,670,774 380,710UNC Wilmington 29 21,604,436 48,944,817 712,577Winst.-Salem SU 21 20,165,447 40,809,211 632,415
SUBTOTAL 149 91,579,596 203,165,483 3,137,943
144
1 47
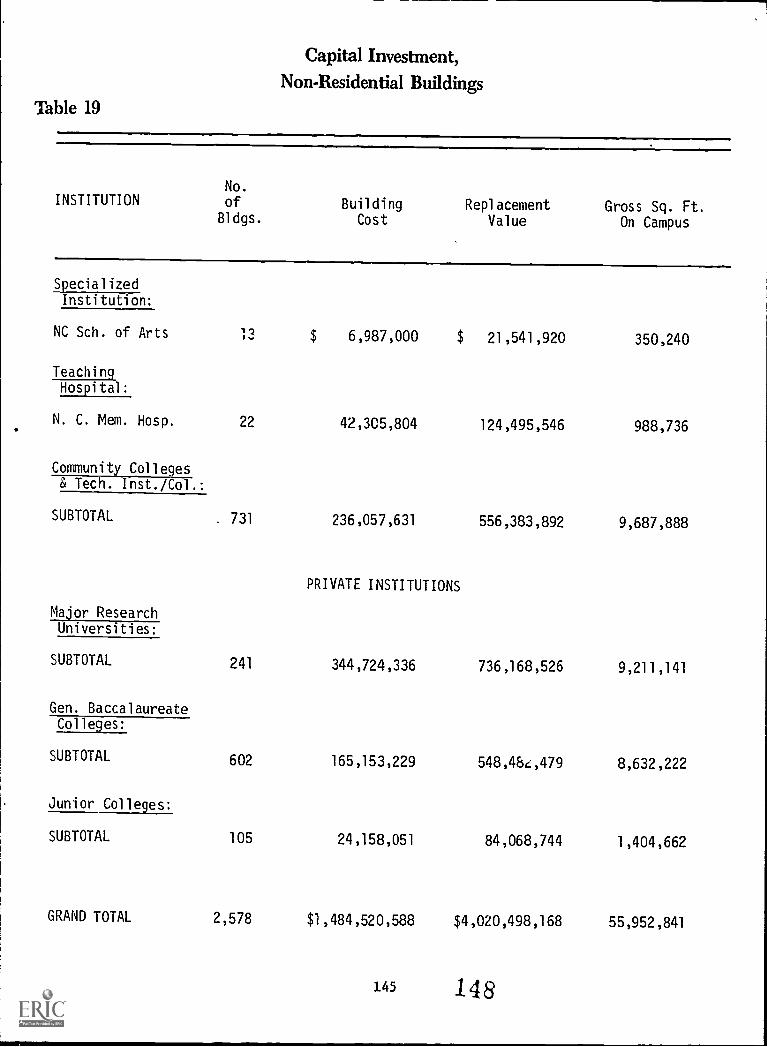
Capital Investment,Non-Residential Buildings
Table 19
INSTITUTIONNo.
of Building Replacement Gross Sq. Ft.Bldgs. Cost Value On Campus
SpecializedInstitution:
NC Sch. of Arts 13 $ 6,987,000 $ 21,541,920 350,240
TeachingHospital:
N. C. Mem. Hosp. 22 42,305,804 124,495,546 988,736
Community Colleges& Tech. Inst./Col.:
SUBTOTAL. 731 236,057,631 556,383,892 9,687,888
PRIVATE INSTITUTIONS
Major ResearchUniversities:
SUBTOTAL 241 344,724,336 736,168,526 9,211,141
Gen. BaccalaureateColleges:
SUBTOTAL 602 165,153,229 548,464,479 8,632,222
Junior Colleges:
SUBTOTAL 105 24,158,051 84,068,744 1,404,662
GRAND TOTAL 2,578 $1,484,520,588 $4,020,498,168 55,952,841
145 148
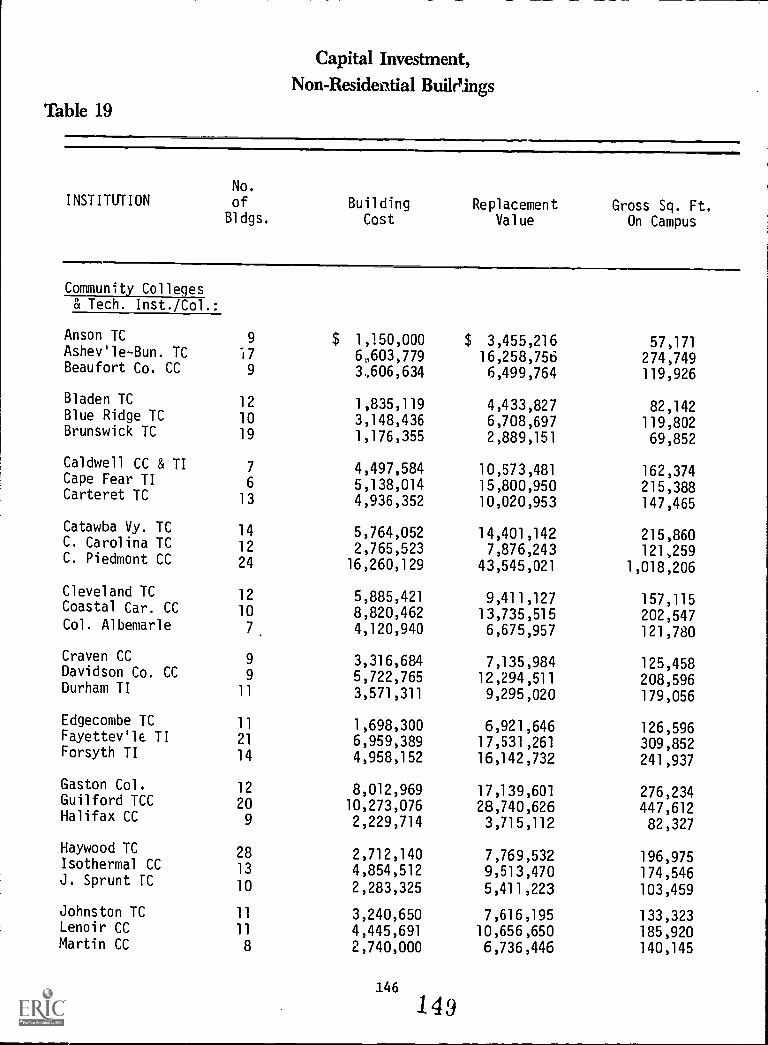
Capital Investment,Non- Resideptial Buileings
Table 19
INSTITUTIONNo.
of Building Replacement Gross Sq. Ft.81dgs. Cost Value On Campus
Community Colleges& Tech. Inst./Col.:
Anson TC 9 $ 1,150,000 $ 3,455,216 57,171Ashev'le -Bun. TC i7 6,603,779 16,258,756 274,749Beaufort Co. CC 9 3,606,634 6,499,764 119,926
Bladen TC 12 1,835,119 4,433,827 82,142Blue Ridge TC 10 3,148,436 6,708,697 119,802Brunswick TC 19 1,176,355 2,889,151 69,852
Caldwell CC & TI 7 4,497,584 10,573,481 162,374Cape Fear TI 6 5,138,014 15,800,950 215,388Carteret TC 13 4,936,352 10,020,953 147,465
Catawba Vy. TC 14 5,764,052 14,401,142 215,860C. Carolina TC 12 2,765,523 7,876,243 121,259C. Piedmont CC 24 16,260,129 43,545,021 1,018,206
Cleveland TC 12 5,885,421 9,411,127 157,115Coastal Car. CC 10 8,820,462 13,735,515 202,547Col. Albemarle 7, 4,120,940 6,675,957 121,780
Craven CC 9 3,316,684 7,135,984 125,458Davidson Co. CC 9 5,722,765 12,294,511 208,596Durham TI 11 3,571,311 9,295,020 179,056
Edgecombe TC 11 1,698,300 6,921,646 126,596Fayettevile TI 21 6,959,389 17,531,261 309,852Forsyth TI 14 4,958,152 16,142,732 241,937
Gaston Col. 12 8,012,969 17,139,601 276,234Guilford TCC 20 10,273,076 28,740,626 447,612Halifax CC 9 2,229,714 3,715,112 82,327
Haywood TC 28 2,712,140 7,769,532 196,975Isothermal CC 13 4,854,512 9,513,470 174,546J. Sprunt rC 10 2,283,325 5,411,223 103,459
Johnston TC 11 3,240,650 7,616,195 133,323Lenoir CC 11 4,445,691 10,656,650 185,920Martin CC 8 2,740,000 6,736,446 140,145
146
149
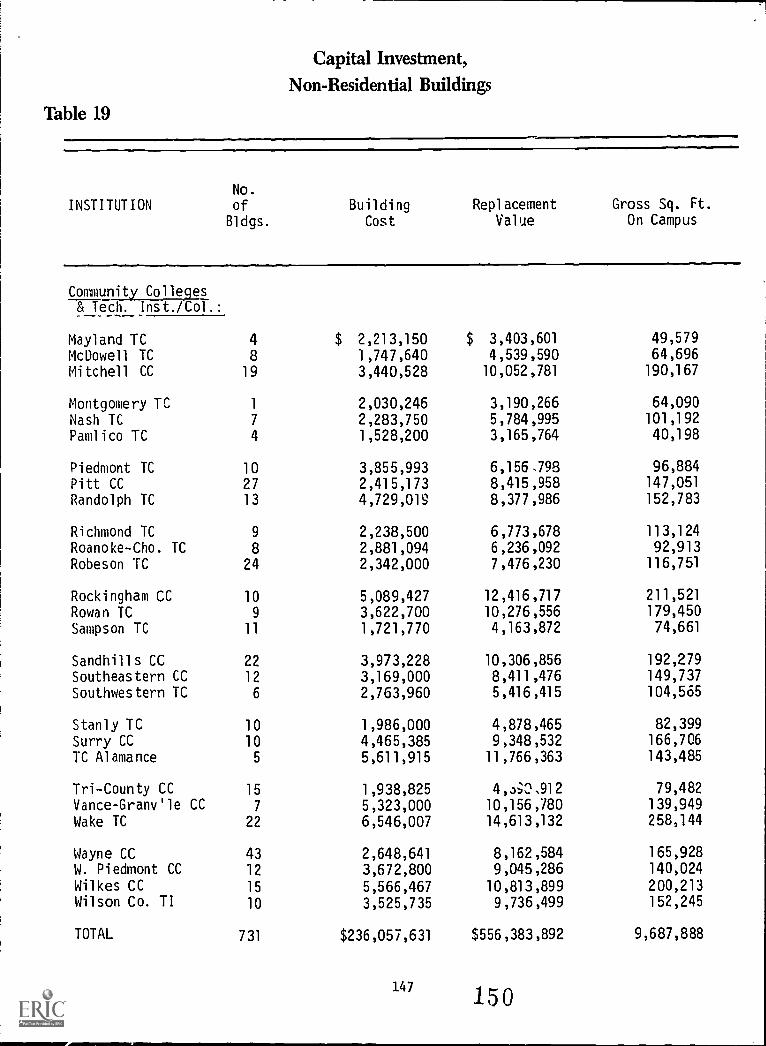
1
Capital Investment,Non-Residential Buildings
Table 19
INSTITUTIONNo.
of Building Replacement Gross Sq. Ft.
Bldgs. Cost Value On Campus
Community Colleges& Tech. Inst./Col.:
Mayland TC 4 $ 2,213,150 $ 3,403,601 49,579
McDowell TC 8 1,747,640 4,539,590 64,696
Mitchell CC 19 3,440,528 10,052,781 190,167
Montgomery TC 1 2,030,246 3,190,266 64,090
Nash TC 7 2,283,750 5,784,995 101,192
Pamlico TC 4 1,528,200 3,165,764 40,198
Piedmont TC 10 3,855,993 6,156.798 96,884
Pitt CC 27 2,415,173 8,415,958 147,051
Randolph TC 13 4,729,019 8,377,986 152,783
Richmond TC 9 2,238,500 6,773,678 113,124
Roanoke-Cho. TC 8 2,881,094 6,236,092 92,913
Robeson TC 24 2,342,000 7,476,230 116,751
Rockingham CC 10 5,089,427 12,416,717 211,521
Rowan TC 9 3,622,700 10,276,556 179,450
Sampson TC 11 1,721,770 4,163,872 74,661
Sandhills CC 22 3,973,228 10,306,856 192,279
Southeastern CC 12 3,169,000 8,411,476 149,737
Southwestern TC 6 2,763,960 5,416,415 104,565
Stanly TC 10 1,986,000 4,878,465 82,399
Surry CC 10 4,465,385 9,348,532 166,706
TC Alamance 5 5,611,915 11,766,363 143,485
Tri-County CC 15 1,938,825 4,a30.912 79,482
Vance- Granv'le CC 7 5,323,000 10,156,780 139,949
Wake TC 22 6,546,007 14,613,132 258,144
Wayne CC 43 2,648,641 8,162,584 165,928
W. Piedmont CC 12 3,672,800 9,045,286 140,024
Wilkes CC 15 5,566,467 10,813,899 200,213Wilson Co. TI 10 3,525,735 9,736,499 152,245
TOTAL 731 $236,057,631 $556,383,892 9,687,888
147 150
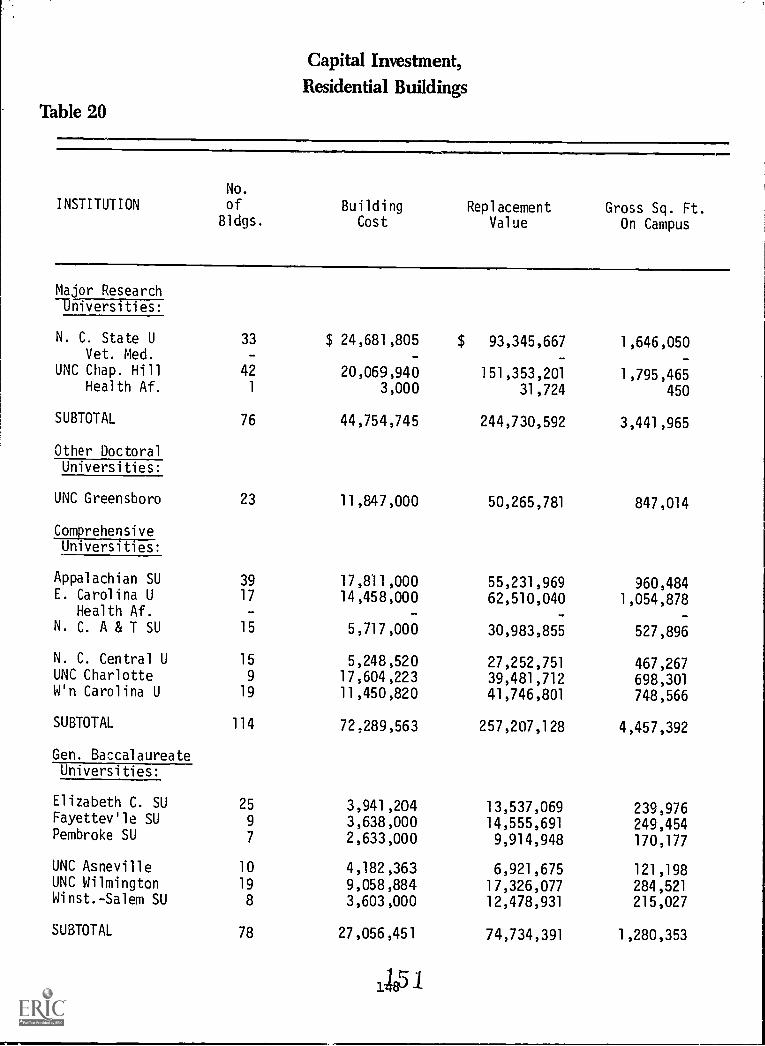
Table 20.INEMM=.
Capital Investment,Residential Buildings
INSTITUTION
No.
of Building Replacement Gross Sq. Ft.Bldgs. Cost Value On Campus
Major ResearchUniversities:
N. C. State U 33 $ 24,681,805 $ 93,345,667 1,646,050Vet. Med.
UNC Chap. Hill 42 20,069,940 151,353,201 1,795,465Health Af. 1 3,000 31,724 450
SUBTOTAL 76 44,754,745 244,730,592 3,441,965
Other DoctoralUniversities:
UNC Greensboro 23 11,847,000 50,265,781 847,014
ComprehensiveUniversities:
Appalachian SU 39 17,811,000 55,231,969 960,484E. Carolina U 17 14,458,000 62,510,040 1,054,878
Health Af. -
N. C. A & T SU 15 5,717,000 30,983,855 527,896
N. C. Central U 15 5,248,520 27,252,751 467,267UNC Charlotte 9 17,604,223 39,481,712 698,301W'n Carolina U 19 11,450,820 41,746,801 748,566
SUBTOTAL 114 72,289,563 257,207,128 4,457,392
Gen. BaccalaureateUniversities:
Elizabeth C. SU 25 3,941,204 13,537,069 239,976Fayettev'le SU 9 3,638,000 14,555,691 249,454Pembroke SU 7 2,633,000 9,914,948 170,177
UNC Asneville 10 4,182,363 6,921,675 121,198UNC Wilmington 19 9,058,884 17,326,077 284,521Winst.-Salem SU 8 3,603,000 12,478,931 215,027
SUBTOTAL 78 27,056,451 74,734,391 1,280,353
3465
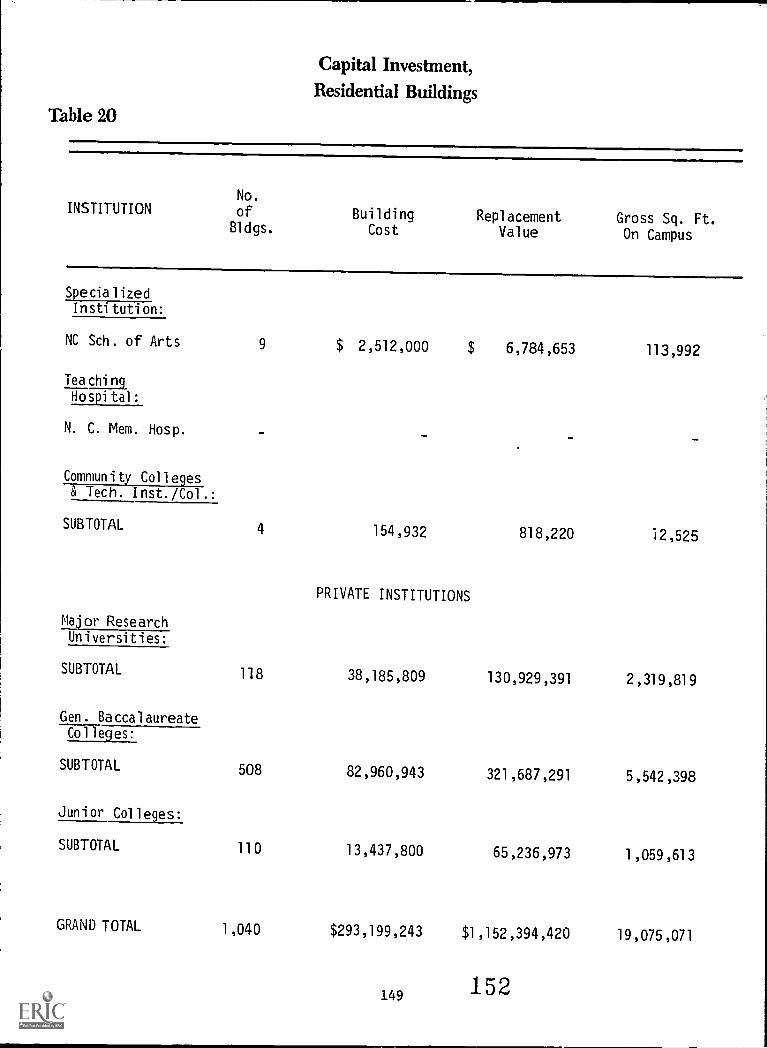
Capital Investment,Residential Buildings
Table 20
INSTITUTIONNo.
of Building Replacement Gross Sq. Ft.Bldgs. Cost Value On Campus
Special ized
Institution:
NC Sch . of Arts 9 $ 2,512,000 6,784,653 113,992
Tea chi ng
Hospi tal :
N. C. Mem. Hosp.
Commun i ty Col l eges& Tech. Inst./Col . :
SUBTOTAL 4 154,932 818,220 12,525
PRIVATE INSTITUTIONS
Major Research
Universities:
SUBTOTAL 118 38,185,809 130,929,391 2,319,819
Gen. BaccalaureateCol leges:
SUBTOTAL 508 82,960,943 321,687,291 5,542,398
Junior Col 1 eges:
SUBTOTAL 110 13,437,800 65,236,973 1,059,613
GRAND TOTAL 1,040 $293,199,243 $1 ,152,394,420 19,075,071
149 152
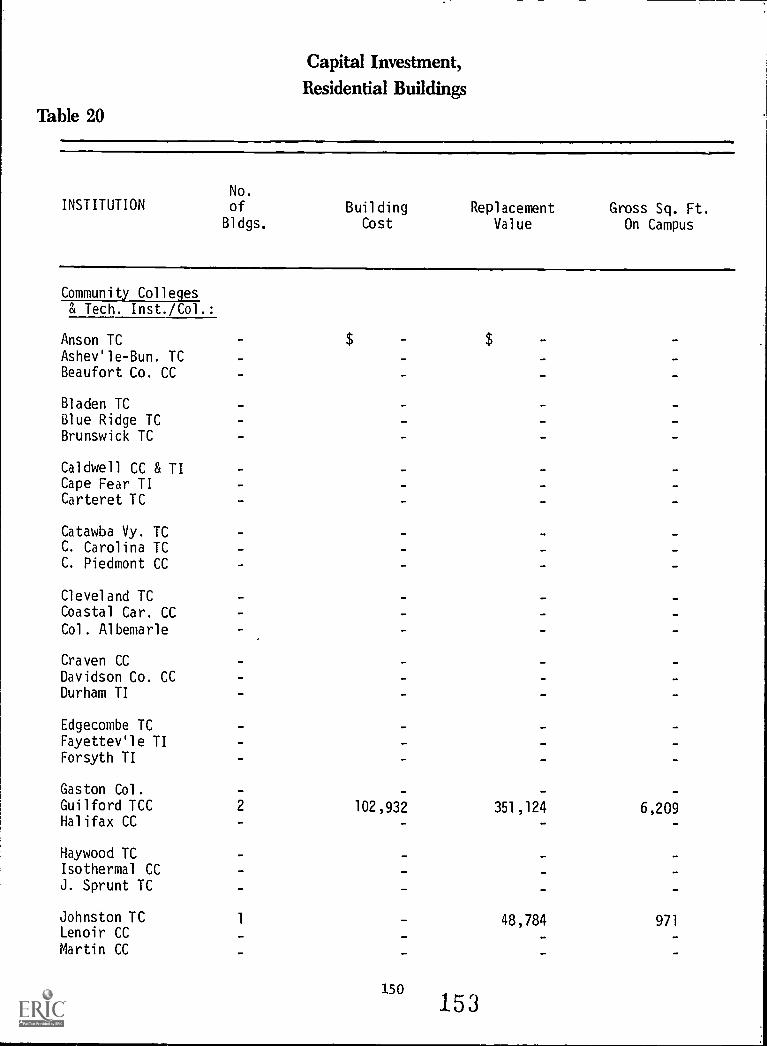
Capital Investment,Residential Buildings
Table 20
INSTITUTIONNo.
of Building Replacement Gross Sq. Ft.Bldgs. Cost Value On Campus
Community Colleges& Tech. Inst./Col.:
Anson TC $ $
Ashev'le-Bun. TC -
Beaufort Co. CC
Bladen TC
Blue Ridge TCBrunswick TC
Caldwell CC & TICape Fear TI - _
Carteret TC
Catawba Vy. TCC. Carolina TCC. Piedmont CC
Cleveland TCCoastal Car. CC
Col. Albemarle
Craven CC
Davidson Co. CCDurham TI
Edgecombe TCFayettev'le TI
Forsyth TI
Gaston Col. -
Guilford TCC 2 102,932 351,124 6,209Halifax CC
Haywood TCIsothermal CC - -J. Sprunt TC
Johnston TC 1 48,784 971Lenoir CC - _
Martin CC
150
153
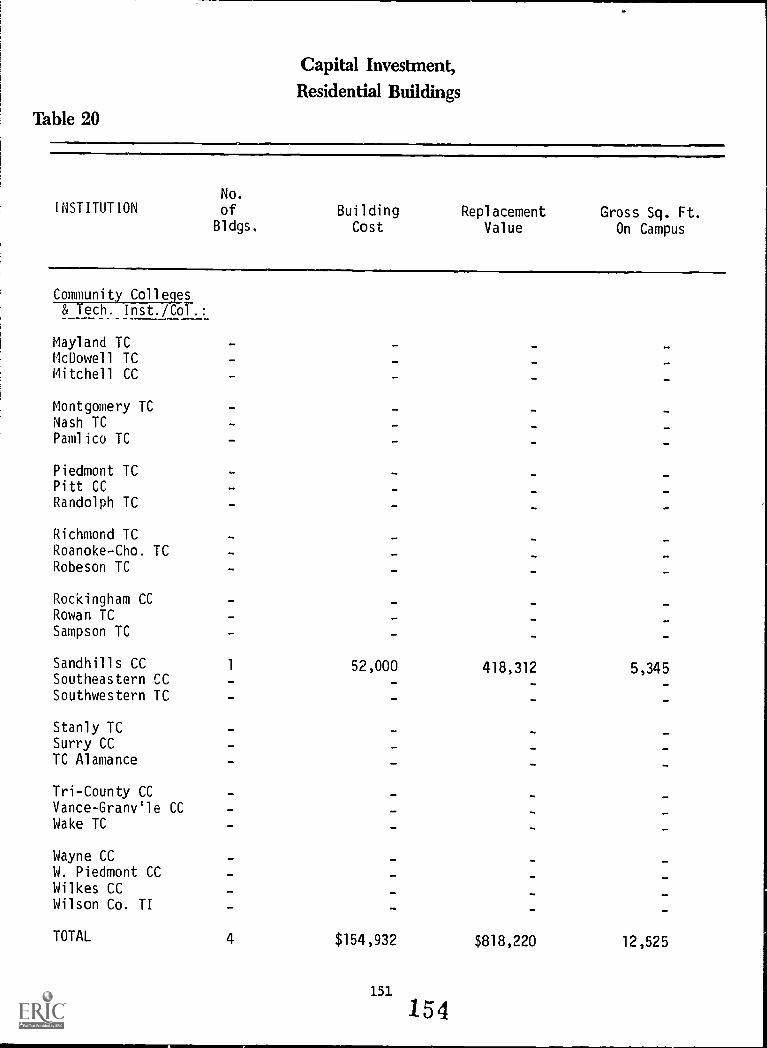
Capital Investment,Residential Buildings
Table 20
INSTITUTIONNo.
of Building Replacement Gross Sq. Ft.Bldgs. Cost Value On Campus
Community Colleges&Tech:lpst./Coll:
Mayland TC -
McDowell TC -
Mitchell CC - -
Montgomery TCNash TC - _Pamlico TC
Piedmont TCPitt CCRandolph TC - -
Richmond TC -
Roanoke -Cho. TC - -
Robeson TC -
Rockingham CCRowan TC OM OA
Sampson TC _ -
Sandhills CC 1 52,000 418,312 5,345Southeastern CC - -
Southwestern TC -
Stanly TCSurry CC - - -TC Alamance - - -
Tri-County CC - _
Vance-Granyle CC -
Wake TC - - -
Wayne CC -
W. Piedmont CCWilkes CC - -
Wilson Co. TI -
TOTAL 4 $154,932 $818,220 12,525
151
154
TABLE 21:
AGE OF BUILDINGS BY GROSS SQUARE FEET
This table reports the total gross square footage of NorthCarolina colleges and universities by year of construction categories.For purposes of this study, the year of construction is defined asthe year that the building was completed regardless of any later yearof occupancy.
Although this table gives some indication of how new an institu-tion's facilities are, it does not take into account renovations. Thedata in this table should, therefore, be considered in conjunctionwith Table 22 (Condition of Buildings) and Table 23 (Estimated Cost toRenovate or Replace Unsatisfactory Facilities).
152
155

AGE OF BUILDINGS BY GROSS SQUARE FEET
Pre 19000.5
1900-
19 9
1930-
19491950-
1959
1980 -
Present11.0
19Z0-196(.
1980 -
Present11.0
1970-1979
23.8
Pre 19000.5
1960-1969
28.2
1900-1929
11.0
1930-1949
9.8
1950-1959
15.5
The University of North Carolina 1
ALL PUBLIC BACCALAUREATE-GRANTING INSTITUTIONS .AND N.C. MEMORIAL HOSPITAL
1970-1979
Community Colleges andTechnical Institutes
153 Private Institutions
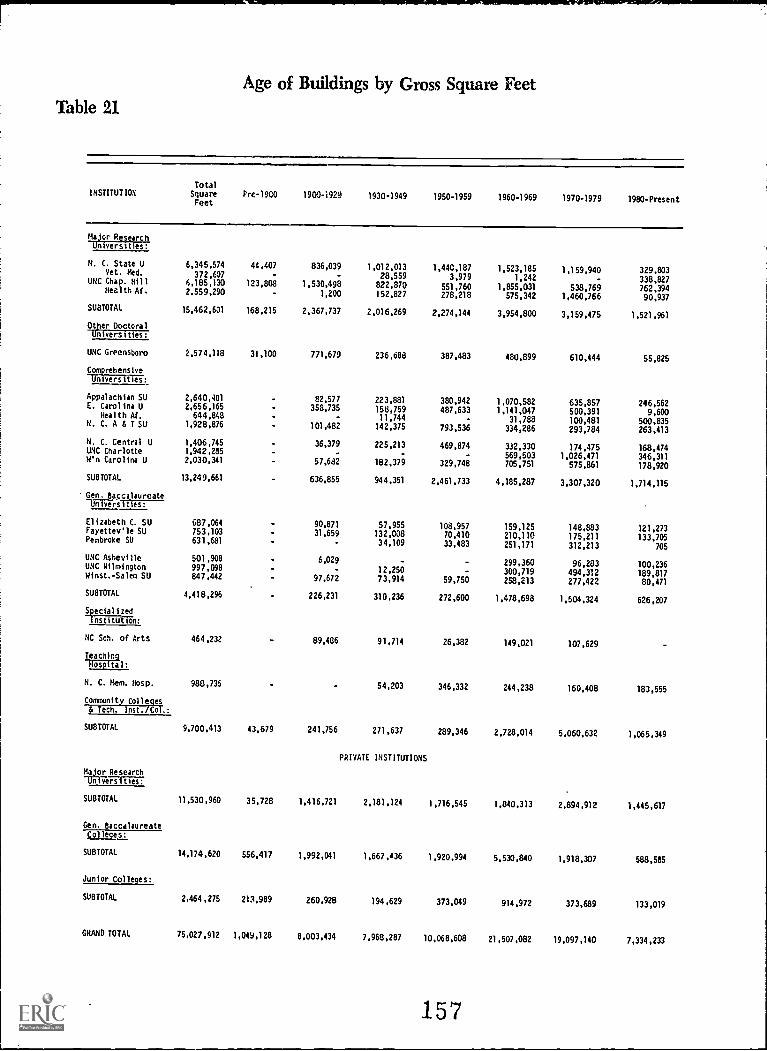
Age of Buildings by Gross Square FeetTable 21
INSTITUTIONTotal
SquareFeet
Pre-1900 1900-1929 1930-1949 1950-1959 1960-1969 1970-1979 1980-Present
Major ResearchUniversities:
N. C. State U 6,345,574 44,407 836,039 1,012,013 1.440.187 1.523,185 1,159.940 329,803Vet. Med. 372.607 28,559 3,979 1.242 338,827UNC Chap. Hill 6,185,130 123,808 1,530,498 822,870 551,760 1.855,031 538,769 762,394Heal th Af. 2,559,290 1,200 152,827 278,218 575,342 1,460.766 90,937SUBTOTAL 15,462,601 168,215 2,367,737 2,016,269 2,274.144 3,954,800 3,159,475 1,521,961Other DoctoralUniversi ties:
UNC Greensboro 2,574.118 31,100 771,679 236,688 387,483 480.899 610,444 55.825ComprehensiveUniversities:
Appalachian SU 2.640.401 82,577 223.881 380,942 1.070.582 635.857 246,562E. Carolina U 2,656,165 358,735 158,759 487,633 1,141,047 500,391 9,600Health Af. 644,848 - 11,744 - 31,788 100,481 500,835N. C. A E T SU 1,928,876 101.482 142,375 793,536 334,286 293,784 263,413N. C. Central U 1,406,745 36,379 225,213 469,874 332.330 174,475 168,474UNC Charlotte 1,942,285 - - - 569,503 1,026.471 346,311ki'n Carolina U 2,030,341 57.682 182,379 329,748 705,751 575,861 178,920SUBTOTAL 13,249,661 636,855 944,351 2.461.733 4,185,287 3,307,320 1,714,115Gen. BaccalaureateWrsitiesElizabeth C. SU 687,064 90,871 57,955 108,957 159,125 148,883 121,273Fayettev'le SU 753.103 31,659 132,008 70,410 210,110 175,211 133,705Pembroke SU 631,681 34,109 33,483 251,171 312,213 705
UNC Asheville 501,908 6,029 - - 299.360 96,283 100,236UNC Wilmington 997,098 12,250 - 300,719 494,312 189.817Winst. -Salem SU 847,442 97,672 73,914 59,750 258,213 277,422 80,471SUBTOTAL 4,418,296 226,231 310.236 272,600 1,478,698 1.504.324 626,207Specialized
nst
NC Sch. of Arts 464,232 89,486 91,714 26,382 149,021 107,629TeachingHospital:
N. C. Hem. Hosp. 988,736 54,203 346,332 244,238 160,408 183,555Community CollegesB. Tech. inst./Col.:
SU8TOTAL 9,700.413 43.679 241,756 271,637 289,346 2,728,014 5,060,632 1,065,349
PRIVATE INSTITUTIONS
Major Research.117/e.-7srere.i7
SUBTOTAL 11,530,960 35,728 1,416,721 2,181,124 1,716,545 1,840.313 2,894,912 1,445,617
Gen. BaccalaureateColleges:
SUBTOTAL 14,174,620 556,417 1,992,041 1,667,436 1,920,994 5,530,840 1.918.307 588,585
Junior Colleges:
SUBTOTAL 2.464,275 213,989 260,928 194,629 373,049 914,972 373,689 133,019
GRAND TOTAL 75,027,912 1,049,128 8,003,434 7,968,287 10,068,608 21,507,082 19,097,140 7,334,233
.157
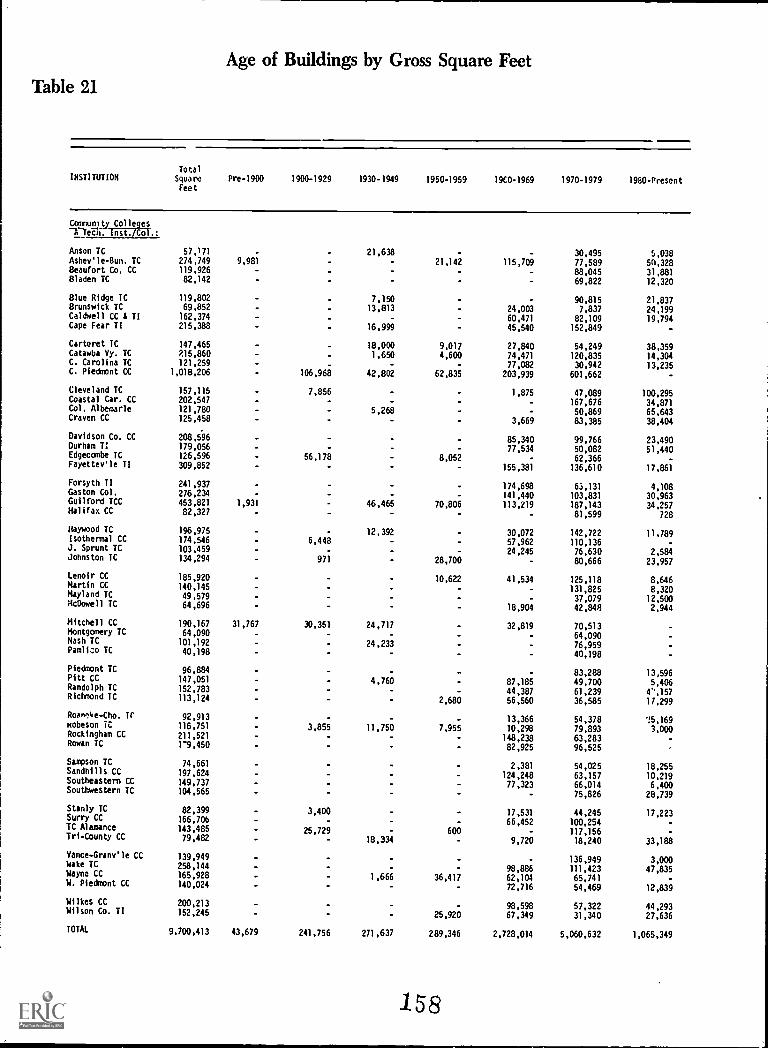
Age of Buildings by Gross Square Feet
Table 21
INSTITUTIONTotal
Square
FeetPre-1900 1900-1929 1930-1949 1950-1959 19C0-1969 1970-1979 1980-Present
CommunIty Colleges
Anson IC 57,171 21,638 30,495 5,038Ashev'le -Bun. IC 274,749 9,981 21,142 115,76 77,589 50,328Beaufort Co. CC 119,926 88,045 31,881Bladen TC 82,142 69,822 12,320
Blue Ridge IC 119,802 7,150 90,815 21,837Brunswick TC 69,852 13,813 24,003 7,837 24,199Caldwell CC i II 162,374 60,471 82,109 19,794Cape Fear II 215,388 16,999 45,540 152,849
Carteret IC 147,465 18,000 9,017 27,840 54,249 38,359Catawba Vy. TC 215,860 1,650 4,600 74,471 120,835 14,304C. Carolina TC 121,259 77,082 30,942 13,235C. Piedmont CC 1,018,206 106,968 42,802 62,835 203,939 601,662
Cleveland TC 157,115 7,856 1,875 47,089 100,295Coastal Car. CC 202,547 167,676 34,871Col. Albemarle 121,780 5,268 50,869 65,643Craven CC 125,458 3,669 83,385 38,404
Davidson Co. CC 208,596 85,340 99,766 23,490Durham TI 179,056 77,534 50,082 51,440Edgecombe TC 126,596 56,178 8,052 62,366Fayettev'le II 309,852 155,381 136,610 17,861
Forsyth TI 241,937 174,698 63,131 4,108Gaston Col. 276,234 141,440 103,831 30,963Guilford TCC 453,821 1,931 46,465 70,806 113,219 187,143 34,257Halifax CC 82,327 81,599 728
Haywood IC 196,975 - 12,392 30,072 142,722 11,789Isothermal CC 174,546 6,448 57,962 110,136J. Sprunt IC 103,459 24,245 76,630 2,584Johnston TC 134,294 971 28,700 80,666 23,957
Lenoir CC 185,920 10,622 41,534 125,118 8,646Martin CC 140,145 131,825 8,320Mayland TC 49,579 37,079 12,500McDowell IC 64,696 18,904 42,848 2,944
Mitchell CC 190,167 31,767 30,351 24,717 32,819 70,513Montgomery IC 64,090 - - 64,090Nash IC 101,192 - - 24,233 76,959Pamlico TC 40,198 40,198
Piedmont TC 96,884 - - 83,288 13,596Pitt CC 147,051 4,760 87,185 49,700 5,406Randolph TC 152,783 44,387 61,239 4',157Richmond IC 113,124 2,680 56,560 36,585 17,299
Rowke-Cho. TC 92,913 13,366 54,378 15,169Kobeson iC 116,751 3,855 11,750 7,955 10,298 79,893 3,000Rockingham CC 211,521 148,238 63,283 -Rowan TC 1'9,450 82,925 96,525
Sampson IC 74,661 2,381 54,025 18,255Sandhills CC 197,624 124,248 63,157 10,219Southeastern CC 149,737 77,323 66,014 6,400Southwestern TC 104,565 75,826 28,739
Stanly TC 82,399 3,400 17,531 44,245 17,223Surry CC 166,706 - 66,452 100,254 -TC Alamance 143,485 25,729 600 - 117,156 -Tri-County CC 79,482 - 18,334 9,720 18,240 33,188
Vance-Granv'le CC 139,949 - - 136,949 3,000Wake TC 258,144 98,886 111,423 47,835Wayne CC 165,928 1,666 36,417 62,104 65,741 -W. Piedmont CC 140,024 - 72,716 54,469 12,839
Wilkes CC 200,213 - 98,598 57,322 44,293Wilson Co. TI 152,245 25,920 67,349 31,340 27,636
TOTAL 9,700,413 43,679 241,756 271,637 289,346 2,728,014 5,060,632 1,065,349
158
TABLE 22:
CONDITION OF BUILDINGS
The condition of campus buildings has been a matter of increas-ing concern to college and university administrators. As institutionalbudgets tightened during the 1970's, many institutions attempted toeconomize by deferring the maintenance of facilities. As a result,some colleges and universities now have buildings which are in suchpoor condition that they can no longer satisfactorily support theprograms for which they were intended. Increasing costs of newconstruction have made proper maintenance of campus physical plantseven more important.
The data in Table 22 are based on the assessment of buildingconditions by the facilities project officers at the institutions.Although few of them are architects or engineers, they generally have(or have access to) sufficient information about the condition of theirinstitutions' facilities to be able to accurately assign a conditioncode to each campus building. These codes are defined on the followingpage.
The sum of the percentages for each institution should in theoryadd to exactly 100.0, but in some cases they do not because of rounding.
156 I1 9
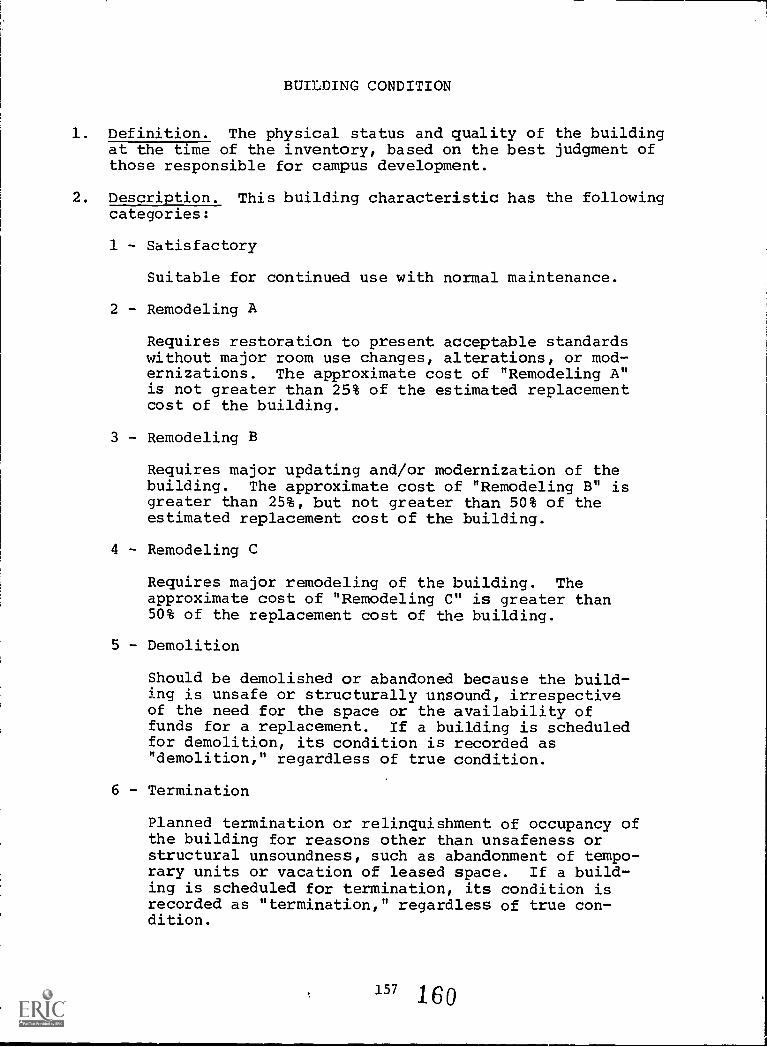
BUILDING CONDITION
1. Definition. The physical status and quality of the buildingat the time of the inventory, based on the best judgment ofthose responsible for campus development.
2. Description. This building characteristic has the followingcategories:
1 - Satisfactory
Suitable for continued use with normal maintenance.
2 - Remodeling A
Requires restoration to present acceptable standardswithout major room use changes, alterations, or mod-ernizations. The approximate cost of "Remodeling A"is not greater than 25% of the estimated replacementcost of the building.
3 - Remodeling B
Requires major updating and/or modernization of thebuilding. The approximate cost of "Remodeling B" isgreater than 25%, but not greater than 50% of theestimated replacement cost of the building.
4 - Remodeling C
Requires major remodeling of the building. Theapproximate cost of "Remodeling C" is greater than50% of the replacement cost of the building.
5 - Demolition
Should be demolished or abandoned because the build-ing is unsafe or structurally unsound, irrespectiveof the need for the space or the availability offunds for a replacement. If a building is scheduledfor demolition, its condition is recorded as"demolition," regardless of true condition.
6 - Termination
Planned termination or relinquishment of occupancy ofthe building for reasons other than unsafeness orstructural unsoundness, such as abandonment of tempo-rary units or vacation of leased space. If a build-ing is scheduled for termination, its condition isrecorded as "termination," regardless of true con-dition.
157 160
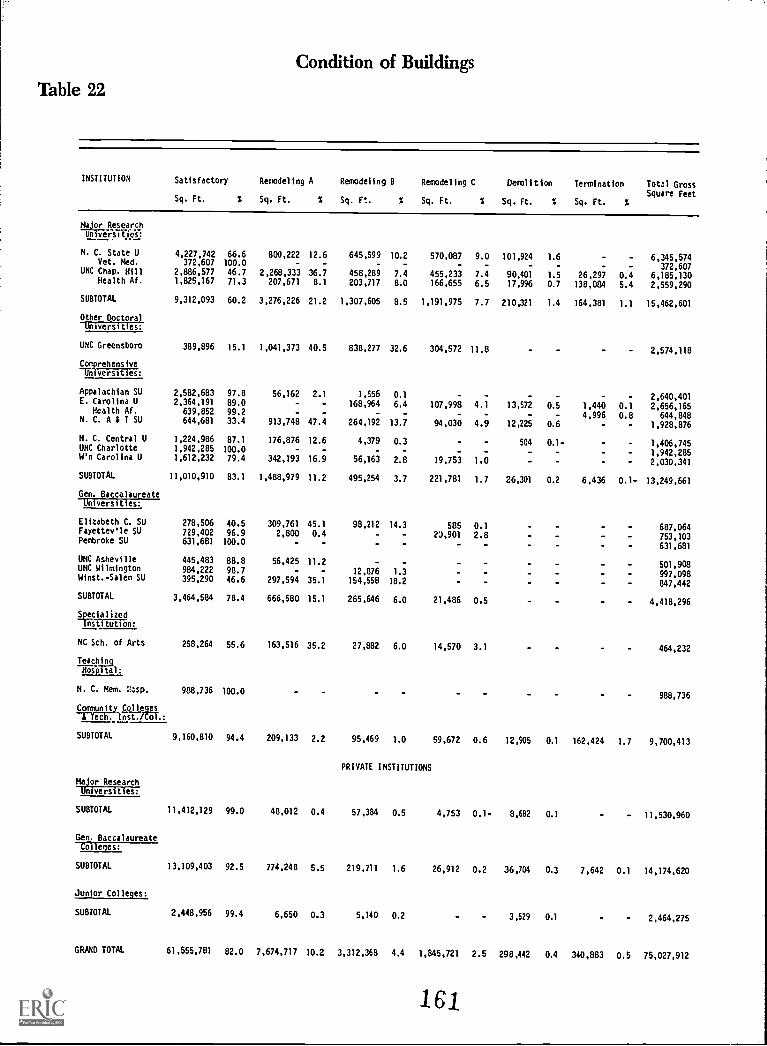
Condition of Buildings
Table 22
INSTITUTION Satisfactory
Sq. Ft. %
Remodeling A
Sq. Ft. %
Remodeling 0
Sq. Ft. %
Remodeling C
Sq. Ft. S
Demolition
Sq. Ft. 5
Termination
Sq. Ft.
Total GrossSquare Feet
Major ResearchUnlveWSITies:
N. C. State U 4,227,742 66.6 800,222 12.6 645,599 10.2 570,087 9.0 101,924 1.6 - 6,345.574Vet. Med. 372,607 100.0 - - - 372,607
UNC Chap. Hill 2,886,577 46.7 2,268,333 36.7 458,289 7.4 455,233 7.4 90,401 1.5 26,297 0.4 6,185,130Health Af. 1,825,167 71.3 207,671 8.1 203,717 8.0 166,655 6.5 17,996 0.7 138,084 5.4 2,559,290
SUBTOTAL 9,312,093 60.2 3,276,226 21.2 1,307,605 8.5 1,191,975 7.7 210,321 1.4 164,381 1.1 15,462,601
Other DoctoralUniversities:
UNC Greensboro 389,896 15.1 1,041,373 40.5 838,277 32.6 304,572 11.8 2,574,118
ComprehensiveUniversities:
Appalachian SU 2,582,683 97.8 56,162 2.1 1,556 0.1 - - - - 2,640,401E. Carolina U 2,364,191 89.0 - - 168,964 6.4 107,998 4.1 13,572 0.5 1,440 0.1 2,656,165
Health Af. 639,852 99.2 - - - - - - 4,996 0.8 644,848N. C. A & T SU 644,681 33.4 913,748 47.4 264,192 13.7 94,030 4.9 12,225 0.6 - 1,928,876
N. C. Central U 1,224,986 87.1 176,876 12.6 4,379 0.3 - 504 0.1- 1,406,745UNC Charlotte 1,942,285 100.0 - - _ - - - 1,942,285W'n Carolina U 1,612,232 79.4 342,193 16.9 56,163 2.8 19,753 1.0 2,030,341
SUBTOTAL 11,010,910 83.1 1,488,979 11.2 495,254 3.7 221,781 1.7 26,301 0.2 6,436 0.1- 13,249,661
Gen. BaccalaureateUniversities:
Elizabeth C. SU 278,506 40.5 309,761 45.1 98,212 14.3 585 0.1 687,064Fayettev'le SU 729,402 96.9 2,800 0.4 - - 23,901 2.8 753,103Pembroke SU 631,681 100.0 - - - - - 631,681
UNC Asheville 445,483 88.8 56,425 11.2 - -- 501,908UNC Wilmington 984,222 98.7 - - 12,876 1.3 997,098Winst.-Salem SU 395,290 46.6 297,594 35.1 154,558 18.2 847,442
SUBTOTAL 3,464,584 78.4 666,580 15.1 265,646 6.0 21,486 0.5 4,418,296
SpecializedBSIIIiiiiiin:
NC Sch. of Arts 258,264 55.6 163,516 35.2 27,882 6.0 14,570 3.1 464,232
TeachingHospital:
N. C. Mem. :asp. 988,736 100.0988,736
Community Colleges-17/ech. Inst./Col.:
SUBTOTAL 9,160,810 94.4 209,133 2.2 95,469 1.0 59,672 0.6 12,905 0.1 162,424 1.7 9,700,413
PRIVATE INSTITUTIONS
Major ResearchUniversities:
SUBTOTAL 11,412,129 99.0 48,012 0.4 57,384 0.5 4,753 0.1- 8,682 0.1 - 11,530,960
Gen. BaccalaureateColleges:
SUBTOTAL 13,109,403 92.5 774,248 5.5 219,711 1.6 26,912 0.2 36,704 0.3 7,642 0.1 14,174,620
Junior Colleges:
SUBTOTAL 2,448,956 99.4 6,650 0.3 5,140 0.2 3,529 0.1 2,464,275
GRAND TOTAL 61,555,781 82.0 7,674,717 10.2 3,312,368 4.4 1,845,721 2.5 298,442 0.4 340,883 0.5 75,027,912
161
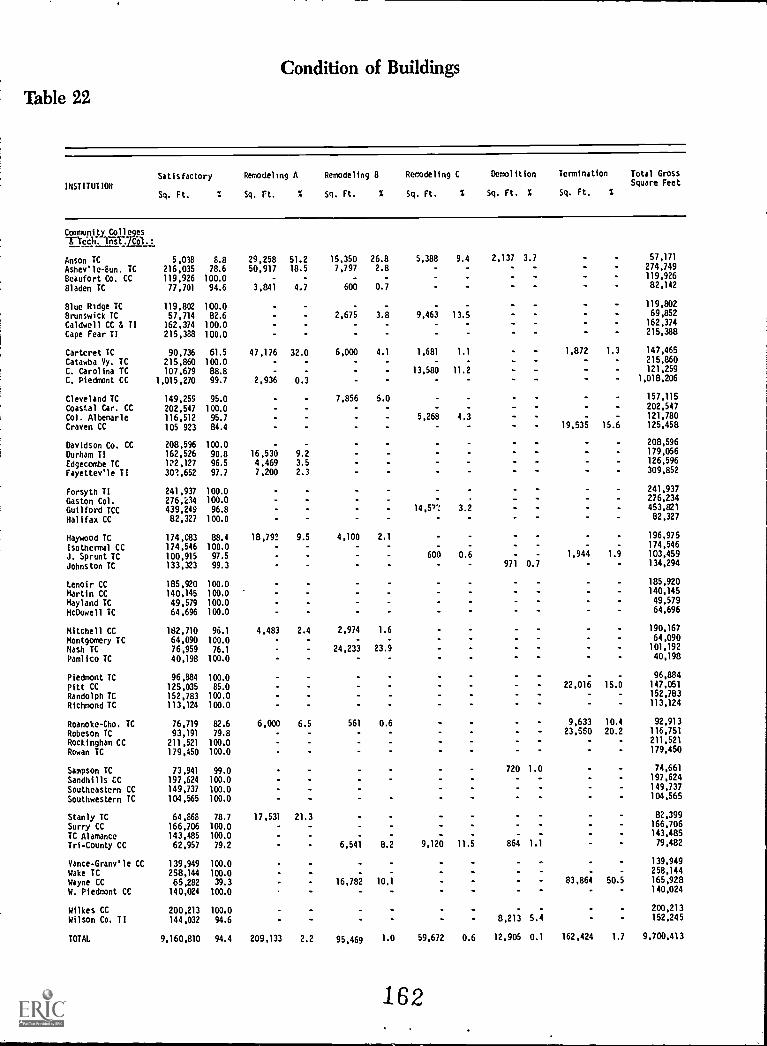
Condition of Buildings
Table 22
INSTITUTION
Satisfactory
Sq. Ft. %
Remodeling A
Sq. Ft. X
Remodeling 8
Sq. Ft. X
Remodeling C
Sq. Ft. X
Demolition
Sq. Ft. X
Termination
Sq. Ft.
Total GrossSquare Feet
Community CollegesZYSech Inst. Col :
Anson TC 5,038 8.8 29,258 51.2 15,350 26.8 5,388 9.4 2,137 3.7 57,171
Ashev'le-Bun. TC 216,035 78.6 50,917 18.5 7,797 2.8 - - 274,749
Beaufort Co. CC 119,926 100.0 119,926
8laden TC 77,701 94.6 3,841 4.7 600 0.7 82,142
8lue Ridge TC 119,802 100.0 119,802
8runswick TC 57,714 82.6 2,675 3.8 9,463 13.5 69,852
Caldwell CC .3 TI 162,374 100.0 162,374
Cape Fear TI 215,388 100.0 215,388
Carteret IC 90,736 61.5 47,176 32.0 6,000 4.1 1,681 1.1 1,872 1.3 147,465
Catawba Vy. TC 215,860 100.0 215,860
C. Carolina TC 107,679 88.8 13,580 11.2 121,259
C. Piedmont CC 1,015,270 99.7 2,936 0.3 1,018,206
Cleveland TC 149,259 95.0 7,856 5.0 - 157,115
Coastal Car. CC 202,547 100.0 - - - - 202,547
Col. Albemarle 116,512 95.7 5,268 4.3 - - 121,780
Craven CC 105 923 84.4 - 19,535 15.6 125,458
Davidson Co. CC 208,596 100.0 -208,596
Durham TI 162,526 90.8 16,530 9.2 179,056
Edgecombe TC 122,127 96.5 4,469 3.5 126,596
Fayettev'le TI 301,652 97.7 7,200 2.3 309,852
Forsyth TI 241,937 100.0 241,937
Gaston Col. 276,234 100.0 276,234
Guilford TCC 439,249 96.8 14,511 3.2 453,821
Halifax CC 82,327 100.0 82,327
Haywood TC 174,083 88.4 18,792 9.5 4,100 2.1 196,975
Isothermal CC 174,546 100.0 - - 174,546
J. Sprunt TC 100,915 97.5 600 0.6 - - 1,944 1.9 103,459
Johnston TC 133,323 99.3 971 0.7 134,294
Lenoir CC 185,920 100.0 185,920
Martin CC 140,145 100.0 140,145
Wayland TC 49,579 100.0 49,579
McDowell IC 64,696 100.0 64,696
Mitchell CC 182,710 96.1 4,483 2.4 2,974 1.6 190,167
Montgomery TC 64,090 100.0 64,090
Nash TC 76,959 76.1 24,233 23.9 101,192
Pamlico TC 40,198 100.0 40,198
Piedmont IC 96,884 100.0 96,884
Pitt CC 125,035 85.0 22,016 15.0 147,051
Randolph TC 152,783 100.0 152,783
Richmond TC 113,124 100.0 113,124
Roanoke-Cho. TC 76,719 82.6 6,000 6.5 561 0.6 9,633 10.4 92,913
Robeson IC 93,191 79.8 23,560 20.2 116,751
Rockingham CC 211,521 100.0 211,521
Rowan TC 179,450 100.0 179,450
Sampson TC 73,941 99.0 720 1.0 74,661
Sandhills CC 197,624 100.0 197,624
Southeastern CC 149,737 100.0 149,737
Southwestern TC 104,565 100.0 104,565
Stanly TC 64,86B 78.7 17,531 21.3 82,399
Surry CC 166,706 100.0 166,706
TC Alamance 143,485 100.0 - - 143,485
Tri-County CC 62,957 79.2 6,541 8.2 9,120 11.5 864 1.1 79,482
Vance-Granv'le CC 139,949 100.0 139,949
Wake TC 258,144 100.0 258,144
Wayne CC 65,282 39.3 16,782 10.1 83,864 50.5 165,928
W. Piedmont CC 140,024 100.0 140,024
Wilkes CC 200,213 100.0 200,213
Wilson Co. TI 144,032 94.6 8,213 5.4 152,245
TOTAL 9,160,810 94.4 209,133 2.2 95,469 1.0 59,672 0.6 12,905 0.1 162,424 1.7 9,700,413
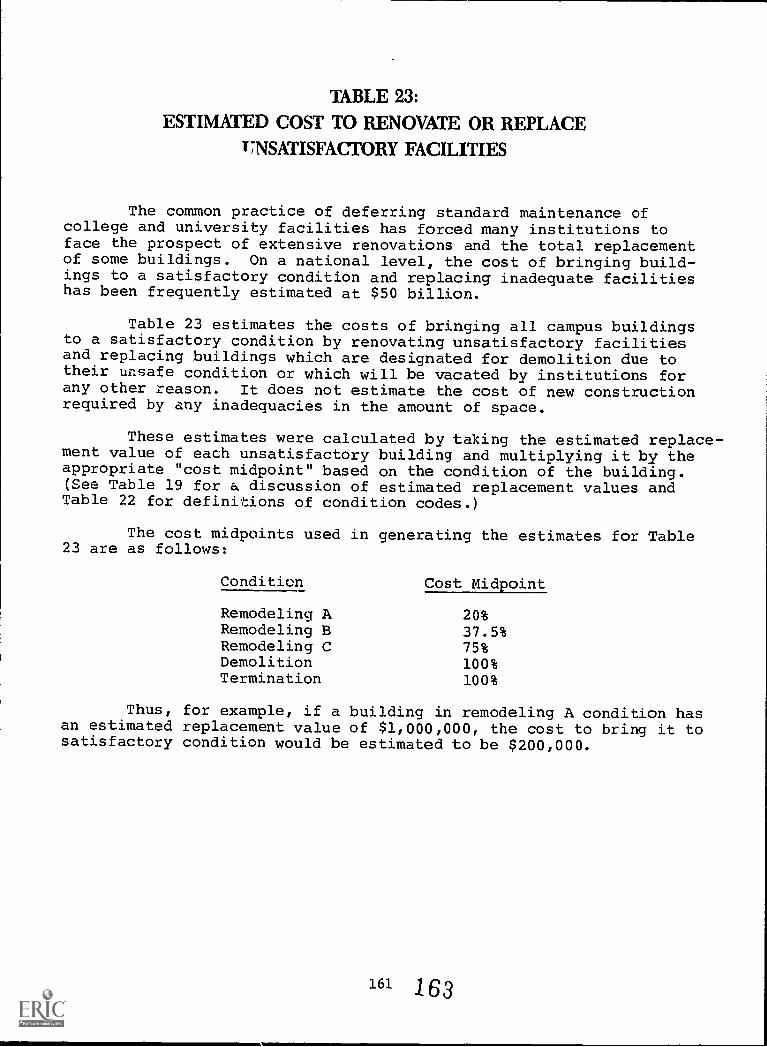
TABLE 23:
ESTIMATED COST TO RENOVATE OR REPLACE
T7NSATISFACTORY FACILITIES
The common practice of deferring standard maintenance ofcollege and university facilities has forced many institutions toface the prospect of extensive renovations and the total replacementof some buildings. On a national level, the cost of bringing build-ings to a satisfactory condition and replacing inadequate facilitieshas been frequently estimated at $50 billion.
Table 23 estimates the costs of bringing all campus buildingsto a satisfactory condition by renovating unsatisfactory facilitiesand replacing buildings which are designated for demolition due totheir unsafe condition or which will be vacated by institutions forany other reason. It does not estimate the cost of new constructionrequired by any inadequacies in the amount of space.
These estimates were calculated by taking the estimated replace-ment value of each unsatisfactory building and multiplying it by theappropriate "cost midpoint" based on the condition of the building.(See Table 19 for a discussion of estimated replacement values andTable 22 for definitions of condition codes.)
The cost midpoints used in generating the estimates for Table23 are as follows:
Condition Cost Midpoint
Remodeling A 20%Remodeling B 37.5%Remodeling C 75%Demolition 100%Termination 100%
Thus, for example, if a building in remodeling A condition hasan estimated replacement value of $1,000,000, the cost to bring it tosatisfactory condition would be estimated to be $200,000.
161 1 63
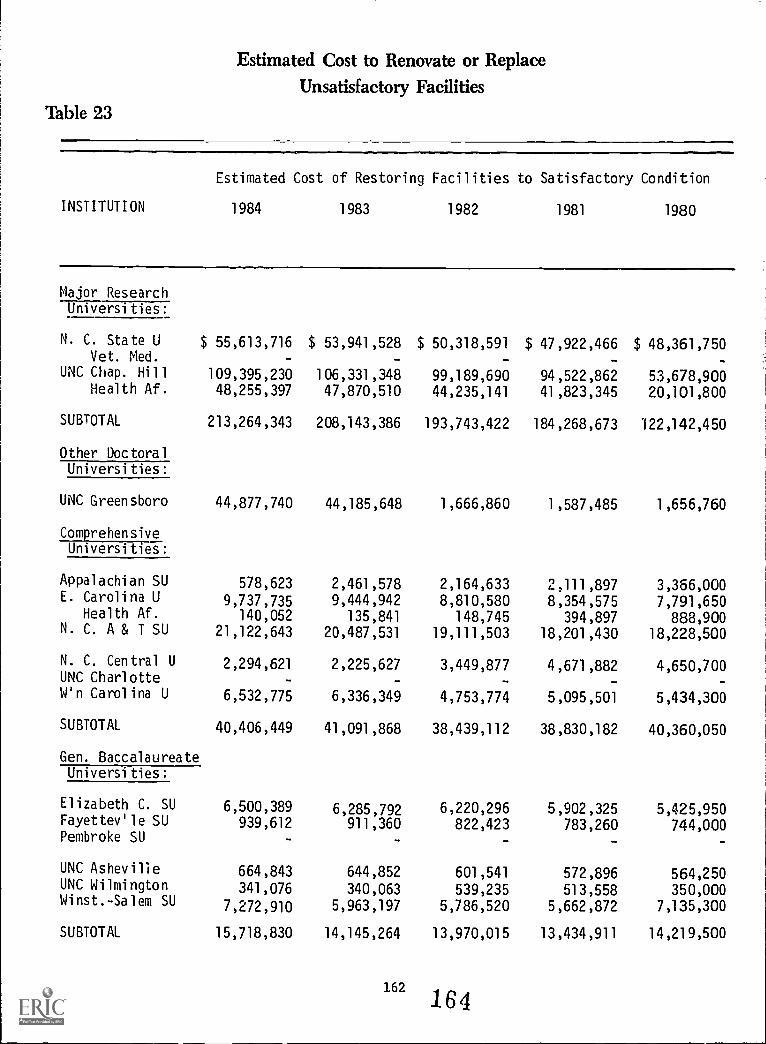
Estimated Cost to Renovate or ReplaceUnsatisfactory Facilities
Table 23
INSTITUTION
Estimated Cost of Restoring Facilities to Satisfactory Condition
1984 1983 1982 1981 1980
Major ResearchUniversi ties:
N. C. State U $ 55,613,716 $ 53,941,528 $ 50,318,591 $ 47,922,466 $ 48,361,750Vet. Med.
UNC Chap. Hill 109,395,230 106,331,348 99,189,690 94,522,862 53,678,900Health Af. 48,255,397 47,870,510 44,235,141 41,823,345 20,101,800
SUBTOTAL 213,264,343 208,143,386 193,743,422 184,268,673 122,142,450
Other DoctoralUniversi ties :
UNC Greensboro 44,877,740 44,185,648 1,666,860 1 ,587,485 1 ,656,760
ComprehensiveUniversities:
Appalachian SU 578,623 2,461,578 2,164,633 2,111,897 3,366,000E. Carolina U 9,737,735 9,444,942 8,810,580 8,354,575 7,791,650
Health Af. 140,052 135,841 148,745 394,897 888,900N. C. A & T SU 21,122,643 20,487,531 19,111,503 18,201,430 18,228,500
N. C. Central U 2,294,621 2,225,627 3,449,877 4,671,882 4,650,700UNC CharlotteW'n Carol ina U 6,532,775 6,336,349 4,753,774 5,095,501 5,434,300
SUBTOTAL 40,406,449 41,091,868 38,439,112 38,830,182 40,360,050
Gen. BaccalaureateUniversi ties:
Elizabeth C. SU 6,500,389 6,285,792 6,220,296 5,902,325 5,425,950Fayettev' le SU 939,612 911,360 822,423 783,260 744,000Pembroke SU
UNC Asheville 664,843 644,852 601,541 572,896 564,250UNC Wilmington 341,076 340,063 539,235 513,558 350,000Winst.-Salem SU 7,272,910 5,963,197 5,786,520 5,662,872 7,135,300
SUBTOTAL 15,718,830 14,145,264 13,970,015 13,434,911 14,219,500
162
164
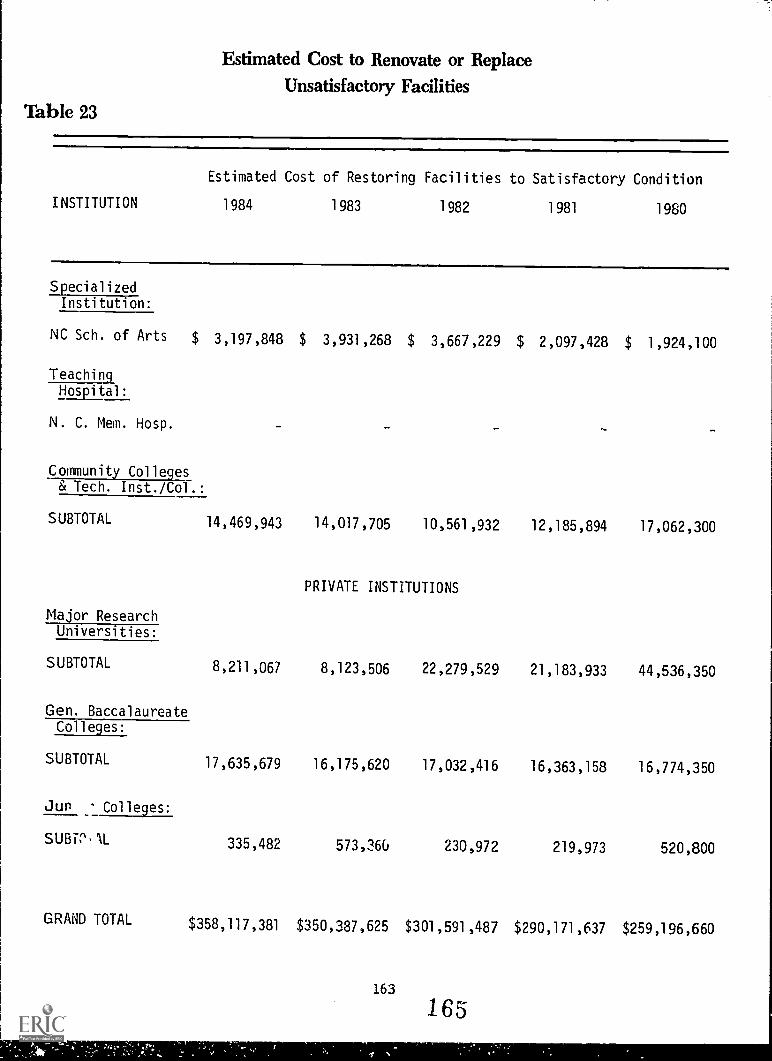
Estimated Cost to Renovate or ReplaceUnsatisfactory Facilities
Table 23
Estimated Cost of Restoring Facilities to Satisfactory Condition
INSTITUTION 1984 1983 1982 1981 1980
SpecializedInstitution:
NC Sch. of Arts $ 3,197,848 $ 3,931,268 $ 3,667,229 $ 2,097,428 $ 1,924,100
TeachingHospital:
N. C. Mem. Hosp.
Community Colleges& Tech. Inst./Col.:
SUBTOTAL 14,469,943 14,017,705 10,561,932 12,185,894 17,062,300
PRIVATE INSTITUTIONS
Major ResearchUniversities:
SUBTOTAL 8,211,067 8,123,506 22,279,529 21,183,933 44,536,350
Gen. BaccalaureateColleges:
SUBTOTAL 17,635,679 16,175,620 17,032,416 16,363,158 16,774,350
Jun . Colleges:
SUB7,1L 335,482 573,266 230,972 219,973 520,800
GRAND TOTAL $358,117,381 $350,387,625 $301,591,487 $290,171,637 $259,196,660
163
165
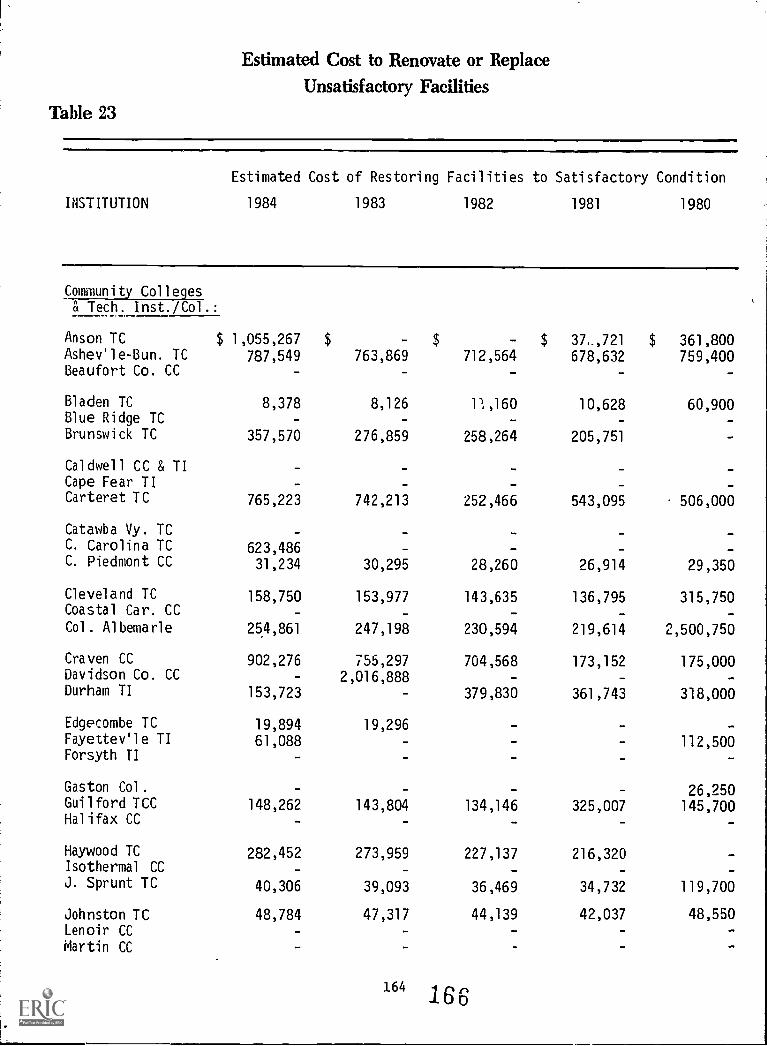
Estimated Cost to Renovate or ReplaceUnsatisfactory Facilities
Table 23
Estimated Cost of Restoring Facilities to Satisfactory Condition
INSTITUTION 1984 1983 1982 1981 1980
Community Colleges& Tech. Inst./Col.:
Anson TC $ 1,055,267 $ $ $ 37,721 $ 361,800Ashevule-Bun. TC 787,549 763,869 712,564 678,632 759,400Beaufort Co. CC - - -
Bladen TC 8,378 8,126 11,160 10,628 60,900Blue Ridge TCBrunswick TC 357,570 276,859 258,264 205,751
Caldwell CC & TICape Fear TI - - -
Carteret TC 765,223 742,213 252,466 543,095 506,000
Catawba Vy. TC - -
C. Carolina TC 623,486 -C. Piedmont CC 31,234 30,295 28,260 26,914 29,350
Cleveland TC 158,750 153,977 143,635 136,795 315,750Coastal Car. CC _ _
Col. Albemarle 254,861 247,198 230,594 219,614 2,500,750
Craven CC 902,276 755,297 704,568 173,152 175,000Davidson Co. CC 2,016,888Durham TI 153,723 379,830 361,743 318,000
Edgecombe TC 19,894 19,296 -
Fayettevile TI 61,088 112,500Forsyth TI -
Gaston Col. - 26,250Guilford TCC 148,262 143,804 134,146 325,007 145,700Halifax CC -
Haywood TC 282,452 273,959 227,137 216,320Isothermal CCJ. Sprunt TC 40,306 39,093 36,469 34,732 119,700
Johnston TC 48,784 47,317 44,139 42,037 48,550Lenoir CC
Martin CC
164 I or,
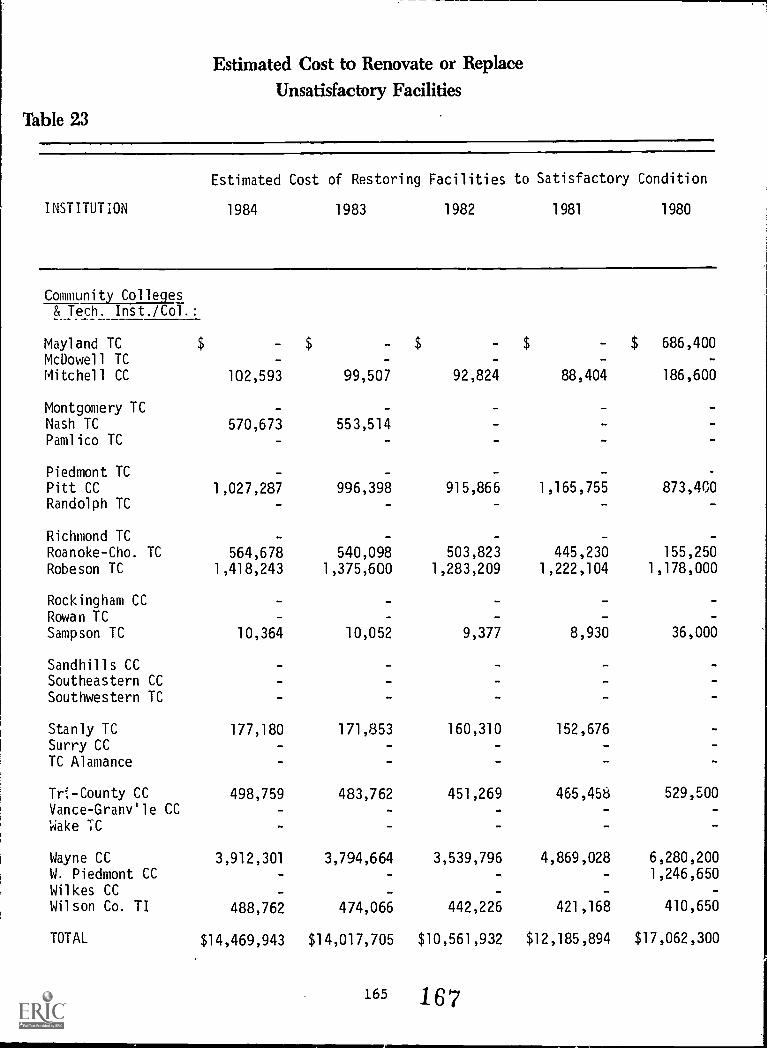
Estimated Cost to Renovate or ReplaceUnsatisfactory Facilities
Table 23
INSTITUTION
Estimated Cost of Restoring Facilities to Satisfactory Condition
1984 1983 1982 1981 1980
Community Colleges& Tech. Inst./Col.:
Mayland TCMcDowell TC
$ - $Y
Mitchell CC 102,593 99,507
Montgomery TC -
Nash TC 570,673 553,514Pamlico TC -
Piedmont TCPitt CC 1,027,287 996,398Randolph TC
Richmond TCRoanoke-Cho. TC 564,678 540,098Robeson TC 1,418,243 1,375,600
Rockingham CCRowan TCSampson TC 10,364 10,052
Sandhills CCSoutheastern CCSouthwestern TC
Stanly TC 177,180 171,853Surry CC -
TC Alamance
Tr-County CC 498,759 483,762Vance- Granv'le CC
'Wake TC
Wayne CC 3,912,301 3,794,664W. Piedmont CCWilkes CCWilson Co. TI 488,762 474,066
TOTAL $14,469,943 $14,017,705
165
$ $ - $ 686,400
92,824 88,404 186,600
-
915,866-
1,165,755 873,400- -
503,823 445,230 155,250
1,283,209 1,222,104 1,178,000
9,377 8,930 36,000
160,310 152,676-
451,269 465,458 529,500- -
-
3,539,796 4,869,028 6,280,2001,246,650
442,226 421,168 410,650
$10,561,932 $12,185,894 $17,062,300
167
, 5 , ^ , ,
.7
, "i 53
S
t-.
, -
,SS
3,,
SS
.55,
,
S, ,,,,
23.
;
,.
tr,
. -* .4 ,
-L - C'e-FSSI1311.1 '()11' st.( .1* Ii1F' :;- i.vt,-"(;3,1t,,, A
, , ,-,:,-,. ,\,..*-;-:',.'r- II '' ""f '.', -' , 7 -::.". .-V.:: ''''',.;41-,..,,,
...,,
TABLE 24:
ACCESSIBLE AREA AS A
PERCENTAGE OF ASSIGNABLE
The Rehabilitation Act of 1973 focused national attention onthe rights of handicapped persons. Section 504 of the Act states that"no otherwise qualified handicapped individual in the UnitedStates . . . shall, solely by reason of his handicap, be excludedfrom the participation in, be denied the benefits of, or be subjectedto discrimination under any program of activity receiving Federalfinancial assistance."
One of the groups protected by Section 504 is the people whoare confined to wheelchairs or whose mobility is otherwise impaired.Although Section 504 does not require that colleges and universitiesmake all of their facilities barrier-free, it does require that theinstitutions' programs be made accessible to the handicapped. Al-though program accessibility can be partially achieved through changesother than facilities modifications, the amount of assignable spacewhich is accessible to the mobility impaired is a factor which mustbe carefully considered in making programs accessible.
The National Center for Education Statistics conducted a surveyin 1978 to determine the impact of Section 504 on colleges anduniversities. One of the findings of the survey was that about 76%of the assignable area on college and university campuses would needto be made accessible in order to comply with the program accessibilityrequirement of Section 504. The survey also found, however, thatthis percentage varied greatly among different institutions.
For purposes of this study, assignable space is considered tobe accessible if a person in a wheelchair can, without assistance,reach that space from immediately outside the building in which thespace is located.
169 1 69
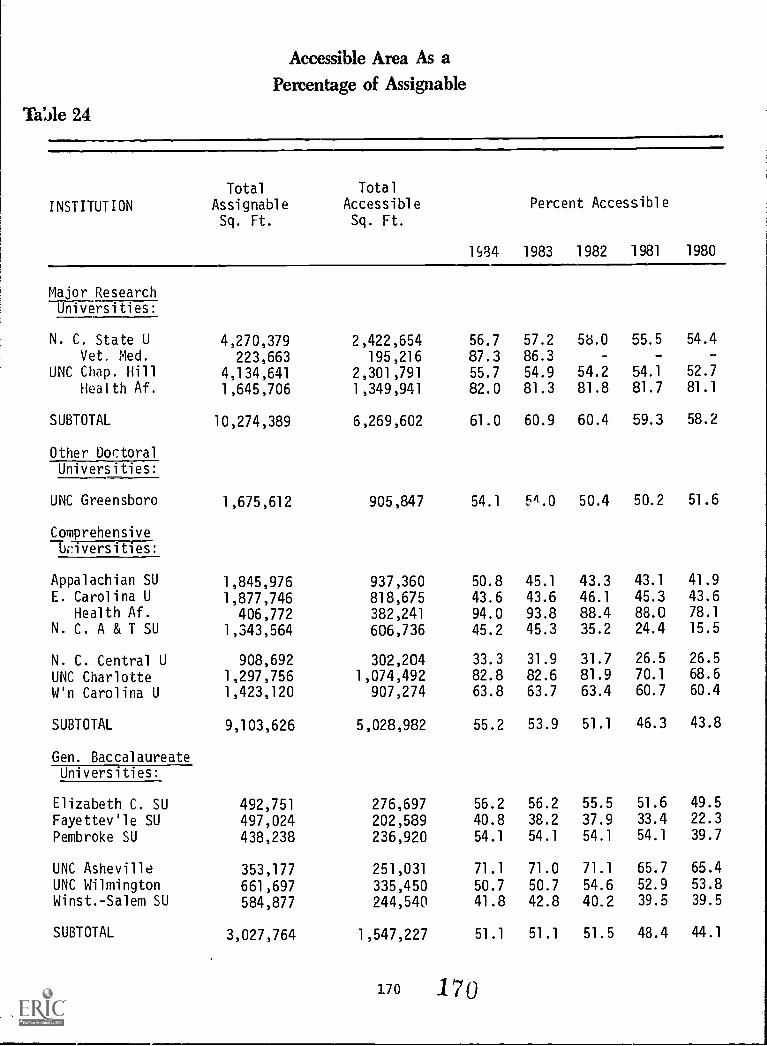
Accessible Area As a
Percentage of Assignable
Ta'ale 24
INSTITUTION
Total
Assignable
Total
Accessible Percent Accessible
Sq. Ft. Sq. Ft.
1984 1983 1982 1981 1980
Major ResearchUniversities:
N. C. State U 4,270,379 2,422,654 56.7 57.2 58.0 55.5 54.4
Vet. Med. 223,663 195,216 87.3 86.3UNC Chap. Hill 4,134,641 2,301,791 55.7 54.9 54.2 54.1 52.7
Health Af. 1,645,706 1,349,941 82.0 81.3 81.8 81.7 81.1
SUBTOTAL 10,274,389 6,269,602 61.0 60.9 60.4 59.3 58.2
Other DoctoralUniversities:
UNC Greensboro 1,675,612 905,847 54.1 54.0 50.4 50.2 51.6
ComprehensiveUniversities:
Appalachian SU 1,845,976 937,360 50.8 45.1 43.3 43.1 41.9
E. Carolina U 1,877,746 818,675 43.6 43.6 46.1 45.3 43.6Health Af. 406,772 382,241 94.0 93.8 88.4 88.0 78.1
N. C. A & T SU 1,343,564 606,736 45.2 45.3 35.2 24.4 15.5
N. C. Central U 908,692 302,204 33.3 31.9 31.7 26.5 26.5
UNC Charlotte 1,297,756 1,074,492 82.8 82.6 81.9 70.1 68.6
W'n Carolina U 1,423,120 907,274 63.8 63.7 63.4 60.7 60.4
SUBTOTAL 9,103,626 5,028,982 55.2 53.9 51.1 46.3 43.8
Gen. BaccalaureateUniversities:
Elizabeth C. SU 492,751 276,697 56.2 56.2 55.5 51.6 49.5
Fayettev'le SU 497,024 202,589 40.8 38.2 37.9 33.4 22.3
Pembroke SU 438,238 236,920 54.1 54.1 54.1 54.1 39.7
UNC Asheville 353,177 251,031 71.1 71.0 71.1 65.7 65.4
UNC Wilmington 661,697 335,450 50.7 50.7 54.6 52.9 53.8
Winst.-Salem SU 584,877 244,540 41.8 42.8 40.2 39.5 39.5
SUBTOTAL 3,027,764 1,547,227 51.1 51.1 51.5 48.4 44.1
170 170
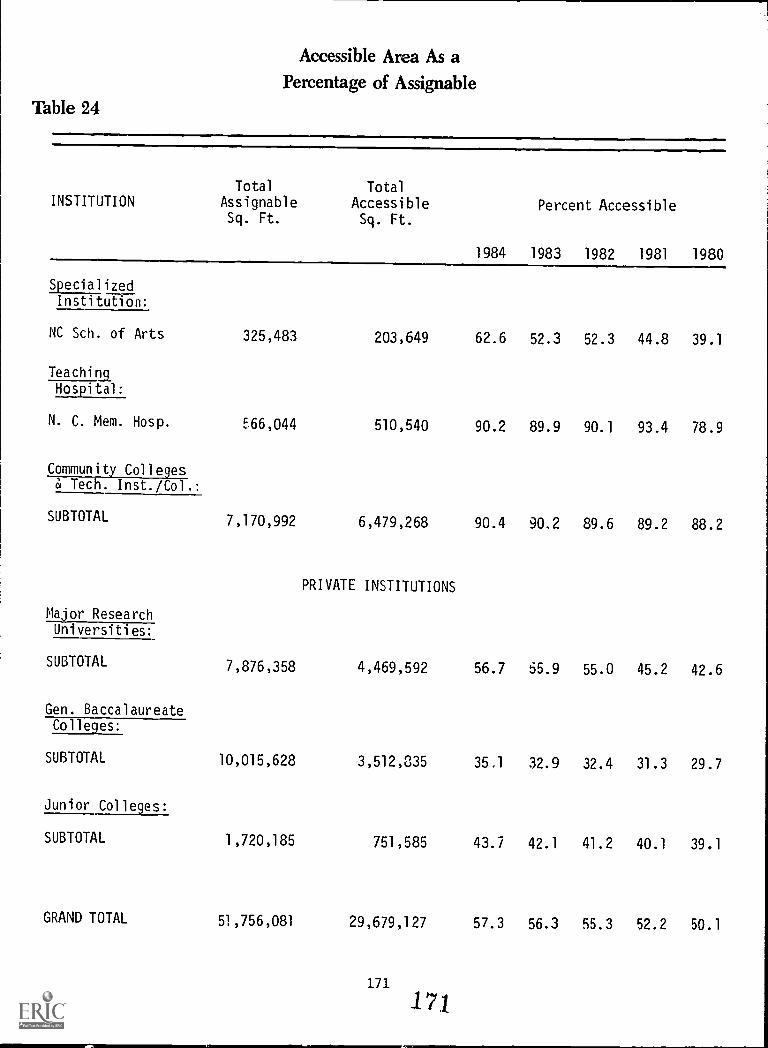
Accessible Area As aPercentage of Assignable
Table 24
INSTITUTIONTotal
AssignableSq. Ft.
Total
AccessibleSq. Ft.
Percent Accessible
1984 1983 1982 1981 1980
SpecializedInstitution:
NC Sch. of Arts 325,483 203,649 62.6 52.3 52.3 44.8 39.1
Teachi ng_
Hospital:
N. C. Mem. Hosp. E;66,044 510,540 90.2 89.9 90.1 93.4 78.9
Community Colleges& Tech. Inst./Col.:
SUBTOTAL 7,170,992 6,479,268 90.4 90.2 89.6 89.2 88.2
PRIVATE INSTITUTIONS
Major ResearchUniversities:
SUBTOTAL 7,876,358 4,469,592 56.7 55.9 55.0 45.2 42.6
Gen. BaccalaureateColleges:
SUBTOTAL 10,015,628 3,512,335 35.1 32.9 32.4 31.3 29.7
Junior Colleges:
SUBTOTAL 1,720,185 751,585 43.7 42.1 41.2 40.1 39.1
GRAND TOTAL 51,756,081 29,679,127 57.3 56.3 55.3 52.2 50.1
171
171
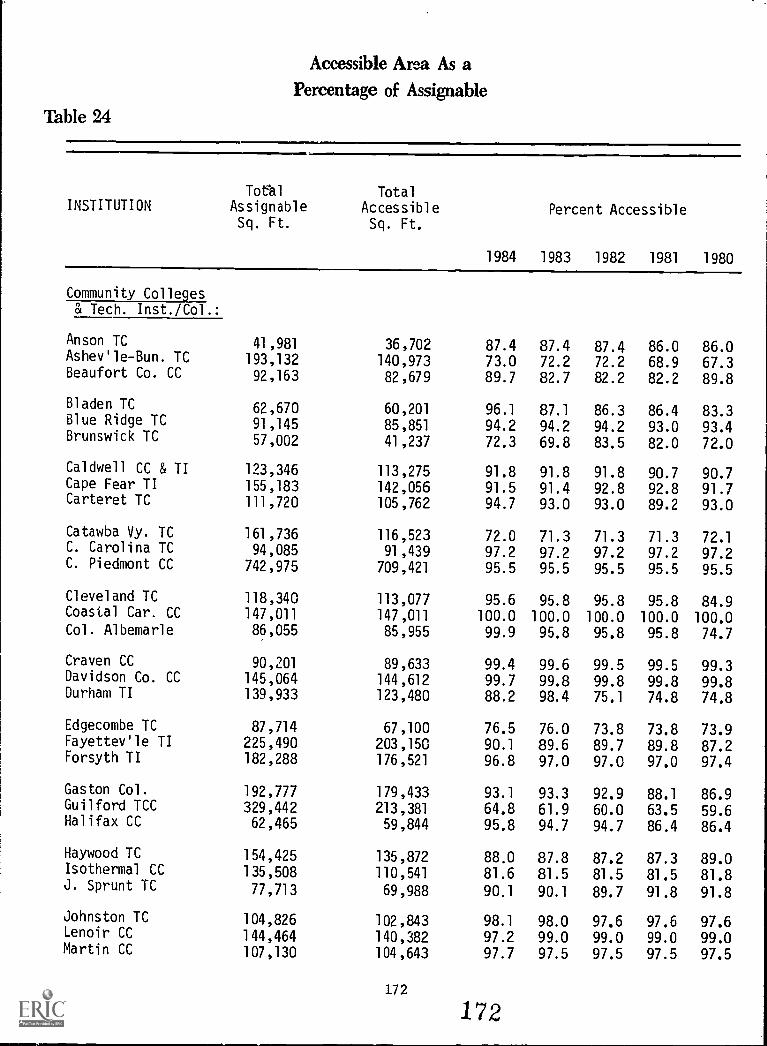
Accessible Area As aPercentage of Assignable
Table 24
INSTITUTIONTotal
AssignableSq. Ft.
Total
AccessibleSq. Ft.
Percent Accessible
1984 1983 1982 1981 1980
Community Colleges& Tech. Inst./Col.:
Anson TC 41,981 36,702 87.4 87.4 87.4 86.0 86.0Ashev'le -Bun. TC 193,132 140,973 73.0 72.2 72.2 68.9 67.3Beaufort Co. CC 92,163 82,679 89.7 82.7 82.2 82.2 89.8
Bladen TC 62,670 60,201 96.1 87.1 86.3 86.4 83.3Blue Ridge TC 91,145 85,851 94.2 94.2 94.2 93.0 93.4Brunswick TC 57,002 41,237 72.3 69.8 83.5 82.0 72.0
Caldwell CC & TI 123,346 113,275 91.8 91.8 91.8 90.7 90.7Cape Fear TI 155,183 142,056 91.5 91.4 92.8 92.8 91.7Carteret TC 111,720 105,762 94.7 93.0 93.0 89.2 93.0
Catawba Vy. TC 161,736 116,523 72.0 71.3 71.3 71.3 72.1C. Carolina TC 94,085 91,439 97.2 97.2 97.2 97.2 97.2C. Piedmont CC 742,975 709,421 95.5 95.5 95.5 95.5 95.5
Cleveland TC 118,340 113,077 95.6 95.8 95.8 95.8 84.9Coastal Car. CC 147,011 147,011 100.0 100.0 100.0 100.0 100.0Col. Albemarle 86,055 85,955 99.9 95.8 95.8 95.8 74.7
Craven CC 90,201 89,633 99.4 99.6 99.5 99.5 99.3Davidson Co. CC 145,064 144,612 99.7 99.8 99.8 99.8 99.8Durham TI 139,933 123,480 88.2 98.4 75.1 74.8 74.8
Edgecombe TC 87,714 67,100 76.5 76.0 73.8 73.8 73.9Fayettev'le TI 225,490 203,150 90.1 89.6 89.7 89.8 87.2Forsyth TI 182,288 176,521 96.8 97.0 97.0 97.0 97.4
Gaston Col. 192,777 179,433 93.1 93.3 92.9 88.1 86.9Guilford TCC 329,442 213,381 64.8 61.9 60.0 63.5 59.6Halifax CC 62,465 59,844 95.8 94.7 94.7 86.4 86.4
Haywood TC 154,425 135,872 88.0 87.8 87.2 87.3 89.0Isothermal CC 135,508 110,541 81.6 81.5 81.5 81.5 81.8J. Sprunt TC 77,713 69,988 90.1 90.1 89.7 91.8 91.8
Johnston TC 104,826 102,843 98.1 98.0 97.6 97.6 97.6Lenoir CC 144,464 140,382 97.2 99.0 99.0 99.0 99.0Martin CC 107,130 104,643 97.7 97.5 97.5 97.5 97.5
172
172
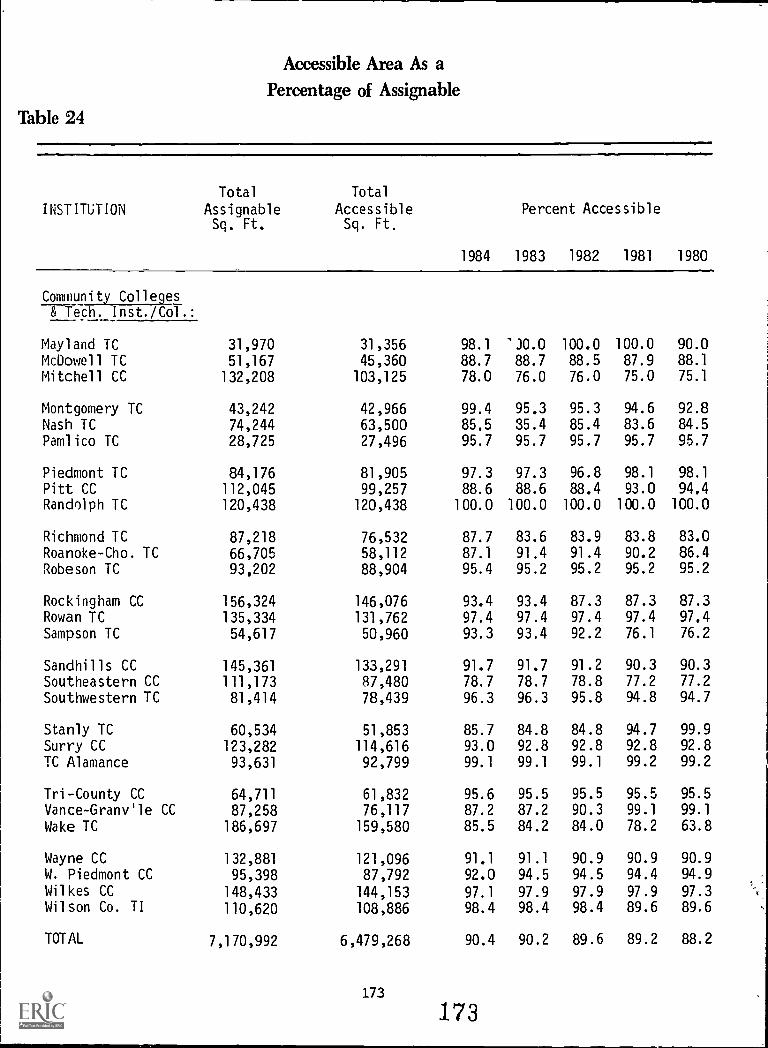
Accessible Area As a
Percentage of Assignable
Table 24
INSTITUTION
Total
AssignableSq. Ft.
Total
AccessibleSq. Ft.
Percent Accessible
1984 1983 1982 1981 1980
Community Colleges& Tech. Inst./Col.:
Mayland IC 31,970 31,356 98.1 'J0.0 100.0 100.0 90.0
McDowell IC 51,167 45,360 88.7 88.7 88.5 87.9 88.1
Mitchell CC 132,208 103,125 78.0 76.0 76.0 75.0 75.1
Montgomery TC 43,242 42,966 99.4 95.3 95.3 94.6 92.8
Nash IC 74,244 63,500 85.5 35.4 85.4 83.6 84.5
Pamlico IC 28,725 27,496 95.7 95.7 95.7 95.7 95.7
Piedmont IC 84,176 81,905 97.3 97.3 96.8 98.1 98.1
Pitt CC 112,045 99,257 88.6 88.6 88.4 93.0 94.4Randolph IC 120,438 120,438 100.0 100.0 100.0 100.0 100.0
Richmond IC 87,218 76,532 87.7 83.6 83.9 83.8 83.0
Roanoke-Cho. TC 66,705 58,112 87.1 91.4 91.4 90.2 86.4
Robeson IC 93,202 88,904 95.4 95.2 95.2 95.2 95.2
Rockingham CC 156,324 146,076 93.4 93.4 87.3 87.3 87.3Rowan TC 135,334 131,762 97.4 97.4 97.4 97.4 97.4Sampson IC 54,617 50,960 93.3 93.4 92.2 76.1 76.2
Sandhills CC 145,361 133,291 91.7 91.7 91.2 90.3 90.3
Southeastern CC 111,173 87,480 78.7 78.7 78.8 77.2 77.2
Southwestern TC 81,414 78,439 96.3 96.3 95.8 94.8 94.7
Stanly TC 60,534 51,853 85.7 84.8 84.8 94.7 99.9
Surry CC 123,282 114,616 93.0 92.8 92.8 92.8 92.8
TC Alamance 93,631 92,799 99.1 99.1 99.1 99.2 99.2
Tri-County CC 64,711 61,832 95.6 95.5 95.5 95.5 95.5
Vance-Gram/11e CC 87,258 76,117 87.2 87.2 90.3 99.1 99.1
Wake TC 186,697 159,580 85.5 84.2 84.0 78.2 63.8
Wayne CC 132,881 121,096 91.1 91.1 90.9 90.9 90.9
W. Piedmont CC 95,398 87,792 92.0 94.5 94.5 94.4 94.9
Wilkes CC 148,433 144,153 97.1 97.9 97.9 97.9 97.3Wilson Co. II 110,620 108,886 98.4 98.4 98.4 89.6 89.6
TOTAL 7,170,992 6,479,268 90.4 90.2 89.6 89.2 88.2
173
173
TABLE 25:
ACCESSIBLE AREA
BY SUMMARY PROGRAMS AND SUBPROGRAMS
The requirement that all colleges and universities make theirprograms accessible to handicapped persons makes careful planning onthe part of campus administrators especially important. Althoughprogram accessibility does not require that a campus be barrier-free,the concepts of program accessibility and facilities accessibilityare inherently interrelated. Campus administrators must thereforeanalyze their campus facilities in terms of accessibility, focusingparticularly on the kinds of space which are accessible.
Table 25 and Tables 25a-25d indicate for each program andsubprogram the percentage of assignable space which is accessible tothe mobility impaired. A dash indicates that a particular institutionhas no assignable space under the indicated program or subprogram.A "0.0" indicates that the institution has assignable space under theprogram or subprogram but that none of it is accessible. Definitionsof the programs and subprograms listed in these tables can be foundin the narratives preceding Tables 14-14d. Subprogram 03 (BuildingService) is not included in Table 25d (and is not considered as partof Program 00 in Table 25) because it applies to nonassignable areaonly.
It is not possible to develop standards to indicate how muchaccessible space in each program and subprogram is needed to achieveprogram accessibility. The figures would vary from institution toinstitution based on the kinds of programmatic changes that had beenimplemented to assist handicapped persons. For example, the financialaid program at a college or university would be considered accessibleif a handicapped student had the same access to the financial aidand related counseling which the institution offered to other students.This could be accomplished without making the space occupied by thefinancial aid office accessible. Thus, a program or subprogram whichhas little or no accessible space is not racessarily inaccessible.
Although the data in Table 25 and Tables 25a-25d cannot be usedto ascertain whether program accessibility has been achieved, theinformation does provide facilities planners with a detailed breakdownof the accessible space on their campuses. This will in turn assisteach institution in the determination of the most practical means ofachieving program accessibility.
175 .174
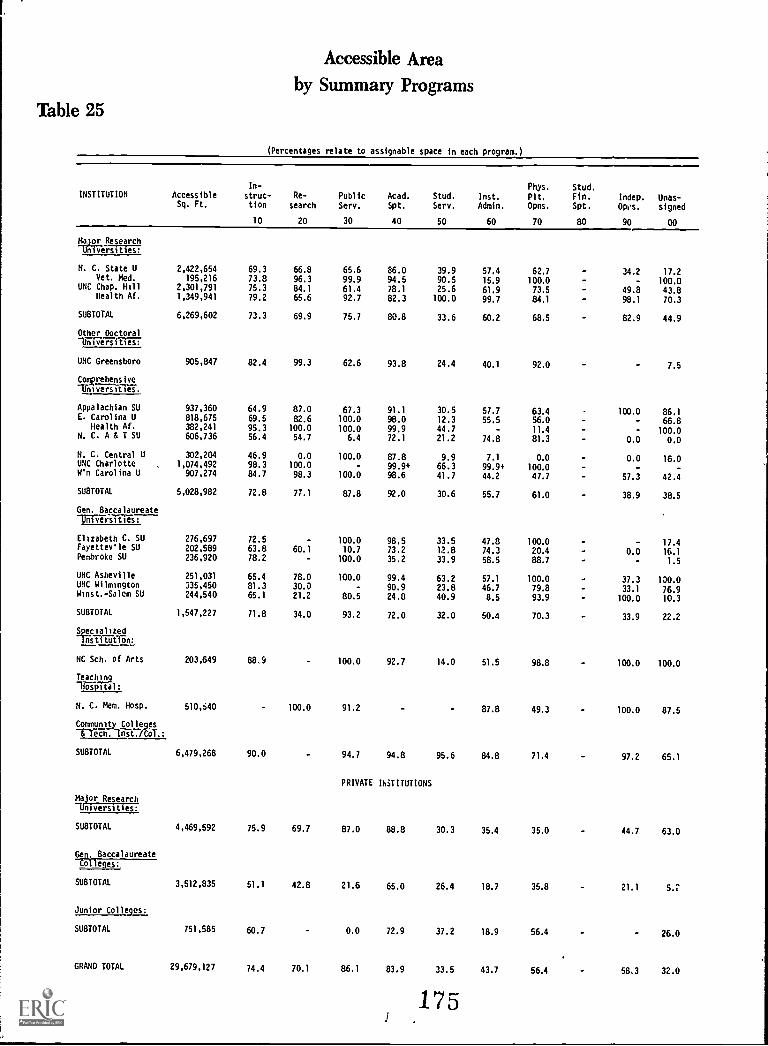
Table 25
Accessible Area
by Summary Programs
(Percentages relate to assignable space in each program.)
INSTITUTION AccessibleSq. Ft.
In-
strut-Lion
10
Re-
search
20
PublicServ.
30
Acad.
Spt.
40
Stud.
Serv.
50
Inst.
Admin.
60
Phys. Stud.
Plt. Fin.Opns. Spt.
70 80
Indep.
Opus.
90
Unas-signed
00
Major ResearchUniveiii17110.
N. C. State U 2,422,654 69.3 66.8 65.6 86.0 39.9 57.4 62.7 34.2 17.2Vet. Med. 195,216 73.8 96.3 99.9 94.5 90.5 15.9 100.0 100.0
UNC Chap. Hill 2,301,791 75.3 84.1 61.4 78.1 25.6 61.9 73.5 49.8 43.8Health Af. 1,349,941 79.2 65.6 92.7 82.3 100.0 99.7 84.1 98.1 70.3
SUBTOTAL 6,269,602 73.3 69.9 75.7 80.8 33.6 60.2 68.5 82.9 44.9
Other Doctoral
905,847 82.4 99.3 62.6 93.8 24.4 40.1 92.0 7.5UNC Greensboro
Comprehensive-Bilanifig.
Appalachian SU 937,360 64.9 87.0 67.3 91.1 30.5 57.7 63.4 100.0 86.1E. Carolina U 818,675 69.5 82.6 100.0 98.0 12.3 55.5 56.0 66.8
Health Af. 382,241 95.3 100.0 100.0 99.9 44.7 - 11.4 - 100.0N. C. A & T SU 606,736 56.4 54.7 6.4 72.1 21.2 74.8 81.3 0.0 0.0
N. C. Central U 302,204 46.9 0.0 100.0 87.8 9.9 7.1 0.0 0.0 16.0UNC Charlotte 1,074,492 98.3 100.0 - 99.9+ 66.3 99.9+ 100.0W'n Carolina U 907,274 84.7 98.3 100.0 98.6 41.7 44.2 47.7 57.3 42.4
SUBTOTAL 5,028,982 72.8 77.1 87.8 92.0 30.6 55.7 61.0 38.9 38.5
Gen. BaccalaureateTiTiiii-RIET---
Elizabeth C. SU 276,697 72.5 100.0 98.5 33.5 47.8 100.0 - 17.4Fayettev'le SU 202,589 63.8 60.1 10.7 73.2 12.8 74.3 20.4 0.0 16.1Pembroke SU 236,920 78.2 100.0 35.2 33.9 58.5 88.7 - 1.5
UNC Asheville 251,031 65.4 78.0 100.0 99.4 63.2 57.1 100.0 37.3 100.0UNC Wilmington 335,450 81.3 30.0 - 90.9 23.8 46.7 79.8 33.1 76.9Winst.-Salem SU 244,540 65.1 21.2 80.5 24.0 40.9 8.5 93.9 100.0 10.3
SUBTOTAL 1,547,227 71.8 34.0 93.2 72.0 32.0 50.4 70.3 33.9 22.2
SpecializedInstitution:
NC Sch. of Arts 203,649 88.9 100.0 92.7 14.0 51.5 98.8 100.0 100.0
Teach-hospital:
N. C. Mem. HosP. 510,S40 100.0 91.2 87.8 49.3 100.0 87.5
Community Colleges-S-Tech. Inst./Col.:
SUBTOTAL 6,479,268 90.0 94.7 94.8 95.6 84.8 71.4 97.2 65.1
PRIVATE INSTITUTIONS
Major ResearchUniversities:
SUBTOTAL 4,469,592 75.9 69.7 87.0 88.8 30.3 35.4 35.0 44.7 63.0
Gen. Baccalaureate-talecies:
SUBTOTAL 3,512,835 51.1 42.8 21.6 65.0 26.4 18.7 35.8 21.1 5.;
Junior Colleges:
SUBTOTAL 751,585 60.7 0.0 72.9 37.2 18.9 56.4 26.0
GRAND TOTAL 29,679,127 74.4 70.1 86.1 83.9 33.5 43.7 56.4 58.3 32.0
175
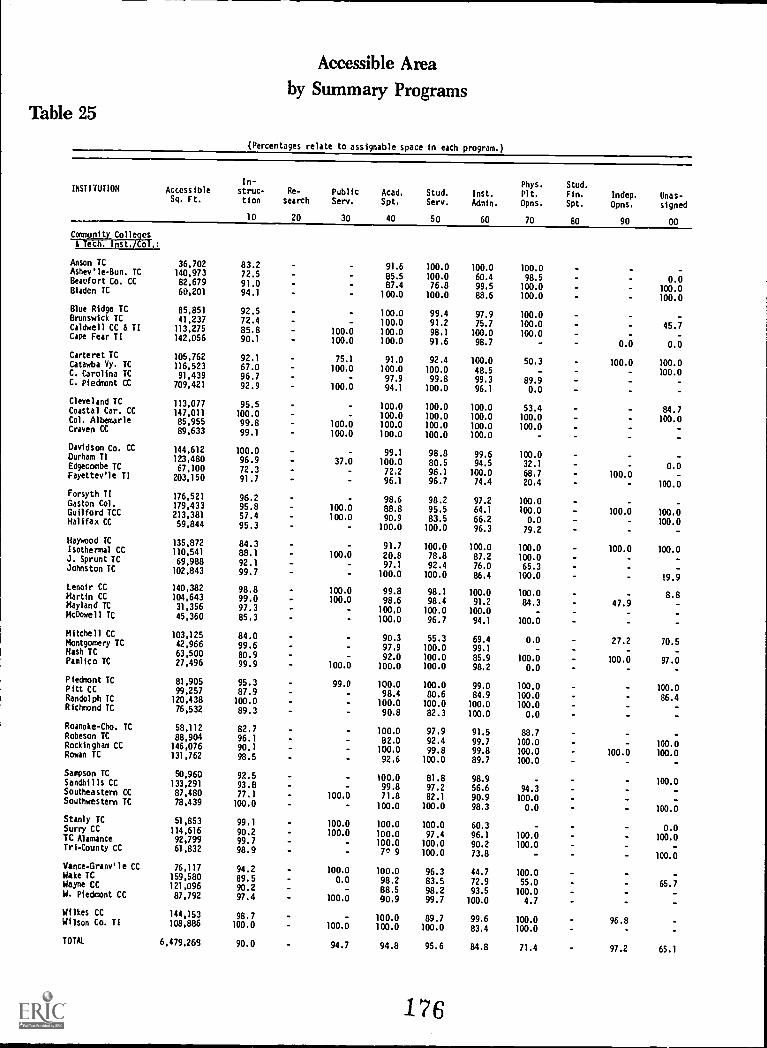
Table 25
Accessible Area
by Summary Programs
(Percentages relate to assignable space in each program.)
INSTITUTION AccessibleSq. Ft.
In-struc-Lion
Re-
searchPublicServ.
Acad.
Spt.Stud.
Serv.Inst.
Admin.
Phys.
Plt.
Opns.
Stud.Fin.
Spt.Indep.
Opns.Unas-signed
10 20 30 40 50 60 70 80 90 00
Community CollegesI Tech. Inst./Col.:
Anson TC 36,702 83.2 91.6 100.0 100.0 100.0Ashev'le-Bun. IC 140,973 72.5 85.5 100.0 60.4 98.5 0.0Beaufort Co. CC 82,679 91.0 67.4 76.8 99.5 100.0 100.0Bladen TC 60,201 94.1 100.0 100.0 88.6 100.0 100.0
Blue Ridge TC 85,851 92.5 100.0 99.4 97.9 100.0Brunswick TC 41,237 72.4 100.0 91.2 75.7 100.0 45.7Caldwell CC 8 TI 113,275 85.8 100.0 100.0 98.1 100.0 100.0Cape Fear TI 142,056 90.1 100.0 100.0 91.6 98.7 0.0 0.0
Carteret TC 105,762 92.1 75.1 91.0 92.4 100.0 50.3 100.0 100.0Catawba Vy. TC 116,523 67.0 100.0 100.0 100.0 48.5 100.0C. Carolina TC 91,439 96.7 97.9 99.8 99.3 89.9C. Piedmont CC 709,421 92.9 100.0 94.1 100.0 96.1 0.0
Cleveland TC 113,077 95.5 100.0 100.0 100.0 53.4 84.7Coastal Car. CC 147,011 100.0 100.0 100.0 100.0 100.0 100.0Col. Albemarle 85,955 99.8 100.0 100.0 100.0 100.0 100.0Craven CC 89,633 99.1 100.0 100.0 100.0 100.0
Davidson Co. CC 144,612 100.0 99.1 98.8 99.6 100.0Durham TI 123,480 96.9 37.0 100.0 80.5 94.5 32.1 0.0Edgecombe TC 67,100 72.3 72.2 96.1 100.0 68.7 100.0Fayettev'le TI 203,150 91.7 96.1 96.7 74.4 20.4 100.0Forsyth TI 176,521 96.2 98.6 98.2 97.2 100.0Gaston Col. 179,433 95.8 100.0 88.8 95.5 64.1 100.0 100.0 100.0Guilford TCC 213,381 57.4 100.0 90.9 83.5 66.2 0.0 100.0Halifax CC 59,844 95.3 100.0 100.0 96.3 79.2
Haywood TC 135,872 84.3 91.7 100.0 100.0 100.0 100.0 100.0Isothermal CC 110,541 88.1 100.0 20.8 78.8 87.2 100.0J. Sprunt TC 69,988 92.1 97.1 92.4 76.0 65.3Johnston IC 102,843 99.7 100.0 100.0 86.4 100.0 19.9Lenoir CC 140,382 98.8 100.0 99.8 98.1 100.0 100.0 8.8Martin CC 104,643 99.0 100.0 98.6 98.4 91.2 84.3 47.9Mayland TC 31,356 97.3 100.0 100.0 100.0McDowell TC 45,360 85.3 100.0 96.7 94.1 100.0
Mitchell CC 103,125 84.0 90.3 55.3 69.4 0.0 27.2 70.5Montgomery TC 42,966 99.6 97.9 100.0 99.1Nash IC 63,500 80.9 92.0 100.0 85.9 100.0 100.0 97.0Pamlico TC 27,496 99.9 100.0 100.0 100.0 98.2 0.0
Piedmont TC 81,905 95.3 99.0 100.0 100.0 99.0 100.0 100.0Pitt CC 99,257 87.9 98.4 80.6 84.9 100.0 86.4Randolph TC 120,438 100.0 100.0 100.0 100.0 100.0Richmond TC 76,532 89.3 90.8 82.3 100.0 0.0
Roanoke-Cho. TC 58,112 82.7 100.0 97.9 91.5 88.7Robeson TC 88,904 96.1 82.0 92.4 99.7 100.0 100.0Rockingham CC 146,076 90.1 100.0 99.8 99.8 100.0 100.0 100.0Rowan TC 131,762 98.5 92.6 100.0 89.7 100.0
Sampson TC 50,960 92.5 100.0 61.8 98.9 100.0Sandhills CC 133,291 93.6 99.8 97.2 56.6 94.3 -Southeastern CC 87,480 77.1 100.0 71.8 82.1 90.9 100.0 -Southwestern TC 78,439 100.0 100.0 100.0 98.3 0.0 100.0
Stanly TC 51,853 99.1 100.0 100.0 100.0 60.3 0.0Surry CC 114,616 90.2 100.0 100.0 97.4 96.1 100.0 - 100.0TC Alamance 92,799 99.7 100.0 100.0 90.2 100.0 -Tri-County CC 61,832 98.9 70 9 100.0 73.8 100.0
Vance-Granv'le CC 76,117 94.2 100.0 100.0 96.3 44.7 100.0 -Wake TC 159,580 89.5 0.0 98.2 83.5 72.9 55.0 65.7Wayne CC 121,096 90.2 - B8.5 98.2 93.5 100.0 -W. Piedmont CC 87,792 97.4 100.0 90.9 99.7 100.0 4.7 -
Wilkes CC 144,153 98.7 100.0 89.7 99.6 100.0 96.8Wilson Co. TI 108,886 100.0 100.0 100.0 100.0 83.4 100.0
TOTAL 6,479.265 90.0 94.7 94.8 95.6 84.8 71.4 97.2 65.1
176
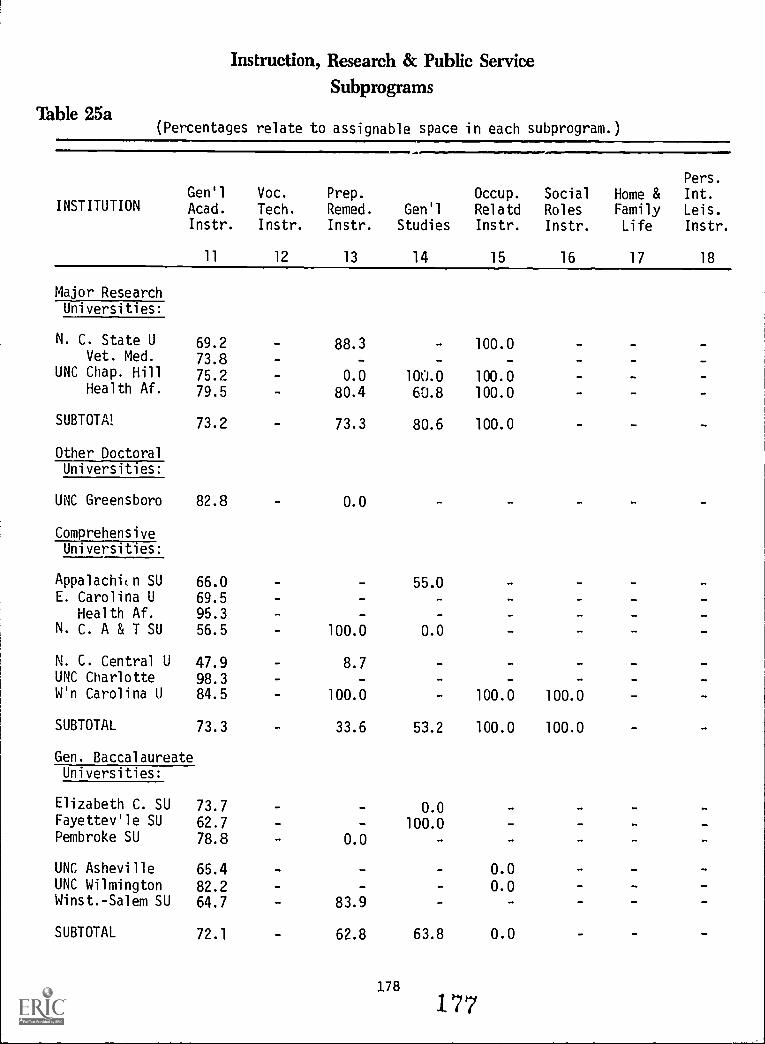
Table 25a
Instruction, Research & Public ServiceSubprograms
(Percentages relate to assignable space in each subprogram.)
Gen'lINSTITUTION Acad.
Instr.
Voc.
Tech.
Instr.
Prep.
Remed.
Instr.
Gen'l
Studies
Occup.RelatdInstr.
SocialRoles
Instr.
Home &FamilyLife
Pers.
Int.
Leis.
Instr.
11 12 13 14 15 16 17 18
Major ResearchUniversities:
N. C. State U 69.2 88.3 100.0Vet. Med. 73.8
UNC Chap. Hill 75.2 0.0 100.0 100.0Health Af. 79.5 80.4 60.8 100.0
SUBTOTAL 73.2 73.3 80.6 100.0
Other DoctoralUniversities:
UNC Greensboro 82.8 0.0
ComprehensiveUniversities:
Appalachian SU 66.0 55.0E. Carolina U 69.5 -
Health Af. 95.3N. C. A & T SU 56.5 100.0 0.0
N. C. Central U 47.9 8.7UNC Charlotte 98.3W'n Carolina U 84.5 100.0 100.0 100.0
SUBTOTAL 73.3 33.6 53.2 100.0 100.0
Gen. BaccalaureateUniversities:
Elizabeth C. SU 73.7 0.0Fayettev'le SU 62.7 100.0Pembroke SU 78.8 0.0
UNC Asheville 65.4 0.0UNC Wilmington 82.2 0.0Winst.-Salem SU 64.7 83.9
SUBTOTAL 72.1 62.8 63.8 0.0
178
177
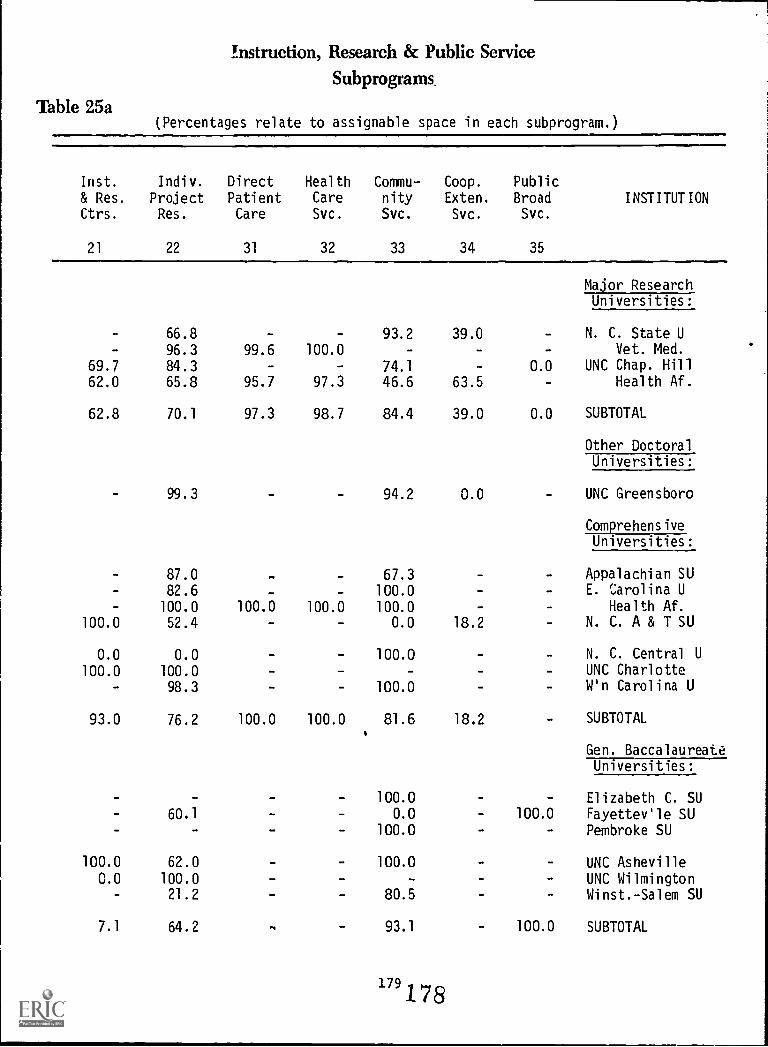
Table 25a
Instruction, Research & Public ServiceSubprograms
(Percentages relate to assignable space in each subprogram.)
Inst.
& Res.
Ctrs.
21
Indiv.
ProjectRes.
22
DirectPatientCare
31
HealthCareSvc.
32
Commu-nitySvc.
33
Coop.
Exten.
Svc.
34
PublicBroadSvc.
35
INSTITUTION
Major ResearchUniversities:
66.8 93.2 39.0 N. C. State U
96.3 99.6 100.0 - Vet. Med.
69.7 84.3 74.1 0.0 UNC Chap. Hill
62.0 65.8 95.7 97.3 46.6 63.5 Health Af.
62.8 70.1 97.3 98.7 84.4 39.0 0.0 SUBTOTAL
Other DoctoralUniversities:
99.3 94.2 0.0 UNC Greensboro
ComprehensiveUniversities:
87.0 .. 67.3 Appalachian SU
82.6 - 100.0 E. Carolina U
100.0 100.0 100.0 100.0 Health Af.
100.0 52.4 0.0 18.2 N. C. A & T SU
0.0 0.0 100.0 N. C. Central U
100.0 100.0 - - UNC Charlotte
98.3 100.0 W'n Carolina U
93.0 76.2 100.0 100.0 81.6 18.2 SUBTOTAL
Gen. BaccalaureateUniversities:
- 100.0 Elizabeth C. SU60.1 - 0.0 100.0 Fayettev'le SU
- 100.0 Pembroke SU
100.0 62.0 100.0 UNC Asheville0.0 100.0 UNC Wilmington
21.2 - 80.5 Winst.-Salem SU
7.1 64.2 PI 93.1 100.0 SUBTOTAL
179 1 78
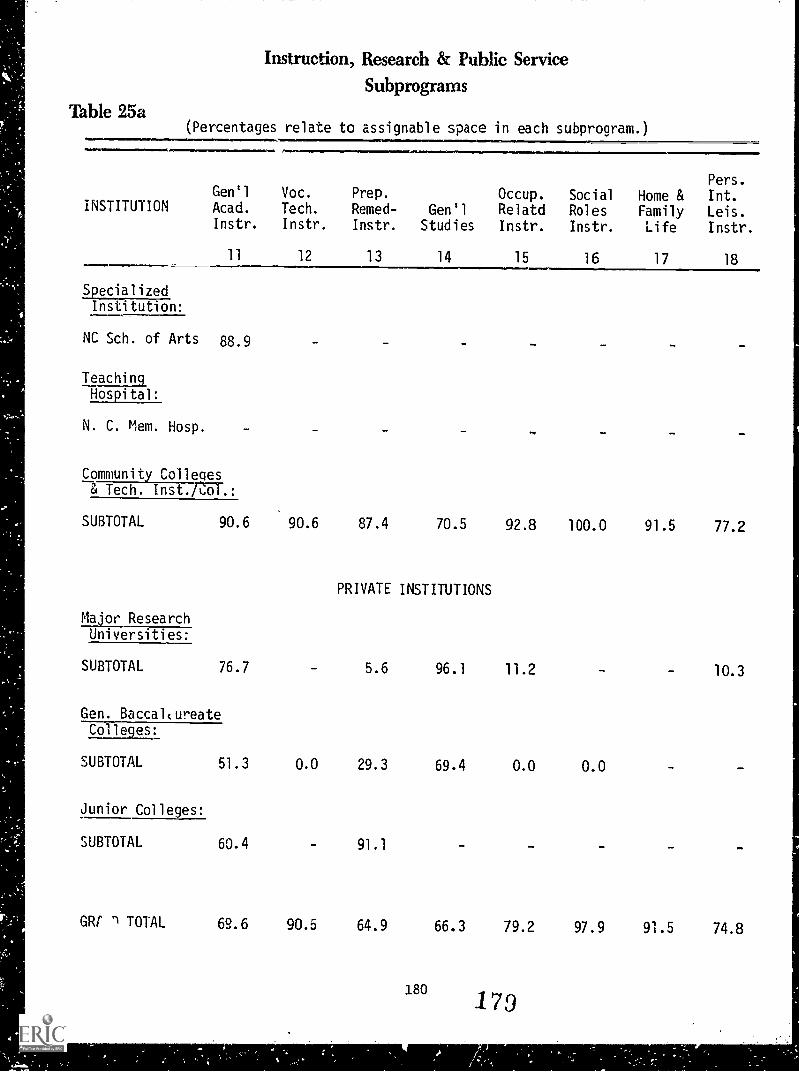
Table 25a
Instruction, Research & Public ServiceSubprograms
(Percentages relate to assignable space in each subprogram...11M.11111=11.11111.111,l1110...
AMOOMMINNINIOMR
Pers.Gen'l Voc. Prep. Occup. Social Home & Int.
INSTITUTION Acad. Tech. Remed- Gen'l Relatd Roles Family Leis.Instr. Instr. Instr. Studies Instr. Instr. Life Instr.
1 11 12 13 14 15 16 17 18
SpecializedInstitution:
NC Sch. of Arts mg
TeachingHospital:
N. C. Mem. Hosp.
Community Colleges& Tech. Inst./Col.:
SUBTOTAL 90.6 90.6 87.4 70.5
PRIVATE INSTITUTIONS
Major ResearchUniversities:
SUBTOTAL 76.7 5.6 96.1
Gen. BaccalaureateColleges:
SUBTOTAL 51.3 0.0 29.3 69.4
Junior Colleges:
SUBTOTAL 60.4 91.1
GRT 1 TOTAL 69.6 90.5 64.9 66.3
180
92.8 100.0 91.5 77.2
11.2 10.3
0.0 0.0
79.2 97.9 91.5 74.8
179
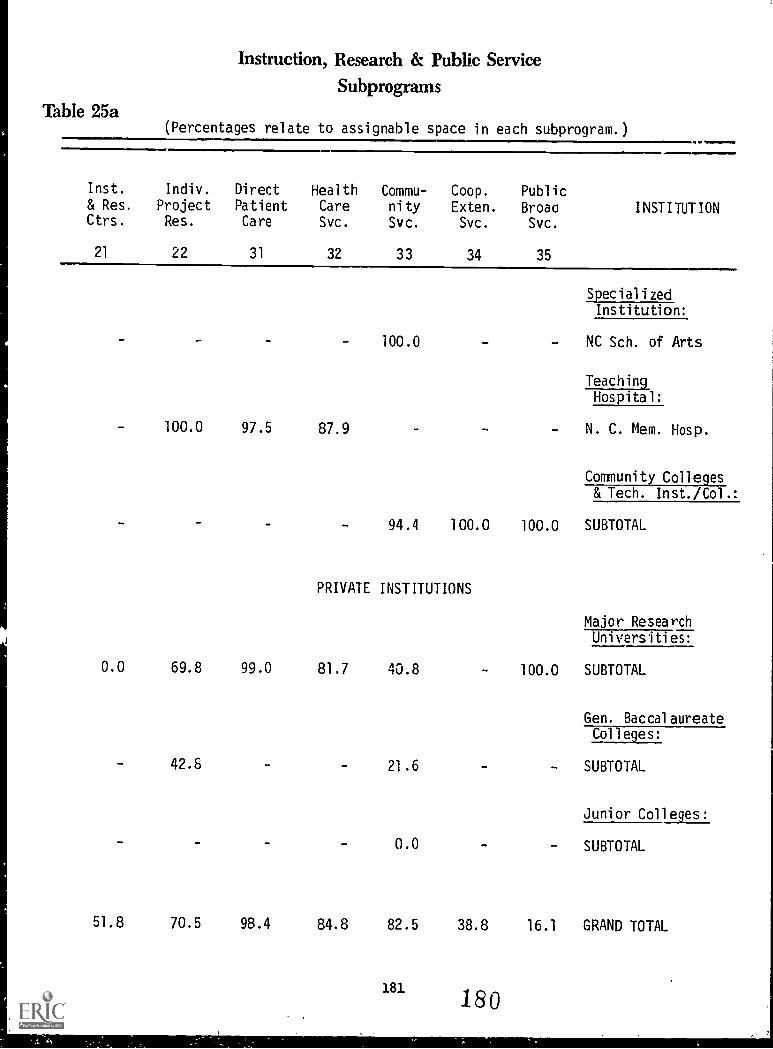
Table 25a
Instruction, Research & Public ServiceSubprograms
(Percentages relate to assignable space in each subprogram.)411(1111110
Inst.
& Res.Ctrs.
21
Indiv.
ProjectRes.
22
Direct
PatientCare
31
HealthCareSvc.
32
Commu-nitySvc.
33
100.0 97.5
-
87.9
-
100.0
94.4
Coop. PublicExten. BroadSvc. Svc.
34 35
INSTITUTION
SpecializedInstitution:
- NC Sch. of Arts
TeachingHospital:
- N. C. Mem. Hosp.
Community Colleges& Tech. Inst./Col.:
100.0 100.0 SUBTOTAL
PRIVATE INSTITUTIONS
0.0 69.8 99.0 81.7 40.8
42.6 21.6
- 0.0
51.8 70.5 98.4 84.8 82.5
181
Major ResearchUniversities:
100.0 SUBTOTAL
Gen. BaccalaureateColleges:
SUBTOTAL
Junior Colleges:
- - SUBTOTAL
38.8 16.1 GRAND TOTAL
180

1
Table 25a
Instruction, Research & Public ServiceSubprograms
(Percentages relate to assignable space in &id', subprogram.)
Gen'lINSTITUTION Acad.
Instr.
Voc.
Tech.
Instr.
Prep.
Remed.Instr.
Gen'l
Studies
Occup.RelatdInstr.
Social
RolesInstr.
Home &FamilyLife
Pers.
Int.
Leis.
Instr.
Commu-nitySvc.
11 12 13 14 15 16 17 18 33
Community Colleges& Tech. Inst./Col.:
Anson TC - 82.7 - 91.1Ashev'le -Bun. TC - 72.1 100.0 40.2 100.0Beaufort Co. CC 100.0 90.5 100.0
Bladen TC - 93.3 - 100.0 - 100.0 100.0Blue Ridge TC - 99.2 - 15.8 100.0 0.0Brunswick TC - 71.1 - - 100.0 - 100.0
Caldwell CC & TI 69.7 88.8 100.0 - 100.0Cape Fear TI 100.0 93.4 86.1 100.0 0.0 100.0Carteret TC - 95.3 0.0 100.0 0.0 0.0 0.0 75.1
Catawba Vy. TC - 64.7 100.0 100.0 - 100.0 100.0C. Carolina TC - 96.3 00.0 100.0C. Piedmont CC 96.6 91.7 100.0 100.0 - 100.0
Cleveland TC - 95.6 100.0 93.5Coastal Car. CC' 100.0 100.0 100.0 100.0 100.0 - 100.0Col. Albemarle 100.0 99.7 100.0 100.0 100.0 - 100.0
Craven CC** 100.0 99.0 100.0Davidson Co. CC 100.0 100.0 100.0 100.0Durham TI - 100.0 100.0 100.0 1.6 100.0 37.0
Edgecombe TC - 72.2 - 74.1Fayettev'le TI - 91.3 - 100.0 100.0Forsyth TI - 96.1 100.0 100.0
Gaston Col. 90.4 97.8 100.0 100.0 11,0.0 - - - 100.0Guilford TCC 100.0 60.2 100.0 17.7 100.0 - 100.0 100.0Halifax CC 94.5 99.8 52.4 - 100.0 - 100.0
Haywood TC 82.2 - 100.0 92.0 - 100.0Isothermal CC** 92.6 89.7 100.0 47.9 48.7 - 100.0 100.0J. Sprunt TC - 94.0 100.0 27.0 - -
Johnston TC - 99.6 - 100.0 -
Lenoir CC* 99.7 98.1 - 100.0 100.0Martin CC* 100.0 98.7 - 100.0 100.0
*34 (Coop. Exten. Svc.): Lenoir CC - 100.0, Martin CC - 100.0,Vance-Granville CC - 100.0, Subtotal - 100.0
131
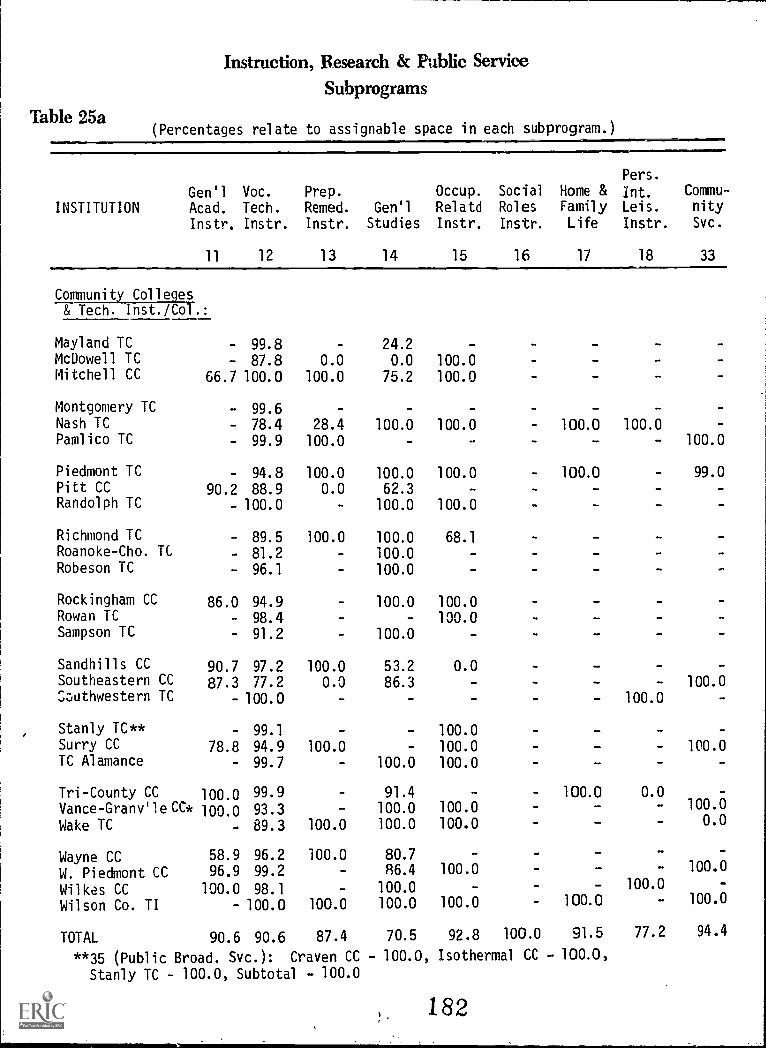
Table 25a
Instruction, Research & Public ServiceSubprograms
(Percentages relate to assignable space in each subprogram.)
Gen'l Voc.
INSTITUTION Acad. Tech.
Instr. Instr.
Prep.
Remed.
Instr.
Gen'l
Studies
Occup.RelatdInstr.
Social
Roles
Instr.
Home &FamilyLife
Pers.
Int.Leis.
Instr.
Commu-nitySvc.
11 12 13 14 15 16 17 18 33
Community Colleges& Tech. Inst./Col.:
Mayland TC - 99.8 24.2 _ -McDowell TC - 87.8 0.0 0.0 100.0Mitchell CC 66.7 100.0 100.0 75.2 100.0
Montgomery TC - 99.6Nash TC - 78.4 28.4 100.0 100.0 100.0 100.0Pamlico TC - 99.9 100.0 - - 100.0
Piedmont TC - 94.8 100.0 100.0 100.0 - 100.0 99.0Pitt CC 90.2 88.9 0.0 62.3Randolph TC - 100.0 100.0 100.0
Richmond TC - 89.5 100.0 100.0 68.1Roanoke-Cho. TC - 81.2 100.0Robeson TC - 96.1 100.0
Rockingham CC 86.0 94.9 100.0 100.0Rowan TC - 98.4 - - 100.0Sampson TC - 91.2 100.0
Sandhills CC 90.7 97.2 100.0 53.2 0.0 - _
Southeastern CC 87.3 77.2 0.0 86.3 - - 100.0,outhwestern TC - 100.0 - 100.0
Stanly TC** - 99.1 100.0Surry CC 78.8 94.9 100.0 100.0 - - 100.0TC Alamance - 99.7 100.0 100.0 _ -
Tri-County CC 100.0 99.9 91.4 - 100.0 0.0
Vance- Granv'leCC* 100.0 93.3 100.0 100.0 - 100.0
Wake TC - 89.3 100.0 100.0 100.0 - 0.0
Wayne CC 58.9 96.2 100.0 80.7
W. Piedmont CC 96.9 99.2
Wilkes CC 100.0 98.1
- 86.4
100.0
100.0 -
100.0
100.0
Wilson Co. TI - 100.0 100.0 100.0 100.0 - 100.0 100.0
TOTAL 90.6 90.6 87.4 70.5 92.8 100.0 91.5 77.2 94.4
* *35 (Public Broad. Svc.): Craven CC - 100.0
Stanly TC - 100.0, Subtotal - 100.0, Isothermal CC - 100.0,
182!
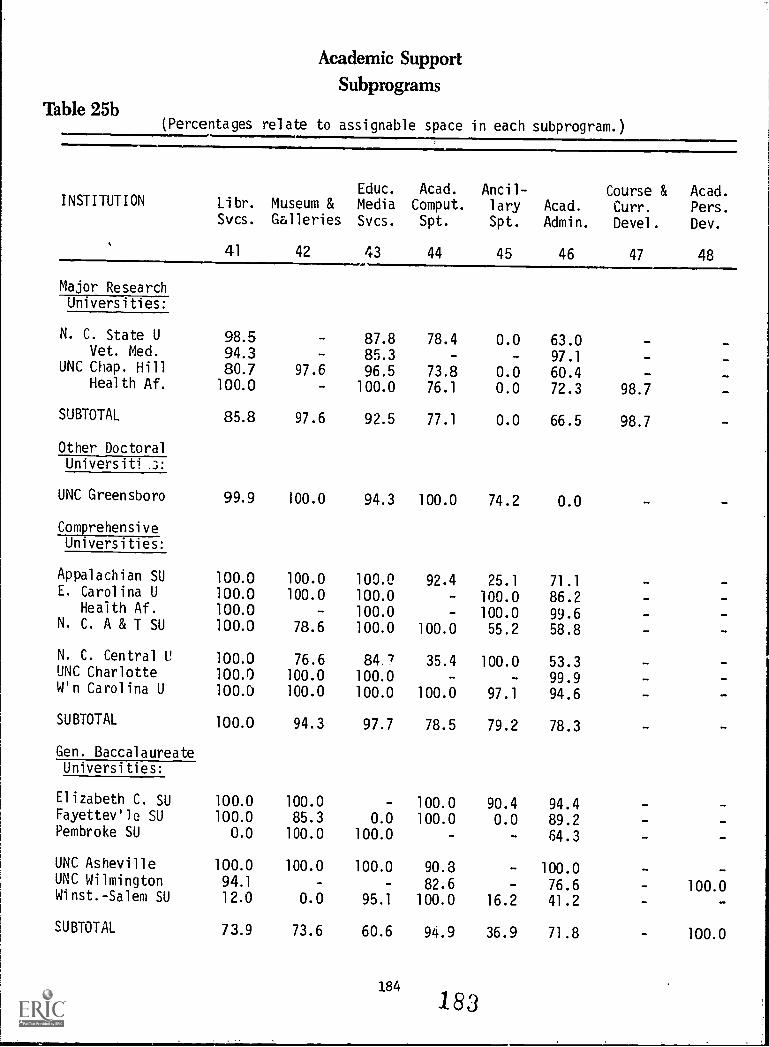
Table 25b
Academic Support
Subprograms
(Percentages relate to assignable space in each subprogram.)
INSTITUTIONEduc.
Libr. Museum & MediaSvcs. Galleries Svcs.
41 42 43
Major Research
98.594.3
87.885.3
Universities:
N. C. State UVet. Med.
UNC Chap. Hill 80.7 97.6 96.5Health Af. 100.0 - 100.0
SUBTOTAL 85.8 97.6 92.5
Other DoctoralUniversiti .3:
UNC Greensboro 99.9 100.0 94.3
ComprehensiveUniversities:
Appalachian SU 100.0 100.0 100.0E. Carolina U 100.0 100.0 100.0
Health Af. 100.0 100.0N. C. A & T SU 100.0 78.6 100.0
N. C. Central 1 100.0 76.6 84.7UNC Charlotte 100.0 100.0 100.0W'n Carolina U 100.0 100.0 100.0
SUBTOTAL 100.0 94.3 97.7
Gen. BaccalaureateUniversities:
Elizabeth C. SU 100.0 100.0 -
Fayettev'le SU 100.0 85.3 0.0Pembroke SU 0.0 100.0 100.0
UNC Asheville 100.0 100.0 100.0UNC Wilmington 94.1Winst.-Salem SU 12.0 0.0 95.1
SUBTOTAL 73.9 73.6 60.6
184
Acad.
Comput.Spt.
Ancil-larySpt.
Acad.
Admin.
Course &Curr.
Devel.
Acad.Pers.
Dev.
44 45 46 47 48
78.4 0.0 63.0 -- 97.1 -
73.8 0.0 60.476.1 0.0 72.3 98.7 -
77.1 0.0 66.5 98.7
100.0 74.2 0.0
92.4 25.1 71.1- 100.0 86.2- 100.0 99.6
100.0 55.2 58.8
35.4 100.0 53.3 _ -99.9
100.0 97.1 94.6
78.5 79.2 78.3
100.0 90.4 94.4100.0 0.0 89.2 _ -
64.3
90.8 - 100.082.6 - 76.6 - 100.0
100.0 16.2 41.2
94.9 36.9 71.8 100.0
183
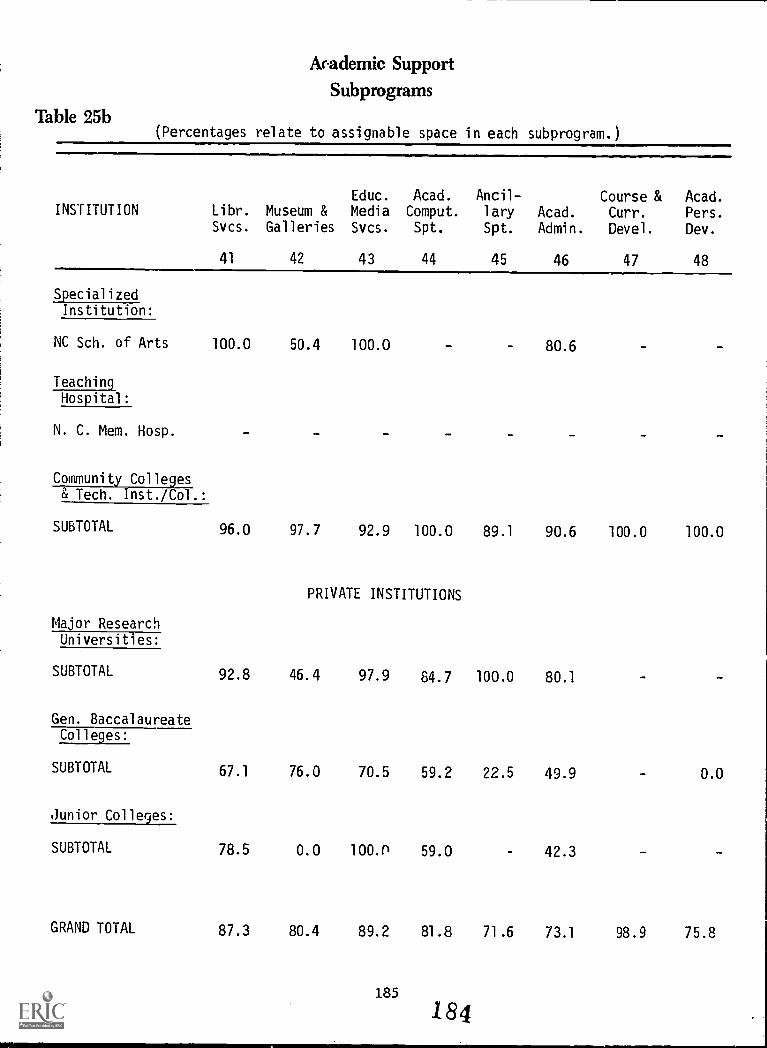
Table 25b
Academic Support
Subprograms
(Percentages relate to assignable space in each subprogram.)
INSTITUTION Libr.
Svcs.
41
Educ. Acad.Museum & Media Comput.Galleries Svcs. Spt.
42 43 44
Ancil-
lary
Spt.
45
Acad.
Admin.
46
Course &Curr.
Devel.
47
Acad.
Pers.
Dev.
48
SpecializedInstitution:
NC Sch. of Arts 100.0 50.4 100.0 - 80.6
TeachingHospital:
N. C. Mem. Hosp.
Community Colleges& Tech. Inst./Col.:
SUBTOTAL 96.0 97.7 92.9 100.0 89.1 90.6 100.0 100.0
PRIVATE INSTITUTIONS
Major ResearchUniversities:
SUBTOTAL 92.8 46.4 97.9 84.7 100.0 80.1
Gen. BaccalaureateCol lees:
SUBTOTAL 67.1 76.0 70.5 59.2 22.5 49.9 0.0
Junior Colleges:
SUBTOTAL 78.5 0.0 100.0 59.0 42.3
GRAND TOTAL 87.3 80.4 89.2 81.8 71.6 73.1 98.9 75.8
185
184
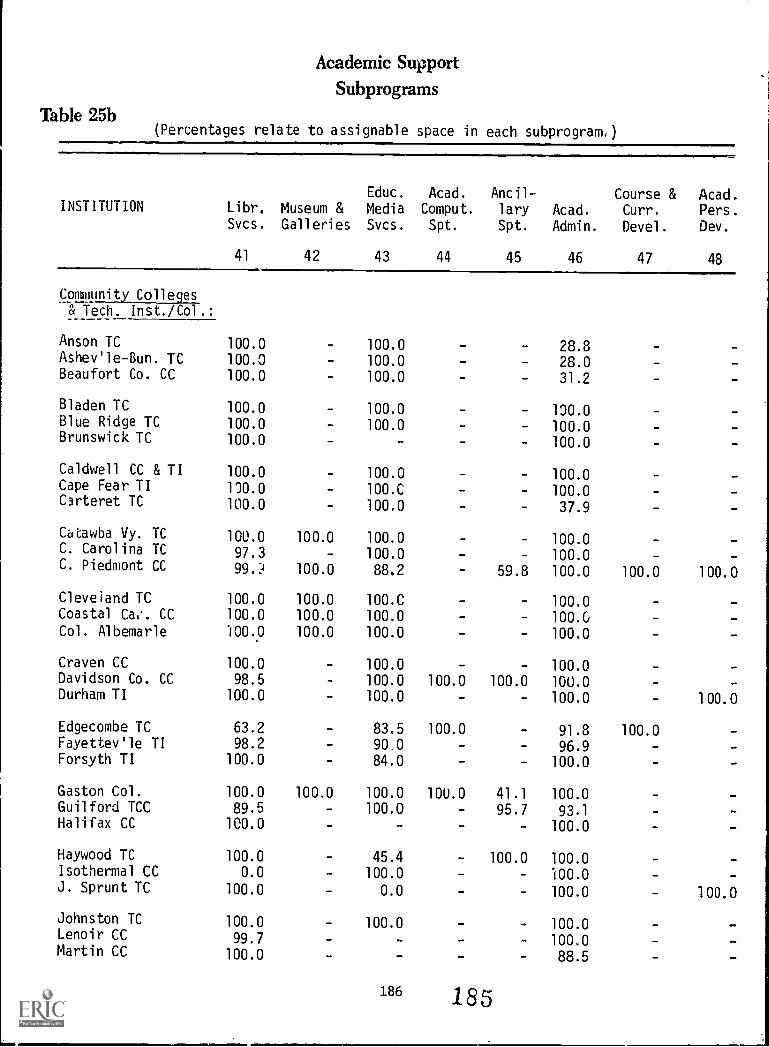
Table 25b
Academic Support
Subprograms
(Percentages relate to assignable space in each subprogram.)
INSTITUTIONEduc.
Libr. Museum & MediaSvcs. Galleries Svcs.
41 42 43
Community Colleges& Tech. Inst./Col.:
Anson TC 100.0 - 100.0Ashev'le -Bun. TC 100.0 - 100.0Beaufort Co. CC 100.0 100.0
Bladen TC 100.0 - 100.0Blue Ridge TC 100.0 - 100.0Brunswick TC 100.0 _
Caldwell CC & TI 100.0 100.0Cape Fear TI 100.0 100.0Carteret IC 100.0 100.0
Catawba Vy. TC 100.0 100.0 100.0C. Carolina TC 97.3 100.0C. Piedmont CC 99.? 100.0 88.2
Cleveland TC 100.0 100.0 100.0Coastal Ca.. CC 100.0 100.0 100.0Col. Albemarle 100.0 100.0 100.0
Craven CC 100.0 - 100.0Davidson Co. CC 98.5 100.0Durham TI 100.0 100.0
Edgecombe TC 63.2 83.5Fayettev'le TI 98.2 90.0Forsyth TI 100.0 84.0
Gaston Col. 100.0 100.0 100.0Guilford TCC 89.5 - 100.0Halifax CC 100.0 -
Haywood TC 100.0 45.4Isothermal CC 0.0 100.0J. Sprunt TC 100.0 0.0
Johnston TC 100.0 100.0Lenoir CC 99.7Martin CC 100.0
186
Acad.
Comput.
Spt.
44
Ancil-larySpt.
45
Acad.
Admin.
46
Course &Curr.
Devel.
47
Acad.Pers.
0ev.
48
- 28.8- 28.0- 31.2
100.0100.0100.0
- 100.0
100.0
37.9
- 100.0- 100.0
59.8 100.0 100.0 100.0
- 100.0100.0
100.0
100.0100.0 100.0 100.0
100.0 100.0
100.0 91.8 100.0
96.9100.0
100.0 41.1 100.0
95.7 93.1- 100.0
- 100.0 100.0- 100.0
100.0 100.0
100.0
100.0
88.5
185
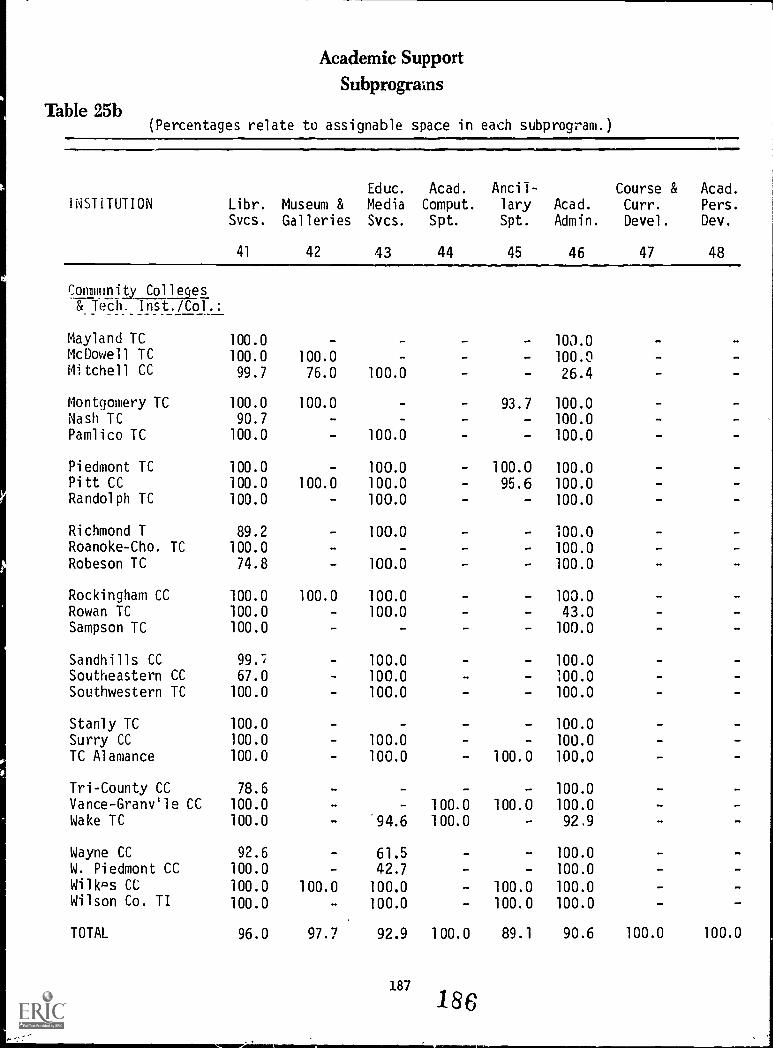
Table 25b
Academic SupportSubprograms
(Percentages relate to assignable space in each subprogram.)
INSTITUTION Libr.
Svcs.
41
Museum &Galleries
42
Educ.
MediaSvcs.
43
Acad.
Comput.
Spt.
44
Ancil-larySpt.
45
Acad.
Admin.
46
Course &Curr.
Devel.
47
Acad.
Pers.
Dev.
48
Community Colleges& Tech. Inst./Col.:
Mayland TC 100.0 - - - 103.0McDowell TC 100.0 100.0 - 100.0Mitchell CC 99.7 76.0 100.0 - - 26.4
Montgomery TC 100.0 100.0 93.7 100.0Nash TC 90.7 - - - 100.0Pamlico TC 100.0 - 100.0 - - 100.0
Piedmont TC 100.0 100.0 - 100.0 100.0Pitt CC 100.0 100.0 100.0 - 95.6 100.0Randolph TC 100.0 100.0 - 100.0
Richmond T 89.2 - 100.0 - 100.0Roanoke-Cho. TC 100.0 - - 100.0Robeson TC 74.8 - 100.0 100.0
Rockingham CC 100.0 100.0 100.0 100.0Rowan TC 100.0 100.0 - 43.0Sampson TC 100.0 - - - 100.0
Sandhills CC 99.7 - 100.0 - - 100.0Southeastern CC 67.0 100.0 100.0Southwestern TC 100.0 - 100.0 - 100.0
Stanly TC 100.0 100.0
Surry CC 100.0 - 100.0 100.0TC Alamance 100.0 - 100.0 100.0 100.0
Tri-County CC 78.6 - - 100.0Vance-Granvie CC 100.0 - - 100.0 100.0 100.0Wake TC 100.0 94.6 100.0 92.9
Wayne CC 92.6 61.5 - 100.0
W. Piedmont CC 100.0 42.7 - 100.0
Wilkas CC 100.0 100.0 100.0 100.0 100.0Wilson Co. II 100.0 - 100.0 100.0 100.0
TOTAL 96.0 97.7 92.9 100.0 89.1 90.6 100.0 100.0
187
-186
........ria
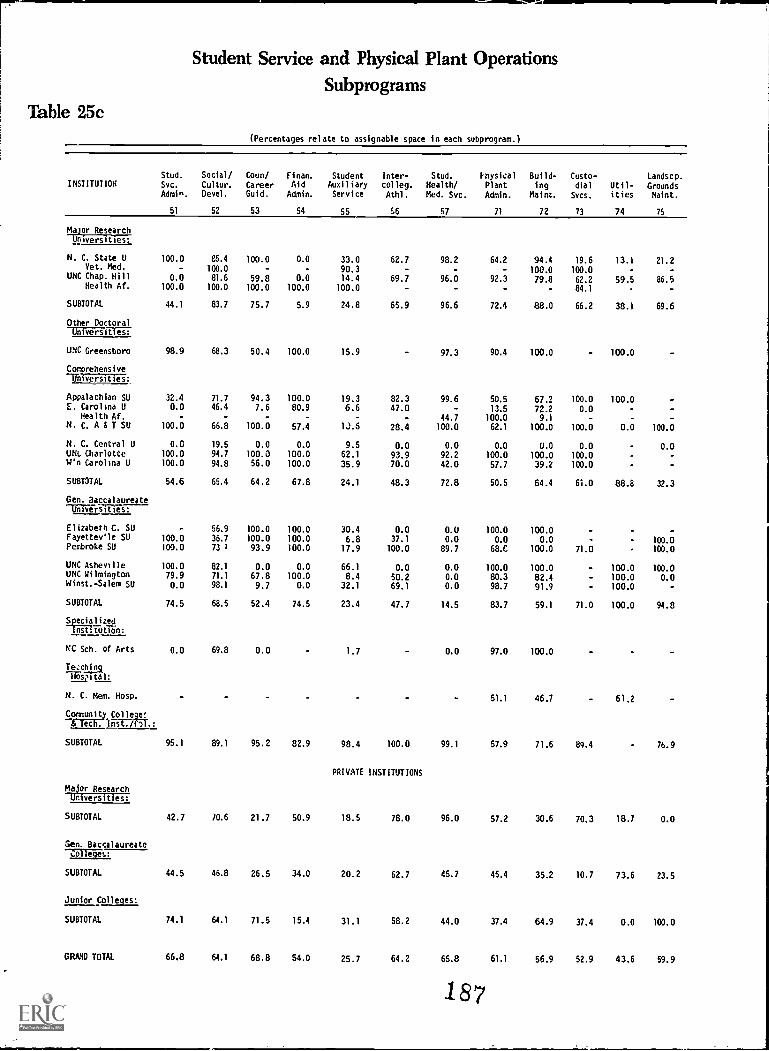
Table 25c
Student Service and Physical Plant OperationsSubprograms
(Percentages relate to assignable space in each subprogram.)
INSTITUTIONStud.
Svc.
Admin.
51
Social/
Cul tur.
Devel.
52
Coun/CareerGuid.
53
Finan.
AidAdmin.
54
StudentAuxiliaryService
55
inter-col leg.
Athl.
1.6
Stud.
Health/
Med. Svc.
57
PhysicalPlant
Admin.
71
Build-ing
Maint.
72
Custo-dial
Svcs.
73
Ut i 1-
ities
74
Landscp.GroundsMaint.
75
Major ResearchUniversities:
N. C. State U 100.0 85.4 100.0 0.0 33.0 62.7 98.2 64.2 94.4 19.6 13.1 21.2Vet. Med. - 100.0 90.3 - - 100.0 100.0 - -
UNC Chap. Hill 0.0 81.6 59.8 0.0 14.4 69.7 96.0 92.3 79.8 62.2 59.5 86.5Health Af. 100.0 100.0 100.0 100.0 100.0 - - - 84.1 -
SUBTOTAL 44.1 83.7 75.7 5.9 24.8 65.9 96.6 72.4 88.0 66.2 38.1 69.6
Other Doctoral717iVe-s 111E7
UNC Greensboro 98.9 68.3 50.4 100.0 15.9 97.3 90.4 100.0 100.0
Comprehensive-Universities:
Appalachian SU 32.4 71.7 94.3 100.0 19.3 82.3 99.6 50.5 67.2 100.0 100.0E. Carolina U 0.0 46.4 7.6 80.9 6.6 47.0 - 13.5 72.2 0.0
Health Af. - - - - 44.7 100.0 9.1 -N. C. A 8 T SU 100.0 66.8 100.0 57.4 1.3.6 28.4 100.0 62.1 100.0 100.0 0.0 100.0
N. C. Central U 0.0 19.5 0.0 0.0 9.5 0.0 0.0 0.0 0.0 0.0 0.0UNL Charlotte 100.0 94.7 100.0 100.0 62.1 93.9 92.2 100.0 100.0 100.0W'n Carolina U 100.0 94.8 56.0 100.0 35.9 70.0 42.0 57.7 39.2 100.0
SUBTOTAL 54.6 65.4 64.2 67.8 24.1 48.3 72.8 50.5 64.4 61.0 88.8 32.3
Gen. 3accalaureateTOWrsitTis:
El izabeth C. SU 56.9 100.0 100.0 30.4 0.0 0.0 100.0 100.0 -Fayettev'le SU 100.0 36.7 100.0 100.0 6.8 37.1 0.0 0.0 0.0 100.0Pembroke SU 100.0 73 1 93.9 100.0 17.9 100.0 89.7 68.0 100.0 71.0 100.0
UNC Asheville 100.0 82.1 0.0 0.0 66.1 0.0 0.0 100.0 100.0 100.0 100.0UNC Wilmington 79.9 71.1 67.8 100.0 8.4 50.2 0.0 80.3 82.4 100.0 0.0Winst.-Salem SU 0.0 98.1 9.7 0.0 32.1 69.1 0.0 98.7 91.9 100.0 -SUBTOTAL 74.5 68.5 52.4 74.5 23.4 47.7 14.5 83.7 59.1 71.0 100.0 94.8
SpecializedInst: tut-17)n:
NC Sch. of Arts 0.0 69.8 0.0 1.7 0.0 97.0 100.0
Te:cilogNovi' tal:
N. C. Mem. Hosp. - 51.1 46.7 61.2
Community Col& Tech. llist./C51.:
SUBTOTAL 95.1 89.1 95.2 82.9 98.4 100.0 99.1 57.9 71.6 89.4 76.9
PRIVATE INSTITUTIONS
Major ResearchUniversities:
SUBTOTAL 42.7 10.6 21.7 50.9 18.5 78.0 96.0 57.2 30.6 70.3 18.7 0.0
Sen. Baccalaureateno TeERt.:
SUBTOTAL 44.5 46.8 26.5 34.0 20.2 62.7 45.7 45.4 35.2 10.7 73.6 23.5
Junior Colleges:
SUBTOTAL 74.1 64.1 71.5 15.4 31.1 58.2 44.0 37.4 64.9 37.4 0.0 100.0
GRAND TOTAL 66.8 64.1 68.8 54.0 25.7 64.2 65.8 61.1 56.9 52.9 43.6 59.9
187
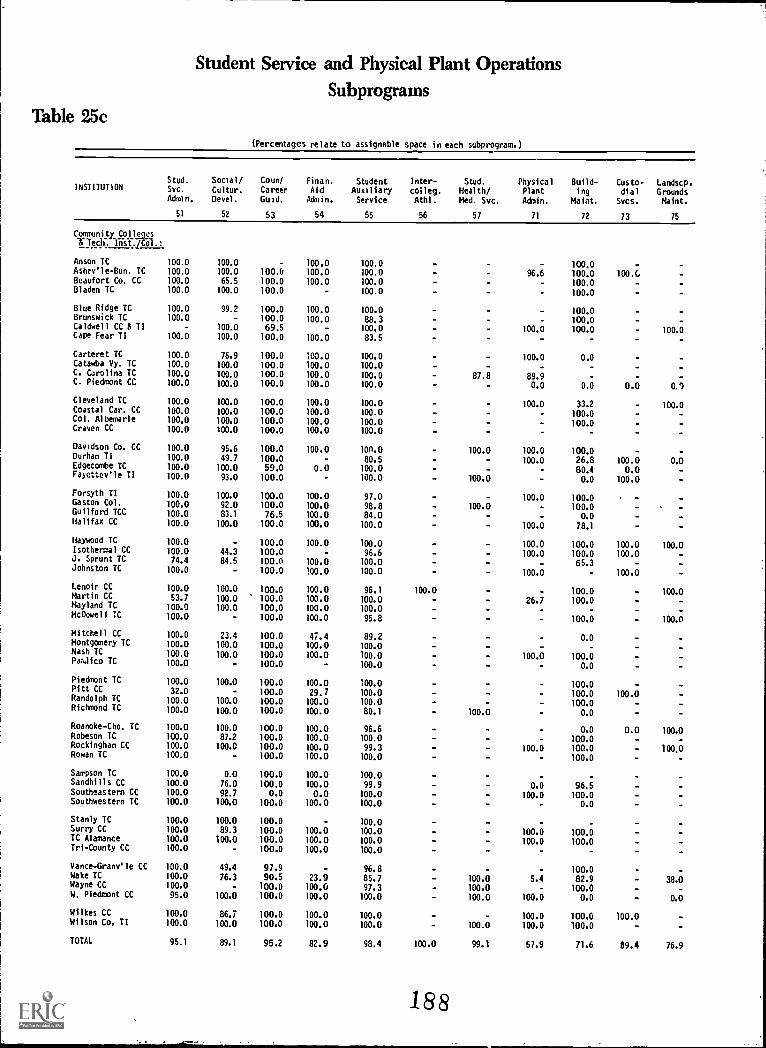
Student Service and Physical Plant Operations
SubprogramsTable 25c
(Percentages relate to assignable space in each subprogram.)
INS11101iONStud.
Svc.
Admin.
51
Social/
Cultur.Devel.
52
Coon/CareerGuid.
53
Finan.AidAdmin.
54
StudentAuxiliaryService
55
Inter-
colleg.Athl.
56
Stud. PhysicalHealth/Med. Svc.
57
PlantAdmin.
71
Build-ing
Maint.
72
Gusto-dial
Svcs.
73
Landscp.GroundsMaint.
75
Cannunitl.C91Teges7. 1e47.. InsVIC-61.:.
Anson IC 100.0 100.0 - 100.0 100.0 100.0Ashev'le-Bun. IC 100.0 100.0 100.0 100.0 100.0 96.6 100.0 100.0Beaufort Co. CC 100.0 65.5 100.0 100.0 100.0 100.0Bladen TC 100.0 100.0 100.0 100.0 100.0
Blue Ridge TC 100.0 99.2 100.0 100.0 100.0 100.0Brunswick TC 100.0 - 100.0 100.0 88.3 100.0Caldwell CC & TI - 100.0 69.5 100.0 100.0 100.0 100.0Cape Fear TI 100.0 100.0 100.0 100.0 83.5
Carteret IC 100.0 76.9 100.0 100.0 100.0 - 100.0 0.0Catawba Vy. TC 100.0 100.0 100.0 100.0 100.0 - -C. Carolina IC 100.0 100.0 100.0 100.0 100.0 87.8 89.9C. Piedmont CC 100.0 100.0 100.0 100.0 100.0 0.0 0.0 0.0 0,1
Cleveland IC 100.0 100.0 100.0 100.0 100.0 100.0 33.2 100.0Coastal Car. CC 100.0 100.0 100.0 100.0 100.0 100.0Col. Albemarle 100.0 100.0 100.0 100.0 100.0 100.0Craven CC 100.0 100.0 100.0 100.0 100.0
Davidson Co. CC 100.0 95.6 100.0 100.0 1011.0 100.0 100.0 100.0Durham TI 100.0 49.7 100.0 80.5 100.0 26.8 100.0 0.0Edgecombe TC 100.0 100.0 59.0 0.0 100.0 80.4 0.0Falattevle TI 100.0 93.0 100.0 100.0 100.0 0.0 100.0
Forsyth TI 100.0 100.0 100.0 100.0 97.0 100.0 100.0Gaston Col. 100.0 92.0 100.0 100.0 98.8 100.0 100.0Guilford TCC 100.0 83.1 76.5 100.0 84.0 0.0Halifax CC 100.0 100.0 100.0 100.0 100.0 100.0 78.1
Haywood IC 100.0 - 100.0 100.0 100.0 100.0 100.0 100.0 100.0Isothermal CC 100.0 44.3 100.0 - 96.6 100.0 100.0 100.0J. Sprunt TC 74.4 84.5 100.0 100.0 100.0 65.3Johnston IC 100.0 - 100.0 100.0 100.0 100.0 100.0
Lenoir CC 100.0 100.0 100.0 100.0 96.1 100.0 100.0 100.0Martin CC 53.7 100.0 100.0 100.0 100.0 26.7 100.0Mayland TC 100.0 100.0 100.0 100.0 100.0McDowell TC 100.0 - 100.0 100.0 95.8 100.0 100.0
Mitchell CC 100.0 23.4 100.0 47.4 89.2 0.0Montgomery IC 100.0 100.0 100.0 100.0 100.0Nash TC 100.0 100.0 100.0 100.0 100.0 100.0 100.0PasJico IC 100.0 - 100.0 - 100.0 0.0
Piedmont IC 100.0 100.0 100.0 100.0 100.0 100.0Pitt CC 32.0 - 100.0 29.7 100.0 100.0 100.0Randolph IC 100.0 100.0 100.0 100.0 100.0 100.0Richmond IC 100.0 100.0 100.0 100.0 80.1 100.0 0.0
Roanoke-Cho. TC 100.0 100.0 100.0 100.0 96.6 0.0 0.0 100.0Robeson TC 100.0 87.2 100.0 100.0 100.0 100.0Rockingham CC 100.0 100.0 100.0 100.0 99.3 100.0 100.0 100.0Rowan TC 100.0 100.0 100.0 100.0 100.0
Sampson IC 100.0 0.0 100.0 100.0 100.0Sandhills CC 100.0 76.0 100.0 100.0 99.9 0.0 96.5Southeastern CC 100.0 92.7 0.0 0.0 100.0 100.0 100.0Southwestern TC 100.0 100.0 100.0 100.0 100.0 0.0
Stanly TC 100.0 100.0 100.0 100.0Surry CC 100.0 89.3 100.0 100.0 100.0 100.0 100.0TC Alamance 100.0 100.0 100.0 100.0 100.0 100.0 100.0Tri-County CC 100.0 100.0 100.0 100.0
Vance-Granv'le CC 100.0 49.4 97.9 - 96.8 100.0Wake TC 100.0 76.3 90.5 23.9 85.7 100.0 5.4 82.9 38.0Wayne CC 100.0 100.0 100.0 97.3 100.0 - 100.0W. Piedmont CC 95.0 100.0 100.0 100.0 100.0 100.0 100.0 0.0 0.0
Wilkes CC 100.0 86,7 100.0 100.0 100.0 - 100.0 100.0 100.0Wilson Co. TI 100.0 100.0 100.0 100.0 100.0 100.0 100.0 100.0 -
TOTAL 95.1 89.1 95.2 82.9 98.4 100.0 99.1 57.9 71.6 69.4 76.9
188
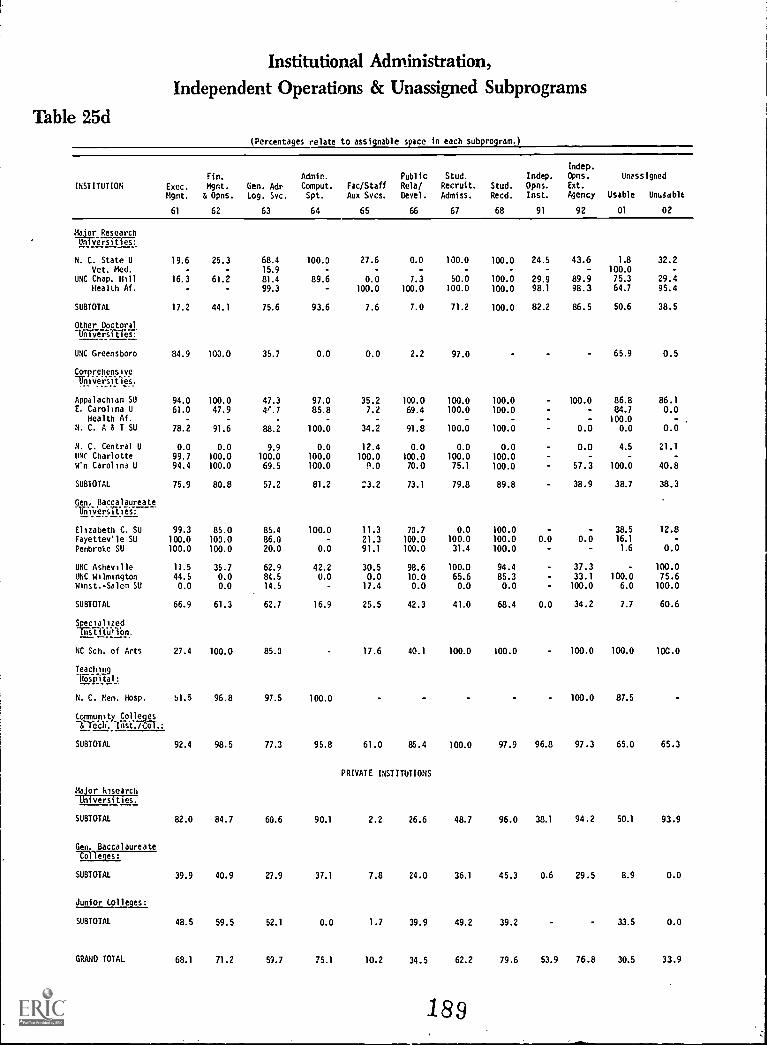
Table 25d
Institutional Administration,Independent Operations & Unassigned Subprograms
(Percentages relate to assignable space in each subprogram.)
INSTITUTION Exec.
Mgmt.
61
Fin.
Mgmt.
& Opns.
62
Gen. AdmLog. Svc.
63
Admin.
Comput.Spt.
64
Fac/Staff
Aux Svcs.
65
PublicBela/
Devel.
66
Stud.
Recruit.Admiss.
67
Stud.
Recd.
68
Indep.
Opns.Inst.
91
Indep.
Opns.
Ext.
Agency
92
Unassigned
Usable Unuieble
01 02
Major. Research
Universities:
N. C. State U 19.6 25.3 68.4 100.0 27.6 0.0 100.0 100.0 24.5 43.6 1.8 32.2Vet. Med. 15.9 - - - - - 100.0 -
UNC Chap. Hill 16.3 61.2 81.4 89.6 0.0 7.3 50.0 100.0 29.9 89.9 75.3 29.4Health Af. 99.3 - 100.0 100.0 100.0 100.0 98.1 98.3 64.7 95.4
SUBTOTAL 17.2 44.1 75.6 93.6 7.6 7.0 71.2 100.0 82.2 86.5 50.6 38.5
Other Doctoral11Wr76:i3131-s7
UNC Greensboro 84.9 100.0 35.7 0.0 0.0 2.2 97.0 65.9 0.5
Comprehensiveliviveiilies.__. .._._ -_.
Appalachian SU 94.0 100.0 47.3 97.0 35.2 100.0 100.0 100.0 100.0 86.8 86.1E. Carolina U 61.0 47.9 4'.7 85.8 7.2 69.4 100.0 100.0 84.7 0.0
Health Af. - - - - - - 100.0N. C. A & T SU 78.2 91.6 88.2 100.0 34.2 91.8 100.0 100.0 0.0 0.0 0.0
N. C. Central U 0.0 0.0 9.9 0.0 12.4 0.0 0.0 0.0 0.0 4.5 21.1Iltif Charlotte 99.7 100.0 100.0 100.0 100.0 100.0 100.0 100.0w'n Carolina U 94.4 100.0 69.5 100.0 9.0 70.0 75.1 100.0 57.3 100.0 40.8
SUBTOTAL 75.9 80.8 57.2 81.2 .3.2 73.1 79.8 89.8 38.9 38.7 38.3
Gen. Baccalaureateliciitersikies7-----
Elizabeth C. SU 99.3 85.0 85.4 100.0 11.3 70.7 0.0 100.0 38.5 12.8Fayettev'le SU 100.0 100.0 86.0 21.3 100.0 100.0 100.0 0.0 0.0 16.1
Pembroke SU 100.0 100.0 20.0 0.0 91.1 100.0 31.4 100.0 1.6 0.0
UNC Asheville 11.5 35.7 62.9 42.2 30.5 98.6 100.0 94.4 37.3 - 100.0UNC Wilmington 44.5 0.0 8t.5 0.0 0.0 10.0 65.6 85.3 33.1 100.0 75.6winst.-Salem SU 0.0 0.0 14.5 17.4 0.0 0.0 0.0 100.0 6.0 100.0
SUBTOTAL 66.9 61.3 62.7 16.9 25.5 42.3 41.0 68.4 0.0 34.2 7.7 60.6
SpecializediiiSillIircon:
NC Sch. of Arts 27.4 100.0 85.0 17.6 40.1 100.0 100.0 100.0 100.0 100.0
TeacPJ.U9Hospital:.
N. C. Mem. Hosp. 51.5 96.8 97.5 100.0 100.0 87.5
Community Colleges-I-YelE, Inst./col.:
SUBTOTAL 92.4 98.5 77.3 95.8 61.0 85.4 100.0 97.9 96.8 97.3 65.0 65.3
PRIVATE INSTITUTIONS
Major ksearchUniversities,
SUBTOTAL 82.0 84.7 60.6 90.1 2.2 26.6 48.7 96.0 38.1 94.2 50.1 93.9
Gen. Baccalaureate
39.9 40.9 27.9 37.1 7.8 24.0 36.1 45.3 0.6 29.5 8.9 0.0SUBTOTAL
Junior Colleges:
SUBTOTAL 48.5 59.5 52.1 0.0 1.7 39.9 49.2 39.2 33.5 0.0
GRAND TOTAL 68.1 71.2 59.7 75.1 10.2 34.5 62.2 79.6 53.9 76.8 30.5 33.9
189
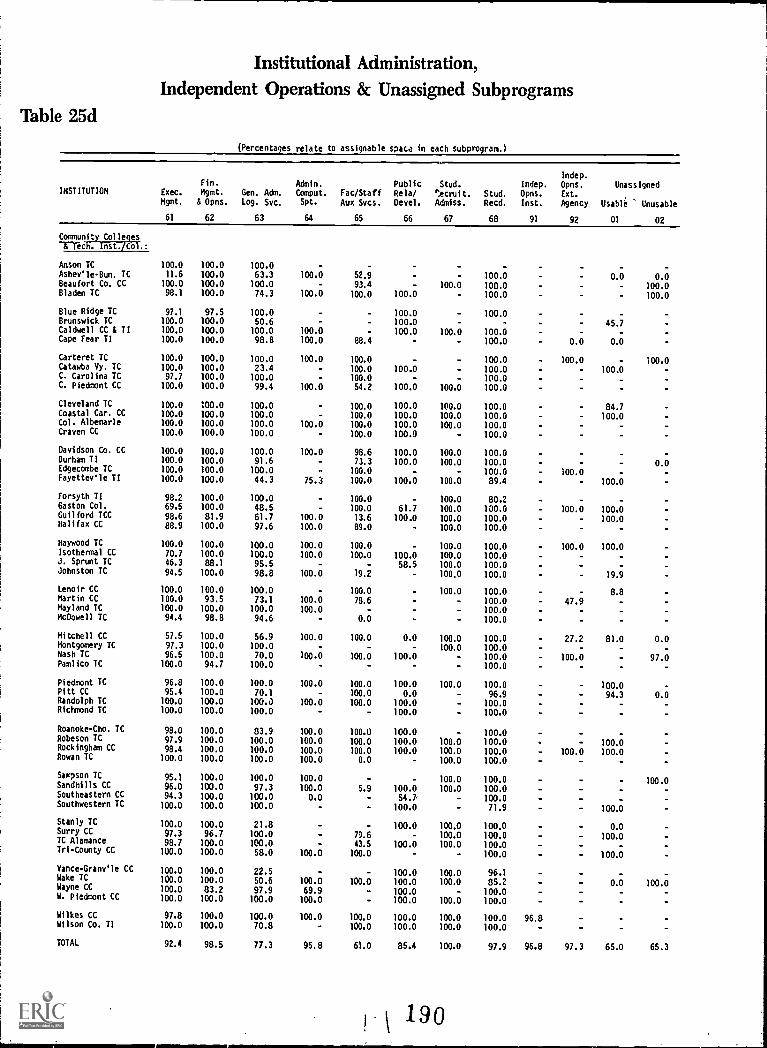
Institutional Administration,Independent Operations & Unassigned Subprograms
Table 25d
(Percentages relate to assignable space in each subprogram.)
INSTITUTION Exec.
Mgmt.
61
Fin.
Mgmt.& Opns.
62
Gen. Adm.
Log. Svc.
63
Admin.
Comput.Spt.
64
Fac/StaffAux Svcs.
65
PublicRela/Devel.
66
Stud.
".ecruit.
Admiss.
67
Stud.Recd.
68
Indep.
Opns.
Inst.
91
lndep.Opns.Ext.
Agency
92
Unassigned
Usable Unusable
01 02
Community Colleges-E-Tich. Inst./Col.:
Anson TC 100.0 100.0 100.0 - .
Ashev'le-Bun. TC 11.6 100.0 63.3 100.0 52.9 100.0 0.0 0.0Beaufort Co. CC 100.0 100.0 100.0 93.a - 100.0 100.0 100.0Bladen TC 98.1 100.0 74.3 100.0 100.0 100.0 100.0 100.0
Blue Ridge TC 97.1 97.5 100.0 - 100.0 100.0 -Brunswick TC 100.0 100.0 50.6 - - 100.0 - 45.7Caldwell CC i TI 100.0 100.0 100.0 100.0 - 100.0 100.0 100.0 -Cape Fear TI 100.0 100.0 98.8 100.0 88.4 100.0 0.0 0.0
Carteret TC 100.0 100.0 100.0 100.0 100.0 100.0 100.0 100.0Catawba Vy. TC 100.0 100.0 23.4 - 100.0 100.0 - 100.0 100.0C. Carolina TC 97.7 100.0 100.0 - 100.0 - 100.0C. Piedmont CC 100.0 100.0 99.4 100.0 54.2 100.0 100.0 100.0
Cleveland TC 100.0 100.0 100.0 100.0 100.0 100.0 100.0 - 84.7Coastal Car. CC 100.0 100.0 100.0 100.0 100.0 100.0 100.0 - 100.0Col. Albemarle 100.0 100.0 100.0 100.0 100.0 100.0 100.0 100.0 - -Craven CC 100.0 100.0 100.0 100.0 100.0 100.0
Davidson Co. CC 100.0 100.0 100.0 100.0 98.6 100.0 100.0 100.0Durham TI 100.0 100.0 91.6 - 73.3 100.0 100.0 100.0 0.0Edgecombe TC 100.0 100.0 100.0 100.0 100.0 100.0Fayettev'le TI 100.0 100.0 44.3 75.3 100.0 100.0 100.0 89.4 - 100.0
Forsyth TI 98.2 100.0 100.0 - 100.0 - 100.0 80.2 -Gaston Col. 69.5 100.0 48.5 - 100.0 61.7 100.0 100.0 100.0 100.0Guilford TCC 98.6 81.9 61.7 100.0 13.6 100.0 100.0 100.0 - 100.0Halifax CC 88.9 100.0 97.6 100.0 89.0 - 100.0 100.0 -
Haywood TC 100.0 100.0 100.0 100.0 100.0 - 100.0 100.0 100.0 100.0Isothermal CC 70.7 100.0 100.0 100.0 100.0 100.0 100.0 100.0J. Sprunt TC 46.3 88.1 95.5 - - 58.5 100.0 100.0Johnston TC 94.5 100.0 98.8 100.0 19.2 - 100.0 100.0 19.9
Lenoir CC 100.0 100.0 100.0 100.0 100.0 100.0 8.8Martin CC 100.0 93.5 73.1 100.0 78.6 100.0 47.9Mayland TC 100.0 100.0 100.0 100.0 - 100.0McDowell TC 94.4 98.8 94.6 0.0 100.0
Mitchell CC 57.5 100.0 56.9 100.0 100.0 0.0 100.0 100.0 27.2 81.0 0.0Montgomery TC 97.3 100.0 100.0 100.0 100.0Nash TC 96.5 100.0 70.0 100.0 100.0 100.0 100.0 100.0 97.0Pamlico TC 100.0 94.7 100.0 100.0
Piedmont TC 96.8 100.0 100.0 100.0 100.0 100.0 100.0 100.0 - 100.0Pitt CC 95.4 100.0 70.1 100.0 0.0 96.9 94.3 0.0Randolph TC 100.0 100.0 100.O 100.0 100.0 100.0 100.0Richmond TC 100.0 100.0 100.0 100.0 100.0
Roanoke-Cho. TC 98.0 100.0 83.9 100.0 100.0 100.0 - 100.0Robeson TC 97.9 100.0 100.0 100.0 100.0 100.0 100.0 100.0 100.0Rockingham CC 98.4 100.0 100.0 100.0 100.0 100.0 100.0 100.0 100.0 100.0Rowan TC 100.0 100.0 100.0 100.0 0.0 - 100.0 100.0
Saepson TC 95.1 100.0 100.0 100.0 - - 100.0 100.0 100.0Sandhills CC 96.0 100.0 97.3 100.0 5.9 100.0 100.0 100.0Southeastern CC 94.3 100.0 100.0 0.0 - 54.7- 100.0Southwestern TC 100.0 100.0 100.0 100.0 71.9 100.0
Stanly TC 100.0 100.0 21.8 - 100.0 100.0 100.0 - 0.0Surry CC 97.3 96.7 100.0 79.6 - 100.0 100.0 - 100.0TC Alamance 98.7 100.0 100.0 43.5 100.0 100.0 100.0 -Tri-County CC 100.0 100.0 58.0 100.0 100.0 - - 100.0 - 100.0
Vance-Granv'le CC 100.0 100.0 22.5 100.0 100.0 96.1Wake TC 100.0 100.0 50.6 100.0 100.0 100.0 100.0 85.2 0.0 100.0Wayne CC 100.0 83.2 97.9 69.9 100.0 100.0W. Piedmont CC 100.0 100.0 100.0 100.0 100.0 100.0 100.0
Wilkes CC 97.8 100.0 100.0 100.0 100.0 100.0 100.0 100.0 96.8Wilson Co. TI 100.0 100.0 70.8 100.0 100.0 100.0 100.0
TOTAL 92.4 98.5 77.3 95.8 61.0 85.4 100.0 97.9 96.8 97.3 65.0 65.3
190
TABLE 26:
ACCESSIBLE AREA BY ROOM CODES
Table 26 indicates for each of the ten summary room codes theamount and percentage of assignable area which is accessible to mobilityimpaired persons. It represents an additional source of informationwhich, when viewed in conjunction with Tables 25-25d, creates adetailed profile of the accessible space on a campus.
Although such information can be useful to campus administratorsin attempting to insure that all programs are accessible to the mobilityimpaired, no absolute conclusions can be drawn from the data as towhether program accessibility has been achieved. It is clear, forexample, that program accessibility does not require that an institutionmake all of its classrooms accessible. Instead, the institution cansimply insure that courses taken by mobility impaired students bescheduled in rooms which are accessible to them.
Dashes in Table 26 indicate that the institution in questiondid not have any assignable area under the indicated summary room code.A "0" in the "Sq. Ft." column (with an accompanying "0.0" in the "%"column) indicates that the institution did have assignable area underthe indicated summary room code but that none of it was accessible.The chart on page 118 lists all of the room codes which comprise thesummary codes used in this table.
193
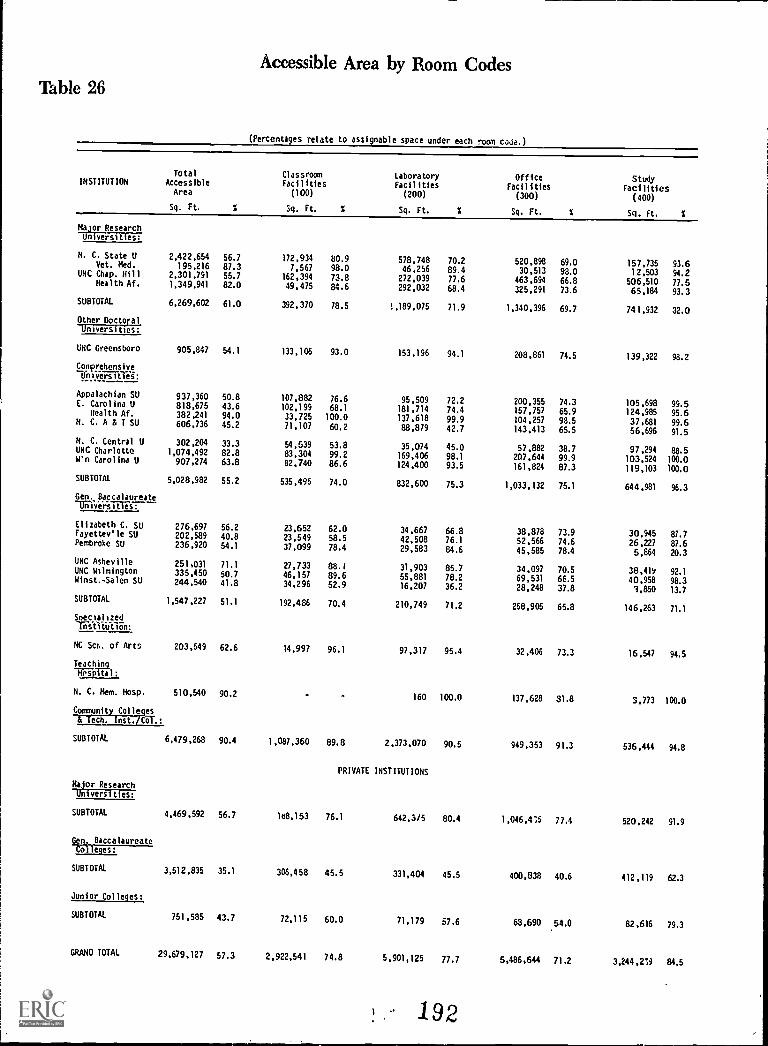
Table 26Accessible Area by Room Codes
(Percentages relate to asst nable space under each room coda.)
INSTITUTION AccessibleTotal
Area
Sq. Ft, %
ClassroomFacilities
(100)
Sq. Ft. X
LaboratoryFacilities
(200)
Sq. Ft. X
OfficeFacilities
(300)
Sq. Ft. %
StudyFacilities
(400)
Sq. Ft. %
Ma jor ResearchUnivversi'ties:
N. C. State U 2,4 2 2,654 56.7 172,934 80.9 578,748 70.2 520,898 69.0 157,735 93.6Vet. Med. 195,216 87.3 7,567 98.0 46,256 89.4 30,513 98.0 12,503 94.2UNC Chap. Hill 2,3 01,791 55.7 162,394 73.8 272,039 77.6 463,694 66.8 506,510 77.5Health Af. 1,34 9,941 82.0 49,475 84.6 292,032 68.4 325,291 73.6 65,184 93.3SUBTOTAL 6,269,602 61.0 392,370 78.5 1,189,075 71.9 1,34 0,396 69.7 741,932 32.0Other DoctoralUniversities:
UNC Greensboro 905,847 54.1 133,106 93.0 153,196 94.1 208,861 74.5 139,322 98.2Comprehensive
Appalachian SU 937,360 50.8 107,882 76.6 95,509 72.2 200.355 74.3 105,698 99.5E. Carolina U 818,675 43.6 102,199 68.1 181,714 74.4 157,757 65.9 1 24 ,985 95.6Health Af. 382,241 94.0 33,725 100.0 137,618 99.9 104.257 98.5 37,681 99.6N. C. A T SU 606,736 45.2 71,107 60.2 88,879 42.7 143,413 65.5 56,696 91.5N. C. Central U 302,204 33.3 54,539 53.8 35,074 45.0 57,882 38.7 97,294 88.5UNC Charlotte 1,074,492 82.8 83,304 99.2 169,406 98.1 207,644 99.9 103,524 100.0W'n Carolina U 907,274 63.8 82,740 86.6 124,400 93.5 161,824 87.3 119.103 100.0SUBTOTAL 5,02 8,982 55.2 535,496 74.0 832,600 75.3 1,033,132 75.1 644,981 96.3Gen. Baccalaureate-07T cvir-sitTerr--
El izabeth C. SU 276,697 56.2 23,652 62.0 34,667 66.8 38,878 73.9 30,945 81.7Fayettev'le SU 202,589 40.8 23,549 58.5 42,508 76.1 52,566 74.6 26,227 87.6Pembroke SU 236,920 54.1 37,099 78.4 29,583 84.6 45,585 78.4 5,864 20.3UNC Asheville 251,031 71.1 27,733 88.1 31,903 85.7 34.097 70.5 38,419 92.1UNC Wilmington 335,450 50.7 46,157 89.6 55,881 78.2 69,531 66.5 40,958 98.3Winst.-Salem SU 244,540 41.8 34,296 52.9 16,207 36.2 28.248 37.8 3,850 13.7SUBTOTAL 1,547,227 51.1 192,486 70.4 210,749 71.2 268.905 65.8 146,263 71.1Soecial zed
NC Sch. of Arts 203,649 62.6 14,997 96.1 97,317 95.4 32,406 73.3 16,547 94.5Teachia.ifisp-Val 1 :
H. C. Mem. Hosp. 510,540 90.2 160 100.0 137,628 81.8 3,773 100.0Community Col 1 eges& Tech. inst./Col.:
SUBTOTAL 6,47 9.268 90.4 1,081,360 89.8 2,373,070 90.5 949,353 91.3 536,444 94.8
PRIVATE INSTITUTIONS
Major ResearchUniversities:
SUBTOTAL 4,46 9,592 56.7 188,153 76.1 642,3/5 80.4 1,046,415 77.4 520,242 91.9
Gen. Baccalaureateg211t9tLI.
SUBTOTAL 3,51 2,835 35.1 306,458 45.5 331,404 45.5 400,838 40.6 412,119 62.3
Junior Colleges:
SUBTOTAL 751,585 43.7 72,1 1 5 60.0 71.179 57.6 68,690 54.0 82,616 79.3
GRAND TOTAL 29,679,127 57.3 2,922,541 74.8 5,901,125 77.7 5,486,644 71.2 3,244 ,214 84.5
192
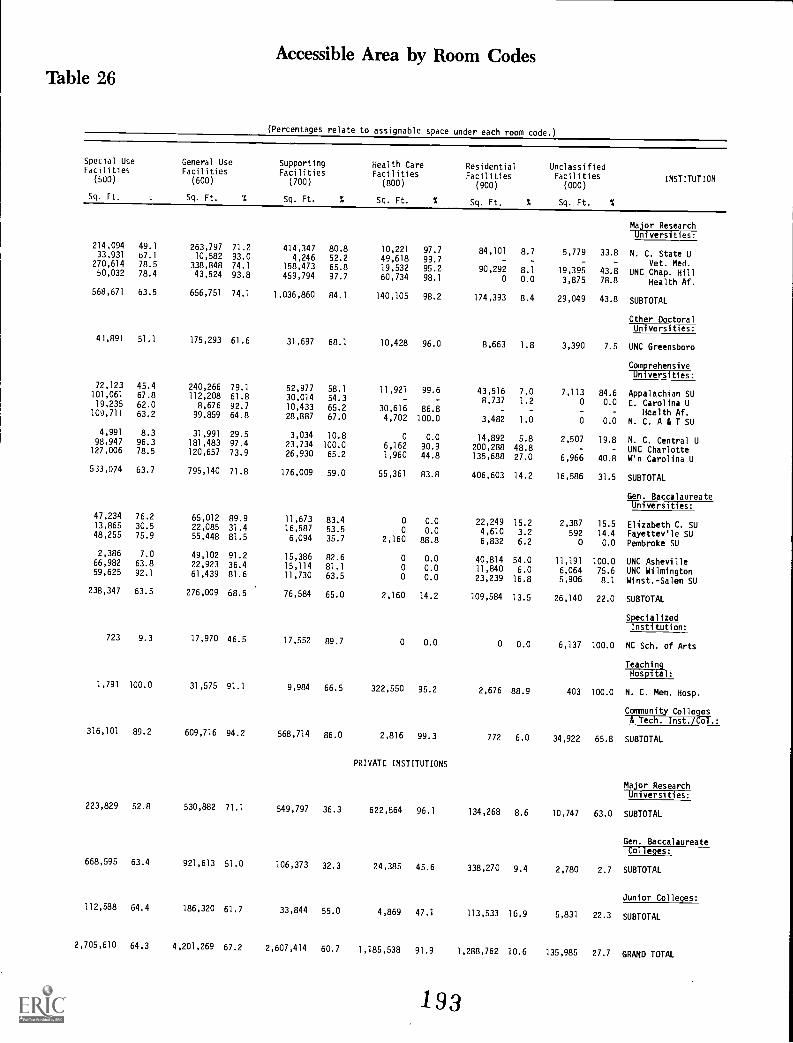
Table 26Accessible Area by Room Codes
(Percentages relate to assignable space under each room code.)
Special UseFacilities
(500)
Sq. Ft.
General Use Supporting Health Care Residential UnclassifiedFacilities Facilities Facilities Facilities Facilities
(600) (700) (800) (900) (000)
Sq. Ft. 5 Sq. Ft. 5 Sq. Ft. 5 Sq. Ft. 5 Sq. Ft. S
INSTITUTION
Major ResearchUniversities:
214,094 49.1 263,797 71.2 414,347 80.8 10,221 97.7 84,101 8.7 5,779 33.8 N. C. State U33,931 0.1 10,582 93.0 4,246 52.2 49,618 99.7 - - Vet. Med.270,614 78.5 338,848 74.1 158,473 65.8 19,532 95.2 90,292 8.1 19,395 43.8 UNC Chap. Hill50,032 78.4 43,524 93.8 459,794 97.7 60,734 98.1 0 0.0 3,875 78.8 Health Af.568,671 63.5 656,751 74.1 1,036,860 84.1 140,105 98.2 174,393 8.4 29,049 43.8 SUBTOTAL
Other DoctoralUniversities:
41,891 51.1 175,293 61.6 31,697 68.1 10,428 96.0 8,663 1.8 3,390 7.5 UNC Greensboro
ComprehensiveUniversities:
72,123 45.4 240,266 79.1 52,977 58.1 11,921 99.6 43,516 7.0 7,113 84.6 Appalachian SU101,061 67.8 112,208 61.8 30,014 54.3 - 8,737 1.2 0 0.0 E. Carolina U19,235 62.0 8,676 92.7 10,433 65.2 30,616 86.8 - - - Health Af.109,711 63.2 99,859 64.8 28,887 67.0 4,702 100.0 3,482 1.0 0 0.0 N. C. A & T SU4,991 8.3 31,991 29.5 3,034 10.8 0 0.0 14,892 5.8 2,507 19.8 N. C. Central U98,947 96.3 181,483 97.4 23,734 100.0 6,162 90.9 200,288 48.8 - - UNC Charlotte127,006 78.5 120,657 73.9 26,930 65.2 1,960 44.8 135,688 27.0 6,966 40.8 W'n Carolina U
533,074 63.7 795,140 71.8 176,009 59.0 55,361 83.8 406,603 14.2 16,586 31.5 SUBTOTAL
Gen. BaccalaureateUniversities:
47,234 76.2 65,012 89.9 11,673 83.4 0 0.0 22,249 15.2 2,387 15.5 Elizabeth C. SU13,865 30.5 22,085 31.4 16,587 53.5 0 0.0 4,610 3.2 592 14.4 Fayettev'le SU48,255 75.9 55,448 81.5 6,094 35.7 2,160 88.8 6,832 6.2 0 0.0 Pembroke SU2,386 7.0 49,102 91.2 15,386 82.6 0 0.0 40,814 54.0 11,191 100.0 UNC Asheville66,982 63.8 22,923 36.4 15,114 81.1 0 0.0 11,840 6.0 6,064 75.6 UNC Wilmington59,625 92.1 61,439 81.6 11,730 63.5 0 0.0 23,239 16.8 5,906 8.1 Winst.-Salem SU
238,347 63.5 276,009 68.5 76,584 65.0 2,160 14.2 109,584 13.5 26,140 22.0 SUBTOTAL
SpecializedInstitution:
723 9.3 17,970 46.5 17,552 89.7 0 0.0 0 0.0 6,137 100.0 NC Sch. of Arts
TeachingHospital:
1,791 100.0 31,575 91.1 9,984 66.5 322,550 95.2 2,676 88.9 403 100.0 N. C. Mem. Hosp.
Community Colleges& Tech. Inst./Col.:
316,101 89.2 609,716 94.2 568,714 86.0 2,816 99.3 772 6.0 34,922 65.8 SUBTOTAL
PRIVATE INSTITUTIONS
Major ResearchUniversities:
223,829 52.8 530,882 71.1 549,797 36.3 622,864 96.1 134,268 8.6 10,747 63.0 SUBTOTAL
Gen. BaccalaureateColleges:
668,595 63.4 921,613 51.0 106,373 32.3 24,385 45.6 338,270 9.4 2,780 2.7 SUBTOTAL
Junior Colleges:112,588 64.4 186,320 61.7 33,844 55.0 4,869 47.1 113,533 16.9 5,831 22.3 SUBTOTAL
2,705,610 64.3 4,201,269 67.2 2,607,414 60.7 1,185,538 91.9 1,288,762 10.6 135,985 27.7 GRAND TOTAL
193
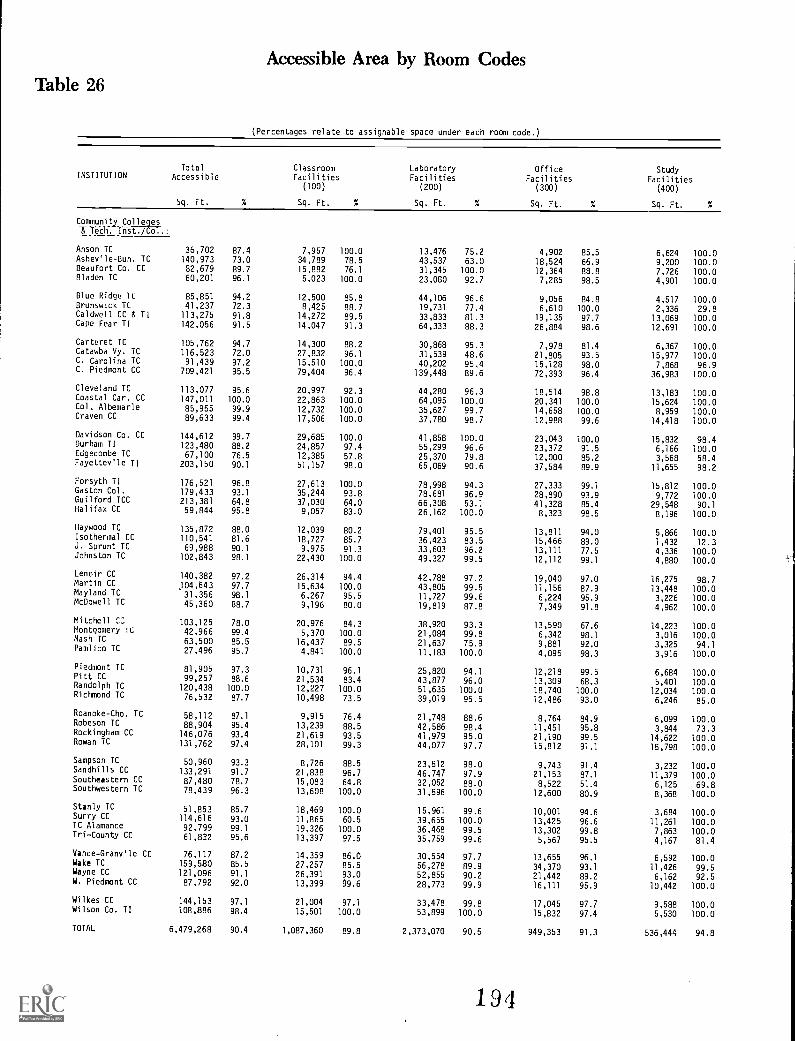
Table 26Accessible Area by Room Codes
(Percentages relate to assignable space under each room code.)
INSTITUTIONTotal
Accessible
Sq. Ft. %
ClassroomFacilities
(100)
Sq. Ft. %
LaboratoryFacilities
(200)
Sq. Ft. X
OfficeFacilities
(300)
Sq. Ft. X
StudyFacilities
(400)
Sq. Ft. X
Community Colleges& Tech. Inst./Col.:
Anson TC 36,702 87.4 7,957 100.0 13,476 75.2 4,902 85,5 6,624 100.0Ashev'le-Bun. TC 140,973 73.0 34,789 78.5 43,537 63.0 18,524 66.9 9,200 100.0Beaufort Co. CC 32,679 89.7 15,882 76.1 31,345 100.0 12,364 88.8 7,726 100.0Bladen TC 60,201 96.1 5,023 100.0 23,080 92.7 7,285 98.5 4,901 100.0
Blue Ridge T. 85,851 94.2 12,500 85.8 44,106 96.6 9,056 84.8 4,517 100.0Brunswick TC 41,237 72.3 8,425 88.7 19,731 77.4 6,610 100.0 2,336 29.8Caldwell CC A TI 113,275 91.8 14,272 89.5 33,833 81.3 19,135 97.7 13,069 100.0Cape Fear TI 142,056 91.5 14,047 91.3 64,333 88.3 26,884 98.6 12,691 100.0
Carteret TC 105,762 94.7 14,300 88.2 30,868 95.3 7,978 81.4 6,367 100.0Catawba Vy. TC 116,523 72.0 27,832 96.1 31,539 48.6 21,805 93.5 15,977 100.0C. Carolina TC 91,439 97.2 15,510 100.0 40,202 95.4 15,128 98.0 7,868 96.9C. Piedmont CC 709,421 95.5 79,404 96.4 139,448 89.6 72,393 96.4 36,983 100.0
Cleveland TC 113,077 95.6 20,997 92.3 44,280 96.3 18,514 98.8 13,183 100.0Coastal Car. CC 147,011 100.0 22,863 100.0 64,095 100.0 20,341 100.0 15,624 100.0Col, Albemarle 85,955 99.9 12,732 100.0 35,627 99.7 14,658 100.0 8,959 100.0Craven CC 89,633 99.4 17,506 100.0 37,780 98.7 12,988 99.6 14,418 100.0
Davidson Co. CC 144,612 99.7 29,685 100.0 41,858 100.0 23,043 100.0 15,832 98.4Durham TI 123,480 88.2 24,857 97.4 55,299 96.6 23,372 91.5 6,166 100.0Edgecombe TC 67,100 76.5 12,385 57.8 25,370 79.8 12,000 85.2 3,568 58.4Fayettev'le TI 203,150 90.1 51,157 98.0 65,069 90.6 37,584 89.9 11,655 98.2
Forsyth TI 176,521 96.8 27,613 100.0 78,998 94.3 27,333 99.1 15,812 100.0Gaston Col. 179,433 93.1 35,244 93.8 78,681 96.9 28,890 93.9 9,772 100.0Guilford TCC 213,381 64.8 37,030 64.0 66,308 53.1 41,328 85.4 29,548 90.1Halifax CC 59,844 95.8 9,057 83.0 26,162 100.0 8,323 98.5 8,196 100.0
Haywood TC 135,872 88.0 12,039 80.2 79,401 95.5 13,811 94.0 5,866 100.0Isothermal CC 110,541 81.6 18,727 85.7 36,423 83.5 15,466 89.0 1,432 12.3J. Sprunt TC 69,988 90.1 9,975 91.3 33,603 96.2 13,111 77.5 4,336 100.0Johnston TC 102,843 98.1 22,430 100.0 49,327 99.5 12,112 99.1 4,880 100.0
Lenoir CC 140,382 97.2 26,314 94.4 42,788 97.2 19,040 97.0 16,275 98.7Martin CC 97.7 15,634 100.0 43,805 99.5 11,156 87.9 13,448 100.0Mayland TC.104,643
31,356 98.1 6,267 95.5 11,727 99.6 6,224 95.9 3,226 100.0McDowell TC 45,360 88.7 9,196 80.0 19,819 87.8 7,349 91.8 4,962 100.0
Mitchell C: 103,125 78.0 20,976 84.3 38,920 93.3 13,590 67.6 14,223 100.0Montgomery IC 42,966 99.4 5,370 100.0 21,084 99.8 6,342 98.1 3,016 100.0Nash TC 63,500 85.5 16,437 89.5 21,637 75.9 9,881 92.0 3,325 94.1Pamlico TC 27,496 95.7 4,841 100.0 11,183 100.0 4,095 98.3 3,916 100.0
Piedmont TC 81,905 97.3 10,731 96.1 25,820 94.1 12,218 99.5 6,684 100.0Pitt CC 99,257 88.6 21,534 83.4 43,877 96.0 13,309 68.3 5,401 100.0Randolph TC 120,438 100.0 12,227 100.0 51,635 100.0 18,740 100.0 12,034 100.0Richmond TC 76,532 87.7 10,498 73.5 39,019 95.5 12,486 93.0 6,246 85.0
Roanoke-Cho. TC 58,112 87.1 9,915 76.4 21,748 88.6 8,764 84.9 6,099 100.0Robeson TC 88,904 95.4 13,239 88.5 42,586 98.4 11,451 95.8 3,844 73.3Rockingham CC 146,076 93,4 21,619 93.5 41,979 95.0 21,190 99.5 14,622 100.0Rowan TC 131,762 97.4 28,101 99.3 44,077 97.7 15,812 91.1 15,798 100.0
Sampson TC 50,960 93.3 8,726 88.5 23,512 98.0 9,743 91.4 3,232 100.0Sandhills CC 133,291 91.7 21,838 96.7 46,747 97.9 21,153 87.1 11,379 100.0Southeastern CC 87,480 78.7 15,083 64.8 32,052 88.0 8,522 51.4 6,125 69.8Southwestern TC 78,439 96.3 13,608 100.0 31,596 100.0 12,600 80.9 8,368 100.0
Stanly TC 51,853 85.7 18,469 100.0 15,961 99.6 10,001 94.6 3,684 100.0Surry CC 114,616 93.0 11,865 60.5 39,655 100.0 13,425 96.6 11,261 100.0TC Alamance 92,799 99.1 19,326 100.0 36,468 99.5 13,302 99.8 7,863 100.0Tri-County CC 61,832 95.6 13,397 97.5 35,759 99.6 5,567 95.5 4,167 81.4
Vance-GraWle CC 76,117 87.2 14,359 86.0 30,554 97.7 13,655 96.1 6,592 100.0Wake TC 159,580 85.5 27,257 85.5 56,278 89.9 34,370 93.1 11,426 99.5Wayne CC 121,096 91.1 26,391 93.0 52,855 90.2 21,442 89.2 6,162 92.5W. Piedmont CC 87,792 92.0 13,399 99.6 28,773 99.9 16,111 95.9 10,442 100.0
Wilkes CC 144,153 97.1 21,004 97.1 33,478 99.8 17,045 97.7 9,588 100.0Wilson Co. TI 108,886 98.4 15,501 100.0 53,899 100.0 15,832 97,4 5,530 100.0
TOTAL 6,479,268 90.4 1,087,360 89.8 2,373,070 90.5 949,353 91.3 536,444 94.8
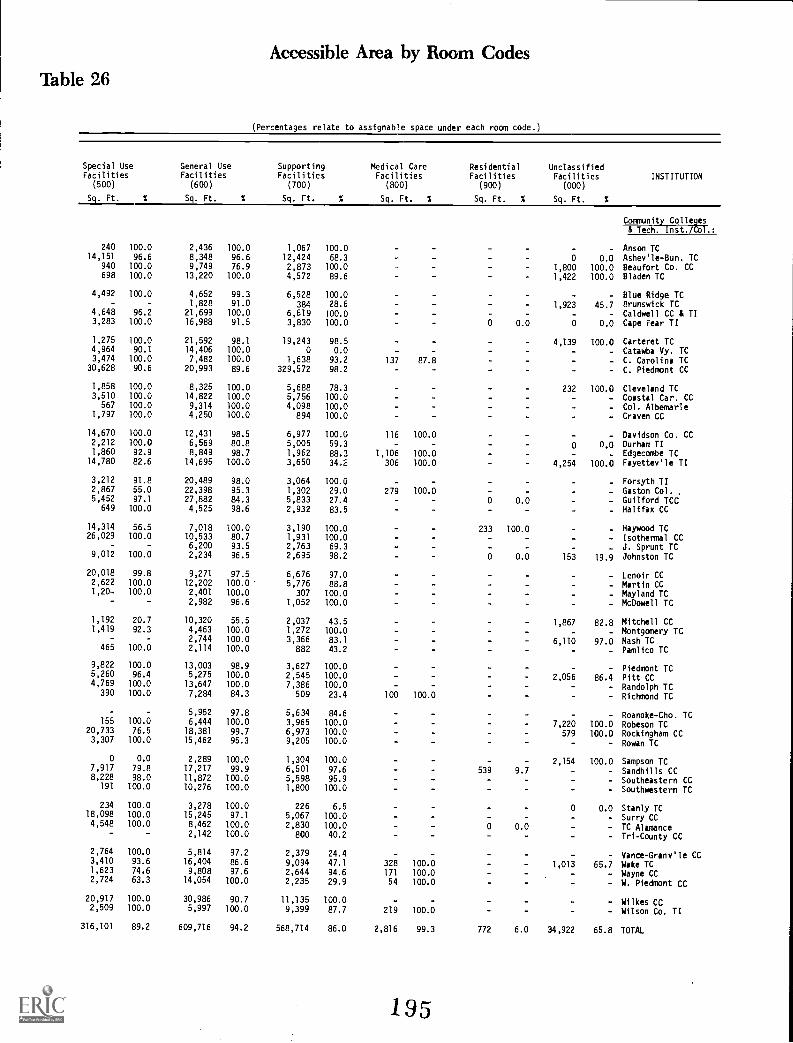
Table 26Accessible Area by Room Codes
(Percentages relate to assignable space under each room code.)
Special UseFacilities
(500)
Sq. Ft. %
General UseFacilities
(600)
Sq. Ft. %
SupportingFacilities
(700)
Sq. Ft. %
Medical CareFacilities
(800)
Sq. Ft. %
ResidentialFacilities
(900)
Sq. Ft. %
UnclassifiedFacilities
(000)
Sq. Ft. %
INSTITUTION
Community Colleges& Tech. Inst./Col.:
240 100.0 2,436 100.0 1,067 100.0 - Anson TC14,151 96.6 8,348 96.6 12,424 68.3 0 0.0 Ashev'le-Bun. TC
940 100.0 9,749 76.9 2,873 100.0 1,800 100.0 Beaufort Co. CC698 100.0 13,220 100.0 4,572 89.6 1,422 100.0 Bladen TC
4,492 100.0 4,652 99.3 6,528 100.0 - Blue Ridge TC- 1,828 91.0 384 28.6 1,923 45.7 8runswick TC
4,648 96.2 21,699 100.0 6,619 100.0 - Caldwell CC & TI3,283 100.0 16,988 91.5 3,830 100.0 0 0.0 0 0.0 Cape Fear TI
1,275 100.0 21,592 98.1 19,243 98.5 .. 4,139 100.0 Carteret TC4,964 90.1 14,406 100.0 0 0.0 _ - - Catawba Vy. TC3,474 100.0 7,482 100.0 1,638 93.2 137 87.8 - C. Carolina IC
30,628 90.6 20,993 89.6 329,572 98.2 - - C. Piedmont CC
1,858 100.0 8,325 100.0 5,688 78.3 232 100.0 Cleveland TC3,510 100.0 14,822 100.0 5,756 100.0 - - - Coastal Car. CC
567 100.0 9,314 100.0 4,098 100.0 - Col. Albemarle1,797 100.0 4,250 100.0 894 100.0 - Craven CC
14,670 100.0 12,431 98.5 6,977 100.0 116 100.0 - Davidson Co. CC2,212 100.0 6,569 80.8 5,005 59.3 - 0 0.3 Durham TI1,860 92.9 8,849 98.7 1,962 88.3 1,106 100.0 - Edgecombe TC
14,780 82.6 14,695 100.0 3,650 34.2 306 100.0 4,254 100.0 Fayettev'le TI
3,212 91.8 20,489 98.0 3,064 100.0 - - Forsyth TI2,867 55.0 22,398 95.3 1,302 29.0 279 100.0 - Gaston Col.5,452 97.1 27,882 84.3 5,833 27.4 - - 0 0.0 - Guilford TCC
649 100.0 4,525 98.6 2,932 83,8 - Halifax CC
14,314 56.5 7,018 100.0 3,190 100.0 233 100.0 - Haywood TC26,029 100.0 10,533 80.7 1,931 100.0 - - - Isothermal CC
- 6,200 93.5 2,763 69.3 - - - J. Sprunt TC9,012 100.0 2,234 96.5 2,695 98.2 0 0.0 153 19.9 Johnston TC
20,018 99,8 9,271 97,8 6,676 97.0 - - Lenoir CC2,622 100.0 12,202 100.0 5,776 88.8 - Martin CC1,20, 100.0 2,401 100.0 307 100.0 - - Mayland TC
- - 2,982 96.6 1,052 100.0 - McDowell TC
1,192 20.7 10,320 55.5 2,037 43.5 1,867 82,8 Mitchell CC1,419 92.3 4,463 100.0 1,272 100.0 - _ Montgomery TC
- - 2,744 100.0 3,366 83.1 6,110 97.0 Nash TC465 100.0 2,114 100.0 882 43.2 - - Pamlico TC
9,822 100.0 13,003 98.9 3,627 100.0 - Piedmont TC5,260 96.4 5,275 100.0 2,545 100.0 2,056 86.4 Pitt CC4,769 100.0 13,647 100.0 7,386 100.0 - Randolph TC
390 100.0 7,284 84.3 509 23.4 100 100.0 - Richmond TC
- 5,952 97.8 5,634 84.6 - Roanoke-Cho. TC155 100.0 6,444 100.0 3,965 100.0 7,220 100.0 Robeson TC
20,733 76.5 18,381 99,7 6,973 100.0 579 100.0 Rockingham CC3,307 100.0 15,462 95.3 9,205 100.0 - - Rowan TC
0 0.0 2,289 100.0 1,304 100.0 - - 2,154 100.0 Sampson TC7,917 79.8 17,217 99,9 6,501 97.6 539 9.7 - Sandhills CC8,228 98.0 11,872 100.0 5,598 95.9 - - Southeastern CC
191 100.0 10,276 100.0 1,800 100.0 Southwestern TC
234 100.0 3,278 100.0 226 6.5 0 0.0 Stanly TC18,098 100.0 15,245 97.1 5,067 100.0 Surry CC4,548 100.0 8,462 100.0 2,830 100.0 0 0.0 TC Alamance
2,142 100.0 800 40.2 Tri-County CC
2,764 100.0 5,814 97.2 2,379 24.4 - Vance-Granv'le CC3,410 93.6 16,404 86.6 9,094 47.1 328 100.0 1,013 65.7 Wake TC1,623 74.6 9,808 97.6 2,644 94.6 171 100.0 Wayne CC2,724 63.3 14,054 100.0 2,235 29.9 54 100.0 W. Piedmont CC
20,917 100.0 30,986 90.7 11,135 100.0 Wilkes CC2,509 100.0 5,997 100.0 9,399 87,7 219 100.0 Wilson Co. TI
316,101 89.2 609,716 94.2 568,714 86.0 2,816 99.3 772 6.0 34,922 65.8 TOTAL
195
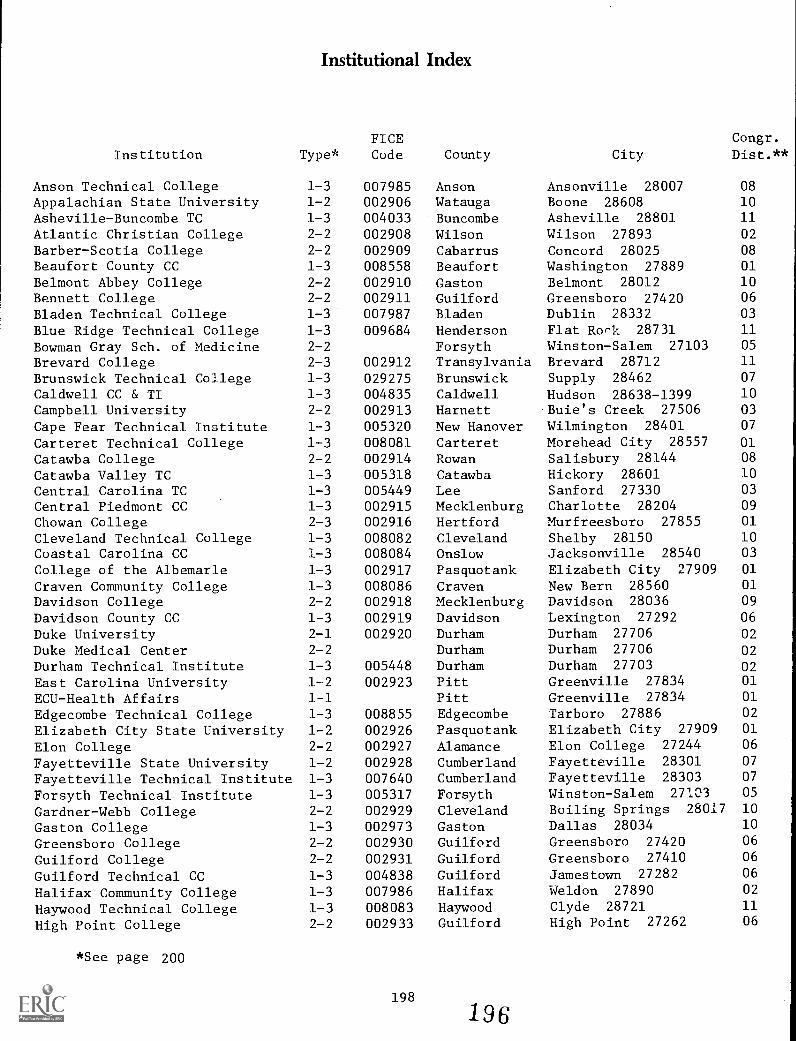
Institutional Index
Institution Type*FICECode County City
Congr.
Dist.**
Anson Technical College 1-3 007985 Anson Ansonville 28007 08
Appalachian State University 1-2 002906 Watauga Boone 28608 10
Asheville-Buncombe TC 1-3 004033 Buncombe Asheville 28801 11
Atlantic Christian College 2-2 002908 Wilson Wilson 27893 02
Barber-Scotia College 2-2 002909 Cabarrus Concord 28025 08
Beaufort County CC 1-3 008558 Beaufort Washington 27889 01
Belmont Abbey College 2-2 002910 Gaston Belmont 28012 10
Bennett College 2-2 002911 Guilford Greensboro 27420 06
Bladen Technical College 1-3 007987 Bladen Dublin 28332 03
Blue Ridge Technical College 1-3 009684 Henderson Flat Rork 28731 11
Bowman Gray Sch. of Medicine 2-2 Forsyth Winston-Salem 27103 05
Brevard College 2-3 002912 Transylvania Brevard 28712 11
Brunswick Technical College 1-3 029275 Brunswick Supply 28462 07
Caldwell CC & TI 1-3 004835 Caldwell Hudson 28638-1399 10
Campbell University 2-2 002913 Harnett Buie's Creek 27506 03
Cape Fear Technical Institute 1-3 005320 New Hanover Wilmington 28401 07
Carteret Technical College 1-3 008081 Carteret Morehead City 28557 01
Catawba College 2-2 002914 Rowan Salisbury 28144 08
Catawba Valley TC 1-3 005318 Catawba Hickory 28601 10
Central Carolina TC 1-3 005449 Lee Sanford 27330 03
Central Piedmont CC 1-3 002915 Mecklenburg Charlotte 28204 09
Chowan College 2-3 002916 Hertford Murfreesboro 27855 01
Cleveland Technical College 1-3 008082 Cleveland Shelby 28150 10
Coastal Carolina CC 1-3 008084 Onslow Jacksonville 28540 03
College of the Albemarle 1-3 002917 Pasquotank Elizabeth City 27909 01
Craven Community College 1-3 008086 Craven New Bern 28560 01
Davidson College 2-2 002918 Mecklenburg Davidson 28036 09
Davidson County CC 1-3 002919 Davidson Lexington 27292 06
Duke University 2-1 002920 Durham Durham 27706 02
Duke Medical Center 2-2 Durham Durham 27706 02
Durham Technical Institute 1-3 005448 Durham Durham 27703 02
East Carolina University 1-2 002923 Pitt Greenville 27834 01
ECU-Health Affairs 1-1 Pitt Greenville 27834 01
Edgecombe Technical College 1-3 008855 Edgecombe Tarboro 27886 02
Elizabeth City State University 1-2 002926 Pasquotank Elizabeth City 27909 01
Elon College 2-2 002927 Alamance Elon College 27244 06
Fayetteville State University 1-2 002928 Cumberland Fayetteville 28301 07
Fayetteville Technical Institute 1-3 007640 Cumberland Fayetteville 28303 07
Forsyth Technical Institute 1-3 005317 Forsyth Winston-Salem 27103 05
Gardner-Webb College 2-2 002929 Cleveland Boiling Springs 28017 10
Gaston College 1-3 002973 Gaston Dallas 28034 10
Greensboro College 2-2 002930 Guilford Greensboro 27420 06
Guilford College 2-2 002931 Guilford Greensboro 27410 06
Guilford Technical CC 1-3 004838 Guilford Jamestown 27282 06
Halifax Community College 1-3 007986 Halifax Weldon 27890 02
Haywood Technical College 1-3 008083 Haywood Clyde 28721 11
High Point College 2-2 002933 Guilford High Point 27262 06
*See page 200
198
196
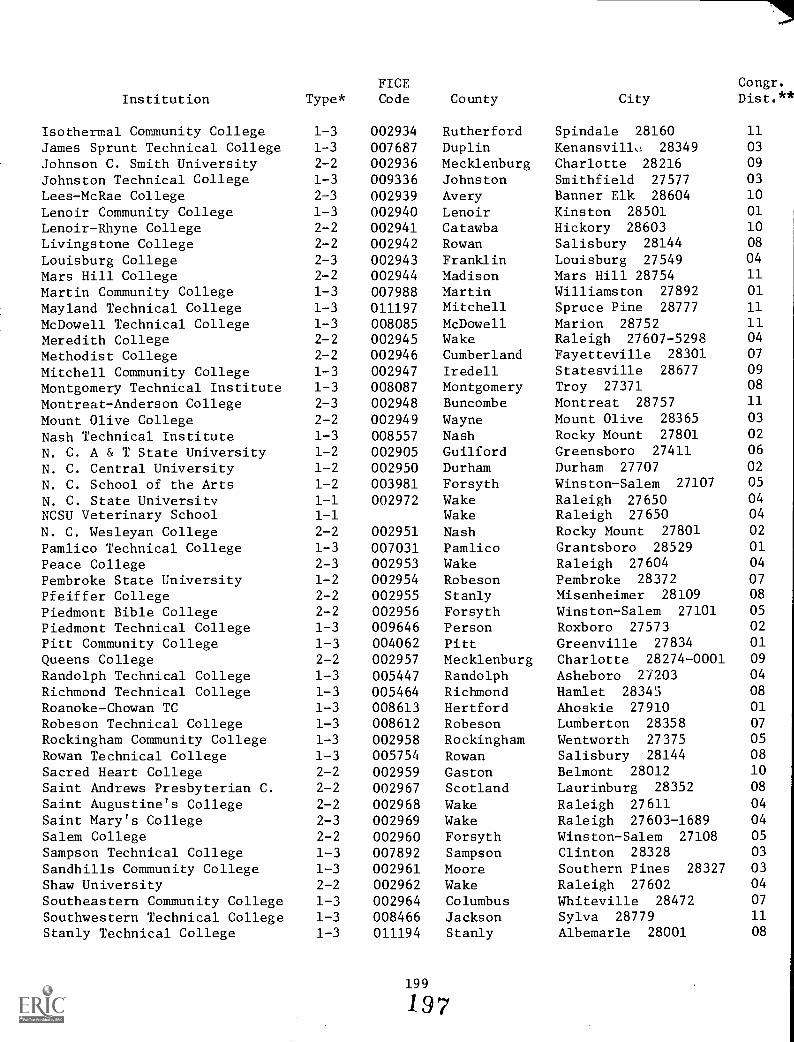
Institution Type*FICECode County City
Congr.Dist.*
Isothermal Community College 1-3 002934 Rutherford Spindale 28160 11
James Sprunt Technical College 1-3 007687 Duplin Kenansvill,: 28349 03
Johnson C. Smith University 2-2 002936 Mecklenburg Charlotte 28216 09
Johnston Technical College 1-3 009336 Johnston Smithfield 27577 03
Lees-McRae College 2-3 002939 Avery Banner Elk 28604 10
Lenoir Community College 1-3 002940 Lenoir Kinston 28501 01
Lenoir-Rhyne College 2-2 002941 Catawba Hickory 28603 10
Livingstone College 2-2 002942 Rowan Salisbury 28144 08
Louisburg College 2-3 002943 Franklin Louisburg 27549 04
Mars Hill College 2-2 002944 Madison Mars Hill 28754 11
Martin Community College 1-3 007988 Martin Williamston 27892 01
Mayland Technical College 1-3 011197 Mitchell Spruce Pine 28777 11
McDowell Technical College 1-3 008085 McDowell Marion 28752 11
Meredith College 2-2 002945 Wake Raleigh 27607-5298 04
Methodist College 2-2 002946 Cumberland Fayetteville 28301 07
Mitchell Community College 1-3 002947 Iredell Statesville 28677 09
Montgomery Technical Institute 1-3 008087 Montgomery Troy 27371 08
Montreat-Anderson College 2-3 002948 Buncombe Montreat 28757 11
Mount Olive College 2-2 002949 Wayne Mount Olive 28365 03
Nash Technical Institute 1-3 008557 Nash Rocky Mount 27801 02
N. C. A & T State University 1-2 002905 Guilford Greensboro 27411 06
N. C. Central University 1-2 002950 Durham Durham 27707 02
N. C. School of the Arts 1-2 003981 Forsyth Winston-Salem 27107 05
N. C. State University 1-1 002972 Wake Raleigh 27650 04
NCSU Veterinary School 1-1 Wake Raleigh 27650 04
N. C. Wesleyan College 2-2 002951 Nash Rocky Mount 27801 02
Pamlico Technical College 1-3 007031 Pamlico Grantsboro 28529 01
Peace College 2-3 002953 Wake Raleigh 27604 04
Pembroke State University 1-2 002954 Robeson Pembroke 28372 07
Pfeiffer College 2-2 002955 Stanly Misenheimer 28109 08
Piedmont Bible College 2-2 002956 Forsyth Winston-Salem 27101 05
Piedmont Technical College 1-3 009646 Person Roxboro 27573 02
Pitt Community College 1-3 004062 Pitt Greenville 27834 01
Queens College 2-2 002957 Mecklenburg Charlotte 28274-0001 09
Randolph Technical College 1-3 005447 Randolph Asheboro 21.203 04
Richmond Technical College 1-3 005464 Richmond Hamlet 28345 08
Roanoke-Chowan TC 1-3 008613 Hertford Ahoskie 27910 01
Robeson Technical College 1-3 008612 Robeson Lumberton 28358 07
Rockingham Community College 1-3 002958 Rockingham Wentworth 27375 05
Rowan Technical College 1-3 005754 Rowan Salisbury 28144 08
Sacred Heart College 2-2 002959 Gaston Belmont 28012 10
Saint Andrews Presbyterian C. 2-2 002967 Scotland Laurinburg 28352 08
Saint Augustine's College 2-2 002968 Wake Raleigh 27611 04
Saint Mary's College 2-3 002969 Wake Raleigh 27603-1689 04
Salem College 2-2 002960 Forsyth Winston-Salem 27108 05
Sampson Technical College 1-3 007892 Sampson Clinton 28328 03
Sandhills Community College 1-3 002961 Moore Southern Pines 28327 03
Shaw University 2-2 002962 Wake Raleigh 27602 04
Southeastern Community College 1-3 002964 Columbus Whiteville 28472 07
Southwestern Technical College 1-3 008466 Jackson Sylva 28779 11
Stanly Technical College 1-3 011194 Stanly Albemarle 28001 08
199
197
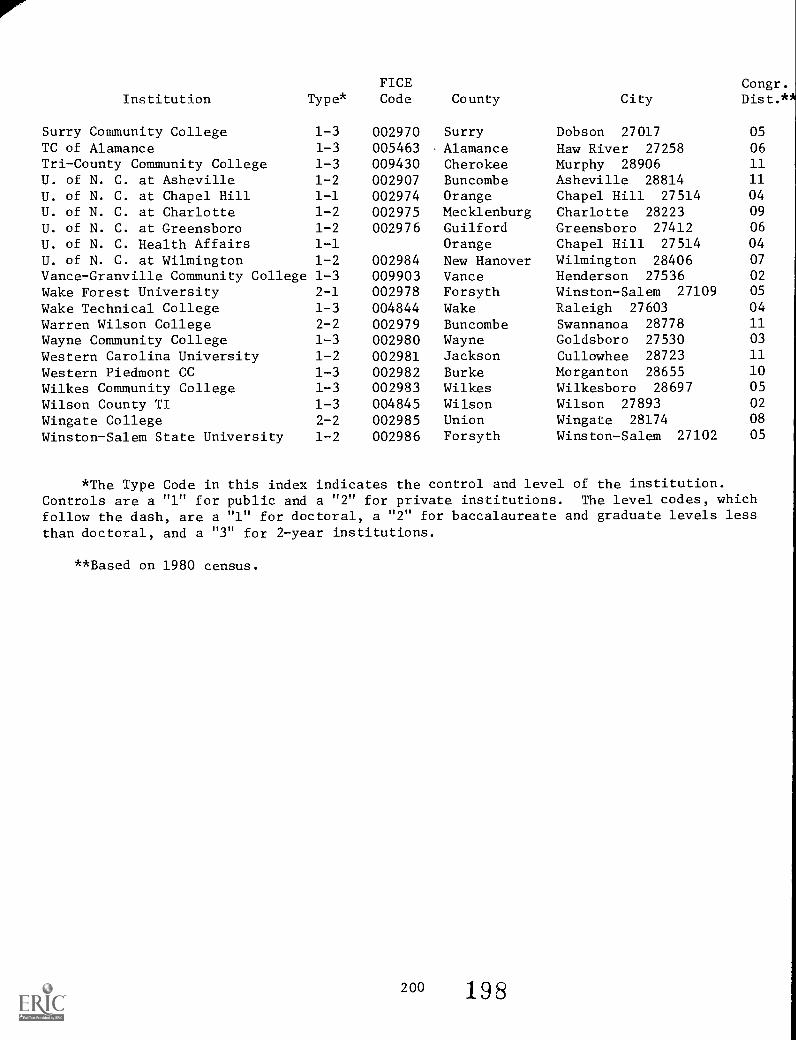
Institution
Surry Community CollegeTC of AlamanceTri-County Community CollegeU. of N. C. at AshevilleU. of N. C. at Chapel HillU. of N. C. at CharlotteU. of N. C. at GreensboroU. of N. C. Health Affairs
Type*
U. of N. C. at Wilmington 1-2Vance-Granville Community College 1-3Wake Forest University 2-1
Wake Technical College 1-3Warren Wilson College 2-2Wayne Community College 1-3Western Carolina University 1-2Western Piedmont CC 1-3Wilkes Community College 1-3Wilson County TI 1-3Wingate College 2-2Winston-Salem State University 1-2
FICECode County City
Congr.Dist.*
002970 Surry Dobson 27017 05
005463 Alamance Haw River 27258 06
009430 Cherokee Murphy 28906 11
002907 Buncombe Asheville 28814 11
002974 Orange Chapel Hill 27514 04
002975 Mecklenburg Charlotte 28223 09
002976 Guilford Greensboro 27412 06
Orange Chapel Hill 27514 04
002984 New Hanover Wilmington 28406 07
009903 Vance Henderson 27536 02
002978 Forsyth Winston-Salem 27109 05
004844 Wake Raleigh 27603 04
002979 Buncombe Swannanoa 28778 11
002980 Wayne Goldsboro 27530 03
002981 Jackson Cullowhee 28723 11
002982 Burke Morganton 28655 10
002983 Wilkes Wilkesboro 28697 05
004845 Wilson Wilson 27893 02
002985 Union Wingate 28174 08
002986 Forsyth Winston-Salem 27102 05
*The Type Code in this index indicates the control and level of the institution.Controls are a "1" for public and a "2" for private institutions. The level codes, whichfollow the dash, are a "1" for doctoral, a "2" for baccalaureate and graduate levels lessthan doctoral, and a "3" for 2-year institutions.
**Based on 1980 census.
200 198
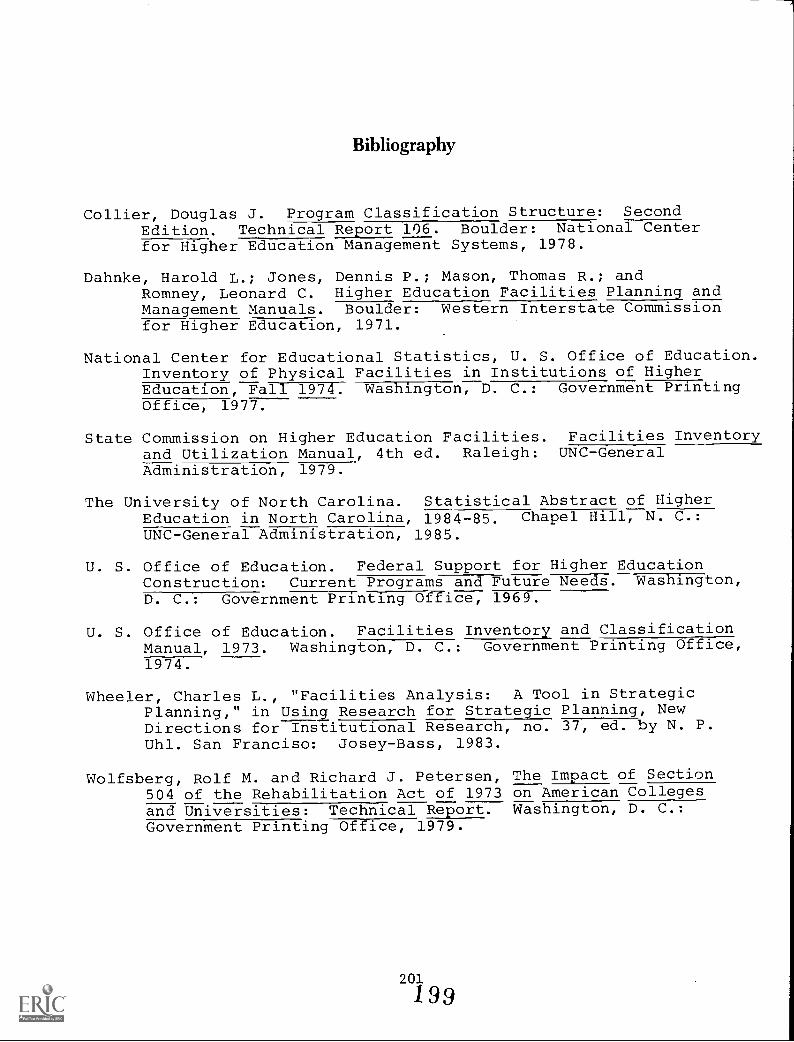
Bibliography
Collier, Douglas J. Program Classification Structure: SecondEdition. Technical Report 106. Boulder: National Centerfor Higher Education Management Systems, 1978.
Dahnke, Harold L.; Jones, Dennis P.; Mason, Thomas R.; andRomney, Leonard C. Higher Education Facilities Planning andManagement Manuals. Boulder: Western Interstate Commissionfor Higher Education, 1971.
National Center for Educational Statistics, U. S. Office of Education.Inventory of Physical Facilities in Institutions of HigherEducation, Fall 1974. Washington, D. C.: Government PrintingOffice, 1977.
State Commission on Higher Education Facilities. Facilities Inventoryand Utilization Manual, 4th ed. Raleigh: UNC-GeneralAdministration, 1979.
The University of North Carolina. Statistical Abstract of HigherEducation in North Carolina, 1984-85. Chapel Hill, N. C.:UNC-General Administration, 1985.
U. S. Office of Education. Federal Support for Higher EducationConstruction: Current Programs and Future Needs. Washington,D. C.: Government Printing Office, 1969.
U. S. Office of Education. Facilities Inventory and ClassificationManual, 1973. Washington, D. C.: Government Printing Office,1974.
Wheeler, Charles L., "Facilities Analysis: A Tool in StrategicPlanning," in Using Research for Strategic Planning, NewDirections for Institutional Research, no. 37, ed. by N. P.Uhl. San Franciso: Josey-Bass, 1983.
Wolfsberg, Rolf M. and Richard J. Petersen, The Impact of Section504 of the Rehabilitation Act of 1973 on American Collegesand Universities: Technical Report. Washington, D. C.:Government Printing Office, 1979.
201
199
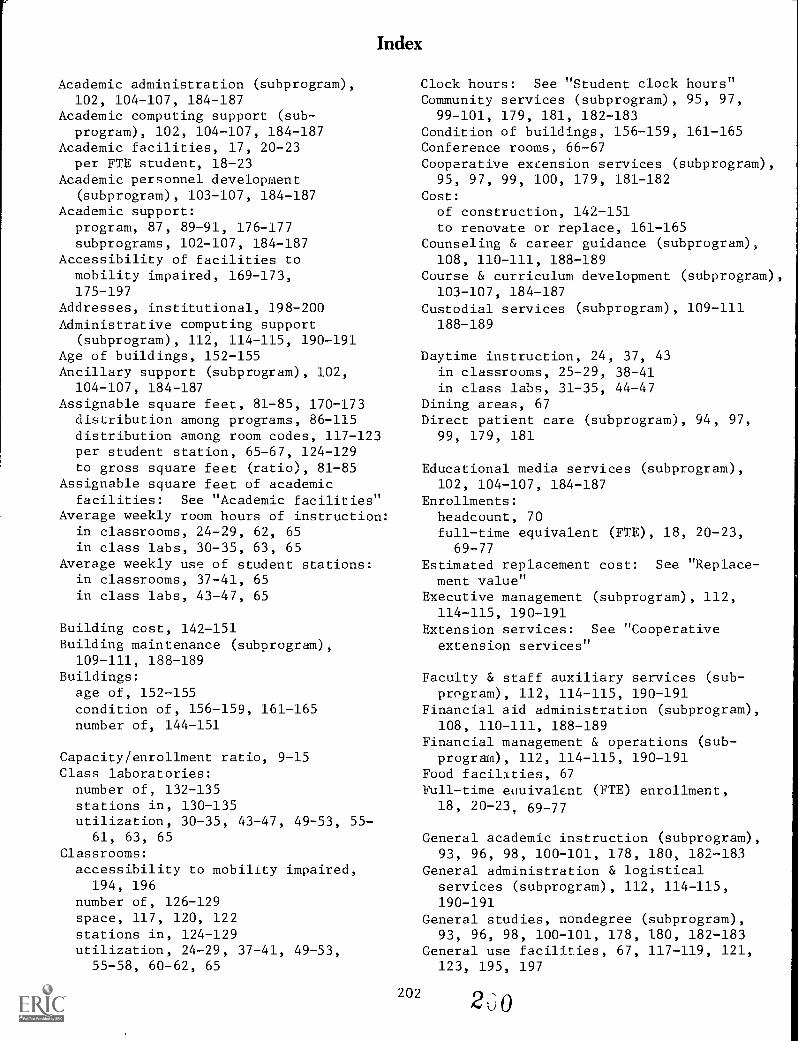
Index
Academic administration (subprogram),102, 104-107, 184-187
Academic computing support (sub-program), 102, 104-107, 184-187
Academic facilities, 17, 20-23per FTE student, 18-23
Academic personnel development(subprogram), 103-107, 184-187
Academic support:program, 87, 89-91, 176-177subprograms, 102-107, 184-187
Accessibility of facilities tomobility impaired, 169-173,175-197
Addresses, institutional, 198-200Administrative computing support
(subprogram), 112, 114-115, 190-191Age of buildings, 152-155Ancillary support (subprogram), 102,
104-107, 184-187Assignable square feet, 81-85, 170-173distribution among programs, 86-115distribution among room codes, 117-123per student station, 65-67, 124-129to gross square feet (ratio), 81-85
Assignable square feet of academicfacilities: See "Academic facilities"
Average weekly room hours of instruction:in classrooms, 24-29, 62, 65
in class labs, 30-35, 63, 65Average weekly use of student stations:
in classrooms, 37-41, 65in class labs, 43-47, 65
Building cost, 142-151Building maintenance (subprogram),
109-111, 188-189Buildings:age of, 152-155condition of, 156-159, 161-165number of, 144-151
Capacity/enrollment ratio, 9-15Class laboratories:number of, 132-135stations in, 130-135utilization, 30-35, 43-47, 49-53, 55-
61, 63, 65Classrooms:accessibility to mobility impaired,
194, 196number of, 126-129space, 117, 120, 122stations in, 124-129utilization, 24-29, 37-41, 49-53,
55-58, 60-62, 65
202
Clock hours: See "Student clock hours"Community services (subprogram), 95, 97,99-101, 179, 181, 182-183
Condition of buildings, 156-159, 161-165Conference rooms, 66-67Cooperative extension services (subprogram),95, 97, 99, 100, 179, 181-182
Cost:of construction, 142-151to renovate or replace, 161-165
Counseling & career guidance (subprogram),108, 110-111, 188-189
Course & curriculum development (subprogram),103-107, 184-187
Custodial services (subprogram), 109-111188-189
Daytime instruction, 24, 37, 43in classrooms, 25-29, 38-41in class labs, 31-35, 44-47
Dining areas, 67Direct patient care (subprogram), 94, 97,
99, 179, 181
Educational media services (subprogram),102, 104-107, 184-187
Enrollments:headcount, 70full-time equivalent (FTE), 18, 20-23,
69-77Estimated replacement cost: See "Replace-ment value"
Executive management (subprogram), 112,114-115, 190-191
Extension services: See "Cooperativeextension services"
Faculty & staff auxiliary services (sub-program), 112, 114-115, 190-191
Financial aid administration (subprogram),108, 110-111, 188-189
Financial management & operations (sub-program), 112, 114-115, 190-191
Food facilities, 67Full-time eouivalent (FTE) enrollment,18, 20-23, 69-77
General academic instruction (subprogram),93, 96, 98, 100-101, 178, 180, 182-183
General administration & logisticalservices (subprogram), 112, 114-115,190-191
General studies, nondegree (subprogram),93, 96, 98, 100-101, 178, 180, 182-183
General use facilities, 67, 117-119, 121,123, 195, 197
2 u 0
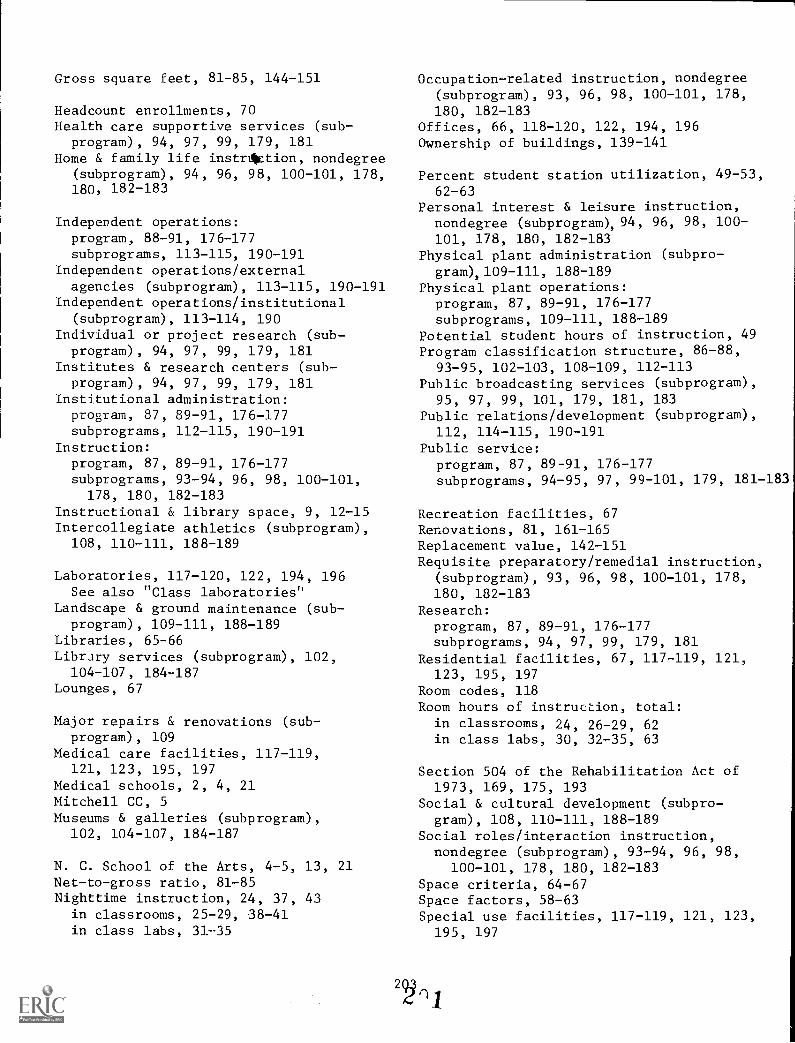
Gross square feet, 81-85, 144-151
Headcount enrollments, 70Health care supportive services (sub-
program), 94, 97, 99, 179, 181Home & family life instrAletion, nondegree
(subprogram), 94, 96, 98, 100-101, 178,180, 182-183
Independent operations:program, 88-91, 176-177subprograms, 113-115, 190-191
Independent operations/externalagencies (subprogram), 113-115, 190-191
Independent operations/institutional(subprogram), 113-114, 190
Individual or project research (sub-program), 94, 97, 99, 179, 181
Institutes & research centers (sub-program), 94, 97, 99, 179, 181
Institutional administration:program, 87, 89-91, 176-177subprograms, 112-115, 190-191
Instruction:program, 87, 89-91, 176-177subprograms, 93-94, 96, 98, 100-101,178, 180, 182-183
Instructional & library space, 9, 12-15Intercollegiate athletics (subprogram),
108, 110-111, 188-189
Laboratories, 117-120, 122, 194, 196See also "Class laboratories"
Landscape & ground maintenance (sub-program), 109-111, 188-189
Libraries, 65-66Library services (subprogram), 102,
104-107, 184-187Lounges, 67
Major repairs & renovations (sub-program), 109
Medical care facilities, 117-119,121, 123, 195, 197
Medical schools, 2, 4, 21Mitchell CC, 5Museums & galleries (subprogram),
102, 104-107, 184-187
N. C. School of the Arts, 4-5, 13, 21Net-to-gross ratio, 81-85Nighttime instruction, 24, 37, 43
in classrooms, 25-29, 38-41in class labs, 31-35
Occupation-related instruction, nondegree(subprogram), 93, 96, 98, 100-101, 178,180, 182-183
Offices, 66, 118-120, 122, 194, 196Ownership of buildings, 139-141
Percent student station utilization, 49-53,62-63
Personal interest & leisure instruction,nondegree (subprogram), 94, 96, 98, 100-101, 178, 180, 182-183
Physical plant administration (subpro-gram),109-111, 188-189
Physical plant operations:program, 87, 89-91, 176-177subprograms, 109-111, 188-189
Potential student hours of instruction, 49Program classification structure, 86-88,
93-95, 102-103, 108-109, 112-113Public broadcasting services (subprogram),95, 97, 99, 101, 179, 181, 183
Public relations/development (subprogram),112, 114-115, 190-191
Public service:program, 87, 89-91, 176-177subprograms, 94-95, 97, 99-101, 179, 181-183
Recreation facilities, 67Renovations, 81, 161-165Replacement value, 142-151Requisite preparatory/remedial instruction,
(subprogram), 93, 96, 98, 100-101, 178,180, 182-183
Research:program, 87, 89-91, 176-177subprograms, 94, 97, 99, 179, 181
Residential facilities, 67, 117-119, 121,123, 195, 197
Room codes, 118Room hours of instruction, total:
in classrooms, 24, 26-29, 62in class labs, 30, 32-35, 63
Section 504 of the Rehabilitation Act of1973, 169, 175, 193
Social & cultural development (subpro-gram), 108, 110-111, 188-189
Social roles/interaction instruction,nondegree (subprogram), 93-94, 96, 98,100-101, 178, 180, 182-183
Space criteria, 64-67Space factors, 58-63Special use facilities, 117-119, 121, 123,195, 197
Square feet: See "Assignable square feet,""Gross square feet"
Stations: See "Student stations"Student auxiliary services (subprogram),108, 110-111, 188-189
Student clock hours, 10, 12-15, 55-57Student financial support, 88Student health/medical services (sub-program), 108-111, 188-189
Student records (subprogram), 113-115,190-191
Student recruitment & admissions(subprogram), 112, 114-115, 190-191
Student service:program, 87, 89-91, 176-177subprograms, 108-111, 188-189
Student service administration (sub-program), 108, 110-111, 188-189
Student stations, 37-41, 44-47, 126-129, 132-135assignable square feet per, 65-67,
124-129, 130-135occupancy, 37-41, 43-47, 49-53
Study facilities, 117-120, 122, 194,196
Supporting facilities, 117-119, 121,123, 195, 197
UNC at Asheville, 5Unassigned space:program, 88-91, 176-177subprogram, 113-115, 190-191
Unclassified space, 117-119, 121, 123,195, 197
Utilities (subprogram), 109-110, 188
Vocational/technical instruction(subprogram), 93, 96, 98, 100-101,178, 180, 182-183
204