document resume - eric · document resume. ed 115 713. 88-ud 015 600-title' designing and,...
TRANSCRIPT

DOCUMENT RESUME
ED 115 713 88 - UD 015 600-
TITLE' Designing and, Implementing Little School Components:gEA.Title,III Evaluation; Final Report.
INSTITUTION D tniet of Columbia Public Schools, Washington, D.C.D pt. of Research ana Evaluation.
SPONS AGENCY Bureau of School Systems (DHEW/OE)t Washington, D.C.Div. of Supplementary Centers and ServiceA.
PUB DATE Aug 75NOTE 58p.; Report prepared by G 8 G Associates, Inc.,
Silver Spring, Maryland -
EDRS PRICE MF-$0.76 HC-$3.32 Plus PostageDESCRIPTORS Acadenic Achievement; Attendance Record's,;
*Compensatory Education Programs; CurriculumDevelopment; Guidance Programs; *gigh Schools;*Individualized Instruction; *Program Evaluation;Staff Improvement; Student Attitudes; TeachingMethods
IDENTIFIERS District of Columbia; Elementary Secondary EducationAct Title III; ESEA Title III
ABSTRACTDesigning and Implementing Programs for the Little
School-Component is-a program funded under Elementary SecondaryEducation Act Title III and designed to develop, implement, anddisseminate a program of individualized instruction at the Howard D.Woodson Senior High School. This program is a third year continuationof the program initiated in 1972-73. The original 300 studentsentering as 10th graders,,in 1972-73 have continued in the program andare now in their senior year. The third year program was expected tocomplete the development of pilot experiences for staff and studentsalike in the development and implementation of individualizedprograms. The current year program was designed to be conducted infour phases described in the project proposal: Articulation andPlanning Session, Implementation of ''he Little School Component,School -Years Workshop and Staff Development, and Evaluation andRede;igi...Phases 2 -4 were -in effect concurrently from the beginningof the 1974-75 academic year while Phase 1 was conducted during thesummer of 1974. The results of the evaluatioh discussed here aptconsidered to clearly indidate support for the Little SchoolComponentls achievement of its goals, particulary,in the ari'As ofdeveloping a viable program of individualized instruction and inCreiating a positive atmosphere fdr learning. (Author/JM)
***********************************************************************Documents acquired 'by ERIC, include many' .informal unpublished
* Materials not available from other sources. ERIC makes every effort *, * to obtain the best copy available. Nevertheless, item's of marginal *
* reproducibility are often encountered and this affects the qualitl% *
* of the microfiche and hardcopy reproductions ERIC makes available *
* via the ERIC Ddcument Reproduction Service (EDRS). EDRS is not* responsible for the quality of the original document. Reproductions **,supplied by EDRS are the be st''that can be made from the original. ' ******************;******************************************************

L
Public , Schools- of th6 District-tf 'Columbia
.DESIGNING .AND.' 'EMENTING LITTLE
SCHOOL CO' poNENT5,
. .
r- tiESEA TITLE III: EVALUATION ''
. FINAL REPb143 ,
Sour
U'S DEPARTMENT OF HEALTH.EDUCATION L WEL FARENATIONAL INSTITUTE_ OF
EDUCATIONTHIS DOCUMENT HAS BEEN REPRODUCEO EXACTLY AS RECEIVED PROMTHE PERSON OR ORGANIZATION ORIGINATING IT POINTS OP VIEW OR OPINIONSSTATED DO NOT NECESSARILY REPRE,SENT OFFICIAL NATIONAL INSTITUTE OFEDUCATION POSITION OR POLICY .
2
Office of Researich and EvaluationDivision of Research Evaluation
August .19745' -1
I (
Office of Planning-,-Wegh and Ekluation
Division:6'f Research and Evaluation
.Dr. James A. Johnson, Associate Superintendent,
Dr. Mildred P. Cooper; Assistant Superintendent
Ms. June Bland, Assistant to the Assistant Superintendent
Mrs. Lavolia W. Vails, Coordinator of EvaluationESEA Title III Projects
4 4.1X
Mrs. ElSa Miller, Chairman of Advisory Council
Mrs. Patricia Goins, Vice Chairman
Mr..Hartis M. Taylor, Director of Federal Programs
Mrs. Grace Davis, Coordinator ESEA Title, III'
Project Director
Mrs. Clara RogersMrs. Janey Younge, Coordinator
1975
3

4
4I4
, .
EVALUATION OF THE PROGRkg: nbESIGNING AND IMPLEMENTINGPROGRAMS FOR THE LITTLE SCHOOL.COUPONENT"
.).
TITLE,III EVALUATION PROJECT
cFINAL REPORT
Division of Research-and Evaluation,Public Schools of the District of
Columbia,- Washington D.C.
ContraCt Na. 1016- AA -NS-O' 5 -GA
G & G Associates, Inc.840 Loxford Terrace
Silver Spring, Md. 20901
August 1975
.1

ACKNOWLEDGMENTS
Mrs. Barbara A. SizemoreSuperintendent of Schools
h
Mr. Vincent E. Reed. !
Associate Superintendent - State Office
Dr. James A. Johnson, Jr.,Iseociate Superintendent - Planning, Research and Evaluation
Mr. Harris M. TaylorAssistant Superintendent - Department of Federal Programs
Dr. Mildred P. Cooper.AAsistant Superintendent for Division of Research and Evaluation
c
Mr: Napoleon .LewisSilperintendent Region Three
Mrs.'Elsa Millerand. Mrs. Patricia Gains
Title III Advisory,Council Chairperson and Co-Chairperson
Mrs. Grace H. DavisCoordinator for ESEA Title III Projects
Mrs: Lavolia VailsCoordinator for Title III Project Evaluations
Mrs. June Bland, Assistant for Evaluation
Mrs. Clara RogersProject Director, Little School Component
Dr. Isadore GoldbergEvaluation Project Director
Dr. Thomas JohnEvaluation - Senior Research Scientist
5

Chapter
;- TAW, C MITENTS,
JJChapteiqDESCRIPTION OF THE PROJECT 1
phase I's, Orientation and Planning Session 1
Phase II - Implementing the Little SchoolComponent 2
Phase III,- SchoolThar Workshop and StaffDevelopment Program
Chapter IIMETHODS AND PROCEDURES
Chapter IIIRESULTS AND ANALYSIS OF DATA
Comparative. AnalySis of Student Attitudes
Student Reactions To The Little SchoolComponent 15.
Absences
.
Standardized Test Resulti
The Individualized Curriculum For The LittleSchools. Component
3
26
Teacher Reactions To The Little SchoolCadponent 28
, Teaching Methods 28
Teacher Ratings of Their ClaSses 34
Staff De.Velopment 39
CoMponent Teachers' Evaluation of LittleSchools 42
6
I.

TABLE OF CONTENTS (CONTINUED)
Chapter
Results of Intefviews.and Observations
Summary of'Results- -
Chapter rv.RECOMMENDATIONS
re
47
.49
A
A
e

LIST-OF TABLES
ITable. -.
H.. ...
II 1. RESULTS OF THE GENERAL HIGH SCHOOL PROGRAMQUESTIONNAIRE 10
2. COMPARISON OF ITEMS OF THE GENERAL HIGHSCHOOL PROGRAM QUESTIONNAIRE 11
3. LITTLE SCHOOL COMPONENT STUDENT QUESTIONNAIRE 16
4. CCMPARISON OF ABSENCES FOR NINE CCITONENTAND NINE NON-COMPONENT SECTIONS 21
5. PSAT AND SAT MATH SCORES OF COMPONENT ANDNON-COMPONENT STUDENTS -24
6. PSAT AND SAT VERBAL SCORES OF COLTONENT ANDNON - COMPONENT. STUDENTS 25
7. CURRENT STATUS OF INDIVIDUALIZED COURSEDEVELOPMENT 27
8. TEACHING METHODS AND MATERIALS USED BYCOMPONENT AND"NON-COMPONENT TEACHERS 29
9. TEACHING IITHODS AND MATERIALS USED "VERYOFTEN" OR "OFTEN" BY C0120NENTNON-CCMPONENT TEACHERS 32
10. PERCEPTIONS OF TEAM TEACHING EXPERIENCE'S OFSIX COMPONENT TEACHERS 34
11. RATINGS OF STUDENTS 'BY LITTLE SCHOOLCOMPONENT TEACHERS AND NON-COMPONENT TEACHERS 36
12. COMPARISON OF LITTLE SCHOOL STUDElT:ANDTEACHER PERCEPTIONS . '38
la. STAFF DEVELOPMENT ASSESSMENT- AND NEEDS ANALYSIS 41
14. TEACHER EVALUATION OF,LITTLE.SCHOOLS 43
CPL ENTS - STRENGTHS, WEAKNESSES,IMPROVEMENTS .. 44
a
'S
'I

CHAPTER I.DESCRIPTION OF THE PROJECT
Designing and,Implementing Programs for the Little SchoolComponent is a.program designed ,to develop, implement, and dis-seminate a program of individualized instruction at the Howardb. Woodson Senior High School. This program-is a third yearcontinuation of the program initiated in 1972-73. OriginalStudents were selected in 1972-73 from student listings suppliedby feeder-school counselors. The 300 students originally enteringas.10th graders in 1972-73 have continued in the program and arenow in their senior year,, The third year program was expected tocomplete the development of pilot experiences for staff andstudents alike in the development and implementation of in-dividualized programs.
The current year program was designed to be conducted in fourphases described in the project proposal:
Phase I - Articulation and Planning SessionPhase II - Implementation of the Little School ComponentPhase III - School-Year Workshop and Staff DevelopmentPhase:IV - Evaluation and Redeslgn.
Phases II - IV were in effe t concurrently from the be-ginning of the 1974-75 academic ^ear while Phase I was conductedduring the Summer 1974.
Phase I - Orientation an' Piannin Session,
Phase I involved concurrent works.lops and training sessionsfor eleven current teachers, one course or, one librarian, oneteacher-coordinator, an assistant principal for instruction, andsix new teachers. All teachers functioned in teams in all phasesof planning and organization. Within this period the staff wasinvolved in workshop t4.ining sessions and the preparation anddevelopment of learnineAtqpials. The counselor and the realingteacher - specialist Were invdlittd in communicating with parentsand students, interpreting the program, testing in reading,assessing student groups, organizing and studying student records,for the purpose (of identifying, and assessing student needs(reading levels; learning difficulties, social problems, etc.),and refining and; further developing student 'profiles.
-14

Phase I focused on assessing space utilization under various'learhing conditions; identifying perforqance objectives and cur-riculum design in different, subject areas;, investigating andlocating the resources and,materials to be used in the class-room; orienting and-assembling students; planning, developing,and organizing a curriculum laboratory and a central instructionalmaterials center; and organizing and developing an intensivecounseling program.
Phsase I involved .an initial prearatory'workshop session andconcurrent Continued workshop, training and planning sessions withPhase III.
Phase II - Lmple henting the Little School Component
For the school year 1974-75, the Little School Componentprovided individualized instruction for 270 fWelfh gradestudents. The teachers involved in Phase I were a part of theresidential staff.
Component course offerings were determind by data compiledin the first two pilot years from the following sources:
(1) student interests as projected from feedback given in,student opinionnaires, student conferences, and courseelective reports;
(2) recommendations from the teaching and guidance staffbased on observations and recognition of needed changesmade apparent by pilot experiences during the first twoyears;
(3)- expressed and recognized needs of students in thevarious academic areas on in-depth student assessment.
The guidance staff continued to develop and implement anongoing program for intensified counseling and pupil assessment;work with-the teaching staff in cluster groupings to develop andimplement the teacher-advisor role in order to make professionalcounseling services more available to students and teaching staff;assist the instructional staff in identifying and solving immediateand ongoing problems; coordinate and establish lines of communi-cation between parents, students, teachers and community; formulateand affect basic objectives for a more humane 'educational andsocial instructional program for Voodson students, and the Woodson.community; serve as a liaison media for immediate feed back to theinstructional staff, the teacher-coordinator, and the administration.
10
-2-

Library personnel involved in Phase I continued as a part.of the' residential. staff for the year. The library componentcoordinator developed, organized, and managed a.curriculumlaboratory and major instructional materials'center utilized bystudents and staff.
'Phase III School -?ear Workshop and Staff Development Pro3ram
°. Component participants,were allotted six additional hourseach week during the school year, not precluding daily planningsessions scheduled for all teachers, to provide additional timefor continued planning, training, the exchange of ideas, and work-shops. 'Because it was discovered in the first year pilot thatcertain staff activities required more time.than,others (planningnew student grouping as opposed to discussing and solving animmediate problem of smalldimensions), the component staff hadthe ption of determining time allotments which best met the needsof th group in the workshop.
istrotii) acted as a core for further expansion and mod-ificati, n of the Little School Component at nodson High School.The scho'1 year provided a.regular base for training and labor-atory,exptriences for other Woodson teachers as Tagil as teachersfrom othepublic schools. Ongoing workshops were` held throughoutthe year t ,orovide training and assistance in areas of need andto further.kpread innovative skills to other members of theWoodson staff.
The teacher-coordinator continued as teacher- coordinatorthroughout the year and assisted in identifying the needs ofparticipating teachers, seeking resources and developing alter-native strategies as issues developed. The library-coordinator wasdirectly responsible for organizing, managing and coordinatingthe instructional materials center and the curriculum laboratorywith all activities involved in £he instructional program of theLittle School Component. The counselor and coordinators workedunder the direct supervision of the Assistant Principal for
ft,
Instruction.
The objectives of the project, as described in the projectproposal, were as follows: '
(1) The instructional staff will 'continue to improveacademic achievement utilizing an individualized pro-dram with 300 twelfth grade-students currently enrolledin the Little School Component. This will be evidencedby:
11.3-

,
,, .i,.
a. ability of tree students to function in aniopq.4.space classroom;
. 'b. pupil assessment, and diagnostic teaching based onstandardized tests and teacher made criterion tests;
c. varied teaching techniques in large and smaag14oupinstruction, independbnt study, Irid laboratory.experiences.
. p-
to.
(2) As a means of improvings both academic achievement andstudent attitude, the guidance staff will -develop andimplement a grog m which will include:a. consolidation of records;b. teacher-advisor role to improve attendance_and
academicperfortlance;c. intensified educational counseling for stadents;
parental involvement.
IAs a part of the.individualized program, theinstrut-tional staff will develop and maintain a curriculumlaboratory of resources and materials which .will be
. tested in the classroom and used as:a: a basis for continuous progress learning;lo-; support for a flexible schedule-in the, future;c. a resource for the remaining Woodson staff and
other public and nonpublic schools.
Reports of the first two years of the project provideddetailed descriptions of project development activities, and forthis reason will not be repeateALhere. In reviewing theseactivities and tie evalui.tion 'nee is emphasized in earlier reports,prithary focus was placed upon'assessing the scope of develop-ment of individualized instructioe metdods the developmentof a'titude arid. self- concept me sues for assessing studentimpact.
wo"
The evaluation of Little Schools was designed in-sufficientdetail to pinpoint the strengtHs and weaknesses ,of the programfor confiinued improvement in t=he Woodson High.School and to serveas a model for other schools who wish to undertake a prograth ofindividualized instruction. The evaluation design focused upon .
process variables in order to examine how students and staff adaptto a program of individualized instruction and to show how improve-ments can be made. Product variables, particularly student progress,achievement, and iAterest in school, were an integral part of theevaluation.,
124i.
or,
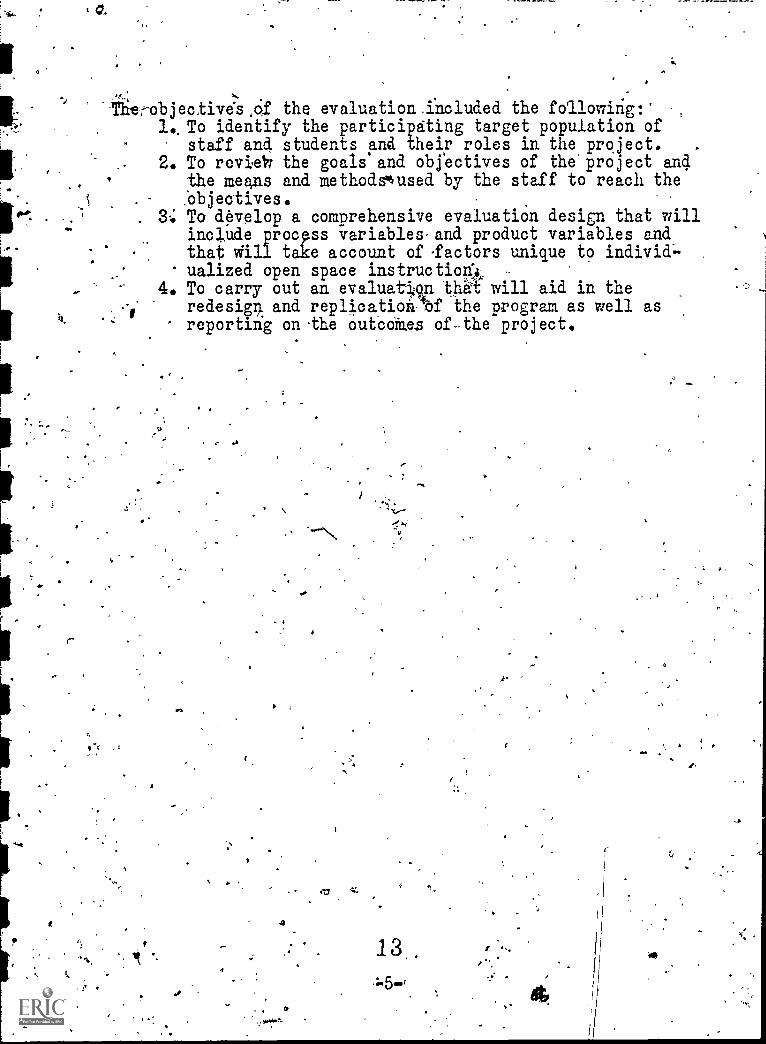
Te-objective'ska the evaluation .included the followirig:'1 To identify the participating target population of
staff and students and their roles in the project. .
2. To revieW the goals and objectives of the' project andthe means and methods6used by the staff to reach the;objectives.
. 3-; To dOvelop a comprehensive evaluation design that willinclude procss variables and product variables andthat Will take account of factors unique to individ-
.
ualized open space instructio4,4. To carry out an evaluatUn that will aid in the
redesign} and replioatioie the program as well asreporting on-the outcoMgs of-the project.
1
4
'
13..
.k
0

CHAPTER IIMETHODS AND PROCEDURES
1
This study Was conducted in three phases:I. project review and evaluation design;2. instrumentation and data collection; and
. 3. data analysis and reporting.
Phase I,..project review and evaluation design, was devoted toidentifying, the participating target population of staff and .
students., and their roles in the project; reviewing the goals andobjectives of the project and the means and methods used by thestaff in reaching them; and the development of a comprehensiveevaluation design that included process and product variables andthat took account of factors unique to individualized instruction.Conferences were held with the Project Director,. AssistantProjector, and representatives of the Division of Research andEvaluation to obtain' a comprehensive picture of the Little SchoolProject. Information and reportS provided at these two confer-ences was later supplemented with other interviews and observations.The evaluation design developed called for comparative surveys ofstudents and teachers various attitudinal areas as well as anassessment of the Little School process dimensions.
Instrumentation (Phase II) to carry out thedesign involvedthe development of three structured questionnaires '(-two for students,onelor.teachers) interviews/observations of classes, review ofinstructional materials :developed by the staff, an analysis ofstandardized test data, and.a comparative analysis of"absencesof Component and Non-Component Students. I
The General High School Program Questionnaire was designed totap'students' self-concepts in relation to schooling. Thisquestionnaire, was admiaistered to a sample of Little School stu-dents and to a compari.7on sample of high school seniors at theSliingara High School. This questiOntaire served as'an indirectmeasure ot the impact Of the Little SChoois Component on students'attitudes and self-concepts.
The little Schools Component Student Questionnaire was designedto Obtain a direct reaction` of the students to the project and wascompleted only by Component Students.
It was intended to.have the entire population of about 270Component students complete each of these questionnaires.However, because Component students were seniors, theyk7e e ex-cused from classdl in late May 1975 and, as a result many students
fo
o14
-6-
$.

did riot complete the questionnaires. It seems reasonable toassume, howeyer, that those students who did complete thequestionnaires are random samples of Component students. Finalsamples were 78 students (about 30%) for the General High SchoolProgram Questionnaire and 133 students (about 45%) for theStudent's Questionnaire.,
The Teacher's Questionnaire was designed to tap areas ofindividualized teaching; the teachers' perceptions of theirstudents ann. classes; Component teachers' staff developmentneeds and the Component teachers' evaluation of Little. Schools.The questionnaire. was completed by 11 of the 14 Componentteachers, the remaining three being absent due to illness.Thirty Non-Component teachers at Woodson Senior High Schoollcompleted the first two parts of the questionnaire, in order tomake comparative analyses of the types'and variety of teachingmethods used and to obtain a comparative. analysis of teachers'perceptions of their students.
'birect observations were made of two ongoing classes toview the teaching methods directly and to observe the quality ofstudent-student and student-teacher, interactions. These class-room observations also provided the opportunity for sp6tinterview's with students.
The evaluator also reviewed an audio-visual presentation ofLittle Schools and a substantial amount of staff developedinstructional materials to assess the programmatic developmentof the project.
'Interviews were held with the project counselors andadditional interview/conferences with the Project Director andAssistant Project Director. Interviews were also planned withthe teaching staff; however, scheduling problems precludedcarrying out these interviews.
The original plans called for the California Test's ofBasic Skills as the standardized achievement test to be admin.istered. However, due to an administrative oversight this testbattery was not administered. As an alternative, -the PreliminaryScholastic Aptitude Tests (PSAT)-for 1973-74 and the Scholastic
'Aptitude Tests (SAT) for 1974-75 were used as the pretests andposttests. Comparisons were made of the actual score gains andthe percentage of Component. and Non-Component students actu-taking each tes,t.
-4Data on absences, was provided by the Assistant Project,Director for nine Component and nine Non-Component sections,each with 270, students.
15.7 .

Data analysis (Phase III) was carried out by handtabulations. Frequency and percentage distributions were ob-tained for all questionnaire items; score, distributions; meansand'standard deviations were 'obtained for the General HighSchool Program Questionnaire, and score distributions mere ob-tained for the PSAT - SAT test results. For comparativeanalyses, the "t" test, z test and the sign test (a nonpara-metric statistic) were used to determine the statisticalsignificance of differences.

CHAPTER IIIRESULTS AND ANALYSIS OF DATA
is section provides the instruments, data analysis,and a iscussion of the findings for each of the two studentquesti nnaires devised for the project, an analysis of absences,stand: dized test-results provided by the Project Director, ananaly la of progress in developing individualized instructionalmate ials, and the results of the teacher questionnaire. Thettac er questionnaire provides a comparative analysis of Con-,pone t and Non-component teachers in varied and individualizedtea ing practices and the teaching climate within which theywor Also provided is an assessment of staff development needsand the Component teachers' assessment of Little SchoOls.
Comparative Analysis. of Student Attitudes
Students in the Little School Component and a control groupof s udents from Spingarn High School were administered a ques-tio aire designed to tap their attitudes and their self conceptsin r lation to schooling. This questionnaire, called the General.High SchOol Program Questionnaire, Was devised by the evaluator,base experience with the goals of individualized programs anddisc sions with the Little School's project staff regarding areasof a titudinal and self-concept impact they hoped to achieve' withthei Students. Therefore, the questionnaire can be considereda mea ure pf behavioral student objectives for individualizedprogr rin the affective domain. The measurement of affectiveChang *,as particularly important as the project seemed to.eiphas ze:thisirea more than the cognitive, domain.
, 4
;40
The questionnaire taps primarily the student's self conceptin rel on to his schooling (questions 1-7); two questions (8and 10 eakwith career planning, particularly appropriate ,tohigh s h 1 seniors; ant withone question (9) deals th the use byteache s f Varied teaching techniques -- that is, teachingstrate ies mors likely to be characteristic of individualizedprograii, e the! Little School Component.
1
All qu stio s are written in such a way that they,area propriate: student's school experience. Only two questions(g and-10) are, sped icific to the high school experience; the re- r.mainder would t\ealopropriate at any level.
174..

The questionnaires were completed by 78 Little Schoolstudents, about a 30 percent sample, and by a control group of81 seniors from Spingarn Senior High School. The control groupwas obtained from outside of Woodson Senior High School as the"Hawthorne effect" would be expected for non-component studentswithin the same school. The questionnaires were administered byschool personnel,
The results of the analysis are presented in Tables and 2.Par Table 1, each questionnaire was scored for questions 1-9.,Question 10, plans for after high school, was not used in thisanalysis. Each item was scored as follows:
StronglyAgreeDisagreeStrongly
Agree
Disagree
- 1- 2
- 3- 4
Thus, with a possible range of 9-36, a high score indicatesa less favorable self concept, while a low-score inaicates a moreavorao e se concept.
TABLE\1
RESULTS OF THE GENERAL HIGiSCHOOL PROGRAM QUESTIoNNA1RE
Mean
COMPONENT STUDENTS CONTROL GROUP
.15.1 17.8
3.3
81
S.D. 3.6
N 78`
"t" = 3.94, Significant beyond :001 level of confidence.
c

TABLE 2
CObiPARISON OF I'T'EMS OF THE GENERAL HIGH SCHOOL PROGRAM'ZZIGETITC377.77-
Response Categories*:,
A. - AreaD - DisagreeSD - Strongly DisagreeB1 - Blank
SA - Strongly Agree
Item and Significance Teat* RC* CoMponentStudentsft %
ControlStudentsf" 1 ,'I/0
1.,.
I understand what myteacher expects of me.
Z = 2.94, Significant.
SAAD
'SDB1
2850
35.964.1
.
13511411
16.263.917.51.2
.1.2
2. I have.a good under-standing of how Lamdoing A"-Ay,sahoolwork. --' . ,
,
Z = 2.3, -.Significant
SAADSDBl
31443
.
39.856.43.8
1854611
22.567.6
. 7.51.21.2
3. I believe IIEti how tostudy and learn.
HotZ : 1.27; HotSignificant
$
SAA.
DSDB1,
393621
50.046.12.61e3.
22aOA$ .
40.053.72.50.03.8
4.'
.
I am very interestedin school.
Z : 2.09, Significant
SAADSD,B1
27,
406A41
34.651.37.7,5.11.3
2236
.193
27.545.023.73.8
_
5..
I have had good eels.-tions with most of myteachers. :
Z = 3.10, Significant
SAAD,SD
Bl-
: 42,
3231
_._
53.941.03.81.3
i 2438153
36.647.518.33.7
.
f' = frequency
19

TAWS. 2 (CONTINUED)N,
\,
Response.alktegories*: Si r.
Y A ,---:',, D -,,
. SD -B1 -
Strongly AgreeAgreeDisagree,Strongly DisagrdeBlank
Item and Significance Test
,
ComponentStudents .
Control-Students
6. I have learned how .to SA 34 43,6 23 28,8take responsibility for ._ A 39 50.0 55' 68.7my school work. D 3 3.8 '2 2.5
SD 2 2.6Z = 1.98, Significant 81
,.
7. In high school I have SA 32 41.0 15 18.8become more confident A 41 52.5 53 66.8.of my school work.
.
DSD
2'
22.62.6
101
12.5-1.2
Z = 3.14, Significant , Bl 1 1.8 1 1.2,
8. My high school program SA. 25 32.0 17 .21.2has helped me make my A 40 51.3 38 47.5lans-for work or co D 11 14.1 20 25.0
loge after high school, SD . 2 2.6 4 ,5.0
/ BI 1 1.2Z = 2.18, Significant - ',
9. My teachers in high schobl SA 41 52.6 8 10.0often usdd a large variety A 25 32.1 29 36.2of teaching techniques ' .iD' 9 11.5 24 30.0such as large 'and small 81)gp6up iastruction, /audio- blvisual, indiiidual pro-jects and student tutors. '
3 ,8.8 , 19 23,8
Z = 6.45, Significant
10. My plans fOr'the first .
year after-high school f
are: .
'
.
, -
work 18 21.4 35 41.6college or other training 61 72.6 4p 47.6marriage; military 4 4.8 .3 3.6Other 1 1.2 1 1.2Blank . 6.0
..
,
Z = 2'.89, Significant
; = frequency2()
-12-

'The results in Table 1-show that Little School students hasa more favorable self concept than doei the control group of highschool seniors. This difference was statistically significant,as measured by the "t" test, beyond the .001 level of confidence.
Table 2 shows the results for each item intht questionnaire.All differences favored the Little School Component over the con-trorgroup. Differences were-statistically significant at the .05level of confidence for all-items except item 3.
These results show the positive effects that the LittleSchool Component has been having on its students. These resultsare loarticillarly grtifying in as much as the majority .of studentsin the control group tended to respond pOsitively to the cuestion-naire with more than three out of four control students markingthe Strongly Agree or Agree response for items 1 -7. Differencesin the Little Schools and control groups_usually were evident inthe number of students marking the "Stroegly Agree" response.
21
f

The following list ranks questions 1-9 in descending order,according to percent differences between the component and controlstudents.
ItemNumber Item
Percent*Difference
-9 My teachers in high school often used a 42.6large variety of teaching techniquessuch as large and small group instruction,audio-visuals, individual projects, andstudent tutors.
5
7
1
I have had good relations with most of 23.9my teachers.
In high schoo have become more 22.2confident of.my ool work.
I understand what my teacher-expects-of me. 19.7
I have a good understanding of how I am 17.3doing in my school work.
6 I have learned how to take responsibility 14.8for my school work. ,
8* My high school progrin has helped me make 14.5--, out may plans for work or college after high
school./. ,
4* --, am very interested in school. 13.4---,
3- I believe I loom how to study` and learn. = 10.0`
*A11 differences are between the percent.marking SA, e cept for,-items 4 and 8 which canipare SA and A.
22,
-14.-

Student Reactions To Thg Little School Component
)
...I
Little Sohool students also completed a brief questionnaip,
to obtain their reactions to the program. The questionnaire wascompleted in May and June 1975 by a sample of 133 or about 45
II
the, component students. The detailed results are Shawn in Ta(Some of the items are similar to those
/
used In the General High,uSchool Program Questionnaires')
Of the students completing the questionnaire, over half hadbeen in the Little School Component for ,;the full three .years,while the remainder split almost evenly.-between 1 and 2 years(question 1). :Overall, about ,64%,of the students rated the Little'School as "much better than the regular program," about 23%rated it "about'the same," and 12% rated Little School "not asgood as the regular Program" (question 15).
Questions 4 through 11 ask about personal scholasticdevelopment, relations with teachers, and reactions to teaching,methods used in the Little Schools. Reactions to these questionsin terms of the percentage of students marking "Strongly Agree"or "Agree" were more positive to the Little School Component thanwas the overall rating with about 71% to 90% reacting favorably.These questioni are presented following Table 3 in rank order ofthe percentage marking "Strongly Agree or "Agree."
Overall,, reactions to the program are quite favorable, withat "least one half of the students and as many as 9 out of 10reacting favorably to the program.' The results shots; improvedrelations with teachers, improved self concepts in relation toschooling, positive reaction to varied teaching techniques, andperceptions of better preparation for work or college after highschool.
23
-15- .44 4-A
1

a -
TABLE 3
LITTLE SCHgOL COMPONENT
STUDENT QUESTIONNAIRE
Item ResponseCategories...
1. How long have youbeen in the LittleSchool Component?
'This year only:Two years:Three years:Blank:
2931730
21.823.354.90.0
I understand what theLittle School teachersexpect of me.
Better than in theregular program:Not as well as inthe regular program:About the tame:Blank:
81
15370
60.9
11.327.80.0
3. I have a betterunderstanding of how Iam doing in my schoolwork,
In the Little SchoolComponent:In the regular.)program:,About the same:
67
27381
50.3
20.328.60.8
4. I believe that the T)Little School hasenabled me_ to study andlearn more.
StronglyAgree:DisagreeStrongly.Blank:
Aire7:
Disagree:
158924,
41
11.366.918.03.00.8
5. My interest in schoolbecame higher in theLittle SchoolComponent.
My relations withteachers seem betterfor itarninglthan inthe regular program.
r
StronglyAgree:DisagreeStronglyBlank:
Agree:
Disagree :,
16'93193
2 .
12.069.914.32.31.5
StronglyApee:DisagreeStronglyBlank:
Agree:
Disagree:
16104'
11"2.
3
12.078.2
2.3
frequency
St. 24

TABL.E.3(2.91_,..liTINUED
.
Item
. -
ResponseCategories
f %
Being in the LittleSchool Componenthelped me takeresponsibility for myschool work.
Strongly Agree:Agree:Disagree:Strongly Disagree:Blank:
201001003
15:075.2.
7.5Q.02.3
8. Being in t4e LittleSchool Component hashelped me be moresconfident of myschool work.
Strongly Agree:Agree:.Disagree :Strongly Disagree:Blank:
20753107
1L0
2.4
;3
.0
5.3
9. I like the variety ofteaching methods(large groups, smallgroups, LAPS, etc.)used in the tattleSchool Col
i
ponent.,
J Strongly Agree:Agree-.Disagree:StronglyDisagree:Blank:.
.
26'
901511
19.57.61:30.80.8
10. Teachers 'n theprogram s-em to care,
,
about me "ore than.
most teac ers I haveknown.
Strongly Agree:Agree: '
Disagree:Strongly Disagree:
' Blank:
31841017
23463.1,7.50:85.3
11. The variety ofv teaching techniques
used in the programfit my needs betteras a student.
Strongly Agree:Agee,:Disagree:Strongly Disagree:'Blank:
17.95
15'24 '
j
12.871.411.3 .
1.53.0
12. Tim much help was theprogram in working. outyour plans for collegeor 'workAfter highschool?
,
A great deal:--Some:None:Blank: .
.
765034
-37.657.1
2.33.0
f = frequency
0
25
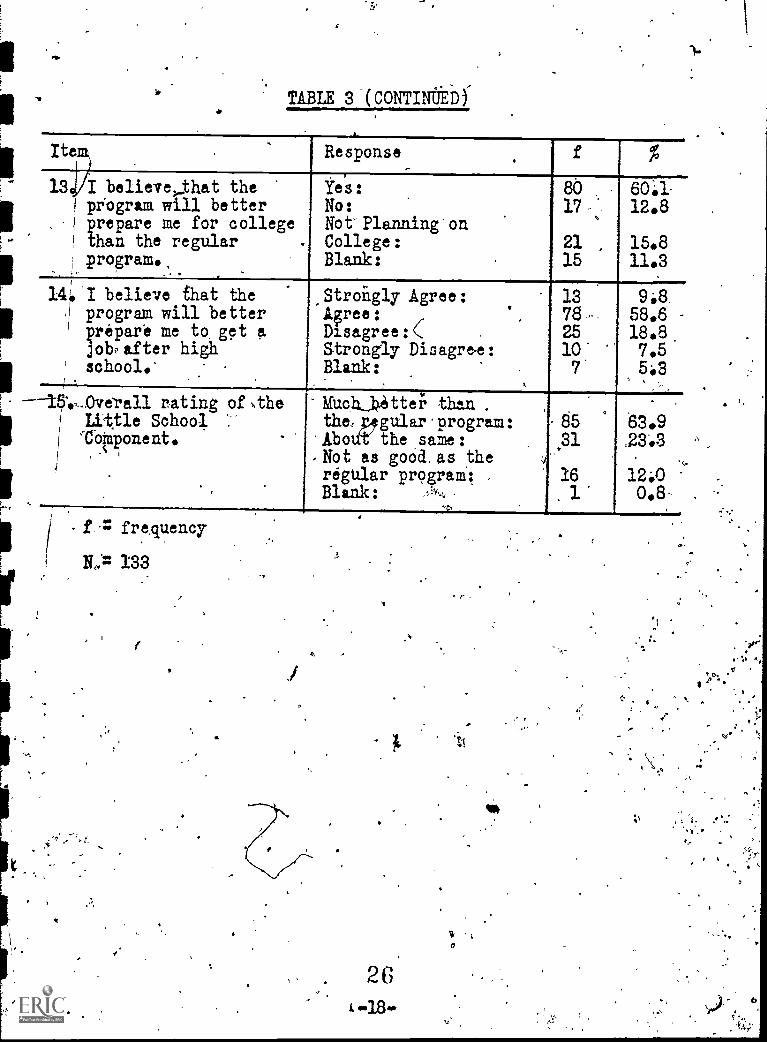
TABLE 3 (CONTINIIIED)
Ite . Response f %
13 I believethat thef program will better
. H prepare me for collegethan the regular
1,program.,
Yes:,
No:Not-Planning'onCollege:Blank:
8017-.
2115
60 1-12.8
15.811.3
141 'I believe that the,11 program will better
Fepare me to get 0.Jobe after highschool.'
Stroigly Agree:Wee: .,
Disagree:cStrongly Disagree:Blank:
. ,
.
1378.
2510'7'
9.8.
58.618.8.7.55.3
-16.,..Overall rating of .theLittle School 1-
ToMponent.
.
, . .
MUchJtter than .
the,
.Abotit'the same:'Not as goad. as theregular program': ,
Blank: ,,'-!,,,
--v
.
.8531
161
63.9,23.3
12.00.8-
-f.= frequency
N,:= 133
261, «18..
Y .
0
J.
;.

.4 ^^
9 4..4
Item .
r.
Percent "Strongly -
Agree or "Agree'
NY relations with tlischers seem better forlearning than'in the iitgular program. 90.2
, ..
Tieing in the Little School Compftent helped me.take nesponsibility for my school Work* , 90.2
I like.the variety of tetc ing methods (large
Av-,
groups,-smill groups, LAPs, eta.). used in theLittle School Component* 8701
Teachers in the program seem to care about memore than most teachers I have known* 86.4
3'
he variety of teachingatechniques Used in thepiOgram fit my heeds better as a student.
, 84.2
My interest in schoOrbecate higher in the'Little School Component. 81:9
I believe that the Little School has enabled ntto study and; learn more. 78.2
Being in the Little School: Component has 'helpedme be more confident of my school work. 71.4
Absences:
Absence records were maintained by the. Assistant=ProjectDirector for the period October 1, 1974 thxough Larch 11, 1975.Foe'comparison purposes, 'records for 9 randomly selected Com-ponent and 9 randomly seleoted Non-component sections weremaintained. TIe sections in each group averaged 30 students fora total of 270.students in the Component and Non-component groups.'The month of September was omitted as there was a great deal ofshifting.of students among the sections, Absences were recordedevery 8 to 10 school days. Mondays and Fridays and weeksincluding holidays were not included as these are the pooreSt.attendance z BeCause of these omissions and the variationin" the time period (8 10 'days} aver which' absence records were,.
27
-19-
4.

1
;
err
maintained; it is not possible to obtain an index of absences perschool day However, since the number of sections <9) and thetotal number of students in each group (270) are the same, acomparison between absences can be made° Table 4 shows theresults of this analysis. Overall, the Non-component group hadmore absences than theComponent groups. The difference wasgreater during the period preceding the Christmas holidays°
This lower absence rate for the Component groups issupporting evidence for; the effectiveness of the Littl Schoolsand is consistent with the findings of reports for the twopreceding years°
i.

TABLE 4
CCMPARISON OF ABSENCES FOR NINE
_11
11~
Ira
OIN
OM
IOCOAPONENT AND NINE NON-CCUPONENT
SECTIONS
Time
,
-,Period
Component
Sections
Non
.Component
Sections
Difference
NI
%Chi
Square
Signif-
icance
(Alpha)
Oct. 1 --Dec. 3, 1974
312
376.i
64
20.5
5.95
.
Yes-.025
Jan. 7 -March 11, 1975
374:
366
22
5.9
0.63'
No
i.
Total Absences
686
7.72
86
12.5
5.07
Yew-4026'
Number of Students
'
270
270

Standardized Test Results
Scores of the Preliminary Scholastic Aptikude Tests (PSAT),taken in 197344 as juniors,- and the Scholastic Aptitude Tests(SAT) .taken this year as seniors, were obtained for those studentswho took the test. The students taking each test were then. groupedinto Component students and Non- component students. These tests wereused in place of the California Tests of Basic Skills which, werenot given due-to a test administration oversight.
Comparison of PSAT and SAT results can provide insights intogains in scholastic aptitude for the Component and Non-componentstudents over a two year period. The tests are measures ofschola6tic aptitude oriented tauard college bound students andare considered by many colleges in their admissions and placementprograms. Although only a limited number of students at Woodsontook the tests, the results (in the absence of a general achieve-ment battery) can provide': insights into the academic progress ofstudents in each group.
The tests are parallel in form and structure and can be'compamd as pre7tests and post-tests. -The.PSAT is administeredin the junior year to.provide student's with an opportunity tobecome\familiar with these tests. Table 5 shows the results forthe Mats scores of the PSAT and SAT, and Table 6 shows the resultsfor the Verbal scores. The score ranges for each test are presented-in parallel at the left of each table to make easy the comparisonof the PSAT and SAT results'fpr the Component and Non-componentstudents. Comparison of selected features of these tables indicatesthat Component students achieved greater progress from the PSAT tothe SAT than did the Non-component students* The data at the bottomof each table shows that the percentage of students who scored35 or highei on the PSAT or 350 or higher on t4g SAT in6reasedfor Component students (16.3% for Math and 10. fo Veroa.0but decreased for Non-component students (decrease of 4.8% forMith'KET67775 for Verbal), suggesting,a larger gain for theComponent students. In both Math and Verbal scores Componentstudents had a smaller percentage' scoring 35 or above on the PSAT(for Math, 18.11. 77 students vs. 34.3% of Non-componentstudents; for Verbal; 20.5% of Component students vs.' 32.9% ofNon-component students).' However, the opposite was true on theSAT taken one year later. On the Math SAT, students scoring 350or above. was 34.4 %'for Component' students and 29.5% for Non-component students. On the .Verbal' SAT, 30.6% of Componentstudents vs. 26.2% of Non-component students scored 350 or higher.
30v.
-22-
4.

-t
Although these differences in the SAT tests favored theComponent students, the differences as measured by the z testmere not statistically Significant.
The z test of statistical significance showed significantgains (5% level .of confidence.0 higher) for the gains of theComponent students for Math and Verbal scores and for PSAT Mathscores of Component vs. Non - component students. The remainingdifferences were not statistically significant. The trends inthe data support the conclusion ti*t. Little Schools was havinga significant impact on the achievement of its students;
(It was not possible to match individual PSAT and SATrecords from the available data. The method of using the per-centage of students above 35 on the PSAT and 250 on the SAT wasused because means and standard deviations would be seriouslydistorted by the highly skewed distributions. The scores of 35and 350 are one score category below the national means o 40 onthe PSAT and 400 on the SAT..)
The number and percentage of students who'took the MAT,and SAT is of interest when considered as an indicator ofstudent interest in attending college, as many colleges considerthese tests in their admissions programs° The results show(Table 5, item 3) that Component students seem to be less orientedto attending college (at least those colleges requiririg-The PSATand SAT examinations) than Non-component students, About twiceas many Non-component students (244) as Component students (12%)took the SAT, while an equal percentage (15%) of both groups,took the PSAT.
1
31

'O
TABLE 5
o.
PSAT "AND SAT MATH SCORES OF COMPONENT
AND NON-COMPONENT STUDENTS
Score Rance Component StudentsSATE
NonPSp.:_r4-MaiLl.r:_
- Component Students
flPSAT 1 PSAT*
f % .f tl
65-69 650-699 1 0.8
60-64 600-649 - -
55.-59 550-599 , 1 0.8
5054 500-549 2 .4.5 '1 2.9 1 1.4 . 1 i 0.8
45-49 450-499 - 1 2.9 2 2.7 - ..
4Q-44 400 -449. 4 9.1 3 = 8.6 8 11.0 8 6.8
35-39 350 -99 2 4.5 7 20.0 14 19.2 24 20.8
30-34 300.-349 12 27.3 6 17.1 13 17.8 29 24.6
25-29 -,250-299 14 31.8 15 42.9 20 27.4 47 39.8
20-24 200 -249 10 22.7' 2 5,7 15 20.5 7 5.9
Total 44 -99.9 35 100.1 73 100.0 118 99.8
1. % of students.scoring 35 orabove on ?SATand 350 orabove on SAT. 18.1 .34.4 4 34.3 29.5
2. % Difference, ,,
PSAT TS. SAT. 4.16.E
S. % of students.
.
taking test. 15 '12 15 24
z test of.sig- 2.43 2.02 0.76 0.54 ,
Ilificance ,Sign.'''. Sign. Not Not
Sign Sign.
1 ,
* PSAT taken'as Juniors in 1973-74..
Of* SAT taken as 'Senidra in 1974-75.
-24- 32,

TABLE 6
PSAT AND SAT VERBAL SCORES OF COMPONENT
AND NON-COMPONENT STUDENTS
Score RangePSAT SAT
.Component Students! SAT **
Non-Component S u en sPSAT* SAT**
60-64
55-69
50754-
45-49
40-44
35-39
30-34
25=29
20-24
600649
550-599
500 ..549
450-499
400-449
350-399
300-349
250-299
200-249
Total
1. % of studentsscoring 35 orabove on PSATand 350 orabove on SAT.
2. % Difference,PSAT vs. SAT.
0.8
2.8 2 2.7
3 6.8 2 5.6 3 4.1 2
0 0.0 OM SO 3 4.1 3
1 2.3 3 8.3 8 11.0 .11
5 11.4 5 13.9 8 11.0 14
9 20.5 8 222 16 20.5 28
14 31.8 7 19.4 15 20.5 27
a2 -27.s 10 27.8 19 26.0 32
20.5
4.10.
30.6 32.9
-6.7
1.7
2.5
0.3
1.9
3.7
249
7.1'
949
126.2
z test of sig-nificance,
'3.511Sign
* PSAT taken as Juniors in 1973-74** SAT taken as Seniors in 1974475.
-25=
33
1051 0.0E 0.51Not Not, N9tSign. Sign. Sign.

ti
Considering the results of the standardizedcte s used inall three years, and positive results Of school gradps last year,Little Schools seems to hAve made a significant impabt on studentachievement. Use of a wide-range standardized achieaement batterywould probably bring outthese gains in achievement'Auch moreclearly. With a new group of students, entering thelittle Schoolnext year, it is essential that a nerYtest battery be included inthe project evaluation. The test battery should include scores inacademic areas in which Little Schools has been active, as well asin basic skill areas of reading and mathematics. The SequentialTests of Educational Progress proved useful in-the first year ofthe project and should be reconsidered. The Educational Develop-ment Series published by the Scholastic Testing-Service might alsobe examined. It provides scores in Verbal and 'ton Verbal -Abilities,'Reading and English (Language Studies), Math and Science (TechnicalStudies), and in Social Studies. Individual parts of the totalbattery may be selected and a number of composite scores may beobtained.
The Individualized Giarriculum FOr The Little Schools Component
Individualization as deveilped for the Little Schools com-ponent has emphasized the redel4lopment of courses within thecurriculum to better acgommodate individual needs and differences.The basic framework for the redevelopment of courses within LittleSchools has emphasized the development of Classroom t:ana2emeAtsystems (CMS) and Learning Activity Packages ( Ps). Staffdevelopment activities for several years have mphasized trainingin these and other areas. Classroom Managemen Systems include arationale, objectives, learning activities, physical classroomlayout,-media/equipment to be employed, criter on tests andmethodsof progress assessment. Learning Acti ity Packages arestudent oriented instructional packages design d to guide studentsthrough a series of instructional activities.
Table 7 shows the range of subject's and c ours es for whichCO and LAPs have been developed and.a rating by the, ProjectDirector of the current status of development of CMS and LAPs.A wide rangy of courses have been developed in individualizedformat, with a judicious concentration on_' required courses aswell as electives. ,Those subjects rated only 'fair" in theirdev6lopment were "generally-thuse that were-----lowes-t-In priorUsanterms of immediate student needs. Teachers working on selOralsubjects therefore concentrated on those in which componentstudents were to be enrolled.
34-26-
Hi

Plans fOr further development; according to thei.ProjectDirector, include as a first priority improvement ini theavailable course packages; coarses in physics, advan'ped bio-logical science, shop courses,- home economic-s, dietetics,Black history, law, geography, and remedial courses in readingand mathematics.
`TABLE 7
CURRENT STATUS OF INDIVIDUALIZED COURSE DEVELOPMENT
S a us of aateria sDevelopment -Classroom Man.s7g4-ppi rAv.-
English Require three years-IOth Grade for college prep-llth Grade aration12th Grade
Social Studies10 - World History11 - American History
. 12 Government
Two years required
Sciences , One year requiredEarth Science
_if not taken in the
Biological_Science 9th gradeChemistity -
Foreign Lariguages ElectivesFrench , -
.
Spanish
Business ElectivesOffice MachinesBookkeeping andAccounting
Art Elective.'
,
Fair-Good
Good
FairGoodGood
Fairlery GoodTery Good.
Good
oil
fa:
-17

Nacher.ReactiatISATo The - little School Component
Data on teachers activities in the Little School Componentand their attitudes toward the provan were obtained from ateachers questionnaire. The questionnaire was designed to obtain ?
information in two areas from don-component as well as Componentteachers. The two areas to which Non-component teachers respondedwere: question '0 - variety of teaching" methods and materials usedand question 4 - ratings of their students. In addition, Componentteachers were asked to rate various aspects of the program andto indicate- areas of individualized instruction for which theyfelt additional staff development may be needed...
The questionnaire =was compted'by 11 of 14 Componentteachers and 30 Non-component 'teachers in May and June 1975: Thethree Component teachers who did not complete the Questionnairewere not available due to serious illness or unavailability.
ti
Of the eleven Component teachers, 6 had been teaching in theLittle School for all three years, 4 teachers for two years, andonly 1 teacher within the current school year.'
Teaching Methods
The detailed data showing the varied teaching techniquesused'by Component And Non- component teachers is presented inTable 8. A number.of important points about this data are alsosummarized in Table 9.
There are a number of observations that should be maderegarding the responses of Component teachers' (Table 8). First,Component teachers as .a group used the entire set-of teachingmethods and materials,.and used them to a greater extent than didNon-component teachers.
Rarely did Component teachers indicate that they "Never"used the teaching method: Only four items were so marked(never used) as follows:
e. Mini-units 1 teacherq. Team teaching 2' teachersr. Prbgrammed instruc-
tion materials 1 re7.czher,`s. Teaching machihes 3,teachers.
)
mr.
3
-28-

TABLE 8
r
TEACHING METHODS AND MATERIALS USED BY COMPONENT
AND NON-COMPONENT TEACHERS
Component.Teachsrs
Non-component Teachers
'
Item
,
Very
Often
Often
Same-
times
Never
Vity._
Often
........--......7...--.......,...1...
12
40,0
8
26.7
1136.7
826.7
310.0
Often-times
826.7
1136.7
11
36.7
8,'
26,7
9 30.0
Some
620.0
7
23.3
8.
26.7
11.
36.7
1343.3
Never -o-r---
Blank
... .._
4..
13.3
,-
413.7
. - 11, ,...
,,,,
10.0
516.7
11. -.
Large groups
.
4
/
b.
Small grotips
/
9:
Audio-visuals'
.
(1.
Learning Activity.
Packages
e.
Mini-units-
f % f % f'
% f % f %-
436.4
7
63.6
654.5
327.3
3-
27.3
4 36.4
4 36.4
5
45.5
545.5
218.2
3
27.3
- -. 3
27.3
,5.
45.5
..........--.
- - . - - - . - 1-
9.1
f.
Contracts,
-
.
`\
g.
Study guides ,.
h.
Work sheets
i.
.0pen classroom s,
j.
Peer'facilitatoft o
youth teachinekout
f % f % f % f % f %
1 9.1
7_____
63.6
7
63.6
7.
63.6
436.4
1 9.1
218.2
4 36.4
3
27.3
5
45.5
9 81.9
___2
18.2
- 1 9.1
2
18.2
--
--- - - - -
.
. - -
310.0
15
50.0
1446.7
413.3
620.0
620.0
723.3
10 .
33.3
930.0
1550.0
1343.3
620.0
6-
20.0
10 33.3
7
23.3
8
26.7
2 Da
.-
t'i.
23.3
2.
6.7
f = frequency
N = Component teachers - 11;
Non-component teachers - 30
Percentages add .to 100.0 within rounding
error.
\ ,
144

-...r
-rem
ir-e
m--
"-vo
r-A
NN
UU
Aga
na M
ama
Item
TABLE 81CONTINLiE11)
Component Tea
Very
Often
Often
chers
Non-componentTeachere
Some-
times
Never
Very
Often
Often
Some-
times'
Never or
Blank
k.
Independent study
1.
Criterion refer-
enced testing
m.
Student
assessment
n.
Teacher-student
planning conferences
o.
Student oriented
objectives
p.
Student developed
objeCtives
14!
f f.
f
436.4
486.4
654.5
1 9.1
545.5
9.1
545.5
'4
86.4
436.4
545.5
545.5
327.3
2 18.2
327.3
1 9.1
545.5-
o 1 9.1'
7VP4
63.6.
enb
SO
516.7
310.0
10
33.3
6,
20.0
14
46.7
930.0
16'
53.3
10
33.3
13
48.3
13
43.3
620.0
9,
30.0
930.0
r. a.
Team teaching
Programmed instruc-
tion materials
Teaching machines
f 4 f
3.
-27.3
1 9.1
1 9.1
1 9.1
2-
18.2
,
1- 9.1
436.4
.7
63.6
6
54.5
2.
18.2
327.3-
.3
10.0
413.3
413.3
89'
26.7
30.0
25
6.7
16.7
-
16.7
330.0
10.0
15
850.0-26.7
11
536.7
16.7
812
26.7
40.0
.
11
36.7
16.7
5 9
,f ; frequency
N = Component teachers'- 11;,Non-component teachers---80
Percentages add to 100.0 within roundingerror.

,. -,,, ,o , ,, ,, . ....), .. .....) , . ... _ , A.. -or ..:., - . , . . it "5 sn i ,-
Programmed matt ials and teaching maghines have natwbeeri-iemphasized in the Li. tie Schools, and a stfuctured program oftegs,..1cA,ching has be n undertaken only in certain subjects.There ore, one woul expect.that some Component teachers mightnot have used these approaches.P.
In contrast, some (from 2.- 15) Non-component teachersr4orted never using 14 ot 19 of the teaching methods listed{Table 8). The four teaching methods that wore used at least"Sometimes" by Non-ebmponent teachers were: c. Audio-visuals;h. Work sheets; k. Independent study; and n. Teacher-studentplanning conferences. 1
I
I
Second, the /teaching methods that Component teachersreported using,"Very Often" reflected methOds emphasized byLittle Schools. The methods marked by a majority (50% or more)of the Component teachersias used "Very, Often" ware:
- b. Small Groups 7 teachersg. Study guides 7 teachersh; Worksheets 7 teachersi. Open Classrooms 7 teachersc: Audio-Visuals 6 teachersm. Student assessme t a teachers.
In contrast, not even one teaching method was marked"Very Often" by a majorit of Non-Component teachOrso
Third, a larger percntage of Component than Non-oomponentteachers marked most teaching methods emphasized biLittle Schoolsas used "Very Often" and/or "Often"; Table 9 shows this contrast.Fourteen of the 19 teachilig methods were marked by a largerercentage of Component t an Non-component teachers as use4 "Veryten' or "Often" (items m rked X in last two columns). Tho
remaining five teaching m thods wore used by a larger pe4entageof Non-component teachers Two of these items (r. ProgrammedInstruction Materials and s. Teaching Machines) are not emphasizedby Little Schools. The o her three methods (f:.Contracts,n. Teacher-student planning conferencesand p. Student developedobjectives) may have been-adopted by many Non-component tetche
as used
as a result of'experiencesthem elsewhere. It must aof its preparation many Nostaff development, innovatProject Director (who is aSchool efforts to introduce varied teaching techniques have also hadan impact on No component' teachers. If not for this, the difference.might be even larger.
with Little Schools or ekperiences, ithso be emphasized that in the three years-component teachers have benefitted from'ye practices, and the example of theso an Assistant Principal). The Little
39-31-
, 0,41. 41-

The fo th and 2331 1 oint related tioea.plt..-that rera to certatn' liod.b'empla161,zect -by Little ,Schools.that.that-'have not been used Very Often or 'Often". by Component'teachers.
TABLE ,9
'TEACHING METTAODS AND MATERIALS USED ."VERB[ OFTEN"OR "OFTEN",
BY COMPONENT AND NON-COMPONENT TEACHERSI
Item.
Componentleachersf I %
Non - Component
Teachersf 1 %
Usedby:C
Mare%
1 2! NC
a; Large groupsb: Small groups'64 Audio-visuals3a. Learning Activity
. Packages' ''
8; Mini-units'fi Contracts'g:, Study guides'h. Work sheets'..1.; Open classrooms3-j. Peer,facilitators-or
youth teaching youth.'k. Independent study 31. Criterion referenced
testing3 -
m: Student assessment'n. Teadher-student planning
conferences.' \
0. Student oriented
p. Stude .e eflopea. objec.ives3'' '
q. Team teachiner. Trogrammed-insti'uction
materials , .
s. Teaching machines
8
1111
85281110
99
810
6
10
4*4
32
72.8100.0100.0
72:845.518.281:8
103:089.9
81.981.9
72:8.90.9
54.6
90.9
86:436.4
27:318.1
2019'
22
16129
222413
2121
1323
19
20
187
1410
j 66.763.473.4
.
53.4'40:030.073.379.943.3.
70:070.0
43.376.6
63.3.
66.7
60.023.3
46:633.3
X.XX
.xX
XXX
1. ''
X
!X
X
.,
X
.
X
X
.
.
.
.
14,Sign test signi/;
Icant
at the 1%, level of confidence.
N = Component Teachers - 11; Non-Component Teachers - 301- from data in Table 8:,.- X in the C colun.indicates that a larger percentage of
Component teachers used the method; ian X in the NC column -indicates that a ldrger percentage of Non-component teachersused the method.
P
N1°
3- Methods emphasized by *tie SChbots: w
i -32- - 40

4
P
Methods emphasized by Little Sch6Ols that halen't Veen used."VerzOften"a by Component teacher's incl et: -
.
-f,. Contracts .ki:.teachers used "Very Often" Of, "Ofteri"
*1
4. Student Developed 4*e- . .
Objectives -' -. 4 teachers used - "Very Often", or "Often!
,,,-. ei'. Mini-units ' 5- teachers used "Very Often"-or "Often"...
4ftwl., Teacher-Student = ,. ,...
er -planning , -i
:,';;.
_ - conferenc4s 6 teachers used."Veryi0ftee or "Often`.';
) 1. Criterion ref- (all should do so) .
,
.
erenced testing 8 teachers used ."Very'Cften"..dr."Cften"(all '.should dposo)e . vs.
1,, Considering the emphasis placed on these methods in.itiff, .
development, more extensive use of themoyComponent teachers Should
be expected. The Little Schools'staff should review these findings
fromithe point of view,of the apprbpr.iateness of using these
methods in.theii, courses more.oftenp. . .
A - .
. ,
In summary, the results of these data show the wide varietyof teaching methods and materials used by Commonint7teachers,
The'sign test was used" to test the. statistical significance ofthe differenCes,between Component :and Non - component teachers in
i response to these questions (Table ). Differences" in the per-
bebtages; between the'Componeut andlon-component teachers were
marked "plus" if (1) the, difference:favored Commonent teachers onmethods emphasized by Little Schools, or (2) in methods not
. emphasized by Little Schools differences favored Non-comp Eent
teacher's or there was no difference. Differences in Dercentages,
were marked "minus" if differences favored Non-caponent teachers,A.for'methods emphaiized by Little Schools, With 16 "pluses' and-3
"Minuses" (items f, ,v. and p) the sfgn test is significant at the
IX level of confidence.,
1(
15,
O
0

_Participating Component teachers-were askedto rate .theirteam teaching experiences. As shown in Table 10, the sixparticipating teachers rated their team teaching experiences-favorably...
TABLE 10
PERCEPTIONS OF TEAM TEACHING EXPERIENCES
OF SIX COMPONENT TEACHERS
Iteia-.,, .
1
D .S1) B1
a. Team teaching gives more time.for preparation: and planning.
,
b. Students benefit more frompresentations by trilYteachers.
,
tUdent grouts are too largein team teaching.'" c-I
-d. CoordinationGwith the other. -member offty team is a problem.
2=
0
s 3
2
0.-
0
.
0
-#'
.
1
0
1
02 f
10
Key: SA - Strongly AgreeApee
D DisagreeSD -.Strongly DisagreeBl - Blank
Teacher Ratings of Their Classes
Canponent and Non-component teachers` were asked-to rate theirclasses in 10 areas emphasized by the Little School Component.Eight of the items request ratings of the. students (a - e, g - i)in'their classes. One item rates studen'Oeacher communications (f)and odeltem (j) was included tb cross-validate teacher perceptionsof the variety of teaching techniques used...Five items f, g,h, and i) were included:that* were similar td items asked of studentsin order to compare student and teacher percptions.
The results are shown in. Table 11. Comparing the ratings ofComponent and Non-component teachers' shows thai:in.overy case theresponies of'Component'teichers were, more favorable (_"Strongly Agree"or 'Irgreits") than Non-component teachers. tSing the. sign test, with
0C

10- luses" and no "-minuses" the differences in the ratings aresignificant at 'the 1% level of confidence.. Overall Componentteachers hold a more ,favorable opinion of :their classes.,
All 11 or 100%.of the Component teachers marked "StronglyAgree" or "Agree" to the following four statements:
--Students In MY classes work readily in groups;--The "quality of student participation is good -- they ask ':-. ==
intelligent questions, discuss an issue-completely, and -----give complete answers;,
--Students accept responsibility for their school work;use a large variety of teaching techniques in my classes.
, Particularly notewOrthy is"the finding on the qualityofstudent participation and their acceptance of responsiblity for-'their Schoolwork, twoar,eas of great importance in academic andpersonal growth:and development. Four.Component teachers and17 Non-component teachers disagreed with'the statement (h) thattheir students have ;ood study habits. This problem should begiven'further attention by both teachers and counselors.
It should' be noted that the majority:of Non-component teachersmarked "Strongly Agree" or "Agree", to,9 out of the 10 items,making' the differences between Component teachers even morenotable.
k
The results of the cross-validation item (j) regardingteacher perceptions of using varied teaching techniques shows theTalidity of listing the teachingj-echniqaes used. All 27 Non-component teachers who answered the question agree with thestatement that they use a large variety of teaching techniques.However, they tended not to use many of thjai- tedhniques isted.(See previous section.)
43-35-
t
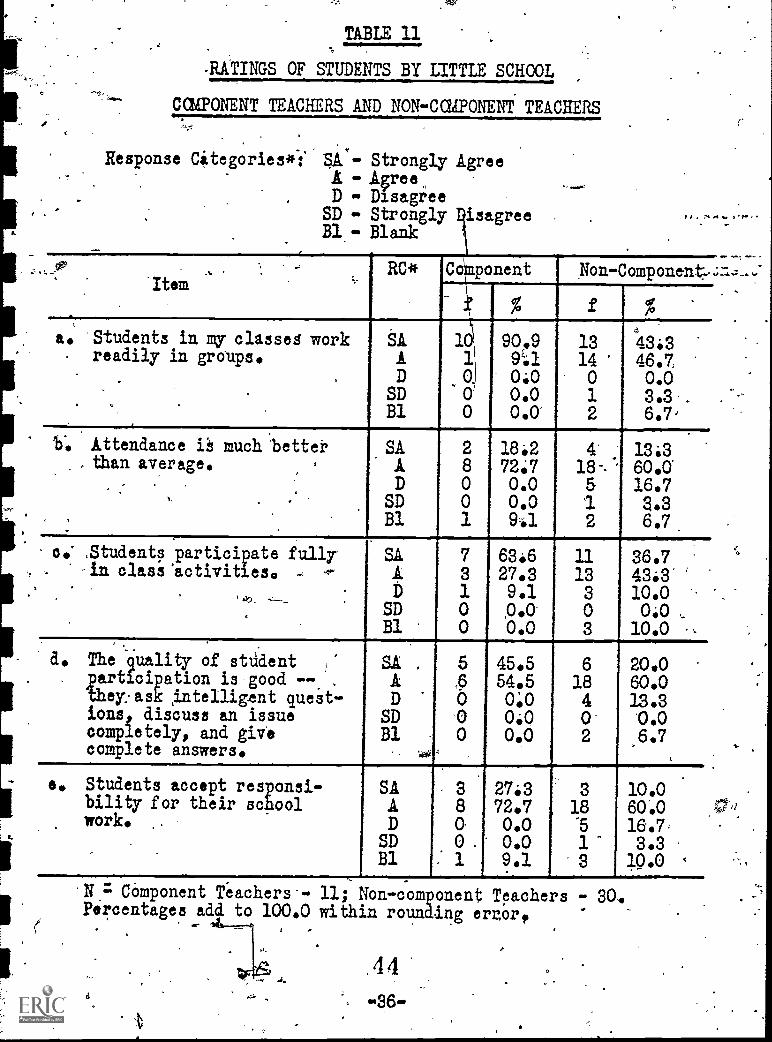
TABLE 11
UTINGS OF STUDENTS BY LITTLE SCHOOL
COMPONENT TEACHERS AND NON-COUPONENi TEACHERS
..
Response Citegories*: SAY- Strongly AgreeA - AgeeD - Disagiee
,
BI - BlankSD - Strongly sagree
.I . 74 04 a.
,... -
.
Item..
RC* Co ponent Non-Component.-
a. 'Students in my classes workreadily in groups.
.
SiADSDBl
11:1
10
-00
90.99:10:00.00.0'
1314012
4
43:346.70.03.3'.6.7w
b. Attendance iS much 'better,than average. ,
..
..
.. ,
SAADSDB1
28001
18.272.70.00.09 -1
4'
18%'512
13:360.016.73.36.7.
c.' .Students participate fullyin class'activities. -
,,_
SAAD
SDBl
73I00
63:627.39.1,0.0-
0.0
1113303
36.743.3' '
10.0 --
oio10.0
d.',.
.
The quality of student i"
participation is-good -- .
they: ask intelligent quest-ions, discuss an issuecompletely, and givecomplete answers.
SAAD
SDBl
5.6
0-0
0
45.554.50:00.00.0
61840-2
20.060.013.30.06.7
,
e. Students accept responsi-Malty for their schoolwork. ..
SAAD
SDBI
380'
0 .
: 1
27.372.70.00.09.1
318'5
1''3
10.060.016.7:3.3
10.0
N = COmponent Teachers-- 11; Non-component Teachers - 30.Percentages ads to 100.0 within rounding ernort
.44-36-

TABLE 11 (CONTINUED)
Response Categories *: Si - Strongly AgreeA - AgreeD Disagree
SD - Strongly DisagreeB1 - Blank
Item
.
,
RC*
.
Component Non-Component
f f. %.
f. .Communication betifeenstudents and teacher ismore than satisfactory.
SAAD
SDB1
:
73001
63.6:27.30.00..0
4 9'.1.1.
12132-
-,03
40:043.3-6:70.0
1040
g. Students are very interestedim.their school work.
.
..
SAADSDti.
4'6100
36.454.4-9.10.0.
0.0
5
16603
'16.753:3'20.0loio
10.0
.. Most of,my students have ,
good study habits. f
,
SA ,
'.Ar' D'
SDBl
.6
'7
. 40.0
0.063.636:4 ,
0.0'
,0.0
29
1702
6.7.,30.0 :----
56:60.0
.5.6./
ie.
.
Students seem to be ''''--
confident of their school.Work.
, . ,
SA'AD
SDBl
. 2720"0'
18.263.618.20:0.
0.0
312120
'3'
10.040.040.00.0
10.0.'.., ,
j. I Joe a large variety of-teaching '4011.0qt-toes La.my 043863:
. '
.
.
SiAD
SD.B1
6-5000
54.545:50.00.00.0
189
tl
0= 3'.4,
60.0$0:0oio
,0:0-110.0
Sign test significant' at the 1% level of confidence.'
N = 'Component Teacher 4i 11; Hon-como4nt Teachers - 30.Percentages add to 100 iithin rounaing irror.
45
-37-
t '

0
4.
Table 12 compares the perceptionS of-Little School studentsand teachers in certain areas. Student data was taken from theGeneral High School Program Questionnaire. While all ratings,are generally; favorable, a larger .percentage of teacherd thanstude -ts (63.6 vs. 53.9) "Strongly .Agrie" that student-teacheicommaleftions have improved. Students, on the other hand, moreoften see themselves as acceptihg responsibility (43.6% Ys. 27.3%),having. good study habits (50.p% vs. 0:0%), and being confidentof their schoolwork (41.0% TS. 18.2%). Students and teachers heldsimilar perceptions of the studentst_interest in school.
TABLE 12.
COMPARISONOF LITTLE SCHOOL STUDENT AND TEACHER PERCEPTIONS
Item Description RC* Student .
Perceptions'TeacherPerceptions,
1. Students acceptresponsibility.
SA. A0
43.650.06.4
27.372.70.0
2.
,
Interest in school.' , SAii0
.
,34:6
14.1
7 36.4
9.1
.
.,,
3. Study Habits:It,
SiA:0
.
50.0.46.13.9
- 0.063436:3'4 .
4. Student Confidencein school work.
SAA0
41:052.56.5 .
. 18.263.618.2 /
. 5. Stude t-teacheroomm ication.
4
' .
SAA0 '
53041.05.1
1 63.627.39.1
.
. . .N 78 11
* Response Categories: 'SA - Strongly AgreeA - Agree .
..,,:..1.,--,. 0 .. Other (Disagree,'Stron:gly Disagree,..7or BIlank)
1 - krmn Goner )Bigh School 'ogram Questionnaire

,. Staff Development
An important pert of the Little Schools program is thetraining of teaching staff in the development and application ofindividualized methods of instruction. Workshops have been heldeach year emphasizing selected topics in individualization andhumanistic teaching; selected staff have visited a number ofschools with exemplary individualized programs; and inservicetraining has been.a continuing and ongoing process under theleadership of the Project Director and Assistant Project Director.
The importance of a sound staff development program to thedevelopment of an exemplary program of individualization cannotbe emphasized too strongly. The Project'Director holds the'point of view that Staff Development is the key to a successfulprogram and that it must be continued over an extended period,at least three years, to be totally effective. Furthermoi,e,workshops and related time are also needed for developing'individualized materials in order for Little Schools to properlydischarge its function of disseminating program information tothe interested educational community.
Based on experience in developing, implementing, and evaluatingindividualized programs, this evaluator concurs with the opinionof the Project Director of the key role played, by a sound staff-development program 'and the need for released time.and/ar workshops to develop or assemble instructional packages. Withoutthese developmental opportunities most individualized programsflounder. Time limitations, furthermore, seriously limit the,quality; usefulness, `and exportability of 'the project experience.
As the project was in its third year and 10 of the 11teachers had been with the project for two orthree yeArs, it was,decided to assess staff development in terms of continuing_ needsof teachers in the development of additional competencies invarious areas of individualizednstruction employed at the .
Little School. Their responses could also be compared to theteaching methods- and techniques used to' provide a basis forfurther consideration of staff development needs.
Component staff were asked to respdhd to the statement:"Based on the workshop, staff development, and other experiencesplease check the areas in which you feel competent and those inwhich you feel yoli need further assistanc64" The results are
, presented in Table 13. Those areas marked most often .as those
4
4 7
-s96
1

in which teachers need assistance.are: s. Indexing and classify-in& learning materials for ability levels 1,60;Tp. Student deielopedobjectives. Those areas which may require `further attention,mostly in individual cases, are those areas in which 8 or moreteachers felt competent, including:. c. Large group instruction,d. Small group instruction, e. Mini-units, g. Study guides,h. Work sheets and k. Independent study. (Those who left theitems blank may have felt that an intermediate response was neededbetween 'competent" and "need assistance' that would reflect aconsolidation through experience of developed skills. If this'is the case, it is most appropriate to consider no response as,requiring further staff development and/or experience.)Comparison to Table 8, however, shows that Independent studywas not used very often by many Component teachers and shOuldtherefore be added to the list of those areas considered forattention in staff development. These areas are marked inTable 13.
4
is
741
48
7
o 4

TABLE 13
STAFF,DEVELOPMENT ASSESSMENT
XND NEEDS ANALYSIS__.--
__, .
.,
.
1
'IF
Teacher Perceptions Used Considerfor StaffDevelop-mentZ
.
..
,Comp-etent
---
NeedASsisLancet
Blank.
.
VeryOften
1
a. Developing classroom-- management system .
:
b. Developing lea/ Ting'materials
a: Large group laistructiond. Small group instruction
jai Mini-units-(1: Contracts_. g. Study guides-h7. Work sheetsLi-Open classrodm.j. Peer 'facilita'orsiciIndependent s udy1. Criterion reierenqed' testing
.14-Student asstrmneiTtn. Teacher-stud.nt
planning'co erences ,--o. Student orielted
objectives ,1
p. Student developed,, " ,
objectivesq. Team teaching,
_
ri Teacher advisor roles. Indexing And Clasiifying
learning materials forability levels ,.
'
...
t
6.
698
-85886 =7
8
7-5
6-
6
476
2
2
301031131.1
23
/,.
.
3.
-2'2,2 --3.
3 -7-2,2
--2---,
3
,
NA
NA47
31 -17
74
i
.
.
X._
4 ,
XXX
XX:'
1
X
/L'
XXX
4,__.--:.very
?2_2
4
-A.6
12
2
5'23
7
2
2
.2--22
2
.5
1--.3NA'
FA1 - Nrrmllar, nf.i-panhPrA inAinAtintr they used AlS methodN s 4 Component Teagiera
X in thit coluan is_based on the perceived needs ofteachers for staff development (the number of teacherswho "need assistance" ,or left the item blank) and theactual use of the teaching method (number who used-themethod "very often").
NAM item not asked.49
often".

n.
Component Teachers' Evaluation Of Little Schools,
An eleVen component te.a,chers indicated that support servicessuch as supplies and eauiPment "need impgovement," a matter thatwas underscored continually by the Project Director and all staffmembers interviewed by the evaluator:. Serious problems have beenencountered in filling orders for audio - 'visuals and other equip-ment needed for the project and the lack of budgeted secretarial...assistance. In priipiring for dissemination activities, .improvedduplicating equipment will also be needed (Table' 14).
With this exception, Little Schools is given high marks bypartib sting teachers. Particularly noteworthy are the highmarks fob interpersonal relations among staff and students with9 teachers marking "good. "}
,
Teachers written comments are summarized ii-Table 15. Thetable sumniarizes the teachers views of the, strengths and weak-nesses. of Little Schools sand ways in which it could be draproved.The strengths listed. amplify s.nd support data presented. earlier,emphasizing ,staff, relationships, improved teaching methods, andbenefits for 'students. The Weaknesses and suggestions forimprgiement focus, as before, on the inadequacy of materials,supplies', funds, 1 and typing. and clerical assistance. Additionally,a full-time dire6tor or assistant director was recommended. Soneteachers, also .expressed the need for additional time for planning,preparation, or for meeting with students and'parents.
-42-
o t

TABZ94
TEACHER EVATAION OF
LITTLE SCHOOLS
G*da!eblt;leiPt-
Needs .Blank
I
ment
ai Planning and .Communicationsb. Schedulingc: Team Operationsd. Support services (supplies,
/AquipMent, etc.) ..
e. Cooperation from the,administrative staff
f. = Relations among coMponent-staff
g. Student/teacher relations.
.6
-56
0
7
99 -4
,
5
-4.3
0
2
/
120
11
0
00
00,2
0
2
. 22
h. Comparing.this year to last year, the-operations--School Component are: 2 - much better;
t. 5 - better;-. .
2 - about the same;0 - not as good;--2 -,Blank.
i. Overall rating Of the Little School Comppeht:.
3 - Outstanding;6 - Good;0 - Pair;0 - Poor;2 - Blank.
of the Little
- -
51
43.8
=

Comments
TABLE 1
TEACHERS CO2ENTS
STRENGTHS, WEAKNESSES, TAPROVEIENTS
-Strengths Of the Little School Component
1. Administration and Staff : 15,
a. Cooperation-b. Positive leadership and
organizationc. Communicationd. Sharing ideas and knowledgee. Competent and dedicated stafff. .Encourages staff creativity and
innovation T!,
g. Nacher7advisor ,roier.
Teaching ...,;Methods*!),(-3
--->.
z"
.i"a. Individualization I. s ruction.,:b. Team teaching.,
. c. Independent study. d. (Che each) -Classroom Management,
small gr6up 'Instruction, studentassessment, criterion referencedtesting, peer facilitators,innovative technioues, learningactivities outside the classroom
3. Students':
4
3222
11
14
322
12
a. Improved student /teacher'relationships
. 4b. Cohesiveness among students . -r 2c; Positive atmosphere for learning 2,d. (One each) Improved attendance,
independence of students, studentstaught on their level, attacklearning gaps,
TOTAL STRENGTHS -
52 .
-44=

Weaknesses Of The Little School Component
Comments
1. Inadequate materials, supplies, textsand storage . 9
2. Lack of funds, 4
3. Lack of typing an clerical assistance 3.
4. More plaping tide -- 3'
5: Communicittion 26., Overcrowded classrooms, 2
7: Need'alternate forms .of course tests t 1
8. Physicil-plant limitations for team'teaching and open space techniques 1
TOTAL WEAKNESSES- 25
Ways In Which The Little Sdhool ,Comdhent Could Be aoroved
1.' Resources 12
a.. More supplies, equipment, andmaterials,. , 8
bo Nbre.funds n 3 ',
,. ,..
C. Space for resourc.e work area 1,
Siaff ' .I. - , li'N-
a. Teacher assistance,, typist, ,'clerical staff
b. Para =professionals,c. Full=time director or assistant
,. director
Other
62
20
a: More planning me ,tif
2b. Released time f4r materials
preparation 4? 1o. More time to metpOtithrstudents
and parents4 4
d. Smaller clasies . 1
5
TOTA IMPROVEMENTS - '28
O

Results of Interviews and :Observations'
The Project Director, Assistant Project Director and theCounselors were interviewed; direat observations were mace offour classes in session; an audio-visual presentation of LittleSchools was reviewed; and a brief review of selected staffdeveloped materials was carried out.
Interviews and observations support the need for additionalpersOftnel and resources for-the plroject, particularly for morereleased time for the Project Director to deficte to Little Schools.Is an'Assistint Principal at Woodsavr the division of time presentsmany difficulties. Although anlssistant Project Director wasassigned, a full-tidperson is needed 'for this position to handlemany of the day -to -day tasks' that arise. Unfortunately, theAssistant Project Director was seiimitly injured during the yearand was gut on sick leave, placing an even heavier burden for endof year.tasks on the Project Director and Little School staff.
It should also be noted that two other staff members werelost to the project:during the year due'to ektended illness.The absences of these .trained personnel undoubtedly diminishedthe overall impact of the project.
ne need for a full-time clerk- typist assigned to theproject was clearly in evidence throughout many of the on-siteobservations and interviews. A program dedicated to developininstructional packages and a program of individualized instructioworthy of dissemination requil%s =mediate on-call services fortyping, filing, reproducing; collating, and distributing projectdeveloped materials. The assignment of a full-time Clerk-
ist would enable the project staffto,brings its materials andfiles up-to-date and ready for dissemination.A 0N
Finally, the project requires the addition of a high speedXerox:for duplicating materials for distribution.
Classroom observations and the review of staff developedmaterials served to confirm the efficac'y of Little'. Schools ,
developed teaching methods. Observation was made of fourdifferent' classes each using some variation of teaching tech-niques emphasized by Little Schools -- e.g.; team teac4ing;small group discussion; a small 'group viewing a slide-tapepresentation with a study,guide to focus on key points, whileother students in the same class pursued other`projects insmall groups or independently; students learning to use business
54

machines fAlowing instructor-preparedguides and audio-visualinstructions, while others in.the,class worked on improving ..theirskill; on various maehines; and others. 'Studentp, queried during,these observations liked the inddpendence an_. respondibility
.,-,4ccorded to them by the varied teaching appr ches.
,'
1Parentil involvement according to:the Project DireC-tor,
has been achieved .by keeping parents informed of the program,inviting them-to damMent upon their children's .participationand, the progress the students have made while in the program.
.
Summary of Results
The results of the evaluation clearly indicate support forthe Little School Component'evhievement of its goals, particq-larly'in the areas of developing a viable program pf'instruction and in creating a positive atmosphere for learning.The evidence for the program shows:
4,
1. Component teachers compared with Non-component teachers,as a result 'of staff development and project' experience,use more varied teaching methods; use those methodsemphas.ized'by Little Schools more often than Non-component teachers; emphasize individualization more than.NonAimponent teachers (see 'section on Tedching Hethoda).
4 b"
"--2. Component teachers as compared with NonTcomponentteachers 'perceive their students more favorably in suchareas as olds partplaaation, accepting responsibilityfor their school work, communication between student andteacher, students' interest-in their school work, tudyhabits, and jstudents' confidence in their school work k(see section'on Teachers' Ratings of Their Classes)
8* Component teachers give,the Little Schools high,marksIn all areas, with, the exception of neeliaLsuppo t'services (supplies, clerk-typist). Elpecific stren ths,weaknesses, and man of improvement. are worth noti gin the section on Component Teachp'ns' Evaluation 'Little Schools.
4. ,Staff development has'made aigobtd deal of progress.However, a number of areas ideAtified need further at-tention and' should be reviewed)by-the project staff.
O

'
't: .° ..0
. The results for students show:
1.. Lower absences for Component vs. Non-Component students.
)4,Component students compared with Non-Component students(at a different high school) show, more positive attitudesin areas such as "have good relations with most of myteachers; have become mere confident of my School work;.
# , understand what my teacher expects- of me; have a goodi,
understanding of how I am doing in my school.liork; havelearned how to take responsibility far my school work;'very interested in sehool; know how to study and learn."
S. Component students give Little Schools high marks in allareas including student-teacher communications and. theirrpersonal scholastic development.
4. Component students compared with Non-Compone4 studenti(at a.differ.eat high school) confirm that heir teachersuse more varied teaching techniques and per 'ihcthis as
,
.
helpful to their laarning....,
5. Component students feel. that Little Schools has preparedthem better for college or work after high.scheol.
6. A larger percentage of Component than'Non-Componentstudents show improvement in the standardized tests,the PSAT administered in the junior, year and used asthe "pretest" and the SAT administered in the senior
,
I
year and used as the,"posttest". Although Comporiehtstudents tendad-to score highe
I
on the SAT Math andIhrbal scores,- the differ4nces were not statisticallysignificant.

a . .
CHAPTER IVRECOMMENDATIONS
I
Based on the findings reported in the previous chgpter. a num-tirsof recommendations are ,offered for consideratidn. Theserecommendations are made in the expectation that they will helpthe Project, the D.C. Public Schools, and the educational cora-
'mlinity reap the full oenefit of this program of individualizedinstructiOn.'
1. The Little Sch!bol CompOnent should definitely be con-'tinued and its. role" expanded, as currehtly planned, intothe disseminatibn.plmse of the program:' Little Schoolshas clearly demonstated its impact" on` students and .
.teachers alike ,in creating a positive atmosphere foi;learning] in developing a,varied program of individu-alized instruction, in improving classroom teaching, andin improving attendance. Although the evidence forstudent achievement is not completely clear, there isenough' to suggest that improvements in student achieve-
, meat have also been made..
2. Little Schools should be given sufficient support and,resources to effectively carry rout its role. Essentialhere are: more released time from Other duties for theProject Director, a full-time Assistant Project Director,a full-time clerk-typist, and reproduction equipment(Xerox).
3. Staff development worksho should be continued forcurrent staff, with released time and/or stipends forextra time (especially summer) to give the staff timeto further develop and consolidate its work in Bevel-oping inidividualized materials. .Although much progresshas been made, additional courses and teaching methodsare-in need of development and improvement. To cut thiseffort" short at this time would be wasteful of the money 1
and effort already expended, and would not provide asmuch information for dissemination purposes.
4. A staff development program for teachers new to Little,Schools and/or individualization would-prove invaluablein taking full advantage of the,Little Schools experience.
a

.-
5. A wide range standardi;ed achievement test battery shouldbe employed in the evaluation in order to reflect themajor course areas typical at the high school level.The STEP tests or the Educational Development Seriesmay be suitable.., 1