document resume - eric · document resume. cg 005 248. loeb, jane; bowers, john ... secondly,...
TRANSCRIPT
ED 039 540
AUTHORTITLE
INSTITUTION
PT.YR DATENOTE
EDFS PRICEDESCRIPTORS
ABSTRACT
DOCUMENT RESUME
CG 005 248
Loeb, Jane; Bowers, JohnPrograms of Study as a Basis for Selection,Placement and Guidance of College Students.American Educational Research Association,Washington, D.C.; Illinois Univ., Urbana.2 Mar 7013p.; Paper presented at the Annual Meeting of theAmerican Educational Research Association,Minneapolis, Minnesota, March 2-6, 1970
EDRS Price MF-$0.2; HC-$0.7E*College Programs, *College Students, DropoutCharacteristics, Dropout Identification, Freshmen,*Guidance, *Placement, *Student Characteristics
The study reports the definition of programs ofstudy which are homogeneous in the patterns of abilities andinterests of their students and the grading standards of they.faculties. It also presents data relating these programs to success,attrition, and transfer of the students who enroll in them. Curriculawere grouped twice; first, according to academic similarity and,secondly, according to vocational and personal preferences. Thesubjects for this study were college freshmen for whom six academicvariables were available for academic grouping: high schoolpercentile rank, four American College Test scores, and firstsemester grade point averages. Interest grouping subjects (alsocollege freshmen) had available data on ten Kuder occupationalinterest scales, six Kuder personal preference scales and the sixacademic variables. Results obtained from the use of Ward'shierarchical grouping analysis indicated that programs of study whichare homogeneous in terms of the abilities, interests and collegegrades of their students can be identified, that these programsdiffer on at least two readily interpretable dimensions and thatgrouping of curricula on these bases simultaneously groups themaccording to sex ratio. (Author/MC)
U.S. DEPARTMENT OF HEALTH, EDUCATION & WELFARE
OFFICE OF EDUCATION
THIS DOCUMENT HAS BEEN REPRODUCED EXACTLY AS RECEIVED FROM THE
PERSON OR ORGANIZATION ORIGINATING IT. POINTS OF VIEW OR OPINIONS
STATED DO NOT NECESSARILY REPRESENT OFFICIAL OFFICE OF EDUCATION
POSITION OR POLICY,
PROGRAMS OF STUDY AS A BASIS FOR SELECTION, PLACEMENTAND GUIDANCE OF COLLEGE STUDENTS1
Jane Loeb and John BowersUniversity of Illinois, Urbana
A review of studies of attrition at campuses across the country revealed
that the median rate of attrition for students enrolled in four-year college
programs was 50% (Summerskill, 1967). If on the average 50% of the students
entering an educational program fail to complete it then knowledge of attri-
tion and transfer rates is essential to the process of educational planning.
However, studies of collegiate success, attrition, and transfer are generally
conducted at the all-university or all-college level, even though a university
or college is likely to subsume curricula which are quite diverse in the
patterns of abilities and interests which they demand, the strictness with
which students are graded, and the academic facilities and faculties cn which
they draw. If such curricula vary in their attrition and transfer rates as
wells then all-college statistics do not yield the needed information.
If programs of study sharing academic facilities could be defined,
planning of educational programs could be based on specific attrition and
transfer rates, educational outputs could be more easily regulated, and
costs more readily assessed. If programs of study were defined which were
homogeneous in terms of the abilities and interests of the students in
them and the grading standards of their faculties, then the following
desirable results might be expected: (1) more effective control of attrition
cep through admission standards tailored to the homogeneous program of study,
cv.LrD
and (2) empirically based guidance of dissatisfied or unsatisfactory students
into programs of study clostily suited to their academic qualifications and
Vaper presented at the Annual Meeting of the American Educational Research
Association, Minneapolis, March, 1970.
2
their vocational interests. It is expected that homogeneity of abilities,
interests and grading standards, on the one hand, and sharing of academic
facilities, on the other, are very closely related phenomena and that
programs of study homogeneous in the first sense will be homogeneous in the
second as well. The present paper, then, reports the definition of programs
of study which are homogeneous in the patterns of abilities and interests of
their students and the grading standards of their faculties and presents
preliminary data relating these programs of study to success, attrition, and
transfer of the students who enroll in them.
METHOD
Curricula were grouped twice, once according to academic similarity
and once according to similarity of vocational and personal preferences.
Ss for the academic grouping were the 10,205 freshmen who entered the University
of Illinois at Urbana in the fall of 1966 or 1967, for whom six academic
variables were available: high school percentile rank (HSPR), four American
College Test (ACT) scores, and first semester grade point average (GPA).
Ss for the interest grouping and for subsequent analyses were the 4,673 freshmen
who first enrolled at the campus in the fall of 1967 for whom scores were
available on the 10 Kuder occupational interest scales and the 6 Kuder
personal preference scales, as well as the six academic variables.
Ward's hierarchical grouping analysis (Veldman, 196'?) was used to group
the curricula into programs of study. For the academic grouping, the 85
curricula enrolling at least 26 Ss were grouped according to the similarity
of their means on the six academic variables. The error index to be minimized
in hierarchical grouping is the sum of the squared differences between
corresponding scores in the profiles, i.e., curricular means, divided by the
3
number of objects to be grouped together. Since the means of the 85
curricula were based on quite disparate Ns, one set of means was used
for each 50 Ss in the curriculum. The total set of means for each variable
was standardized, with the result that each of the six variables was equally
important in the grouping. Separate analysis of the academic and Kuder data
prevented the 16 Kuder scales from contributing more to the grouping decisions
than the six academic scales. Identical means were grouped together first,
since the error index for these combinations was zero. The error indices for
subsequent combinations were then dependent on curricular sizes as well as
similarity of curricular means. Each of the 80 curricula with at least 13 Ss,
with one set of means used for each 25 Ss in the curriculum, were grouped by
the same procedure on the basis of the similarity of their 16 Kuder means.
The change in the error index with each successive combination of curricula
was examined, and the grouping process was terminated at that number of groups
beyond which recombination would lead to a relatively large increase in the
error index. This procedure resulted in 11 academie groups and 10 interest
groups. Each of the remaining small curricula, not used in the grouping
process, was classified into that academic group on the basis of whose means
and dispersion matrix the curriculum's six academic means yielded the smallest
classification x2 (Cooley 4 Lohnes, 1962). This procedure was repeated, using.
Kuder scores, to classify small curricula into the Kuder groups, but with the
restriction that a small curriculum could enter only those Kuder groups
which, after all small curricula had been classified, would have at least ten
Ss from the academic group to which the small curriculum belonged. In this
manner, 39 groups of curricula were defined which differed from each other
in either their academic or Kuder classification, or both.
RESULTS
Discriminant analysis indicated that the 39 programs were highly
discriminable on the basis of the 22 variables with A =.160, F = 10.625,
df = 836/88069, p.001.
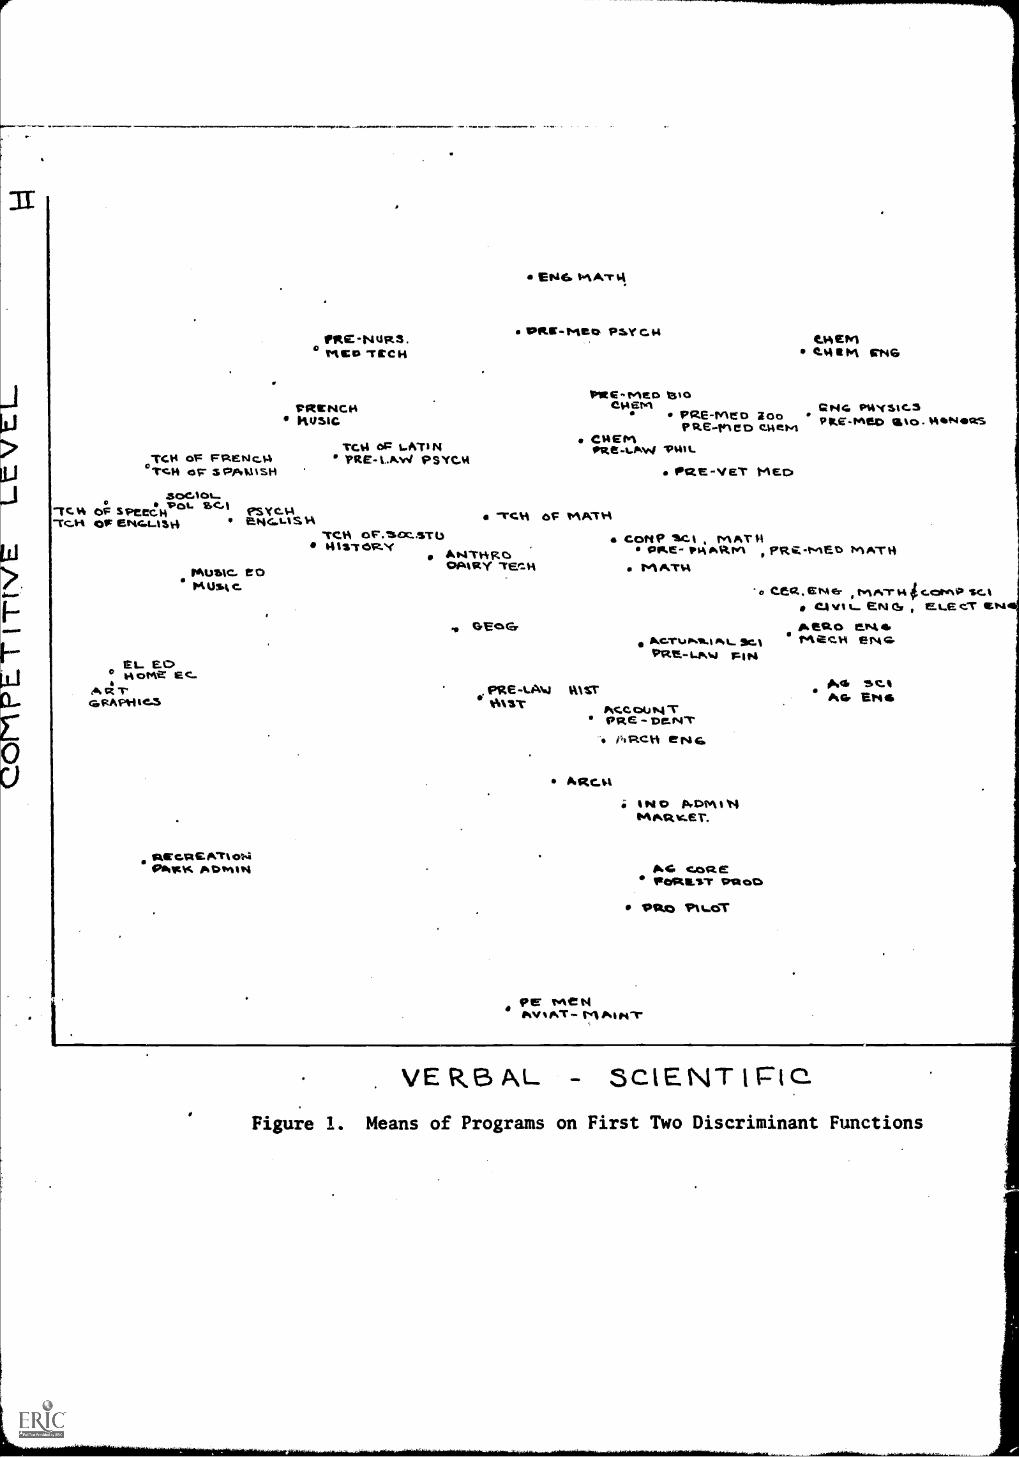
Figure 1 indicates the positions of the means of the 39 programs on the
first two discriminant dimensions and defines the programs in terms of their
two largest curricula. Together the first two functions account for 64%
of the total discriminating power of the test battery. Table 1 lists the
Insert Figure 1
first two scaled vectors and indicates that the largest contributors to group
separation along the first function are Kuder Scientific, Computational and
Mechanical scales and ACT Natural Science and Math, all positively weighted,
and Kuder Social Service and ACT English, negatively weighted. High scores
on scientific and quantitative interests and achievement scales yield a
high score on function I, and high scores on social service interest and
English achievement yield a low score on the function. In Figure 1 it can
Insert Table 1
be seen that the programs of study with high means on this function are
made up of curricula such 'as engineering, chemistry, pre-med, etc., while
programs of study with relatively low means on this function consist of
teaching, English, and other verbally oriented curricula. This first
function rather clearly separates scientific from verbal programs.
S
Heavy contributors to function II are HSPR, Kuder Scientific and Social
Service, all positively weighted, and GPA, Kuder Verification and Kuder
Directing and Influencing Others, all negatively weighted. The high positive
weight for HSPR combined with the high negative weight for GPA suggests that
programs with means which are high on this function enroll students whose
GPA's at the University are low relative to their HSPR's, while programs
with relatively low means on this function enroll students whose CPA's are
higher than one would expect given their low HSPR. Thus this function appears
to separate programs according to their competitive level. Examination of
Figure 1 suggests that programs of study with means which are relatively
high on this function are generally scholarly or professional in orientation:
chemistry, physics, French, pre-nursing. Programs with relatively low means
on this function are those which are oriented toward the business world or
toward less academic activities: finance, industrial administratiun, aviation
recreation and park administration.
Second semester performance data were available for the sample, allowing
investigation of the academic drop and transfer rates within the programs.
Table 2 presents correlations, for the 39 programs of study, among means on the
first two discriminant functions, percent of students transferring to another
program second semester, percent of students dropped for academic reasons
during the first year, and percent of the students in the program who were
male. Positive correlations of percent dropped, transferred and male with mean
Insert Table 2
on the first discriminant function indicate that loss of students through
drop and transfer is more common in the scientific than in the verbal programs
and that the scientific -verbal continuum is very closely related to sex. The
higher transfer rate for more scientific programs suggests a movement toward
6
more verbal areas. Indeed the mean for all transfers of the difference
between original and final program mean on the first function was 1.124,
suggesting an overall tendency for transfer to occur in the direction of
the verbal curricula.
Negative correlations of percent dropped and percent male with mean on
the second function indicate that the less competitive programs have higher
drop rates and higher proportions of males than the more competitive ones.
Although students in the less competitive programs earn GPA's which are
high relative to their HSPR's, these GPA's are still low relative to the
requirements for survival at the University. The very high correlation
of maleness with the first discriminant function and the positive correlations
between drop and transfer rates and percent male lead to the question of whe-
ther the relationships of drop and transfer rates to position on the discrim-
inant axes are simply the result of differential sex ratios in the programs
and a tendency for males to drop and transfer more than females.
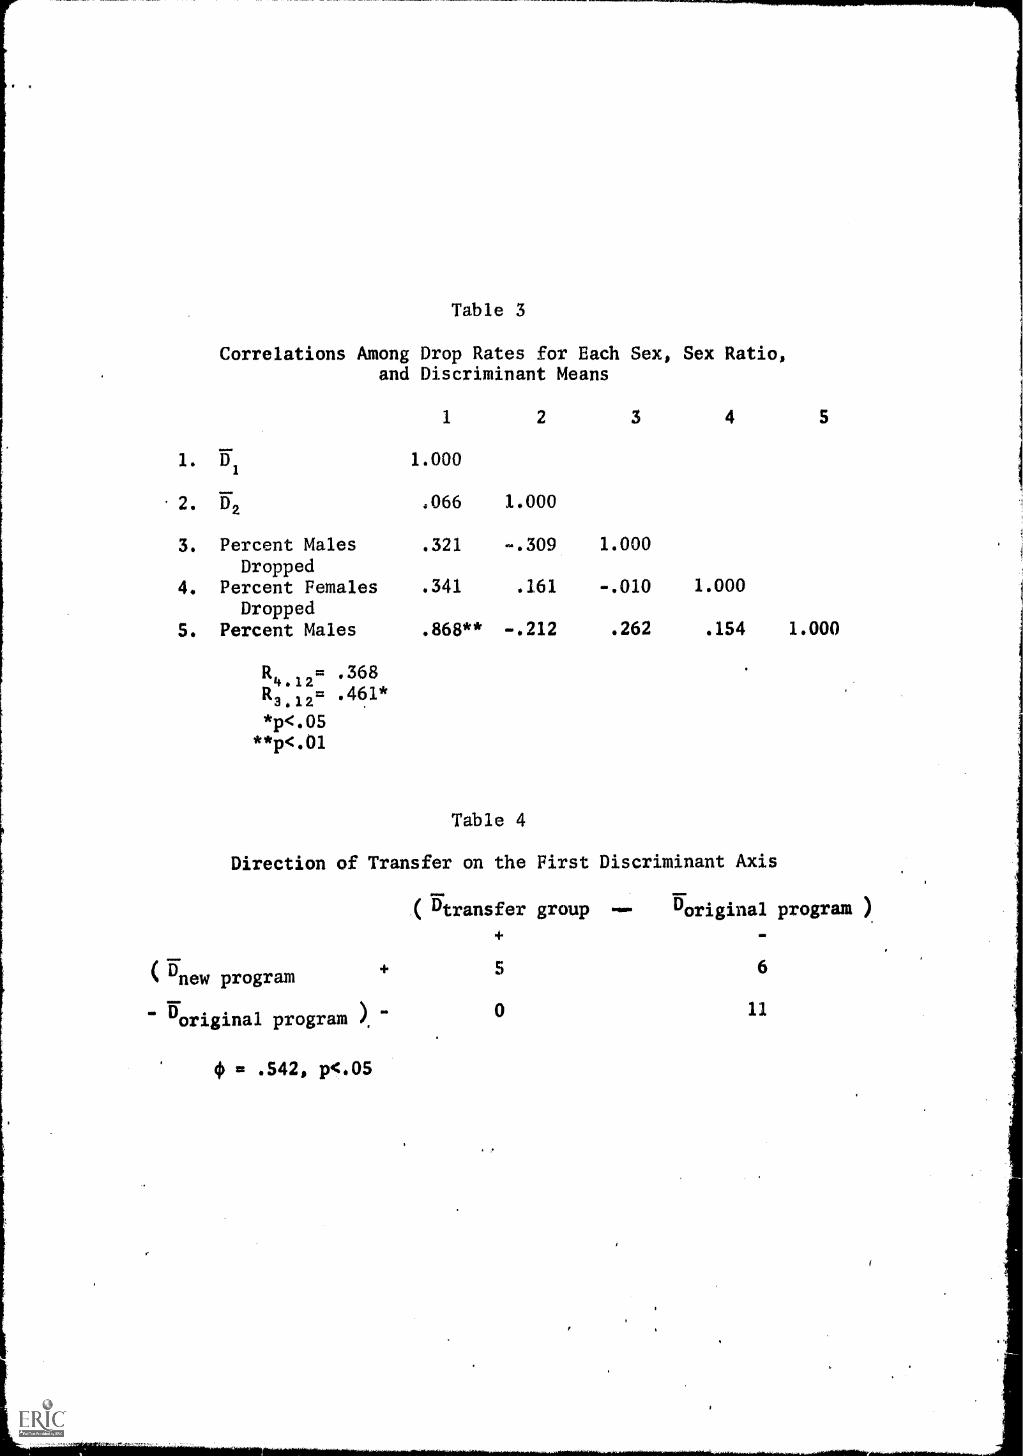
Table 3 lists correlations, for the 33 programs in which both sexes were
represented, between percent males dropped, percent females dropped, means on
the two functions, and percent male. The data in Table 3 reveal that drop
Insert Table 3
rates within programs are uncorrelated for the sexes, that male drop rate tends
to be higher in the more scientific and the less competitive curricula, with
R = .461 (p.05), and that female drop rate is not particularly predictable
from either or both functions.
The extent to which transfer was predictable from discriminant scores on
the first axis was investigated. The analysis was limited to the first
7
function because the second function had been found to be unrelated to
transfer rate. Groups of at least five Ss who transferred from and to the
same program were identified and their means on the first discriminant function
calculated. It was expected that direction of transfer on the discriminant
axis should be positively related to direction of the difference between the
mean of the transfer group and the mean of the program of study from which
they moved. Thus the difference between the mean of the transfer group and the
mean of the program from which they transferred and the difference between the
mean of the program to which they moved and the mean of the program from
which they moved were expected to tend to be either both positive or both
negative. Table 4 lists the results. Of the 22 transfer groups with at
least five Ss, 16 moved the expected direction on the first axis. The phi
coefficient for direction of transfer on the first axis, .542, is significant
at the .05 level.
Insert Table 4
The potential usefulness of the programs in predicting drop rates within
colleges was assessed by regrouping the 39 programs into the original 11
academic groups and comparing drop rates within a college for students entering
each of the academic groups represented within the college. Seven of the eight
colleges at Urbana had more than one academic group represented within them,
and of these seven, four had significant differences in drop rates (p<.05).
These four include Liberal Arts and Sciences, the major college in terms of
size. Homogeneity of the academic groups was tested by examining the drop
rates of the colleges within them. Of nine academic groups so tested, those
with more than one college represented in them, only two had significant
differences among the drop rates of the colleges (p<.05).
8
DISCUSSION
The results of this study indicate that programs of study which are
homogeneous in terms of the abilities, interests, and college grades of
their students can be identified, that these programs differ on at least
two readily interpretable dimensions, and that grouping of curricula on
these bases simultaneously groups them according to sex ratio. The
University has in recent years used HSPR and ACT Composite and no other
variables such as interest scores, ACT subscores, or sex, in making
admission decisions. Hence differences among programs in patterns of
ability, interests, and sex are the results of self-selection. If the
admission procedure were reorganized so that differential ability data were
taken into account in the admission decision, program differences might
become even more clearly defined.
The positive correlations of drop and transfer rates with the first
discriminant axis indicate that attrition of these sorts is heaviest in the
scientific curricula. If upperdivision spaces are filled in these curricula,
the University must either be overadmitting freshmen into the scientific
curricula or combating attrition by accepting transfer students, primarily
other institutions. In either case, the expenses involved, both human
and institutional, in accepting, partially training, then dropping students
could be decreased by increasing the level of selectivity in admission into
these programs, possibly by holding admission open longer in these programs
than in those to which suitable applicants need not be so highly qualified.
Loss dud to transfer from the scientific to other programs probably
acts as a control on enrollment within the more verbal programs. Data
from other studies (e.g., Bower.' Mahan, 1968) indicate that while males
9
are more likely to be dropped than females, females are more likely to withdraw
than males. Thus, the verbal, heavily female curricula can be expected to
lose many students entirely from the system, whose places can conveniently
be filled by emigr4s from the scientific and technical fields.
The use of programs of study developed here as a basis for placement
and guidance of students could be expected to decrease interprogram transfer
rates, particularly in later semesters. Students tend to move in the right
direction on the first axis without guidance based on these results. If
guidance procedures were focused on directing students into programs with
interest and ability profiles similar to their own, later transfers and re-transfers
could probably be avoided. It should be noted that the uncorrelated nature
of male and female drop rates within programs suggests that differential
guidance procedures may be required according to sex.
A number of subsequent investigations are necessary in order to develop
further the program of study approach. First, the extent of the overlap in
academic facilities used by curricula within programs must be investigated.
Second, the performance of the present subjects in later semesters must be
traced in order to provide long-term attrition and success data and to allow
the development of profiles of the aptitudes and interests of students who
are, in the long ran, both satisfied with and satisfactory within their
programs of study. Finally, differential predictions of success and satisfaction
within programs need to be developed for purposes of selection, placement, and
guidance.
References
Bowers, J. and Mahan, M. "University Policy Objectives Reflected in thegraduation and Dropout Rates for a Freshman Class," Research Report# 284, Measurement and Research Division, Office of InstructionalResources, University of Illinois, Urbana, Illinois, 1968.
Cooley, W. W. and Lohnes, P. R. Multivariate Procedures for the BehavioralSciences, John Wiley & Sons, Inc., New York, 1962.
Summerskill, John. "Dropouts from College," in The American College,Nevitt Sanford (ed.) John Wiley & Sons, Inc., 1962, p. 627.
Veldman, D.J. Fortran Programming for the Behavioral Sciences, Holt,Rinehart and Winston, New York, 1967.
MoL
J
J
LU
0
TCH of FREINic,4*MH of SPA.LItsH PCtE-VET MED
ENG. wAik-rul.
ppm- pies PSYCHPlite-NuRS. tvNEM° tamp TICcii C11.01 CNC.
riterIci4KUSIc
Tc.$4 O LATINPRE -t.xvit PSYCH
PitE-MEoCHEM
PRE-Meo zooPRE-Plea e.ttetit
CHEMPRE -t.AW PHIL.
SoCtot...pot. act"CH or Speecs fSYC.H
-Tc,44
"rC.V1 Oe MATHTc-I-t Etstc..1-1S1-4 E44,1.1SH
ANTHRO P.COMP Sot , MATH
0 %2-TORY OE- IPHAP.tvl MATHCIFttRY TEct4 MATH
EL_ EOirtova EC.,
Ptus4c. eaMusk C..
ART'6PAPI-Ite.-5
Q NG PNYS1e..3PRE -Meg) tato. HeNotz5
evEcNG
CECt.elster ,rwArt-THi.c.czt,"P sc.tClvtL.Cl EN , c.T EN
ilATC°141 *EPAI4%.P.C."1-Lo "111.1" L. actPp,e.-LI4 FIN
, PRE-LAW MsT oks sc.%EIIIMsT 441
Pwc.couniTPRE-DmNT
PIRCVt ENG
ARCHINO P.Divtt<4MARY-ET.
SigroStEATtotvlPARK Al:pv*1114 AG cdocZE
P0141LsT CntotS
Psk.0 P%LoT
PE meNPvoT- MAI per
VERBAL sclENT I PIC
Figure 1. Means of Programs on First Two Discriminant Functions
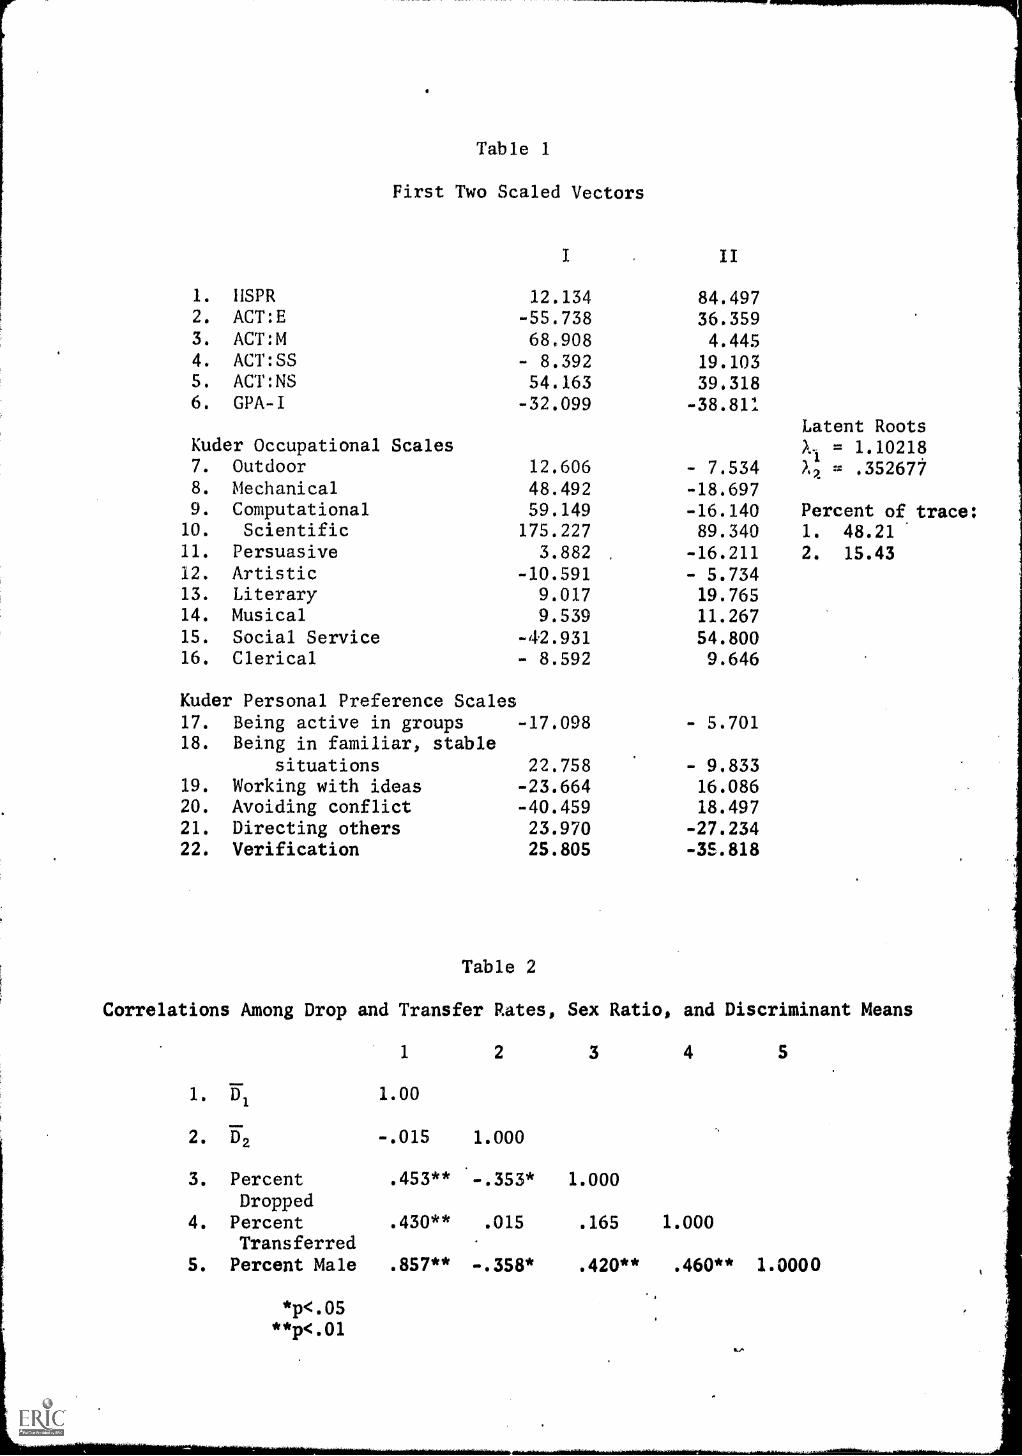
Table 1
First Two Scaled Vectors
I
1. IISPR 12.1342. ACT:E -55.7383. ACT:M 68,9084. ACT:SS - 8.3925. ACT:NS 54.1636. GPA-I -32.099
II
84.49736.359
4.44519.10339,318
-38.811Latent Roots
Kuder Occupational Scales A.1 = 1.102187. Outdoor 12.606 - 7.534 = .3526778. Mechanical 48.492 -18.6979. Computational 59.149 -16.140 Percent of trace:
10. Scientific 175.227 89.340 1. 48.2111. Persuasive 3.882 -16.211 2. 15.4312. Artistic -10.591 - 5.73413. Literary 9.017 19.76514. Musical 9.539 11.26715. Social Service -42.931 54.80016. Clerical 8.592 9.646
Kuder Personal Preference Scales17. Being active in groups -17.098 - 5.70118. Being in familiar, stable
situations 22.758 - 9.83319. Working with ideas -23.664 16.08620. Avoiding conflict -40.459 18.49721. Directing others 23.970 -27.23422. Verification 25.805 -35.818
Table 2
Correlations Among Drop and Transfer Rates, Sex Ratio, and Discriminant Means
3. PercentDropped
4. Percent .430**Transferred
5. Percent Male .857**
1
1.00
-.015
2
1.000
3
.453** .-.353* 1.000
.015 .165 1.000
-.358* .420** .460** 1.0000
*p<.05"p<.01
4 5
Correlations Among Drop Rates for Each Sex, Sex Ratio,and Discriminant Means
1 2 3 4 5
1. 151 1.000
2. D2 .066
3. Percent Males .321
Dropped4. Percent Females .341
DroppedS. Percent Males .868**
R4.12= .368
R3.12= .461*
*p<.05**p<.01
1.000
-.309
.161
-.212
1.000
-.010
.262
1.000
.154 1.000
Table 4
Direction of Transfer on the First Discriminant Axis
(5.new program
Doriginal program ),
= .542, p<.05
( 5transfer group Doriginal program )
5 6
0 11