document resume ed 166 246 robertson, david w.; and others · document resume ed 166 246 tm 008 267...
TRANSCRIPT
DOCUMENT RESUME
ED 166 246 TM 008 267
AUTHOR Robertson, David W.; And OthersTITLE Comparative Racial. Analysis of Enlisted Advancement
Exams: Item Differentiation. Final Report.INSTITUTION Navy Personnel Research and DeVelopment Center, San
Diego, Calif. 1
REPORT NO NPRDC-TR-77-16PUB DATE Feb 77NOTE 56p.; For related document, see .ED 152 841
EDRS PRICE MF-$0.83 HC-$3.50 Plus Postage.DESCRIPTORS Enlisted Personnel; *Item Analysis;, *Occupational
Tests; Promotion (Occupational); *glacial Differences;Technical Occupations; *Test Bias; *TestConstruction; Test Items; Test Reliability; TestValidity
IDENTIFIERS *Item Difficulty;.*Item Discrimination (Tests); TestLength
ABSTRACT- A comparative study of item analysis was-conducted on
the basis of race to determine whether alternative test construction.or processing might increase the proportion of black enlistedpersonnel among those passing various military technical knowledge
. examinations. The study, used data from six specialists at four gradelevels and investigated item analysis data indicating itemdifficulty, item-test point-biserial correlation, item-subtestcorrelation, item differentiation (between high scoring and low'scoring groups), and item-criterion correlation (where the criterionwas...the performance factor rating)). It was found that itemdifferentiation' was generally lower for blacks than for whites; thatthe highest item"-diffeientiation values tended to be for easieritems; that items that were nearly equal in difficulty for blacks, and.whites tended to be very difficult items; and that items with highitem-criterion correlations tended to have low item-testcorrelations. It was also found that tests of 20"to 30 items selectedby the item-criterion correlation method were more valid than longertests up to 150 items. Various aspects of item analysis are discussedand data are provided for a variety of comparisons. (Author/CTM)
***********************************************************************Reproductions supplied by EDRS are the best that can be made
from the original document.***********************************************************************
NPRDC TR 77-16
COMPARATIVE RACIAL ANALYSIS OF ENLISTED ADEXAMS:. ITEM DIFFERENTIATION
David W. RobertsonMarjorie H. RoyleDavid J. Morena
Reviewed byMartin F. Wiskoff
Approved by.James J. Regan
Techhical Director
ebruary 077.
CEMENT 44
U S DEPARTMENT OF HEALTH.EDUCATION & WELFARENATIONAL INSTITUTE OF
EDUCATION
THIS DOCUMENT HAS .8EEN REPRO-DUCED EXACTLY AS RECEIVED FROMTHE PERSON OR ORGANIZATION OBIGIN-*TING IT POINTS OF VIEW OR OPINIONSSTATED DO NOT NECES-SARILY REPRE-SENT OFFICIAL NATIONAL INSTITUTE OFEDUCATION POSITION OR POLICY
Navy Personnel Research and Development CenterSan Diego, California 92152
UNCLASSIFIED
SECURITY CLASSIF1dA'TION OF Tiell PAGE (Nam Data Entered).
REPORT DOCUMENTATION -PAGEF READ INSTRUCTIONS
BEFORE COMPLETING FORM1. REPORT NUMBER
"NPRDC TR 77-16
2.430VT ACCESSION NO. 3. RECIPIENT'S CATALOG NUMBER
4. TITLE (and Subtitle)
COMPARATIVE RACIAL ANALYSIS OF ENLISTED
ADVANCEMENT EXAMS: ITEM DIFFERENTIATION
,E. TYPE OF REPORT 6 PERIOD COVERED,
Final ReportMay 1974 - May 1976
6. PERFORMING ORG. REPORT NUMBER
1
7. AUTHOR(*), .,
David W. RobertsonMarjorie H. RoyleDavid J. Morena
fl. CONTRACT OR GRANT NUMBER e)
9. PERFORMING ORGANIZATION NAME7(R13 ADRIESS
Navy Personnel Research and Development ,CenterSan Diego, California 92152'
10. PROGRAM ELEMENT, PROJECT, TASKAREA 6 WORK UNIT NUMBERS
62763NZE55.,,521.031.03.02
n CONTROLLING OFFICE NAME AND ADDRESS
Navy Personnel Research and Development CenterSan Diego, California 92152
12. REPORT DATEJanuary 1977
13 NUMBER OF PAGES
4914 MONITORING AGENCY NAME & ADDRESSOf different from Controlling Office) IS. SECURITY CLASS. (of Ihl report)
UNCLASSIFIED16., DECLASSIFICATION/DOWNGRADING
SCHEDULE
16. DISTRIBUTION STATEMENT (of this Report)
I
: .
Approved for public release; distribution unlimited
17. DISTRIBUTION STATEMENT (of the ebtrect entered in Block 20, if different from Report)
I
18. SUPPLEMENTARY NOTES.
d
19 KEY WORDS (Continue on reverse aide If ncmary end Identify by block number)
Item analysis j
-4)
PromotionRacial compa.risOnEqual opportunity
i20 ABSTRACT (Continue on reverse lade if necmary and Identify by block number)
A comparative-raelal analysis of-item differentiation was conducted todetermine whether advancement exam items are similarly differentiatingbetween good and poor !performers of racial groups.. Techniques were alsoinvestigated to improve test quality as measured by item differentiationor test reliability. The study'specifically investigated (1) the differencesin item differentiation betweeleBlacks and Whites, (2) item-difficulty leVelsthat yield maximum im differeiation, (3) the impact on item differentia-
.1
.,.
DD 1 JANFORM73 1473 EDITION OF if NOV 66 IS OBSOLETE UNCLASSIFIED
SECURITY CLASSIFICATION OF THIS PAGE (When Cieti+Entereil)
UNCLASSIFIEDSECURITY CLASSIFICATION OF THIS PAOINIIIHNe D.
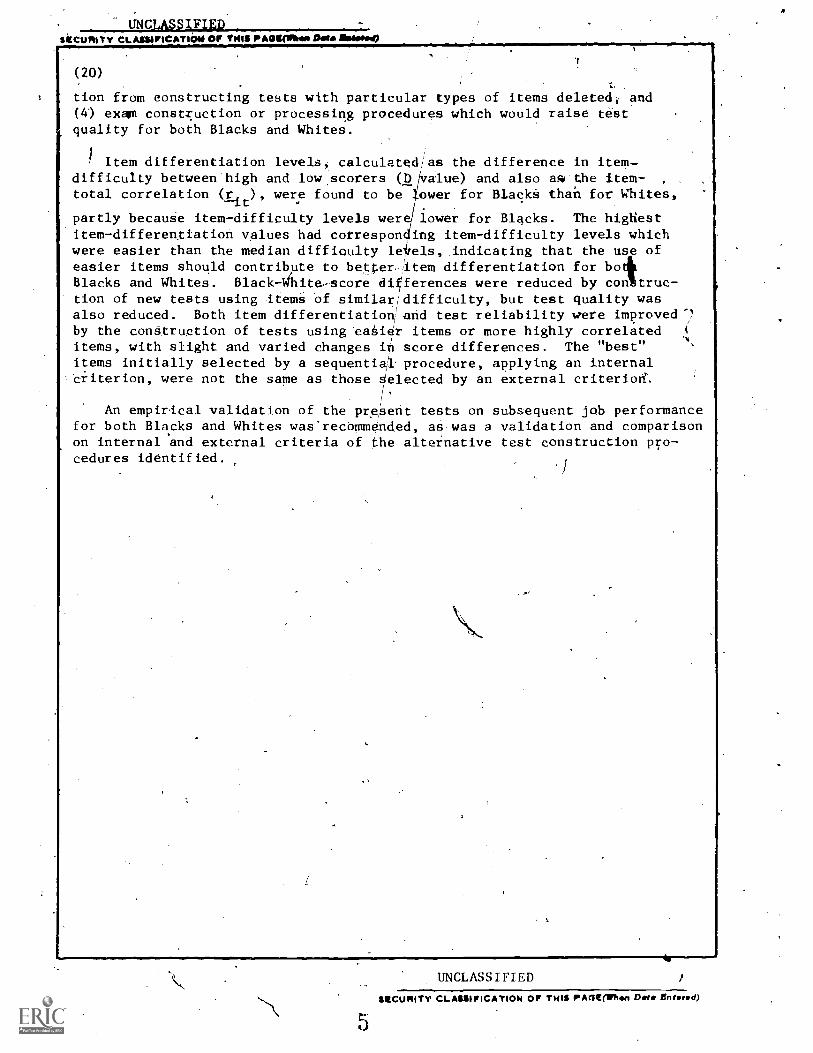
(20)
tion from constructing tests with particular types of items deleted, and(4') exam construction or processing procedures which would raise testquality for both Blacks and Whites.
Item differentiation levels, calculated/as the difference in item-difficulty between high and low scorers (D alue) and also a% the item- ,
total correlation (Eit)' were found to be ower for Blacks than for Whites,
partly because item-difficulty levels wer lower for Blacks. The highestitem-differentiation values had correspon ing item-difficulty levels whichwere easier than the median difficulty leVels, indicating that the use ofeasier items should contribute to better-Item differentiation for boBlacks and Whites. Black - Whiter score differences were reduced by con true-tion of new tests using items of similar difficulty, but test quality wasalso reduced. Both item differentiation/ and test reliability were improved7by the construction of tests using eaaier items or more highly correlated 1
items, with slight and varied changes in score differences. The "best"items initially selected by a sequential procedure, applying an internalcriterion, were not the same as those Selected by an external criterion'.
An empirical validation of the present tests on subsequent job performancefor both Blacks and Whites was'recommended, as was a validation and comparisonon internal and external criteria of the alternative test construction pro-cedures identified.
/
UNCLASSIFIED
SECURITY CLASSIFICATION OF THIS AGE(Phon Data Enter.d)
5

FOREWORD
This study was initiated in response to a request from the Chief ofNaval Personnel (Pers-6) to determine the feasibility of developingEnlisted Advancement Exams from items similar in difficulty for bothBlack and White racial groups, as an approach to improving equal oppor-tunity in career growth for minority groups. Previous studies examineditem- difficulty levels both for entire racial groups (Robertson & Royle,'1976--TR 76-6) and for subgroups matched on total test score (Robertson &Montague, 1976--TR 76-34). This report, the third in a series, ekaminesitem differentiation and test'reliability,for the present exams and formodified exams using alternative item selection procedures.
The substantial and valuable assistance of the following persons isgratefully acknowledged: Mr. William E. Montague and DP2 Suzanne Olson,for, data pro'cessIng and computation; and Ms. Hazel F. Schwab, for clericalsupport.
This study was 'performed under Exploratory'Developmeat Task Area7,F55.521.031 (Career Performande and SeleCtion).--
J. J. CLARKINCommanding Officer
v
a
I
SUMMARY
Problem
('Blacks are advanced to paygrades E-4 -and above in smaller proportions
than Whites and score lower on the technical knowledge exam than do Whites.It has been found that when exams were constructed only of items similarin Aifficulty for both Blacks and Whites (to reduce total test score,differences),.the items were concentrated in the difficult (i.e., guessing)range. .Whis prior finding suggested that such an apprbach would degradetest lity.
Purpose
As a follow-on, the present study investigated test quality in termsof item differentiation and test reliability. Questions'specificallyaddrelsed were: (1),what racial differences'in item differentiation exist,(2) what levels of item difficulty ( value) yield maximum item differentia-tion for Black and Whites,'(3) what impact constructing tests by selectingpaiticular types of items would have og item differentiation, and (4)what exam construction or processing techniques would raise test qualityfor Blacks and Whites.
Approach
Item response data for exams of six occupational specialties acrossfour pay grades (i.e., 24 different exams) were analyzed as follows:
1. Racial differences in item differentiation were calculated as (a)the difference in item difficulty between high and low scorers (2 value)and (b) the item-total score correlation Lit value).
2. Levels of item difficulty yielding maximum item differentiation weredetermined by comparing P values with corresponding D and rit values.
3. Three types of modified tests were developed by selecting differenttypes of items: (a) items similar in difficulty for Black` and Whites (SIM-P),(b) those that were not extremely difficult (UPA-P), and (c) those'that werehighly correlated (SEQUIN). Black -White score differences in item differ-entiation and test reliability values for these tests were compared withthose for the original test.
4. The SEQUIN item-selection procedure was applied to certain examsusing an on-job performance factor as a criterion:. items correlating high
) with internal (total score) and external (on-jOb performance) criteria werecompared.
Findings
1. Item differentiation was generally lower for Blacks than for Whites,partly because item-difficulty (p value) distributions are lower for Blacksthan Whites (p.-7).
0
vii
2.) The highest item- differentiation values (D Lit values) had-
:orr'espohding item-difficulty levels (P values) that were higher than thenedian P values (of all items). Thi's indicates that the use of easieratemsShould contribute to higher (i.e., better) Item differentiation for bothSlacks and Whites (pp. 7.and 11).
3.' Selecting items that were similar in'difficulty for both.,BlacksInd Whites (SIMP-P test) did reduce mean score differences between "Blacks.ind Whites but it also reduced item difeerentiation and test reliability.ielecting,items that were easier for Blacks (UPA.4' test) and those thatwere highly correlated (SEQUIN .test) resulted in slight and varied changesin mean score, differences and also increased, item differentiation andtest reliability (p. 11).
4. The "best" items initially selected by the SEQUIN procedure 139Applying an internal criterion were not the same as those- selected by .
Applying-an external criterion. This result raises new questions regardingthe relevance of internal-consistency type measures of tqtt quality toneasures of subsequent,job-relevantTerformance (p. 14).
2onc1usions
1. Item diff6rentiation and test reliability of advancement examscould be imprbved for both Blacks and Whites by using.item selection andconstruction procedures identified in Ts study.
2. Developing tests by'using items similar in difficulty for Blacksand Whites is not feasible since it reduces test quality. However, developingtests by eliminating excessively difficult items would improve test qualityand benefit Blacks.
RecOMmendations
The empirical validity of the present tests on subsequent job performanceshould bc.conipared betwee Blacks and Whites,.and the alternative item pro-cessing and conStructio ,)cedures identified herein should be validated
and computed on internal and external criteria.
- -1 CONTENTS
Page ..
INTRODUCTION 1
Problem and Background 1
Purpose 1/
METHOD 3
Data 3
Analysis 3
Racial Differences in Item Differentiation 3
Effects of Item-Difficulty (p Value) on ItemDifferentiation
Effects of Item Selection Procedures 5
Effects of Exam Construction and Processing Procedures 6
RESULTS 7
Racial Differences in Item Differentiation 7
Effects of Item-Difficulty (P Value)-on ItemDifferentiation
Effects of Item Selection ProceduresEffects of Exam Construction And Processing Procedures
DISCUSSION
7
1114
19
Procedures for Improving Advancement Tests 19
Test Validation 19Identification and Categorization of Valid Items 20
Item Construction Procedures 20
Post Hoc Item Deletion Procedures 21
Balancing Item'Biases 2
Implications of theResults 22
CONCLUSIONS 25
RECOMMENDATIONS 27
REFERENCES 29
APPENDIX - METHODOLOGICAL ISSUES IN ITEM ANALYSIS A -0
DISTRIBUTION LIST
Page
LIST OF TABLES
Advancement Exam Sample Sizes, Means and StandardDeviations by Race 4
r
2. Range and Median D Values 8
3. Racial Differences in Item. Differentiation for 20 SelectedItems -of the ADJ3 Exam 9
4. Range and Median of Seven -Item Sets of Highest D Values.With Corresponding P Values 10
4
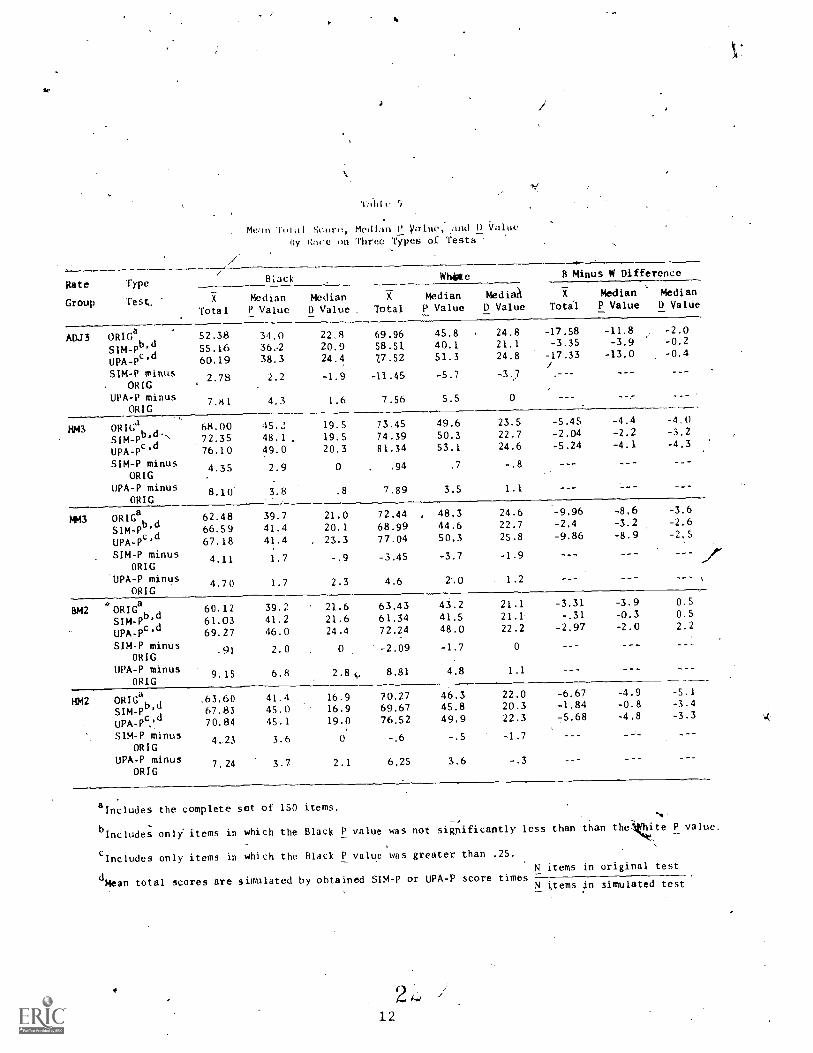
5. Mean Total Score, .Median P Value, and D Value by Raceon Three Types of Tests 12
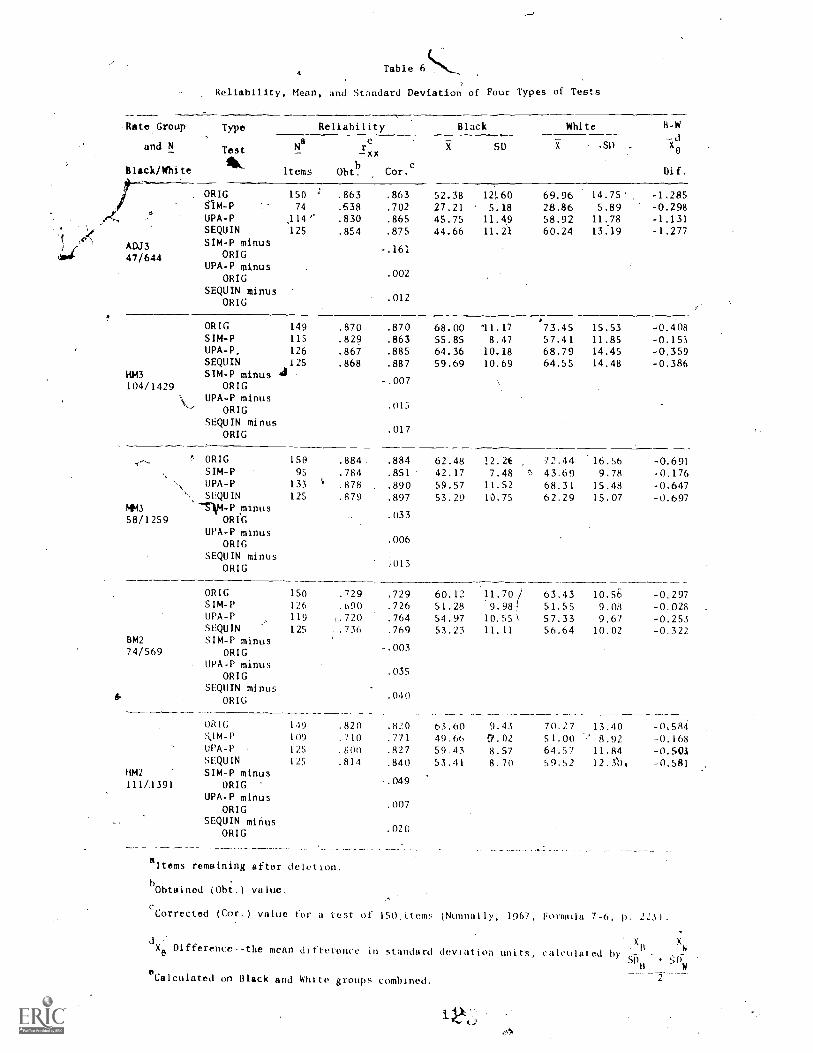
6. Reliability, Mean, and Standard Deviation of Four Typesof. Tests 13
7. Proportions of lheoretical and Applied Type Items in 25 hostand Least Valid, Items Selected by SEQUIN (ADJ3 Exam) . . 15
8 . Comparison Between Internal and External Criteria of SEQUINItem Accretion of Lowest Item-Differentiation Values '
(ADJ3 EXam) 16
9. Comparison Between Internal and External Criteria of SEQUINItem Accretion of LowestkItem-Differentation Values(BM2 Exam) 17
FIGURE
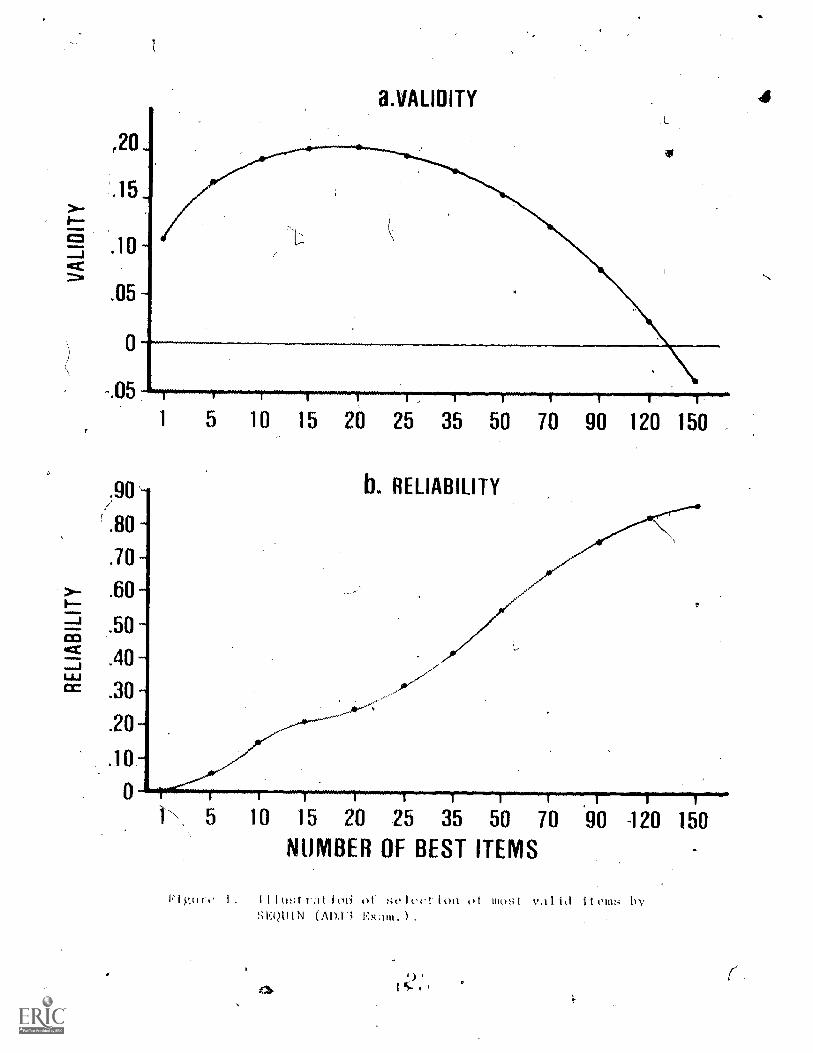
1. Illustration of selection of most valid items by SEQUIN,(ADJ3 Exam). 14
O
INTRODUCTION
Problem and Background
The-Enlisted Advancement System is one of the Navy'sAajor personnelselection systems being studied to/identify and alleviate any CdnditiOnthat might be detrimental to eqUal opportunity in career growth for allindividuals and groups. Advancements to paygrades E-4 and above arecompetitive and are based on several differentially'weighted factors,including the score obtained on a technical knowledge exam, which is sub-stantially weighted. A separate exam, comprising 150 multiple-choiceitems, is developed for each of approXimately 80 Navy ratings ('i.e., occupa-tional specialties). for each Paygrade within each rating.
It hap been found that Blacks score lower-than Whites on the technicalknowledge exams, an4 thata smaller proportion of Blacks than Whites areadvanced. To reduce the difference in scores, Rpbertson\and Royle (1975)investigated the feasibility of constructing exams containing only itemsthat were similar in difficulty for troth Blacks and'Whites. They concludedthat the construction of such tests could not be recommended, since theitems of similar difficulty were concentrated in the difficult range (i.e.,in the guessing range). Although they found that differences in averagetotal test score between Blacks and Whites would be reduced in tests con-structed of this type of item, they suggested that such tests wou41 degradetest quality4for both groups. ,Thus, one aspect of the problem is to findways of constructing advancement tests that provide similar' competitiveopportunity for all groups, but without loss of test quality, as measuredby item differentiation or internal consistency-type reliability.
Purpose
This study investigated racial differences in test quality in termsOf item differentiation,1 including the effects from alternative itemselection techniques.
The questions specifically addressed were:
1. What differences in item differentiation exist between Bfacksand Whites?
2. What P value leveI yield maximum item differentiation for BlacksWA
and Whites?
3. What impact would censqueting tests by selecting particular typesof items have on item differentiation and test reliability?
4. What exam construction or processing procedures would raise testquality for Blacks and Whites.
Lihe term "item differentiation" is used instead of theterm typicallyused in item-analytic studies, "item discrimination," to avoid confusionin the context of racial discrimination.
4,
Data
METROD.
Item response data-from the technical knowledge exams of the Series61 (August 1912) advancement competitions were provided by the NavalExamining Center (Ow the Naval Education and Training Program Develop-ment Center; NEMO.? The ratings seleCted for analysis were those inwhich minority group representation was relatively high. The six:ratingsselected, in competition to paygrades 4,through 7, were:
Aviation Machinist's Mate (Jet. -pgine MechanicY (ADJ)Boatswain's Mate (BM)Boiler Technician (BT)Commissaryman (CS)Hospital Corpsman (HM)Machinist's Mate (MM)
Data (of Blae'ks and White only) for the 24 separate competing'groups wereanalyzed. Table 1 presents the sample size, total test mean, and standarddeviation for each, group.
analysis
Racial Differences in Item Differentiation
Item differentiation is considered more important than Item-difficulty in conStructing tests from "good" items; that is, those thatare neither extremely easy nor difficult (e.g., P values between 40, and 80),and that relate tothe total Cestscore either by a high,positil*e.correla-Lion or by hight- proportions of.high than low scorers answering the itemcorrectly. P valuesof medium difficulty place upper limits on the rela-tionship of an iteilOio total test score, but do not guarantee effectiveitem differentiation (Nunnally, 1967). The tit and D value, statistics
were applied to(s'elected items of some of the exams to examine racialdifferences in itom differentiation. The r statistics were obtained
by calculating a Pearson product-moment correlation between each individual'sright-wropg response to an item and total test score, yieldinga pointbiserial 'coefficient. The I) value Statistic was calculated by, rank - orderingtotal scores and.splitting them at the mediane.creating-two subgroups--thosewho scored high on the total test score and those who scored low. 13 valueswere obtained by subtracting the percentage of high scorers who answered.the item correctly from the percentage of low scorers who answered the itemcorrectly. Details of these procedures and differences between them arediscussed in the Appendix.
2This data set was also used in previous studies of this series(i.e., Robertson & Royle, 1975 and Robertson & I Lague, 1976).
Q
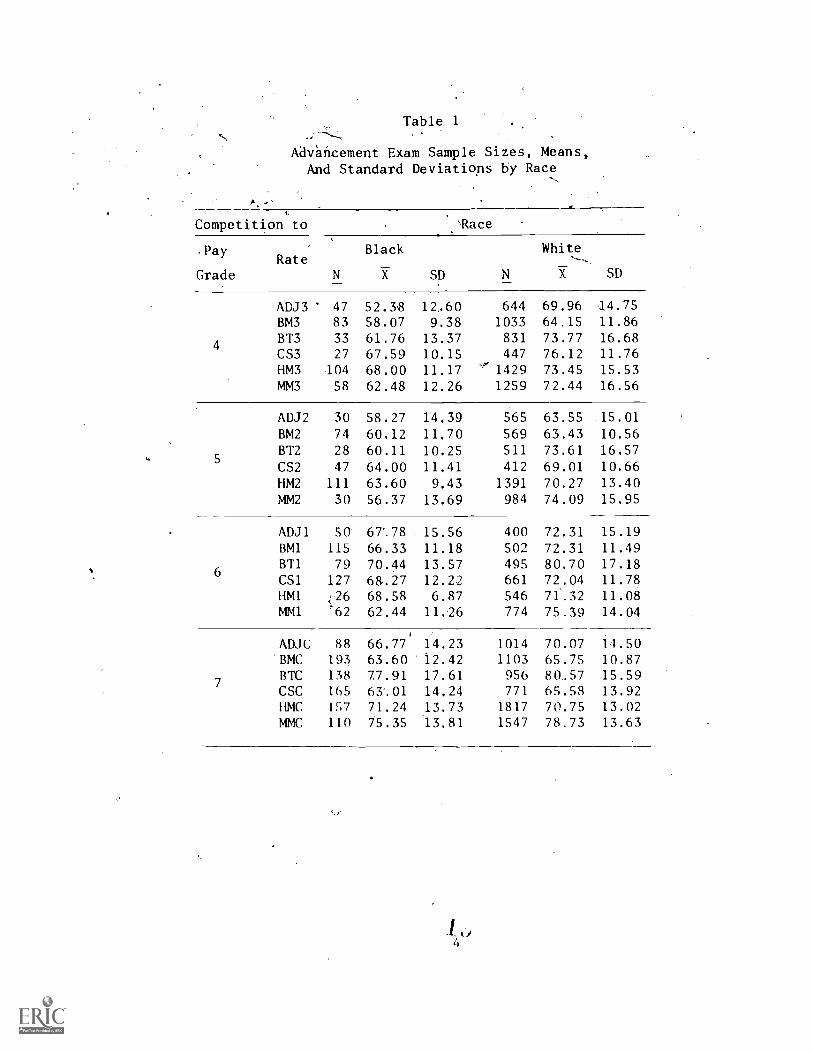
Table 1
Advancement Exam Sample Sizes, Means,And Standard Deviations by Race
Competition to \Race
,Pay
GradeRate
N
Black
X SD
White
SD
4
ADJ3BM3BT3CS3HM3MM3
47
83
33
27
104
58
52.3858.0761.7667.5968.0062.48
12,609.3813.37
10.1511.17
12.26
6441033831447
14291259
69.9664.1573.7776.1273.4572.44
14.7511.8616.6811.7615.5316.56
5
ADJ2BM2
BT2
CS2HM2
MM2
30
74
28
47
111
30
58.27
60.1260.1164.0063.6056.37
14,39
11.7010.25
11.41
9.4313.69
565
569511
412
1391
984
63.55
63.4373.6169.0170.2774.09
15.01
10.5616.5710.6613.4015.95
6
ADJ1BM1
BT1
CS1HM1MM1
SO115
79
127
426'62
67'.78
66.3370.4468.2768.5862.44
15.5611.1813.5712.226.8711.26
400502495661
546774
72.31
72.3180.7072.0471.3275.39
15.1911.4917.1811.7811.0814.04
7
ADJCBMCBTCCSCHMCMMC
88193
138
165
157
110
66.77'63.6077.9163.0171.2475.35
14.2312.4217.6114.2413.73'13.81
10141103956771
18171547
70.0765.7580,.57
65.5870.7578.73
14.5010.8715.5913.9213.0213.63
Effects of Item-Difficulty (P Value) on Item Differentiation
Although P values of medium difficulty generally produce the mostdifferentiating items, the.literature is not in full agreement as to whatthe ideal P value or range of P values should be. Thus, to investigatethe relationship between item-difficulty and.item differentiation, Dvalues were rank ordered, seven -item sets were extracted from the top'ranks, and the'rcorresponding P values for the D values were identified.Similarily, P values were rank ordered; seven-item sets were extractedfrom the top, middle, and bottom of the ranks; and the corresponding Dualues were identif.ied. Finally, r values were rank ordered, and the
-it'2 values for the highest and lowest nine r'
dtvalues were identified. All
of the above statistics were computed separately for Blacks and Whitesand then compared for racial differences.
Effects of Item Selection Procedures
Kr) compare the impacts on test reliability and item differentiationfrom alternative methods of item selection, the following three typesof tests were simulated and comparative statistics computed:
1. The similar P value (SIM-P) method, developed by Robertsonand Royle (1975), Which selects only those items having a White P valuethat is not significantly' greater than the Black P value.
2. The upgraded P value (UPA-P) method, developed by Robertsonand Royce (1.975), which selects only those items having a Black P valuegreater than 25.
3. The SEQUiN method, developed by Moonan, Balaban, and Geyser(1967), which sequentially identifies and selects 41 us with high corieln-Lions to'maximize a least squares prediction of a c, .rion of total score.This "hetiristic" method s4ects items in an "accretiol,' procedure. Thefirst item selected Ls the one that correlates most hi Oily with a specifiedcriterion; subsequent items selected are those whose intercorrelationswith the items already nominated tend to maximize J'he correlat1on coefficientin a regression equation.
internal consistency reliabillties (Kuder-Richardson type, 0hisel1i,,1964, Formula 9719) were recalculated for the new shortened tests, andcompared with those of the original. (ORtG) 150-item test. The'obtained
v- values for the shortened tests were corrected by the Spearman-Brown Formula((;hiselli, 1964, Formula 9.-.4) to provide comparisons of 1.50-item tests.
Means and standard deviations were recalcu1ared separately forBlacks and Whites for the ,diortened tests and compared with those of theoriginal test.

Effects of Exam Construction and Processing Procedures
To examine alternative test construction or processing proceduresthat might raise test quality, a concurrent measure of on-job performancewas used. Since no longitudinal type of external criterion was availablefor the present analysis, such as a measure of technical job performanceat the next highe,r paygrade, the Performance Factor in the compositefor advancement competition was utilized for illustrative purposes.(Since this factor is a measure of present rather than subsequent jobperformance, and includes evaluation of interpersonal behaviors, suchas leadership and conduct, in addition to technical effectiveness, itsuse for illustrative purposes only is emphasized.)
The SEQUIN item-selection procedure was applied to the ADJ3 and BM2Exams with the Performance Factor as a criterion. Items selected earlyand late in the sequential procedure by two types of criteria--internal(total score) and external (on-job performance)--were then compared todetermine characteristics of valid items in predicting job performance.
RESULTS
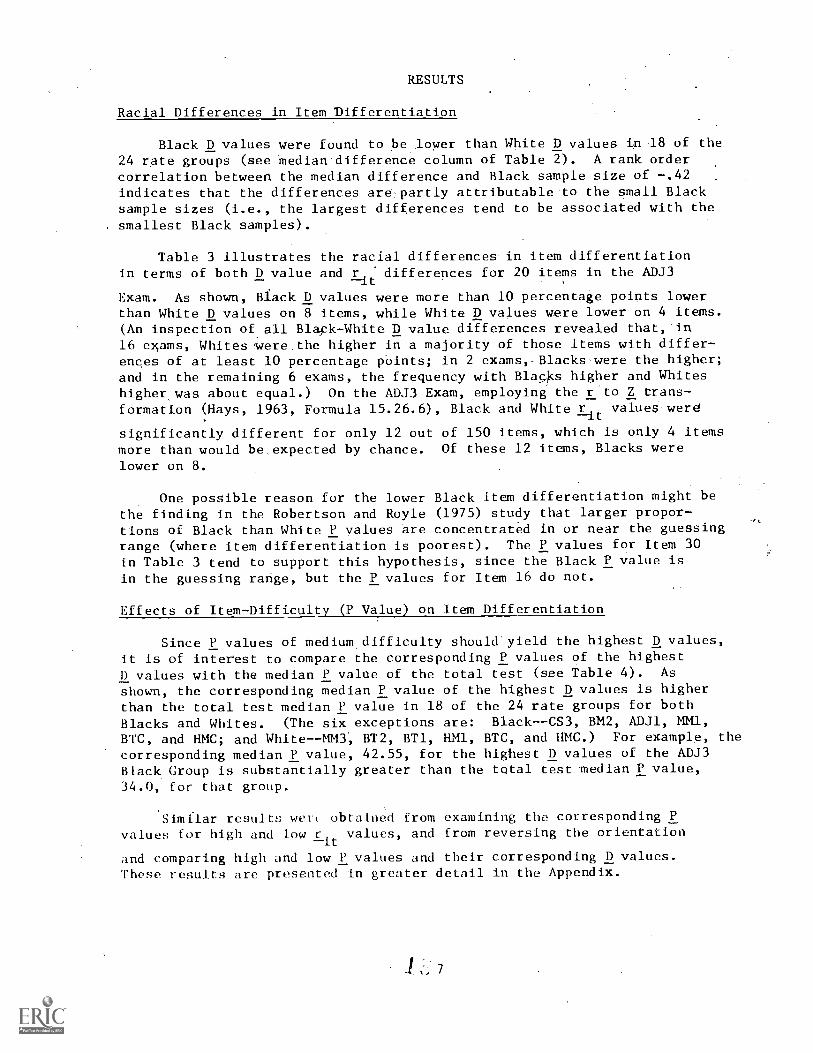
Racial Differences in Item Differentiation
Black D values were found to be lower than White D values in 18 of the24 rate groups (see median difference column of Table 2). A rank ordercorrelation between the median difference and Black sample size of .42indicates that the differences are partly attributable to the small Blacksample sizes (i.e., the largest differences tend to be associated with thesmallest Black samples).
Table 3 illustrates the racial differences in item differentiationin terms of both D value and rit differences for 20 items in the ADJ3
Exam. As shown, Black D values were more than 10 percentage points lowerthan White D values on 8 items, while White D values were lower on 4 items.(An inspection of all BlackWhite D value differences revealed that, in16 exams, Whites-were the higher in a majority of those items with differences of at least 10 percentage points; in 2 exams,-Blacks were the higher;and in the remaining 6 exams, the frequency with Bla4s higher and Whiteshigher, was about equal.) On the ADJ3 Exam, employing the r to Z transformation (Hays, 1963, Formula 15.26.6), Black and White r values werd
significantly different for only 12 out of 150 items, which is only 4 itemsmore than would be expected by chance. Of these 12 items, Blacks were
lower on 8.
One possible reason for the lower Black item differentiation might bethe finding in the Robertson and Royle (1975) study that larger proportions of Black than White P values are concentrated in or near the guessingrange (where item differentiation is poorest). The P values for Item 30in Table 3 tend to support this hypothesis, since the Black P value isin the guessing range, but the P values for Item 16 do not.
Effects of ItemDifficulty (P Value) on Item Differentiation
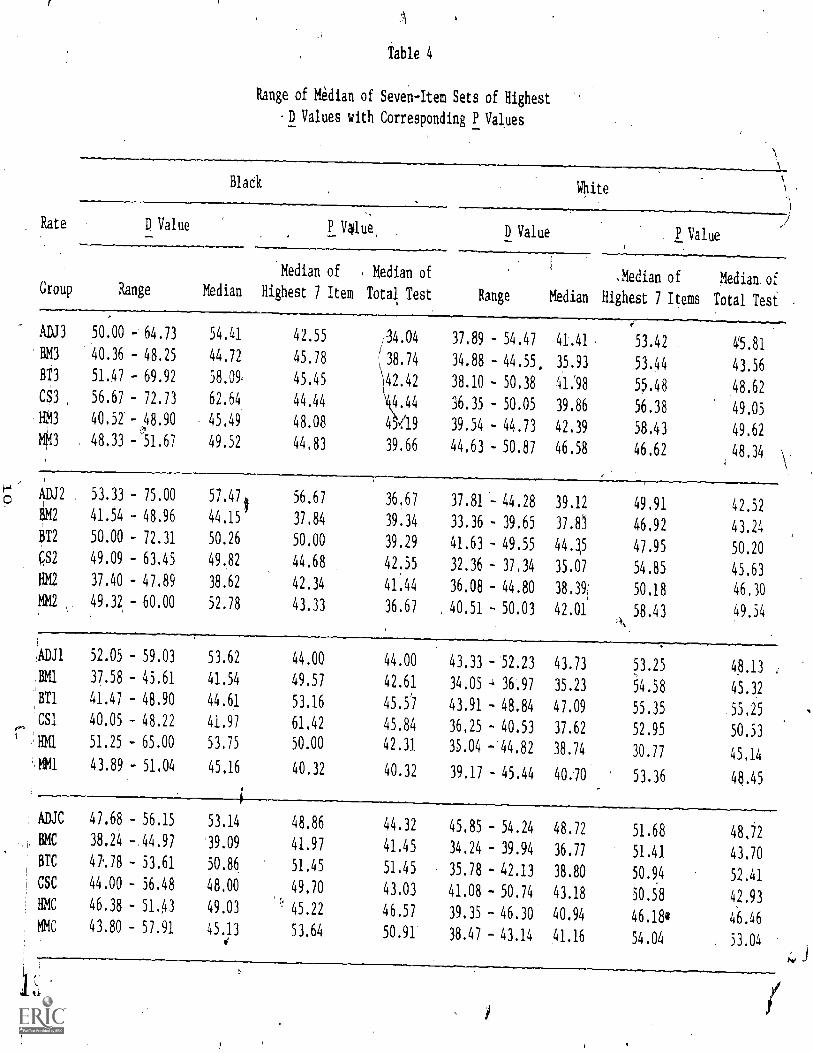
Since P values of medium difficulty should yield the highest D values,it is of interest to compare the corresponding P values of the highestD values with the median P value of the total test (see Table 4). As
shown, the corresponding median P value of the highest D values is higherthan the total test median P value in 18 of the 24 rate groups for bothBlacks and Whites. (The six exceptions are: Black--CS3, BM2, ADJ1, MM1,BTC, and HMC; and White--MM3., BT2, BT1, HM1, BTC, and HMC.) For example, thecorresponding median P value, 42.55, for the highest D values of the ADJ3Black Group is substantially greater than the total test median P value,34.0, for that group.
Similar results wer( obtained from examining the corresponding Pvalues for high and low r
Itvalues, and from reversing the orientation
and comparing high and low P values and their corresponding D values.These results are presented in greater detail in the Appendix.
1 0 7
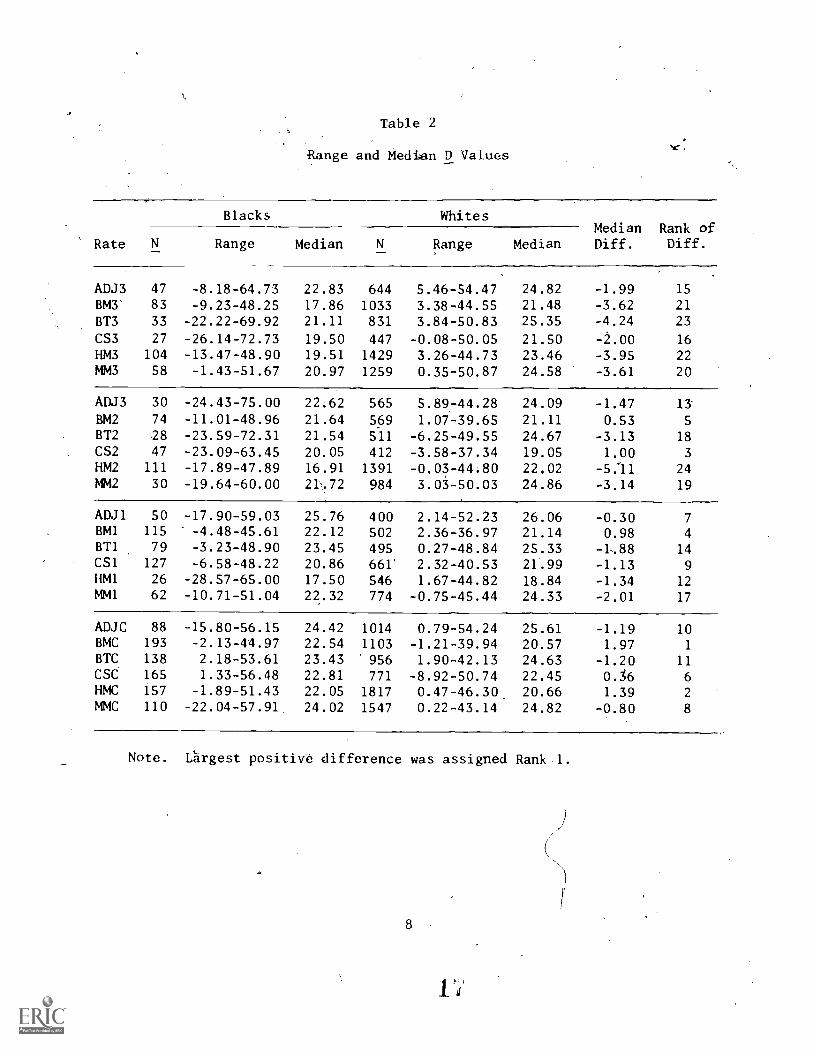
Table 2
Range and Median D Values
Rate
Blacks WhitesMedianDiff.
Rank ofDiff.N Range Median Range Median
ADJ3 47 -8.18-64.73 22.83 644 5.46-54.47 24.82 -1.99 15
BM3' 83 -9.23-48.25 17.86 1033 3.38-44.55 21.48 -3.62 21
BT3 33 -22.22-69.92 21.11 831 3.84-50.83 25.35 -4.24 23
CS3 27 -26.14-72.73 19.50 447 -0.08-50.05 21.50 -2.00 16
HM3 104 -13.47-48.90 19.51 1429 3.26-44.73 23.46 -3.95 22MM3 58 -1.43-51.67 20.97 1259 0.35-50.87 24.58 -3.61 20
ADJ3 30 -24.43-75.00 22.62 565 5.89-44.28 24.09 -1.47 13
BM2 74 -11.01-48.96 21.64 569 1.07-39.65 21.11 0.53BT2 .28 -23.59-72.31 21.54 511 -6.25-49.55 24.67 -3.13 18
CS2 47 -23.09-63.45 20.05 412 -3.58-37.34 19.05 1.00 3
HM2 111 -17.89-47.89 16.91 1391 -0.03-44.80 22.02 -5:11 24MM2 30 -19.64-60.00 21.72 984 3.03-50.03 24.86 -3.14 19
ADJ1 50 -17.90-59.03 25.76 400 2.14-52.23 26.06 -0.30 7
BM1 115 -4.48-45.61 22.12 502 2.36-36.97 21.14 0.98 4
BT1 79 -3.23-48.90 23.45 495 0.27-48.84 25.33 -1.88 14CS1 127 -6.58-48.22 20.86 661' 2.32-40.53 21.99 -1.13 9HM1 26 -28.57-65.00 17.50 546 1.67-44.82 18.84 -1.34 12MM1 62 -10.71-51.04 22.32 774 -0.75-45.44 24.33 -2.01 17
ADJC 88 -15.80-56.15 24.42 1014 0.79-54.24 25.61 -1.19 10BMC 193 -2.13-44.97 22.54 1103 -1.21-39.94 20.57 1.97 1
BTC 138 2.18-53.61 23.43 '956 1.90-42.13 24.63 -1.20 11CSC 165 1.33-56.48 22.81 771 -8.92-50.74 22.45 0.36 6HMC 157 -1.89-51.43 22.05 1817 0.47-46.30_ 20.66 1.39 2
MMC 110 -22.04-57.91 24.02 1547 0.22-43.14 24.82 -0.80 8
Note. Largest positive difference was assigned Rank 1.
8

Table 3
Racial Differences in It.Jelm DifferentiationFor 2b Selected Item6 o. he ADJ3 Exam
Item
No.
Black White
B Minus W-Difference4
P Value D Value r--it
P Value Ds Value rit
psa
Z Test
11 21.28 7.61 .330 34.32 25.42 .287 -17.81 .865 \
12 31.91 19.93` -.021 26.71 11.10 .036 8.83 -.359
13 42.55 23.73 .346 58.54 20.88 .143 2.85 1.392
14 34.04 41.12 .574 73.45 23.39 .315 17.73 2.101*
15 34.04 7.07 .028 38.51 9.13 .013 -2.06 .096,
16 46.81 -1.99 .176 51.55 35.18 .306 -37.17 -.887
17 46.81 32.07 ".228 61.49 23.80 .241 8.27 -.089
18 25.53 -1.09 -.026 29.97 8.45 .049 -9.54 -.481
19 27.66 36.21 .126 19.41 17.22 .168 18.99 -.275
2C 78.72 34.48 .108 72.98 29.56 .243 4.92 -.896
21 21.28 n 1.53 .063 23:76 16.68 .074 -15.15 -.071
22 19.15 50.00 .041 36.65 36,58 .343 13.42 -2.031*
23 34.04 25.86 .317 47.36 45.53 .387 -19.67 -.513
24 36.17 40.42 .140 49.07 32.54 .356 7.88 --1.485
25 38.30 9.96 ..,018 42.86 34.56 .340 -24.60 -2,157*
26 42.55 57.09 .474 49.22/
26.60 .272 30.49 1.516
27 29.79 32.76 .387 61.49/ 26.00 .266 6.76 .871
28 34.04 16.86 .115 44.88 31.50 .182 -14.64 -.440
29 34.04 -1.15 .201 33.54 20.76 .211 -21.91 -.067
30 21.28 1, 10.54 .314 55.75 54.47 .501 -43.93 -1.449
aDifferences greater than 25.00 are underlined.
bSignificance of difference between two rit correlations tested using
9r-to Z transformation 1
--,-. (Hays, 1963, formula 15.26.6).cr(Z1-Z2)
*Two-tail test, 13- < .05.
9
f'
Table 4
Range of Median of Seven-Item Sets of Highest
-D Values with Corresponding P Values
BlackWhite
Rate D Value P V4lue, D Value P Value
Group Range Median
Median of , Median of
Highest 7 Item Total Test Range
,Median of Median. of
Median Highest 7 Items Total Test
ADJ3 50.00 - 64.73 54.41 42.55 (34.04 37.89 - 54.47 41.41 53.42. 45.811213 40.36 - 48.25 44.72 45.78 (38.74 34.88 - 44.55. 35.93 53.44 43.56BT3 51.47 - 69.92 58.09 45.45 38.10 - 50.38 41:98 55.48 48.62CS3 56.67 72.73 62.64 44.44 4.44 36.35 - 50.05 39.86 56.38 49,05HM3 40.52 - .48.90 45,49 48.08 4 9 39.54 - 44.73 42.39 58.43 49.62Mt43 48.33 2'51,67 49.52 44.83 39.66 44.63 - 50.87 46,58 46,62 48.34
ADJ2 53.33 75.00 57,47 56.67 36.67 37.81 - 44.28 39.12 49.91 42.52iM2 41.54 - 48.96 44,15 37.84 39.34 33.36 - 39.65 37.81 46.92 43.24BT2 50.00 - 72.31 50.26 50.00 39.29 41.63 - 49.55 44.15 47.95 50.20C.S2 49.09 63.45 49.82 44.68 42,55 32.36 - 37,34 35.07 54.85 45,63HM2 37.40 - 47,89 38.62 42.34 41,44 36.08 - 44.80 38.39 50.18 46.30M112 49.32 60.00 52.78 43.33 36.67 40.51 - 50.03 42.01 58.43 49.54
ADJ1 52.05 59.03 53.62 44.00 44.00 43,33 -52.23 43.73 53.25 48.13BM1 37.58 - 45.61 41.54 49.57 42.61 34.05 4 36.97 35.23 54.58 45.32BT1 41.47 - 48.90 44.61 53.16 45.57 43.91 - 48.84 47.09 55.35 55.25CS1 40.05 - 48.22 41.97 61,42 45.84 36.25 - 40.53 37.62 52.95 50.53
51.25 - 65.00 53,75 50.00 42.31 35.04 - 44.82 38.74 30.77 45.14toil43.89 - 51.04 45.16 40.32 40.32 39.17 - 45.44 40.70 53.36 48.45
ADJC 47.68 - 56.15 53.14 48.86 44.32 45.85 54.24 48.72 51.68 48,72BMC 38.24 - 44.97 39.09 41.97 41.45 34,24 - 39.94 36.77 51.41 43,70BTC 47.78 - 53.61 50.86 51.45 51.45 35.78 - 42.13 38.80 50.94 52.41CSC 44.00 - 56.48 48.00 49,70 43.03 41.08 - 50,74 43.18 50.58 42.93INC 46.38 51.43 49.03 45.22 46.57 39.35 46.30 40.94 46.180 46.46MMC 43.80 57.91 45.13 53.64 50.91' 38.47 - 43.14 41.16 54.04 53.04
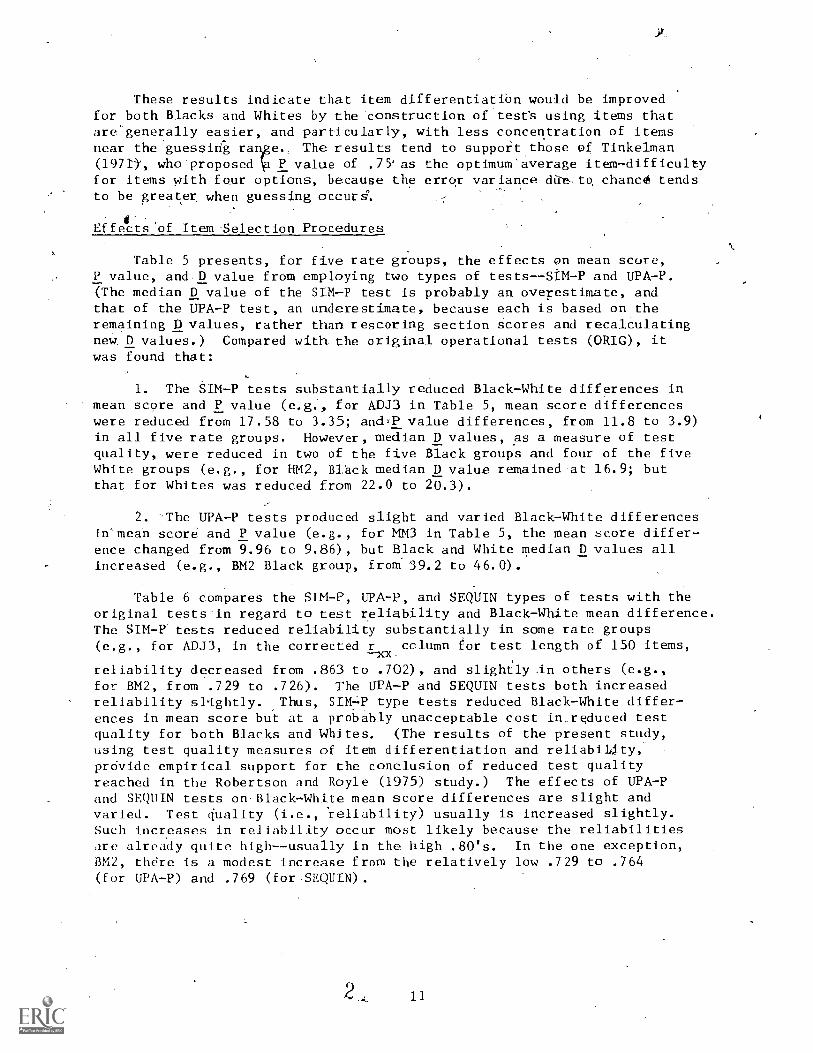
These results indicate that item differentiatiOn would be improvedfor both Blacks and Whites by the construction of test's using items thatare generally easier, and particularly, with less concentration of items
Tnear the guessing ra e.: The results tend to support those of Tinkelman(1971), who proposed P value of .75'as the optimum' average item-difficultyfor items with four options, because the error variance dire. to, chanc0 tendsto be greater, when guessing occurs,
Effects of Item Selection Procedures
Table 5 presents, for five rate groups, the effects on mean scure,P value, and D value from employing two types of tests--SIM-P and UPA-P.(The median D value of the SIM-P test is probably an overestimate, andthat, of the UPA-P test, an underestimate, because each is based on theremaining D values, rather than rescoring section scores and recalculatingnew, D values.) Compared with the original operational tests (ORIG), itwas found that:
1. The SIM-P tests substantially reduced Black-White differences inmean score and P value (e.g., for ADJ3 in Table 5, mean score differenceswere reduced from 17.58 to 3.35; andIP value differences, from 11.8 to 3.9)in all five rate groups. However, median D values, as a measure of testquality, were reduced in two of the five Black groups and four of the fiveWhite groups (e.g., for HM2, Black median D value remained at 16.9; butthat for Whites was reduced from 22.0 to 20.3).
2. The UPA-P tests produced slight and varied Black-White differenceshi'mean score and P value (e.g., for M/13 in Table 5, the mean score differ-ence changed from 9.96 to 9.86), but Black and White median D values allincreased (e.g., BM2 Black group, from 39.2 to 46.0).
Table 6 compares the SIM-P, UPA-P, and SEQUIN types of tests with theoriginal tests in regard to test reliability and Black-White mean difference.The SIM-P tests reduced reliability substantially in some rate groups(e.g., for ADJ3, in the corrected r cclumn for test length of 150 items,
reliability decreased from .863 to .702), and slightly An others (e.g.,for BM2, from .729 to .726). The UPA-P and SEQUIN tests both increasedreliability slightly. Thus, SIN -P type tests reduced Black-White differ-ences in mean score but at a probably unacceptable cost in,reduced testquality for both Blacks and Whites. (The results of the present study,using test quality measures of item differentiation and reliability,prOvide empirical support for the conclusion of reduced test qualityreached in the Robertson and Boyle (1975) study.) The effects of UPA-Pand SEQUIN tests on Black -White mean score differences are slight andvaried. Test quality (i.e., 'reliability) usually is increased slightly.Such increases in reliability occur most likely because the reliabilitiesare already quite high--usually in the high .80's. In the one exception,BM2, thdre is a modest increase from the relatively low .729 to .764(for UPA-P) and .769 (for,SEQUIN).
11
A
MIllt 5
Mena Tulal tic.oro, Median I' Ynjue, :111d D Value
Ity Race on Three Types of Tests
Rate Type
Group Test.
Black White B Minus W Difference
X Median Median X Median Mediail Median Median
Total P Value D Value . Total P Value D Value Total P Value D Value
ADJ3 ORIGa
b,dS1M-P
c,dUPA-PSIM-P minus
ORIGUPA-P minus
ORIG
HMS 01210b,d-.
S1M-Pc,d
UPA-PSIM-P minus
ORIG(IPA -P minus
ORIG
52.38 34.0 22.8 69.96 45.8 24.8
55.16 362 20.9 58.51 40.1 21.1
60.19 38,3 24.4 7:7.52 51.3 24.8
2.78 2.2 -1.9 -11.45 -5.7 -3.7
7.81 4.3 1.6 7.56 5.5 0
-17.58-3.35-17.33
-11.8-3.9
-13.0
68.0072.3576.10
45.2
48.1 .
49.0
19.5
19.520.3
73.4574.3981.34
49.650.353.1
23.5
22.724.6
4.35 2.9 0 .94 .7 -.8
8.10 3.8 .8 7.89 3.5 1.1
-5.45-2.04
-5.24
- 4.4
-2.2
-4.1
-2.0-0.2-0.4
-4.03.2
-4.3
MM3 ORIGa
SIM-Pb,dc,d
UPA-PSIM-P minus
ORIGUPA-P minus
ORIG
62.4866.5967.18
39.741.441.4
21.020.1
, 23.3
72.44 , 48.3
68.99 44.6
77.04 50.3
24.622.7
25.8
4.11 1.7 -.9 -3.45 -3.7 -1.9
4.70 1.7 2.3 4.6 2.0 1.2
-9.96- 2.4
-9.86
-8,6-3.2
-8.9
3.6
2.6-2.5
BM2 40RIGad
SIM-Pc
'
dUPA-P 'SIM-P minus
ORIGIIF'A -P minus
ORIG
60.1261.0369.27
39.2
41.246.0
21.6
21.624.4
63.4361.3472.24
43.241.548.0
.91 2.0 0 -2.09 -1.7
9.15 6.8 2.8 8.81 4.8
21.1
21.122.2
0
-3.31-.31
-2.97
3.90. 3
-2.0
0.5
0.5
2.2
HM2 (241Gab,dSIM -P
UPA-Pc,SIM-P minus
ORIGUPA-P minus
ORIG
.63.6067.8370.84
41.445.045.1
16.916.919.0
70.2769.6776,52
46.345.849.9
22.020.322.3
4_23 3.6 0 -.6 -.5 -1.7
7.24 3.7 2.1 6,25 3.6 -.3
6.67-1.84
75.68
-4.9-0.8-4.8
5.1
-3.4-3.3
aIncludes the complete set of 150 items.
b Includes only items in which the Black P value was not significantly less than than the lhite P value.
cIncludes only items in which the Black P value was greater than .25.N items in original test
dMean total scores are simulated by obtained SIM-P or UPA-P score timesN ;terns in simulated test
12
Table
Reliability, Mean, and Standard Deviation of Four Types of Tests
Rate Group Type Reliability Black White li-W
--( 0 _and N Test re
5 SU i .S X0xx
,Bisck/Mbite Items Obt.
ADJ347/644
ORIG 150 .863S1M-P 74 .638UPA-P 114' .830
SEQUIN 125 .854
SIM-P minusORIG
UPA-P minusORIG
SEQUIN minusORIG
H)43
104/1429
ORIG 149 .870SIM-P 115 .829UPA-P, 126 .867SEQUIN 12S .868SIM-P minus
ORIGUPA-P minus
ORIGSEQUIN minus
ORIG
f)013
58/1259
ORIG 150
SIM-P 9S
UPA-P 133
SEQUIN 125
minusORIG
UPA-P minusORIG
SEQUIN minusORIG
.884
.784
.878
.879
ORIG 150 .729SIM-P 126 .690(IPA -P 119 .720SEQUIN 125 .736
BM2 SIM-P minus74/569 ORIG
(IPA -P minus
ORIGSEQUIN minus
ORIG
HM2111/1391
ORIG 149 .820SiM-P 109 .710UPA-P ) 125 .800SEQUIN 125 .814SIM-P minus
ORIGUPA-P minus
ORIGSEQUIN minus
ORIG
°Items remaining after deletion.
bObtained (Oht.) value,
Corrected (Cor.) value for a test of
Cor.c
Dif,
.863 52.38 121.60 69.96 14.75' -1.285.702 27.21 5.18 28.86 5.89 -0.298.865 45.75 11.49 58.92 11.78 -1.131.875 44.66 11.21 60.24 13.19 -1,277
-.161
.002
.012
0
.870 68.00 11.17 73.45 15.53 -0.408
.863 55.85 8.47 57.41 11.85 -0.153
.885 64.36 10.18 68.79 14.45 -0,359
.887 59.69 10.69 64.55 14,48 -0,386
-.007
015.
.017
.884 62.48 12.26 72.44 16.56 -0.691
.851 42.17 7.48 43.69 9.78 -0,176
.890 59.57 11.52 68.31 15.48 -0.647.897 53.29 10.75 62.29 15.07 -0.697
.033
.006
.729 60.12 11.70 63.43 10.56 -0,297.726 51.28 9.98 51.55 9.08 -0.028.764 54.97 10.55k 57.33 9.67 -0.253.769 53.23 11.11 56.64 10.02 -0.322
003
.035
.040
.820 63.60 9.43 70.27 13.40 -0,584
.771 49.66 V.02 51.00 " 8.92 -0.168
.827 59.43 8.57 64.57 11.84 -0.503
.840 53.41 8.70
-.049,
007.
59.52 12.3b, -0.581
.020
150,items (Nunnally, 1967, Formula 7-6, p. 223).
d - k XkKe Difference -the mean difference in standard deviatioa units, calculated I
SDI) . Sbw
°Calculated on Black and White groups combined.

Effects of Exam Construction and Processing Procedures.
When the Performance Factor was employed as representative of anexternal, job-relevant criterion, the SEQUIN procedure reached:a maximumvalidity with a small subset of items. For the ADJ3 Exam, the value ofthe validity coefficient rose rapidly to a maximum of .206 with the selec-tion of the 20 most valid items (see Figure la); then tapered off to a slight
negative validity of -.031 for all 150 items. Similarly, for the BM2Exam, the validity coefficient reached a peak of .273 for 3.0 items, anda final value of .016. Compared to the validity coefficient, the value ,
of the reliability coefficient, which is largely a function of the numberof items in a test, continued to rise steadily (see Figure lb) during the I
selection of the first 100 items and leveled, off with the-selection of the"beSt" 120 items.
Since SEQUIN also identifies the specific items selected in the "accre-tion" process, it was possible to categorize items according to content andcompare items selected early and late in the process. In the selection ofitems from the ADJ3 Exam (see Table 7) , twice the proportion of theoreticalitems occurred in the last 25 (i.e., least valid) items as in the first 25(i.e., most valid), although this 16 percentage point difference was notsignificant when a chi square test was applied.
Comparing the ADJ3 Exam items selected by both an internal and anexternal criterion, items with the 14 lowest item-total correlations were.identified (r
it< .050). With the internal criterion, 11 of the 14 ,items
were among the last third of the itemOto be selected' (see Table 8).However, with the external criterion (the Performance Factor), 12 of the14 items were in the first third of the items selected. Particularly,
three of the items with both a very low P value and ra value were among
those selected earliestfirth, seventh, and thirteenth -by the externalcriterion.
Similar results were obtained on the BM2 Exam (see Table9). Twelve
of the 15 Items with the lowest item-total correlations were among thefirst third of Items sylectd by the external criterion,. with six of thoseitems among the first 24,
14
a.VALIOITY
0
-.05
.90
r .80
.70
>- .60
.50=a
_) .40wcc .30 -
.20-
.10
0
1 10 15 20 25 35 50 70 90 120 150
b. RELIABILITY
tr
1 1 1 1 i1, 10 15 20 25 35 50 70 90 -120 150
NUMBER OF BEST ITEMS
RI };111C I . I I NIS 1%1 I 017 ed Select 011 t) I 1110S V,1 1 1 1 item- byEQU I N (AD., 1 Exam. 1 .
Cto
4
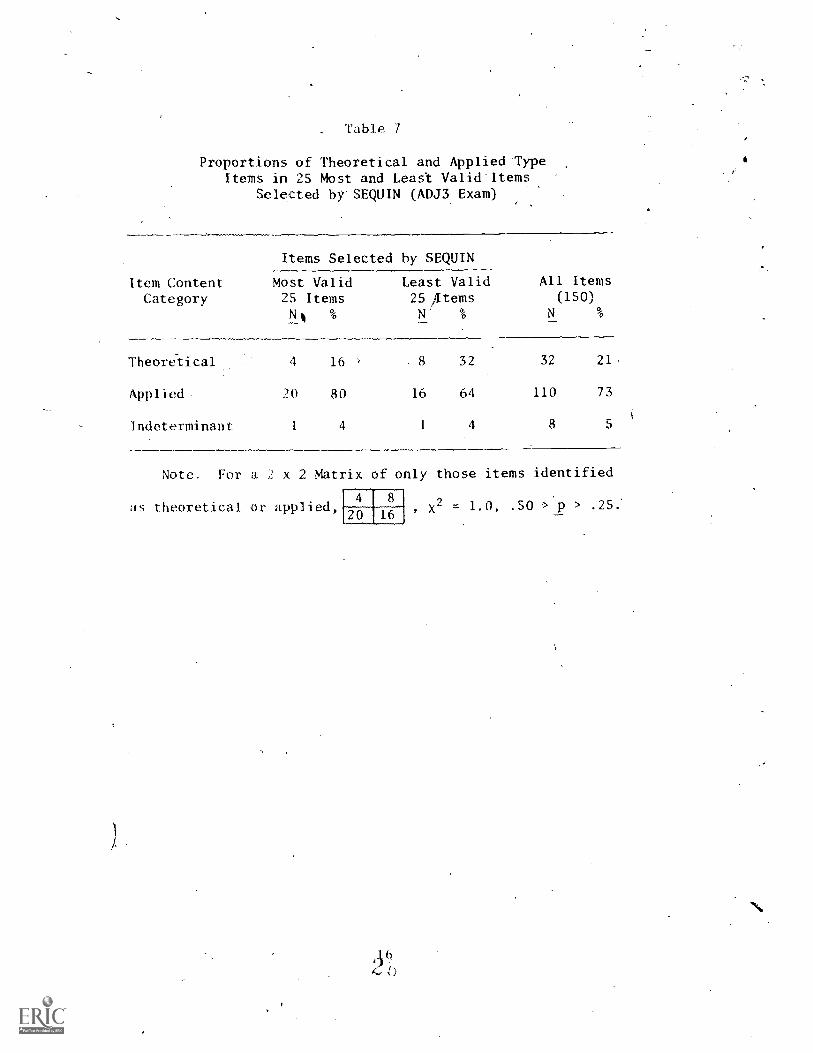
Table 7
Proportions of Theoretical and Applied TypeItems in 25 Most and Least Valid'Items
Selected by SEQUIN (ADJ3 Exam)
Items Selected by SEQUIN
Item Content Most Valid Least Valid All Items
Category 25 Items 25 Atems (150)
Nii % N' % N %
Theoretical 4 16 8 32 32 21.
Applied 20 80 16 64 110 73
Indeterminant 1 4 1 4 8 5
Note. For a 2 x 2 Matrix of only those items identified
as theoretical or applied,4 8
20 16
43"
,x2 = 1.0, .50 > p > .25.
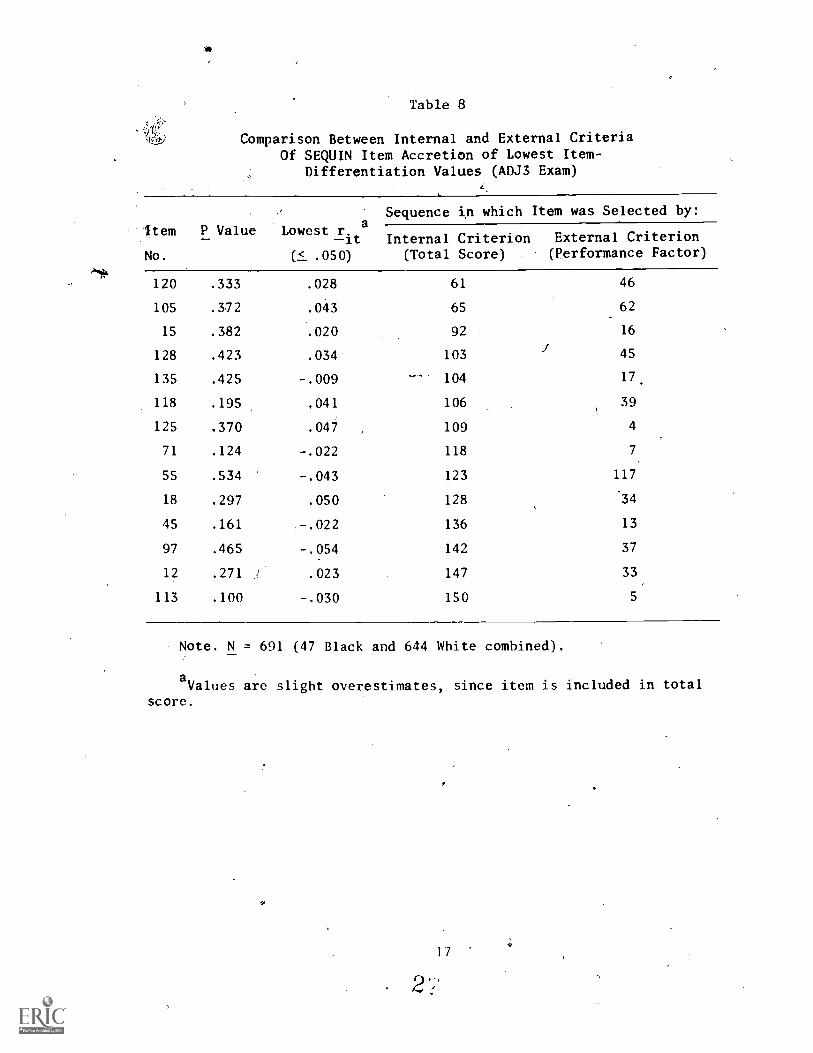
Table 8
Comparison Between Internal and External CriteriaOf SEQUIN Item Accretion of Lowest Item-
Differentiation Values (ADJ3 Exam)
item
No.
P Value Lowest r.a
it(5_ .050)
Sequence in which Item was Selected by:
Internal Criterion(Total Score)
External Criterion(Performance Factor)
120 .333 .028 61 46
105 .372 .043 65 62
15 .382 .020 92 16
128 .423 .034 103I
45
135 .425 -.009 -- 104 17.
118 .195 .041 106 39
125 .370 .047 109 4
71 .124 -.022 118 7
55 .534 -.043 123 117
18 .297 .050 128 '34
45 .161 -.022 136 13
97 .465 -.054 142 37
12 .271 , .023 147 33,
113 .100 -.030 150 5
Note. N = 691 (47 Black and 644 White combined).
aValues are slight overestimates, since item is included in total
Score.
2
17
,
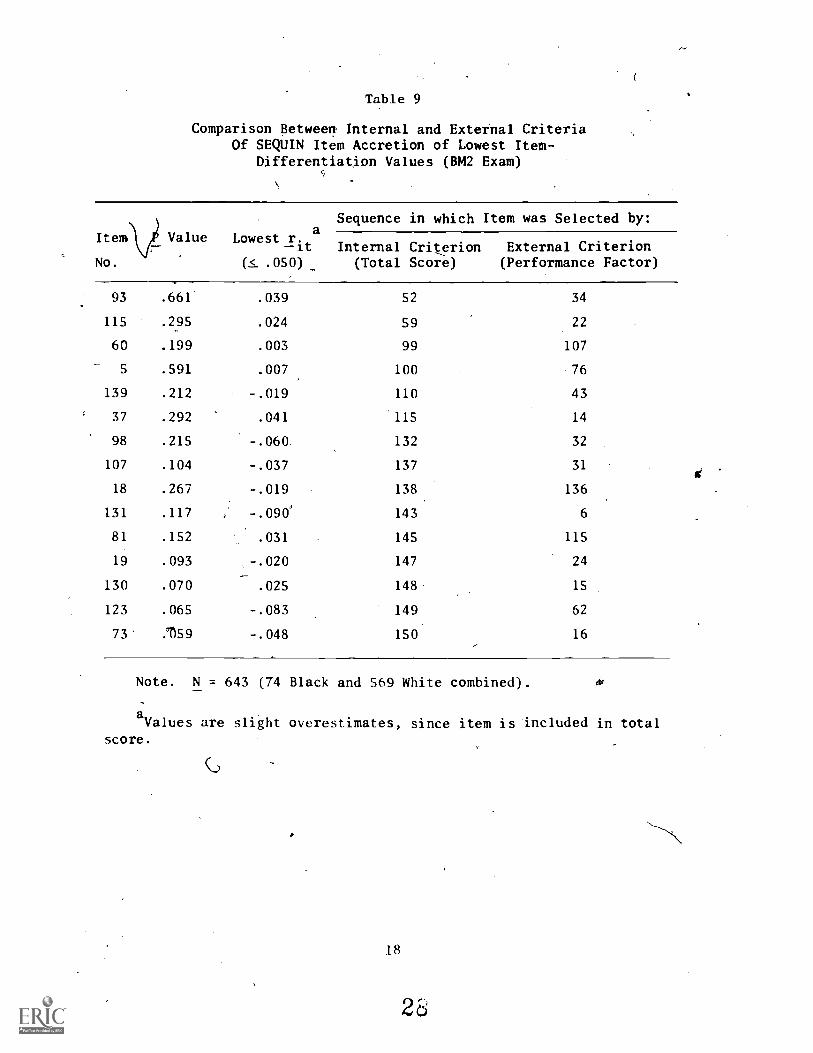
Table 9
Comparison Between Internal and External CriteriaOf SEQUIN Item Accretion of Lowest Item-
Differentiation Values (BM2 Exam)
Item
No.
Value Lowest r.--it Internal Criterion External Criterion
(.5._ .050) (Total Score) (Performance Factor)
Sequence in which Item was Selected by:
93 .661 .039 52 34
115 .295 .024 59 22
60 .199 .003 99 107
5 .591 .007 100 76
139 .212 -.019 110 43
37 .292 .041 115 14
98 .215 -.060 132 32
107 .104 -.037 137 31
18 .267 -.019 138 136
131 .117 -.090' 143 6
81 .152 .031 145 115
19 .093 -.020 147 24_
130 .070 .025 148 15
123 .065 -.083 149 62
73' n59 -.048 150 16
Note. N = 643 (74 Black and 569 White combined).
aValues are slight overestimates, since item is included in total
score.
18
26
DISCUSSION
Procedures for Improving Advancement Tests
The pioblem of how to improve enlisted advancement exams is discussedin the light of the results reported above, the reality of the administra-tion and use of the tests, and the desirability of achieving one or more ofthree objectives - -(1) increasing test reliability, (2) increasing testvalidity, and (3) decreasing Black-White score differences. It is, of
course, easier to state an objective than to achieve it. Even when therules of good item construction are followed, there is no assurance thatthe item characteristics desired will be achieved, unless the items arepretested. Nunnally (1967) suggests pretesting at least twice as manyitems as are intended for the final test. Although such a procedure maybe ideal, there are practical limitations in regards to the developmentof Navy enlisted advancement exams. Advancement is intensely competitive,particularly in the higher paygrades where the proportion of openings ismuch smaller than the proportion of highly qualified candidates available.If items were pretested on a sample group, the examinees in the samplegroup might have the advantage of being alerted to the specific contentof the forthcoming exam. Also, the P values would probably be lower inthe pretest than in the operational test, since the pretest examinees wouldnot be motivated to study as intensely as they would for the operationaltest.
In lieu of a pretesting procedure, the tests could be improved bythe employMent of four other procedures:
1. Test validation on an external, job-relevant criterion.
2. Identification of the most and least valid items, and a contentcategorization of the items identified.
3. Utilization of item construction procedures that tend to produceitems with the desired characteristics (e.g., havi specified levelsof item difficulty, differentiation, and validity).
4. Post hoc item deletion procedures that eliminate undesirable itemsafter administration but prior to,final scoring.
Each of these four approaches is discussed in detail below.
Test Validation
The primary concern with a personnel selection test is, of course,its relevance to the purpose of the selection--in the present case, tothe individual's effectiveness in the next higher grade for which selected.The measures of test quality investigated in the present study--testreliability and item differentiation--are important to test validity (bysetting upper limits on it) but do not of themselves assure test validity.
19

Validation of the advancement exams on job-relevant criteria isneeded for two reasons. First, the courts are becoming increasingly in-sistent on empirical evidence of the job relevance of personnel selectionprocedures in compliance with the Civil Rights Act of 1964. Second, CNOObjective Number CNO-1, entitled Retention of Career Personnel (ofSeptember 1974), is not addressed to the retention of personnel ingeneral, but rather, to the retention of top quality career personnel.The demonstration of top quality certainly is largely a function of anindividual's effectiveness on the job; and motivation to reenlist iscertainly heavily influenced by advancement success. ----.
Highly effective validation procedures are available that would beresponsive to the above two requirements. The SEQUIN procedure, which wasdemonstrated with an illustrative job-relevant criterion, was shown to bequite useful, not only to maximize the validity of a test using a subsetof items but also to identify the specific items.which contribute to, anddistract from, prediction of the criterion behavior.
Identification and Categorization of Valid Items
Since SEQUIN identifies the specific item selected in the "accre-tion" process, it also provides test makers with the capability to analyzeand categorize the content of each item. With'this knowledge, certain"mixes" of various categories of items could be considered in the construc-tion of future tests. For example, there might be an optimal ratio oftheoretical to applied type items for maximum job-relevant validity. The
difference between proportions of theoretical and applied items in thefirst and last 25 items selected in the ADJ3 Exam was not significant.However, with larger pools of items (e.g., the first and last 50-item sub-sets from a number of exams of similar occupational specialities), signi-ficant differences might be identified. Also, categories other thantheoretical-applied might be studied, such as the differential validityof the content of the subtest sections.
Item Construction Procedures
In the reliability analysis of five rate groups (see Table 6),the reliability of the BM2,Exam, .729, was substantially below that ofthe other four groups. This result might be a function of either itemstatistical or structural characteristics. For example, the median Pvalue (see Table 4) and D value (see Table 2) of the BM2 White group arerelatively low among all White groups. (Since the Black and White groupsof each rate group were combined to'calculate the reliability, the obtainedvalue reflects primarily the distribution statistics of the majority Whitegroup.)
Although the literature abounds with guidance for item writing,many of the rules have not been adequately evaluated empirically. In oneempirical demonstration of undesirable item characteristics, Dudycha andCarpenter (1973) found that:
1. An inclusive distractor, such as "all (or any or none) ofthe above" (as opposed to a specific distraCtor, which is a specified wordor phrase) reduces item differentiation.
2. A negative stem structure, which includes the word "not"(as opposed to a positive stem structure, which does not) increases-itemdifficulty.
3. An open-stem structure, which requires the answer to completethe sentence (as opposed to a closed-stem structure, which is a completesentence) increases item difficulty.
4. The combination of open-positive stems and closed-negativestems in.the same test reduces item differentiation.
It was observed that all foiir of these item designs are used with varyingfrequency,in the present advancement exams, particularly in the BM2 Exam.It would thus be useful to determine whether the Use of these (and perhapsother) structures contributes to undesirable item chafacteristics (e.g.,reduced P values or D values).
Also, median P values and D values would probably be increased byraising the criterion values for reuse of items (e.g., P values no lessthan .30 or greater than .85, and r with item in score, no less than
.05) but subject to item validity with an external criterion.
Post Hoc Item Deletion Procedures
Although pretesting of items is probably not feasible, applica-tion of item deletion procedures which eliminate undesirable items (e.g.,.those with, extreme high or low P values, or low differentiation values)subsequent td administration but prior to final scoring for selectionpurposes might increase the reliability or validity-of the exams. TheSEQUIN accretion procedures described above demonstrated that a subsetof items could be selected that yields a higher validity than, and anequally high reliability as, the total set of items. However, these resultsshould be considered tentative, because the procedure capitalizes on theintercorrelations of the sample data, and is thus influenced by chance.Cross-validation is necessary to ensure that the results are not an effectof sampling error (Henryssen, 1971).
The selection of items to increase reliability will usually tendto increase validity (Henryssen, 1971). 'However, if excessive emphasisis placed on increasing test homogeneity, the test may beceme too narrowand one-sided in content to have high validity. In the SEQUIN demonstra-tion with,the ADJ3 and BM2 Exams, many of the items with the lowest item-total correlation were selected by an internal criterion near the end ofthe accretion process, but by an external critorloh., near the beginning.
A number of reasons might account for these results (other thanthat the use of the present Performance Factor as an external criterionmay not have been appropriate, even for illustrative purposes). If the
21 3
test content tends to be heterogeneous, rather than homogenous, assuggested by some of the low intercorrelations among section scores, theninternal consistency type measures of reliability may be of limited rele-vance. This possibility is suggested by a comparison between the reli-'ability and validity coefficients of the ADJ3 and BM2 Exams. Althoughan internal consistency type measure of reliability places an upper limiton the validity of a test, the situation only applies with homogenoustests. However, with a heterogeneous test, elimination of items with lowitem-total correlations could result in the reduction of predictablevariance. It may be observed that the reliability of the BM2 Exam islower, but its validity is higher,than those of the ADJ3 Exam. Also,when the correlation between two tests is near zero or slightly negative,(as is the ADJ3 Exam with the external criterion), the items that correlateLowest with total test score (i.e., the lowest rit- values) could very well
be those that correlate highest with an external criterion.
Balancing Item Biases
Another issue pertains to the question of the compatibility of thetwo objectives identified by the Chief of Naval Personnel to be investi-gated--the feasibility of compiling "tests eomposed of questions havingidentical or correlatable degree of difficulty 0.2)lo factors for bothBlacks and Whites." The Robertson and Royle (1975) study was addressedto the first objective, "identical" difficulty; and the Robertson andMontague (1976) study, to the second, "correlatable" difficulty. Thepresent study addressed both objectives in the context of item differen-tiation and test reliability.
Both the Robertson and Royle (1975) and the present study found that theconstruction of tests of items of similar difficulty--from the existingpool of items--was not feasible. The question might be raised as to theexistence of, or the possibility of developing, items on which Blacksare superior. If such items were found,-tests might be constructed with
2a "balance" of items in which Whites do well on some, and Blacks, on others.Ironically, such tests would result in incredsed racial bias, as measuredby a decrease in relative item difficulty (Rho value). (The issue of"balancing" item biases is discussed briefly by Cleary and Hilton (1968)and by Jensen (1973).)
Implications of the Results
The demonstrations of improved item differentiation by eliminatingexcessively difficult items and items with low or negative differentia-tion suggest the need to implement the item-deletion and item-construc-tion procedures discussed. Such procedures would result in a slightdecrease in mean score differences between Blacks and Whites and, in termsof test quality, a slight increase in item differentiation for Whites and
. a moderate increase for Blacks. Also, any procedure that would raise thelever of P values would reasonably be expected to reduce the proportionfailed by the exam cut-score, thereby enabling those who passed to con-tinue to compete on their other advancement factors. Although such aprocedure was not demonstrated in the present study, it is of particularinterest and advantage to Blacks.
22
HOwever, the SEQUIN demonstration, in which the items selected werecompared by internal and external criteria, alsO suggest that items deletedto 'Increase item differentiation or test homogeneity may be the types ofitems that best contribute to predicting job-relevant performance by anexternal criterion. Thus, until external validation studies are performedto determine the relationship of test heterogeneity to subsequent perfor-mance in the grade to which advanced, recommendations to implement the pro-cedures discussed above are deemed premature.
23
CONCLUSIONS
1. Enlisted Advancement Exam item differentiation and internal con-sistency type tesc reliability could be improved for both Blacks and Whitesby using item selction and construction procedures identified, developed,or demonstrated in this study.
2. The development of tests in which only the items similar in difficultyfor both Blacks and Whites are used is not feasible because it would reduce .
test quality. However, the elimination of ekcessively difficult items,by either alternative item construction, or, post-administration item dele-tion procedures, would improve test quality and, in particular, benefitBlacks, because the propoition of candidates failed by the exam cut-scorewould be reduced, thereby enabling those who passed to continue to com-pete on their other advancement factors.
3. The two objectives that were identified for investigation in thepresent series of studies--the feasibility of compiling "tests composed ofquestions having identical or correlatable degree of difficulty . .
for both Blacks and Whites"--may not be compatible. As stated%above,construction,of tests of only items of "identical" difficulty, at leastfrom the existing pool of items, was not feasible. Using "balanced" itemsmight be an alternative to items of "identical" difficulty. However, evenif new items could be developed on which Blacks were superior, and teststhen constructed with a "balance" of items in which Whites do well on someand Blacks on others, such tests would be characteristic of reduced "cor-relatable" degree of difficulty. Thus, the use of a measure of relativeitem difficulty as an indication of possible racial bias appears to be oflimited relevance in a study directed towards identifying effective pro-cedures to.provide all racial groups with similar opportunities for advance-ment.
25
RECOMMENDATIONS
The fundamental question regarding racial differences in advancementshould pertain to-the relationship of each selection factor, includingthe present Technical Knowledge Exam, to subsequent job-relevant performancein the grade to which selected., The results of the final phase of thepresent analysis raise important new questions regarding differencesbetween the "best" items selected by an internal and an.external criterion.Thus, implementation of the procedures discussed or demonstrated in thepresent study (which was at the exploratory level of research), priorto addressing these new-questions, would be premature.
It is recommended that: (1) the empirical validity of the presenttestS,on subsequent performance be compared between Blacks and Whites,and (2) the alternative item processing and item construction proceduresdiscussed in the present study be validated and compared on internal andexternal criteria.
3L,27
REFERENCES
Cleary, T. A., & Hilton, T. L. An investigation of item bias. Educationaland Psychological Measurement, 1968, 28, 61-75.
Conrad, H. S. Characteristics and Uses of item analysis data. PsychologicalMonographs, 1948, 62, (Whole No. 295). (See Appendix)
Dudycha, A. L., & Carpenter, J. B. Effects of item format on item dis-crimination and difficulty. Journal of Applied Psychology, 1973, 58,116-121.
Ghiselli; E. E. Theory of psychological.measurepent. New York: McGraw-Hill, 1964.
Hays, W. L. Statistics for psycholopsts. New York: Holt, Rinehart, &Winston, 1963.
Henryssen, S. Gathering, analyzing, and using data on test -items. InR. L. Thoindike (Ed.), Educational measurement (2nd ed.). Washington, D.C.:American Council on Education, 1971.
Jensen, A. R. An examination of culture bias in the Wonderlic PersonnelTest. Paper presented at the National Academy of Sciences, Washington, D.C.,October 22, 1973.
'Kelley, T. L. Selection of upper and lower groups for the validationof test items. Journal of Educational Psychology, 1939,.30, 674-680.(See Appendix)
Lawshe, C. H., Jr. A nomograph for estimating the validity of test items.Journal of Applied Psychology, 1942, 26, 846-849. (See Appendix)
Moonan, W. J., Balaban, J. G., & Geyser, M. J. SEQUIN II: A computerizeditem selection and regression analysis procedure. San Diego: NavyPersonnel Research and Development Center, July 1967. Paper presentedat the Military Testing Association Annual Conferense, Toronto, Canada,September 1967'.
Nunnally, J. C. Psychometric theory. New York: McGraw-Hill, 1967.
Robertson, D. W., & Montague, W. E. Comparative raci4 analysis ofEnlisted Advancement Exams: Relative item-difficulty betweenperformance-matched groups (Tech. Rep. 76-34). San Diego: NavyPersonnel Research and Development Center,)larch 1976.
Robertson, D. W., & Royle, M. H. Comparative racial analysis ofEnlisted Advancement Exams: Item-difficulty (Tech. Rep. 76-6).San Diego: Navy Personnel Research and Development Center, July 1975.
Tinkelman, S. N. Planning the objective test. In R. L. Thorndike (Ed.),Educational measurement (2nd ed.). Washington,"D.C.: American Councilon Education, 1971.
29
36
APPENDIX
METHODOLOGICAL ISSUES IN ITEM ANALYSIS
3A-0
APPENDIX
MUMODOLOGICAL ISSUES IN ITEM ANALYSIS
The calculation of item-difficulty and item- differentiation indicesfor a large number of tests With large subject pools permitted'investiga-tion of methodological questions as well as the study of racial groupdifferences.
A number of computational approaches may be used in determining item-differentiation using the item-total relationship, including the and d
D value) techniques employed in this study. These and other alternativeprocedures provide much the same information. ; The rankingsof item-differ-entiation values by alternative procedures usually yield cotrelationsamong the ranks in the .90's (Nunnally, 1967). In computing item-differ-entiation statistics, if the item itself is included in the total (orsection) score, some portion of the correlation value obtained will bean artifact from the presence of the item itself (Nunnally, 1967).(Obviously, the size of this artifact will vary inversely with the numberof items'. in the test/section.) Also, if a test contains subtests (i.e.,"sections") of differing content (i.e., a nonhomogenous type test), itmay be more appropriate to compare item responses with the subtest scorethan with total score.
Alternative Item Analysis Procedures_Employed
To investigate the effects of including the item.in the total scoreand of computing item-differentiation statistics on sections vice totaltest scores, the follwing alternative statistics were computed:
1. r (w/'item)--item-section correlation, with the item included
in the section score.
\27 1:4s (w/o item)--item-section correlation, without the item in
cluded in the section score.
3. rit
(w/ item)--item-total correlation, with the item included
in the total score.
4. r-lt (w/o item)--item-total correlation, without the item in-
eluded in the total test score.
'lThe D value of the present study is to be distinguished from theLawshe (1942) D value, adopted from the Kelley (1939) technique, whichexpresses the difference between the two scoring groups in terms ofsigma units.
A-1
A !-
5. D value (w/ item)--percentage difference between high and lows
section scorers /ho answered the item correctly.
6. Dtvalue (w/ item)--percentage difference between high and low
total scorers who answered the item correctly.
Dsvalues (hereafter referred to as D values) were calculated on all
items for all 24 rate groups employing the above procedure 5. Althoughthis procedure produces values that Are overestimates from the presenceof the item itself in the section score, it Agas considered useful for thepresent analysis, since the primary interest concerned the relative sizeof the values between Blacks and Whites, rather than the absolutesizeof the D value.
Idtercorrelations among section and-total-test scores were calculatedfor four selected rate groups.
Effects on item -Test Correlation From Including Item in Score
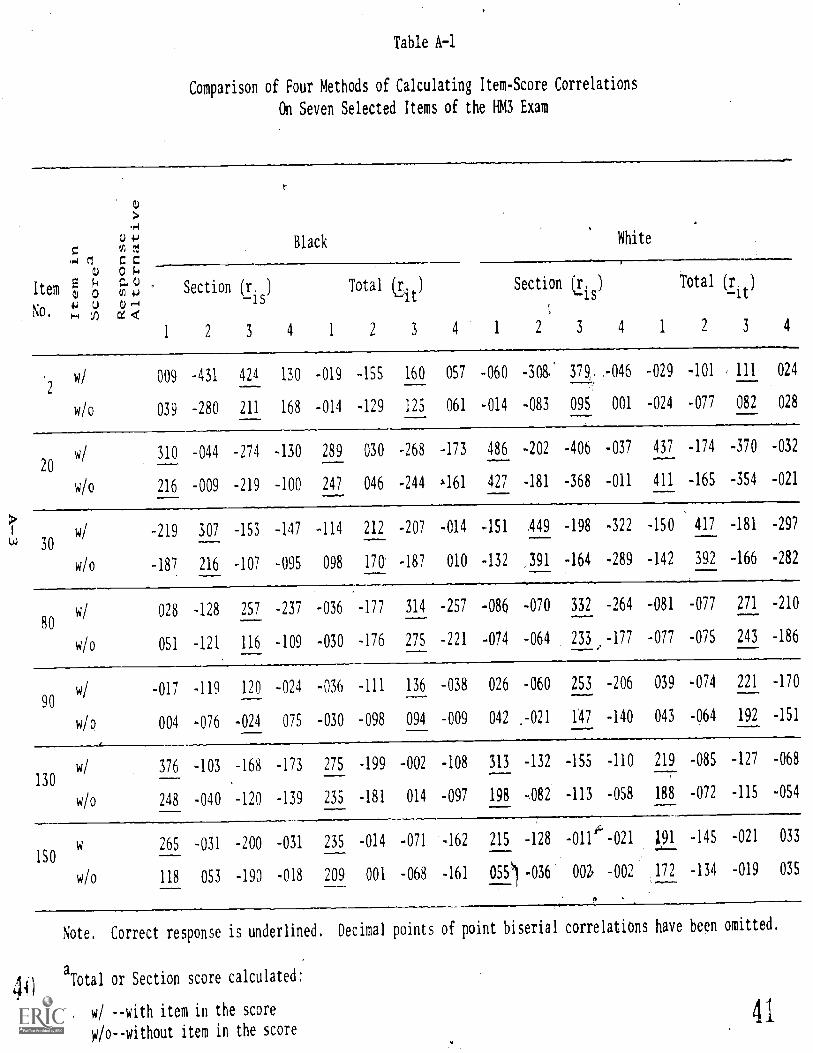
iable A-1 presents item-score point biperial correlations for allfour alternative responses for seven selected items of the 11M3 Exam,calculated,, both with and without the item included in the score. Thecorrelations between each alternative item'tesponse and test scoLp-werefound to be higher when the item was included in the score than en itwas not included. This finding is consistent with discussions in thegeneral literature (e.g., Nunnally, 1967). Inclusion of the item in thesection score frequently increases substantially the r of the correct
'response alternative (e.g., for Item 2 alternative ), from .211 to .424.for Blacks, and from 095 to .379 for Whites). Inclusion of the itemin total score, however, usually increases the r
ithy only .02 to .04
correlation points (e.g., for Item 130 alternative 1, from .235 to .275for Blacks, and from .188 to .219 for Whites). .The 'increase in List from
inclUsion of the item in the section score, is greatest in the lowestr values without the Item (e.g., for Whites, from .055 to,.215 in Item
150, compared:with .391 to .449 in Item O), although the difference inris
is slight (e.g., for Whites, from .003 to .046, a difference of .043
in Item 150, compared with'a difference of .049 in Item 30).
, In calculating D values, ,a similar procedure could have been applied,by dividing the group into high and low scorers for each item on thebasis of their score without that item included. This lengthy procedurewas not applied, therefore all obtained D values can be considered to beoverestimates.
A-2
4U
Table A-1
Comparison of Four Methods of Calculating Item-Score Correlations
On Seven Selected Items of the I1M3 Exam
EItem 0
No,
mC
Black White
U 0HH C400 m 0u 0
1
Section (ris)
2 3 4 1
Totalbrit)
2 3 4 1
Section (ris)
;
2 3 4 1
Total (rit)
2 3 4
2
w/ 009 -431 424 130 -019 -155 160 057 -060 -308: 379, .-046 -029 -101 , 111 024
w/o 039 -280 211 168 -014 -129 125 061 -014 -083 095 001 -024 -077 082 028
20w/ 310 -044 -274 -130 289 030 -268 -173 486 -202 -406 -037 437 -174 -370 -032
w/o 216 -009 -219 -100 247 046 -244 A161 427 -181 -368 -011 411 -165 -354 -021
30w/ -219 307 -153 -147 -114 212 -207 -014 -151 449 -198 -322 -150 417 -181 -297
w/o -187 216 -107 -095 098 170 -187 010 -132 ,391 -164 -289 -142 392 -166 -282
80w/ 028 -128 257 -237 -036 -177 314 -257 -086 -070 332 -264 -081 -077 271 -210
w/o 051 -121 116 -109 -030 -176 275 -221 -074 -064 233 -177 -077 -075 243 -186
90w/ -017 -119 120 -024 -036 -111 136 -038 026 -060 253 -206 039 -074 221 -170
w/o 004 -076 -024 07S -030 -098 094 -009 042 ,-021 147 -140 043 -064 192 -151
130w/ 376 -103 -168 -173 275 -199 -002 -108 313 -132 -155 -110 219 -085 -127 -068
w/o 248 -040 -120 -139 235 -181 014 -097 198 -082 -113 -058 188 -072 -115 -054
150265 -031 -200 -031 235 -014 -071 -162 215 -128 -0111;-021 191 -145 -021 033
w/o 118 053 -190 -018 209 001 -068 -161 0551 -036 002 -002 172 -134 -019 035
Note, Correct response is underlined. Decimal points of point biserial correlations have been omitted.
aTotal or Section score calculated:
w/ --with item in the score
W/o -- without item in the score41
Comparison of Item Differentiation by Section and Total Score
As expected, Ds values were found to be higher than D-t
values. As
illustrated with 15 selected BM2 items in Table A-2, Black Dsvalues
exceeded Di values by 4 to 41 percentage points with four exceptions
(e.g., in Item 10, the D value was lower by about 10 points). Also the
rank order of item differentiation varied considerably both by method(11 and 2
t) and by race.
Table A-3 presents the item-score correlations, of the correct responseonly, for 13 items (including the 7 items in Table A-1) from the HM3 Exam,along with corresponding D values and P values.2 The'ranks (among the 13items) of alternative item-differentiation values are quite similar acrossmethod (e.g., r
isand D
s'r and r
--it'etc.) when both methods include
-- -the item in the score, and when both methods exclude the item. However,the ranks vary when one method with the item included is compared withanother method with the item excluded. For example, on Item 110, the Whitegroup ranks for r
is(rank 11) and 'DD (rank 12), with the item in the score,
-- -sare nearly the same compared to the Lis rank without the-item (rank 6).
Of particular interest in Table A-3 is the comparison between and
Lit values (without the item included in the score). If the total test
contains section of differing content, use of ris
may be more appropriate
than Lit (as discussed on page A-1). Tables A-4 and A-5 present intercorre-
lations among section and total scores for two exams. For example, onthe HM3 Exam (see Table A-4), section-section correlations range from-.011 (sections 1 and 6) to .431 for Blacks, and from .019 to .648 forWhites. Section-total correlations range from .363 to .814 for Blacks,and from .370 to .904 for Whites. (The section-total correlations arespuriously high, since the section is included in the total score.)
2The measure of item-difficulty employed in this item-analysis wasthe P value, the percentage of a group which answers the item correctly(i.e., as defined by Tinkelman (1971,,p. 62), the lower the P value, themore difficult the item). This measure is to bedistinguished from analternative measure of item-difficulty, Delta value, designated by theGreek letter, "A-i" and characterized by higher A values associated withmore difficult items. This latter measure employs "transformed criterion-scores" of the persons attempting, the item and is particularly appropriatein tests measuring speed of performance (Conrad, 1948). Because bothBlacks and Whites tend to complete the entire test, the simpler P valuewas used In the present analysis.
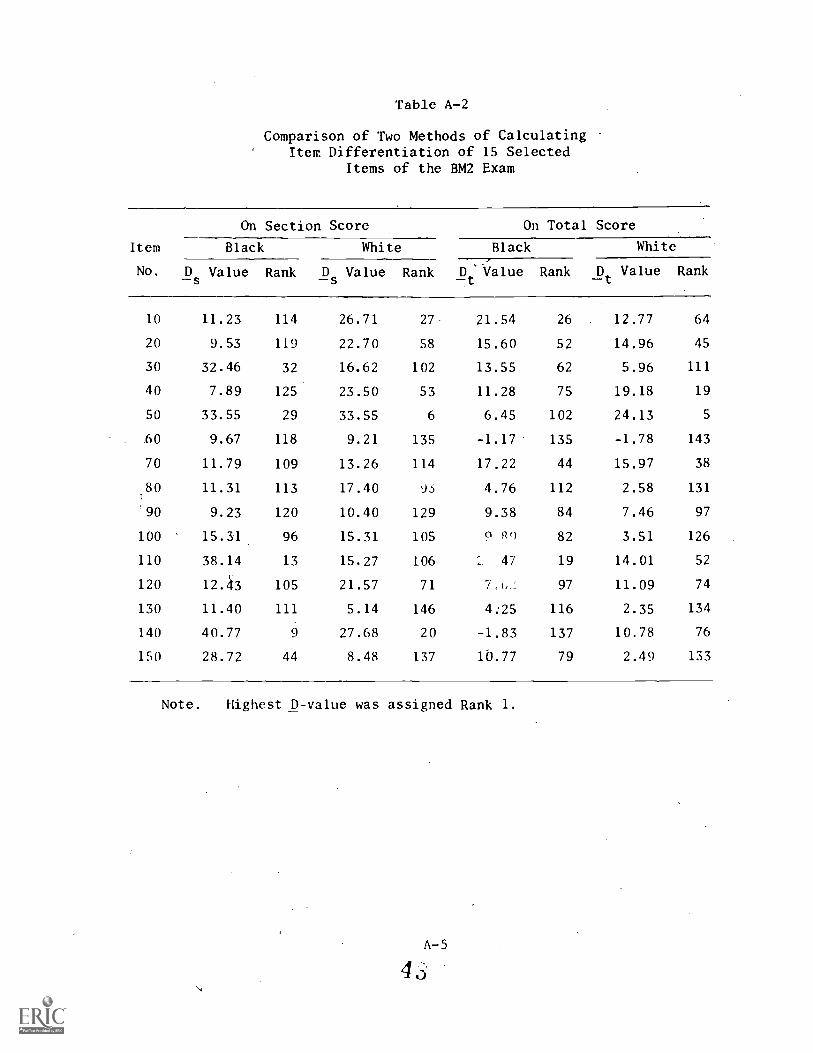
Table A-2
Comparison of Two Methods of CalculatingItem Differentiation of 15 Selected
Items of the BM2 Exam
Item
No.
On Section Score On Total Score
Black White Black White
IDsValue Rank lDs Value Rank p
tValue Rank Dt Value Rank
10 11.23 114 26.71 27 21.54 26 12.77 64
20 9.53 119 22.70 58 15.60 52 14.96 45
30 32.46 32 16.62 102 13.55 62 5.96 111
40 7.89 125 23.50 53 11.28 75 19.18 19
50 33.55 29 33.55 6 6.45 102 24.13 5
60 9.67 118 9.21 135 -1.17 135 -1.78 143
70 11.79 109 13.26 114 17.22 44 15.97 38
80 11.31 113 17.40 9.) 4.76 112 2.58 131
!90 9.23 120 10.40 129 9.38 84 7.46 97
100 15.31 96 15.31 105 0 RO 82 3.51 126
110 38.14 13 15.27 106 2 47 19 14.01 52
120 12.'3 105 21.57 71 7.o_ 97 11.09 74
130 11.40 111 5.14 146 4:25 116 2.35 134
140 40.77 9 27.68 20 -1.83 137 10.78 76
150 28.72 44 8.48 137 16.77 79 2.49 133
Note. Highest D-value was assigned Rank 1.
A-5
4,3
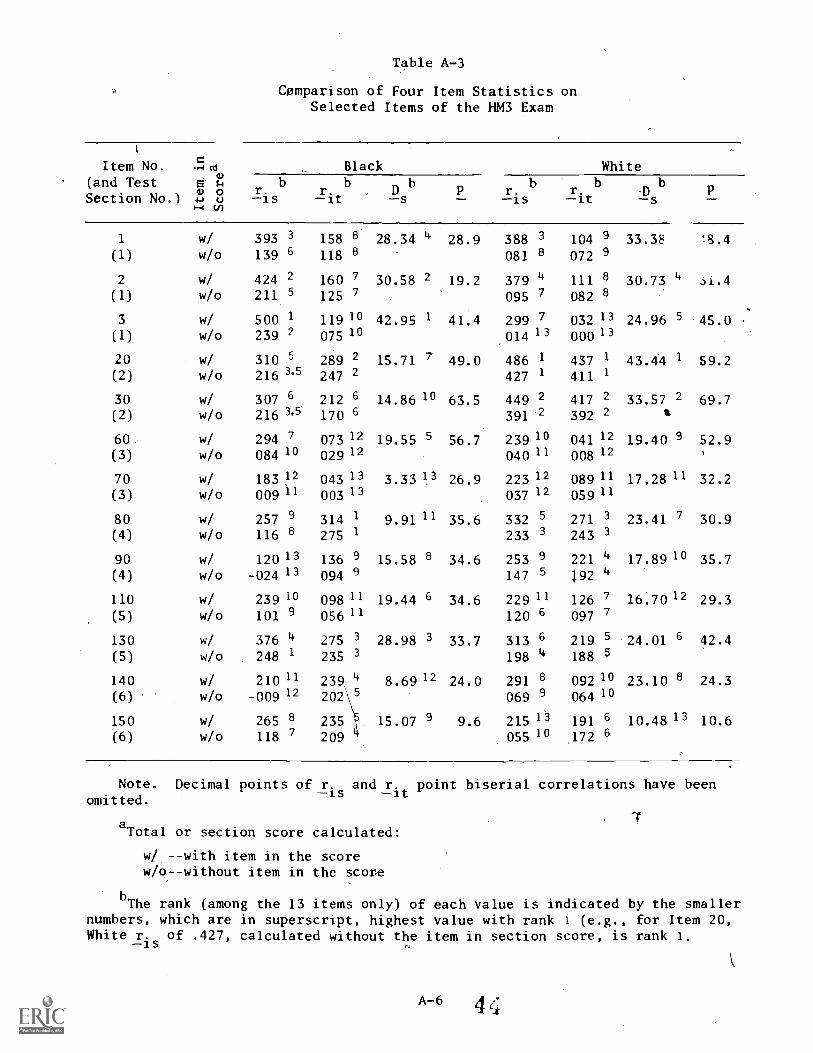
Table A-3
Comparison of Four Item Statistics onSelected Items of the HM3 Exam
1
Item No.(and TestSection No.)
-H= ai
PP.:., 3
Black Whiteb
r.-is
r.-it
b bD-s
P r.-is
br.-it
b
:Pls
bP
1 w/ 393 3 158 8 28.34 4 28.9 388 3 104 9 33.38 8.4(1) w/o 139 6 118 8 081 8 072 9
2 w/ 424 2 160 7 30.58 2 19.2 379 4 111 8 30.73 4 oi.4(1) w/o 211 5 125 7 095 7 082 8
3 w/ 500 1 1191° 42.95 1 41.4 299 7 032 13 24.96 5 45.0(1) w/o 239 2 075 10 014 00013
20 w/ 310 5 289 2 15.71 7 49.0 486 1 437 1 43.44 1 59.2(2) w/o 216 3'5 247 2 427 1 411 1
30 w/ 307 6 212 6 14.86 10 63.5 449 2 417 2 33.57 2 69.7(2) w/o 216 3'5 170 6 391 2 392 2 4
60 w/ 294 7 07312 19.55 5 56.7 23910 041 12 19.40 9 52.9
(3) w/o 084 10 029 12 040 11 008 12 °
70 w/ 183 12 043 13 3.33 13 26.9 223 12 089 11 17.28 11 32,2
(3) w/o 009 11 003 13 037 12 05911
80 w/ 257 9 314 1 9.91 11 35.6 332 5 271 3 23.41 7 30.9(4) w/o 116 8 275 1 233 3 243 3
90 w/ 120 13 136 9 15.58 8 34.6 253 9 221 4 17.89 10 35.7(4) w/o -024 13 094 9 147 5 192 4
110 w/ 239 10 098 11 19.44 6 34.6 229 11 126 7 16.7012 29.3
(5) w/o 101 9 056 11 120 6 097 7
130 w/ 376 4 275 3 28.98 3 33.7 313 6 219 5 24.01 6 42.4(5) w/o 248 1 235 3 198 4 188 5
140 w/ 210 11 239 4 8.6912 24.0 291 8 092 10 23.10 8 24.3(6) w/o -009 12 202 5 069 9 064 10
150 w/ 265 8 235 15.07 9 9.6 215 13 191 6 10.4813 10.6(6) w/o 118 7 209 055 10 172 6
Note. Decimal points of ris and r. point biserial correlations have been--it
omitted.
aTotal or section score calculated:
w/ --with item in the scorew/--without item in the score
bThe rank (among the 13 items only) of each value is indicated by the smaller
numbers, which are in superscript, highest value with rank 1 (e.g., for Item 20,White ris of .427, calculated without the item in section score, is rank 1.
A-6 4
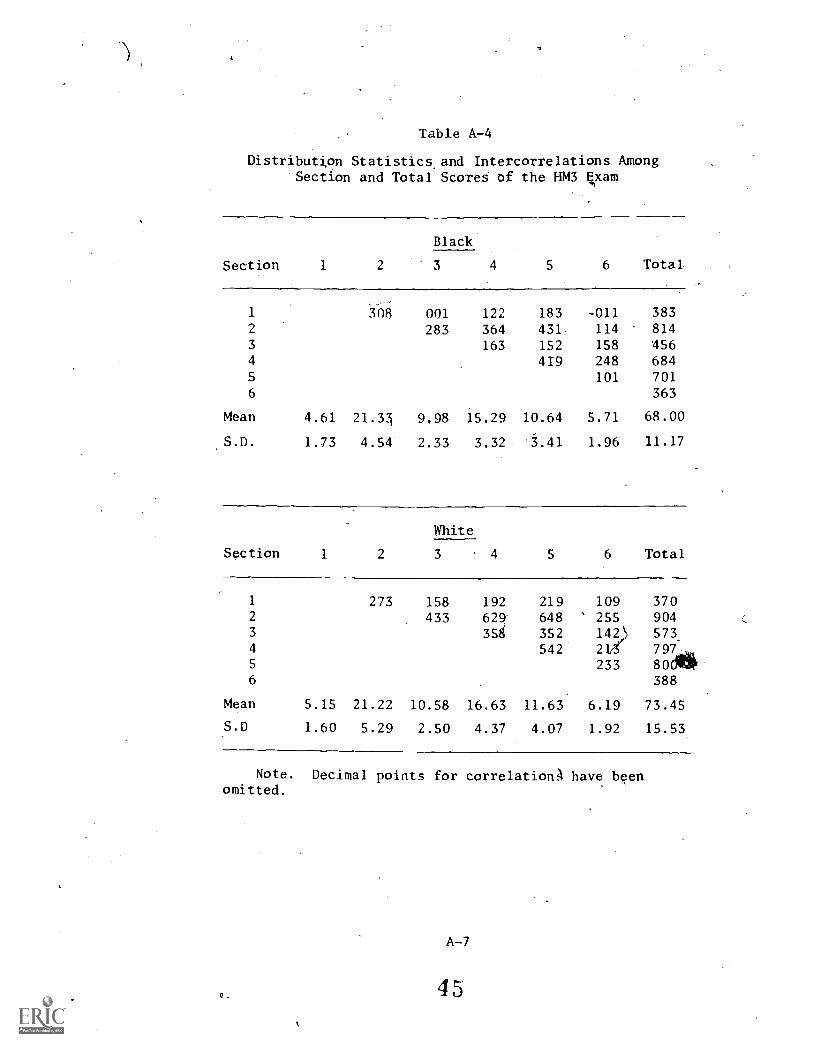
Table A-4
Distribution Statistics and Intercorrelations AmongSection and Total Scores of the HM3 Exam
Black
Section 1 2 3 4 5 6 Total
1 308 001 122 183 -011 383
283 364 431 114 8143 163 152 158 4564 419 248 6845 101 701
6 363
Mean 4.61 21.3 9.98 15.29 10.64 5.71 68.00
S.D. 1.73 4.54 2.33 3.32 '3.41 1.96 11.17
White
Section 1 2 3 4 5 6 Total
1 273 158 192 219 109 3702 433 629 648 ' 255 9043 35B 352 1123) 573.
4 542 2 797..aa
5 233 800,1*6 388
Mean 5.15 21.22 10.58 16.63 11.63 6.19 73.45
S.D 1.60 5.29 2.50 4.37 4.07 1.92 15.53
Note. Decimal points for correlationA have beenomitted.
A-7
45
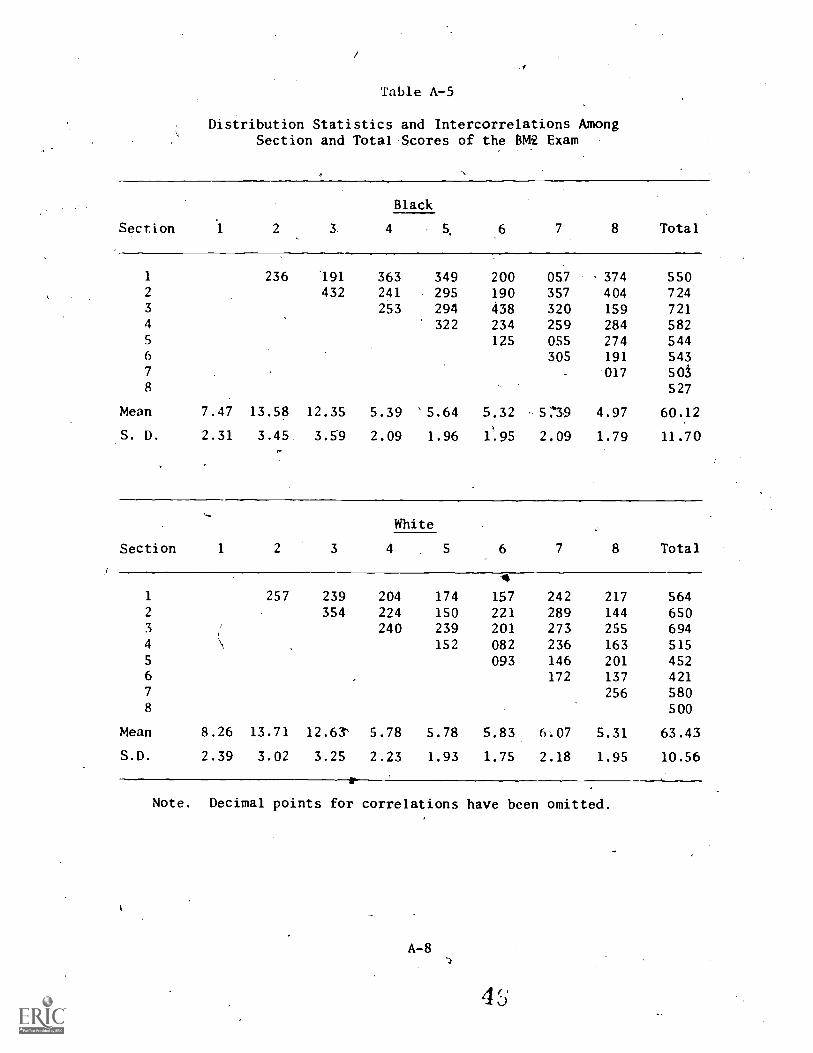
Table A-5
Distribution Statistics and Intercorrelations AmongSection and Total Scores of the BM Exam
Black
Section 1 2 3 4 5. 6 7 8 Total
1 236 191 363 349 200 057 374 5502 432 241 295 190 357 404 7243 253 294 438 320 159 7214 322 234 259 284 5825 125 055 274 5446 305 191 5437 017 5038 527
Mean 7.47 13.58 12.35 5.39 '5.64 5,32 - 5:39 4.97 60.12
S. D. 2.31 3.45 3.59 2.09 1.96 1.95 2.09 1.79 11.70
White
Section 1 2 3 4 5 6 7 8 Total
41 257 239 204 174 157 242 217 5642 354 224 150 221 289 144 6503
i240 239 201 273 255 694
4 152 082 236 163 5155 093 146 201 4526 172 137 4217 256 5808 500
Mean 8.26 13.71 12.63^ 5.78 5.78 5.83 6.07 5.31 63.43
S.D. 2.39 3.02 3.25 2.23 1.93 1,75 2.18 1.95 10.56
Note. Decimal points for correlations have been omitted.
A-8
C)'
It might be reasonable to assume that, if the section-total correla-tion is low, r
Iswould be higher than and more appropriate than r
Itif
the section content is assumed to be homogenous). However, these assump-tions are not supported by the few illustrative items of the HM3 Exam inTable A-3. For example, for Blacks, Lit is higher than es on the two items
(140 and 150) from section 6, although this section had the lowest section-total correlation (.363 in Table A-4). Of the two items (20 and 30 inTable A-3) from the section with the highest section-total correlation(.814 in Table A-4), one r
Itis higher, and the other is lower than r
Is.
In the light of varying differences between ris
and rat, and among
section - total, correlation (including, quite likely, even sections of hetero;-geneous content), generally, the most useful measure of item differentiationappears to be r
It(without the item included in total score). (Nonethe-
less, use of Dswith item in section score is considered usefu' and
adequate for analyzing the relative differences between racial groupsin the present study.)
Relationship. Between P and D Values
When the correspondingiPvalues for the highest D values were examined(see Table 4 and page 7), bile median P value of the highest D values wasgenerally higher than the total median P value. Similar results were alsoobtained with the corresponding P values for the highest r
Itvalues in
Table A-6. With one exception (the MM3 Black group), these correspondingP values are higher than the total test median P value. For example, thecorresponding median P value, 54.19, for the highest rit values of the
ADJ3 White group, is substantially higher than the total test median Pvalues, 45.81 for that group.
Table A-3 also provides examples of high P values which yield high orlow differentiation values (e.g., for the White group, Item 20 P value of59.2 with r
I- twithout the item in score of .411, but Item 60 P value of
52.9 with rI- t
of only .008), and low P values which yield high or low
differentiation values (e.g., Item 80 P value of 30.9 with rit of .243,
but Item 70 P value of 32.2 with rlt
of only .059.
Reversing the orientation and comparing P values with correspondingD values yielded similar results (see Table A-7). The P values of middledifficulty (e.g., ADJ3 Black group, median P value of 34.04) yield corre-sponding D values (e.g., 41.12) which are substantially lower than thehighest I) values (e.g., ADJ3 Black median, 54.41, in Table 'page 10).Figures A-1, A-2, and A-3 display the median P valuesl-nnd correspondingD values for the 7-item ranked sets of items in Table A-7. It may beobserved that the highest P values yield corresponding D values which arehigher than the corresponding D values of the lowest P values for bothBlacks and Whites.
4 9
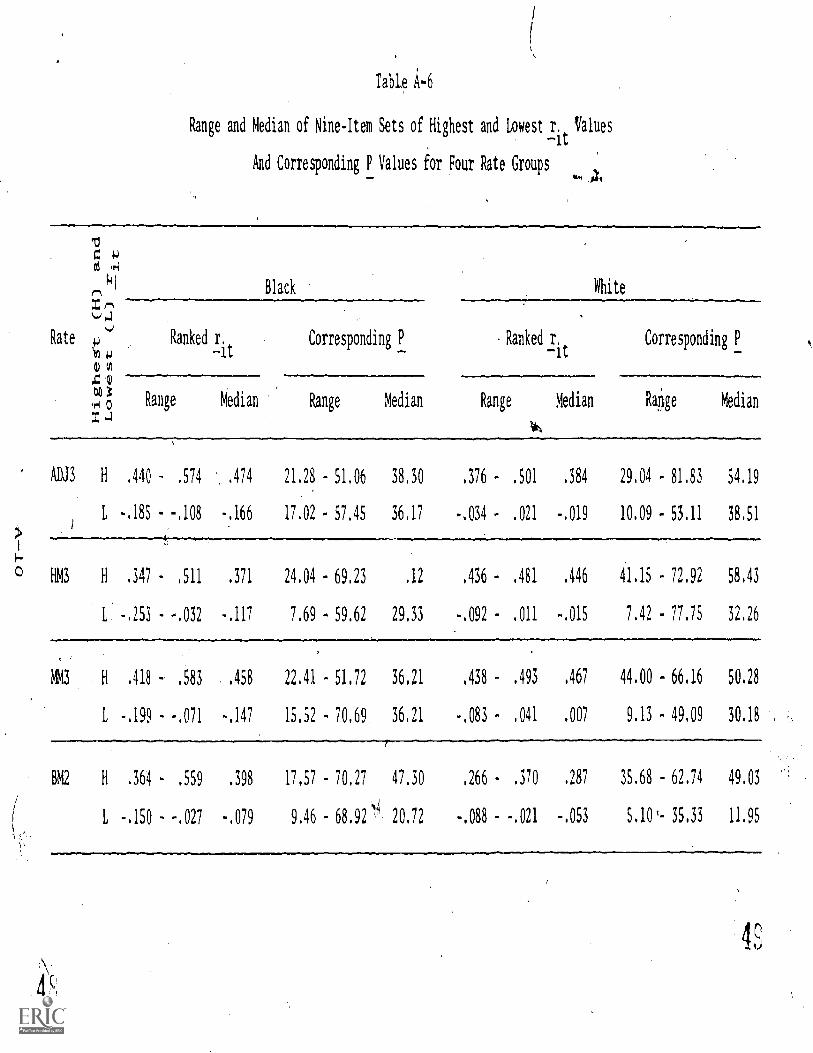
Table A-6
Range and Median of Nine-Item Sets of Highest and Lowest rit Values
And Corresponding P Values for Four Rate Groups
Black White
Rate 0 Ranked r. Corresponding P Ranked r.
'If) 4 t -it41
4 0
V) Range
ADJ3 H .440 .574 ,
L -.185 - -.108
HM3 H .347 - .511
-.253 - -.032
MM3 H .418 - .583
L -.199 - -.071-...mBM2 H .364 - ,559
L -.150 - -.027
Corresponding P
Median Range Median Range Median Raige Median
.474 21,28 51.06 38.30 .376 - .501 .384 29.04 - 81.83 54,19
-.166 17.02 - 57.45 36.17 -.034 - .021 -.019 10.09 - 53.11 38.51
.371 24.04 - 69.23 .12 .436 - .481 .446 41.15 - 72.92 58.43
-.117 7,69 - 59.62 29.33 -.092 .011 -.015 7.42 - 77.75 32.26
.458 22.41 - 51.72 36.21 ,438 ,493 ,467 44.00 - 66,16 50,28
-,147 15.52 - 70,69 36,21 -.083 - .041 ,007 9,13 - 49,09 30.18
.398 17,57 70,27 47,30 .266 - .370 .287 35,68 62.74 49,03
-.079 9.46 - 68.92 20,72 -.088 -.021 -.053 5.10'- 35,33 11.95
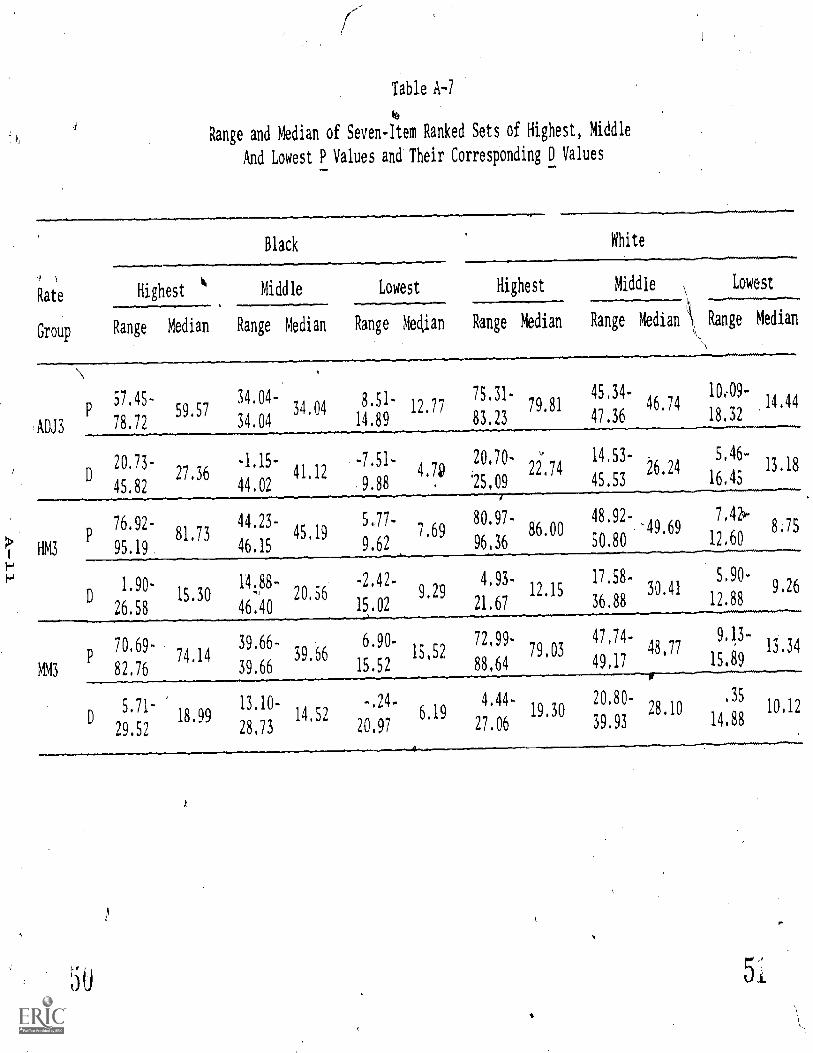
Table A-7
Range and Median of Seven -Item Ranked Sets of Highest, Middle
And Lowest P Values and Their Corresponding D Values
Rate
Group
ADJ3
Black White
Highest Middle Lowest Highest Middle Lowest
Range Median Range Median Range Median Range Median Range Median Range Median
57,45-
p 59.5778.72
20,73-D 27.36
45.82
76.92-P 81.73
HM3 95.19
MM3
34.04-34 04 8'51" 12.77 75'31' 79 81
45.3446.74
10e09 - 14.44
34.04 14.89 83.23 47.36 18,32
-1.15-14,53.
26,245,46-
13.1841.12
-7.51.4.79 2°,7°- 22.74
44.02 9.88 , '25,09 45,53 16,45
5.77.7.69
80.97-86.00
48,92-49,69 8.75
7,4b0
9.62 96,36 50.80 12,60
44.23-45.19
46.15
D1.90-
15,30149, 88-
20.5626.58 46.40
70,69-74.14
82.76
5.71-D 18.99
29.52
50
39.66-39. 6
39.66
13.10-
2
14 528,73
-2.42. 4.93- 17.58- 5,90-
9.29 12.15 30.41 9.26
15 02 21.67 36.88 12.88
6.90- , -729915,52 79,03
15.52 88,64
-.24- 4.44-6.19 19.30
20,97 27.06
47,74-48,77 13.34
49,17 IS 89
20.80-28,10 '35 10.12
39.93 14.88
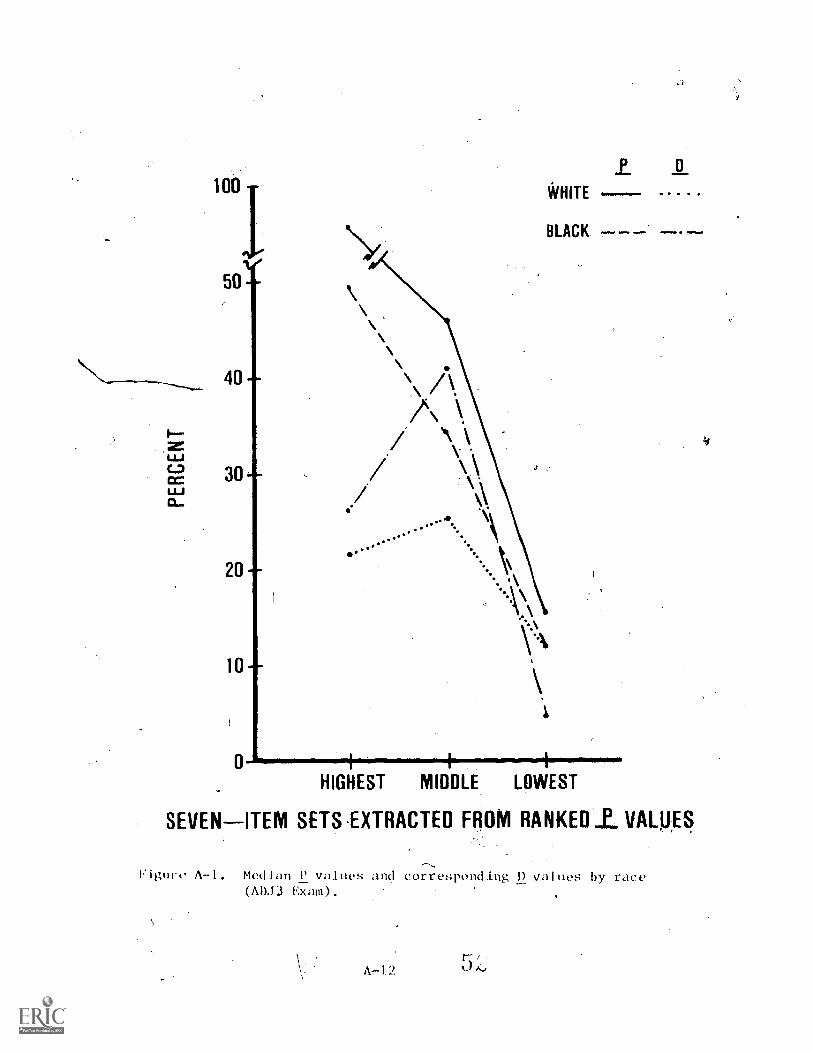
100
3.;50
40
C.,cc 30LLJ0
20
10
0--
P D
WHITE -MOON
HIGHEST MIDDLE LOWEST
SEVEN-ITEM SETS EXTRACTED FROM RANKED 1. VALUES
Figure A-1. Median P values and corresponding D values by race(ADJ3 Exam).
1. A-12
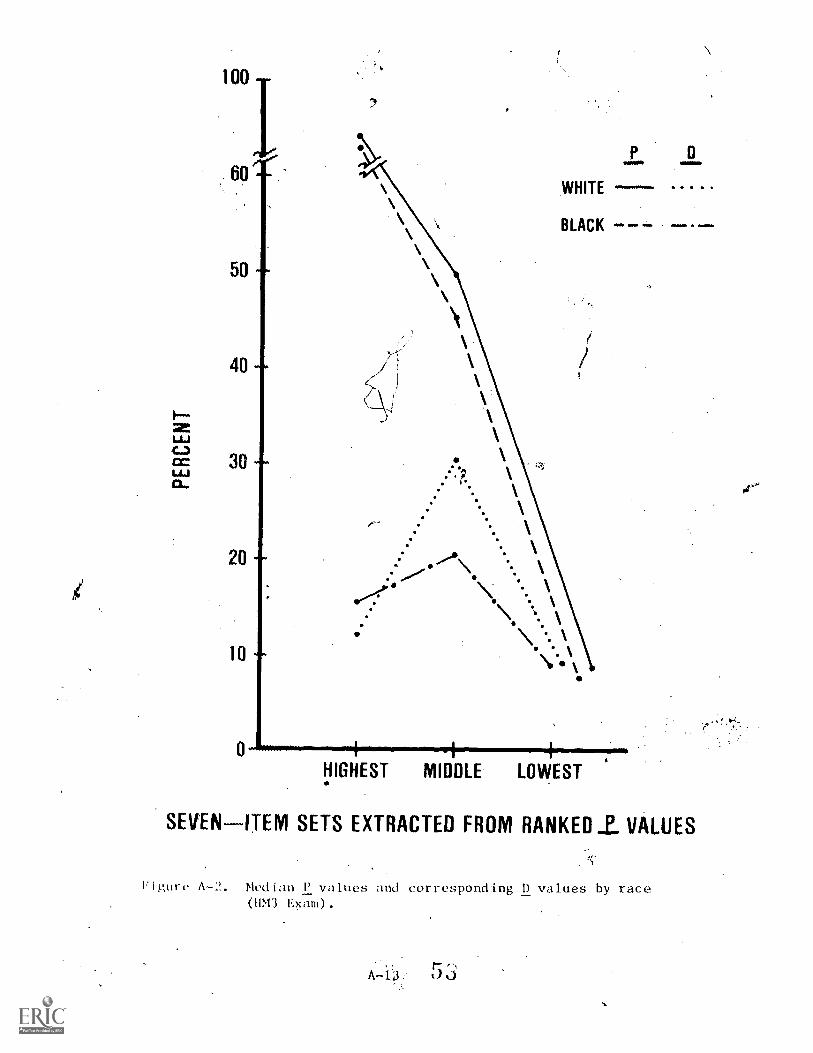
100
0
50
40
IrLLJ
ac 30LU
20
10
WHITE
BLACK ow. Orialwa
HIGHEST MIDDLE LOWEST
SEVEN-ITEM SETS EXTRACTED FROM RANKED _E. VALUES
Figaro A-2. Median P values and corresponding D values by race(UM3 Exam).
A -13 ti
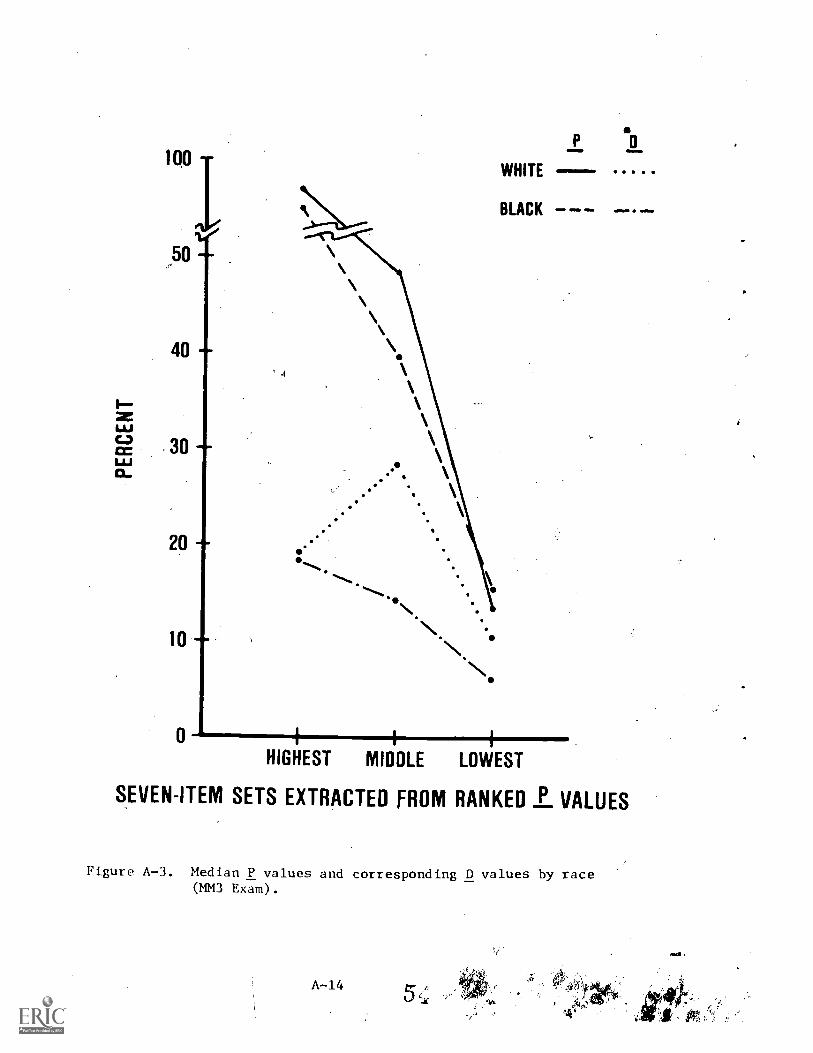
50
40--
\30 -
UJ.
..*
20 -
10
WHITE
BLACK
\*6
N.
01M IMMO 0.W1
4
HIGHEST MIDDLE LOWEST
SEVEN -ITEM SETS EXTRACTED FROM RANKED L VALUES
Figure A-3. Median P values and corresponding D values by race(MM3 Exam).
A-14
Findings
In the methodological comparisons of alternative measures of itemdifficulty, the item-score correlptions, with the item included in thescore were greater than without the item included. With the item inthe score, the itemtotal correlation (rit) was greater by about .02
to .04 correlation points, and the item - section correlation (ris) was
greater by large and varying amounts.
In compkrisons of item-section and item-total measures, the percentagedifference between high and low scorers answering the item correctly washigher on the item-section percentages (ps values) than on the item-total
percentages (4 values) with the item included in both scores.
Item-section (Eis) and item-total (rit ) correlations, without the
--
item included in the score of either, varied as to which was the larger.Section score Wercorrelations within each total test varied from low tohigh values, suggesting some heterogeneity in some tests or some sectionsof ,tests. (Heterogeneity would t4Pd to reduce r
Isor r
dtvalues.) In
light of these varying differences, the most useful measure of item differ-entiation appears to be r without 'the item included in the total score.
The P values which corresponded to the highest D values or values
were higher than the median P values for the total tests, suggesting thateasier items might improve item differentiation. In the comparison of theends of the P value ranges, the highest P values' (i.e., easiest items) hadcorresppnding D values which were higher than'the corresponding 2 valuesof the lowest P values, which suggests that the difficult. items areexcessively difficult.
p
55
A-15
DISTRIBUTION LIST
Assistant Secretary of the Navy (Manpower and Reserve Affairs)Office of Assistant Secretary of Defense (M&RA), Washington, D.C.Chief of Naval Operations (0P-987P10)
Chief of Naval Personnel (Pers-1), (Pers-10c), (Pecs -21), (Pers-212),(Pers-2120),, (Pers-523), (Pers-6), (Pers-611) (2)
Chief of Naval Education and Training (N-5), (003), (014)Chief of Naval Technical Training (Code 016), (Code N-6)Chief of Naval Education and Training SupportChief of Naval Education and Training Support (01A)Chief of Information (01-2252)Chief of Naval Material (NMAT 0344), (NMAT 035)Chief of Naval Research (Code 450) (4), (Code 458) (2)Commander, Naval Electronics Laboratory Center (2)Commanding Officer, Naval Education and Training Program DevelopmentCenter (3)
Commanding Officer, Naval Health Research CenterDirector, Behavioral Sciences Department, Naval Medical Research Institute,
Bethesda
Science Advisor, ACOS for Tactical Development, Commander Second FleetSuperintendent, Naval AcademySuperintendent, Naval Postgraduate SchoolSuperintendent, United States Military AcademySuperintendent, Coast Guard AcademyTechnical Library, Naval Postgraduate SchoolHuman Goals Office, Naval Education and Training Center, Newport, RIArmy Research Institute for Behavioral and Social SciencesU.S. Army Enlisted Evaluation Center, Fort Benjamin Harrison (2)Human Resources Development Division, U.S. Army Personnel and AdministrationCombat Developments Activity
Headquarters, Department of the Army, Office of the Deputy Chief of Stafffifrpersonnel (Attn: 'Chief, Research Office)
Comthander, Air Force Human Resources Laboratory, Brooks Air Force BaseHeadquarters, 'Air Force (Attn: Science Division, Directorate of Scienceand Technology, DCS/Research and Development), Washington, D.C.
Program Manager, Life Sciences Directorate, Air Force Office ofScientific Research (AFSC)
Personnel Research Division, Air Force Human Resources Laboratory (AFSC),Lackland Air Force Base
Occupational and Manpower Research Division, Air Force Human ResourcesLaboratory (AFSC), Lackland Air Force Base
Technical Library, Air Force Human Resources Laboratory (AFSC),Lackland Air Force Base
Defense Race Relations Institute, Patrick Air Force BaseCommander, Armed Forces Vocational Test GroupCoast Guard Headquarters (G-p-1/62)U.S. Coast Guard Institute, Oklahoma City, OKCenter for Naval Analyses, Arlington, VANational Research Council, Washington, D.C.National Science Foundation, Washington, D.C.Defense Documentation Center (12)