document resume ed 087 835 ud 014 073 · document resume ed 087 835 ud 014 073 title an evaluation...
TRANSCRIPT
DOCUMENT RESUME
ED 087 835 UD 014 073
TITLE An Evaluation of the Corrective Mathematics Servicesfor Disadvantaged Pupils in Non-Public Schools. ESEATitle I Program.
INSTITUTION New York Univ., N.Y. Center for Field Research andSchool Services.
SPONS AGENCY New York City Board of Education, Brooklyn, N.Y.PUB DATE Aug 72NOTE 66p.; Function Number 920644
EDRS PRICE MF-$0.65 HC-$3.29DESCRIPTORS Compensatory Education Programs; *Disadvantaged
Youth; Economically Disadvantaged; Elementary SchoolStudents; Inservice Teacher Education; *NonpublicSchool Aid; *Program Evaluation; *RemedialMathematics; Remedial Programs; Secondary SchoolStudents; Small Group Instruction; Urban Education
IDENTIFIERS Elementary Secondary Education Act Title I; ESEATitle I; *New York .City
ABSTRACTThe Corrective Mathematics Services Program for
Disadvantaged Pupils in Nonpublic Regular Day Schools, funded underTitle I of the 1965 Elementary Secondary Education Act, was proposedto serve approximately 14,032 poverty area children who attended 165non-public regular day schools. Those children were eligible forthese services whose score on a standardized test in mathematics wasmore than one standard deviation below the grade norm. Correctiveservices were provided by licensed teachers from the New York CityBoard of Education as an in-school program during the regular schoolhours. In addition, a room was made available by the non-publicschool. Teachers were to be given in-service training andinstructional material and necessary equipment were to be provided.Most children were to receive instruction in groups of approximatelyten pupils. Two stated objectives of the program were as follows: (1)
Pupils in grades two and three in the project will be expected toincrease achievement levels in computational skills from six monthsto one year depending upon age, grade, degree of retardation andother causative factors. They will also be expected to increaseachievement levels in verbal problem solving from three to eightmonths ceteris paribus. Moreover, these children will be expected todemonstrate increased interest and curiosity in mathematics. (2)
Pupils in grades four, five and six enrolled in the project will beexpected to develop greater skill in translating verbal problems intomathematical equations and in finding solutions. (Author/JM)
U S DEPARTMENT OF HEALTH.INSM EDUCATION &WELFARE
NATIONAL INSTITUTE OF
re\ EDUCATIONDOCUNTENT HAS BEEN RE T.RLT
CC) DLTEED XAC IL AS RECEIVED IRON,THE PENSON OR ORGANIZA I ION ORIGINAT LNG I POINTS OT VIEW Ok OPINIONSSTA TETT DO NOT NECESSARiL V PET PRESENT OT 111 NATIONAL INStiTt, OrEIP'EA HON POSITION OR TTOLtEY
Fun^.tion Number: 920644
AN EVALUATION OF THECORRECTIVE MATHEMATICS SERVICES
FOR DISADVANTAGED PUPILS INNON-PUBLIC SCHOOLS
ESEA TITLE I PROGRAM
Evaluation of a New York City school district educationalproject funded under Title I of the Elementary andSecondary Education Act of 1965 (PL 89-10), performedunder contract with the Board of Education of the City ofNew York for the 1971-1972 school year.
Project Evaluation Team:William Zlot, DirectorEdward CarrollThan PorterStanley Taback
CENTER FOR EDUCATIONAL RESEARCH AND FIELD SERVICESSchool of EducationNew York University
August, 1972
New York University
School of EducationCenter fur Educational Research and Field ServicesOffice of Off - Campus Courses
51 Press BuildingWashington SquareNew York, N .Y . (0001Telephone: (212)598-2891{, 3425
September 30, 1972
Dr. David AbramsonActing DirectorBureau of Educational ResearchBOARD OF EDUCATION
OF THE CITY OF NEW YORK110 Livingston StreetBrooklyn, New York 11201
Dear Dr. Abramson:
In fulfillment of the agreement dated March 30, 1972 between the New YorkCity Public Schools and the Center for Educational Research and FieldServices, I am pleased to submit three hundred copies of the final report,An Evaluation of the Corrective Mathematics Services for Disadvanta edPupils in Non-Public Schools.
The Bureau of Educational Research and the professional staff of theNew York City Public Schools were most cooperative in providing data andfacilitating the study in general. Although the objective of the teamwas to evaluate a project funded under Title I, this report goes beyondthis goal. Explicit in this report are recommendations for modificationsand improvement of the program. Consequently, this report will serve itspurpose best if it is studied and discussed by all who are concerned witheducation in New York City -- the Board of Education, professional staff,students, parents, lay leaders, and other citizens. To this end, thestudy team is prepared to assist with the presentation and interpretationof its report. In addition, the study team looks forward to our continuedaffiliation with the New York City Public Schools.
You may he sure that New York University and its School of Education willmaintain a continuing interest in the schools of New York City.
Respectfully submitted,
ARNOLD SDirector
AS:jh
TABLE OF CONTENTS
Chapter Page
EXECUTIVE SUMMARY , i
1. INTRODUCATION , 1
A. Decription 1
B. Evaluation Objectives 3
C. Aspects of the Evaluation 4
II. IMPLEMENTATION OF EVALUATION OBJECTIVE 1 10
A. A Gross Analysis of the Gain of the
Project Students 10
B. A Statistical Comparison of Achievement
in Mathematics of the Project Students
and the Non-Project Students
C. Estimates of the Increases in Attitude
in Mathematics and of the Relationship
between Attitude and Achievement in Mathematics
11
17
III. IMPLEMENTATION OF EVALUATION OBJECTIVES 2 AND 3 24
A. Evaluation Objective 2 24
B. Evaluation Objective 3 (Recommendations) 28
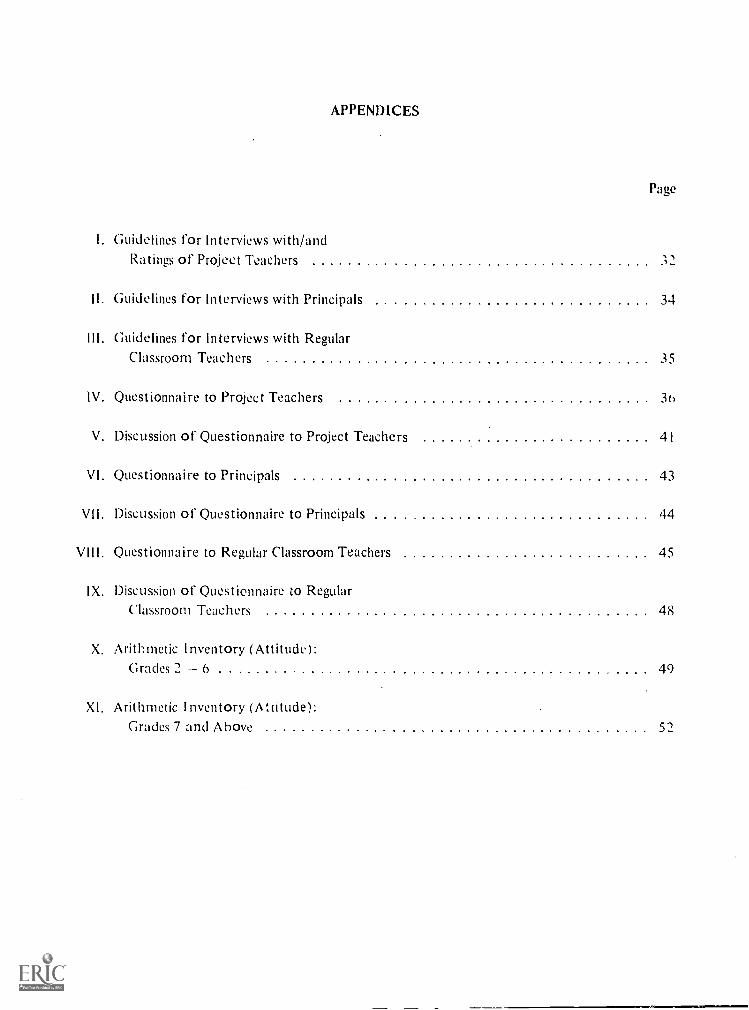
APPENDICES
Page
I. Guidelines for Interviews with/andRatings of Project Teachers 32
II. Guidelines for Interviews with Principals 34
III. Guidelines for Interviews with RegularClassroom Teachers 35
IV. Questionnaire to Project Teachers 36
V. Discussion of Questionnaire to Project Teachers 41
VI. Questionnaire to Principals 43
VII. Discussion of Questionnaire to Principals 44
VIII. Questionnaire to Regular Classroom Teachers 45
IX. Discussion of Questionnaire to RegularClassroom Teachers 48
X. Arithmetic Inventory (Attitude):Grades 2 6 49
XI. Arithmetic Inventory (Attitude):Grades 7 and Above 51
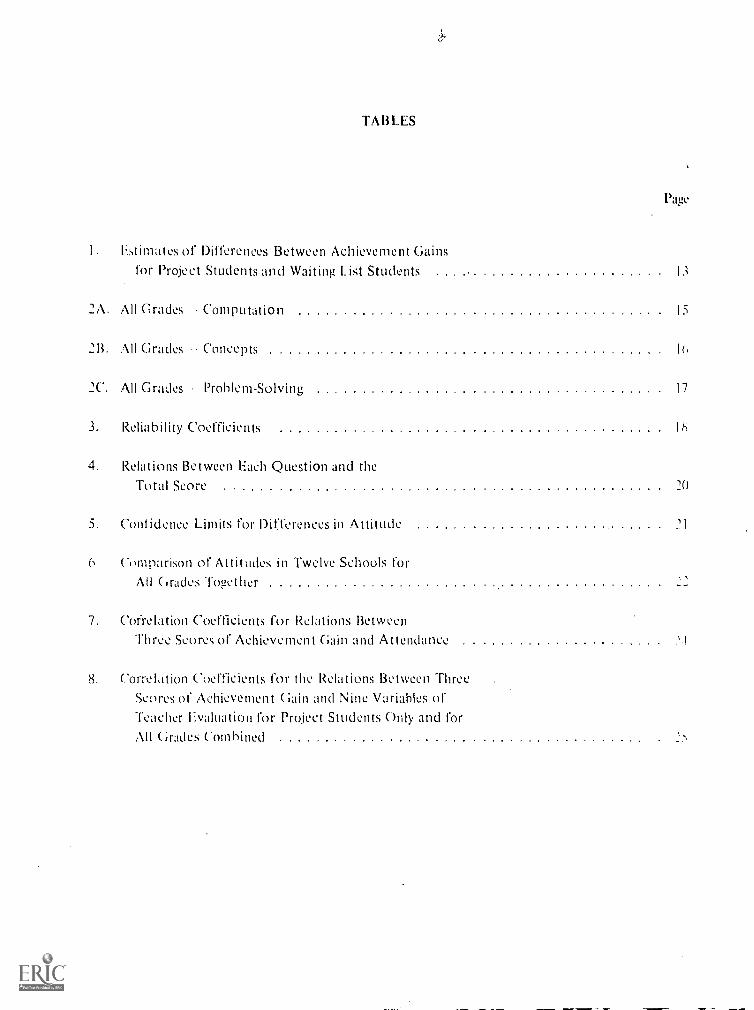
TABLES
Page
I. Estimates of Differences Between Achievement Gainsfor Project Students and Waiting List Students 13
2A. All Grades Computation 15
U. All Grades Concepts l(
2C. All Grades Problem-Solving 17
3. Reliability Coefficients
4. Relations Between Each Question and theTotal Score 20
5. Confidence Limits for Differences in Attitude 1
6. Comparison of Attitudes in Twelve Schools forAll Grades Together
7. Correlation Coefficients for Relations BetweenThree Scores of Achievement Gain and Attendance
8. Correlation Coefficients for the Relations Between ThreeScores of Achievement Gain and Nine Variables ofTeacher Evaluation for Project Students Only and forAll Grades Combined
... III 'NOV
ACKNOWLEDGEMENTS
To Lawrence F. Larkin, Director of the Office of State and Federally Assisted
Programs for the Non-Public Schools and Mrs. Lucille A. Stovall, Coordinator of
Corrective Mathematics Services, both of the New York City Board of Education
for their cooperation and their advice on goals and procedures;
To Mr. Ambrose Emilio, Rabbi Burton Jaffa, Mr. Joseph P. O'Connor and
Mr. George Prassas, Title I Liaison Officers at the New York City Board of
Education for their help in facilitating our evaluation by enabling us to obtain
access to various schools;
To Professors Edward Carroll, Than Porter and Stanley Taback for their
diligent work and valuable judgments;
To Professor Than Porter for his expert assistance in computer processing
of the data and evaluating the results;
And to Dr. Arnold Spinner and Miss Helen Keily, Center for Educational
Research and School Services, School of Education, New York University, for
their constant aid, encouragement and advice.
W.Z.
EXECUTIVE SUMMARY
A. The Program Description
The Corrective Mathematics Services Program for Disadvantaged Pupils in Non-public
Regular. Day Schools I was proposed to serve approximately 14,032 poverty area children
who attended 165 non-public regular day schools. Those children were eligible for these
services whose score on a standardized test in mathematics was more than one standard de-
viation below the grade norm. Corrective services were provided by licensed teachers from
the New York City Board of Education as an in-school program during the regular school
hours. In addition, a room deemed adequate for the needs of small group instruction was to
be made available by the non-public school. Teachers were to be given in- service training and
instructional material and necessary equipment were to be provided. Most children were to
receive instruction in groups of approximately ten pupils.
The stated objectives of the program were as follows:
1. Pupils in grades 2 and 3 enrolled in the project will be expected to increase
achievement levels in computational skills from six months to one year depending upon age,
grade, degree of retardation and other causative factors. They will also be expected to in-
crease achievement levels in verbal problem solving from three months to eight months de-
pending on age, grade, degree of retardation and other causitive factors. Moreover, these
children will be expected to demonstrate increased interest and curiosity in mathematics
by exploring mathematical ideas independently.
2. Pupils in grades 4, 5 and 6 enrolled in the project will be expected to develop
greater skill in translating verbal problems into mathematical equations and in finding
solutions. They will be expected to increase achievement levels in verbal problem solving
from three months to eight months depending upon these factors. Moreover, they will he ex-
pected to demonstrate greater interest in, and appreciation of, mathematical ideas by in-
creased participation in the mathematics class.
3. Pupils in grades 7, 8 and 9 enrolled in the project will be expected to increase
achievement levels in. computational skills and also in problem solving from six months to
one year or more depending upon age, grade, degree of retardation and other causitive factors.
(Corrective. Mathematics Services for Disadvantaged Pupils in Non-Public Schools, 1971-1972, Title I, ES!' A Board of hluca t ion,City of New York
B. Evaluation Objectives
1. Evaluation Oblective I: To examine the degree to which the proposed objectives
of the Corrective Mathematics Services Program have been achieved:
(a) Aspects (4 the Evaluation:
(I') Project and non-project students in each of a stratified random sample of
20 schools selected approximately in proportion to the distribution of the
schools by religion in the entire set of 149 schools actually serviced were sub-
jected to a rather close statistical analysis. (See parts (2') and (3') which follow.)
(2') Pre and post-test scores on the Metropolitan Achievement Tests were obtained.
In order to assess the gain in achievement of the project students, a "control"
group was established by taking the MAT scores of students on the waiting lists
in the 18 schools in our random sample from which we were ablt to obtain the needed
data in order to conduct our analyses. Pertinent confidence intervals were computed
by the analysis of covariance.
(3') In an attempt to assess the extent to which the improvement of the mathe-
matical attitude of students in the project exceeds that of students not in the
project, the following design was followed:
Tests of mathematical attitude were constructed by the team of evaluators and given
to the project students and to the non-project students in the schools both near
the beginning of the school year and near the end of the school year. One attitude
test was given to the students in grades 2 6, and another was given to those in
grades 7 and above. The questions were written in both English and Spanish on each
test paper.
The results of these tests were used to determine the increase favorable attitude
toward mathematics on the part of the project students as well as the relationship
(correlation) between mathematical attitude and achievement in mathematics on the
MAT's.
(b) Findings (The findings (a') and (b') which follow, correspond, respectively, to the
preceding items (2') and (3') under part (a) which we just discussed.)
ii
(a') In the opinion of the evaluating team the gains in achievement from the
project are sufficiently greater than those from the waiting list to state with
95% confidence that the project in general, is very worthwhile, (See Chapter 11,
Part B.)
(b') There is very little evidence to support any claim that the project has
any considerable effect upon the attitude of students toward mathematics as in-
dicated by the tests in Appendices X and Xl. (See Chapter II, Part C.)
2. Evaluation Objective 2: To examine and appraise the procedures employed in the
Corrective Mathematics Services Program to achieve the stated program objectives.
(a) Aspects of Me Evaluation
(1') Project students and project teachers in the random sample of 20 schools
were subjected to a close analysis. (See Part (2') which follows.) In addition,
principals and at least one regular classroom teacher in each of the 20 schools
were interviewed during on-site visits. Ratings of eight teaching practices of
the project teachers in the 20 schools were made. (See Part (3') below.) Moreover,
there were pertinent questions on anonymous questionnaires to the project teachers,
principals and regular classroom teachers in each of the 149 schools. (See Part
(4') below.)
(2') For the project students in each of the 20 schools in our sample, a study
was made of the relationship between achievement and the number of project teach-
ing sessions attended by the students. A coefficient of partial correlation was
computed to assess the relationship between achievement at the end of the year
and the number of sessions a student was taught.
(3') For the project teachers in each of the 20 schools, a correlation coefficient
was computed for the relationship between the mean achievement of each school and
the project teacher's total rating (See Appendix I) as well as for the teacher's
rating on each of the eight teaching practices,
(4') Numerical Assignments were made to the alternate responses to the pertinent
questions on the anonymous questionnaires sent to all project teachers and arith-
metic means were computed.
iii
(a) Findin,0 (The findings (a'), (b') and (c') which follow, correspond, respec-
tively, to the preceding items (2'), (3') and (4') under part (a) which we just
discussed.)
(a') It appears of little consequence whether a student's attendance is good
or poor he learns the same in either case. (See Chapter III, Part A.)
(b') There is not even any barely acceptable evidence of any worthwhile rela-
tion between any of the ratings (as indicated in the form given in Appendix I)
and any of the three measures of achievement in mathematics computation, con-
cepts, and problem-solving. (See Chapter III, Part A.)
(c') In general, according to the responses to pertinent questions on the anony-
mous questionnaires, the procedures followed in the Corrective Mathematics Ser-
vices Program were regarded as being satisfactory by the 64 (out of 9(i) respond-
ing project teachers. (See Chapter III, Part A.)
3. Evaluation Objective 3: To present recommendations for improving the effective-
ness of Corrective Mathematics Services Program.
(a) Recommendations:
I. The pre-testing should be done in the fall despite the complaint of the non-
public school supervisors. For without both a pre-test and post-test score obtained
according to a consistent schedule, it is difficult to measure pupil progress
2. The practice in some schools of having a corrective mathematics teacher sec
the same children on each of three or four days under an experimental program
yielded significantly better results than those made by the children receiving
two periods of remedial instruction. The practice should be extended.
3. The supervisors should extend the practice of working with, and talking to.
individual children during their visits to the schools.
4. The corrective teacher should write some sort of progress report (not a grade)
periodically during the year about each child in the corrective program. These
reports might be sent home to parents and/or to regular teacher.
iv
5. Since the corrective math program is of a remedial nature, it seems advisable
, that the corrective mathematics teacher have adequate space to handle small
workshops.
6. There should be more flexibility in corrective program so that children could
move in and out more easily during the academic year. (Subject to appropriate
investigation.)
7. One day a week service is practically meaningless. Not only do the children
involved forget almost everything from week to week, but with holidays`, sickness,
etc. the service, in reality, is truly tokenism.
8. Teachers need more training conferences, where they may work at the materials
on an individual basis. It is not sufficient to have demonstration classes.
9. A workshop could be offered for the parents at each school. This way, the
parents might be able to provide some home assistance which would reinforce the
program. Perhaps the Board and an individual non-public school could share the
responsibility (at least financial) of providing such a workshop.
10. Corrective mathematics teachers should reinforce topics treated in the regu-
lar classroom by teaching and developing closely related topics at appropriately
correlated times.
11. There still is very little meaningful contact between the regular classroom
teacher and the corrective teacher. At most, they usually only eat lunch together.
12. There should be some orientation provided for "new" regular classroom
teachers so that they fully understand the purposes and procedures for the cor-
rective mathematics program. Efforts should be made on the part of the coordi-
nator in cooperation with the non-public school staff to this end.
13. Coordinators and supervisors can stimulate more interest in the corrective
math program by giving demonstrations or by explaining the program to the regu-
lar faculty of the school.
14. Corrective mathematics teachers should be available to attend a regular
school faculty conference in the early fall.
15. Corrective teachers should be given some idea of how to handle minor emo-
tional problems that they might encounter. Perhaps the Title I guidance coun-
selor in a school might conduct a workshop to assist the corrective teachers.
16. Consideration should be given (subject to appropriate investigation) to
dropping disruptive discipline problems from the program.
17. There are schools where it becomes virtually automatic for some children
to go to the corrective mathematics class year after year. There should be some
limits set on how long a particular student, who shows no or little sign of
progress, would be permitted to continue in the program.
(b) Conclusion:
The evaluators continue to believe that the corrective Mathematics Services
Program is a successful and viable program.
vi
I. INTRODUCTION
A. Program Description
According to the program proposal 1, corrective mathematics instruction was to be pro-
vided for approximately 14,032 disadvantaged pupils attending 165 non-public schools. The
schools included in this program are located chiefly in poverty areas having high concentra-
tions of low-income
Those children whose score on a standardized achievement test in mathematics is more
than one standard deviation below the grade norm were deemed eligible for participation in
the program. A room deemed adequate for the needs of small group instruction was to be
made available by the non-public school during the regular school hours. Teachers were to be
assigned to give instruction to small groups of approximately ten children. In the event that
it is not possible to secure personnel for instruction during the regular school hours, services
were to be provided in the same schools after regular hours until such time as regular staff
becomes available. All personnel must be licensed by the Board of Education.
Inservice training of the Corrective Mathematics Teachers was to be conducted under
the supervision of the Project Coordinator with the assistance of field supervisors and mathe-
matics consultants. Workshops for the parents of the non-public school children admitted to
the prograM were to be conducted by the field supervisors and the Corrective Mathematics
Teachers.
The evaluation covers the instruction program which operated during the school year,
:_:,spten ber 1, 1971 to June 30, 1972.
The stated objectives of the program were as follows:
1) Pupils in grades 2. and 3 enrolled in the project will be expected to increase achieve-
ment levels in computational skills from six months to one year depending upon age, grade,
degree of retardation and other causative factors. They will also be expected to increase
achievement levels in verbal problem solving from three months to eight months depending
upon age, grade, degree of retardation and other causative factors. Moreover, these children
will be expected to demonstrate increased interest and curiosity in mathematics by exploring
mathematical ideas independently.
'Corrective mathematics Services for Disadvantaged Pupils in NonPublic Schools, 1971-1972, Title 1, ESEA 13oard ofEducation, City of New York.
1
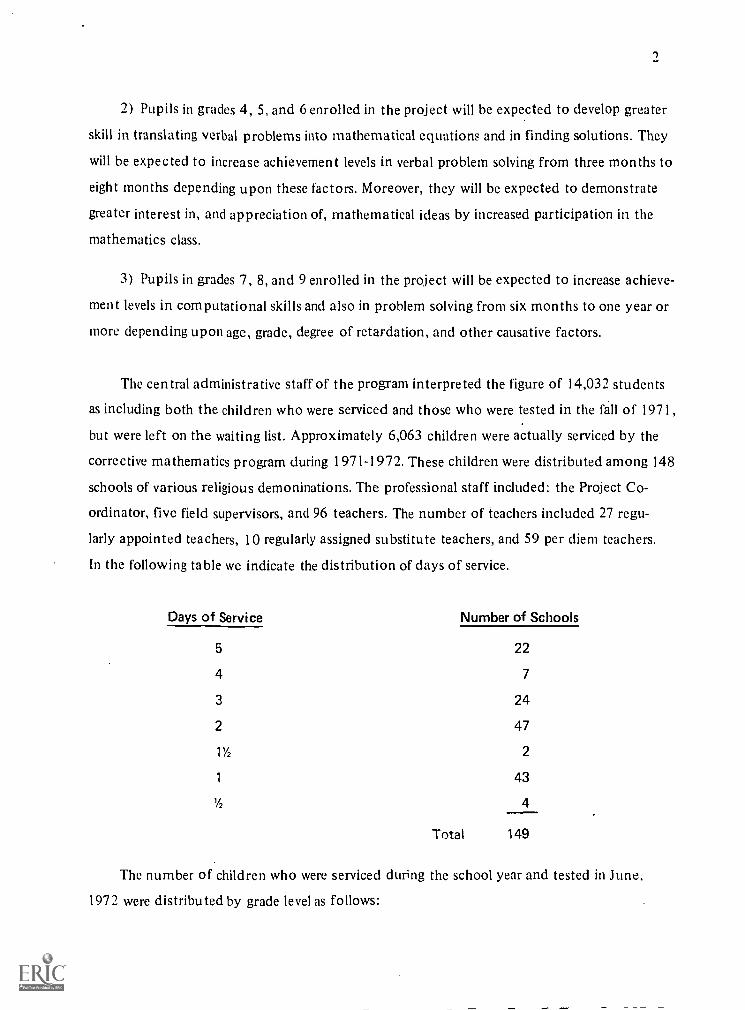
2) Pupils in grades 4, 5, and 6 enrolled in the project will be expected to develop greater
skill in translating verbal problems into mathematical equations and in finding solutions. They
will be expected to increase achievement levels in verbal problem solving from three months to
eight months depending upon these factors. Moreover, they will be expected to demonstrate
greater interest in, and appreciation of, mathematical ideas by increased participation in the
mathematics class.
3) Pupils in grades 7, 8, and 9 enrolled in the project will be expected to increase achieve-
ment levels in computational skills and also in problem solving from six months to one year or
more depending upon age, grade, degree of retardation, and other causative factors.
The central administrative staff of the program interpreted the figure of 14,032 students
as including both the children who were serviced and those who were tested in the fall of 1971,
but were left on the waiting list. Approximately 6,063 children were actually serviced by the
corrective mathematics program during 1971-1972. These children were distributed among 148
schools of various religious demoninations. The professional staff included: the Project Co-
ordinator, five field supervisors, and 96 teachers. The number of teachers included 27 regu-
larly appointed teachers, 10 regularly assigned substitute teachers, and 59 per diem teachers.
In the following table we indicate the distribution of days of service.
Days of Service Number of Schools
5 22
4 7
3 24
2 47
1Y2 2
1 43
1/2 4
Total 149
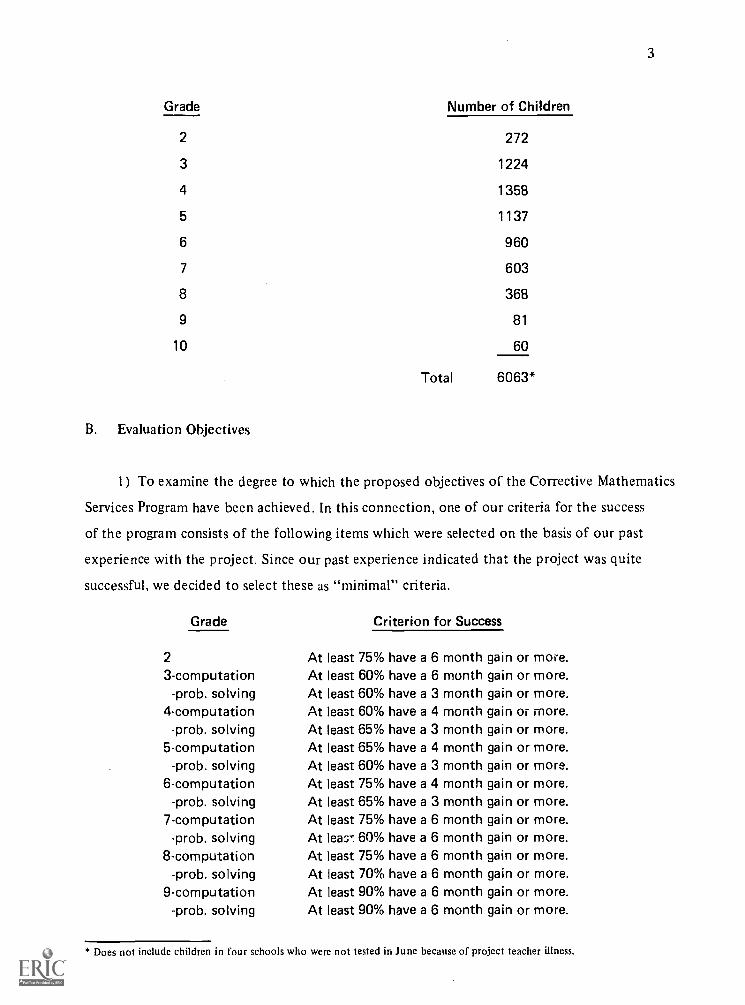
The number of children who were serviced during the school year and tested in June,
1972 were distributed by grade level as follows:
3
Grade Number of Children
2 272
3 1224
4 1358
5 1137
6 960
7 603
8 368
9 81
10 60
Total 6063*
B. Evaluation Objectives
1) To examine the degree to which the proposed objectives of the Corrective Mathematics
Services Program have been achieved. In this connection, one of our criteria for the success
of the program consists of the following items which were selected on the basis of our past
experience with the project. Since our past experience indicated that the project was quite
successful, we decided to select these as "minimal" criteria.
Grade Criterion for Success
2 At least 75% have a 6 month gain or more.3-computation At least 60% have a 6 month gain or more.
-prob. solving At least 60% have a 3 month gain or more.4computation At least 60% have a 4 month gain or more.
-prob. solving At least 65% have a 3 month gain or more.5-computation At least 65% have a 4 month gain or more.
-prob. solving At least 60% have a 3 month gain or more.6-computation At least 75% have a 4 month gain or more.
-prob. solving At least 65% have a 3 month gain or more.7-computation At least 75% have a 6 month gain or more.-prob. solving At 60% have a 6 month gain or more.
8-computation At least 75% have a 6 month gain or more.-prob. solving At least 70% have a 6 month gain or more.
9-computation At least 90% have a 6 month gain or more.-prob. solving At least 90% have a 6 month gain or more.
* Does not include children in four schools who were not tested in June because of project teacher illness.
4
2) To examine and appraise the procedures employed in the Corrective Mathematics
Services Program to achieve the stated objectives.
3) To present recommendations for improving the effectiveness of the Corrective
Mathematics Services Program.
C. Aspects of the Evaluation
1) Evaluation Objective 1: To examine the degree to which the proposed objectives
of the Corrective Mathematics Services Program have been achieved.
(a) Subjects Project and non-project students in each of a stratified random sample
of 20 schools se::xted approximately in proportion to the distribution of the
schools by religion in the entire set of 149 schools actually serviced were sub-
jected to a rather close analysis. (See part (b) which follows.) On the basis of
our two years experience in evaluating this program, we believe that the differ-
ences in achievement between the project and non-project students would be of
such a magnitude that a sample of 20 schools will provide sufficient power to
our statistical analyses so that we may obtain reasonably confident conclusions.
(b) Methods and Procedures
(1') Pre and post-test scores on the MAT were obtained for the children in the
20 schools of our sample who were in the Corrective Mathematics Program. More-
over, pre and post-test scores were also obtained for the students in 18 of the
20 schools who were left on the waiting list these latter students were the
"Control Group." The children from this "Control Group" were paired by grade
level with those in our sample who were in the project. The fact that the Control
Group students, in general, scored higher on the pre-test was taken into account
in our statistical analysis. (The results will be discussed in Chapter II.) The
reason we did not obtain waiting list scores from the other two schools appears
to be due only to a "misunderstanding" on the part of the project teachers in
that school and not because of intentional withholding. Thus, we do not think
that the results of our statistical analyses are compromised because these data
are lacking.
5
(2') In an attempt to assess the extent to which the improvement of the attitude
of students toward mathematics in the project exceeds that of students not in the
project, the following design was followed:
Tests of mathematical attitude were constructed by the team of evaluators and
given to the project students and to the non-projects in the schools both near
the beginning of the school year and near the end of the school year. One interest
test 1,ras given to the studenti in grades 2-6, and another was given to those
in grades 7 and above. The questions were written in both English and Spanish
on each test paper. The results of these tests were used to determine the im-
provement in mathematical attitude on the pare of the project students as well
as the relationship between mathematical attitude and achievement in mathe-
matics on the MAT's. (Appendices X and X1 the tests and their correlation
with MAT achievement and their results will be discussed in Chapter II).
(c) Statistical and/or Qualitative Analysis The material under (1') and (2') in the
following discussion relates, respectively, to the methods and procedures under the
corresponding numbers in the preceding item (b), "Methods and Procedures."
(1') Pertinent confidence intervals were obtained from an analysis of the pre and
post-test scores on the MAT of the project students and the non-project students in
our random sample of 20 schools. These confidence intervals were computed in the
various cases by the analysis of covariance to determine whether or not there is a
difference in mathematics achievement between those who received special remedial
work and those who did not.
(2') The questions on the interest test formulated by the evaluation team were
submitted to a reading specialist who reworded them to make them as clear as
possible to students of the ages to be tested.
We used a scale of responses for each question with the different levels of re-
sponses being never, sometimes, and most of the time for grades 2-6, and
all the time for grades 7 and above. In scoring the tests the responses were
assigned numbers in such a way that a high number always indicates higher interest
than does a lower number. A particular student's score on the test was taken to be
6
the mean of all the scores on the individual questions that were actually answered
by the students.
After the test was developed, it was administered to both project and non-project
(waiting list) students in our random sample of schools. For each student, both
the total test score and the score on each question was recorded. Then, for each
question, a Pearson product-moment coefficient of correlation was computed for
the scores on that question paired with the corresponding total scores. Thus, we
had one coefficient of correlation for each question. If, for a particular
question this coefficient is non-positive, or even if it is positive but very low,
then that question was excluded from further analysis. New total scores were then
computed for all the questions not thus excluded. This process of exclusion was
repeated using these new total scou!s. This procedure was continued until all
questions had a correlation coefficient sufficiently high to yield 95% confidence
that, in general, the score on that question was positively related to the total
score. (If such a test is given again in future years, some of the questions that
are excluded from further analysis in the fall of 1971 may be used in reworded
form.)
A coefficient of correlation was computed in order to obtain the split-half re-
liability coefficient. That is, half of the questions were considered to be one
test and the other half another test, and the coefficient of correlation between
these two tests was computed. This coefficient was then corrected by the Spear-
man-Brown correction formula to account for the fact that each half-test has
only half as many questions as the actual test. If the resulting reliability
was greater than .80, the test was considered to be sufficiently reliable. If
not, the question having lowest correlation with the total score was discarded
and the reliability was recomputed. This procedure was repeated until a suffi-
ciently high reliability coefficient was obtained.
When the discarding processes were over, a total score was computed for each
student for only those questions that were still included and this score will be
known as the pre-test score. Thus, the one administration of the test near the
beginning of the year was used both for perfecting the test and also for the
actual pre-test scores.
7
Near the end of the year, the same attitude test was given and it included all the
questions that were on the pre-test regardless of whether they were excluded or
not from further analysis at the beginning of the year. We did this for the fol-
lowing reason: If the questions that were excluded from analysis on the pre-test,
did not appear at all on the post-test, the two tests may not be equivalent since
they would be of different lengths. Also, some questions, although they may not
be considered in the total post-test score, may still help to establish rapport
and, thus, influence the responses to other questions. A total test score was
computed for each student using only those questions that were included in the
pre-test score and this score as called the post-test score.
An analysis of covariance was computed using the post-test scores as the depen-
dent variable, the type of treatment that is, whether the student was in the
project or not as the independent variable, and the pre-test score as a covari-
ance. This analysis yielded a confidence interval within which the confidence is
95% that the difference between the mean attitude of project students at the end
of the year and the mean attitude of non-project students at the end of the year
lies. Of course, adjustments were made to account for differences in attitude at
the end of the year that appear to have been caused by differences in interest at
the beginning of the year. By adjustments we mean that the effect of the beginning
scores was removed by using the gain in achievement as the score.
The pre-test and post-test achievement scores from the Metropolitan Achievement
Test and pre-test and post-test scores from the interest test are four scores for
each project student in our random sample. A correlation coefficient for the re-
lationship between the post-test achievement score and the post-test interest
score was computed to assess the strength of the relation between attitude and
achievement. Of course, the effect of the pre-test scores were removed at the be-
ginning of the computation.
(d) Time Schedule
Pre-tests MAT and Attitude September 1971
Post-tests MAT and Attitude May and June 1972
8
2) Era/tot/on Obfectire 2: To examine and appraise the procedures employed in the
Corrective Mathematics Services Program to achieve the stated program objectives.
(a) Subjects:
Project students and project teachers in the random sample of 20 schools were
subjected to a close analysis. (See part (b) which follows.) In addition, princi-
pals and at least one regular classroom teacher in each of the 20 schools were
interviewed. Moreover, there were pertinent questions on anonymous question-
naires to project teachers, principals, and regular classroom teachers in each of the
149 schools. On the basis of our two years experience in evaluating this program,
we believe that the differences in achievement between the project and non-project
students would be of such magnitude that a sample of 20 schools will provide suf-
ficient power to our statistical analyses to that we may obtain reasonable con-
fident conclusions.
(b) Methods and Procedures:
(I') For the project students in each of the 20 schools in our random sample, a
study was made of the relationship between achievement and the number of project
teaching sessions attended by the students. We obtained for each project student
in our random sample a Metropolitan Achievement Test post-test score, as well as
a number which is the number of sessions that the student was taught and a Metro-
politan Achievement Test pre-test score.
(2') On-site visits to each of the random sample of schools were conducted. These
visits were begun in the fall of 1971. In addition, four of these schools were
arbitrarily selected and visited for a second time in the spring 1972.
During each visit, the corrective teacher, the principal, and two regular class-
room teachers were interviewed in conformity with specially prepared interview
forms. (Appendices I, II, and III.) Ratings of eight teaching practices of the
project teachers in the 20 schools were made and analyses were carried out to
assess the relation between achievement and these teaching practices. Among the
other teaching practices we investigated are: respect of the project teacher for
the students, the project teacher's expectation for the student, and the
9
authoritarianism of the project teacher. Pertinent data was obtained during the on-
site visits by the evaluators in their observations of the corrective mathematic:.
classes. (The results will be discussed in Chapter III.)
(3') Pertinent questions were included in each of the anonymous questionnaires
which were mailed to teachers, principals, and two regular classroom teachers in
all of the 149 schools. (See Appendices IV, VI, VIII, respectively. The results
of our analysis of pertinent questions will be given in Chapter III. Analysis of
other questions are given in Apptidices V, VII, and IX.)
(c) Statistical and/or Qualitative Analysis The material under (1'), (23), and (3') in
the following discussion relates, respectively, to the methods and procedures under
the corresponding cumbers in the proceeding item (b) "Methods and Procedures."
(1') A coefficient of partial correlation was computed for each school in our sam-
ple to assess the relation between achievement at the end of the year and the number
of sessions that a student was taught. In the course of the computation the effect
of the pre-test achievement was removed.
(2') A correlation coefficient was computed for the relationship between the mean
achievement of the project students in each school of our sample and the project
students in each school of our sample and the project teacher's total rating as
well as for the teacher's rating on each of the teaching practices.
(3') Numerical assignments were made to the alternative responses to the perti-
nent questions on all the anonymous questionnaires and arithmetic means were
computed.
Time Schedule
On-site visits throughout school year
Mailing of anonymous questionnaires March 1972
3) Evaluation Objective 3: To present recommendations for improving the effective-
ness of the Corrective Mathematics Services Program. These recommendations are based on the
results of our statistical analyses and interviews. (The recommendations are given in
Chapter III.)
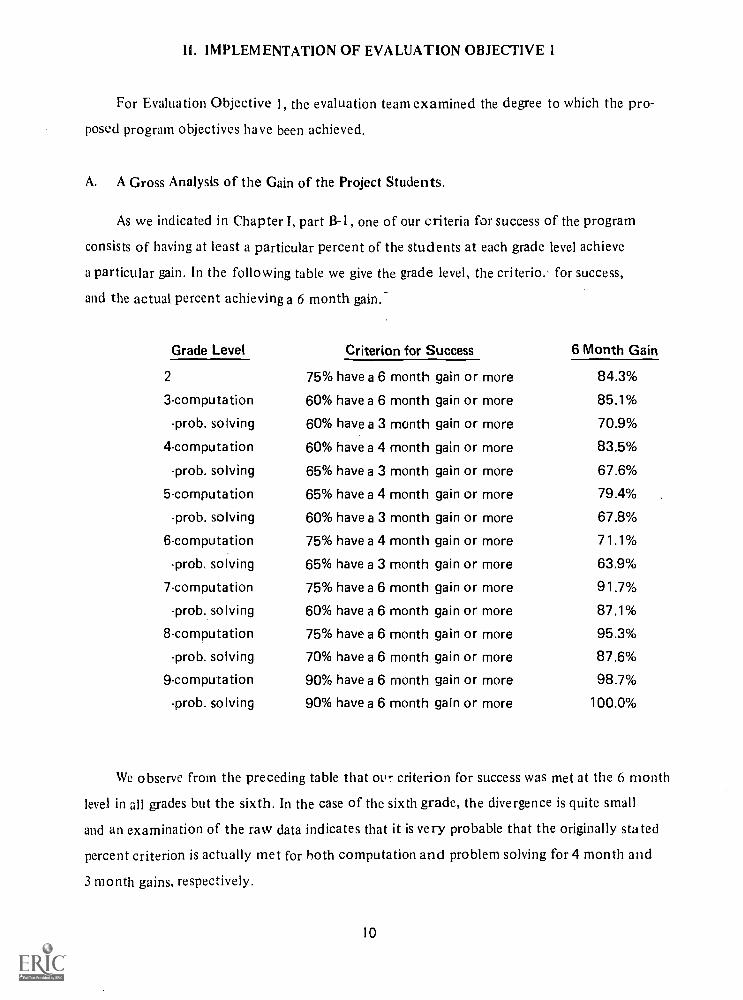
II. IMPLEMENTATION OF EVALUATION OBJECTIVE 1
For Evaluation Objective 1, the evaluation team examined the degree to which the pro-
posed program objectives have been achieved.
A. A Gross Analysis of the Gain of the Project Students.
As we indicated in Chapter I, part B-1, one of our criteria for success of the program
consists of having at least a particular percent of the students at each grade level achieve
a particular gain. In the following table we give the grade level, the criterioc for success,
and the actual percent achieving a 6 month gain.-
Grade Level Criterion for Success 6 Month Gain
2 75% have a 6 month gain or more 84.3%
3-computation 60% have a 6 month gain or more 85.1%
-prob. solving 60% have a 3 month gain or more 70.9%
4-computation 60% have a 4 month gain or more 83.5%
-prob. solving 65% have a 3 month gain or more 67.6%
5-computation 65% have a 4 month gain or more 79.4%
-prob. solving 60% have a 3 month gain or more 67.8%
6-computation 75% have a 4 month gain or more 71.1%
-prob. solving 65% have a 3 month gain or more 63.9%
7-computation 75% have a 6 month gain or more 91.7%
-prob. solving 60% have a 6 month gain or more 87.1%
8-computation 75% have a 6 month gain or more 95.3%
-prob. solving 70% have a 6 month gain or more 87.6%
9-computation 90% have a 6 month gain or more 98.7%
-prob. solving 90% have a 6 month gain or more 100.0%
We observe from the preceding table that ow.- criterion for success was met at the 6 month
level in all grades but the sixth. In the case of the sixth grade, the divergence is quite small
and an examination of the raw data indicates that it is very probable that the originally stated
percent criterion is actually met for hoth computation and problem solving for 4 month and
3 month gains, respectively.
10
11
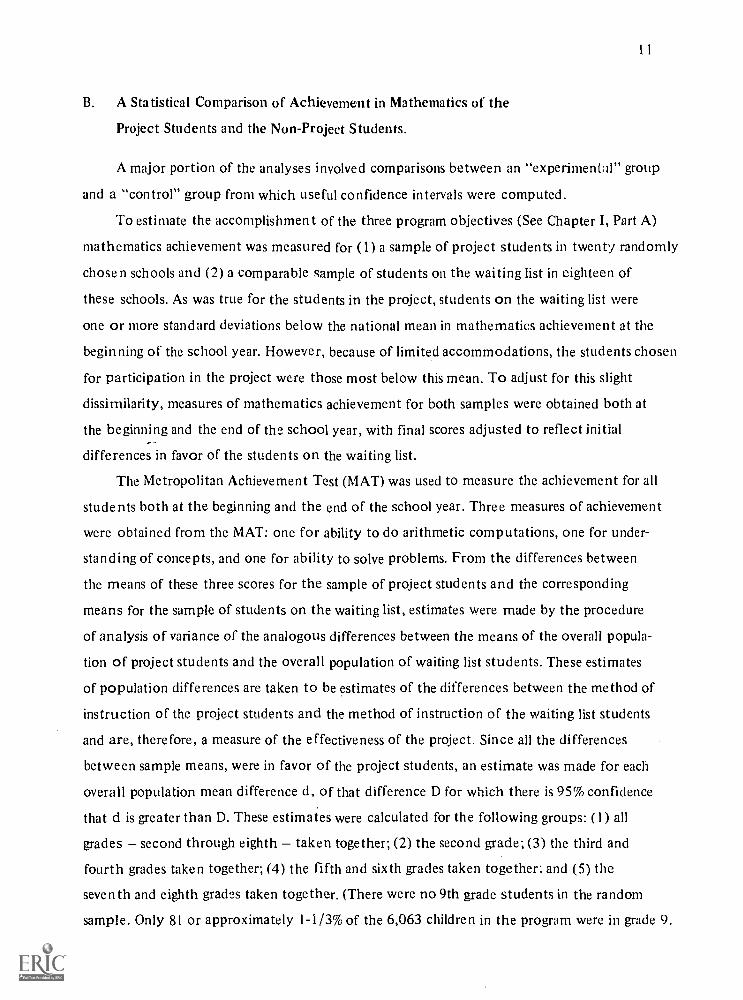
B. A Statistical Comparison of Achievement in Mathematics of the
Project Students and the Non-Project Students.
A major portion of the analyses involved comparisons between an "experimental" group
and a "control" group from which useful confidence intervals were computed.
To estimate the accomplishment of the three program objectives (See Chapter I, Part A)
mathematics achievement was measured for (1) a sample of project students in twenty randomly
chosen schools and (2) a comparable sample of students on the waiting list in eighteen of
these schools. As was true for the students in the project, students on the waiting list were
one or more standard deviations below the national mean in mathematics achievement at the
beginning of the school year. However, because of limited accommodations, the students chosen
for participation in the project were those most below this mean. To adjust for this slight
dissimilarity, measures of mathematics achievement for both samples were obtained both at
the beginning and the end of the school year, with final scores adjusted to reflect initial
differences in favor of the students on the waiting list.
The Metropolitan Achievement Test (MAT) was used to measure the achievement for all
students both at the beginning and the end of the school year. Three measures of achievement
were obtained from the MAT: one for ability to do arithmetic computations, one for under-
standing of concepts, and one for ability to solve problems. From the differences between
the means of these three scores for the sample of project students and the corresponding
means for the sample of students on the waiting list, estimates were made by the procedure
of analysis of variance of the analogous differences between the means of the overall popula-
tion of project students and the overall population of waiting list students. These estimates
of population differences are taken to be estimates of the differences between the method of
instruction of the project students and the method of instruction of the waiting list students
and are, therefore, a measure of the effectiveness of the project. Since all the differences
between sample means, were in favor of the project students, an estimate was made for each
overall population mean difference d, of that difference D for which there is 95% confidence
that d is greater than D. These estimates were calculated for the following groups: (1) all
grades second through eighth taken together; (2) the second grade; (3) the third and
fourth grades taken together; (4) the fifth and sixth grades taken together; and (5) the
seventh and eighth grades taken together. (There were no 9th grade students in the random
sample. Only 81 or approximately 1-1/3% of the 6,063 children in the program were in grade 9.
12
The random sample was stratified by religious code and the-sampling did not pick-up any
9th graders.)
Various wades were combined because we believed that the fragmentation of information
would be too great for each grade separately. The evaluation team felt that there was not
enough difference in content between two consecutive grades for separate analyses to be of
great interest. Account was taken of variables in pupils exposure. (See Chapter 3.) The
number of days Olat each project student attended the program was recorded and coefficients
of correlation were computed for the relations between this exposure and the achievements.
The exposure of non-project students was zero for each student.
The means and differences are all stated in units of one "year of achievement" which
is the average achievement gained during one year by children in general in the entire country.
Thus, one year of achievement gain is the average achievement gain for the nation as a whole.
Since this year of achievement is considered to be a ten-month year, the number of tenths of
years of achievement gain is also the number of months of gain. Thus, for example, six tenths
of a year of gain means six months gain. Table 1 on the following page lists these estimates.
Since the number of degrees of freedom is rather large in all but one case, namely the
concepts scores for Grades Seven and Eight, the critical t ratio was taken to be 1.65 in every
case, which is the same as for a normal distribution. Although the number of subjects is cer-
tainly accounted for in the computation of the standard error, the sample of only 12 project
students for the comparison of concepts for Grades Seven and Eight is very questionable.
The standard error is reported in Table I so that it is possible for the reader to com-
pute any other confidence limits that may be desired. The lower limit of any confidence inter-
val is, in general, the difference between the sample means and the product of the standard
error and the appropriate critical t ratio, which can be found in a table in most statistics
texts. For example, referring to "computation all grades" we have (to the nearest thou-
sandth) .298 = .384(.052 x 1.65).
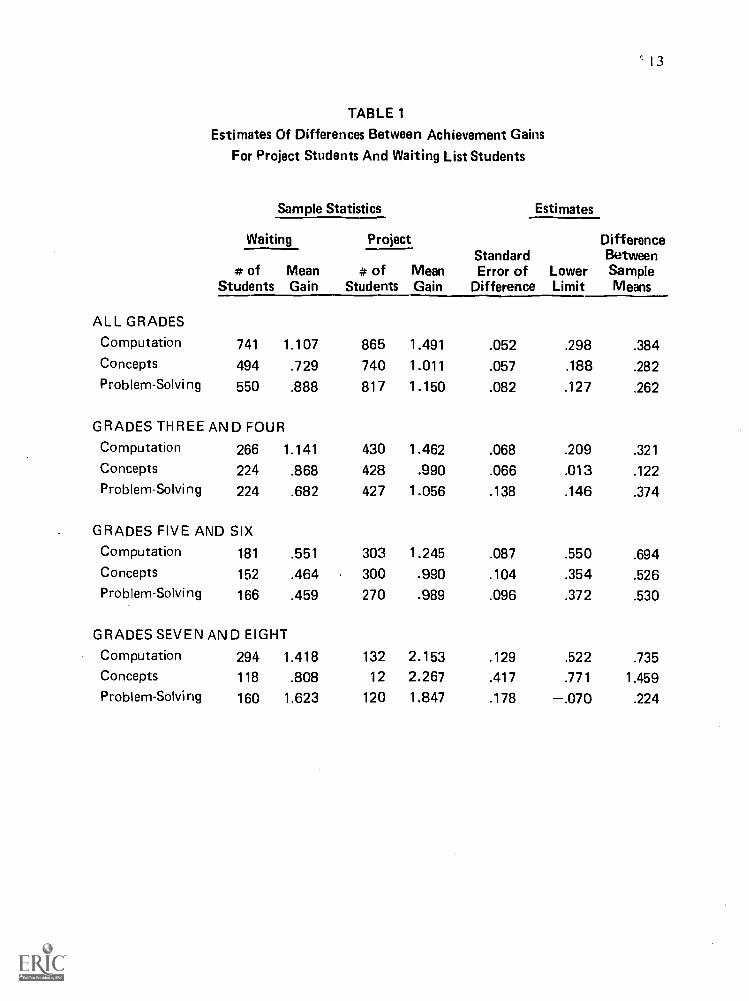
TABLE 1
Estimates Of Differences Between Achievement Gains
For Project Students And Waiting List Students
Sample Statistics Estimates
`13
ALL GRADES
Waiting ProjectStandardError of
DifferenceLowerLimit
DifferenceBetweenSampleMeans
# ofStudents
MeanGain
# ofStudents
MeanGain
Computation 741 1.107 865 1.491 .052 .298 .384Concepts 494 .729 740 1.011 .057 .188 .282Problem-Solving 550 .888 817 1.150 .082 .127 .262
GRADES THREE AND FOUR
Computation 266 1.141 430 1.462 .068 .209 .321
Concepts 224 .868 428 .990 .066 .013 .122Problem-Solving 224 .682 427 1.056 .138 .146 .374
GRADES FIVE AND SIXComputation 181 .551 303 1.245 .087 .550 .694Concepts 152 .464 300 .990 .104 .354 .526Problem-Solving 166 .459 270 .989 .096 .372 .530
GRADES SEVEN AND EIGHT
Computation 294 1.418 132 2.153 .129 .522 .735
Concepts 118 .808 12 2.267 .417 .771 1.459
Problem-Solving 160 1.623 120 1.847 .178 -.070 .224
14
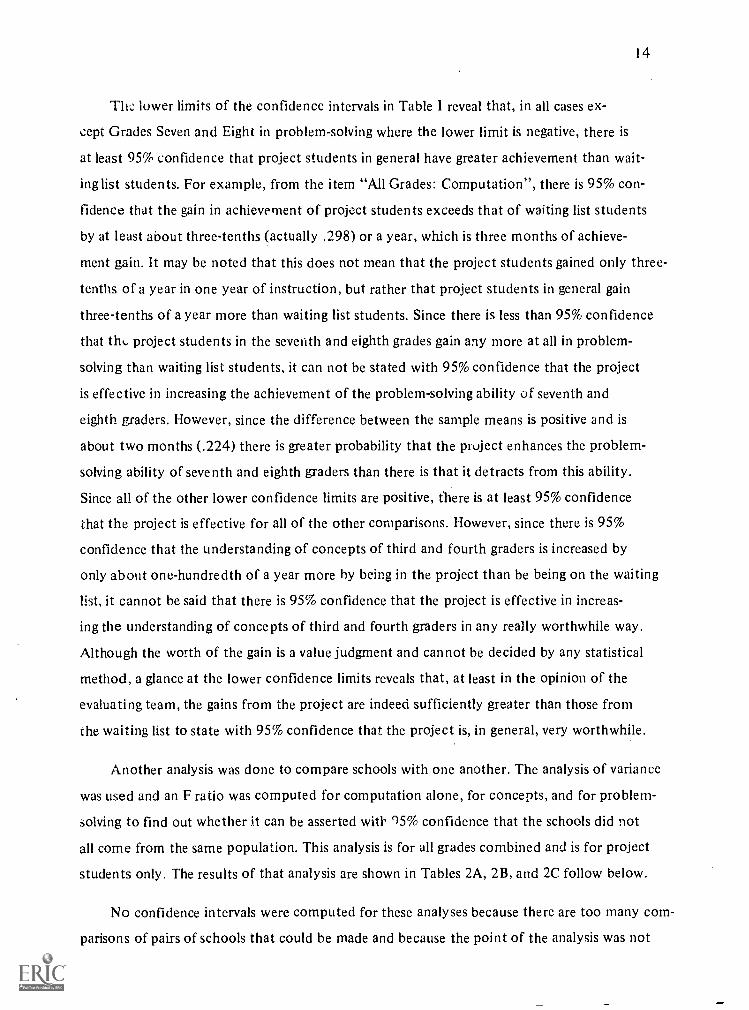
Th.: lower limits of the confidence intervals in Table I reveal that, in all cases ex-
cept Grades Seven and Eight in problem-solving where the lower limit is negative, there is
at least 95% confidence that project students in general have greater achievement than wait-
ing list students. For example, from the item "All Grades: Computation", there is 95% con-
fidence that the gain in achievement of project students exceeds that of waiting list students
by at least about three-tenths (actually .298) or a year, which is three months of achieve-
ment gain. It may be noted that this does not mean that the project students gained only three-
tenths of a year in one year of instruction, but rather that project students in general gain
three-tenths of a year more than waiting list students. Since there is less than 95% confidence
that the project students in the seventh and eighth grades gain any more at all in problem-
solving than waiting list students, it can not be stated with 95% confidence that the project
is effective in increasing the achievement of the problem-solving ability of seventh and
eighth graders. However, since the difference between the sample means is positive and is
about two months (.224) there is greater probability that the project enhances the problem-
solving ability of seventh and eighth graders than there is that it detracts from this ability.
Since all of the other lower confidence limits are positive, there is at least 95% confidence
that the project is effective for all of the other comparisons. However, since there is 95%
confidence that the understanding of concepts of third and fourth graders is increased by
only about one-hundredth of a year more by being in the project than be being on the waiting
list, it cannot be said that there is 95% confidence that the project is effective in increas-
ing the understanding of concepts of third and fourth graders in any really worthwhile way.
Although the worth of the gain is a value judgment and cannot be decided by any statistical
method, a glance at the lower confidence limits reveals that, at least in the opinion of the
evaluating team, the gains from the project are indeed sufficiently greater than those from
the waiting list to state with 95% confidence that the project is, in general, very worthwhile.
Another analysis was done to compare schools with one another. The analysis of variance
was used and an F ratio was computed for computation alone, for concepts, and for problem-
solving to find out whether it can be asserted with 95% confidence that the schools did not
all come from the same population. This analysis is for all grades combined and is for project
students only. The results of that analysis are shown in Tables 2A, 2B, and 2C follow below.
No confidence intervals were computed for these analyses because there are too many com-
parisons of pairs of schools that could be made and because the point of the analysis was not
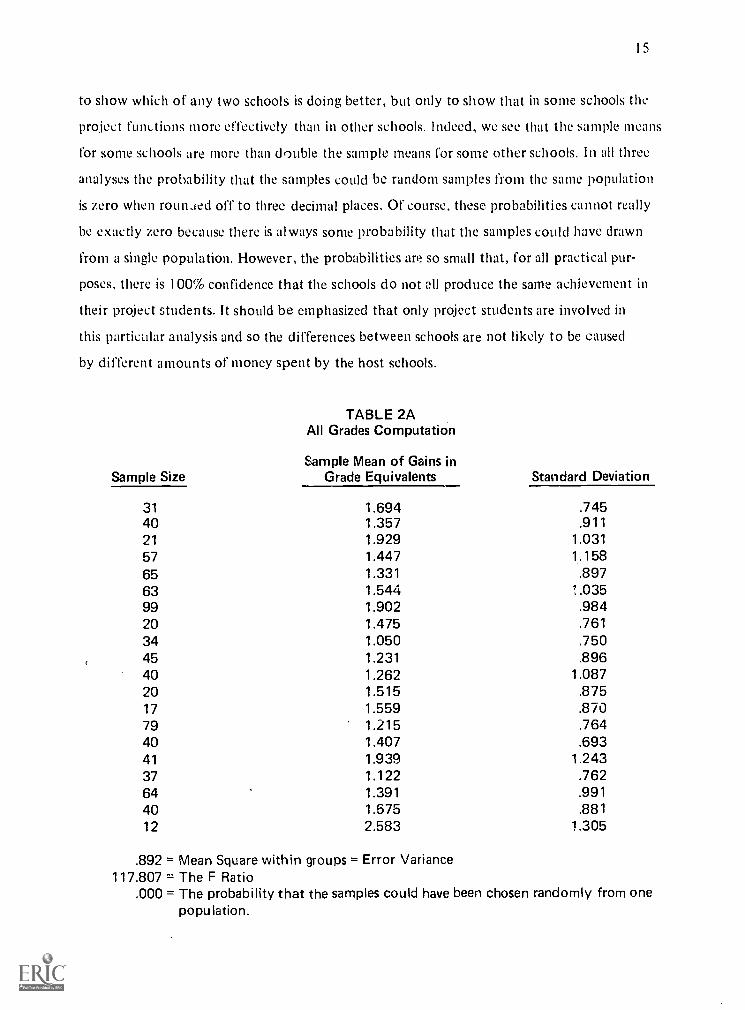
IS
to show which of any two schools is doing better, but only to show that in some schools the
project funLtions more effectively than in other schools. Indeed, we see that the sample means
for some schools are more than double the sample means for some other schools. In all three
analyses the probability that the samples could be random samples from the same population
is zero when rounded off to three decimal places. or course, these probabilities cannot really
be exactly zero because there is always some probability that the samples could have drawn
from a single population. However, the probabilities are so small that, for all practical pur-
poses, there is 100% confidence that the schools do not 411 produce the same achievement in
their project students. It should be emphasized that only project students are involved in
this particular analysis and so the differences between schools are not likely to be caused
by different amounts of money spent by the host schools.
Sample Size
TABLE 2AAll Grades Computation
Sample Mean of Gains inGrade Equivalents Standard Deviation
31 1.694 .74540 1.357 .91121 1.929 1.03157 1.447 1.15865 1.331 .89763 1.544 1.03599 1.902 .98420 1.475 .76134 1.050 .75045 1.231 .89640 1.262 1.08720 1.515 .87517 1.559 .87079 1.215 .76440 1.407 .69341 1.939 1.24337 1.122 .76264 1.391 .99140 1.675 .88112 2.583 1.305
.892 = Mean Square within groups = Error Variance117.807 = The F Ratio
.000 = The probability that the samples could have been chosen randomly from onepopulation.
I6
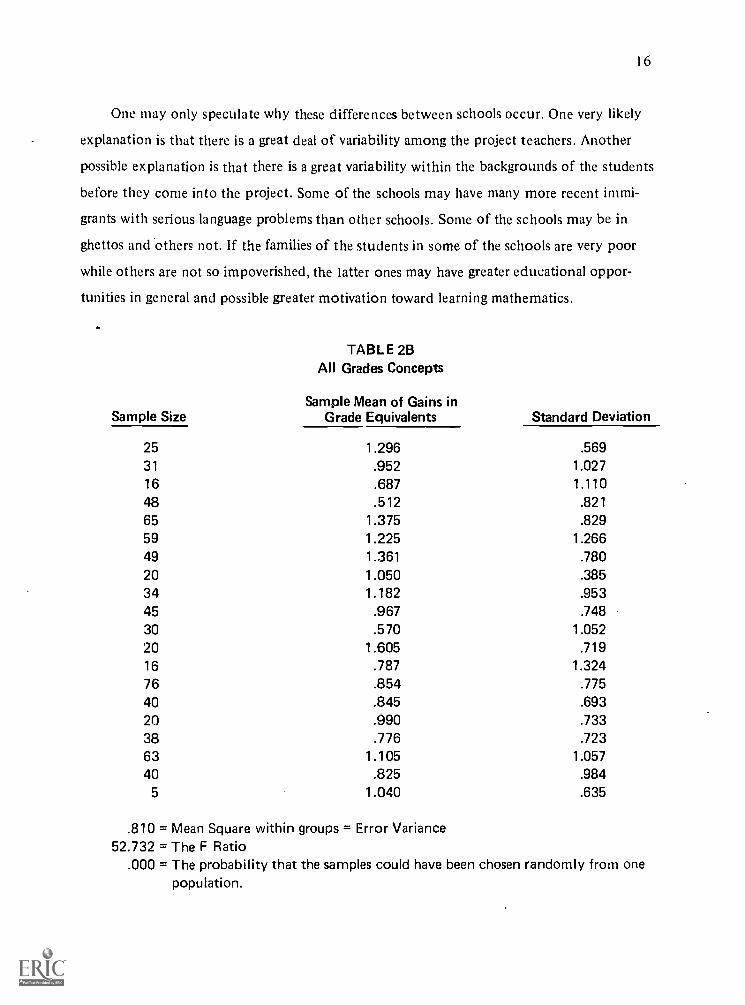
One may only speculate why these differences between schools occur. One very likely
explanation is that there is a great deal of variability among the project teachers. Another
possible explanation is that there is a great variability within the backgrounds of the students
before they come into the project. Some of the schools may have many more recent immi-
grants with serious language problems than other schools. Some of the schools may be in
ghettos and others not. If the families of the students in some of the schools are very poor
while others are not so impoverished, the latter ones may have greater educational oppor-
tunities in general and possible greater motivation toward learning mathematics.
Sample Size
TABLE 2BAll Grades Concepts
Sample Mean of Gains inGrade Equivalents Standard Deviation
25 1.296 .569
31 .952 1.027
16 .687 1.11048 .512 .821
65 1.375 .82959 1.225 1.26649 1.361 .780
20 1.050 .38534 1.182 .953
45 .967 .748
30 .570 1.052
20 1.605 .719
16 .787 1.324
76 .854 .775
40 .845 .693
20 .990 .733
38 .776 .723
63 1.105 1.057
40 .825 .9845 1.040 .635
.810 = Mean Square within groups = Error Variance52.732 = The F Ratio
.000 = The probability that the samples could have been chosen randomly from onepopulation.
17
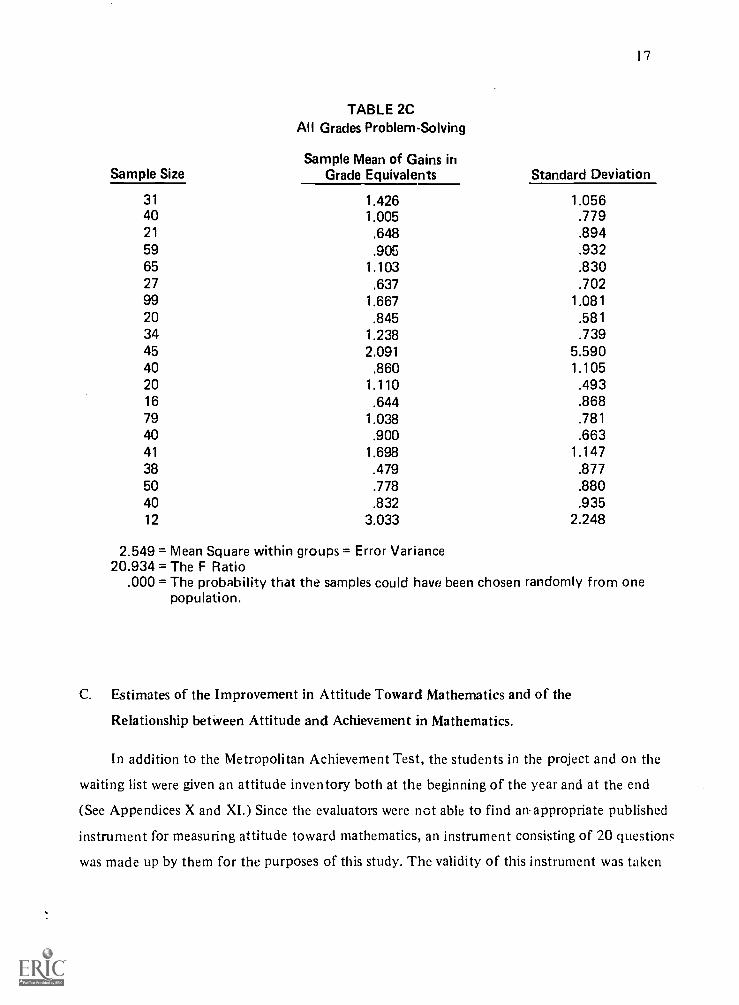
TABLE 2CAll Grades Problem-Solving
Sample Mean of Gains inSample Size Grade Equivalents Standard Deviation
31 1.426 1.05640 1.005 .77921 .648 .89459 .905 .93265 1.103 .83027 .637 .70299 1.667 1.08120 .845 .58134 1.238 .73945 2.091 5.59040 .860 1.10520 1.110 .49316 .644 .86879 1.038 .78140 .900 .66341 1.698 1.14738 .479 .87750 .778 .88040 .832 .93512 3.033 2.248
2.549 = Mean Square within groups = Error Variance20.934 = The F Ratio
.000 = The probability that the samples could have been chosen randomly from onepopulation.
C. Estimates of the Improvement in Attitude Toward Mathematics and of the
Relationship betWeen Attitude and Achievement in Mathematics.
In addition to the Metropolitan Achievement Test, the students in the project and on the
waiting list were given an attitude inventory both at the beginning of the year and at the end
(See Appendices X and XI.) Since the evaluators were not able to find an. appropriate published
instrument for measuring attitude toward mathematics, an instrument consisting of 20 questions
was made up by them for the purposes of this study. The validity of this instrument was taken
18
at face value. That is, since the questions, by their meaning, seemed to be obviously asking
about attitude toward mathematics, it was assumed that it must be measuring what the evaluators
choose to define as attitude toward mathematics.
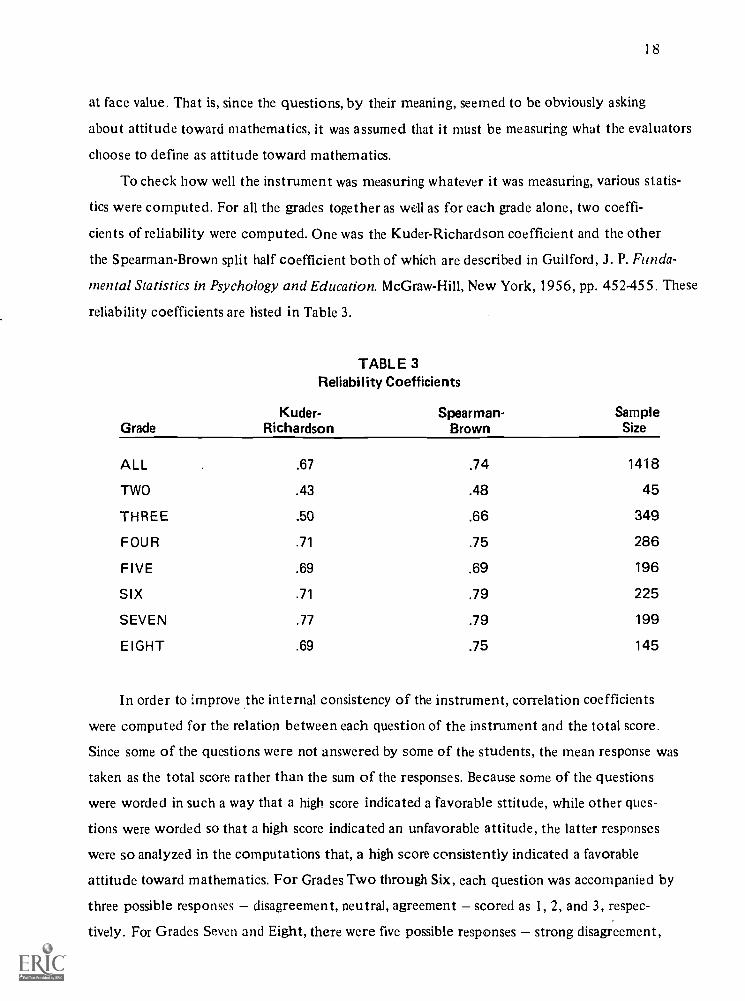
To check how well the instrument was measuring whatever it was measuring, various statis-
tics were computed. For all the grades together as well as for each grade alone, two coeffi-
cients of reliability were computed. One was the Kuder-Richardson coefficient and the other
the Spearman-Brown split half coefficient both of which are described in Guilford, J. P. Funda-
mental Statistics in Psychology and Education. McGraw-Hill, New York, 1956, pp. 452-455. These
reliability coefficients are listed in Table 3.
TABLE 3Reliability Coefficients
GradeKuder-
RichardsonSpearman-
BrownSampleSize
ALL .67 .74 1418
TWO .43 .48 45
THREE .50 .66 349
FOUR .71 .75 286
FIVE .69 .69 196
SIX .71 .79 225
SEVEN .77 .79 199
EIGHT .69 .75 145
In order to improve the internal consistency of the instrument, correlation coefficients
were computed for the relation between each question of the instrument and the total score.
Since some of the questions were not answered by some of the students, the mean response was
taken as the total score rather than the sum of the responses. Because some of the questions
were worded in such a way that a high score indicated a favorable sttitude, while other ques-
tions were worded so that a high score indicated an unfavorable attitude, the latter responses
were so analyzed in the computations that, a high score consistently indicated a favorable
attitude toward mathematics. For Grades Two through Six, each question was accompanied by
three possible responses disagreement, neutral, agreement scored as 1, 2, and 3, respec-
tively. For Grades Seven and Eight, there were five possible responses strong disagreement,
1 Q
agreement, neutral, agreement, strong agreement scored as one through five, respectively. In
order to make the responses comparable for all grades, a score of three for Grades Two through
Six was changed to a score of five, a score of two was changed to a score of three, while a
score of one was left unchanged. Thus, for all questions and for all grades a score of one re-
flects a strongly unfavorable attitude, or at least an unfavorable attitude, toward mathe-
matics, a score of three reflects a neutral opinion, and a score of five reflects a strongly
favorable attitude, or at least a favorable attitude toward mathematics. In cases in which
there were responses of two and four, the meanings are between one and three and between three
and five respectively.
For all grades together and for each grade separately, except Grade Two, the correlation
coefficients were found to be high enough for one to be at least 99% confident that any par-
ticular question 'tit asures, to some extent, the same attributes that the whole test measures.
However, for Grade Two, the correlation coefficients were low and were even negative for
some questions. Considering these low correlation coefficients as well as the low reliability
coefficients shown in Table 3, it appears that the instrument was not appropriate for use with
second grade children. Perhaps it is not even possible to measure the attitudes of such young
children for (1) their attitudes may not yet be stabilized, (2) they may not be able to ex-
press their feelings well, and (3) they may not fully understand the directions of a standard-
ized instrument.
Because of the low correlation coefficient for Grade Two, some of the most weakly re-
lated questions were dropped from the instrument for this grade and new correlation coeffi-
cients and reliability coefficients were computed. Questions 3, 5, 7, 8, 10, 13, 17, 18, and 20
were dropped for the second grade and for purposes of computing the correlation coefficients
for all grades together, the second graders were not included in the computations affecting
the questions. All twenty questions were retained for the other grades. Thus, there were
actually two instruments, one for the second grade, consisting of only eleven questions, and
another for all the other grades consisting of twenty questions. The reliability coefficients
shown in Table 3 for the Second Grade are those that were computed after the questions were
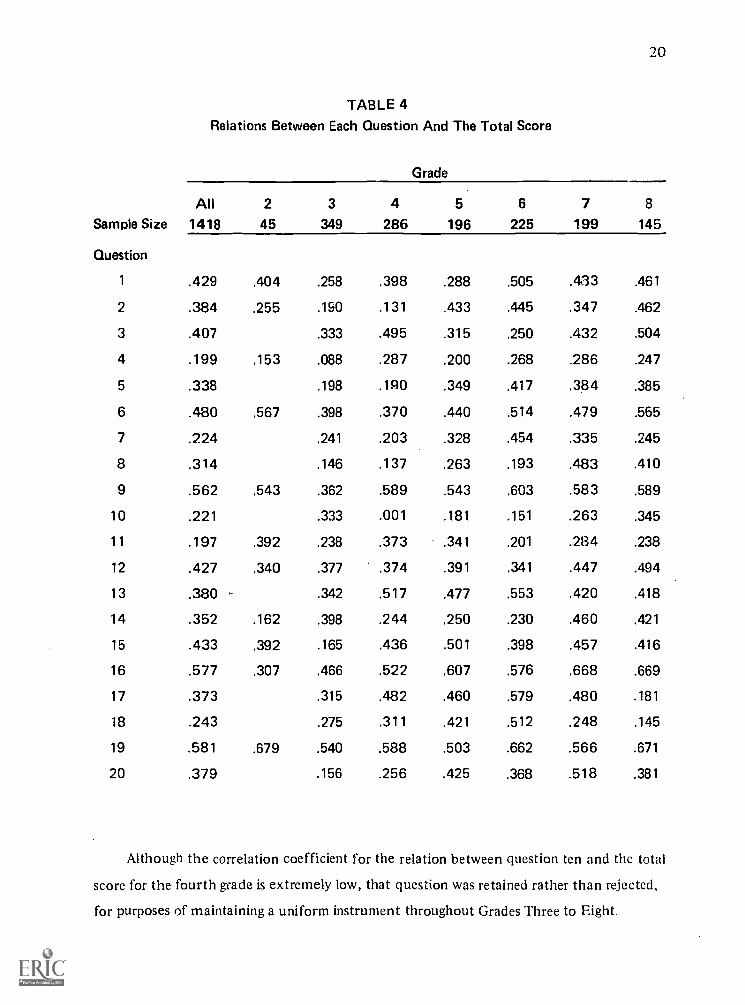
chopped. The correlation coefficients and sample sizes are listed in Table 4.
The sample size may actually be different for each question as well as for each grade
because not all of the questions were answered by all students. However, as the sample sizes
are nearly the same for all questions for any one grade, only one size is given. The actual
number of students who responded to each question was used in computing the correlation
coefficients.
20
TABLE 4Relations Between Each Question And The Total Score
Grade
All 2 3 4 5 6 7 8
Sample Size 1418 45 349 286 196 225 199 145
Question
1 .429 .404 .258 .398 .288 .505 .433 .461
2 .384 .255 .190 .131 .433 .445 .347 .462
3 .407 .333 .495 .315 .250 .432 .504
4 .199 .153 .088 .287 .200 .268 .286 .247
5 .338 .198 .190 .349 .417 .384 .385
6 .480 .567 .398 .370 .440 .514 .479 .565
7 .224 .241 .203 .328 .454 .335 .245
8 .314 .146 .137 .263 .193 .483 .410
9 .562 .543 .362 .589 .543 .603 .583 .589
10 .221 .333 .001 .181 .151 .263 .345
11 .197 .392 .238 .373 .341 .201 .284 .238
12 .427 .340 .377 .374 .391 .341 .447 .494
13 .380 .342 .517 .477 .553 .420 .418
14 .352 .162 .398 .244 .250 .230 .460 .421
15 .433 .392 .165 .436 .501 .398 .457 .416
16 .577 .307 .466 .522 .607 .576 .668 .669
17 .373 .315 .482 .460 .579 .480 .181
18 .243 .275 .311 .421 .512 .248 .145
19 .581 .679 .540 .588 .503 .662 .566 .671
20 .379 .156 .256 .425 .368 .518 .381
Although the correlation coefficient for the relation between question ten and the total
score for the fourth grade is extremely low, that question was retained rather than rejected,
for purposes of maintaining a uniform instrument throughout Grades Three to Eight.
21
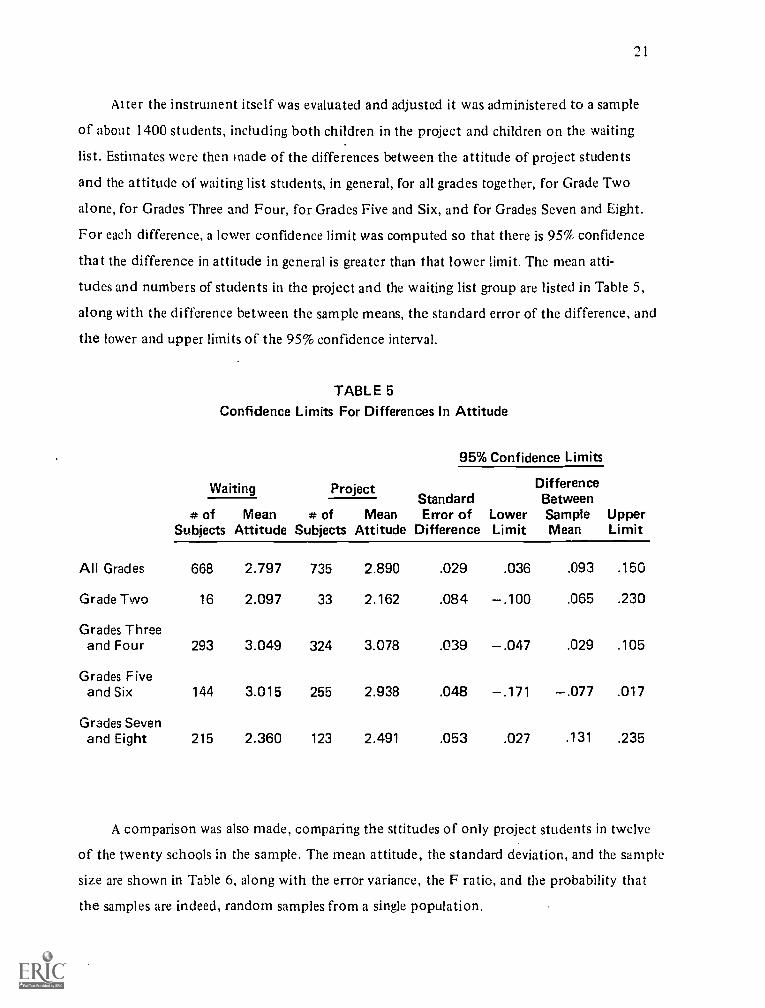
At ter the instrument itself was evaluated and adjusted it was administered to a sample
of about 1400 students, including both children in the project and children on the waiting
list. Estimates were then made of the differences between the attitude of project students
and the attitude of waiting list students, in general, for all grades together, for Grade Two
alone, for Grades Three and Four, for Grades Five and Six, and for Grades Seven and Eight.
For each difference, a lower confidence limit was computed so that there is 95% confidence
that the difference in attitude in general is greater than that lower limit. The mean atti-
tudes and numbers of students in the project and the waiting list group are listed in Table 5,
along with the difference between the sample means, the standard error of the difference, and
the lower and upper limits of the 95% confidence interval.
TABLE 5Confidence Limits For Differences In Attitude
95% Confidence Limits
Waiting ProjectStandardError of Lower
Difference Limit
DifferenceBetweenSampleMean
UpperLimit
# of Mean # of MeanSubjects Attitude Subjects Attitude
All Grades 668 2.797 735 2.890 .029 .036 .093 .150
Grade TWO 16 2.097 33 2.162 .084 .100 .065 .230
Grades Threeand Four 293 3.049 324 3.078 .039 .047 .029 .105
Grades Fiveand Six 144 3.015 255 2.938 .048 .171 .077 .017
Grades Sevenand Eight 215 2.360 123 2.491 .053 .027 .131 .235
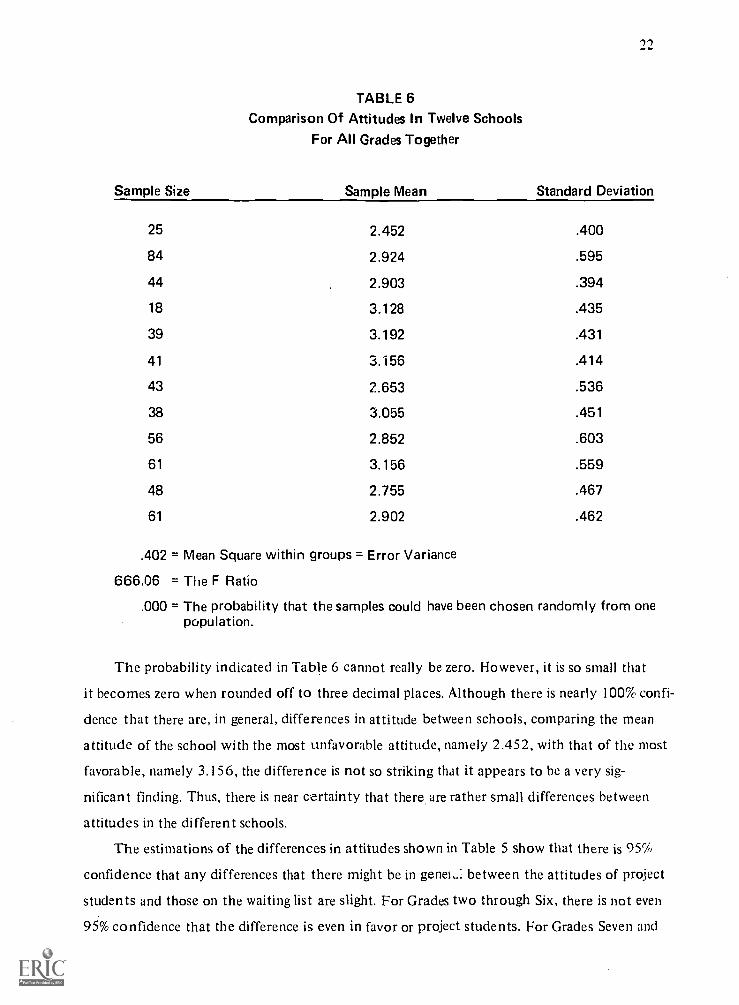
A comparison was also made, comparing the sttitudes of only project students in twelve
of the twenty schools in the sample. The mean attitude, the standard deviation, and the sample
size are shown in Table 6, along with the error variance, the F ratio, and the probability that
the samples are indeed, random samples from a single population.
Sample Size
12
TABLE 6Comparison Of Attitudes In Twelve Schools
For All Grades Together
Sample Mean Standard Deviation
25 2.452 .400
84 2.924 .595
44 2.903 .394
18 3.128 A35
39 3.192 .431
41 3.156 .414
43 2.653 .536
38 3.055 .451
56 2.852 .603
61 3.156 .559
48 2.755 .467
61 2.902 .462
.402 = Mean Square within groups = Error Variance
666.06 = The F Ratio
.000 = The probability that the samples could have been chosen randomly from onepopulation.
The probability indicated in Table 6 cannot really be zero. However, it is so small that
it becomes zero when rounded off to three decimal places. Although there is nearly 100% confi-
dence that there are, in general, differences in attitude between schools, comparing the mean
attitude of the school with the most unfavorable attitude, namely 2.452, with that of the most
favorable, namely 3.156, the difference is not so striking that it appears to be a very sig-
nificant finding. Thus, there is near certainty that there are rather small differences between
attitudes in the different schools.
The estimations of the differences in attitudes shown in Table 5 show that there is 95%
confidence that any differences that there might be in genet,: between the attitudes of project
students and those on the waiting list are slight. For Grades two through Six, there is not even
95% confidence that the difference is even in favor or project students. For Grades Seven and
23
Eight and for all the grades together, there is 95% confidence that project students in gen-
eral have a more favorable attitude toward mathematics than those on the waiting list. How-
ever, the differences are so slight that in the opinion of the evaluators, they can hardly
be considered important. Indeed, since the attitudes were measured on a five point scale, it
is again the opinion of the evaluators that even a difference of .235 on a five point scale
is not enough to be considered noteworthy. Since there is 95% confidence that all of the dif-
ferences are less than .235, and since there is 95% confidence that the differences for most
of the grades are a great deal less than that, there is very little evidence to support any
claim that the project has any considerable effect upon the attitude of students toward
mathematics.
One may only conjecture why the project has no substantial effect upon the attitudes of
students toward mathematics. Furthermore, this seems to contradict a later finding (Chapter
III, Part A) that there is no worthwhile relation between attendance and achievement. If it
is speculated that the reason that attendance has no worthwhile effect upon achievement is
that by merely participating in the project a student is motivated to learn mathematics, then
it would appear that this same student's attitude toward mathematics should be appreciably
more improved than that of a student on the waiting list. Since this was not the case in this
study, it may be that the project students do not associate the benefits of the project with
mathematics itself, that is, whereas they may derive increased security and self-concept from
participation in the project, they still maintain mildly unfavorable attitudes toward the ac-
tual subject matter of mathematics. It may be noted from Table 5 that the mean attitudes are
generally about 3 or somewhat less than 3, which means that the overall attitudes toward mathe-
matics of both project students and waiting list students are either neutral or somewhat un-
favorable. Apparently, the initial attitudes of project students toward mathematics are suf-
ficiently unfavorable so that the project has little or no effect upon them, even though the
comparison of achievement presented earlier shows that there is at least 95% confidence that
the project does indeed improve achievement.
III. IMPLEMENTATION OF EVALUATION OBJECTIVES 2 AND 3
A. Evaluation Objective 2
As indicated in Part B of Chapter I, Evaluation Objective 2 was to examine and appraise
the procedures employed to achieve the stated objectives of the Corrective Mathematics Ser-
vices Program.
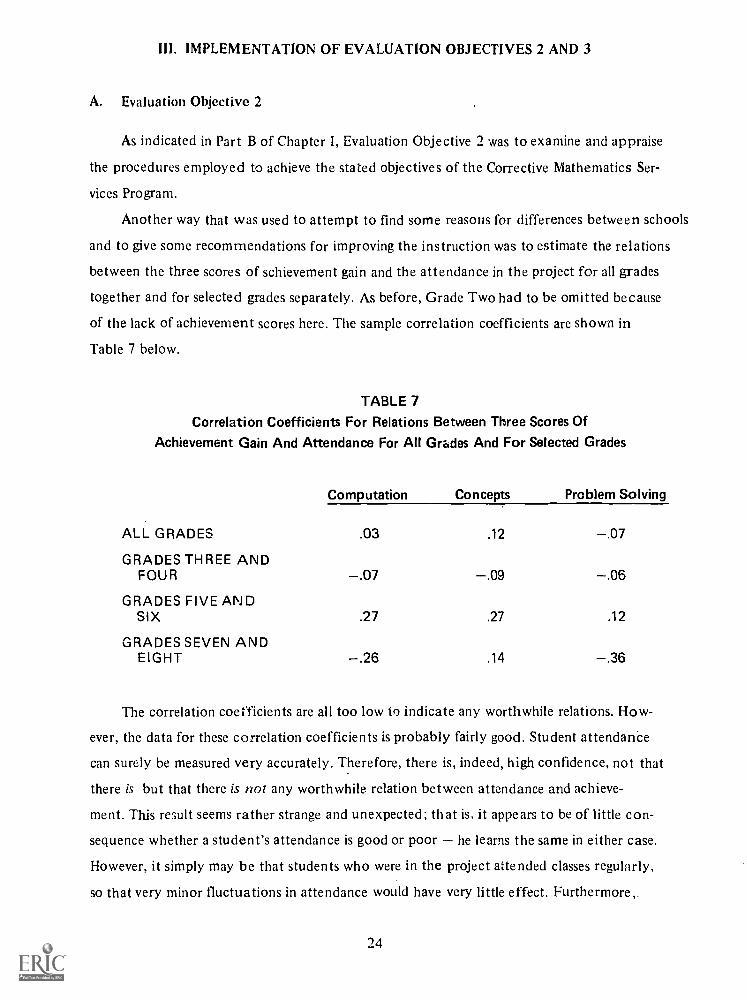
Another way that was used to attempt to find some reasons for differences between schools
and to give some recommendations for improving the instruction was to estimate the relations
between the three scores of schievement gain and the attendance in the project for all grades
together and for selected grades separately. As before, Grade Two had to be omitted because
of the lack of achievement scores here. The sample correlation coefficients are shown in
Table 7 below.
TABLE 7Correlation Coefficients For Relations Between Three Scores Of
Achievement Gain And Attendance For All Grades And For Selected Grades
Computation Concepts Problem Solving
ALL GRADES .03 .12 .07GRADES THREE AND
FOUR .07 .09 .06GRADES FIVE AND
SIX .27 .27 .12
GRADES SEVEN ANDEIGHT .26 .14 .36
The correlation coefficients are all too low to indicate any worthwhile relations. How-
ever, the data for these correlation coefficients is probably fairly good. Student attendance
can surely be measured very accurately. Therefore, there is, indeed, high confidence, not that
there is but that there is not any worthwhile relation between attendance and achieve-
ment. This result seems rather strange and unexpected; that is, it appears to be of little con-
sequence whether a student's attendance is good or poor he learns the same in either case.
However, it simply may be that students who were in the project attended classes regularly,
so that very minor fluctuations in attendance would have very little effect. Furthermore,.
24
25
perhaps it was the mere fact that they were in the program that made them improve in their
achievement and not the actual instruction that they received. Since the teachers who were
interviewed almost universally stated that the students considered it a privilege, and not
a stigma, to be in the project, it may be only this salutary effect of participation that
was responsible for the overall gains of the program. Although this is only a conjecture,
it is a possibility that might be given some serious thought. The reader should keep in mind,
however, that although the correlation coefficients do indeed show high confidence that them
is no worthwhile relation between attendance and achievement, no statistical analysis can ever
tell why that is so.
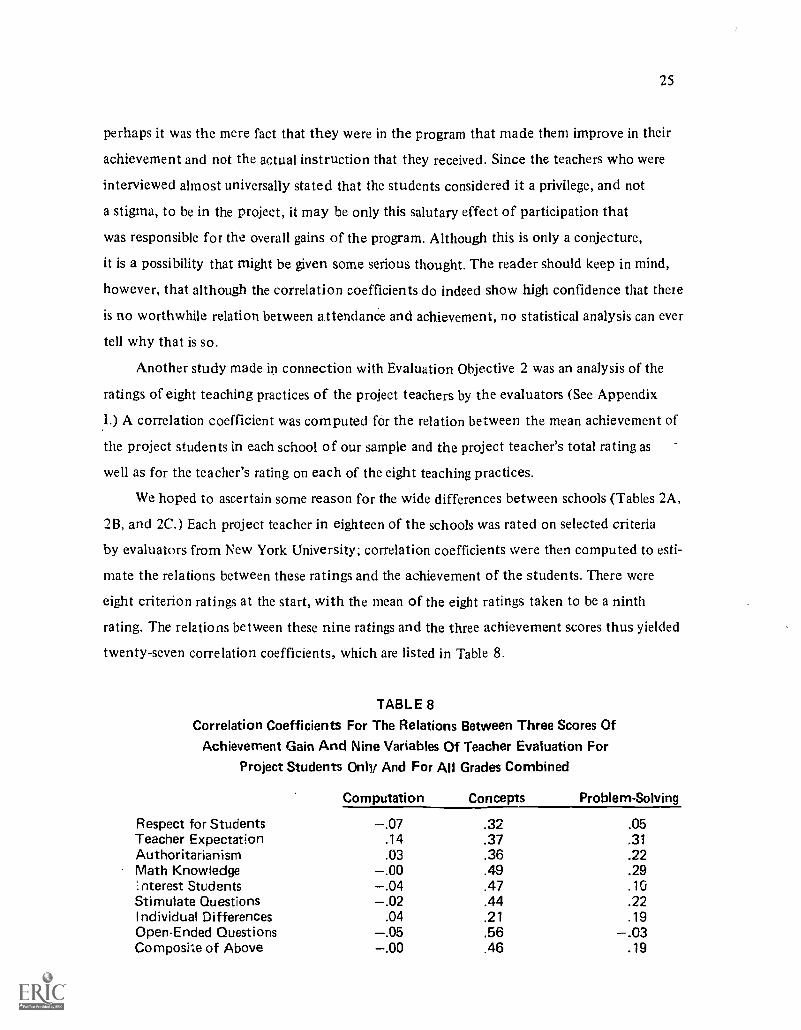
Another study made in connection with Evaluation Objective 2 was an analysis of the
ratings of eight teaching practices of the project teachers by the evaluators (See Appendix
I.) A correlation coefficient was computed for the relation between the mean achievement of
the project students in each school of our sample and the project teacher's total rating as
well as for the teacher's rating on each of the eight teaching practices.
We hoped to ascertain some reason for the wide differences between schools (Tables 2A,
2B, and 2C.) Each project teacher in eighteen of the schools was rated on selected criteria
by evaluators from New York University; correlation coefficients were then computed to esti-
mate the relations between these ratings and the achievement of the students. There were
eight criterion ratings at the start, with the mean of the eight ratings taken to be a ninth
rating. The relations between these nine ratings and the three achievement scores thus yielded
twenty-seven correlation coefficients, which are listed in Table 8.
TABLE 8
Correlation Coefficients For The Relations Between Three Scores Of
Achievement Gain And Nine Variables Of Teacher Evaluation For
Project Students Only And For All Grades Combined
Computation Concepts Problem-Solving
Respect for Students .07 .32 .05Teacher Expectation .14 .37 .31Authoritarianism .03 .36 .22Math Knowledge .00 .49 .29Interest Students .04 .47 .10Stimulate Questions .02 .44 .22Individual Differences .04 .21 .19Open-Ended Questions .05 .56 .03Composite of Above .00 .46 .19
26
Although there were different numbers of students for the three achievement scores,
there were approximately eight hundred students in all the grades together. Since the standard
error of a correlation coefficient is I /V n-3 , the standard error in this case is approxi-
mately 1/V800 = .05 and 1.65 times this standard error is about .08. Although Fisher's z'
transformation is needed to normalize the distribution of correlation coefficients, even a
casual observation of .08 less than each of the sample correlation coefficients above gives
a rough approximation of the lower limit above which there is 95% confidence that the popu-
lation correlation coefficient lies. And it can be seen thus even at a glance that the sam-
ple correlation coefficients in Table 8 are so low that they do not give even barely accept-
able evidence of any worthwhile relation between any of the ratings and any of the three
measures of achievement. In fact, taking .08 more than each of the above correlation coeffi-
cients, it can be seen that, in most cases, there is 95% confidence that there is not a worth-
while relation. Consider the highest correlation coefficient in Table 8, namely the correla-
tion coefficient of .56 between the teacher's ability to ask open-ended questions and the
student's performance on concepts. Since .56 + .08 = .64 which indicates what, in the opinion
of some readers, may be considered to be a rather worthwhile relation, it cannot be concluded
with 95% confidence that there is no worthwhile relation between the teacher rating of ability
to ask open-ended questions and the students' achievement in the understanding of concepts.
However, since .56 .08 = .48 which is not very high either, there is also not 95% confidence
that there is any very worthwhile relation whatever between that rating and understanding of
concepts.
Since it seems absurd tc conclude that there really is no worthwhile relation between
the teacher's competence and the achievement of the students, one might speculate why these
ratings failed to be even slightly related to achievement. A cursory glance at the rating
scores revealed that one of the raters had very much higher ratings than the other raters.
The teachers were rated by three members of the evaluating team. Although the raters tried
to standardize their ratings, it appears that this standardization was not accomplished. Thus
the rating was more a measure of the generosity of the rater than a measure of the ability of
the teacher. Furthermore, the particular characteristics of the teachers that the evaluators
attempted to rate might not have been very pertinent. The characteristics were chosen to he,
at face value, those teacher traits that could reasonably be expected to be related to student
achievement. Perhaps the wrong criteria were chosen.
27
One of the procedures employed in the program involved assigning of teachers in accord-
ance with school needs. Certainly, the existence of a sizable waiting list in almost all of
the schools indicates that an expansion of the program would be required in order to carry
out this procedure satisfactorily. Moreover, the fact that 49 schools, or about one-third of
the 149 schools in the program, received less than two days of service (See Chapter I, Part A)
also indicates that an expansion of the program would be required in order to carry out this
procedure successfully. We say this because we feel that each school should be serviced at
least two full days a week since the occurrence of many school holidays makes this amount of
service quite necessary in most cases. We draw attention to questions 6 and 7 on the Ques-
tionnaire to Project Teachers (Appendices IV and V) in this connection. Question 6 reads:
"How many time a week do you meet each student in your program?" The mean response was
2.3 times (66 respondents). Question 7 reads: "Do you feel that the number of times given
in Question 6 should be decreased, left the same, or increased?" Weights of 1, 2, and 3
were assigned to the preceding responses, respectively. The mean response was 2.6. (64 re-
spondents). Thus, these project teachers tended to think that the number of days of ser-
vice for each student should be increased.
Another pr Dcedure employed in the program involved providing teachers with in-service
training. We draw attention to the questions 12 through 19 in the Questionnaire to Project
Teachers since they relate to the training experiences that have been offered to the project
teachers. We also draw attention to questions 36 and 39 on the Questionnaire to Project
Teachers. Question 36 reads: "How would you rate the training experiences you have re-
ceived since entering the program in diagnosing the remediating pupils' learning difficul-
ties in mathematics? (Check one): Very Helpful, Helpful, Little Help, and No Help." Weights
of 1, 2, 3, and 4 were assigned to these responses, respectively with the mean response 2.4.
(52 respondents). Question 39 reads: "How would you rate the training you have received
in the use of appropriate instructional materials? (Check one): Very Helpful, Helpful, Little
Help, and No Help." Assigning weights as in Question 39 we found the mean response to be
2.0. (63 respondents).
Another procedure employed in the program involved providing instructional materials and
necessary equipment. We draw attention to the responses of the project teachers to Question 27
in the Questionnaire to Project Teachers. This question reads: "How useful do you find the
materials which are provided for your classroom'? (Check one): Very Useful, Somewhat Useful,
Useless, Hinders Learning." Weights of 1, 2, 3, and 4 were assigned to these responses,
28
respectively. The mean responses of the project teachers was 1.16. (64 respondents). This
signifies that in the opinion of these teachers the materials provided were rather useful.
A room deemed adequate for the needs of small group instruction was to be made avail-
able by the non-public school. In order to ascertain the degree to which this procedure was
carried out, the evaluators appealed to Question 29 in the Questionnaire to Project Teachers.
This question reads as follows: "How would you rate the room facilities provided for your
corrective class? (Check one): Satisfactory, Unsatisfactory." Weights of 1 and 2 were as-
signed to the responses "Satisfactory," and "Unsatisfactory," respectively. The mean re-
sponse was 1.2. (65 respondents). Thus, in the opinion of these teachers the room was a little
less than satisfactory.
One of the procedures employed in the program was to give instruction to groups of approxi-
mately ten pupils. In this connection we draw attention to Questions 1 and 2 on the Question-
naire to Project Teachers. Question 1 asks the teacher for the total number of pupils in the
corrective mathematics classes and Questio.1 2 asks him for the total number of corrective
classes he teaches. The total of the answers to Question 1 by the 64 project teachers was
3891 pupils. (65 respondents). The mean response to Question 2 was 7.3 classes per week. (65
respondents). From these data we find that "on the average" each corrective mathematics
class had 8.3 pupils.
B. Evaluation Objective 3 (Recommendations)
1. The pre-testing must be done in the fall despite the complaint of the non-public
school supervisors. For without both a pre-test and a post-test score obtained according to
a consistent schedule, it is difficult to measure pupil progress validly.
2. The practice in some schools of having a corrective mathematics teacher see the
same children on each of three or four days under an experimental program yielded signifi-
cantly better results than those made by the children receiving two periods of remedial in-
struction. The practice should be extended.
3. The supervisors should extend the practice of working with, and talking to, indi-
vidual children during their visits to the schools.
4. The corrective teacher should write some sort of progress report (not a grade) peri-
odically during the year about each child in the corrective program. These reports might be
sent home to parents and/or to the regular teacher.
29
5. Since the corrective math program is of a remedial nature, it seems advisable that
the corrective mathematics teachers have adequate space to handle small workshops.
6. There should be more flexibility in corrective programs so that children could
come in and out more easily during the academic year. (Subject to appropriate investigation.)
7. One-day-a-week service is practically meaningless. Not only do the children in-
volved forget almost everything from week to week, but with holidays, sickness, etc. the
service, in reality, is truly tokenism.
8. Teachers need more training conferences, where they may work at the materials on
an individual basis. It is not sufficient to have demonstration classes.
9. A workshop could be offered for the parents at each school. This way, the parents
might be able to provide some home assistance which would reinforce the program. Perhaps the
Board and an individual non-public school could share the responsibility (at least financially)
of providing such a workshop.
10. Corrective mathematics teacher should reinforce topics treated in the regular class-
room by teaching and developing closely related topics at appropriately correlated times.
11. There still is very little meaningful contact between the regular classroom teacher
and the corrective teacher. At most, they usually only eat lunch together.
12. There should be some orientation provided for "new" regular classroom teachers
so that they fully understand the purposes and procedures for the corrective mathematics pro-
gram. Efforts should be made on the part of the coordinator in cooperation with the non-public
school staff to this end.
13. Coordinators and supervisors can stimulate more interesting in the corrective math
program by giving demonstrations or by explaining the pr.)gram to the regular faculty of the
school.
14. Corrective mathematics teachers should be available to attend a regular school
faculty conference in the early fall.
30
15. Corrective teachers should be given some idea of how to handle minor emotional
problems that they might encounter. Perhaps the Title I guidance counselor in a school might
conduct a workshop to assist the corrective teachers.
16. Consideration should be given (subject to appropriate investigation) to dropping
disruptive discipline problems from the program.
17. There are schools where it becomes virtually automatic for some children to go to
the corrective mathematics class year after year. There should be some limits set on how long
a particular student, who shows no or little sign of prowess, would be permitted to continue
in the program.

31
APPENDICES

APPENDIX ITITLE I CORRECTIVE PROGRAMS IN THE NON-PUBLIC SCHOOLS
GUIDELINES FOR INTERVIEWS WITH PROJECT TEACHERCORRECTIVE MATHEMATICS PROGRAM 1971-1972
School Date
32
Teacher's Nam' Observer
1.
1.
Total Number of Pupils in Corrective Classes
Total Number of Corrective Classes taught
3. Total Number of Pupils on Waiting List
4. Lowest grade level you teach
f... Highest grade level you teach
6. Educational background of project teacher:College(s) Degree(s) Date(s) Major(s)
7. List collegiate courses in mathematics and mathematics pedagogy which you have takenwithin the last five years.
8. Which of the courses listed in question 7 do you think have been the most helpful to youin your work in the corrective mathematics program? (List no more than five).
9. Teaching experience of project teacher:Grade(s) Subject(s) taught
10. Additional comments that might bear upon this evaluation.
No. of Years
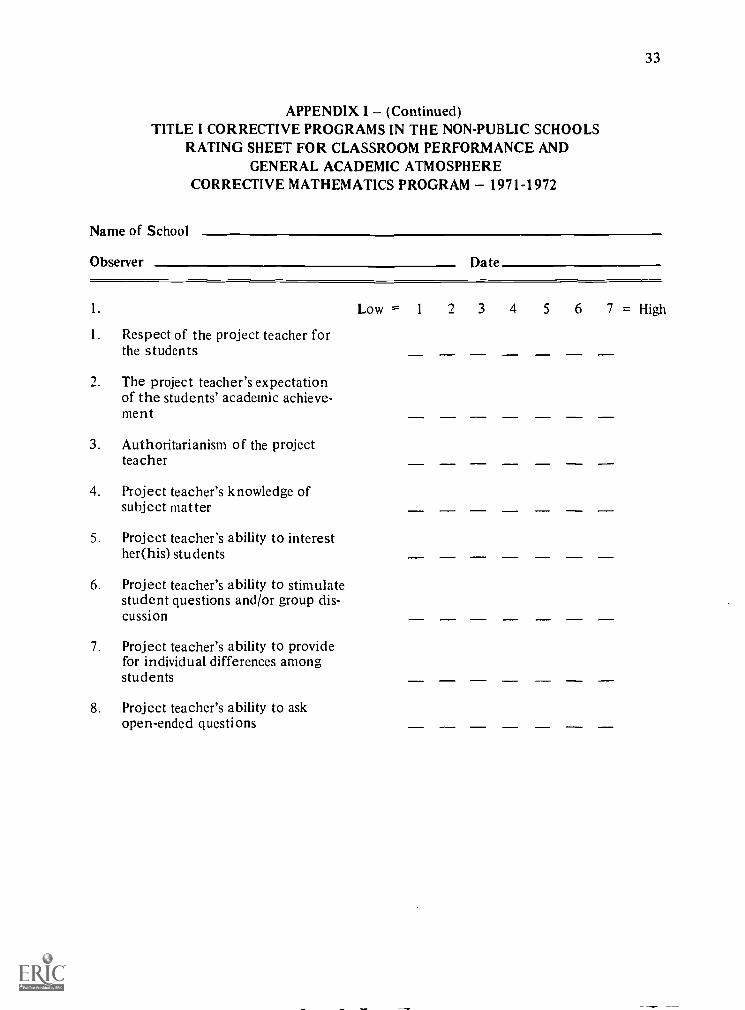
33
APPENDIX I (Continued)TITLE I CORRECTIVE PROGRAMS IN THE NON-PUBLIC SCHOOLS
RATING SHEET FOR CLASSROOM PERFORMANCE ANDGENERAL ACADEMIC ATMOSPHERE
CORRECTIVE MATHEMATICS PROGRAM 1971-1972
Name of School
Observer Date
1. Low = 1 2 3 4 5 6 7= High
1. Respect of the project teacher forthe students
2. The project teacher's expectationof the students' academic achieve-ment
3. Authoritarianism of the projectteacher
4. Project teacher's knowledge ofsubject matter
5. Project teacher's ability to interesther(his) students
6. Project teacher's ability to stimulatestudent questions and/or group dis-cussion
7. Project teacher's ability to providefor individual differences amongstudents
8. Project teacher's ability to askopen-ended questions
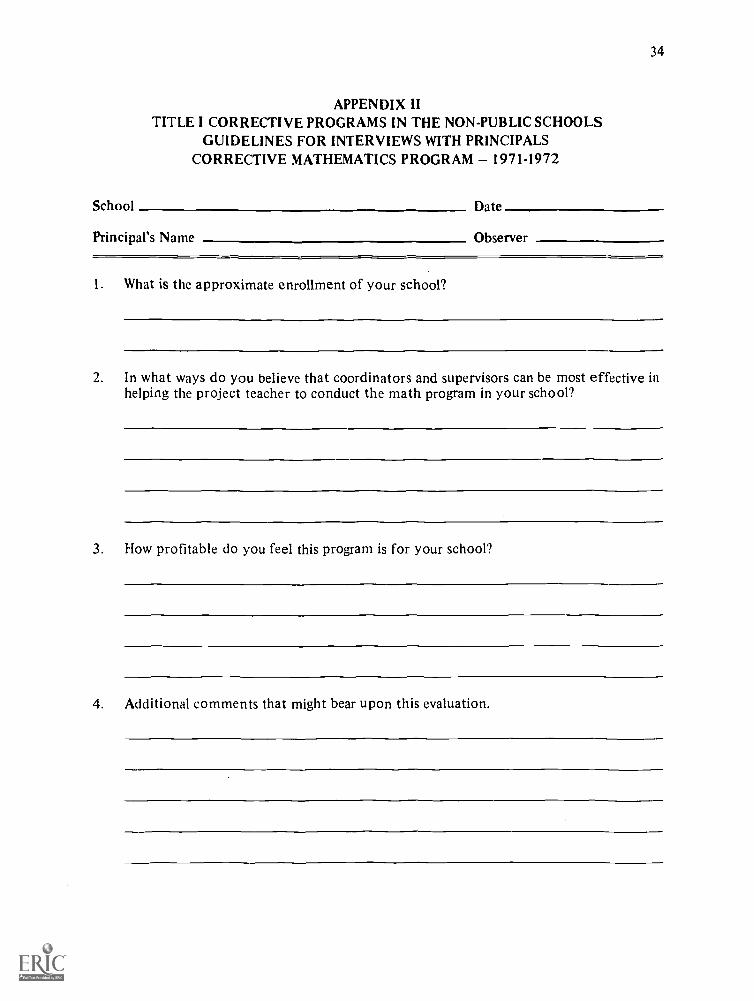
34
APPENDIX IITITLE I CORRECTIVE PROGRAMS IN THE NON-PUBLIC SCHOOLS
GUIDELINES FOR INTERVIEWS WITH PRINCIPALSCORRECTIVE MATHEMATICS PROGRAM 1971-1972
School Date
Principal's Name Observer
1. What is the approximate enrollment of your school?
2. In what ways do you believe that coordinators and supervisors can be most effective inhelping the project teacher to conduct the math program in your school?
3. How profitable do you feel this program is for your school?
4. Additional comments that might bear upon this evaluation.
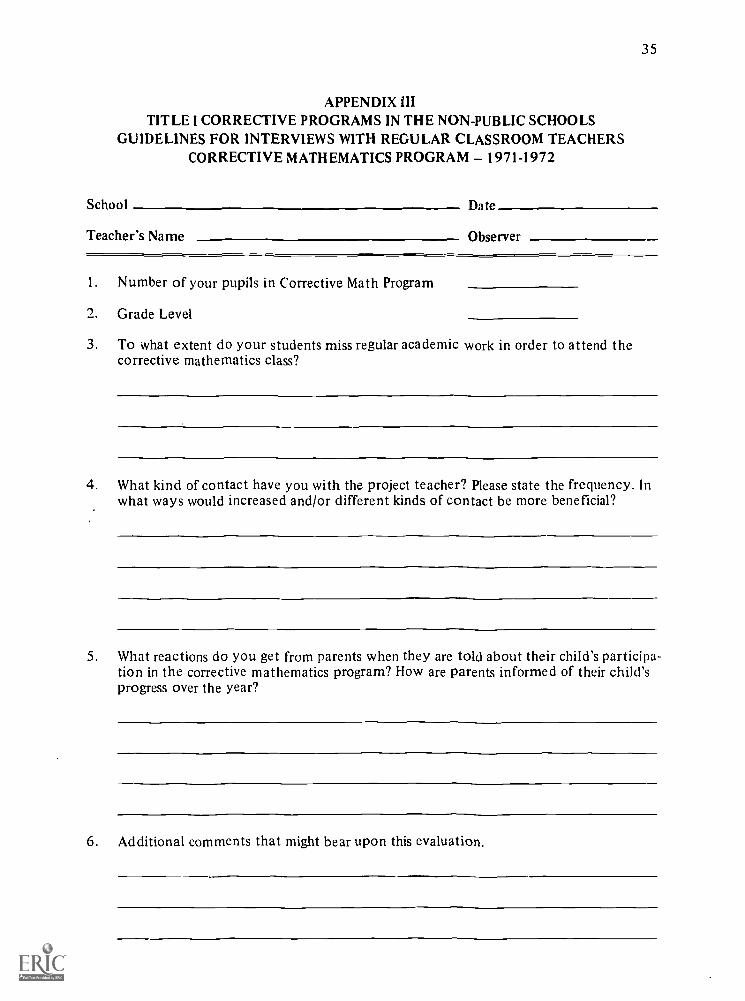
35
APPENDIX IIITITLE I CORRECTIVE PROGRAMS IN THE NON-PUBLIC SCHOOLS
GUIDELINES FOR INTERVIEWS WITH REGULAR CLASSROOM TEACHERSCORRECTIVE MATHEMATICS PROGRAM 1971-1972
School Date
Teacher's Name Observer
1. Number of your pupils in Corrective Math Program
Grade Level
3. To what extent do your students miss regular academic work in order to attend thecorrective mathematics class?
4. What kind of contact have you with the project teacher? Please state the frequency. Inwhat ways would increased and/or different kinds of contact be more beneficial?
5. What reactions do you get from parents when they are told about their child's participa-tion in the corrective mathematics program? How are parents informed of their child'sprogress over the year?
6. Additional comments that might bear upon this evaluation.

APPENDIX IVTITLE I CORRECTIVE PROGRAM IN THE NON-PUBLIC SCHOOLS
QUESTIONNAIRE TO PROJECT TEACHERCORRECTIVE MATHEMATICS PROGRAM 1971-1972
PLEASE RESPOND ANONYMOUSLY
1. Total number of pupils in your corrective math classes
2. Total number of corrective classes taught
3. Total number of pupils on waiting list
4. Lowest grade level you teach
5. Highest grade level you teach
6. How many times a week do you meet each student in your program?
7. Do you feel that the number of times given in question 6 should be:
Decreased Left the same Increased
8. For how many years, including the present as one full year, have youtaught in the corrective math program?
9. Give the total number of years you have taught in elementary orjunior high school. Include the present year as one full year.
10. Check the degrees you hold:
Baccalaureate Masters Doctorate
11. Please list any courses you are currently taking:
36
How would you rate the training experiences you have received since entering the program?(Refer to questions 12-17).
12. Pre-trainingorientationmeetings
13. Weekly in-servicesessions withsupervisors
Number Very Little orAttended Helpful Helpful No Help Harmful
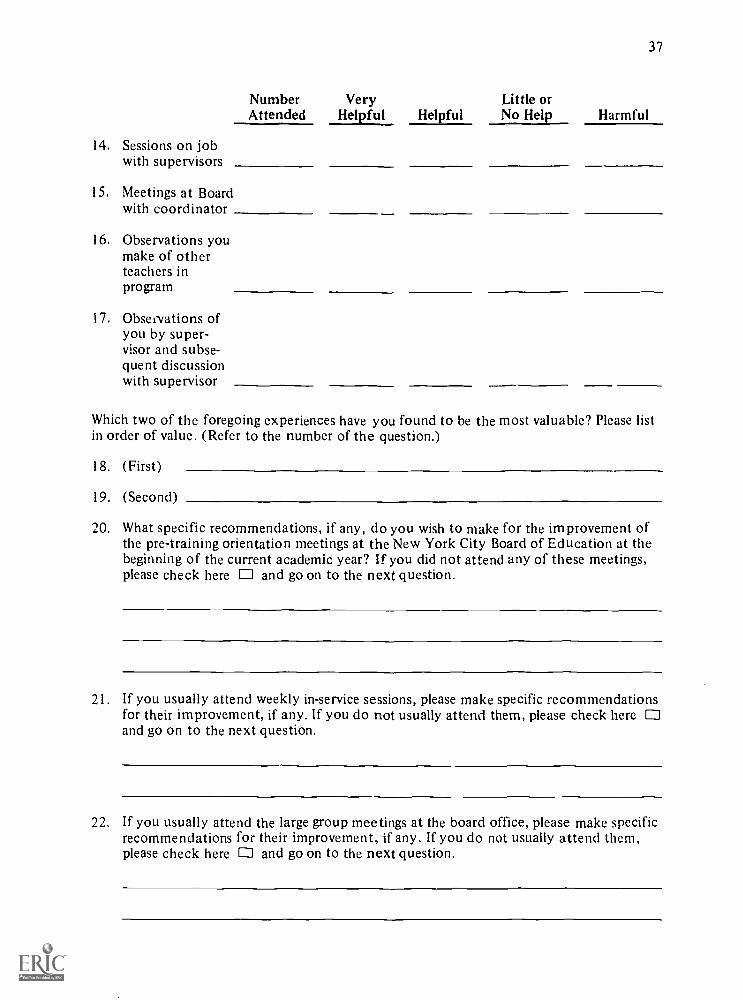
Number Very Little orAttended Helpful Helpful No Help Harmful
14. Sessions on jobwith supervisors
15. Meetings at Boardwith coordinator
16. Observations youmake of otherteachers inprogram
17. Observations ofyou by super-visor and subse-quent discussionwith supervisor
37
Which two of the foregoing experiences have you found to be the most valuable? Please listin order of value. (Refer to the number of the question.)
18. (First)
19. (Second)
20. What specific recommendations, if any, do you wish to make for the improvement ofthe pre-training orientation meetings at the New York City Board of Education at thebeginning of the current academic year? If you did not attend any of these meetings,please check here El and go on to the next question.
21. If you usually attend weekly in-service sessions, please make specific recommendationsfor their improvement, if any. If you do not usually attend them, please check here Eland go on to the next question.
22. If you usually attend the large group meetings at the board office, please make specificrecommendations for their improvement, if any. If you do not usually attend them,please check here 0 and go on to the next question.
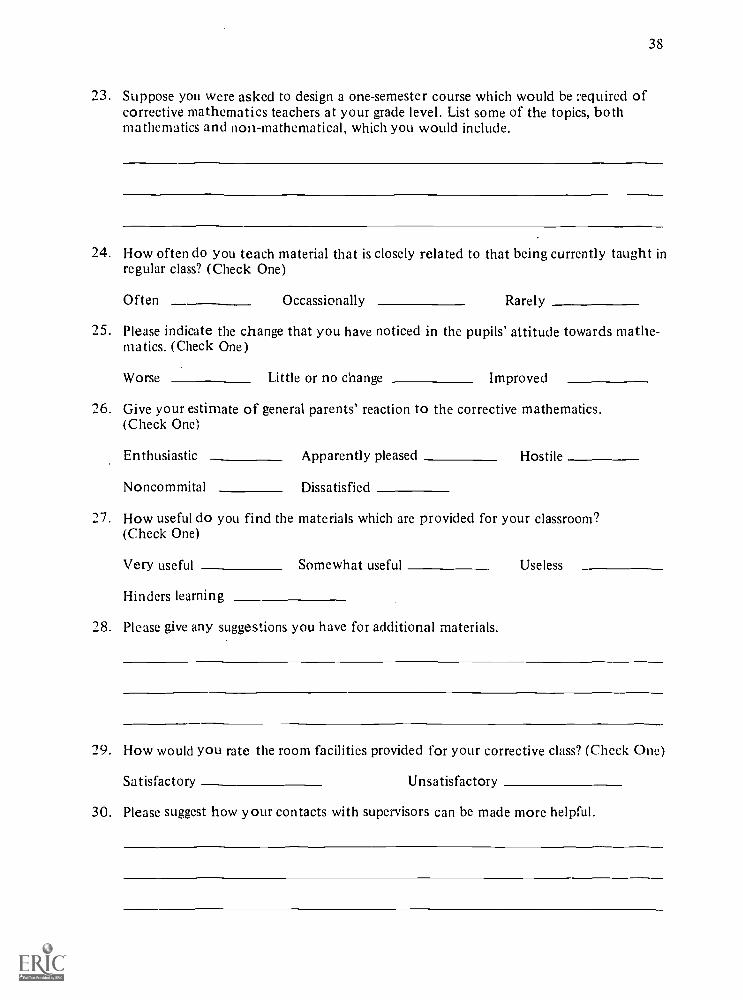
38
23. Suppose you were asked to design a one-semester course which would be required ofcorrective mathematics teachers at your grade level. List some of the topics, bothmathematics and non mathematical, which you would include.
24. How often do you teach material that is closely related to that being currently taught inregular class? (Check One)
Often Occassionally Rarely
25. Please indicate the change that you have noticed in the pupils' attitude towards mathe-matics. (Check One)
Worse Little or no change Improved
26. Give your estimate of general parents' reaction to the corrective mathematics.(Check One)
Enthusiastic Apparently pleased Hostile
Noncommital Dissatisfied
27. How useful do you find the materials which are provided for your classroom?(Check One)
Very useful Somewhat useful Useless
Hinders learning
28. Please give any suggestions you have for additional materials.
29. How would you rate the room facilities provided for your corrective class? (Check One)
Satisfactory Unsatisfactory
30. Please suggest how your contacts with supervisors can be made more helpful.
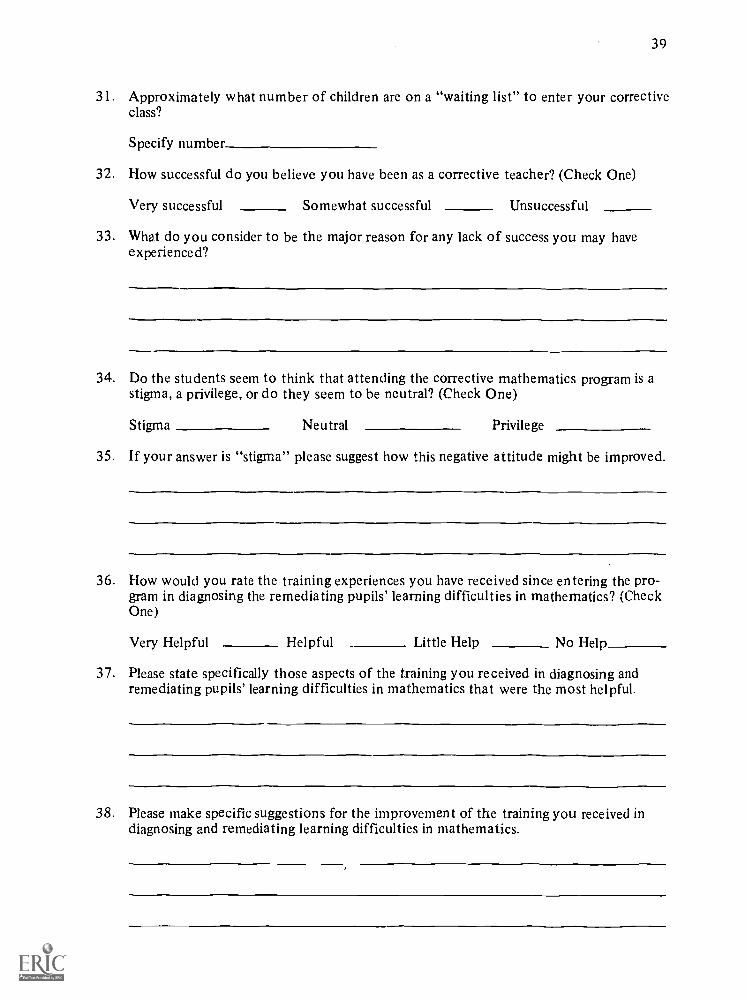
39
31. Approximately what number of children are on a "waiting list" to enter your correctiveclass?
Specify number
32. How successful do you believe you have been as a corrective teacher? (Check One)
Very successful Somewhat successful Unsuccessful
33. What do you consider to be the major reason for any lack of success you may haveexperienced?
34. Do the students seem to think that attending the corrective mathematics program is astigma, a privilege, or do they seem to be neutral? (Check One)
Stigma Neutral Privilege
35. If your answer is "stigma" please suggest how this negative attitude might be improved.
36. How would you rate the training experiences you have received since entering the pro-gram in diagnosing the remediating pupils' learning difficulties in mathematics? (CheckOne)
Very Helpful Helpful Little Help No Help
37. Please state specifically those aspects of the training you received in diagnosing andremediating pupils' learning difficulties in mathematics that were the most helpful.
38. Please make specific suggestions for the improvement of the training you received indiagnosing and remediating learning difficulties in mathematics.
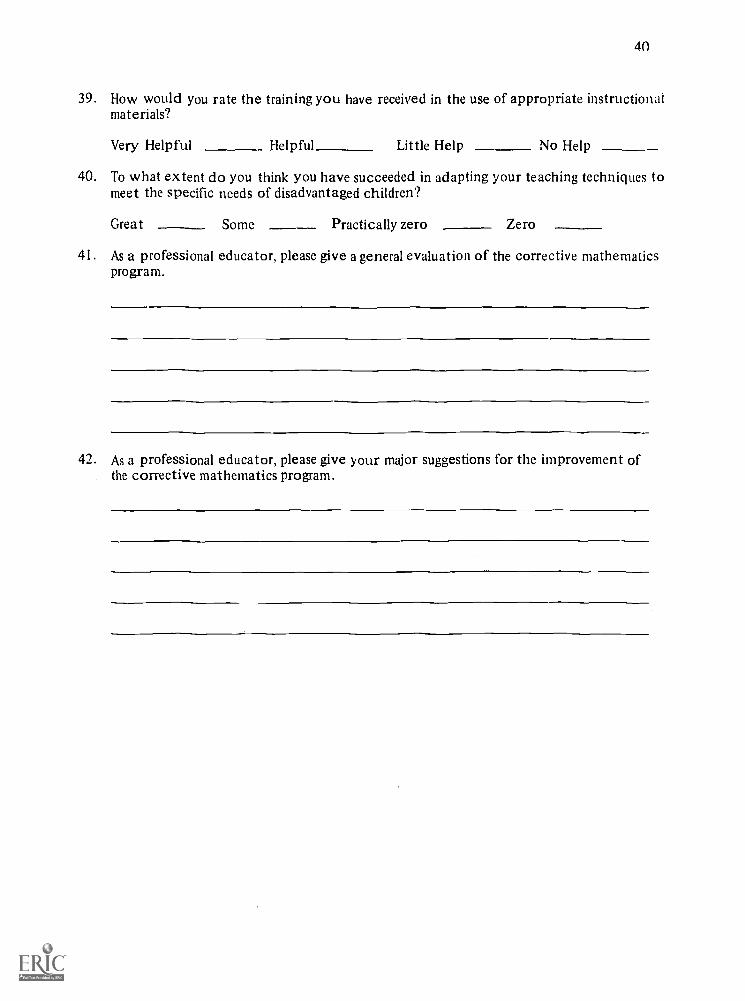
40
39. How would you rate the training you have received in the use of appropriate instructionalmaterials?
Very Helpful Helpful Little Help No Help
40. To what extent do you think you have succeeded in adapting your teaching techniques tomeet the specific needs of disadvantaged children?
Great Some Practically zero Zero
41. As a professional educator, please give a general evaluation of the corrective mathematicsprogram.
42. As a professional educator, please give your major suggestions for the improvement ofthe corrective mathematics program.
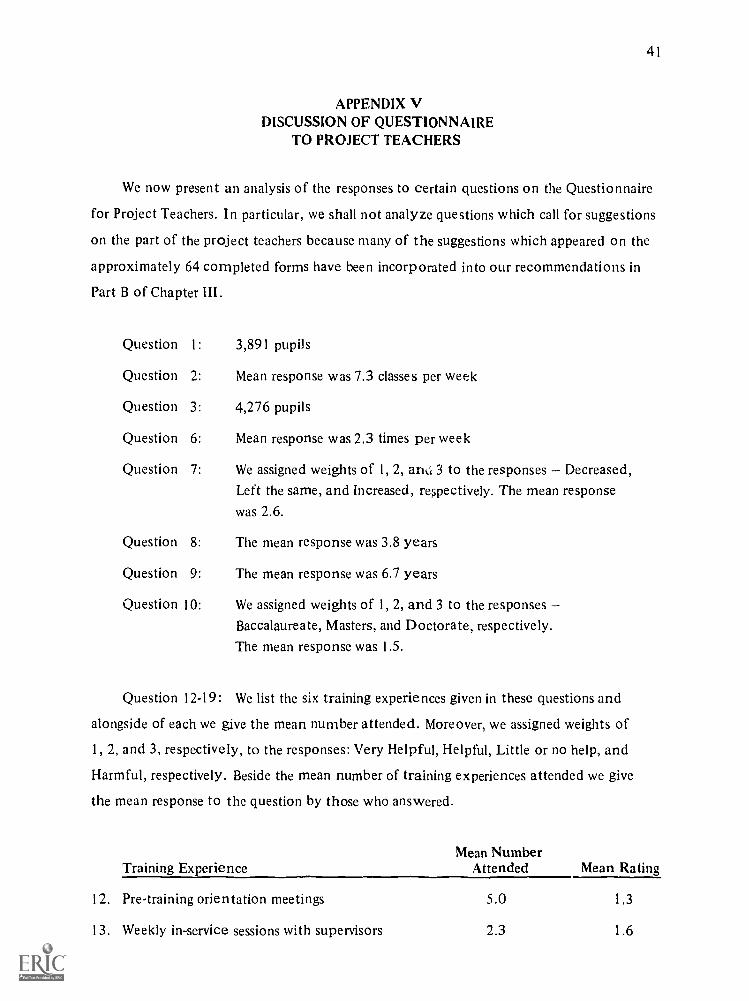
41
APPENDIX VDISCUSSION OF QUESTIONNAIRE
TO PROJECT TEACHERS
We now present an analysis of the responses to certain questions on the Questionnaire
for Project Teachers. In particular, we shall not analyze questions which call for suggestions
on the part of the project teachers because many of the suggestions which appeared on the
approximately 64 completed forms have been incorporated into our recommendations in
Part B of Chapter III.
Question 1 : 3,891 pupils
Question 2: Mean response was 7.3 classes per week
Question 3: 4,276 pupils
Question 6: Mean response was 2.3 times per week
Question 7: We assigned weights of 1, 2, arhi 3 to the responses Decreased,
Left the same, and Increased, reppectively. The mean response
was 2.6.
Question 8: The mean response was 3.8 years
Question 9: The mean response was 6.7 years
Question 10: We assigned weights of 1, 2, and 3 to the responses
Baccalaureate, Masters, and Doctorate, respectively.The mean response was 1.5.
Question 12-19: We list the six training experiences given in these questions and
alongside of each we give the mean number attended. Moreover, we assigned weights of
1, 2, and 3, respectively, to the responses: Very Helpful, Helpful, Little or no help, and
Harmful, respectively. Beside the mean number of training experiences attended we give
the mean response to the question by those who answered.
Mean NumberTraining Experience Attended Mean Rating
12. Pre-training orientation meetings 5.0 1.3
13. Weekly in-service sessions with supervisors 2.3 1.6
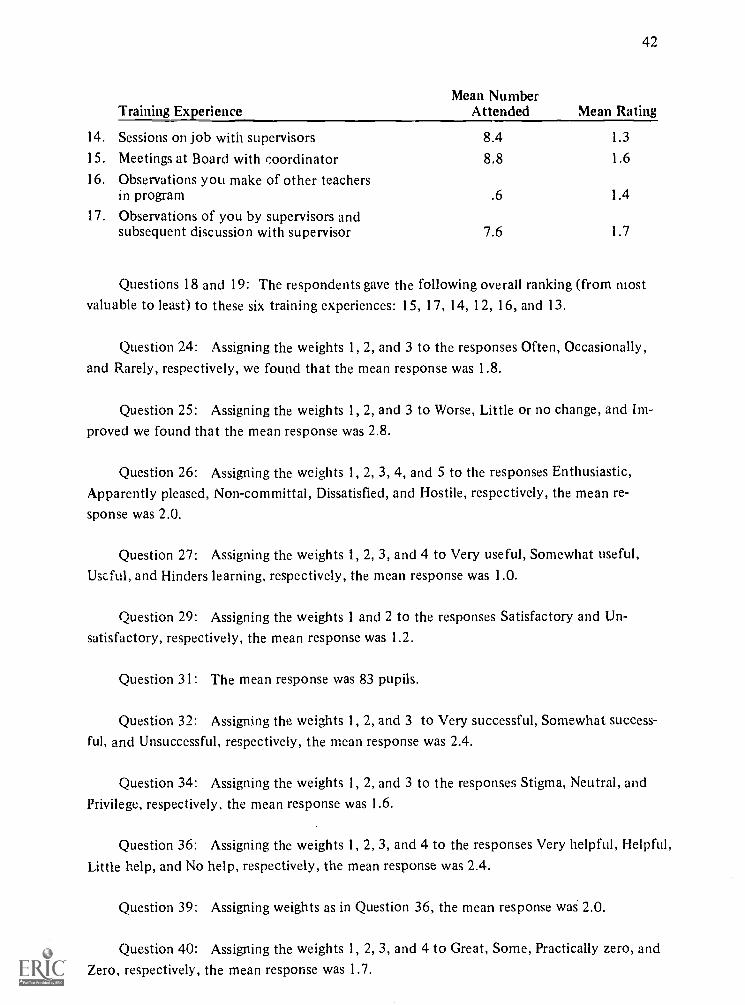
42
Mean NumberTraining Experience Attended Mean Rating
14. Sessions on job with supervisors 8.4 1.3
15. Meetings at Board with coordinator 8.8 1.6
16. Observations you make of other teachersin program .6 1.4
17. Observations of you by supervisors andsubsequent discussion with supervisor 7.6 1.7
Questions 18 and 19: The respondents gave the following overall ranking (from mostvaluable to least) to these six training experiences: 15, 17, 14, 12, 16, and 13.
Question 24: Assigning the weights 1, 2, and 3 to the responses Often, Occasionally,and Rarely, respectively, we found that the mean response was 1.8.
Question 25: Assigning the weights 1, 2, and 3 to Worse, Little or no change, and Im-proved we found that the mean response was 2.8.
Question 26: Assigning the weights 1, 2, 3, 4, and 5 to the responses Enthusiastic,Apparently pleased, Non-committal, Dissatisfied, and Hostile, respectively, the mean re-sponse was 2.0.
Question 27: Assigning the weights 1, 2, 3, and 4 to Very useful, Somewhat useful,Uscful, and Hinders learning, respectively, the mean response was 1.0.
Question 29: Assigning the weights 1 and 2 to the responses Satisfactory and Un-satisfactory, respectively, the mean response was 1.2.
Question 31: The mean response was 83 pupils.
Question 32: Assigning the weights 1, 2, and 3 to Very successful, Somewhat success-ful, and Unsuccessful, respectively, the mean response was 2.4.
Question 34: Assigning the weights 1, 2, and 3 to the responses Stigma, Neutral, and
Privilege, respectively, the mean response was 1.6.
Question 36: Assigning the weights 1, 2, 3, and 4 to the responses Very helpful, Helpful,Little help, and No help, respectively, the mean response was 2.4.
Question 39: Assigning weights as in Question 36, the mean response was 2.0.
Question 40: Assigning the weights 1, 2, 3, and 4 to Great, Some, Practically zero, andZero, respectively, the mean response was 1.7.

43
APPENDIX VITITLE I CORRECTIVE PROGRAMS IN THE NON-PUBLIC SCHOOLS
QUESTIONNAIRE TO PRINCIPALCORRECTIVE MATHEMATICS PROGRAM 1971-1972
PLEASE RESPOND ANONYMOUSLY
1. What percent of those students who qualify for admission to the corrective mathematicsprogram are accommodated?
Give your estimate of regular staff members' reactions to the corrective mathematicsprogram. (Please Check One)
Enthusiastic Apparently pleased
Noncommital Dissatisfied
3. Please add any suggestions you may have for improving staff reaction:
4. As a professional educator, please give a general evaluation of the corrective mathematicsprogram.
5. As a professional educator, please give your major suggestions for the improvement ofthe corrective mathematics program.
44
APPENDIX VIIDISCUSSION OF QUESTIONNAIRE
TO PRINCIPALS
We now present an analysis of the responses to certain questions on the Questionnaire
for Principals. We shall not analyze questions which call for suggestions on the part of the
principals because many of the suggestions which appeared on the approximately 84 com-
pleted forms have been incorporated into our recommendations in Part B of Chapter III.
Question 1: The mean response was 38.3%.
Question 2: Assigning the weights 1, 2, 3, and 4 to Enthusiastic, Apparently pleased,
Non-committal, and Dissatisfied, respectively, the mean response was 2.2.
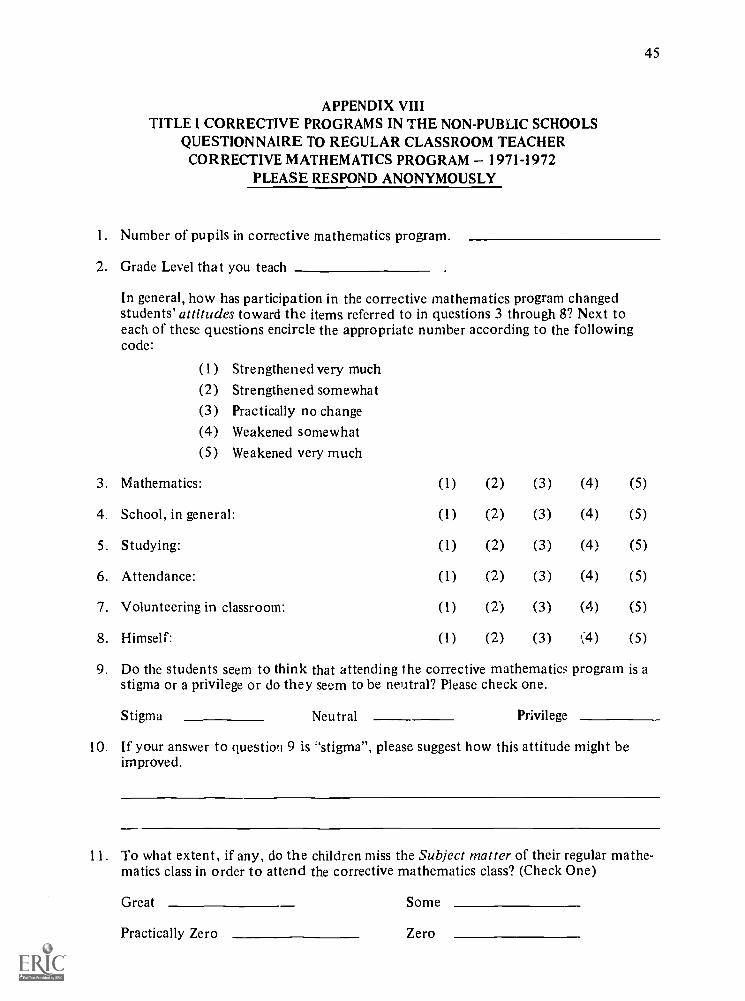
APPENDIX VIIITITLE I CORRECTIVE PROGRAMS IN THE NON-PUBLIC SCHOOLS
QUESTIONNAIRE TO REGULAR CLASSROOM TEACHERCORRECTIVE MATHEMATICS PROGRAM 1971-1972
PLEASE RESPOND ANONYMOUSLY
1. Number of pupils in corrective mathematics program.
2. Grade Level that you teach
45
In general, how has participation in the corrective mathematics program changedstudents' attitudes toward the items referred to in questions 3 through 8? Next toeach of these questions encircle the appropriate number according to the followingcode:
(1) Strengthened very much(2) Strengthened somewhat(3) Practically no change(4) Weakened somewhat
(5) Weakened very much
3. Mathematics:
4. School, in general:
5. Studying:
6. Attendance:
7. Volunteering in classroom:
8. Himself:
(1) (2) (3) (4) (5)
(1) (2) (3) (4) (5)
(1) (2) (3) (4) (5)
(1) (2) (3) (4) (5)
(1) (2) (3) (4) (5)
(1) (2) (3) (4) (5)
9. Do the students seem to think that attending the corrective mathematics program is astigma or a privilege or do they seem to be neutral? Please check one.
Stigma Neutral Privilege
10. If your answer to question 9 is "stigma", please suggest how this attitude might beimproved.
11. To what extent, if any, do the children miss the Subject matter of their regular mathe-matics class in order to attend the corrective mathematics class? (Check One)
Great Some
Practically Zero Zero
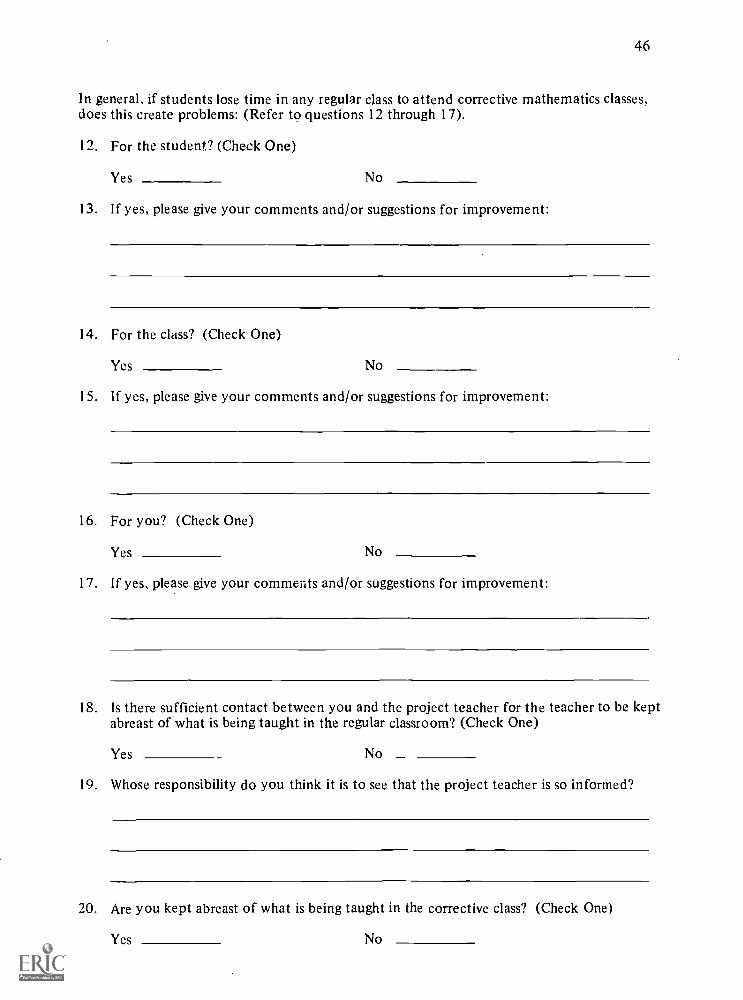
46
In general, if students lose time in any regular class to attend corrective mathematics classes,does this create problems: (Refer to questions 12 through 17).
12. For the student? (Check One)
Yes No
13. If yes, please give your comments and/or suggestions for improvement:
14. For the class? (Check One)
Yes No
15. If yes, please give your comments and/or suggestions for improvement:
16. For you? (Check One)
Yes No
17. If yes, please give your comments and/or suggestions for improvement:
18. Is there sufficient contact between you and the project teacher for the teacher to be keptabreast of what is being taught in the regular classroom? (Check One)
Yes No
19. Whose responsibility do you think it is to see that the project teacher is so informed?
20. Are you kept abreast of what is being taught in the corrective class? (Check One)
Yes No
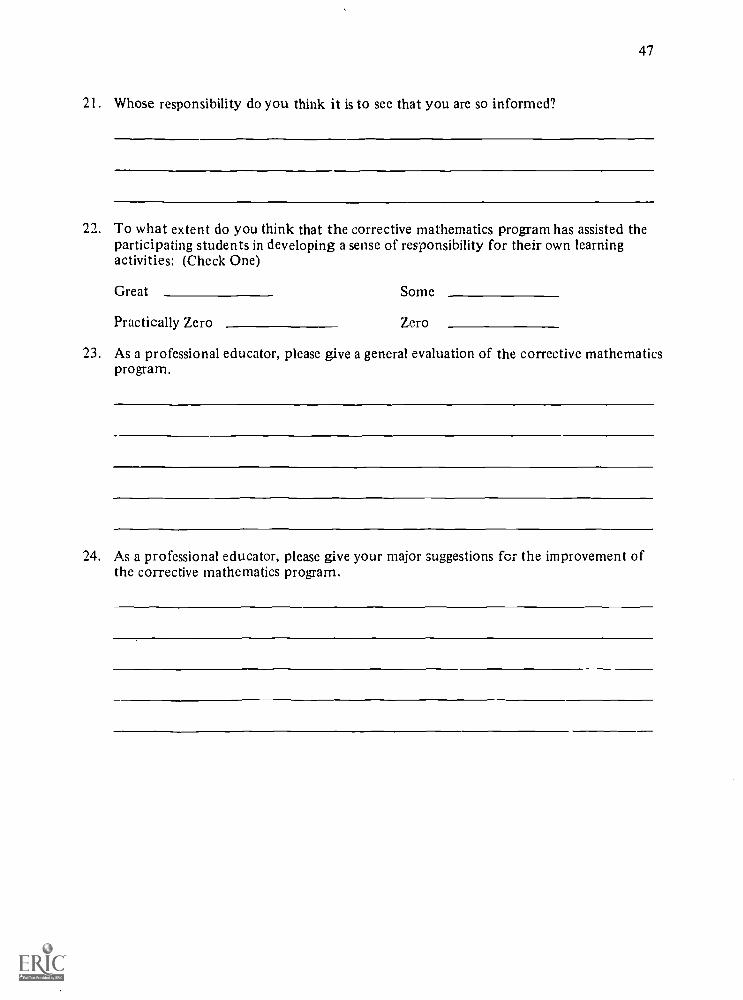
47
21. Whose responsibility do you think it is to see that you are so informed?
22. To what extent do you think that the corrective mathematics program has assisted theparticipating students in developing a sense of responsibility for their own learningactivities: (Check One)
Great Some
Practically Zero Zero
23. As a professional educator, please give a general evaluation of the corrective mathematicsprogram.
24. As a professional educator, please give your major suggestions for the improvement ofthe corrective mathematics program.
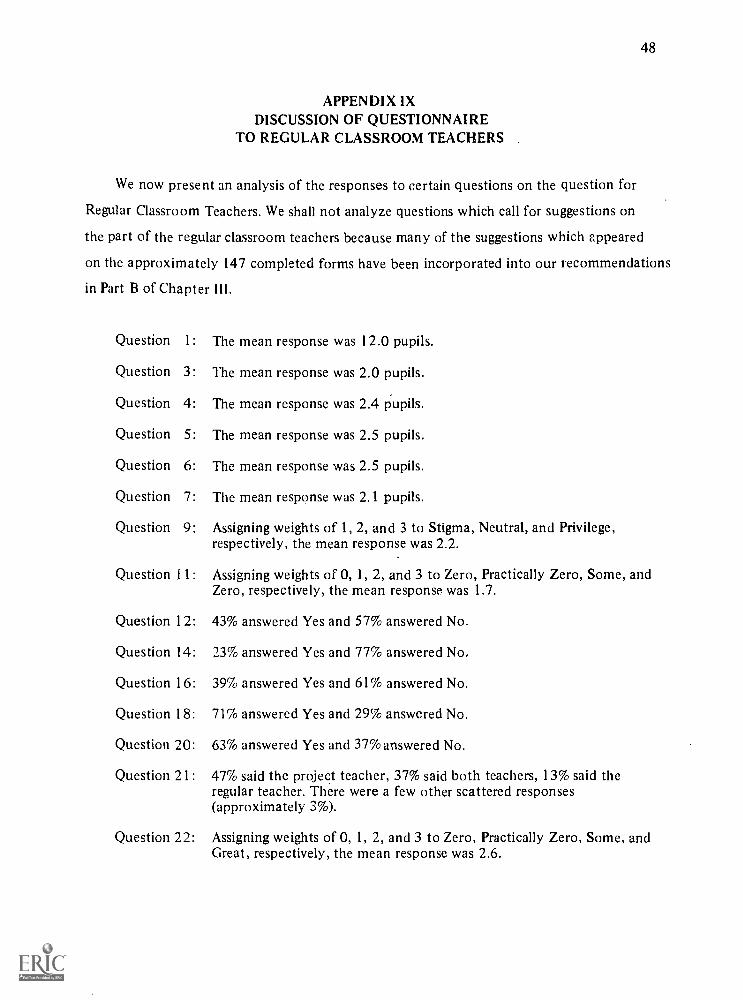
48
APPENDIX IXDISCUSSION OF QUESTIONNAIRE
TO REGULAR CLASSROOM TEACHERS
We now present an analysis of the responses to certain questions on the question for
Regular Classroom Teachers. We shall not analyze questions which call for suggestions on
the part of the regular classroom teachers because many of the suggestions which appeared
on the approximately 147 completed forms have been incorporated into our recommendations
in Part B of Chapter III.
Question 1: The mean response was 12.0 pupils.
Question 3: The mean response was 2.0 pupils.
Question 4: The mean response was 2.4 pupils.
Question 5: The mean response was 2.5 pupils.
Question 6: The mean response was 2.5 pupils.
Question 7: The mean response was 2.1 pupils.
Question 9: Assigning weights of 1, 2, and 3 to Stigma, Neutral, and Privilege,respectively, the mean response was 2.2.
Question 11: Assigning weights of 0, 1, 2, and 3 to Zero, Practically Zero, Some, andZero, respectively, the mean response was 1.7.
Question 1 2: 43% answered Yes and 57% answered No.
Question 14: 23% answered Yes and 77% answered No.
Question 16: 39% answered Yes and 61% answered No.
Question 18: 71% answered Yes and 29% answered No.
Question 20: 63% answered Yes and 37%answered No.
Question 21: 47% said the project teacher, 37% said both teachers, 13% said theregular teacher. There were a few other scattered responses(approximately 3%).
Question 22: Assigning weights of 0, 1, 2, and 3 to Zero, Practically Zero, Some, andGreat, respectively, the mean response was 2.6.
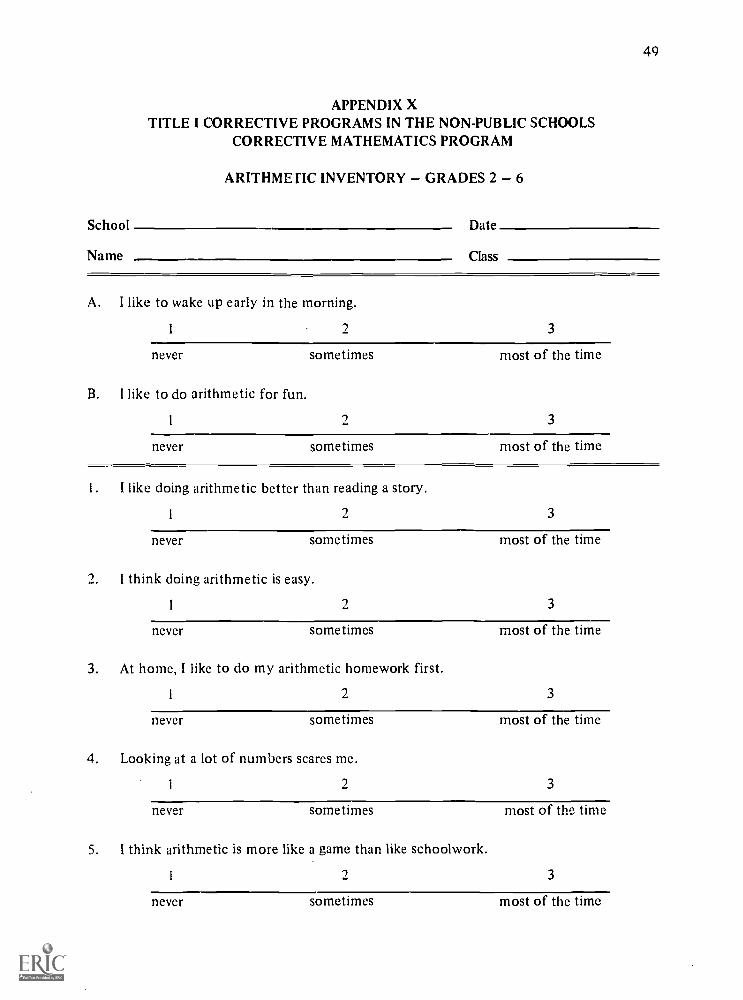
APPENDIX XTITLE I CORRECTIVE PROGRAMS IN THE NON-PUBLIC SCHOOLS
CORRECTIVE MATHEMATICS PROGRAM
ARITHMETIC INVENTORY GRADES 2 6
School
Name
Date
Class
A.
B.
I like to wake up early in the morning.
3
never sometimes
I like to do arithmetic for fun.
1 2
most of the time
3
never sometimes most of the time
1.
2.
3.
4.
5.
I like doing arithmetic better than reading a story.
1 2 3
never sometimes
1 think doing arithmetic is easy.
1 2
most of the time
3
never sometimes
At home, I like to do my arithmetic homework first.
1 2
most of the time
3
never sometimes
Looking at a lot of numbers scares me.
I
most of the time
3
never sometimes
I think arithmetic is more like a game than like schoolwork.
most of the time
1 2 3
never sometimes most of the time
49
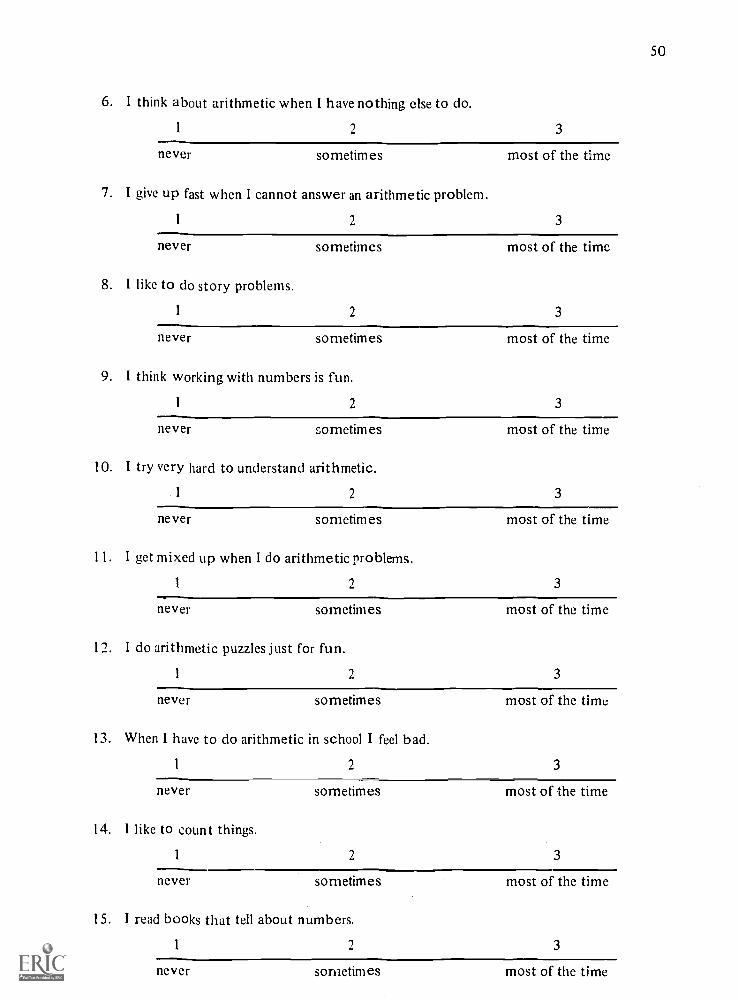
50
6. I think about arithmetic when I have nothing else to do.
1 2 3
never sometimes most of the time
7. I give up fast when I cannot answer an arithmetic problem.
1 2 3
never
8. I like to do story problems.
1
sometimes most of the time
2 3
never sometimes most of the time
9. I think working with numbers is fun.
1 2 3
never sometimes most of the time
10. I try very hard to understand arithmetic.
1 2 3
never sometimes most of the time
11. I get mixed up when I do arithmetic problems.
1 2 3
never sometimes most of the time
12. I do arithmetic puzzles just for fun.
1 2 3
never sometimes most of the time
13. When I have to do arithmetic in school I feel bad.
1 2 3
never sometimes most of the time
14. I like to count things.
1 2 3
never sometimes most of the time
15. I read books that tell about numbers.
1 2 3
never sometimes most of the time
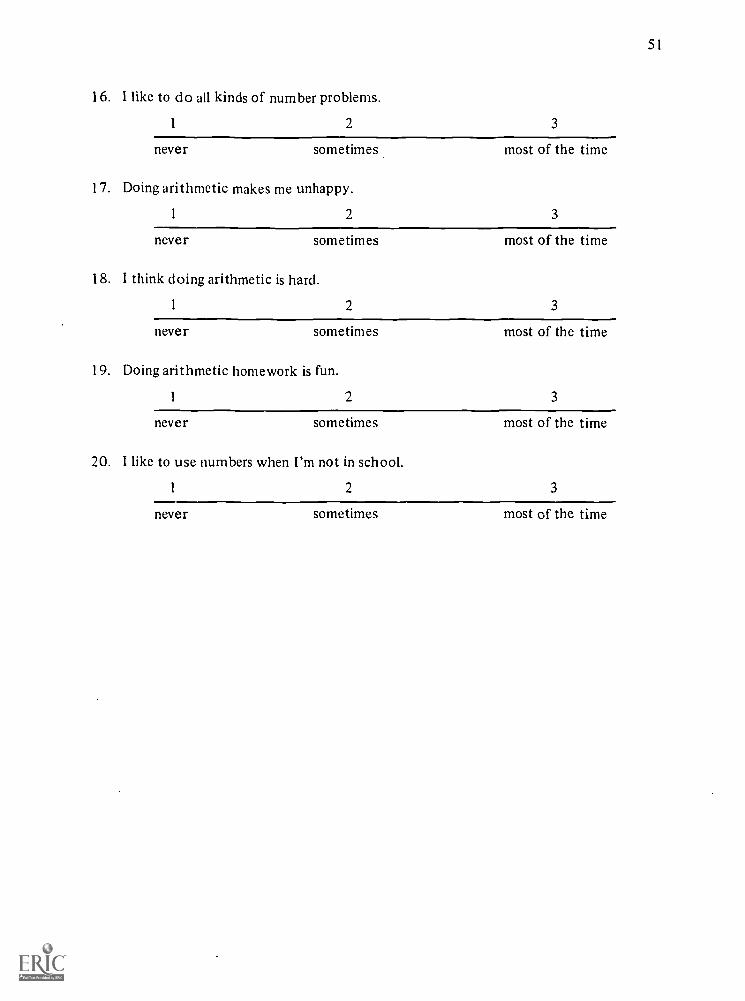
51
16.
17.
18.
19.
20.
I like to do all kinds of number problems.
1 2 3
never sometimes
Doing arithmetic makes me unhappy.
1 2
most of the time
3
never sometimes
I think doing arithmetic is hard.
1 2
most of the time
3
never sometimes
Doing arithmetic homework is fun.
1 2
most of the time
3
never sometimes
I like to use numbers when I'm not in school.
most of the time
1 2 3
never sometimes most of the time
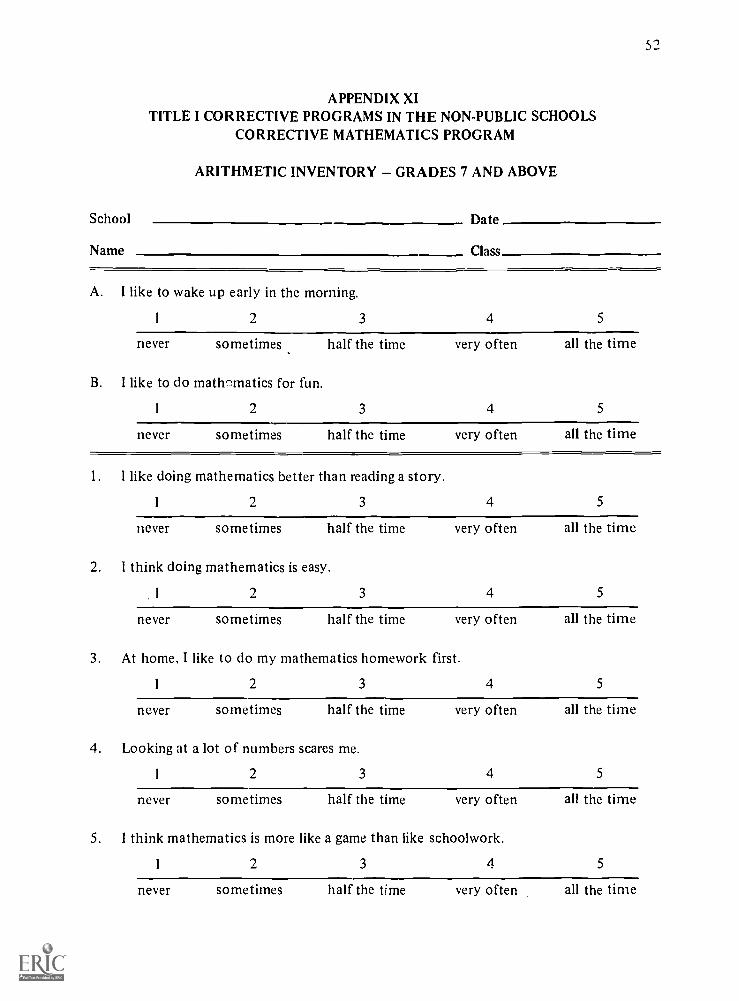
52
APPENDIX XITITLE I CORRECTIVE PROGRAMS IN THE NON-PUBLIC SCHOOLS
CORRECTIVE MATHEMATICS PROGRAM
ARITHMETIC INVENTORY GRADES 7 AND ABOVE
School Date
Name Class
A. I like to wake up early in the morning.
2 3 4 5
never sometimes half the time very often all the time
B. I like to do math-Imatics for fun.
1 2 3 4 5
never sometimes half the time very often all the time
1. I like doing mathematics better than reading a story.
2 3 4 5
never sometimes half the time very often all the time
2. I think doing mathematics is easy.
1 2 3 4 5
never sometimes half the time very often all the time
3. At home, I like to do my mathematics homework first.
2 3 4 5
never sometimes half the time very often all the time
4. Looking at a lot of numbers scares me.
1 2 3 4 5
never sometimes half the time very often all the time
5. I think mathematics is more like a game than like schoolwork.
I 2 3 4 5
never sometimes half the time very often all the time
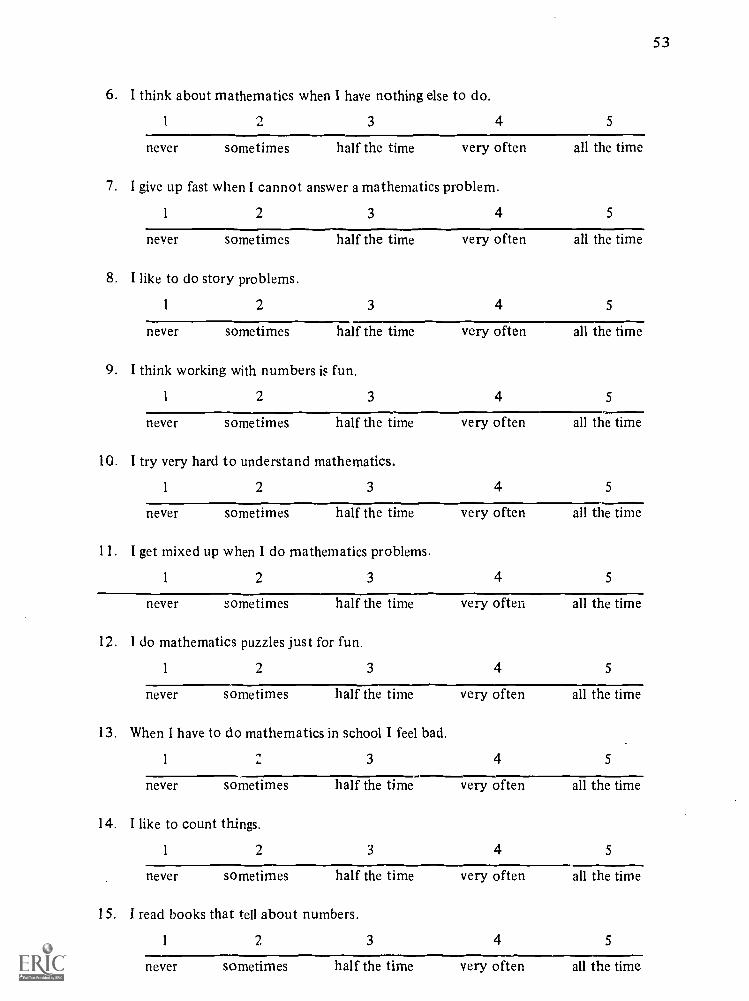
6. 1 think about mathematics when I have nothing else to do.
3 4 5
never sometimes half the time very often all the time
7. I give up fast when I cannot answer a mathematics problem.
1 2 3 4 5
never sometimes half the time very often all the time
8. I like to do story problems.
1 2 3 4 5
never sometimes half the time very often all the time
9. I think working with numbers is fun.
1 2 3 4 5
never sometimes half the time
10. I try very hard to understand mathematics.
1 2 3
very often all the time
4 5
never sometimes half the time very often all the time
11. I get mixed up when I do mathematics problems.
1 2 3 4 5
never sometimes half the time very often all the time
12. I do mathematics puzzles just for fun.
1 2 3 4 5
never sometimes half the time very often all the time
13. When I have to do mathematics in school I feel bad.
1 3 4 5
never sometimes half the time very often all the time
14. I like to count things.
1 2 3 4 5
never sometimes half the time very often all the time
15. I read books that tell about numbers.
1 2 3 4 5
never sometimes half the time very often all the time
53
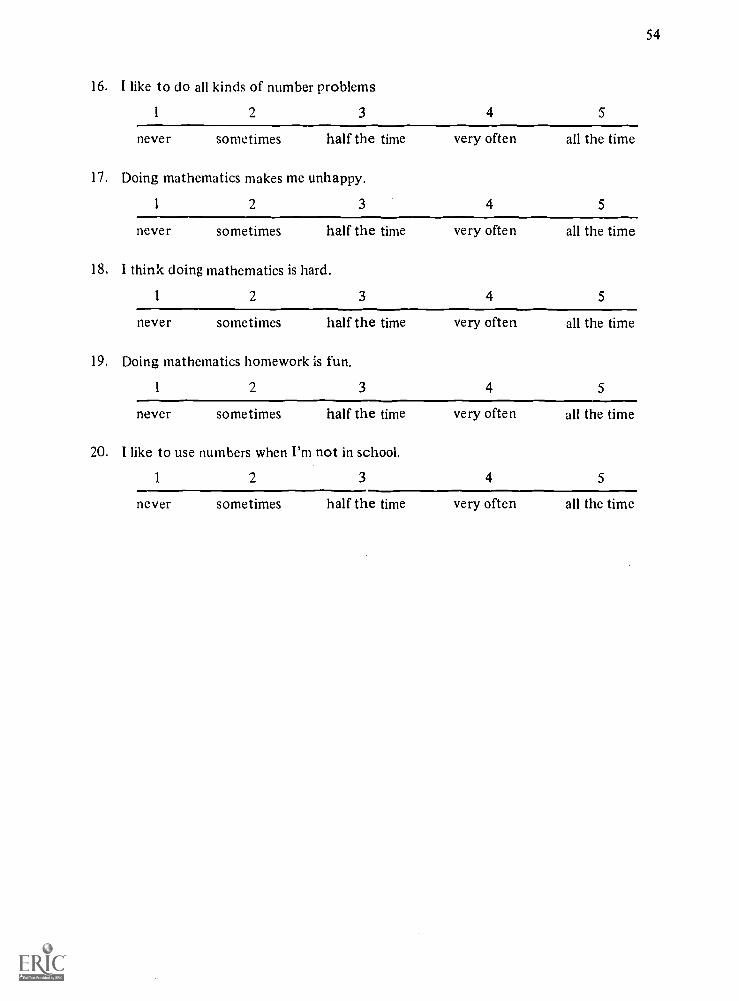
54
16. I like to do all kinds of number problems
1 2 3 4 5
never sometimes half the time very often all the time
17. Doing mathematics makes me unhappy.
1 2 3 4 5
never sometimes half the time very often all the time
18. I think doing mathematics is hard.
1 2 3 4 5
never sometimes half the time very often all the time
19. Doing mathematics homework is fun.
1 2 3 4 5
never sometimes half the time very often all the time
20. I like to use numbers when I'm not in school.
1 2 3 4 5
never sometimes half the time very often all the time
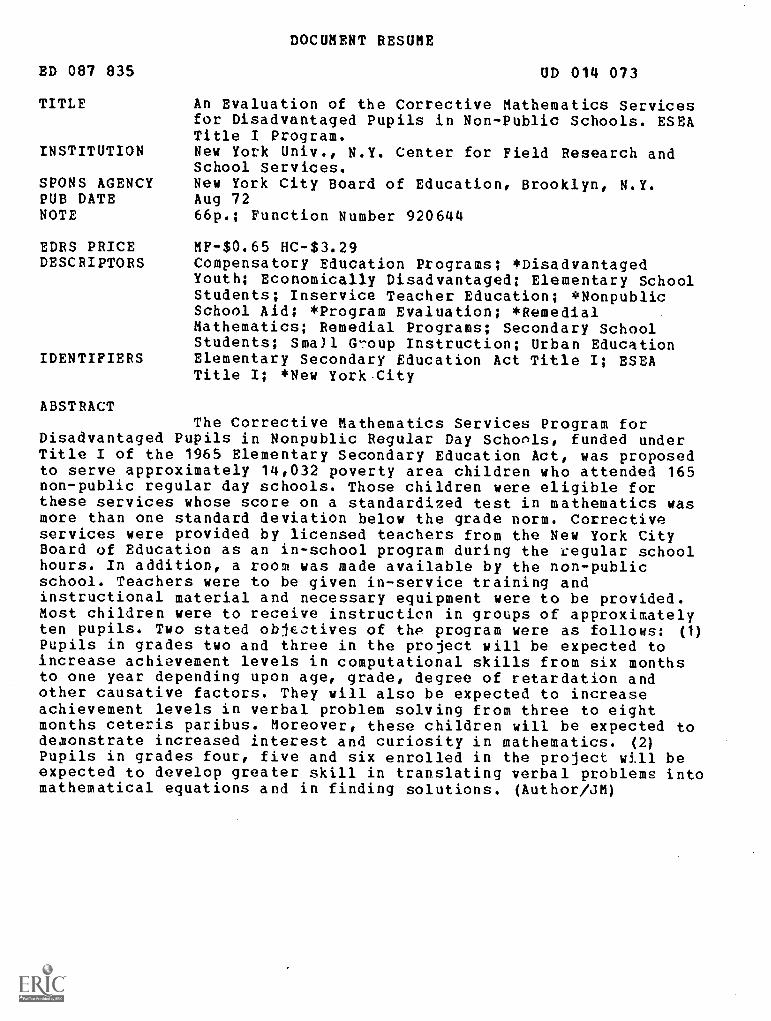
DOCUMENT RESUME
ED 087 835 UD 014 073
TITLE An Evaluation of the Corrective Mathematics Servicesfor Disadvantaged Pupils in Non-Public Schools. ESEATitle I Program.
INSTITUTION New York Univ., N.Y. Center for Field Research andSchool Services.
SPONS AGENCY New York City Board of Education, Brooklyn, N.Y.PUB DATE Aug 72NOTE 66p.; Function Number 920644
EDRS PRICE MF-$0.65 HC-$3.29DESCRIPTORS Compensatory Education Programs; *Disadvantaged
Youth; Economically Disadvantaged; Elementary SchoolStudents; Inservice Teacher Education; *NonpublicSchool Aid; *Program Evaluation; *RemedialMathematics; Remedial Programs; Secondary SchoolStudents; Sma)1 Group Instruction; Urban Education
IDENTIFIERS Elementary Secondary Education Act Title I; ESEATitle I; *New York.City
ABSTRACTThe Corrective Mathematics Services Program for
Disadvantaged Pupils in Nonpublic Regular Day Schools, funded underTitle I of the 1965 Elementary Secondary Education Act, was proposedto serve approximately 14,032 poverty area children who attended 165non-public regular day schools. Those children were eligible forthese services whose score on a standardized test in mathematics wasmore than one standard deviation below the grade norm. Correctiveservices were provided by licensed teachers from the New York CityBoard of Education as an in-school program during the regular schoolhours. In addition, a room was made available by the non-publicschool. Teachers were to be given in-service training andinstructional material and necessary equipment were to be provided.Most children were to receive instruction in groups of approximatelyten pupils. Two stated objectives of the program were as follows: (1)
Pupils in grades two and three in the project will be expected toincrease achievement levels in computational skills from six monthsto one year depending upon age, grade, degree of retardation andother causative factors. They will also be expected to increaseachievement levels in verbal problem solving from three to eightmonths ceteris paribus. Moreover, these children will be expected todemonstrate increased interest and curiosity in mathematics. (2)Pupils in grades four, five and six enrolled in the project will beexpected to develop greater skill in translating verbal problems intomathematical equations and in finding solutions. (Author/JM)
U S DEPARTMENT OF HEALTH.Lr'N EDUCATiON 6WELi ARE
NATIONAL iNSTiTUTE OFEDUCATION
DOCUYEST 155 PEEN REPROCr). C)CEC) EXAcve AS RECEi,,r 0 FROM
TrA PERSON Oa ORGAN!,ZA hoPi °RIG tiA PC-NTS OF Y.£ S OR OP,N.ONS
A'F C! 00 NOT NECESSARiv REPPEANT OF At NA t tC04. :NST1 I rlf opto,cA1,0% Postcs, OP t..)t uVCD
Function Number: 920644
AN EVALUATION OF THECORRECTIVE MATHEMATICS SERVICES
FOR DISADVANTAGED PUPILS INNON-PUBLIC SCHOOLS
ESEA TITLE I PROGRAM
Evaluation of a New York City school district educationalproject funded under Title I of the Elementary andSecondary Education Act of 1965 (PL 89.10), performedunder -contract with the Board of Education of the City ofNew York for the 1971.1972 school year.
Project Evaluation Team:William Zlot, DirectorEdward CarrollThan PorterStanley Taback
CENTER FOR EDUCATIONAL RESEARCH AND FIELD SERVICESSchool of Education
'4 New York University
August, 1972
New York University
School of EducationCenter for Educational Research and Field Serb icesOffice of OffCampus Courses
SI Press RuildingWashington SquareN e,s York, N.Y. 10003Telephone' (212)598.2898, 3425
September 30, 1972
Dr. David AbramsonActing DirectorBureau of Educational ResearchBOARD OF EDUCATION
OF THE CITY OF NEW YORK110 Livingston StreetBrooklyn, New York 11201
Dear Dr. Abramson:
In fulfillment of the agreement dated March 30, 1972 between the New YorkCity Public Schools and the Center for Educational Research and FieldServices, I am pleased to submit three hundred copies of the final report,An Evaluation of the Corrective Mathematics Services for Disadvanta edPupils in Non-Public Schools.
The Bureau of Educational Research and the professional staff of theNew York City Public Schools were most cooperative in providing data andfacilitating the study in general. Although the objective of the teamwas to evaluate a project funded under Title I, this report goes beyondthis goal. Explicit in this report are recommendations for modificationsand improvement of the program. Consequently, this report will serve itspurpose best if it is studied and discussed by all who are concerned witheducation in New York City -- the Board of Education, professional staff,students, parents, lay leaders, and other citizens. To this end, thestudy team is prepared to assist with the presentation and interpretationof its report. In addition, the study team looks forward to our continuedaffiliation with the New York City Public Schools.
You may he sure that New York University and its School of Education willmaintain a continuing interest in the schools of New York City.
AS:jh
Respectfully spbmitted,
ARNOLD SDirector
TABLE OF CONTENTS
Chapter Page
EXECUTIVE SUMMARY
I. INTRODUCATION , 1
A. Decription
B. Evaluation Objectives 3
C. Aspects of the Evaluation 4
IMPLEMENTATION OF EVALUATION OBJECTIVE 1 I 0
A. A Gross Analysis of the Gain of the
Project Students 10
B. A Statistical Comparison of Achievement
in Mathematics of the Project Students
and the NonProject Students
C. Estimates of the Increases in Attitude
in Mathematics and of the Relationship
between Attitude and Achievement in Mathematics 17
III. IMPLEMENTATION OF EVALUATION OBJECTIVES 2 AND 3 24
A. Evaluation Objective 2 24
B. Evaluation Objective 3 (Recommendations) 28
APPENDICES
Page
L Guidelines for Interviews with/andRatings of Project Teachers 1'
II. Guidelines for Interviews with Principals 34
III. Guidelines for interviews with RegularClassroom Teachers 35
IV. Questionnaire to Project Teachers 36
V. Discussion of Questionnaire to Project Teachers 41
VI. Questionnaire to Principals 43
VII. Discussion of Questionnaire to Principals 44
VIII. Questionnaire to Regular Classroom Teachers 45
IX. Discussion of Questionnaire to RegularClassroom Teachers 48
X. Arithmetic Inventory (Attitude):Grades 2 6 49
XI. Arithmetic Inventory (Attitude):Grades 7 and Above 52
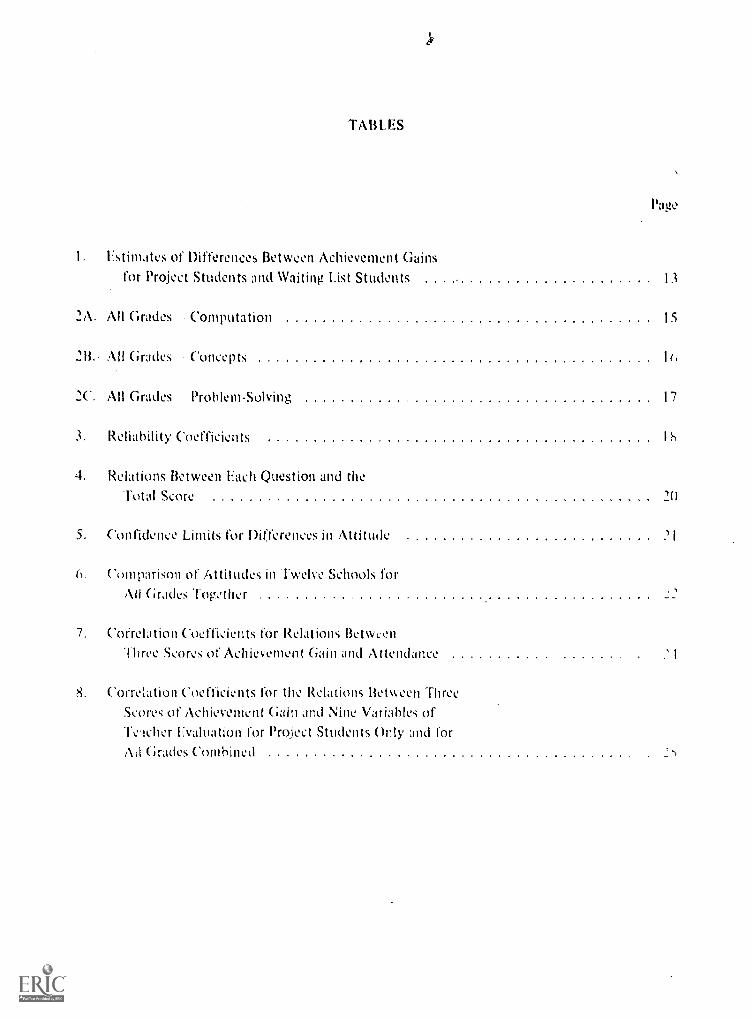
TABLES
Page
1. Estimates of Differences Between Achievement Gainsfor Project Students and Waiting List Students 13
2A. All Grades Computation 15
U. All Grades Concepts 1r.
2C. All Grades Problem-Solving 17
3. Reliability Coefficients 18
4. Relations Between Each Question and theTotal Score 20
5. Confidence Limits for Differences in Attitude 'I
6. Comparison of Attitudes in Twelve Schools forAll Grades Together
7. Correlation Coefficients for Relations BetweenThree Scores of Achievement Gain and Attendance
8, Correlation Coefficients for the Relations Between ThreeScores of Achievement Gain and Nine Variables of-reicher Evaluation for Project Students Only and forAil Grades Combined
1
ACKNOWLEDGEMENTS
To Lawrence E. Larkin, Director of the Office of State and Federally Assisted
Programs for the NonPublic Schools and Mrs, Lucille A, Stovall, Coordinator of
Corrective Mathematics Services, both of the New York City Board of Education
for their cooperation and their advice on goals and procedures;
To Mr. Ambrose Emilio, Rabbi Burton Jaffa, Mr. Joseph P. O'Connor and
Mr. George Prassas, Title I Liaison Officers at the New York City Board of
Education for their help in facilitating our evaluation by enabling us to obtain
access to various schools;
To Professors Edward Carroll, Than Porter and Stanley Taback for their
diligent work and valuable judgments;
To Professor Than Porter for his expert assistance in computer processing
of the data and evaluating the results;
And to Dr. Arnold Spinner and Miss Helen Keily, Center for Educational
Research and School Services, School of Education, New York University, for
their constant aid, encouragement and advice.
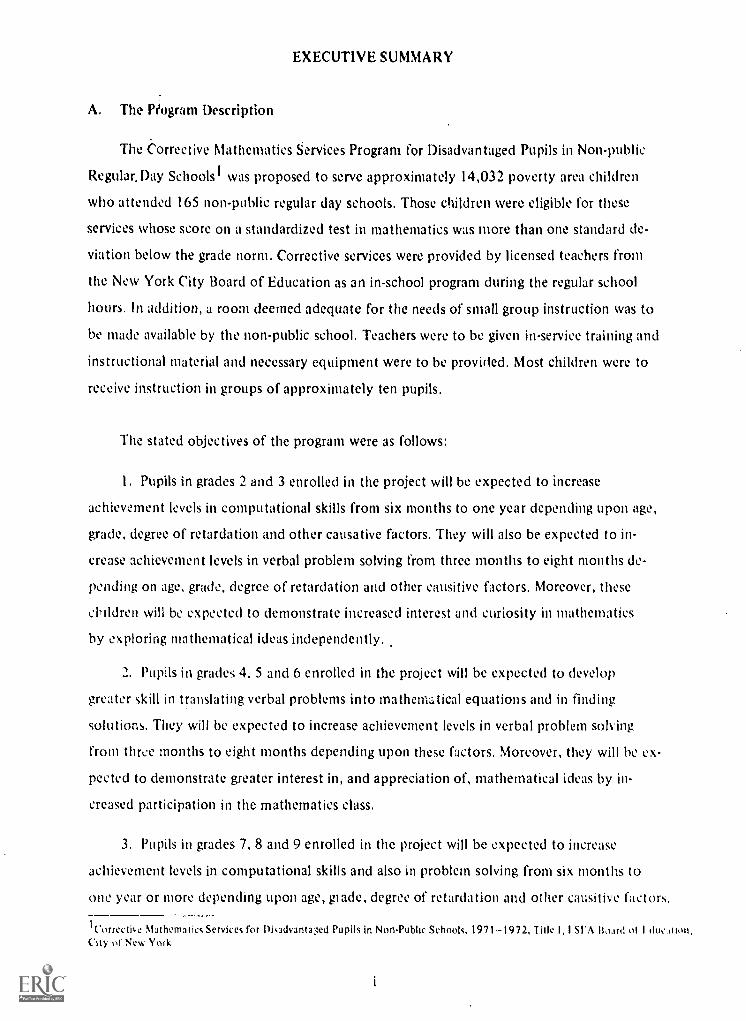
EXECUTIVE SUMMARY
A. The POogram Description
The Corrective Mathematics Services Program for Disadvantaged Pupils in Non-public
Regular. Day Schools 1 was proposed to serve approximately 14,032 poverty area children
who attended 165 non-public regular day schools. Those children were eligible for these
services whose score on a standardized test in mathematics was more than one standard de-
viation below the grade norm. Corrective services were provided by licensed teachers from
the New York City Board of Education as an in-school program during the regular school
hours, In addition, a room deemed adequate for the needs of small group instruction was to
be made available by the non-public school. Teachers were to be given in-service training and
instructional material and necessary equipment were to be provided. Most children were to
receive instruction in groups of approximately ten pupils.
The stated objectives of the program were as follows:
1. Pupils in grades 2 and 3 enrolled in the project will be expected to increase
achievement levels in computational skills from six months to one year depending upon age,
grade, degree of retardation and other causative factors. They will also be expected to in-
crease achievement levels in verbal problem solving from three months to eight months de-
pending on age, grade, degree of retardation and other causitive factors. Moreover, these
cbildren will be expected to demonstrate increased interest and curiosity in mathematics
by exploring mathematical ideas independently.
2. Pupils in grades 4. 5 and 6 enrolled in the project will be expected to develop
greater skill in translating verbal problems into mathematical equations and in finding
solutions. They will be expected to increase achievement levels in verbal problem solving
from three months to eight months depending upon these factors. Moreover, they will be ex-
pected to demonstrate greater interest in, and appreciation of, mathematical ideas by in-
creased participation in the mathematics class.
3. Pupils in grades 7, 8 and 9 enrolled in the project will be expected to increase
achievement levels in computational skills and also in problem solving from six months to
one year or more depending upon age, glade, degree of retardation and other causitive factors.
1 Corrective Mathematics Services for Disadvantaxd Pupils in Non-Public Schools, 1971-1972, Title 1,1 S1'A nn,ird oI I
()Iv of New York
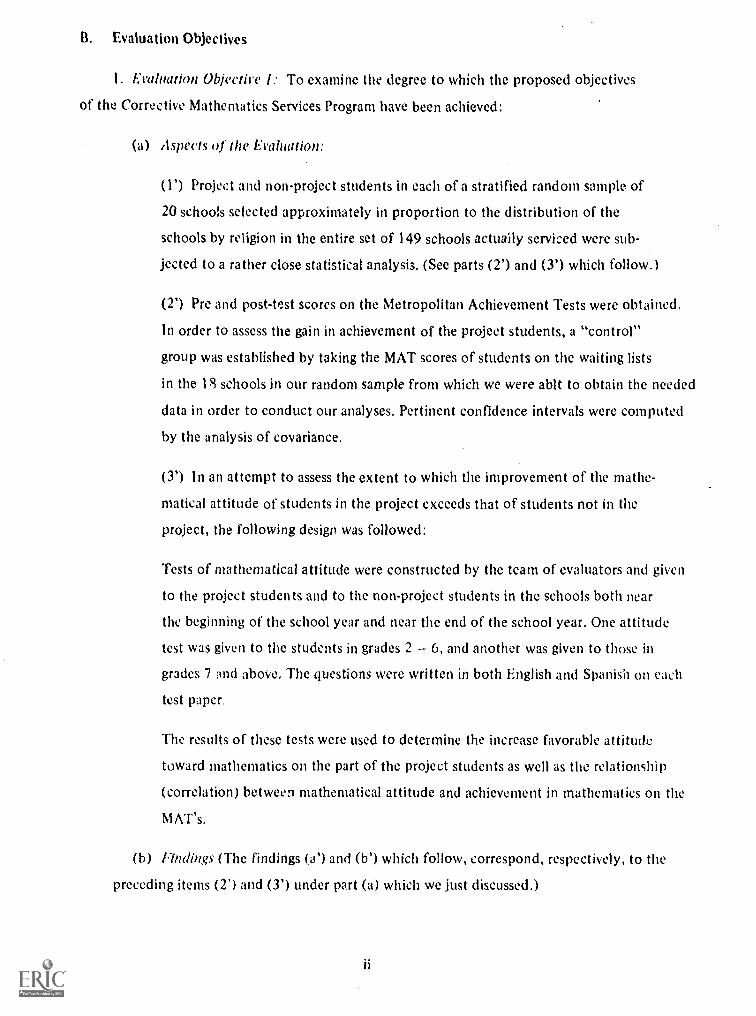
B. Evaluation Objectives
I. Evaluation Objective 1: To examine the degree to which the proposed objectives
of the Corrective Mathematics Services Program have been achieved:
(a) Aspects of the Evaluation:
(1') Project and nonproject students in each of a stratified random sample of
20 schools selected approximately in proportion to the distribution of the
schools by religion in the entire set of 149 schools actually serviced were sub-
jected to a rather close statistical analysis. (See parts (2') and (3') which follow.)
(2') Pre and post-test scores on the Metropolitan Achievement Tests were obtained.
In order to assess the gain in achievement of the project students, a "control"
group was established by taking the MAT scores of students on the waiting lists
in the 18 schools in our random sample from which we were ablt to obtain the needed
data in order to conduct our analyses. Pertinent confidence intervals were computed
by the analysis of covariance.
(3') In an attempt to assess the extent to which the improvement of the mathe-
matical attitude of students in the project exceeds that of students not in the
project, the following design was followed:
Tests of mathematical attitude were constructed by the team of evaluators and given
to the project students and to the non-project students in the schools both near
the beginning of the school year and near the end of the school year. One attitude
test was given to the students in grades 2 -- 6, and another was given to those in
grades 7 and above. The questions were written in both English and Spanish on each
test paper.
The results of these tests were used to determine the increase favorable attitude
toward mathematics on the part of the project students as well as the relationship
(correlation) between mathematical attitude and achievement in mathematics on the
MAT's.
(b) Findings (The findings (a') and (b') which follow, correspond, respectively, to the
preceding items (2') and (3') under part (a) which we just discussed.)
ii
(a') In the opinion of the evaluating team the gains in achievement from the
project are sufficiently greater than tnose from the waiting list to state with
95% confidence that the project in general, is very worthwhile. (See Chapter II,
Part B.)
(be) There is very little evidence to support any claim that the project has
any considerable effect upon the attitude of students toward mathematics as in-
dicated by the tests in Appendices X and XI. (See Chapter II, Part C.)
1 Evaluation Objective 2: To examine and appraise the procedures employed in the
Corrective Mathematics Services Program to achieve the stated program objectives.
(a) Aspects of' the Evaluation
(1') Project students and project teachers in the random sample of 20 schools
were subjected to a close analysis. (See Part (2') which follows.) In addition,
principals and at least one regular classroom teacher in each of the 20 schools
were interviewed during on-site visits. Ratings of eight teaching practices of
the project teachers in the 20 schools were made. (See Part (3') below.) Moreover,
there were pertinent questions on anonymous questionnaires to the project teachers,
principals and regular classroom teachers in each of the 149 schools. (Sec Part
(4') below.)
(2') For the project students in each of the 20 schools in our sample, a study
was made of the relationship between achievement and the number of project teach-
ing sessions attended by the students. A coefficient of partial correlation was
computed to assess the relationship between achievement at the end of the year
and the number of sessions a student was taught.
(3') For the project teachers in each of the 20 schools, a correlation coefficient
was computed for the relationship between the mean achievement of each school and
the project teacher's total rating (See Appendix I) as well as for the teacher's
rating on each of the eight teaching practices.
(4') Numerical Assignments were made to the alternate responses to the pertinew
questions on the anonymous questionnaires sent to all project teachers and arith-
metic means were computed.
iii
(a) Findings (The findings (as), (be) and (c') which follow, correspond, respec-
tively, to the Preceding items (2), (3') and (4') under part (a) which we just
discussed.)
(a') It appears of little consequence whether a student'slittendance is good
or poor he learns the same in either ease. (See Chapter III, Part A.)
(be) There is not even any barely acceptable evidence of any worthwhile rela-
tion between any of the ratings (as indicated in the form given in Appendix I)
Lind any of the three measures of achievement in mathematics computation, con-
cepts, and problem-solving. (See Chapter HI, Part A.)
(c') In general, according to the responses to pertinent questions on the anony-
mous questionnaires, the procedures followed in the Corrective Mathematics Ser-
vices Program were regarded as being satisfactory by the 64 (out of %) respond-
ing project teachers. (See Chapter III, Part A.)
3. Evaluation Objective 3: To present recommendations for improving the effective-
ness of Corrective Mathematics Services Program.
(a) Recommenthitions:
1. The pre-testing should be done in the fall despite the complaint of the non-
public school supervisors. For without both a pre-test and post-test score obtained
according to a consistent schedule, it is difficult to measure pupil progress
2. The practice in sonic schools of having a corrective mathematics teacher sec
the same children on each of three or four days under an experimental program
yielded significantly better results than those made by the children receiving
two periods of remedial instruction. The practice should be extended.
3. The supervisors should extend the practice of working with, and talking to,
individual children during their visits to the schools.
4. The corrective teacher should write some sort of progress report (not a grade)
periodically during the year about each child in the corrective program. These
reports might be sent home to parents and/or to regular teacher.
iv
5. Since the corrective math program is of a remedial nature, it seems advisable
, that the corrective mathematics teacher have adequate space to handle small
workshops.
6. There should be more flexibility in corrective program so that children could
move in and out more easily during the academic year. (Subject to appropriate
investigation.)
7. One day a week service is practically meaningless. Not only do the children
involved forget almost everything from week to week, but with holidays, sickness,
etc. the service, in reality, is truly tokenism.
8. Teachers need more training conferences, where they may work at the materials
on an individual basis. It is not sufficient to have demonstration classes.
9. A workshop could be offered for the parents at each school. This way, the
parents might be able to provide some home assistance which would reinforce the
program. Perhaps the Board and an individual non-public school could share the
responsibility (at least financial) of providing such a workshop.
10. Corrective mathematics teachers should reinforce topics treated in the regu-
lar classroom by teaching and developing closely related topics at appropriately
correlated times.
11. There still is very little meaningful contact between the regular classroom
teacher and the corrective teacher. At most, they usually only eat lunch together.
12. There should be some orientation provided for "new" regular classroom
teachers so that they fully understand the purposes and procedures for the cor-
rective mathematics program. Efforts should be made on the part of the coordi-
nator in cooperation with the non-public school staff to this end.
13. Coordinators and supervisors can stimulate more interest in the corrective
math program by giving demonstrations or by explaining the program to the regu-
lar faculty of the school.
14. Corrective mathematics teachers should be available to attend a regular
school faculty conference in the early fall.
15. Corrective teachers should be given some Idea of how to handle minor emo-
tional problems that they might encounter. Perhaps the Title 1 guidance coun-
selor in a school might conduct a workshop to assist the corrective teachers.
16. Consideration should be given (subject to appropriate investigation) to
dropping disruptive discipline problems from the program.
17. There are schools where it becomes virtually automatic for some children
to go to the corrective mathematics class year after year. There should be some
limits set on how long a pat ticular student, who shows no or little sign of
progress, would be permitted to continue in the program.
(b) Conclusion;
The evaluators continue to believe that the corrective Mathematics Services
Program is a successful and viable program.
,7)11.40.
vi
I, INTRODUCTION
A. Program Description
According to the program proposal', corrective mathematics instruction was to be pro-
vided for approximately 14,032 disadvantaged pupils attending 165 non-public schools. The
schools included in this program are locate chiefly in poverty areas having high concentra-
tions of low-income families.
Those children whose score on a standardized achievement test in mathematics is more
than one standard deviation below the grade norm were deemed eligible for participation in
the program. A room deemed adequate for the needs of small group instruction was to be
made available by the non-public school during the regular school hours. Teachers were to be
assigned to give instruction to small groups of approximately ten children. In the event that
it is not possible to secure personnel for instruction during the regular school hours, services
were to be provided in the same schools after regular hours until such time as regular staff
becomes available. All personnel must be licensed by the Board of Education.
lnservice training of the Corrective Mathematics Teachers was to be conducted under
the supervision of the Project Coordinator with the assistance of field supervisors and mathe-
matics consultants. Workshops for the parents of the non-public school children admitted to
the prograM were to be conducted by the field supervisors and the Corrective Mathematics
Teachers.
The evaluation covers the instruction program which operated during the school year,
ber I, 1971 to June 30, 1972.
The stated objectives of the program were as follows:
I) Pupils in grades 2, and 3 enrolled in the project will be expected to increase achieve-
ment levels in computational skills from six months to one year depending upon age, grade,
degree of retardation and other causative factors. They will also be expected to increase
achievement levels in verbal problem solving from three months to eight months depending
upon age, grade, degree of retardation and other causative factors. Moreover, these children
will be expected to demonstrate increased interest and curiosity in mathematics by exploring
mathematical ideas independently.
1 Corrective mathematics Services for Disadvantaged Pupils in NonPublic Schools, 1971-1972, Title I. ESEA hoard ofEducation. City of New York.
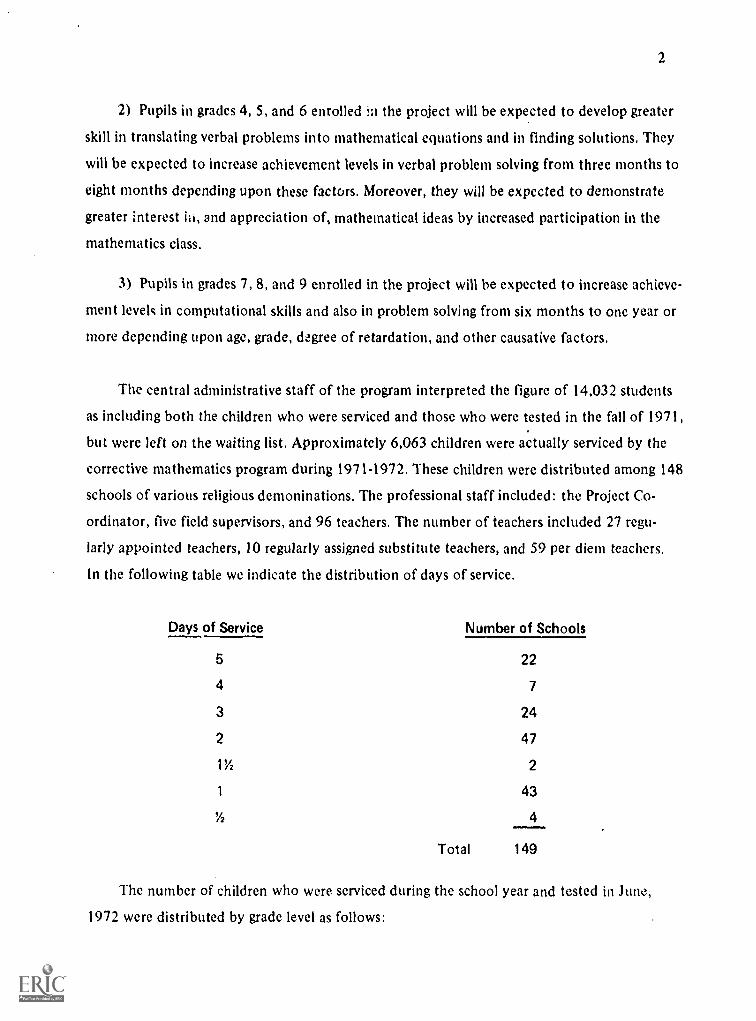
2
2) Pupils in grades 4, 5, and 6 enrolled in the project will be expected to develop greater
skill in translating verbal problems into mathematical equations and in finding solutions, They
will be expected to increase achievement levels in verbal problem solving from three months to
eight months depending upon these factors. Moreover, they will be expected to demonstrate
greater interest hi, and appreciation of, mathematical ideas by increased participation in the
mathematics class.
3) Pupils in grades 7, 8, and 9 enrolled in the project will be expected to increase achieve-
ment levels in computational skills and also in problem solving from six months to one year or
more depending upon age, grade, degree of retardation, and other causative factors.
The central administrative staff of the program interpreted the figure of 14,032 students
as including both the children who were serviced and those who were tested in the fall of 1971,
but were left on the waiting list. Approximately 6,063 children were actually serviced by the
corrective mathematics program during 1971-1972. These children were distributed among 148
schools of various religious demoninations. The professional staff included: the Project Co-
ordinator, five field supervisors, and 96 teachers. The number of teachers included 27 regu-
larly appointed teachers, 10 regularly assigned substitute teachers, and 59 per diem teachers.
In the following table we indicate the distribution of days of service.
Days of Service Number of Schools
5 22
4 7
3 24
2 47
11/2 2
1 43
1/2 4
Total 149
The number of children who were serviced during the school year and tested hi June,
1972 were distributed by grade level as follows:
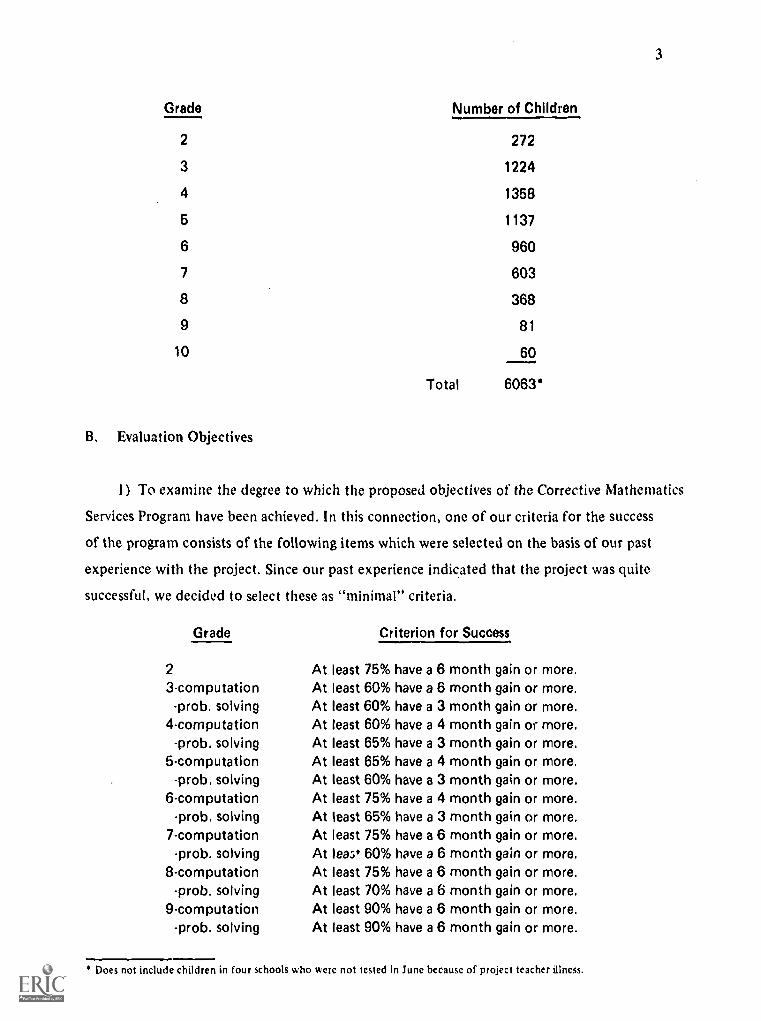
3
Grade Number of Children
2 272
3 1224
4 1358
5 1137
6 960
7 603
8 368
9 81
10 60
Total 6063*
B. Evaluation Objectives
1) To examine the degree to which the proposed objectives of the Corrective Mathematics
Services Program have been achieved. In this connection, one of our criteria for the success
of the program consists of the following items which were selected on the basis of our past
experience with the project. Since our past experience indicated that the project was quite
successful, we decided to select these as "minimal" criteria.
Grade Criterion for Success
2 At least 75% have a 6 month gain or more.3-computation At least 60% have a 6 month gain or more.
-prob. solving At least 60% have a 3 month gain or more.4computation At least 60% have a 4 month gain or more.
-prob. solving At least 65% have a 3 month gain or more.5-computation At least 65% have a 4 month gain or more.
-prob. solving At least 60% have a 3 month gain or more.6-computation At least 75% have a 4 month gain or more.
-prob. solving At least 65% have a 3 month gain or more.7-computation At least 75% have a 6 month gain or more.
-prob. solving At leant 60% have a 6 month gain or more.8-computation At least 75% have a 6 month gain or more.
-prob. solving At least 70% have a 6 month gain or more.9computation At least 90% have a 6 month gain or more.
-prob. solving At least 90% have a 6 month gain or more.
* Does not include children in four schools who were not tested in June because of project teacher illness.
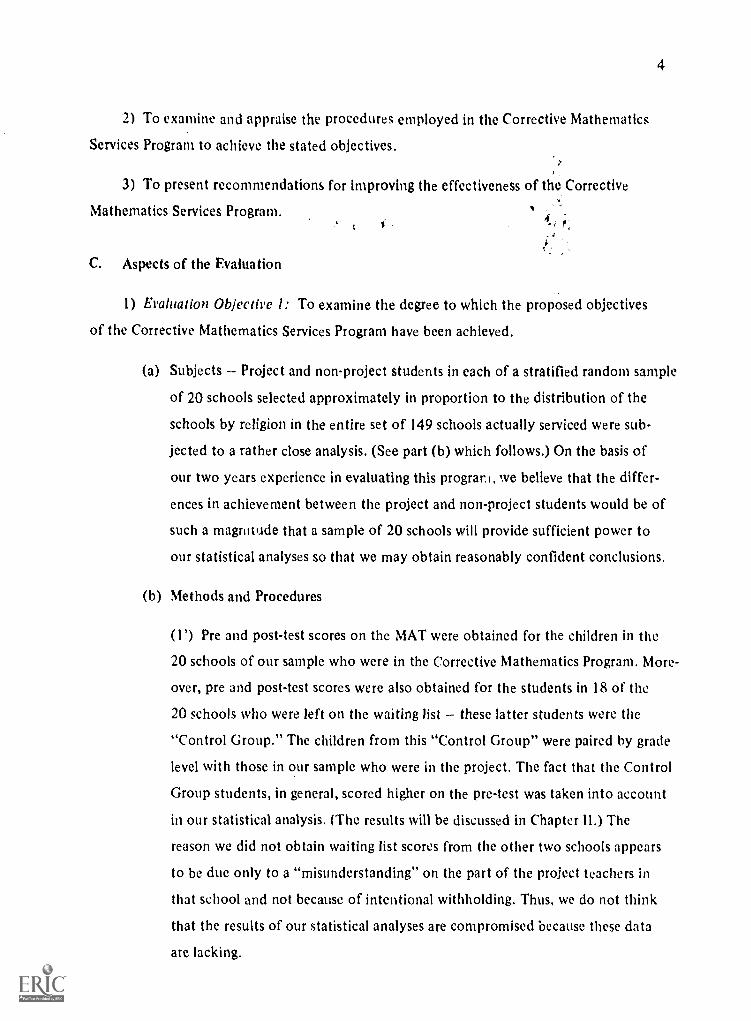
4
2) To examine and appraise the procedures employed in the Corrective Mathematics
Services Program to achieve the stated objectives.
3) To present recommendations for improving the effectiveness of the Corrective
Mathematics Services Program.
C. Aspects of the Evaluation
I) Evaluation Objective 1: To examine the degree to which the proposed objectives
of the Corrective Mathematics Services Program have been achieved.
(a) Subjects -- Project and non-project students in each of a stratified random sample
of 20 schools selected approximately in proportion to the distribution of the
schools by religion in the entire set of 149 schools actually serviced were sub-
jected to a rather close analysis. (See part (b) which follows.) On the basis of
our two years experience in evaluating this program, we believe that the differ-
ences in achievement between the project and non-project students would be of
such a magnitude that a sample of 20 schools will provide sufficient power to
our statistical analyses so that we may obtain reasonably confident conclusions.
(b) Methods and Procedures
(1') Pre and post-test scores on the MAT were obtained for the children in the
20 schools of our sample who were in the Corrective Mathematics Program. More-
over, pre and post-test scores were also obtained for the students in 18 of the
20 schools who were left on the waiting list these latter students were the
"Control Group." The children from this "Control Group" were paired by grade
level with those in our sample who were in the project. The fact that the Control
Group students, in general, scored higher on the pre-test was taken into account
in our statistical analysis. (The results will be discussed in Chapter 11.) The
reason we did not obtain waiting list scores from the other two schools appears
to be due only to a "misunderstanding" on the part of the project teachers hi
that school and not because of intentional withholding. Thus, we do not think
that the results of our statistical analyses are compromised because these data
are lacking.
5
(2') In an attempt to assess the extent to which the improvement of the attitude
of students toward mathematics in the project exceeds that of students not in the
project, the following design was followed:
Tests of mathematical attitude were constructed by the team of evaluators and
given to the project students and to the non-projects in the schools both near
the beginning of the school year and near the end of the school year. One interest
test was given to the students in grades 2-6, and another was given to those
in grades 7 and above. The questions were written in both English and Spanish
on each test paper. The results of these tests were used to determine the im-
provement in mathematical attitude on the part of the project students as well
as the relationship between mathematical attitude and achievement in mathe-
matics on the MAT's. (Appendices X and XI the tests and their correlation
with MAT achievement and their results will be discussed in Chapter 11).
(c) Statistical and/or Qualitative Analysis The material under (I) and (2') in the
following discussion relates, respectively, to the methods and procedures under the
corresponding numbers in the preceding item (b), "Methods and Procedures."
(1') Pertinent confidence intervals were obtained from an analysis of the pre and
post-test scores on the MAT of the project students and the non-project students in
our random sample of 20 schools. These confidence intervals were computed in the
various cases by the analysis of covariance to determine whether or not there is a
difference in mathematics achievement between those who received special remedial
work and those who did not.
(2') The questions on the interest test formulated by the evaluation team were
submitted to a reading specialist who reworded them to make them as clear as
possible to students of the ages to be tested.
We used a scale of responses for each question with the different levels of re-
sponses being never, sometimes, and most of the time for grades 2 -6, and
all the time for grades 7 and above. In scoring the tests the responses were
assigned numbers in such a way that a high number always indicates higher interest
than does a lower number. A particular student's score on the test was taken to be
G
the mean of all the scores on the individual questions that were actually answered
by the students.
After the test was developed, it was administered to both project and nortprojeet
(waiting list) students in our random sample of schools. For each student, both
the total test score and the score on each question was recorded. Then, for each
question, a Pearson product-moment coefficient of correlation was computed for
the scores on that question paired with the corresponding total scores. Thus, we
had one coefficient of correlation for each question. If, for a particular
question this coefficient is non-positive, or even if it is positive but very low,
then that question was excluded from further analysis. New total scores were then
computed for all the questions not thus excluded. This process of exclusion was
repeated using these new total scot.s. This procedure was continued until all
questions had a correlation coefficient sufficiently high to yield 95% confidence
that, in general, the score on that question was positively related to the total
score. (If such a test is given again in future years, some of the questions that
are excluded from further analysis in the fall of 1971 may be used in reworded
form.)
A coefficient of correlation was computed in order to obtain the split-half re-
liability coefficient. That is, half of the questions were considered to be one
test and the other half another test, and the coefficient of correlation between
these two tests was computed. This coefficient was then corrected by the Spear-
man-Brown correction formula to account for the fact that each half-test has
only half as many questions as the actual test. If the resulting reliability
was greater than .80, the test was considered to be sufficiently reliable. If
not, the question having lowest correlation with the total score was discarded
and the reliability was recomputed. This procedure was repeated until a suffi-
ciently high reliability coefficient was obtained.
When the discarding processes were over, a total score was computed for each
stmdent for only those questions that were still included and this score will he
known as the pre-test score. Thus, the one administration of the test near the
beginning of the year was used both for perfecting the test and also for the
actual pre-test scores.
Near the end of the year, the same attitude test was given and it included all the
questions that were on the pre-test regardless of whether they were excluded or
not from further analysis at the beginning of the year. We did this for the fol-
lowing reason: If the questions that were excluded from analysis on the pre-test,
did not appear at all on the post-test, the two tests may not be equivalent since
they would be of different lengths. Also, some questions, although they may not
be considered in the total post-test score, may still help to establish rapport
and thus, influence the responses to other questions. A total test score was
computed for each student using only those questions that were included in the
pre-test score and this score as called the post-test score.
An analysis of covariance was computed using the post-test scores as the depen-
dent variable, the type of treatment that is, whether the student was in the
project or not as the independent variable, and the pre-test score as a covari-
ance. This analysis yielded a confidence interval within which the confidence is
95% that the difference between the mean attitude of project students at the end
of the year and the mean attitude of non-project students at the end of the, year
lies. Of course, adjustments were made to account for differences in attitude at
the end of the year that appear to have been caused by differences in interest at
the beginning of the year. By adjustments we mean that the effect of the beginning
scores was removed by using the gain in achievement as the score.
The pre-test and post-test achievement scores from the Metropolitan Achievement
Test and pre-test and post-test scores from the interest test are four scores for
each project student in our random sample. A correlation coefficient for the re-
lationship between the post-test achievement score and the post-test interest
score was computed to assess the strength of the relation between attitude and
achievement. Of course, the effect of the pre-test scores were removed at the be-
ginning of the computation.
(d) Tittle Schedule
Pre-tests MAT and Attitude September 1971
Post-tests MAT and Attitude May and June 1972
8
2) Evaluation Objective 2: To examine and appraise the procedures employed in the
Corrective Mathematics Services Program to achieve the stated program objectives.
(a) Subjects:
Project students and project teachers in the random sample of 20 schools were
subjected to a close analysis, (See part (b) which follows.) In addition, princi-
pals and at least one regular classroom teacher in each of the 20 schools were
interviewed, Moreover, there were pertinent questions on anonymous question-
naires to project teachers, principals, and regular classroom teachers in each of the
149 schools, On the basis of our two years experience in evaluating this program,
we believe that the differences in achievement between the project and non-project
students would be of such magnitude that a sample of 20 schools will provide suf-
ficient power to our statistical analyses to that we may obtain reasonable con-
fident conclusions.
(b) Methods and Procedures..
(1') For the project students in each of the 20 schools in our random sample, a
study was made of the relationship between achievement and the number of project
teaching sessions attended by the students. We obtained for each project student
in our random sample a Metropolitan Achievement Test post-test score, as well as
a number which is the number of sessions that the student was taught and a Metro-
politan Achievement Test pre-test score.
(2') On-site visits to each of the random sample of schools were conducted. These
visits were begun hi the fall of 1971. In addition, four of these schools were
arbitrarily selected and visited for a second time in the spring 1972.
During each visit, the corrective teacher, the principal, and two regular class-
room teachers were interviewed in conformity with specially prepared interview
forms. (Appendices I, II, and III.) Ratings of eight teaching practices of the
project teachers in the 20 schools were made and analyses were carried out to
assess the relation between achievement and these teaching practices. Among the
other teaching practices we investigated are: respect of the project teacher for
the students, the project teacher's expectation for the student, and the
9
authoritarianism of the project teacher, Pertinent data was obtained during the on-
site visits by the evaluators in their observations of the corrective mathematic:,
classes. (The results will be discussed in Chapter III,)
(3') Pertinent questions were included in each of the anonymous questionnaires
which were mailed to teachers, principals, and two regular classroom teachers in
all of the 149 schools. (See Appendices IV, VI, VIII, respectively. The results
of our analysis of pertinent questions will be given in Chapter III. Analysis of
other questions are given in Appendices V, VII, and IX.)
(e) Statistical and /or Qualitative Analysis The material under (I '), (2'), and (3') in
the following discussion relates, respectively, to the methods and procedures under
the corresponding numbers in the proceeding item (b) "Methods and Procedures."
( I') A coefficient of partial correlation was computed for each school in our sam-
ple to assess the relation between achievement at the end of the year and the number
of sessions that a student was taught. In the course of the computation the effect
of the pre-test achievement was removed.
(2') A correlation coefficient was computed for the relationship between the mean
achievement of the project students in each school of our sample and the project
students in each school of our sample and the project teacher's total rating as
well as for the teacher's rating on each of the teaching practices.
(3') Numerical assignments were made to the alternative responses to the perti-
nent questions on all the anonymous questionnaires and arithmetic means were
computed.
Time Schedule
On-site visits throughout school year
Mailing of anonymous questionnaires March 1972
3) Evaluation Objective 3: To present recommendations for improving the effective-
ness of the Corrective Mathematics Services Program. These recommendations are based on the
results of our statistical analyses and interviews. (The recommendations are given in
Chapter III.)
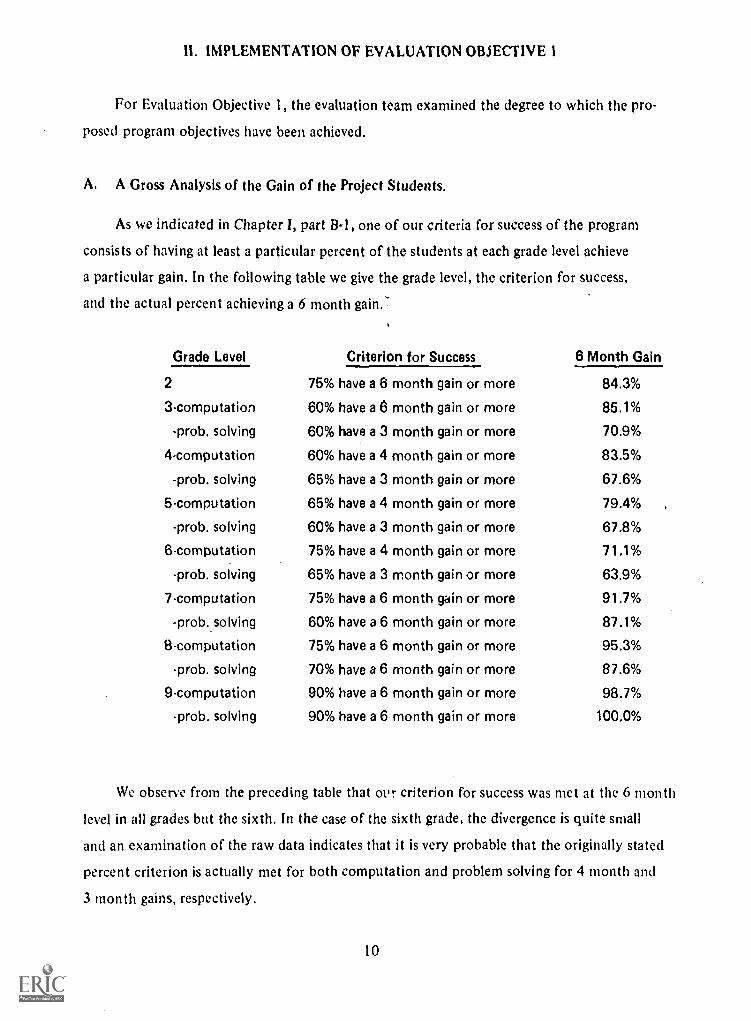
II. IMPLEMENTATION OF EVALUATION OBJECTIVE 1
For Evaluation Objective I, the evaluation team examined the degree to which the pro-
posed program objectives have been achieved.
A. A Gross Analysis of the Gain of the Project Students.
As we indicated in Chapter 1, part B-I, one of our criteria for success of the program
consists of having at least a particular percent of the students at each grade level achieve
a particular gain. In the following table we give the grade level, the criterion for success,
and the actual percent achieving a 6 month gain.-
Grade Level
2
3-computation
-prob, solving
4-computation
-prob. solving
5-computation
-prob. solving
6-computation
-prob. solving
7-computation
-prob. solving
8-computation
-prob. solving
9-computation
-prob. solving
Criterion for Success
75% have a 6 month gain or more
60% have a
60% have a
60% have a
65% have a
65% have a
60% have a
75% have a
65% have a
75% have a
60% have a
75% have a
70% have a
90% have a
90% have a
6 month gain or more
3 month gain or more
4 month gain or more
3 month gain or more
4 month gain or more
3 month gain or more
4 month gain or more
3 month gain or more
6 month gain or more
6 month gain or more
6 month gain or more
6 month gain or more
6 month gain or more
6 month gain or more
6 Month Gain
84.3%
85.1%
70.9%
83.5%
67.6%
79.4%
67.8%
71.1%
63.9%
91.7%
87.1%
95.3%
87.6%
98.7%
100.0%
We observe from the preceding table that of r criterion for success was met at the 6 month
level in all grades but the sixth. In the case of the sixth grade, the divergence is quite small
and an examination of the raw data indicates that it is very probable that the originally stated
percent criterion is actually met for both computation and problem solving for 4 month and
3 month gains, respectively.
10
11
B. A Statistical Comparison of Achievement in Mathematics of the
Project Students and the Non-Project Students.
A major portion of the analyses involved comparisons between an "experimental" group
and a "control" group from which useful confidence intervals were computed.
To estimate the accomplishment of the three program objectives (See Chapter I, Part A)
mathematics achievement was measured for (1) a sample of project students in twenty randomly
chosen schools and (2) a comparable sample of students on the waiting list in eighteen of
these schools. As was true for the students in the project, students on the waiting list were
one or more standard deviations belt '3/ the national mean in mathematics achievement at the
beginning of the school yeas'. However, because of limited accommodations, the students chosen
for participation in the project were those most below this mean. To adjust for this slight
dissimilarity, measures of mathematics achievement for both samples were obtained both at
the beginning and the end of the school year, with final scores adjusted to reflect initial
differences in favor of the students on the waiting list.
The Metropolitan Achievement Test (MAT) was used to measure the achievement for all
students both at the beginning and the end of the school year. Three measures of achievement
were obtained from the MAT: one for ability to do arithmetic computations, one cor under-
standing of concepts, and one for ability to solve problems. From the differences between
the means of these three scores for the sample of project students and the corresponding
means for the sample of students on the waiting list, estimates were made by the procedure
of analysis of variance of the analogous differences between the means of the overall popula-
tion of project students and the overall population of waiting list students. These estimates
of population differences are taken to be estimates of the differences between the method of
instruction of the project students and the method of instruction of the waiting list students
and are, therefore, a measure of the effectiveness of the project. Since all the differences
between sample means, were in favor of the project students, an estimate was made for each
overall population mean difference d, of that difference D for which there is 95% confidence
that d is greater than D. These estimates were calculated for the following groups: (1) all
grades second through eighth taken together; (2) the second grade; (3) the third and
fourth grades taken together; (4) the fifth and sixth grades taken together; and (5) the
seventh and eighth grades taken together. (There were no 9th grade students in the random
sample. Only 81 or approximately 1-1/3% of the 6,063 children in the program were in grade 9.
12
The random sample was stratified by religious code and the'sampling did not pick-up any
9th graders.)
Various grades were combined because we believed that the fragmentation of information
would be too great for each grade separately. The evaluation team felt that there was not
enough difference in content between two consecutive grades for separate analyses to be of
great interest. Account was taken of variables in pupils exposure. (See Chapter 3.) The
number of days that each project student attended the program was recorded and coefficients
of correlation were computed for the relations between this exposure and the achievements.
The exposure of non-project students was zero for each student.
The means and differences are all stated in units of one "year of achievement" which
is the average achievement gained during one year by children in general in the entire country.
Thus, on year of achievement gain is the average achievement gain for the nation as a whole.
Since this year of achievement is considered to be a ten-month year the number of tenths of
years of achievement gain is also the number of months of gain. Thus, for example, six tenths
of a year of gain means six months gain. Table 1 on the following page lists these estimates.
Since the number of degrees of freedom is rather large in all but one case, namely the
concepts scores for Grades Seven and Eight, the critical t ratio was taken to be 1.65 in every
case, which is the same as for a normal distribution. Although the number of subjects is cer-
tainly accounted for in the computation of the standard error, the sample of only 12 project
students for the comparison of concepts for Grades Seven and Eight is very questionable.
The standard error is reported in Table I so that it is possible for the reader to com-
pute any other confidence limits that may be desired. The lower limit of any confidence inter-
val is. in general, the difference between the sample means and the product of the standard
error and the appropriate critical t ratio, which can be found in a table in most statistics
texts. For example, referring to "computation all grades" we have (to the nearest thou-
sandth) .298 = .384(.052 x 1.65).
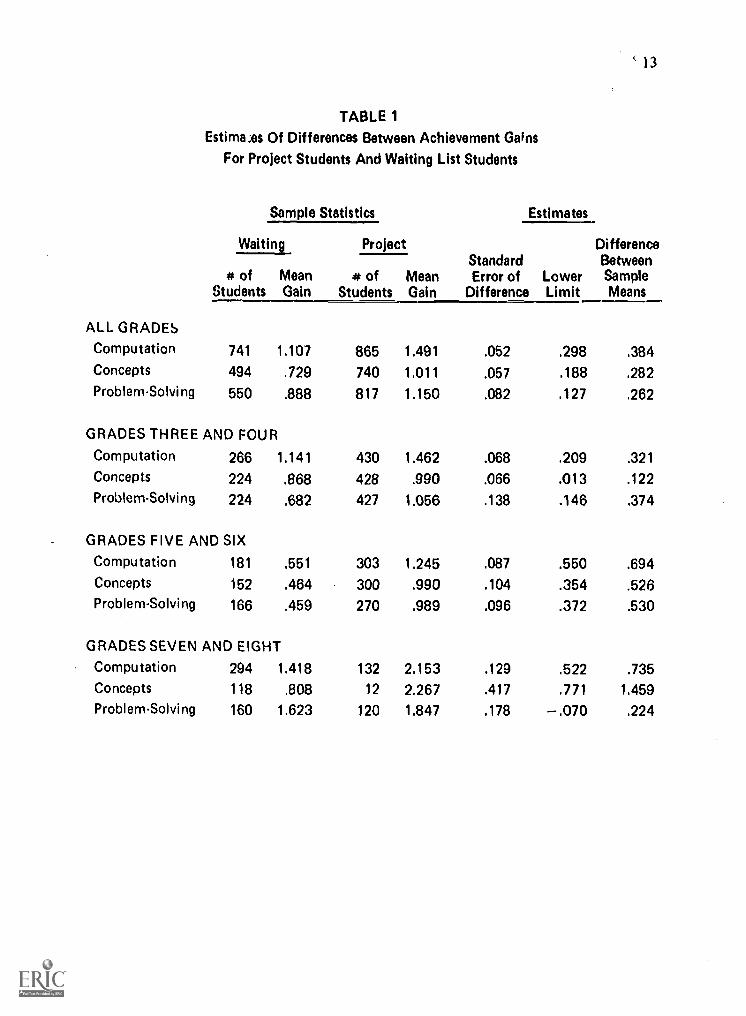
`13
TABLE 1
Estimates Of Differences Between Achievement Gains
For Project Students And Waiting List Students
ALL GRADES
Sample Statistics Estimates
Waiting ProjectStandardError of
DifferenceLowerLimit
DifferenceBetweenSampleMeans
* ofStudents
MeanGain
# ofStudents
MeanGain
Computation 741 1.107 865 1.491 .052 .298 .384Concepts 494 .729 740 1.011 .057 .188 .282Problem-Solving 550 .888 817 1.150 .082 .127 .262
GRADES THREE AND FOUR
Computation 266 1.141 430 1.462 .068 .209 .321
Concepts 224 .868 428 .990 .066 .013 .122Problem-Solving 224 .682 427 1.056 .138 .146 .374
GRADES FIVE AND SIXComputation 181 .551 303 1.245 .087 .550 .694Concepts 152 .464 300 .990 .104 .354 .526Problem-Solving 166 .459 270 .989 .096 .372 .530
GRADES SEVEN AND EIGHT
Computation 294 1.418 132 2.153 .129 .522 .735Concepts 118 .808 12 2.267 .417 .771 1.459
Problem-Solving 160 1.623 120 1.847 .178 -.070 .224
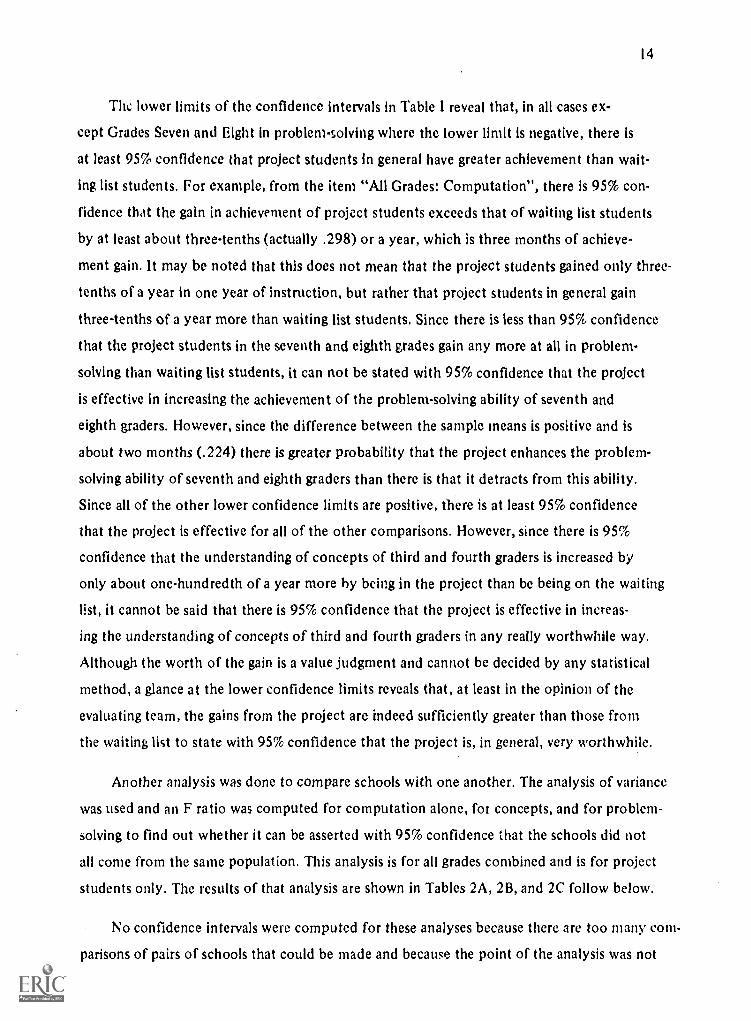
14
The lower limits of the confidence intervals in Table I reveal that, in all cases ex-
cept Grades Seven and Eight in problem-solving where the lower limit is negative, there is
at least 95% confidence that project students in general have greater achievement than wait-
ing list students. For example, from the item "All Grades: Computation", there is 95% con-
fidence that the gain in achievement of project students exceeds that of waiting list students
by at least about three-tenths (actually .298) or a year, which is three months of achieve-
ment gain. It may be noted that this does not mean that the project students gained only three-
tenths of a year in one year of instruction, but rather that project students in general gain
three-tenths of a year more than waiting list students. Since there is less than 95% confidence
that the project students in the seventh and eighth grades gain any more at all in problem-
solving than waiting list students, it can not be stated with 95% confidence that the project
is effective in increasing the achievement of the problem-solving ability of seventh and
eighth graders. However, since the difference between the sample means is positive and is
about two months (.224) there is greater probability that the project enhances the problem-
solving ability of seventh and eighth graders than there is that it detracts from this ability.
Since all of the other lower confidence limits are positive, there is at least 95% confidence
that the project is effective for all of the other comparisons. However, since there is 95%
confidence that the understanding of concepts of third and fourth graders is increased by
only about one-hundredth of a year more by being in the project than be being on the waiting
list, it cannot be said that there is 95% confidence that the project is effective in increas-
ing the understanding of concepts of third and fourth graders in any really worthwhile way.
Although the worth of the gain is a value judgment and cannot be decided by any statistical
method, a glance at the lower confidence limits reveals that, at least in the opinion of the
evaluating team, the gains from the project are indeed sufficiently greater than those from
the waiting list to state with 95% confidence that the project is, in general, very worthwhile.
Another analysis was done to compare schools with one another. The analysis of variance
was used and an F ratio was computed for computation alone, for concepts, and for problem-
solving to find out whether it can be asserted with 95% confidence that the schools did not
all conic from the same population. This analysis is for all grades combined and is for project
students only. The results of that analysis are shown in Tables 2A, 2B, and 2C follow below.
No confidence intervals were computed for these analyses because there are too many com-
parisons of pairs of schools that could be made and because the point of the analysis was not
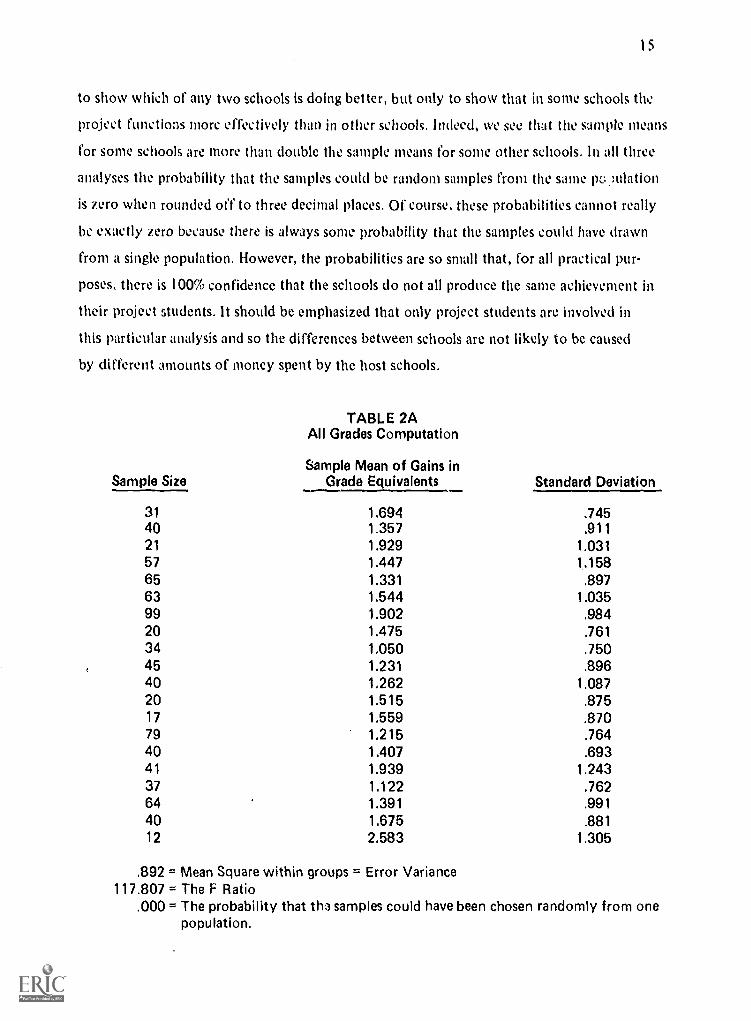
15
to show which of any two schools is doing better, but only to show that in some schools the
project functions more effectively than in other schools. indeed, we see that the sample means
for some schools are more than double the sample means for sonic other schools. In all three
analyses the probability that the samples could be random samples from the same population
is zero when rounded oft' to three decimal places. Of course, these probabilities cannot really
be exactly zero because there is always some probability that the samples could have drawn
from a single population. However, the probabilities are so small that, for all practical pur-
poses, there is 100% confidence that the schools do not all produce the same achievement in
their project students. It should be emphasized that only project students are involved in
this particular analysis and so the differences between schools are not likely to be caused
by different amounts of money spent by the host schools.
Sample Size
TABLE 2AAll Grades Computation
Sample Mean of Gains inGrade Equivalents Standard Deviation
31 1.694 .74540 1.357 .91121 1.929 1.03157 1.447 1.15865 1.331 .89763 1.544 1.03599 1.902 .98420 1.475 .76134 1,050 .75045 1.231 .89640 1,262 1.08720 1.515 .87517 1.559 .87079 1.215 .76440 1.407 .69341 1.939 1.24337 1.122 .76264 1.391 .99140 1.675 .88112 2.583 1.305
.892 = Mean Square within groups = Error Variance117.807 = The F Ratio
.000 = The probability that the samples could have been chosen randomly from onepopulation.
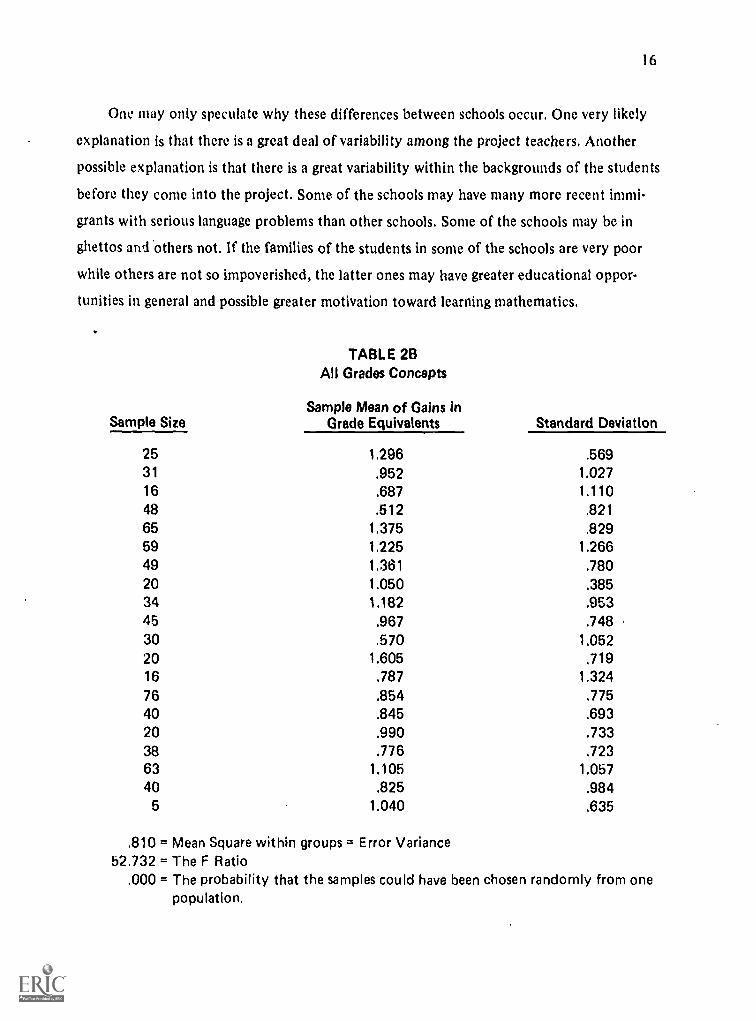
16
One may only speculate why these differences between schools occur. One very likely
explanation is that there is a great deal of variability among the project teachers, Another
possible explanation is that there is a great variability within the backgrounds of the students
before they come into the project. Some of the schools may have many more recent immi-
grants with serious language problems than other schools. Some of the schools may be in
ghettos and others not, If the families of the students in some of the schools are very poor
while others are not so impoverished, the latter ones may have greater educational oppor-
tunities in general and possible greater motivation toward learning mathematics.
Sample Size
TABLE 2BAll Grades Concepts
Sample Mean of Gains inGrade Equivalents Standard Deviation
25 1.296 .56931 .952 1.02716 .687 1.11048 .512 .82165 1.375 .82959 1.225 1.26649 1.361 .78020 1.050 .38534 1.182 .95345 .967 .74830 .570 1.05220 1.605 .71916 .787 1.32476 .854 .77540 .845 .69320 .990 .73338 .776 .72363 1.105 1.05740 .825 .984
5 1.040 .635
.810 = Mean Square within groups = Error Variance52.732 = The F Ratio
.000 = The probability that the samples could have been chosen randomly from onepopulation.
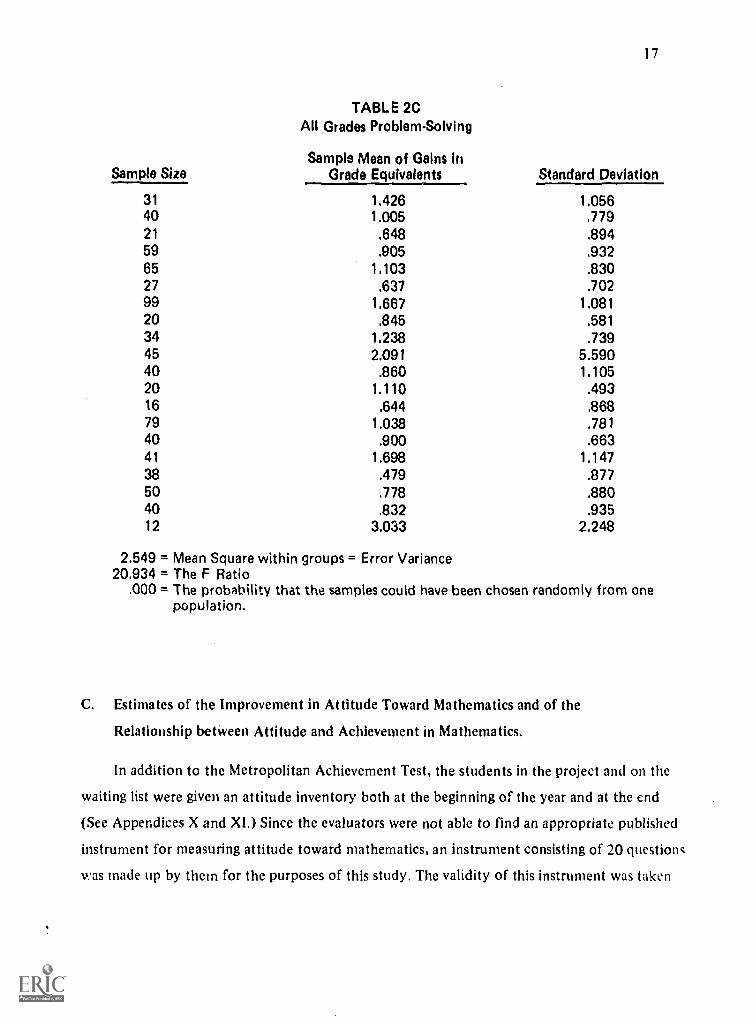
17
TABLE 2CAll Grades ProblemSolving
Sample Mean of Gains ireSample Size Grade Equivalents Standard Deviation
31 1.426 1.05640 1.005 .77921 .648 .89459 .905 .93265 1.103 .83027 .637 .70299 1.667 1.08120 .845 .58134 1.238 .73945 2.091 5.59040 .860 1.10520 1.110 .49316 .644 .86879 1.038 .78140 .900 .66341 1.698 1.14738 .479 .87750 .778 .88040 .832 .93512 3.033 2.248
2.549 = Mean Square within groups = Error Variance20.934 = The F Ratio
.000 = The probability that the samples could have been chosen randomly from onepopulation.
C. Estimates of the Improvement in Attitude Toward Mathematics and of the
Relationship between Attitude and Achievement in Mathematics.
In addition to the Metropolitan Achievement Test, the students in the project and on the
waiting list were given an attitude inventory both at the beginning of the year and at the end
(See Appendices X and Xl.) Since the evaluators were not able to find an appropriate published
instrument for measuring attitude toward mathematics, an instrument consisting of 20 questionc
was made up by them for the purposes of this study. The validity of this instrument was taken
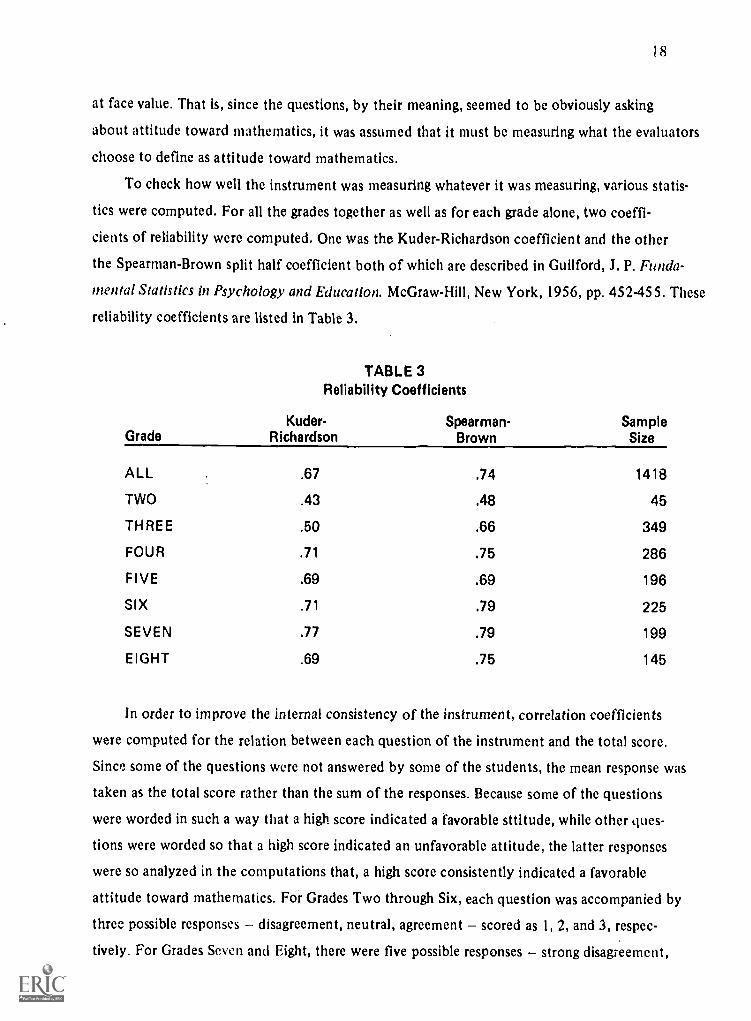
18
at face value. That is, since the questions, by their meaning, seemed to be obviously asking
about attitude toward mathematics, it was assumed that it must be measuring what the evaluators
choose to define as attitude toward mathematics.
To check how well the instrument was measuring whatever it was measuring, various statis-
tics were computed. For all the grades together as well as for each grade alone, two coeffi-
cients of reliability were computed. One was the Kuder-Richardson coefficient and the other
the Spearman-Brown split half coefficient both of which are described in Guilford, J. P. Funda-
mental Statistics in Psychology and Education. McGraw-Hill, New York, 1956, pp. 452455. These
reliability coefficients are listed in Table 3.
TABLE 3
Reliability Coefficients
GradeKuder-
RichardsonSpearman-
BrownSampleSize
ALL .67 .74 1418
TWO .43 .48 45
THREE .50 .66 349
FOUR .71 .75 286
FIVE .69 .69 196
SIX .71 .79 225
SEVEN .77 .79 199
EIGHT .69 .75 145
In order to improve the internal consistency of the instrument, correlation coefficients
were computed for the relation between each question of the instrument and the total score.
Since some of the questions were not answered by some of the students, the mean response was
taken as the total score rather than the sum of the responses. Because some of the questions
were worded in such a way that a high score indicated a favorable sttitude, while other ques-
tions were worded so that a high score indicated an unfavorable attitude, the latter responses
were so analyzed in the computations that, a high score consistently indicated a favorable
attitude toward mathematics. For Grades Two through Six, each question was accompanied by
three possible responses disagreement, neutral, agreement scored as 1, 2, and 3, respec-
tively. For Grades Seven and Fight, there were five possible responses strong disagreement,
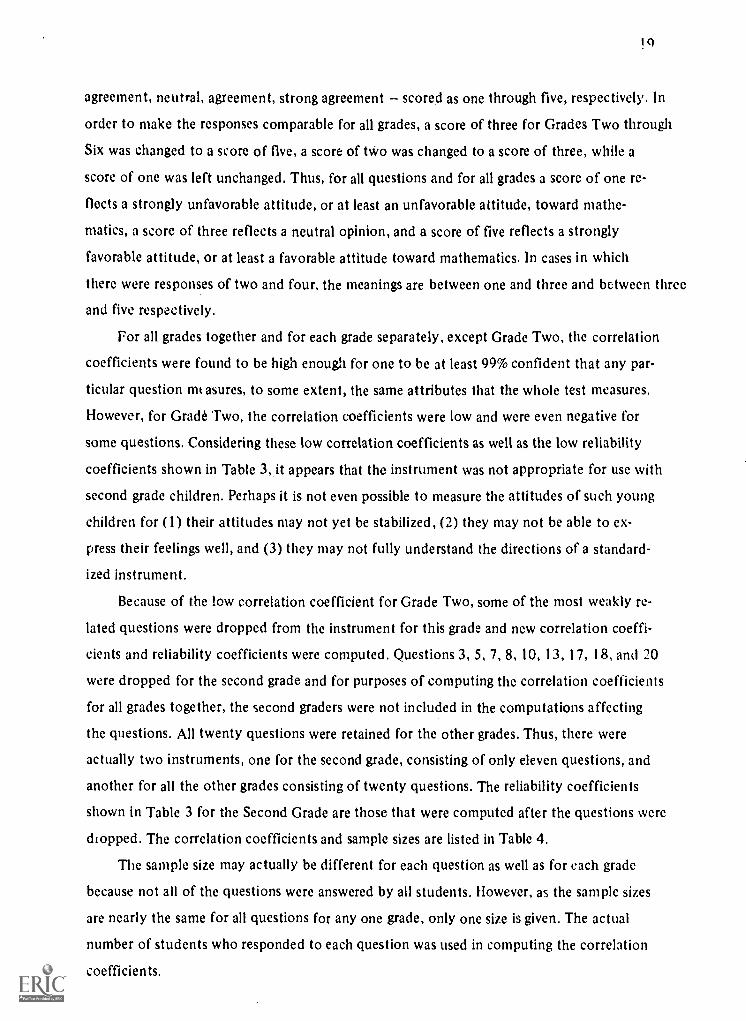
agreement, neutral, agreement, strong agreement scored as one through five, respectively. In
order to make the responses comparable for all grades, a score of three for Grades Two through
Six was changed to a score of five, a score of two was changed to a score of three, while a
score of one was left unchanged. Thus, for all questions and for all grades a score of one re-
flects a strongly unfavorable attitude, or at least an unfavorable attitude, toward mathe-
matics, a score of three reflects a neutral opinion, and a score of five reflects a strongly
favorable attitude, or at least a favorable attitude toward mathematics. In cases in which
there were responses of two and four, the meanings are between one and three and between three
and five respectively.
For all grades together and for each grade separately, except Grade Two, the correlation
coefficients were found to be high enough for one to be at least 99% confident that any par-
ticular question mt asures, to some extent, the same attributes that the whole test measures.
However, for Grade Two, the correlation coefficients were low and were even negative for
some questions. Considering these low correlation coefficients as well as the low reliability
coefficients shown in Table 3, it appears that the instrument was not appropriate for use with
second grade children. Perhaps it is not even possible to measure the attitudes of such young
children for (1) their attitudes may not yet be stabilized, (2) they may not be able to ex-
press their feelings well, and (3) they may not fully understand the directions of a standard-
ized instrument.
Because of the low correlation coefficient for Grade Two, some of the most weakly re-
lated questions were dropped from the instrument for this grade and new correlation coeffi-
cients and reliability coefficients were computed. Questions 3, 5, 7, 8, 10, 13, 17, 18, and 20
were dropped for the second grade and for purposes of computing the correlation coefficients
for all grades together, the second graders were not included in the computations affecting
the questions. All twenty questions were retained for the other grades. Thus, there were
actually two instruments, one for the second grade, consisting of only eleven questions, and
another for all the other grades consisting of twenty questions. The reliability coefficients
shown in Table 3 for the Second Grade are those that were computed after the questions were
chopped. The correlation coefficients and sample sizes are listed in Table 4.
The sample size may actually be different for each question as well as for each grade
because not all of the questions were answered by all students. However, as the sample sizes
are nearly the same for all questions for any one grade, only one size is given. The actual
number of students who responded to each question was used in computing the correlation
coefficients.
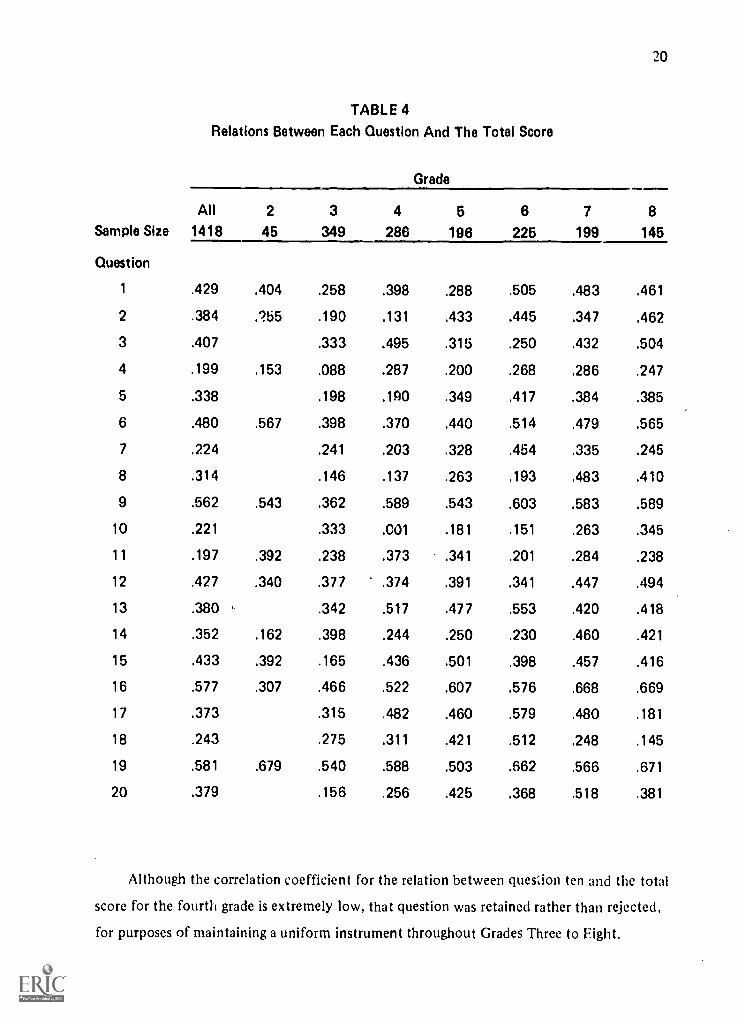
20
TABLE 4
Relations Between Each Question And The Total Score
Grade
All 2 3 4 5 6 7 8
Sample Size 1418 45 349 286 196 225 199 145
Question
1 .429 .404 .258 .398 .288 .505 .483 .461
2 .384 .255 .190 .131 .433 .445 .347 .462
3 .407 .333 .495 .315 .250 .432 .504
4 .199 .153 .088 .287 .200 .268 .286 .247
5 .338 .198 .190 .349 .417 .384 .385
6 .480 .567 .398 .370 .440 .514 .479 .565
7 .224 .241 .203 .328 .454 .335 .245
8 .314 .146 .137 .263 .193 .483 .410
9 .562 .543 .362 .589 .543 .603 .583 .589
10 .221 .333 .001 .181 .151 .263 .345
11 .197 .392 .238 .373 .341 .201 .284 .238
12 .427 .340 .377 .374 .391 .341 .447 .494
13 .380 .342 .517 .477 .553 .420 .418
14 .352 .162 .398 .244 .250 .230 .460 .421
15 .433 .392 .165 .436 .501 .398 .457 .416
16 .577 .307 .466 .522 .607 .576 .668 .669
17 .373 .315 .482 .460 .579 .480 .181
18 .243 .275 .311 .421 .512 .248 .145
19 .581 .679 .540 .588 .503 .662 .566 .671
20 .379 .156 .256 .425 .368 .518 .381
Although the correlation coefficient for the relation between question ten and the total
score for the fourth grade is extremely low, that question was retained rather than rejected,
for purposes of maintaining a uniform instrument throughout Grades Three to Eight.
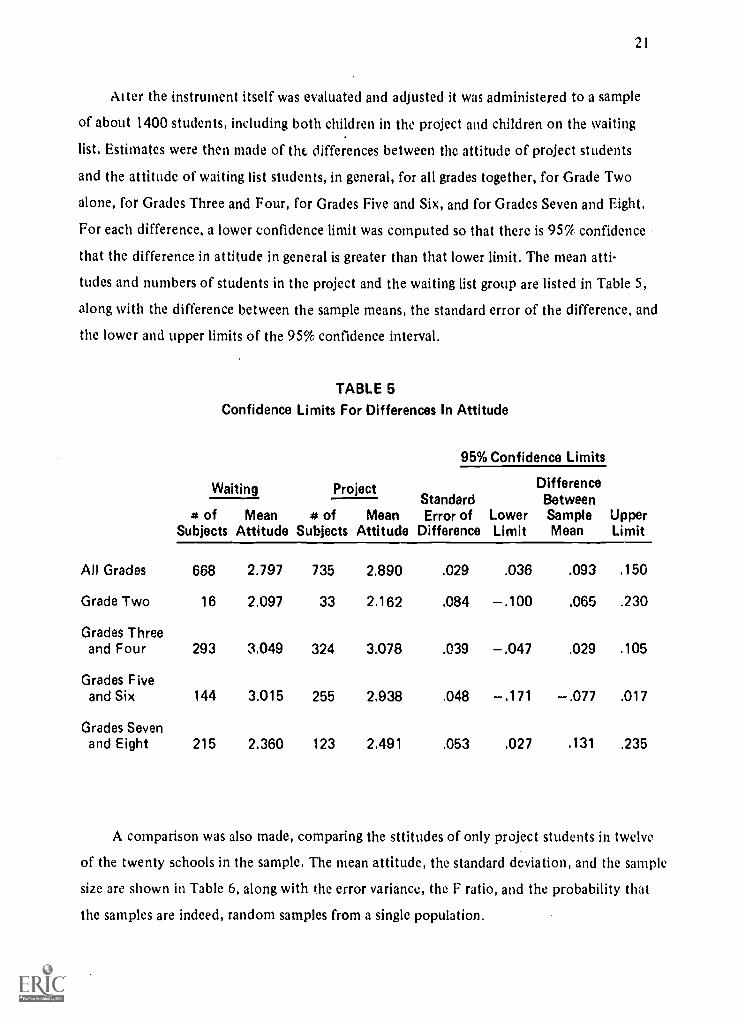
21
Alter the instrument itself was evaluated and adjusted it was administered to a sample
of about 1400 students, including both children in the project and children on the waiting
list. Estimates were then made of the_ differences between the attitude of project students
and the attitude of waiting list students, in general, for all grades together, for Grade Two
alone, for Grades Three and Four, for Grades Five and Six, and for Grades Seven and Eight.
For each difference, a lower confidence limit was computed so that there is 95% confidence
that the difference in attitude in general is greater than that lower limit. The mean atti-
tudes and numbers of students in the project and the waiting list group are listed in Table 5,
along with the difference between the sample means, the standard error of the difference, and
the tower and upper limits of the 95% confidence interval.
TABLE 5Confidence Limits For Differences In Attitude
Waiting Project
95% Confidence Limits
UpperLimit
StandardError of Lower
Difference Limit
DifferenceBetweenSampleMean
# of Mean # of MeanSubjects Attitude Subjects Attitude
All Grades 668 2.797 735 2.890 .029 .036 .093 .150
Grade Two 16 2.097 33 2.162 .084 .100 .065 .230
Grades Threeand Four 293 3.049 324 3.078 .039 .047 .029 .105
Grades Fiveand Six 144 3.015 255 2.938 .048 .171 .077 .017
Grades Sevenand Eight 215 2.360 123 2.491 .053 .027 .131 .235
A comparison was also made, comparing the sttitudes of only project students in twelve
of the twenty schools in the sample. The mean attitude, the standard deviation, and the sample
size are shown in Table 6, along with the error variance, the F ratio, and the probability that
the samples are indeed, random samples from a single population.
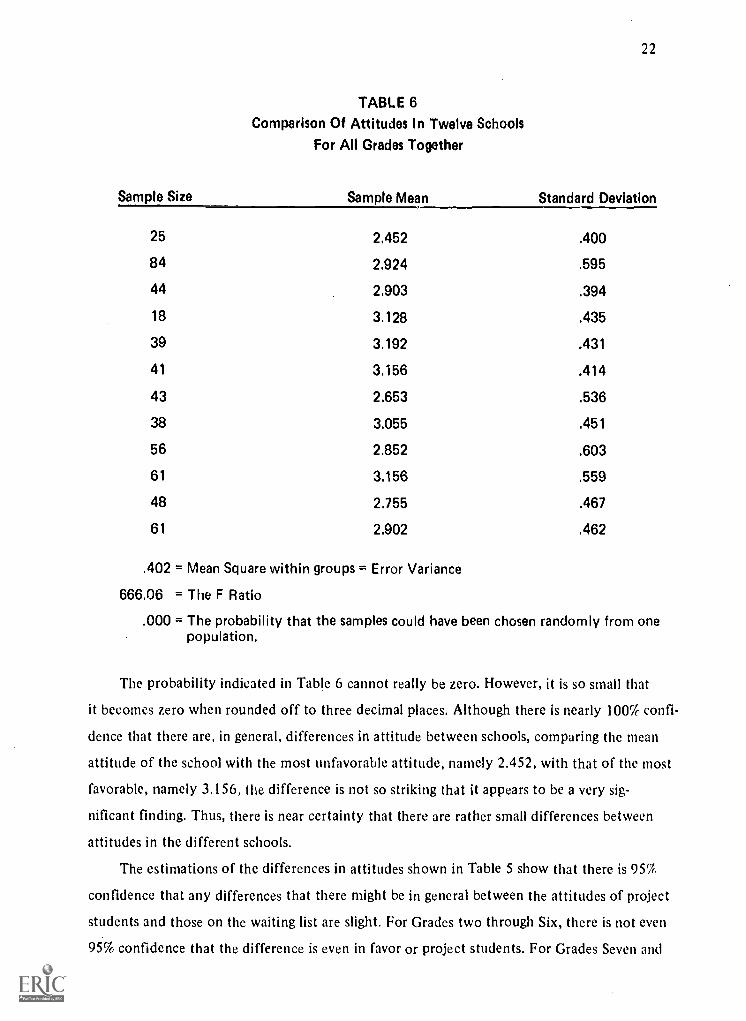
Sample Size
22
TABLE 6Comparison Of Attitudes In Twelve Schools
For All Grades Together
Sample Mean Standard Deviation
25 2,452 .400
84 2.924 .595
44 2.903 .394
18 3.128 .435
39 3.192 .431
41 3.156 .414
43 2.653 .536
38 3.055 .451
56 2.852 .603
61 3.156 .559
48 2.755 .467
61 2.902 .462
.402 = Mean Square within groups = Error Variance
666.06 = The F Ratio
.000 = The probability that the samples could have been chosen randomly from onepopulation.
The probability indicated in Table 6 cannot really be zero. However, it is so small that
it becomes zero when rounded off to three decimal places, Although there is nearly 100% confi-
dence that there are, in general, differences in attitude between schools, comparing the mean
attitude of the school with the most unfavorable attitude, namely 2.452, with that of the most
favorable, namely 3.156, the difference is not so striking that it appears to be a very sig-
nificant finding. Thus, there is near certainty that there, are rather small differences between
attitudes in the different schools.
The estimations of the differences in attitudes shown in Table 5 show that there is 95%
confidence that any differences that there might be in general between the attitudes of project
students and those on the waiting list are slight. For Grades two through Six, there is not even
95% confidence that the difference is even in favor or project students. For Grades Seven and
23
Eight and for all the grades together, there is 95% confidence that project students in gen-
eral have a more favorable attitude toward mathematics than those on the waiting list. How-
ever, the differences are so slight that in the opinion of the evaluators, they can hardly
be considered important. Indeed, since the attitudes were measured on a five point scale, it
is again the opinion of the evaluators that even a difference of .235 on a five point scale
is not enough to be considered noteworthy. Since there is 95% confidence that all of the dif-
ferences are less than .235, and since there is 95% confidence that the differences for most
of the grades are a great deal less than that, there is very little evidence to support any
claim that the project has any considerable effect upon the attitude of students toward
mathematics.
One may only conjecture why the project has no substantial effect upon the attitudes of
students toward mathematics. Furthermore, this seems to contradict a later finding (Chapter
III, Part A) that there is no worthwhile relation between attendance and achievement. If it
is speculated that the reason that attendance has no worthwhile effect upon achievement is
that by merely participating in the project a student is motivated to learn mathematics, then
it would appear that this same student's attitude toward mathematics should be appreciably
more improved than that of a student on the waiting list. Since this was not the case in this
study, it may be that the project students do not associate the benefits of the project with
mathematics itself, that is, whereas they may derive increased security and self-concept from
participation in the project, they still maintain mildly unfavorable attitudes toward the ac-
tual subject matter of mathematics. It may be noted from Table 5 that the mean attitudes are
generally about 3 or somewhat less than 3, which means that the overall attitudes toward mathe-
matics of both project students and waiting list students are either neutral or somewhat un-
favorable. Apparently, the initial attitudes of project students toward mathematics are suf-
ficiently unfavorable so that the project has little or no effect upon them, even though the
comparison of achievement presented earlier shows that there is at least 95% confidence that
the project does indeed improve achievement.
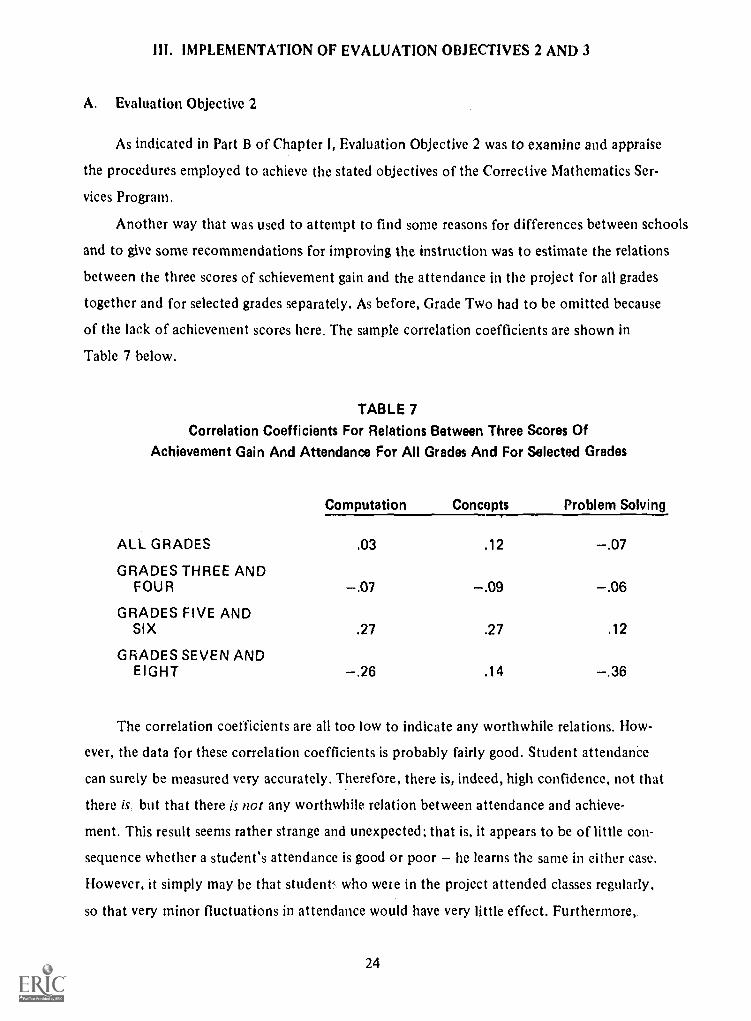
III. IMPLEMENTATION OF EVALUATION OBJECTIVES 2 AND 3
A. Evaluation Objective 2
As indicated in Part B of Chapter 1, Evaluation Objective 2 was to examine and appraise
the procedures employed to achieve the stated objectives of the Corrective Mathematics Ser-
vices Program.
Another way that was used to attempt to find some reasons for differences between schools
and to give some recommendations for improving the instruction was to estimate the relations
between the three scores of schievement gain and the attendance in the project for all grades
together and for selected grades separately. As before, Grade Two had to be omitted because
of the lack of achievement scores here. The sample correlation coefficients are shown in
Table 7 below.
TABLE 7Correlation Coefficients For Relations Between Three Scores Of
Achievement Gain And Attendance For All Grades And For Selected Grades
Computation Concepts Problem Solving
ALL GRADES .03 .12 .07GRADES THREE AND
FOUR .07 .09 .06GRADES FIVE AND
SIX .27 .27 .12
GRADES SEVEN ANDEIGHT .26 .14 .36
The correlation coefficients are all too low to indicate any worthwhile relations. How-
ever, the data for these correlation coefficients is probably fairly good. Student attendance
can surely be measured very accurately. Therefore, there is, indeed, high confidence, not that
there is but that there is not any worthwhile relation between attendance and achieve-
ment. This result seems rather strange and unexpected; that is, it appears to be of little con-
sequence whether a student's attendance is good or poor he learns the same in either case.
However, it simply may be that student, who were in the project attended classes regularly,
so that very minor fluctuations in attendance would have very little effect. Furthermore,
24
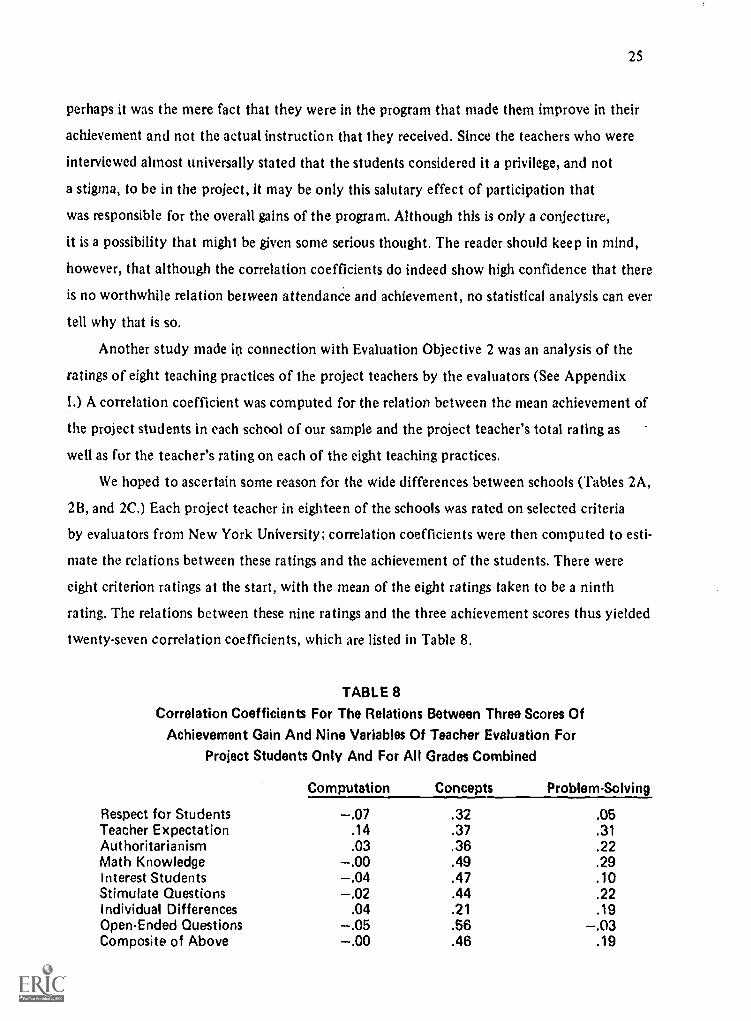
25
perhaps it was the mere fact that they were in the program that made them improve in their
achievement and not the actual instruction that they received. Since the teachers who were
interviewed almost universally stated that the students considered it a privilege, and not
a stigma, to be in the project, it may be only this salutary effect of participation that
was responsible for the overall gains of the program. Although this is only a conjecture,
it is a possibility that might be given some serious thought. The reader should keep in mind,
however, that although the correlation coefficients do indeed show high confidence that there
is no worthwhile relation between attendanCe and achievement, no statistical analysis can ever
tell why that is so.
Another study made in connection with Evaluation Objective 2 was an analysis of the
ratings of eight teaching practices of the project teachers by the evaluators (See Appendix
I.) A correlation coefficient was computed for the relation between the mean achievement of
the project students in each school of our sample and the project teacher's total rating as
well as for the teacher's rating on each of the eight teaching practices.
We hoped to ascertain some reason for the wide differences between schools (Tables 2A,
2B, and 2C.) Each project teacher in eighteen of the schools was rated on selected criteria
by evaluators from New York University; correlation coefficients were then computed to esti-
mate the relations between these ratings and the achievement of the students. There were
eight criterion ratings at the start, with the mean of the eight ratings taken to be a ninth
rating. The relations between these nine ratings and the three achievement scores thus yielded
twenty-seven correlation coefficients, which are listed in Table 8.
TABLE 8
Correlation Coefficients For The Relations Between Three Scores Of
Achievement Gain And Nine Variables Of Teacher Evaluation For
Project Students Only And For All Grades Combined
Computation Concepts Problem-Solving
Respect for Students .07 .32 .05Teacher Expectation .14 .37 .31Authoritarianism .03 .36 .22Math Knowledge .00 .49 .291 nterest Students .04 .47 .10Stimulate Questions .02 .44 .22individual Differences .04 .21 .19Open-Ended Questions .05 .56 .03Composite of Above .00 .46 .19
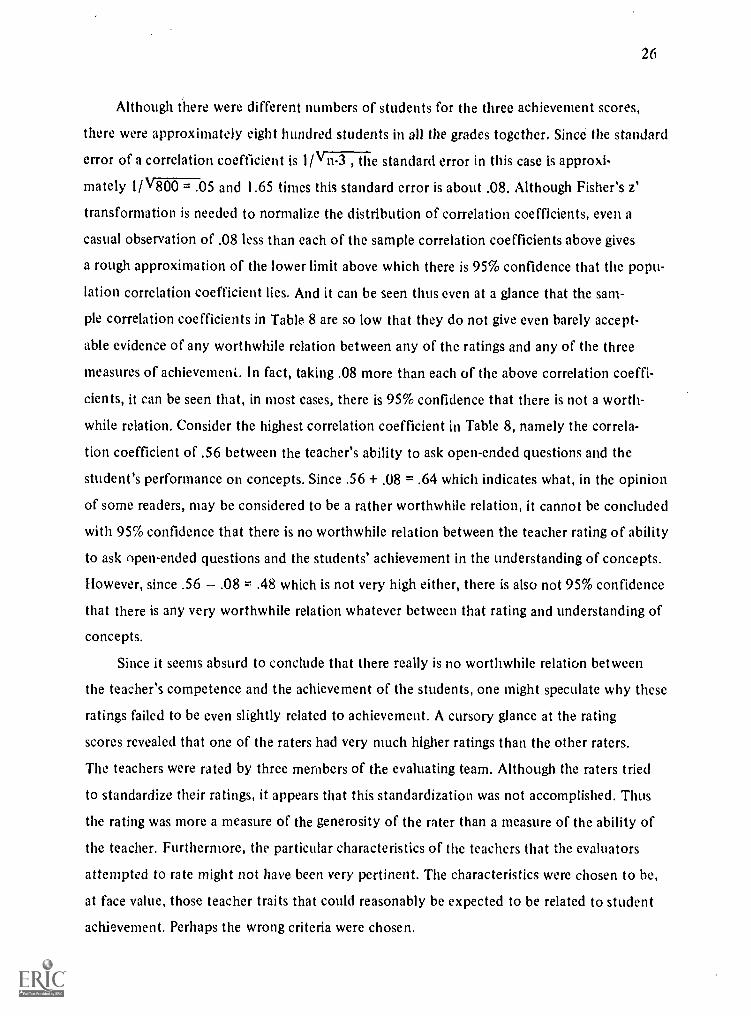
26
Although there were different numbers of students for the three achievement scores,
there were approximately eight hundred students in all the grades together. Since the standard
error of a correlation coefficient is standard error in this case is approxi-
mately 1/V800 = .05 and 1.65 times this standard error is about .08. Although Fisher's z'
transformation is needed to normalize the distribution of correlation coefficients, even a
casual observation of .08 less than each of the sample correlation coefficients above gives
a rough approximation of the lower limit above which there is 95% confidence that the popu-
lation correlation coefficient lies. And it can be seen thus even at a glance that the sam-
ple correlation coefficients in Table 8 are so low that they do not give even barely accept-
able evidence of any worthwhile relation between any of the ratings and any of the three
measures of achievement. In fact, taking .08 more than each of the above correlation coeffi-
cients, it can be seen that, in most cases, there is 95% confidence that there is not a worth-
while relation. Consider the highest correlation coefficient in Table 8, namely the correla-
tion coefficient of .56 between the teacher's ability to ask open-ended questions and the
student's performance on concepts. Since .56 + .08 = .64 which indicates what, in the opinion
of some readers, may be considered to be a rather worthwhile relation, it cannot be concluded
with 95% confidence that there is no worthwhile relation between the teacher rating of ability
to ask open-ended questions and the students' achievement in the understanding of concepts.
However, since .56 .08 = .48 which is not very high either, there is also not 95% confidence
that there is any very worthwhile relation whatever between that rating and understanding of
concepts.
Since it seems absurd to conclude that there really is no worthwhile relation between
the teacher's competence and the achievement of the students, one might speculate why these
ratings failed to be even slightly related to achievement. A cursory glance at the rating
scores revealed that one of the raters had very much higher ratings than the other raters.
The teachers were rated by three members of the evaluating team. Although the raters tried
to standardize their ratings, it appears that this standardization was not accomplished. Thus
the rating was more a measure of the generosity of the rater than a measure of the ability of
the teacher. Furthermore, the particular characteristics of the teachers that the evaluators
attempted to rate might not have been very pertinent. The characteristics were chosen to he,
at face value, those teacher traits that could reasonably be expected to be related to student
achievement. Perhaps the wrong criteria were chosen.
27
One of the procedures employed in the program involved assigning of teachers in accord-
ance with school needs. Certainly, the existence of a sizable waiting list in almost all of
the schools indicates that an expansion of the program would be required in order to carry
out this procedure satisfactorily. Moreover, the fact that 49 schools, or about one-third of
the 149 schools in the program, received less than two days of service (See Chapter I, Part A)
also indicates that an expansion of the program would be required in order to carry out this
procedure successfully. We say this because we feel that each school should be serviced at
least two full days a week since the occurrence of many school holidays makes this amount of
service quite necessary in most cases. We draw attention to questions 6 and 7 on the Ques-
tionnaire to Project Teachers (Appendices IV and V) in this connection. Question 6 reads:
"How many time a week do you meet each student in your program?" The mean response was
2.3 times (66 respondents). Question 7 reads: "Do you feel that the number of times given
in Question 6 should be decreased, left the same, or increased?" Weights of 1, 2, and 3
were assigned to the preceding responses, respectively. The mean response was 2.6. (64 re-
spondents). Thus, these project teachers tended to think that the number of days of ser-
vice for each student should be increased.
Another procedure employed in the program involved providing teachers with in-service
training. We draw attention to the questions 12 through 19 in the Questionnaire to Project
Teachers since they relate to the training experiences that have been offered to the project
teachers. We also draw attention to questions 36 and 39 on the Questionnaire to Project
Teachers. Question 36 reads: "How would you rate the training experiences you have re-
ceived since entering the program in diagnosing the remediating pupils' learning difficul-
ties in mathematics? (Check one): Very Helpful, Helpful, Little Help, and No Help." Weights
of 1, 2, 3, and 4 were assigned to these responses, respectively with the mean response 2.4.
(52 respondents). Question 39 reads: "How would you rate the training you have received
in the use of appropriate instructional materials? (Check one): Very Helpful, Helpful, Little
Help, and No Help." Assigning weights as in Question 39 we found the mean response to be
2.0. (63 respondents).
Another procedure employed in the program involved providing instructional materials and
necessary equipment. We draw attention to the responses of the project teachers to Question 27
in the Questionnaire to Project Teachers. This question reads: "How useful do you find the
materials which are provided for your classroom? (Check one): Very Useful, Somewhat Useful,
Useless, Hinders Learning." Weights of 1, 2, 3, and 4 were assigned to these responses,
28
respectively. The mean responses of the project teachers was 1.16. (64 respondents). This
signifies that in the opinion of these teachers the materials provided were rather useful.
A room deemed adequate for the needs of small group instruction was to be made avail-
able by the non-public school. In order to ascertain the degree to which this procedure was
carried out, the evaluators appealed to Question 29 in the Questionnaire to Project Teachers.
This question reads as follows: "How would you rate the room facilities provided for your
corrective class? (Check one): Satisfactory, Unsatisfactory." Weights of I and 2 were as-
signed to the responses "Satisfactory," and "Unsatisfactory," respectively. The mean re-
sponse was 1.2. (65 respondents). Thus, in the opinion of these teachers the room was a little
less than satisfactory.
One of the procedures employed in the program was to give instruction to groups of approxi-
mately ten pupils. In this connection we draw attention to Questions 1 and 2 on the Question-
naire to Project Teachers. Question I asks the teacher for the total number of pupils in the
corrective mathematics classes and Question 2 asks him for the total number of corrective
classes he teaches. The total of the answers to Question 1 by the 64 project teachers was
3891 pupils. (65 respondents). The mean response to Question 2 was 7.3 classes per week. (65
respondents). From these data we find that "on the average" each corrective mathematics
class had 8.3 pupils.
B. Evaluation Objective 3 (Recommendations)
1. The pre-testing must be done in the fall despite the complaint of the non-public
school supervisors. For without both a pre-test and a post-test score obtained according to
a consistent schedule, it is difficult to measure pupil progress validly.
2. The practice in some schools of having a corrective mathematics teacher see the
same children on each of three or four days under an experimental program yielded signifi-
cantly better results than those made by the children receiving two periods of remedial in-
struction. The practice should be extended.
3. The supervisors should extend the practice of working with, and talking to, indi-
vidual children during their visits to the schools.
4. The corrective teacher should write some sort of progress report (not a grade) peri-
odically during the year about each child in the corrective program. These reports might be
cent borne to parents and/or to the regular teacher.
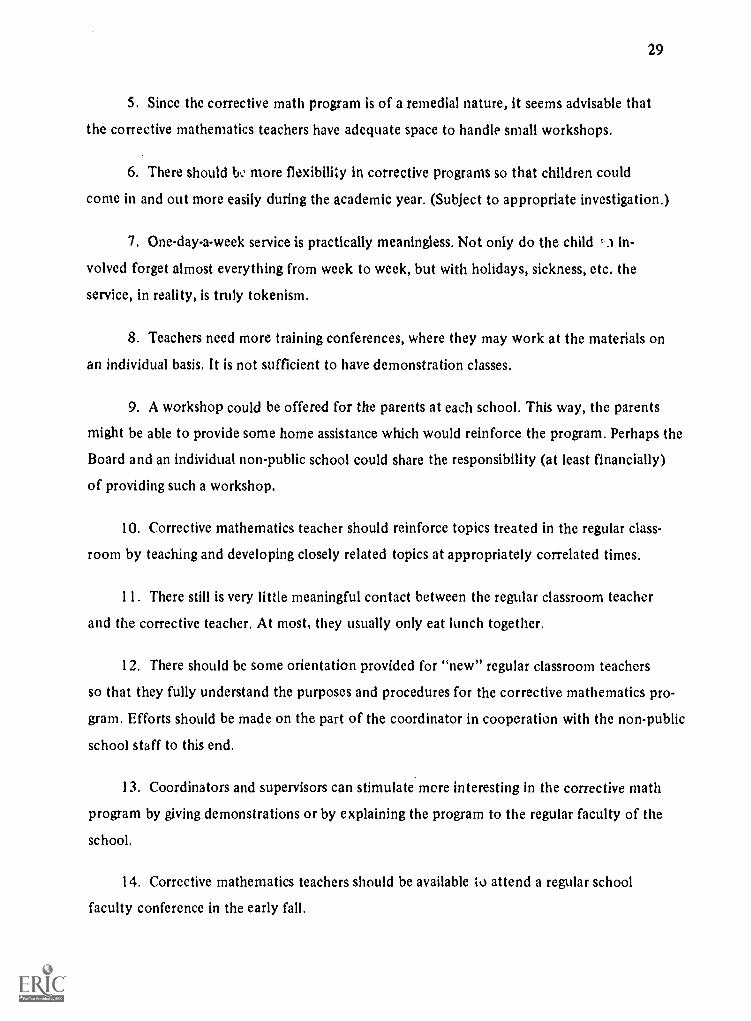
29
5. Since the corrective math program is of a remedial nature, it seems advisable that
the corrective mathematics teachers have adequate space to handle small workshops.
6. There should more flexibility in corrective programs so that children could
come in and out more easily during the academic year. (Subject to appropriate investigation.)
7. One-day-a-week service is practically meaningless. Not only do the child 'I in-
volved forget almost everything from week to week, but with holidays, sickness, etc. the
service, in reality, is truly tokenism.
8. Teachers need more training conferences, where they may work at the materials on
an individual basis. It is not sufficient to have demonstration classes.
9. A workshop could be offered for the parents at each school. This way, the parents
might be able to provide some home assistance which would reinforce the program. Perhaps the
Board and an individual non-public school could share the responsibility (at least financially)
of providing such a workshop.
10. Corrective mathematics teacher should reinforce topics treated in the regular class-
room by teaching and developing closely related topics at appropriately correlated times.
11. There still is very little meaningful contact between the regular classroom teacher
and the corrective teacher. At most, they usually only eat lunch together.
12. There should be some orientation provided for "new" regular classroom teachers
so that they fully understand the purposes and procedures for the corrective mathematics pro-
gram. Efforts should be made on the part of the coordinator in cooperation with the non-public
school staff to this end.
13. Coordinators and supervisors can stimulate more interesting in the corrective math
program by giving demonstrations or by explaining the program to the regular faculty of the
school.
14. Corrective mathematics teachers should be available to attend a regular school
faculty conference in the early fall.
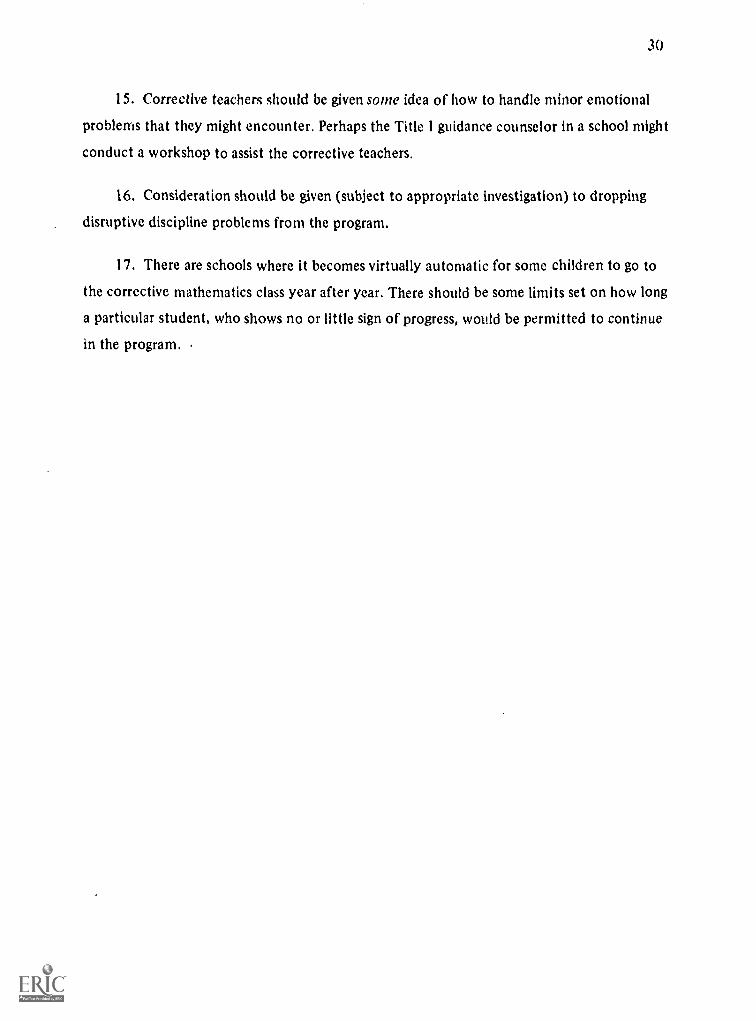
30
15. Corrective teachers should be given some idea of how to handle minor emotional
problems that they might encounter. Perhaps the Title 1 guidance counselor in a school might
conduct a workshop to assist the corrective teachers.
16. Consideration should be given (subject to appropriate investigation) to dropping
disruptive discipline problems from the program.
17. There are schools where it becomes virtually automatic for some children to go to
the corrective mathematics class year after year. There should be some limits set on how long
a particular student, who shows no or little sign of progress, would be permitted to continue
in the program.
31
APPENDICES

APPENDIX ITITLE I CORRECTIVE PROGRAMS IN THE NON-PUBLIC SCHOOLS
GUIDELINES FOR INTERVIEWS WITH PROJECT TEACHERCORRECTIVE MATHEMATICS PROGRAM 1971.1972
School Date
32
Teacher's Name Observer
1. Total Number of Pupils in Corrective Classes
2. Total Number of Corrective Classes taught
3. Total Number of Pupils on Waiting List
4. Lowest grade level you teach
5. Highest grade level you teach
6. educational background of project teacher:College(s) Degree(s) Date(s) Major(s)
7. List collegiate courses in mathematics and mathematics pedagogy which you have takenwithin the last five years.
8, Which of the courses listed in question 7 do you think have been the most helpful to youin your work in the corrective mathematics program? (List no more than five).
9. Teaching experience of project teacher:Grade(s) Subject(s) taught
10. Additional comments that might bear upon this evaluation.
No. of Years

33
APPENDIX I (Continued)TITLE I CORRECTIVE PROGRAMS IN THE NON-PUBLIC SCHOOLS
RATING SHEET FOR CLASSROOM PERFORMANCE ANDGENERAL ACADEMIC ATMOSPHERE
CORRECTIVE MATHEMATICS PROGRAM 1971.1972
Name of School
Observer Date
1. Respect of the project teacher forthe students
2. The project teacher's expectationof the students' academic achieve-ment
3. Authoritarianism of the projectteacher
4. Project teacher's knowledge ofsubject matter
5. Project teacher's ability to interesther(his) students
6. Project teacher's ability to stimulatestudent questions and/or group dis-cussion
7. Project teacher's ability to providefor individual differences amongstudents
8. Project teacher's ability to askopen-ended questions
Low = 1 2 3 4 5 6 7 = High

APPENDIX IITITLE I CORRECTIVE PROGRAMS IN THE NON-PUBLIC SCHOOLS
GUIDELINES FOR INTERVIEWS WITH PRINCIPALSCORRECTIVE MATHEMATICS PROGRAM 1971.1972
School Date
34
Principal's Name Observer
1. What is the approximate enrollment of your school?
2. In what ways do you believe that coordinators and supervisors can be most effective inhelping the project teacher to conduct the math program in your school?
3. How profitable do you feel this program is for your school?
4. Additional comments that might bear upon this evaluation.
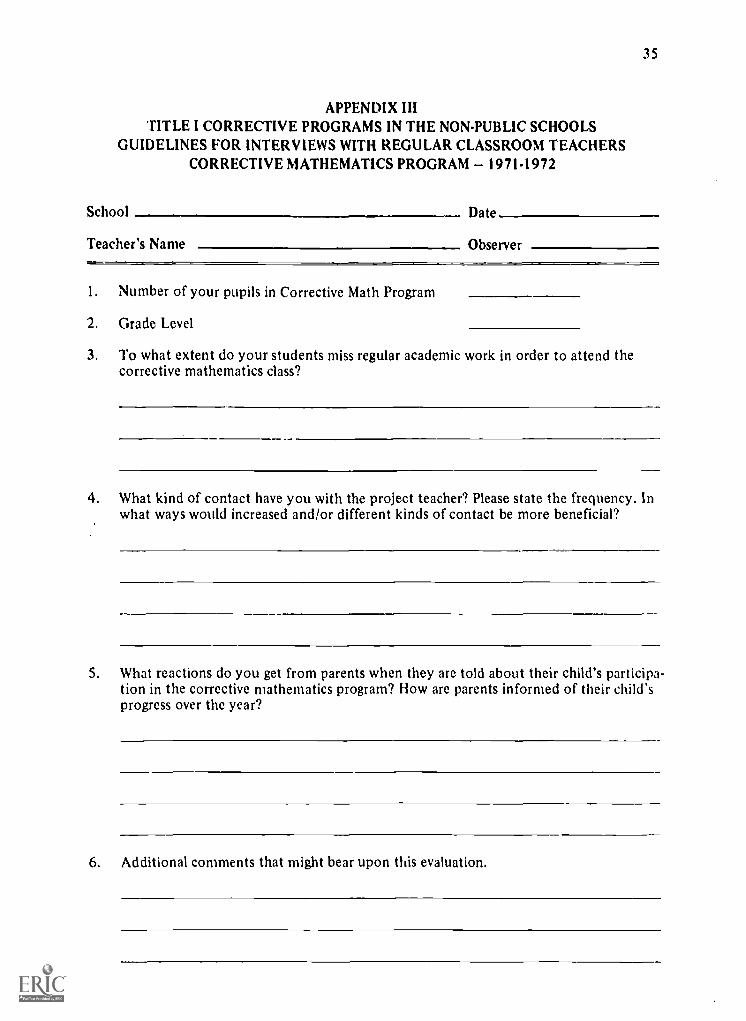
APPENDIX IIITITLE I CORRECTIVE PROGRAMS IN THE NON-PUBLIC SCHOOLS
GUIDELINES FOR INTERVIEWS WITH REGULAR CLASSROOM TEACHERSCORRECTIVE MATHEMATICS PROGRAM 1971.1972
School Date
35
Teacher's Name Observer
1. Number of your pupils in Corrective Math Program
2. Grade Level
3. To what extent do your students miss regular academic work in order to attend thecorrective mathematics class?
4. What kind of contact have you with the project teacher? Please state the frequency. Inwhat ways would increased and/or different kinds of contact be more beneficial?
5. What reactions do you get from parents when they are told about their child's participa-tion in the corrective mathematics program? How are parents informed of their child'sprowess over the year?
6. Additional comments that might bear upon this evaluation.

APPENDIX IVTITLE 1 CORRECTIVE PROGRAM IN THE NON-PUBLIC SCHOOLS
QUESTIONNAIRE TO PROJECT TEACHERCORRECTIVE MATHEMATICS PROGRAM 19714972
PLEASE RESPOND ANONYMOUSLY
1. Total number of pupils in your corrective math classes
2. Total number of corrective classes taught
3. Total number of pupils on waiting list
4. Lowest grade level you teach
5. Highest grade level you teach
6. Now many times a week do you meet each student in your program?
7. Do you feel that the number of times given in question 6 should be:
Decreased
36
Left the same Increased
8. For how many years, including the present as one full year, have youtaught in the corrective math program?
9. Give the total number of years you have taught in elementary orjunior high school. Include the present year as one full year.
10. Check the degrees you hold:
Baccalaureate Masters Doctorate
11. Please list any courses you are currently taking:
How would you rate the training experiences you have received since entering the program?(Refer to questions 12-17).
12. Pre-trainingorientationmeetings
13. Weekly in-servicesessions withsupervisors
Number Very Little orAttended Helpful Helpful No Help Harmful
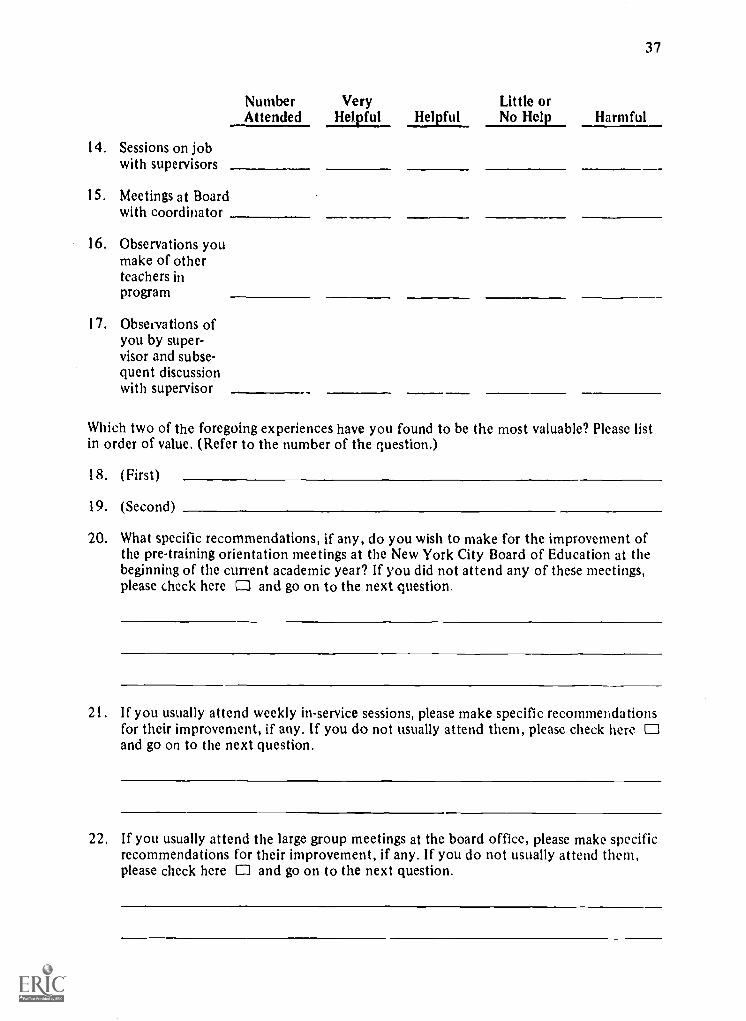
Number Very Little orAttended _Helpful Helpful No Help Harmful
14. Sessions on jobwith supervisors
I S. Meetings at Boardwith coordinator
16. Observations youmake of otherteachers inprogram
17. Observations ofyou by super-visor and subse-quent discussionwith supervisor
37
Which two of the foregoing experiences have you found to be the most valuable? Please listin order of value. (Refer to the number of the question.)
18. (First)
19. (Second)
20. What specific recommendations, if any, do you wish to make for the improvement ofthe pre-training orientation meetings at the New York City Board of Education at thebeginning of the current academic year? If you did not attend any of these meetings,please check here 0 and go on to the next question.
21. If you usually attend weekly in-service sessions, please make specific recommendationsfor their improvement, if any. If you do not usually attend them, please check here Cland go on to the next question.
22. If you usually attend the large group meetings at the board office, please make specificrecommendations for their improvement, if any. If you do not usually attend them,please check here E and go on to the next question.
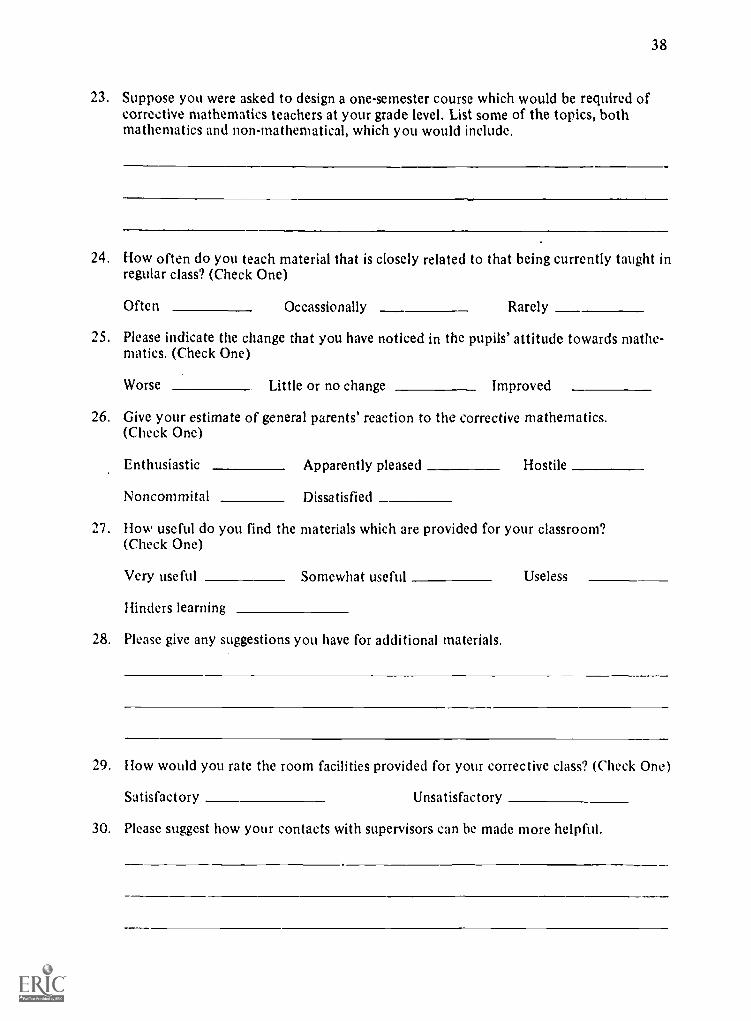
38
23. Suppose you were asked to design a one-semester course which would be required ofcorrective mathematics teachers at your grade level. List some of the topics, bothmathematics and non-mathematical, which you would include.
24. How often do you teach material that is closely related to that being currently taught inregular class? (Check One)
Often Occassionally Rarely
25. Please indicate the change that you have noticed in the pupils' attitude towards mathe-matics. (Check One)
Worse Little or no change Improved
26. Give your estimate of general parents' reaction to the corrective mathematics.(Check One)
Enthusiastic Apparently pleased Hostile
Noncommital Dissatisfied
27. How useful do you find the materials which are provided for your classroom?(Check One)
Very useful Somewhat useful Useless
Hinders learning
28. Please give any suggestions you have for additional materials.
29. How would you rate the room facilities provided for your corrective class? (Check One)
Satisfactory Unsatisfactory
30. Please suggest how your contacts with supervisors can be made more helpful.
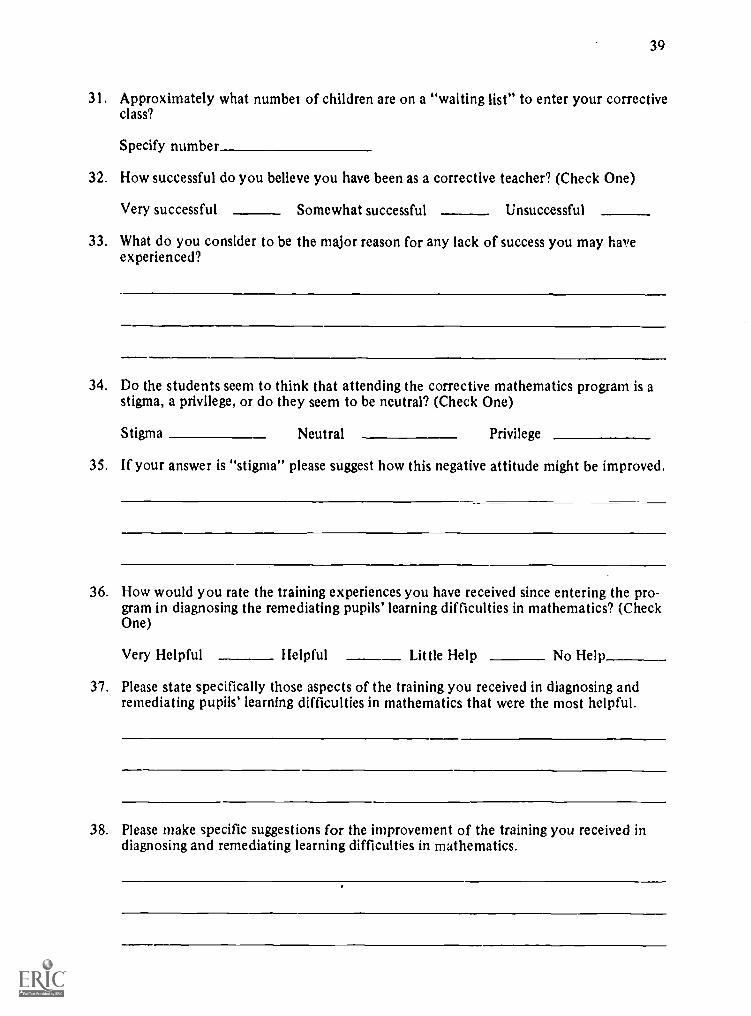
39
31. Approximately what number of children are on a "waiting list" to enter your correctiveclass?
Specify number
32. How successful do you believe you have been as a corrective teacher? (Check One)
Very successful Somewhat successful Unsuccessful
33. What do you consider to be the major reason for any lack of success you may haveexperienced?
34. Do the students seem to think that attending the corrective mathematics program is astigma, a privilege, or do they seem to be neutral? (Check One)
Stigma Neutral Privilege
35. If your answer is "stigma" please suggest how this negative attitude might be improved.
36. How would you rate the training experiences you have received since entering the pro-gram in diagnosing the remediating pupils' learning difficulties in mathematics? (CheckOne)
Very Helpful Helpful Little Help No Help
37. Please state specifically those aspects of the training you received in diagnosing andremediating pupils' learning difficulties in mathematics that were the most helpful.
38. Please make specific suggestions for the improvement of the training you received indiagnosing and remediating learning difficulties in mathematics.
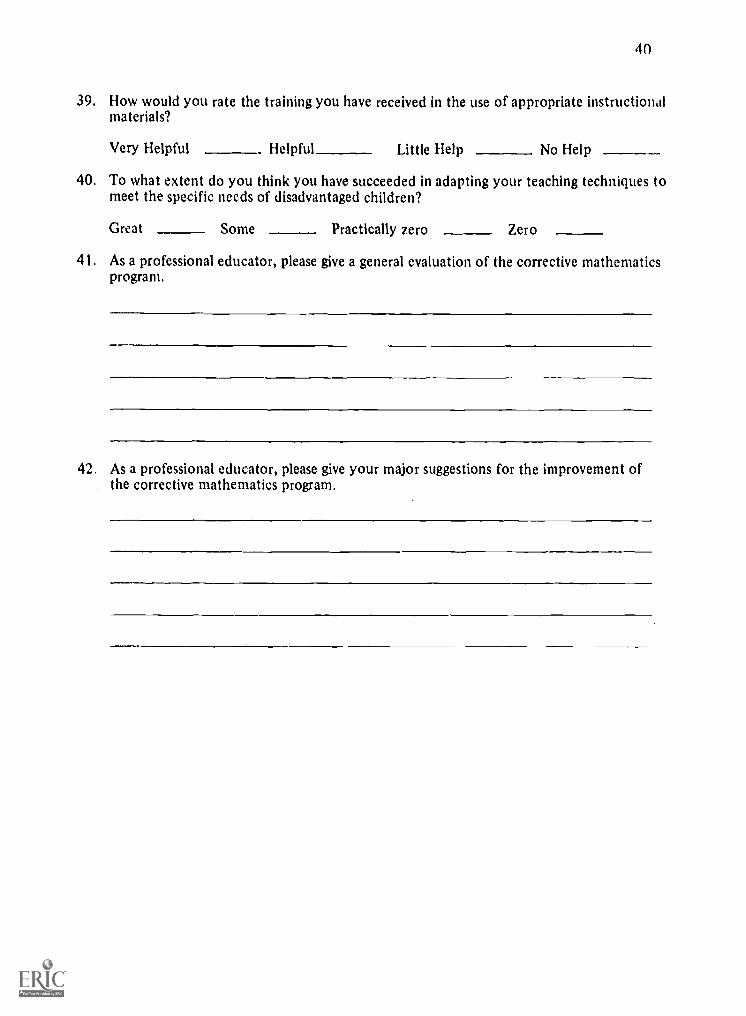
40
39. How would you rate the training you have received in the use of appropriate instructionalmaterials?
Very Helpful Helpful Little Help No Help
40. To what extent do you think you have succeeded in adapting your teaching techniques tomeet the specific needs of disadvantaged children?
Great Some Practically zero Zero
41. As a professional educator, please give a general evaluation of the corrective mathematicsprogram.
42. As a professional educator, please give your major suggestions for the improvement ofthe corrective mathematics program.
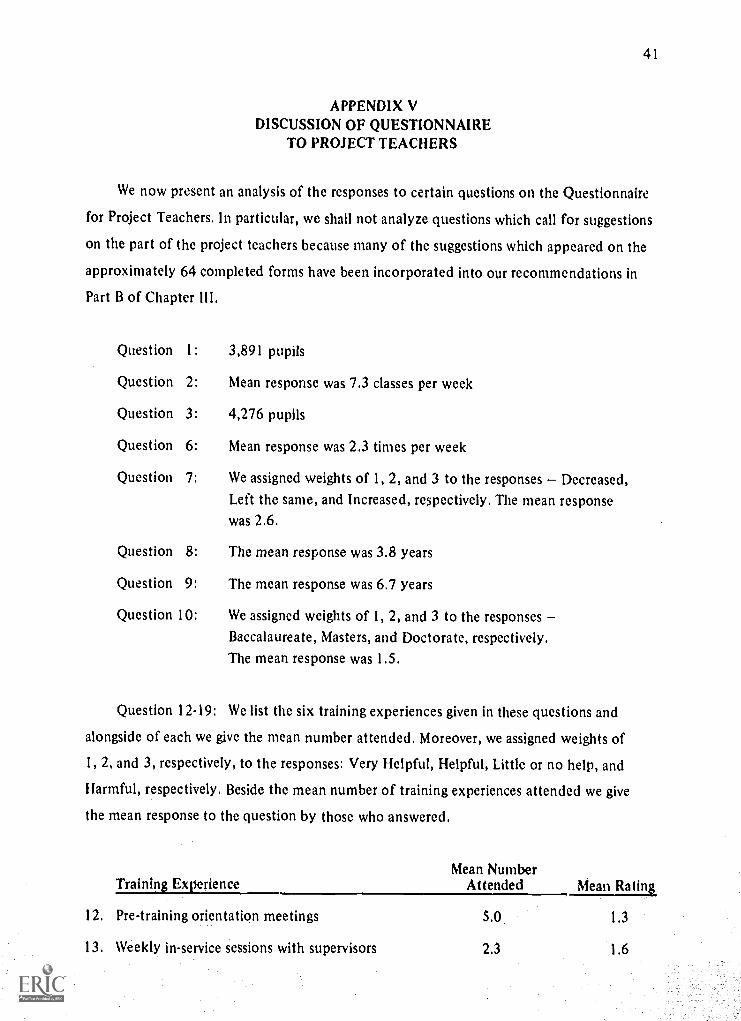
41
APPENDIX VDISCUSSION OF QUESTIONNAIRE
TO PROJECT TEACHERS
We now present an analysis of the responses to certain questions on the Questionnaire
for Project Teachers. In particular, we shall not analyze questions which call for suggestions
on the part of the project teachers because many of the suggestions which appeared on the
approximately 64 completed forms have been incorporated into our recommendations in
Part B of Chapter III.
Question I:
Question 2:
Question 3:
Question 6:
Question
3,891 pupils
Mean response was 7.3 classes per week
4,276 pupils
Mean response was 2.3 times per week
7: We assigned weights of 1, 2, and 3 to the responses Decreased,Left the same, and Increased, respectively. The mean responsewas 2.6.
Question 8:
Question 9:
Question 10:
The mean response was 3.8 years
The mean response was 6.7 years
We assigned weights of 1, 2, and 3 to the responses
Baccalaureate, Masters, and Doctorate, respectively.The mean response was 1.5.
Question 12-19: We list the six training experiences given in these questions and
alongside of each we give the mean number attended. Moreover, we assigned weights of
1, 2, and 3, respectively, to the responses: Very Helpful, Helpful, Little or no help, and
Harmful, respectively. Beside the mean number of training experiences attended we give
the mean response to the question by those who answered.
Mean NumberTraining Experience Attended Mean Rating
12. Pre-training orientation meetings
13. Weekly in-service sessions with supervisors
5.0 1.3
2.3 1.6
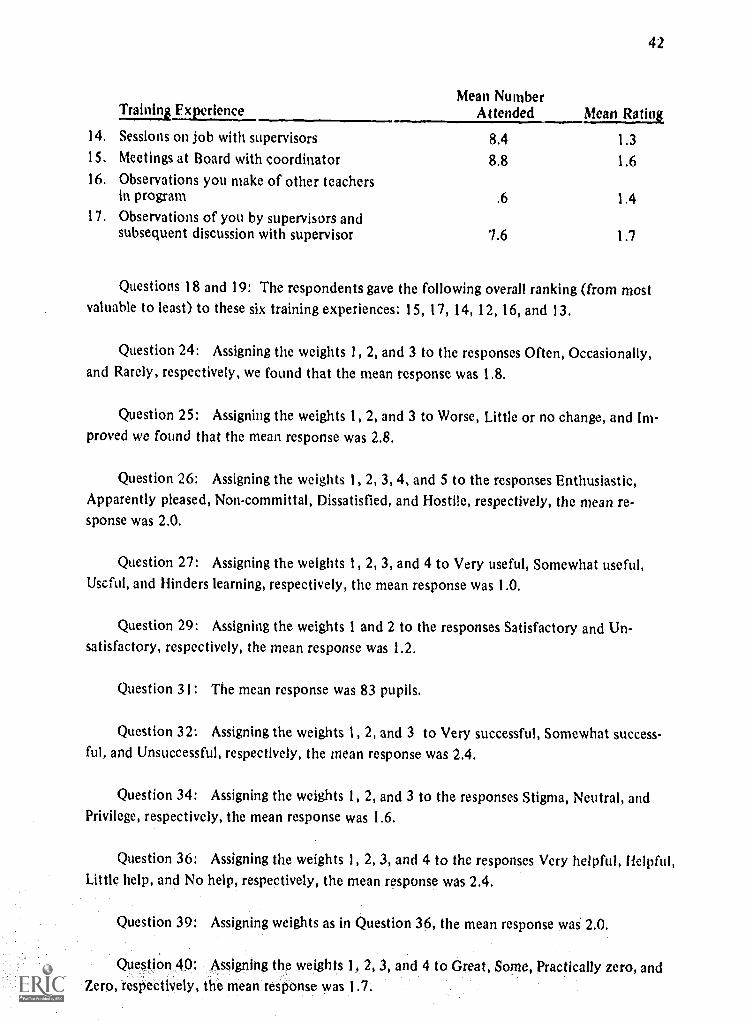
42
Mean NumberTraining Experience Attended _Mean Rating
14. Sessions on job with supervisors 8.4 1.315. Meetings at Board with coordinator 8.8 1.616. Observations you make of other teachers
in program .6 1.417. Observations of you by supervisors and
subsequent discussion with supervisor 1.?
Questions 18 and 19: The respondents gave the following overall ranking (from mostvaluable to least) to these six training experiences: 15, 17, 14, 12, 16, and 13.
Question 24: Assigning the weights 1, 2, and 3 to the responses Often, Occasionally,and Rarely, respectively, we found that the mean response was 1.8.
Question 25: Assigning the weights 1, 2, and 3 to Worse, Little or no change, and Im-proved we found that the mean response was 2.8.
Question 26: Assigning the weights 1, 2, 3, 4, and 5 to the responses Enthusiastic,Apparently pleased, Non-committal, Dissatisfied, and Hostile, respectively, the mean re-sponse was 2.0.
Question 27: Assigning the weights 1, 2, 3, and 4 to Very useful, Somewhat useful,Useful, and Hinders learning, respectively, the mean response was 1.0.
Question 29: Assigning the weights 1 and 2 to the responses Satisfactory and Un-satisfactory, respectively, the mean response was 1.2.
Question 31: The mean response was 83 pupils.
Question 32: Assigning the weights 1, 2, and 3 to Very successful, Somewhat success-ful, and Unsuccessful, respectively, the mean response was 2.4.
Question 34: Assigning the weights 1, 2, and 3 to the responses Stigma, Neutral, andPrivilege, respectively, the mean response was 1.6.
Question 36: Assigning the weights 1, 2, 3, and 4 to the responses Very helpful, Helpful,Little help, and No help, respectively, the mean response was 2.4.
Question 39: Assigning weights as in Question 36, the mean response was 2.0.
Question 40: Assigning the weights 1, 2, 3, and 4 to Great, Some, Practically zero, andZero, respectively, the mean response was 1.7.
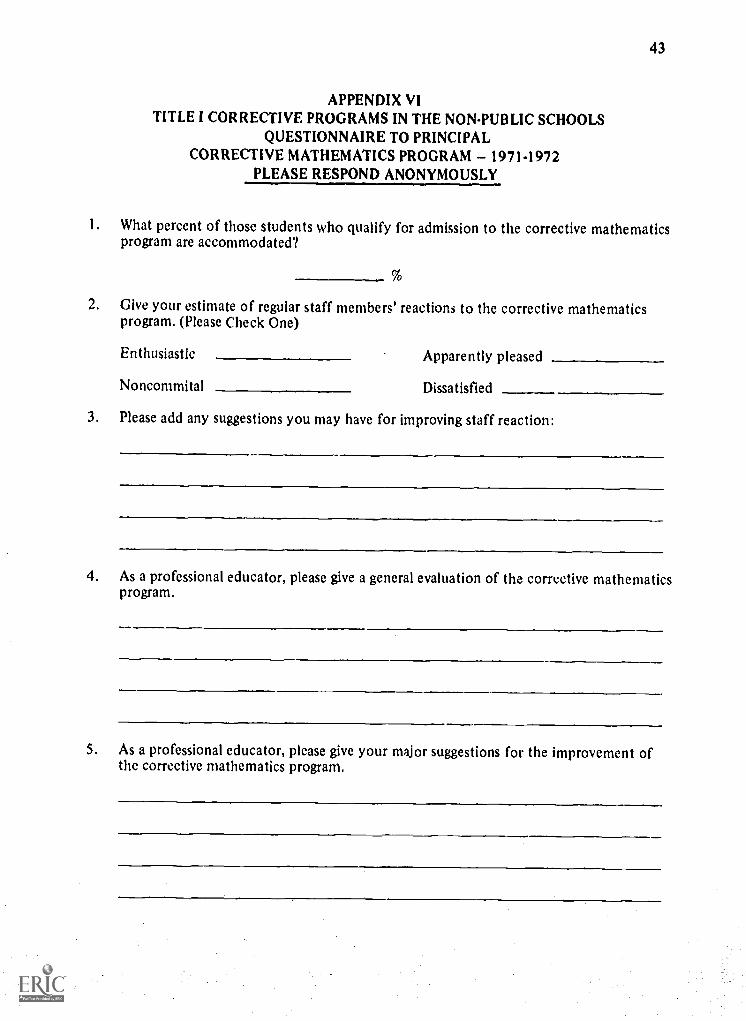
43
APPENDIX VITITLE I CORRECTIVE PROGRAMS IN THE NON-PUBLIC SCHOOLS
QUESTIONNAIRE TO PRINCIPALCORRECTIVE MATHEMATICS PROGRAM 1971.1972
PLEASE RESPOND ANONYMOUSLY
1. What percent of those students who qualify for admission to the corrective mathematicsprogram are accommodated?
2. Give your estimate of regular staff members' reactions to the corrective mathematicsprogram. (Please Check One)
Enthusiastic Apparently pleased
Noncommital Dissatisfied
3. Please add any suggestions you may have for improving staff reaction:
4. As a professional educator, please give a general evaluation of the corrective mathematicsprogram.
5. As a professional educator, please give your major suggestions for the improvement ofthe corrective mathematics program.
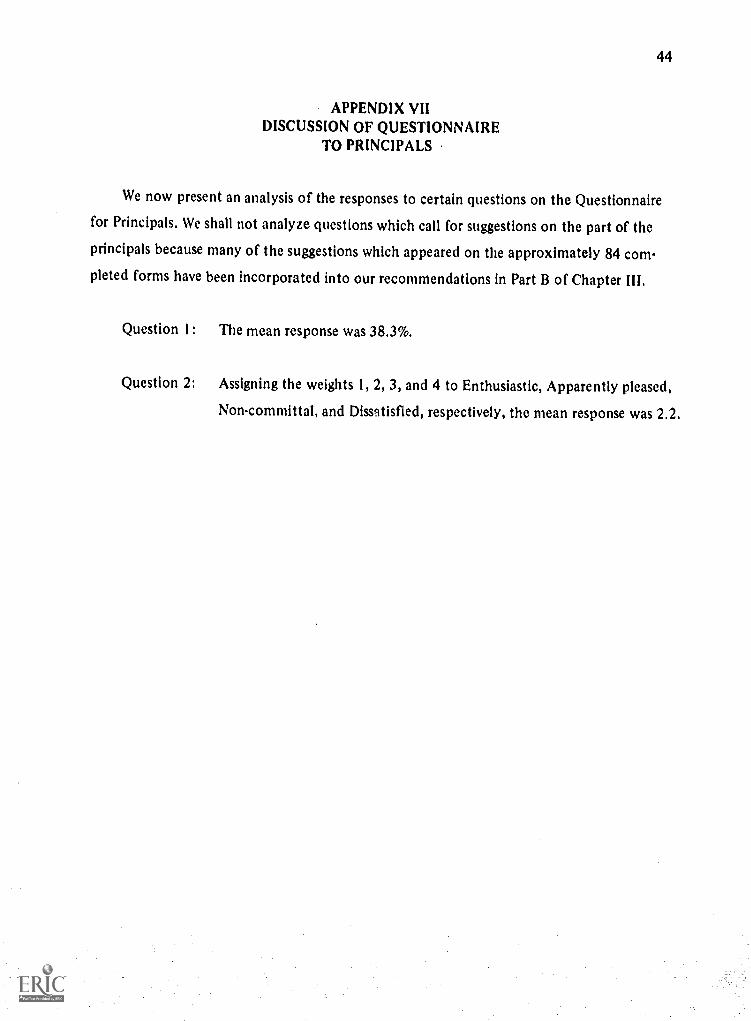
44
APPENDIX VIIDISCUSSION OF QUESTIONNAIRE
TO PRINCIPALS
We now present an analysis of the responses to certain questions on the Questionnaire
for Principals. We shall not analyze questions which call for suggestions on the part of the
principals because many of the suggestions which appeared on the approximately 84 com-
pleted forms have been incorporated into our recommendations in Part B of Chapter III.
Question I : The mean response was 38.3%.
Question 2: Assigning the weights 1, 2, 3, and 4 to Enthusiastic, Apparently pleased,
Non-committal, and Dissatisfied, respectively, the mean response was 2.2.
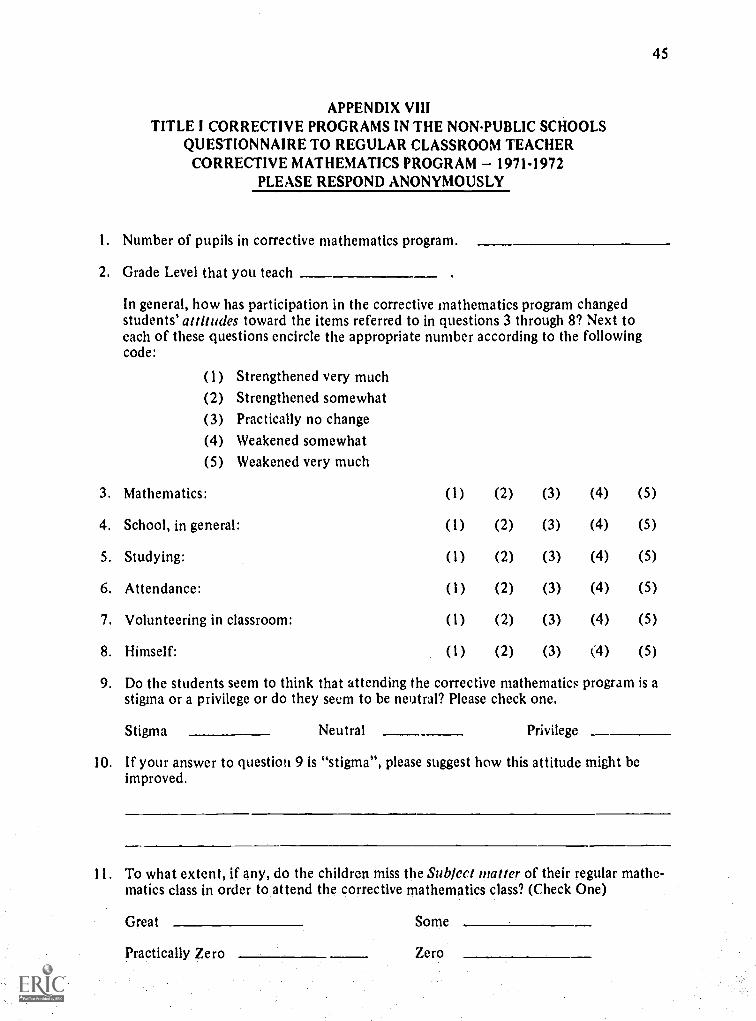
APPENDIX VIIITITLE I CORRECTIVE PROGRAMS IN THE NON-PUBLIC SCHOOLS
QUESTIONNAIRE TO REGULAR CLASSROOM TEACHERCORRECTIVE MATHEMATICS PROGRAM 1971.1972
PLEASE RESPOND ANONYMOUSLY
1. Number of pupils in corrective mathematics program.
2. Grade Level that you teach
45
In general, how has participation in the corrective mathematics program changedstudents' attitudes toward the items referred to in questions 3 through 8? Next toeach of these questions encircle the appropriate number according to the followingcode:
(1) Strengthened very much(2) Strengthened somewhat(3) Practically no change(4) Weakened somewhat
(5) Weakened very much
3. Mathematics:
4. School, in general:
5. Studying:
6. Attendance:
7. Volunteering in classroom:
8. Himself:
(I) (2) (3) (4) (5)
(I) (2) (3) (4) (5)
(I) (2) (3) (4) (5)
(1) (2) (3) (4) (5)
(1) (2) (3) (4) (5)
(I) (2) (3) (4) (5)
9. Do the students seem to think that attending the corrective mathematics program is astigma or a privilege or do they seem to be neutral? Please check one.
Stigma Neutral Privilege
10. If your answer to question 9 is "stigma", please suggest how this attitude might beimproved.
I I. To what extent, if any, do the children miss the Sublect matter of their regular mathe-matics class in order to attend the corrective mathematics class? (Check One)
Great Some
Practically Zero Zero
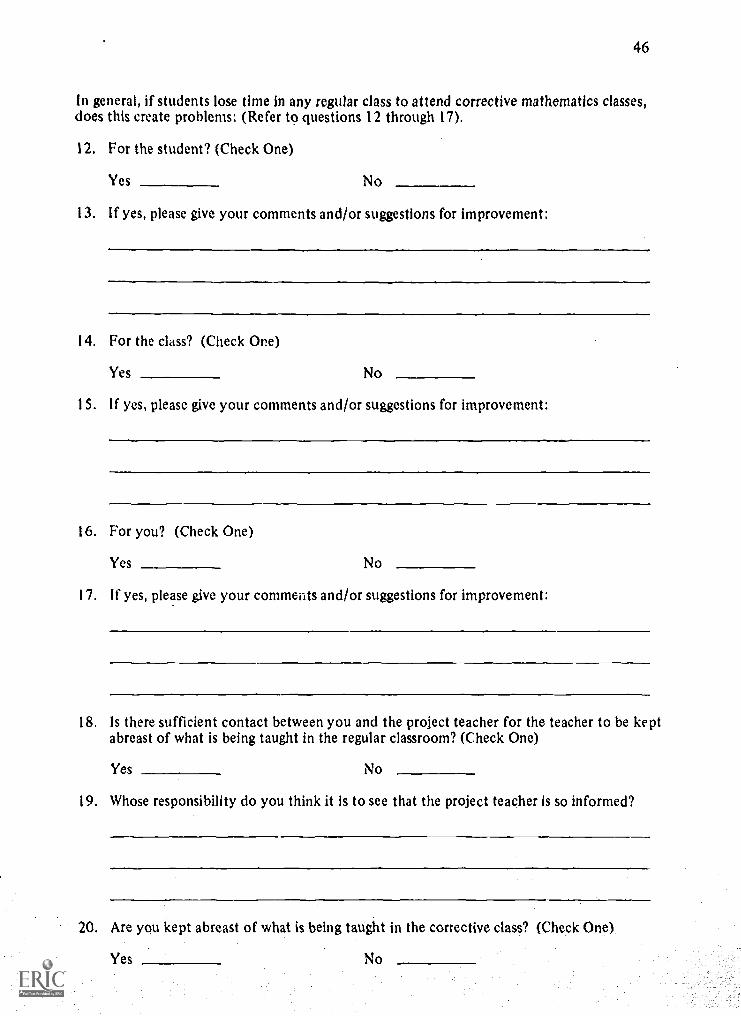
46
In general, if students lose time in any regular class to attend corrective mathematics classes,does this create problems: (Refer to questions 12 through 17).
12. For the student? (Check One)
Yes No
13. If yes, please give your comments and/or suggestions for improvement:
14. For the class? (Check One)
Yes No
15. If yes, please give your comments and/or suggestions for improvement:
16. For you? (Check One)
Yes No
17. If yes, please give your comments and/or suggestions for improvement:
18. Is there sufficient contact between you and the project teacher for the teacher to be keptabreast of what is being taught in the regular classroom? (Check One)
Yes No
19. Whose responsibility do you think it is to see that the project teacher is so informed?
20. Are you kept abreast of what is being taught in the corrective class? (Check One)
Yes No
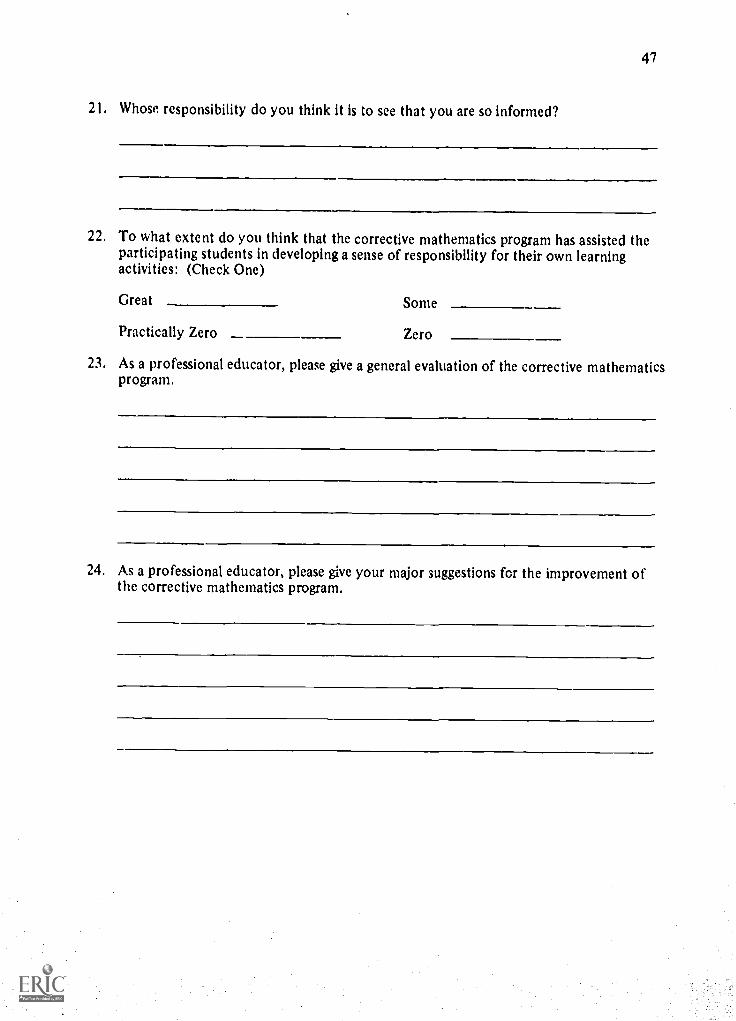
47
21. Whose responsibility do you think it is to see that you are so informed?
22. To what extent do you think that the corrective mathematics program has assisted theparticipating students in developing a sense of responsibility for their own learningactivities: (Check One)
Great Some
Practically Zero Zero
23. As a professional educator, please give a general evaluation of the corrective mathematicsprogram.
24. As a professional educator, please give your major suggestions for the improvement ofthe corrective mathematics program.
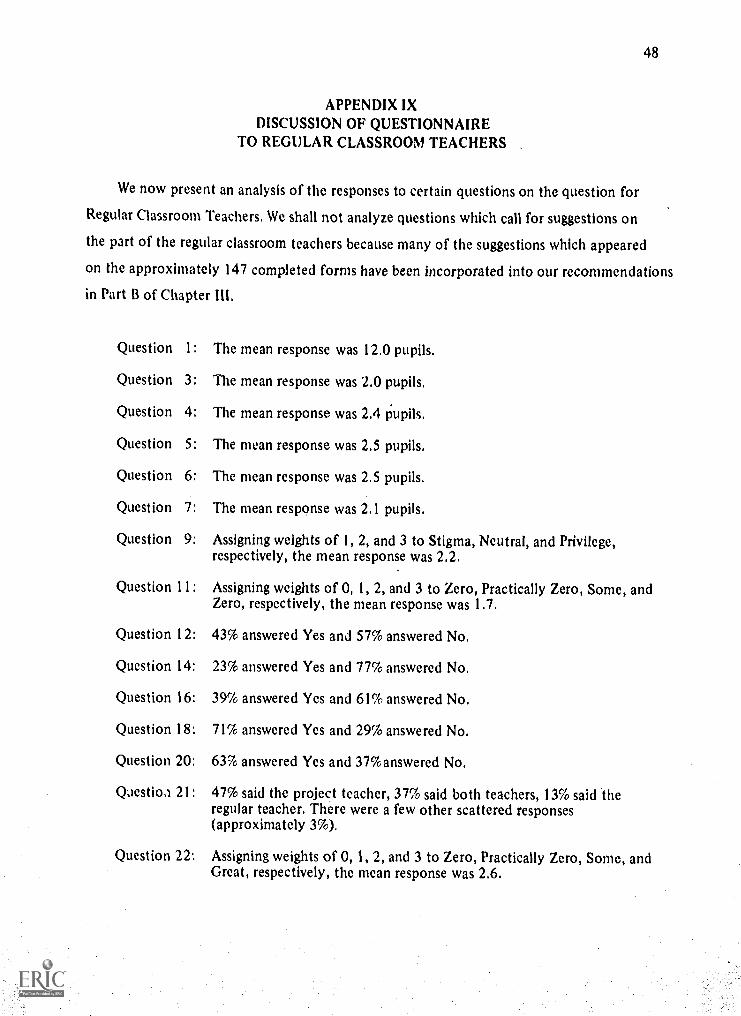
48
APPENDIX IXDISCUSSION OF QUESTIONNAIRE
TO REGULAR CLASSROOM TEACHERS
We now present an analysis of the responses to certain questions on the question for
Regular Classroom Teachers. We shall not analyze questions which call for suggestions on
the part of the regular classroom teachers because many of the suggestions which appeared
on the approximately 147 completed forms have been incorporated into our recommendations
in Part B of Chapter III.
Question 1:
Question 3:
Question 4:
Question 5:
Question 6:
Question 7:
Question 9:
Question 11:
Question 12:
Question 14:
Question 16:
Question 18:
Question 20:
Question
Question
The mean response was 12.0 pupils.
The mean response was 2.0 pupils.
The mean response was 2.4 pupils.
The mean response was 2.5 pupils.
The mean response was 2.5 pupils.
The mean response was 2.1 pupils.
Assigning weights of I, 2, and 3 to Stigma, Neutral, and Privilege,respectively, the mean response was 2.2.
Assigning weights of 0, I, 2, and 3 to Zero, Practically Zero, Some, andZero, respectively, the mean response was 1.7.
43% answered Yes and 57% answered No.
23% answered Yes and 77% answered No.
39% answered Yes and 61% answered No.
71% answered Yes and 29% answered No.
63% answered Yes and 37%answered No.
21: 47% said the project teacher, 37% said both teachers, 13% said theregular teacher. There were a few other scattered responses(approximately 3%),
22: Assigning weights of 0, 1, 2, and 3 to Zero, Practically Zero, Some, andGreat, respectively, the mean response was 2.6.
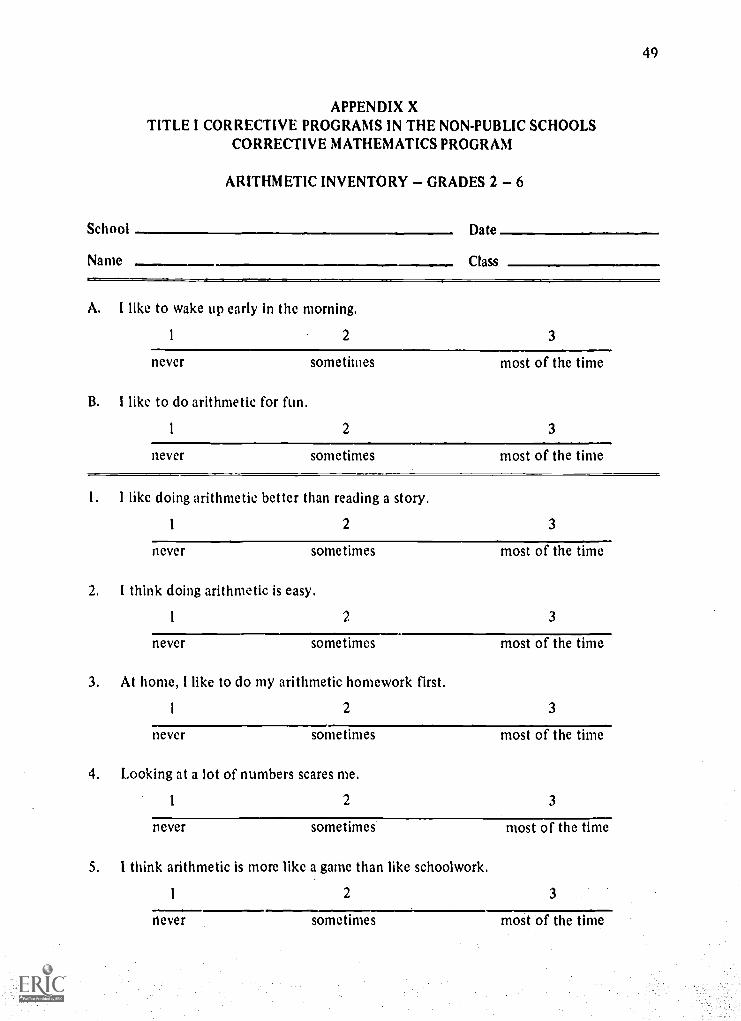
49
APPENDIX XTITLE I CORRECTIVE PROGRAMS IN THE NON-PUBLIC SCHOOLS
CORRECTIVE MATHEMATICS PROGRAM
ARITHMETIC INVENTORY GRADES 2 6
School Date
Name Class
A. I like to wake up early in the morning.
1 2 3
never
B. I like to do arithmetic for fun.
1
sometimes most of the time
2 3
never sometimes most of the time
1. I like doing arithmetic better than reading a story,
1 2 3
never sometimes most of the time
2. I think doing arithmetic is easy.
1 2 3
never sometimes most of the time
3. At home, I like to do my arithmetic homework first.
I 2 3
never sometimes most of the time
4. Looking at a lot of numbers scares me.
1 2 3
never sometimes most of the time
5. 1 think arithmetic is more like a game than like schoolwork.
2 3
never sometimes most of the time
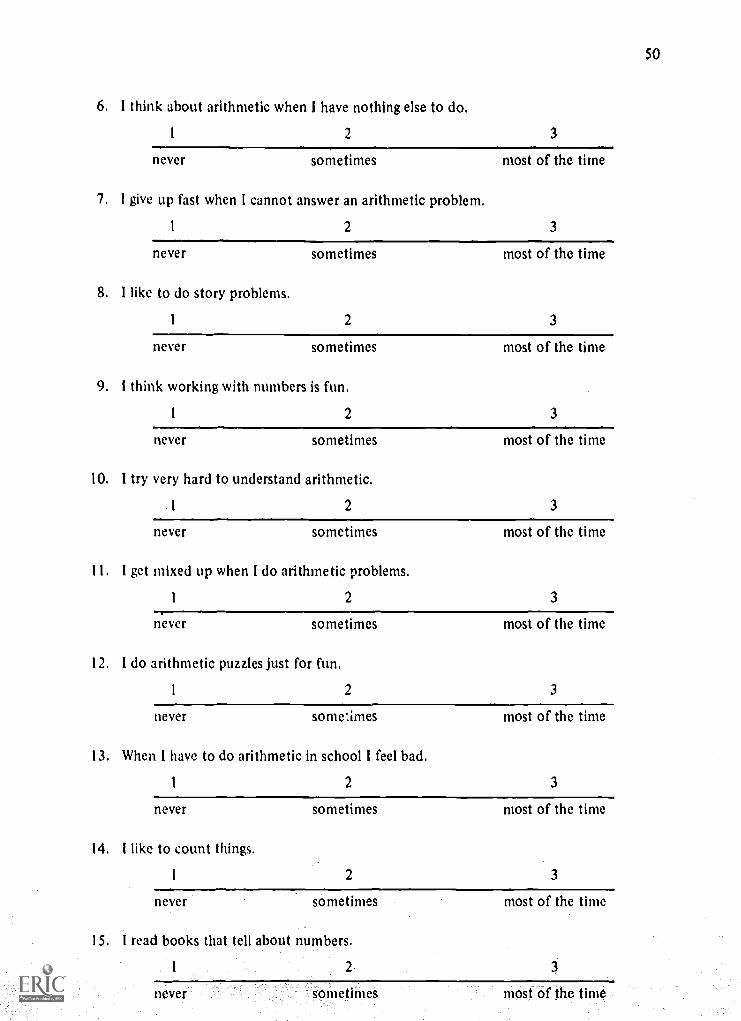
50
6. 1 think about arithmetic when I have nothing else to do.
1 2 3
never sometimes most of the time
7. 1 give up fast when I cannot answer an arithmetic problem.
1 2 3
never
8. I like to do story problems.
sometimes most of the time
2 3
never sometimes most of the time
9. 1 think working with numbers is fun.
2 3
never sometimes most of the time
10. 1 try very hard to understand arithmetic.
2 3
never
1
sometimes most of the time
I. I get mixed up when I do arithmetic problems.
1 2 3
never sometimes most of the time
12. 1 do arithmetic puzzles just for fun.
1 2 3
never sometimes most of the time
13. When I have to do arithmetic in school 1 feel bad.
2 3
never
14. 1 like to count things.
1
sometimes most of the time
2 3
never sometimes most of the time
15. I read books that tell about numbers.
1 2 3
never sometimes most of the time
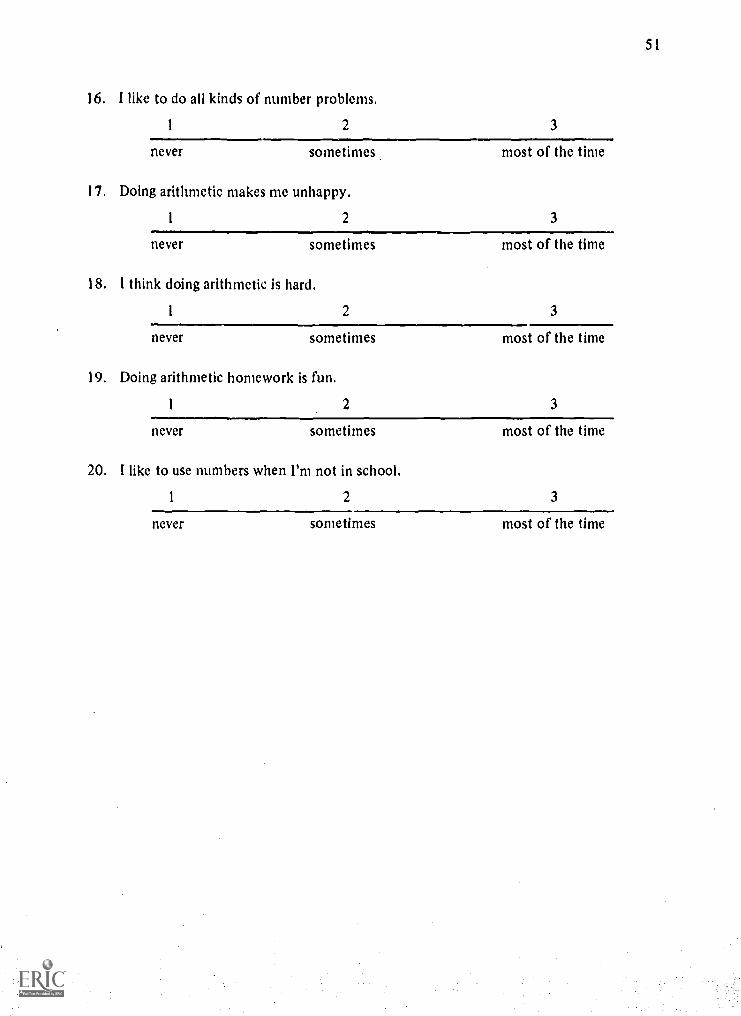
16. 1 like to do all kinds of number problems.
1 2 3
never sometimes most of the time
17. Doing arithmetic makes me unhappy.
2 3
never sometimes
18. I think doing arithmetic is hard.
1
never
most of the time
2 3
sometimes
19. Doing arithmetic homework is fun.
1 2
most of the time
3
never sometimes
20. I like to use numbers when I'm not in school.
1 2
most of the time
3
never sometimes most of the time
51
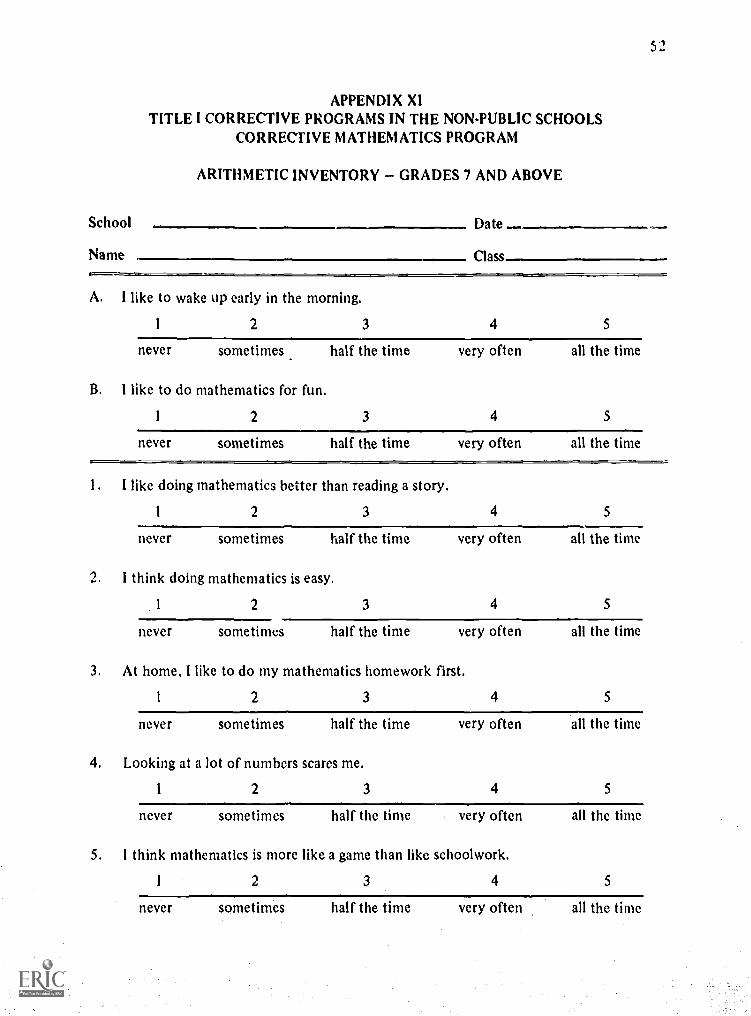
APPENDIX XITITLE I CORRECTIVE PROGRAMS IN THE NON-PUBLIC SCHOOLS
CORRECTIVE MATHEMATICS PROGRAM
ARITHMETIC INVENTORY GRADES 7 AND ABOVE
School Date
Name
52
Class
A. I like to wake up early in the morning.
2 3 4 5
never sometimes half the time very often all the time
B. I like to do mathematics for fun.
1 2 3 4
never sometimes half the time very often
S
all the time
1. I like doing mathematics better than reading a story.
1 2 3 4 5
never sometimes half the time very often all the time
2. I think doing mathematics is easy.
1 2 3 4 5
never sometimes half the time very often all the time
3. At home, I like to do my mathematics homework first.
I 2 3 4 5
never sometimes half the time very often all the time
4. Looking at a lot of numbers scares me.
1 2 3 4 5
never sometimes half the time very often all the time
5. I think mathematics is more like a game than like schoolwork.
1 2 3 4 5
never sometimes half the time very often all the time
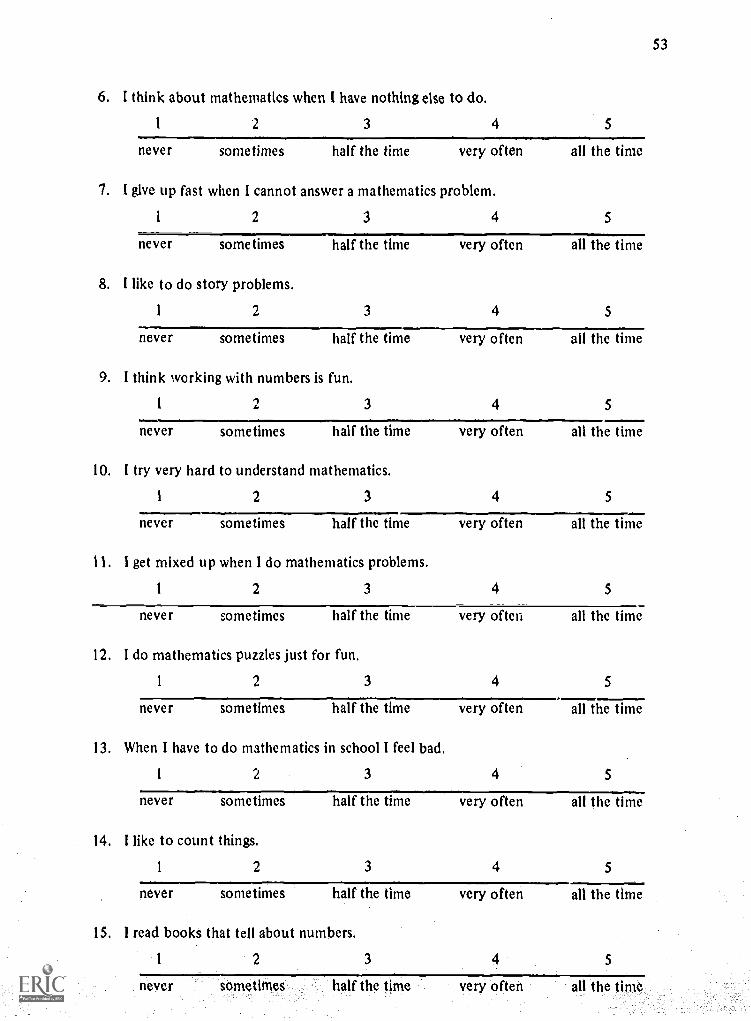
6. I think about mathematics when I have nothing else to do.
2 3 4 5
never sometimes half the time very often all the time
7. I give up fast when I cannot answer a mathematics problem.
1 2 3 4 5
never sometimes half the time very often all the time
8. I like to do story problems.
1 2 3 4
never sometimes half the time very often
9. I think working with numbers is fun.
1 2 3 4
never sometimes half the time very often all the time
5
all the time
5
I0. I try very hard to understand mathematics.
1 2 3 4 5
never sometimes half the time very often all the time
11. I get mixed up when I do mathematics problems.
1 2 3 4 5
never sometimes half the time very often all the time
12. I do mathematics puzzles just for fun,
1 2 3 4 5
never sometimes half the time very often all the time
13. When I have to do mathematics in school I feel bad.
2 3 4 5
never sometimes half the time very often all the time
14. I like to count things.
1 2 3 4 5
never sometimes half the time very often all the time
15. 1 read books that tell about numbers.
1 2 3 4 5
sometimes half the time very often all the time
53
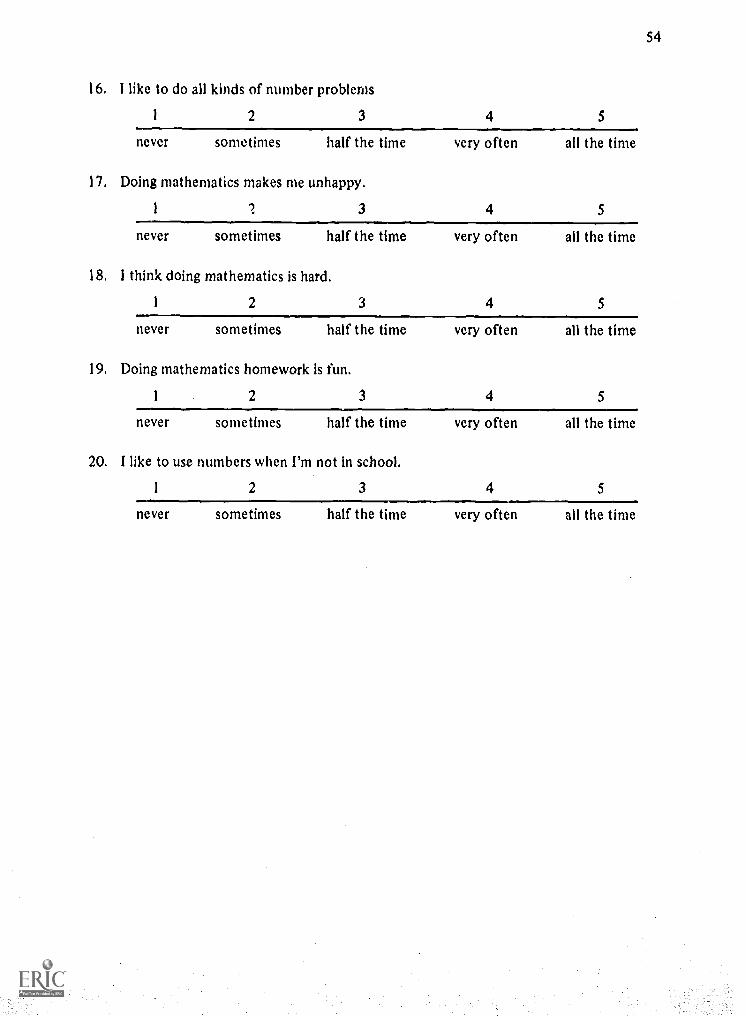
16. 1 like to do all kinds of number problems
1 2 3 4 5
never sometimes half the time very often all the time
17. Doing mathematics makes me unhappy.
1 3 4 5
never sometimes half the time very often all the time
18. 1 think doing mathematics is hard.
1 2 3 4 5
never sometimes half the time very often all the time
19. Doing mathematics homework is fun.
1 2 3 4 5
never sometimes half the time very often all the time
20. I like to use numbers when I'm not in school.
1 2 3 4 5
never sometimes half the time very often all the time
54