document resume cg 021 196 author tang, … · document resume ed 300 701 cg 021 196 author tang,...
TRANSCRIPT
DOCUMENT RESUME
ED 300 701 CG 021 196
AUTHOR Tang, Thomas Li-Ping; And OthersTITLE Top-, Middle-, and Lower-Management Attendance and
Quality Circle Effectiveness.PUB DATE 13 Aug 88NOTE 29p.; Paper presented at the Annual Convention of the
American Psychological Association (96th, Atlanta,GA, August 12-16, 1988).
PUB TYPE Reports - Research/Technical (143) --Speeches /Conference Papers (150)
EDRS PRICE mpo1/pc02 Plus Postage.DESCRIPTORS *Administrators; *Attendance; *Middle Management;
*Program Effectiveness; *Quality Circles
ABSTRACTA quality circle (QC) is a group of workers from the
same work area who voluntarily meet on a regular basis to identify,analyze, and solve various work-related problems. While managementsupport has been a variable frequently cited as critical to thesuccess of QCs in organizations, very little research has empiricallydocumented the relationship between management support and QCeffectiveness. This study was conducted to examine the relationshipbetween top-, middle-, and lower-management attendance and theeffectiveness of QCs. The effectiveness of 47 QCs over a 3-yearperiod was examined as a function of management attendance using thearchival data of a QC program. The results showed that QCs with ahigh level of upper-management attendance had a higher attendancerate at QC meetings and had more QC members than had QCs with a lowlevel of management attendance. QCs with a high level ofmiddle-management attendance had attempted more QC projects and had ahigher amount of cost savings than had QCs with a low level ofmanagement attendance. The effect of lower-management attendance onQC effectiveness was not significant. (Author/NB)
***********************************************************************
* Reproductions supplied by EDRS are the best that can be made *
* from the original document. *
***********************************************************************
Top-, Middle-, and Lower-Management Attendance
and Quality Circle Effectiveness
Thomas Li-Ping Tang
Middle Tennessee State University
Peggy Smith Tollison
Vanderbilt University and
Textron Aerostructures, Northville, TN
Harold D. Whiteside
Middle Tennessee State University
U DEPARTMENT OF EDUCATIONOffice of Educational Research and Improvement
ED TIONAL RESOURCES INFORMATIONCENTER (ERIC)
his document has been reproduced asrnceived from the person or organizationoriginating it.
Ch Minor changes have been made to improvereproduction quality Running head: QUALITY CIRCLE
Points of gew or opinions staled in this docu-ment do not necessarily repre-ent official
C\J OERI position or policy
CD
Quality Circle
1
"PERMISSION TO REPRODUCE THISMATERIAL HAS BEEN GRANTED BY
7.77wair 1(3(-73
'07TO THE EDUCATIONAL RESOURCESINFORMATION CENTER (ERIC)."
Presented at the 96th Annual Convention of the American Psychological
Association at Atlanta, Georgia, August 13, 1988, (9:00 a.m.).
Address reprint requests to Thomas Li-Ping Tang, Box 516, Department of
Psychology, Middle Totnnessee State University, Murfreesboro, TN 37132,
(615) 898-2005.
2

Quality Circle
2
Abstract
The effectiveness of 47 quality circles (QCs) over a three-year period
was examined as a function of management attendance using the archival
data of a QC program. The results showed that QCs with a high level of
upper-management attendance had a higher attendance rate at QC meetings
and had more QC members than had QCs with a low level of management attendance.
QCs with a high level of middle-management attendance had attempted more
QC projects and had a higher amount of cost savings than had QCs with a
low level of management attendance. The effect of lower-management attendance
on QC effectiveness was not significant.
Quality Circle
3
Top-, Middle-, and Lower-Management Attendance
and Quality Circle Effectiveness
A quality circle (QC) is a group of workers from the same work area that
voluntarily meet on a regular basis to identify, analyze, and solve various
work-related problems (Barrick & Alexander, 1987; Ingle, 1982; Lawler & Mbhrman,
1985; Tang, Tollison, & Whiteside, 1987c; Rafaeli 1985). Management support has
been one of the many variables most often cited as critical to the success of QCs in
organizations (e.g., Cole & Tachiki, 1983; Garvin, 1986; Gibson, 1981; Goodman, 1983;
Ingle, 1982; Lawler, 1986; Lawler & Mohrman, 1985; Reiker, 1983; Wayne, Griffin, &
Bateman, 1986). However, vary little research in the literature has empirically
documented the relationship between management support and QC effectiveness. The
major purpose of the present study was to empirically examine the relationship
between top-, middle-, and lower-management attendance and the effectiveness of QCs
in a field study. In the following paragraphs, theories and research related to
management attendance and QC effectiveness are briefly reviewed.
Management Attendance
It is reasoned that if the management of an organization supports the QC
program, managers will attend QC support (steering committee) meetings and/or QC
meetings which will enable them to offer their knowledge, expertise, information, and
related resources to those QCs and help them select, coordinate, and solve QC-related
problems. Further, a high level of management attendance may lead to a high level of
perceived demand characteristics (PDC) (cf. Orne, 1962; Salomon, 1984). One factor
which affects the amount of invested mental effort is a person's perceived demand
characteristics of the stimulus, task, or context (Salomon, 1984). The more
demanding PDC is, the greater amount of mental effort will be expended which, in
turn, may lead to a high level of effectiveness and performance.
4
Quality Circle
4
It is also possible that managers' own involvements in QC-related activities may
set an example or role model for QC members, thus, a high level of management
attendance may lead to QC members' high involvements in QC activities which can be
expressed in terms of QC membership (i.e., QC size), the attendance rate at QC
meetings, and the actual performance or problen-solving activities of QCs. These
results can be explained, in part, by Bandura's (1977) social learning theory which
stales that the best explanation of behavior is in terms of continuous, reciprocal
interaction between c)titive, behavioral, and environmental determinants.
It is reasonable to believe that upper- and middle-level managers may have more
"power" than first-line supervisors in an organization (cf. French & Raven, 1959).
Therefore, it is Plausible that Om attendance of upper- and middle-level managers
may pose a high level of perceived demand characteristics to QC members, whereas the
involvement of first-line supervisors may pose a low level of perceived demand
characteristics to QC members. Further, upper- and middle-level managers may set a
good role model for QC workers and have stronger impacts on QC effectiveness,
however, the first-line supervisors may not.
Top-Management Attendance
Ingle (1982) pointed out that "top Management involvement in the Quality Circle
program is essential in setting up the policy and guidelines" and "helps to promote
more funding, participation, guidance, and cooperation throughout the company" (p.
58, emphasis added). Top management personnel's involvement in QC steering committee
meetings over time is also "an indicator of the priorities" the individual might have
set in their "day-to-day management activities" (Tollison, 1986b, p. 88). Recently,
Tang, Tollison, and Whiteside (1986, 1987a; Tollison, 1986a; Tollison, Tang, &
Whiteside, 1986) examined the effects of upper-management attendance, circle
initiation, and collar color on QC effectiveness. They found that QCs with a high
Quality Circle
5
level of upper-management attendance solved their problems significantly faster than
did those QCs with a low level of attendance.
It has been pointed out by Dean (1985) that QC members "apparently have little
patience for merely going through the motions--they want results" (p. 326). Dean
(1985) further pointed out that the primary interest in becoming a member of a QC and
attending QC meeting was probably due to "the circles' potential for improving the
work place" (p. 326). This goal can be achieved by QC members, if they are able to
solve their problems. It has been suggested also that an important asset of QC
membership was that QCs were "sources of both informational and emotional social
support" (Marks, Mirvis, Hackett, A Grady, 1986, p. 68). If QC members were not
satisfied with their QC-related activities, they probably would withdraw their
involvements in QCs.
Top-level managers are usually concerned about the identification of new quality
circle teams and the development of policies and procedures for QCs. Thus, top-level
managers' attendance at QC steering committee meetings would be highly related to QCs
members' motivation to attend QCs.
Hypothesis 1: QCs with a high level of top-management attendance
will have higher motivation to attend QC meetings than will QCs
with a low level of attendance.
Middle-Management Attendance
Tam Tollison, and Whiteside (1987b) examined the major differences between
active and inactive QCs and suggested that active QCs had a significantly higher
level of attendance from the middle management than had inactive QCs. These results
were related to the idea suggested by Lawler and Mohrman (1985) that resistance by
"middle management" was one of the several "destructive forces" related to QCs'
failure (p. 67). It should be pointed out, however, that "lack of resistance" from
Quality Circle
6
middle- management do not necessarily mean "attendance" or "support" of QC activities.
Further, it is also plausible that managers who are against QCs may get involved in QC
activities in order to establish their control over these QCs. It was reasoned,
however, that middle-level managers' attendance in QC activities would have a
significant and positive impact on the effectiveness of QCs.
Further, middle-level managers were "invited" to attend QC meetings. The actual
number of meetings attended was examined. These managers were invited to attend QC
meetings for the following reasons. For example, middle-level managers might be
asked to provide technical knowledge, information, and resources in identifying QC
problems, sele'ting QC projects, solving QC problems, and presenting possible
solutions to management presentation meetings. Further, costs of project
implementation and cost savings were estimated and calculated by these middle-level
managers. It was plausible that a good solution might lead to high cost savings.
Thus, they might be helpful, informative, and promotive. They might also be summoned
by intrusion or a helpful "hint" from management. Managers were mostly invited or
excluded according to the circumstance as perceived by the QC members.
It was reasonable to expect that the attendance of middle management might be
caused by the demand characteristics. Their presence might also cause a high level
of demand characteristics, which in turn, might enhance QC workers' problem-solving
activities, namely, the number of projects they hid worked on and cost savings. In
fact, middle-level managers were invited to attend QC meetings mostly for these two
reasons. It was also plausibe that middle-level managers' attendance might help QC
members to further develop their problem-solving skills, increase their own
Involvement of QC activities, the morale of the teams, and set a good role model for
QCs.
Hypothesis 2: QCs with a high level of middle-management attendance
7
Quality Circ1J
7
will have a significantly higher number of QC projects attempted and
cost. savings than will QCs with a low level of attendance.
Lower-Management Attendance
In the literature, first-line supervisors have been frequently characterized as
men in the middle (Driscoll, Carroll, 6 Sprecher, 1978; Roethlisberger, 1945;
Schlesinger 6 Klein, 1982). Further, first-line supervisors do not share in the
"decision - making process" (Wray, 1949, p. 298), are not a real part of the "company
management" (Bittel 6 Ramsey, 1982, p. 27), and tend to identify socre closely with
workers than with management (Cole, 1971; Nosow, 1981). &Irvin (1986) examined the
responses from first-line supervisors in Japan and the U.S. and found that Japanese
supervisors "displayed a strong management commitment to quality" (p. 668), whereas
U.S. supervisors considered that "quality received far less emphasis than meeting
production schedules" (p. 669).
Although first-line supervisors may have the day-to-day contact and direct
authority over the QC team members and actually direct the team's effort, they may
not have enough "power" (cf. French 6 Raven, 1959), perceived demand characteristics
(PDC) (Salomon, 1984), and may not serve as a role model for members (cf. Bandura,
1977). It was hypothesized that lower management attendance would have no
significant relationship with QC effectiveness.
Rafaeli (1985) and Holcomb and Berger (1986) suggested that there was a tendency
toward higher satisfaction and positive attitudes with increasing tenure in QCs. It
was plausible that QC tenure might have an effect on QC attitudes and satisfaction,
Which in turn, might have an effect on QC effectiveness. In the present study,
several variables were significantly related to QC tenure, thus, besides the use of
multivariate analyses of variance (MANOVA), three separate sets of multivariate
analyses of covariance (MANCVAs) using QC tenure as a covariate were performed in
Quality Circle
8
order to determine the extent to which QC tenure would influence the effect of
management attendance on QC effectiveness.
Method
The subjects of the present study were 255 employees from 47 QCs of a middle
Tennessee structures fabrication and assembly plant. Data were collected over a
three-year period. The facility employed approximately 3200 when this project began
and over 4600 at its conclusion. Three hundred and sixteen workers (6.8% of the work
force) were involved in 53 QCs at the time of the study. The range of circle size
varied from 3 to 26 members with an average of 8.5 members per circle over the
three-year period. During this time period, 28 circles were formed in the first
year, 18 the second year, and 7 the third year. Of these 53 QCs, only 7 had survived
for the whole 36 months period. Seventeen QCs died before the end of the third year.
The major differences between active and inactive QCs were examined and presented
elsewhere (Tang et al., 1987b). Six new QCs were excluded from the present data
analyses because they had not completed any QC-related project. Of these 47 QCs, 11
QCs were in the white-collar category, 36 QCs were in the blue-collar category. All
blue-collar QCs were unionized. The differences between white- and blue-collar QCs
were examined and presented elsewhere (see Tang et al., 1987a).
The average age of workers involved in QCs was 36.8 years old. Their
educational level varied from grade school to graduate degrees with an average of
13.12 years of school. The average tenure of QC members with the company was 6.1
years.
Management Attendance
Top-, middle-, and lower-management attendance were operationally defined as
follows:
Top-Management Attendance. There was only one steering committee for the QC
9
Quality Circle
9
program which consisted of the company president, 12 vice - presidents from diffeent
areas of a division, and a QC program coordinator. The major purposes of this
steering committee were to identify new QCs, develop policies and procedures for QCs,
and implement QC projects when accepted. This committee met once a month. However,
when the situation called for more meetings they might meet as often as once a week.
For example, members of the steering committee might be asked to sit in a management
presentation where QC members presented their solutions to a problem or to act upon
the implementation of QC projects, then, the steering committee would meet in a
meeting. in the present study, only the attendance rate of these 12 vice presidents
was included in the calculation. Each vice president had direct responsibility ft-7 2
to 10 QCs in his or her own area.
The percentage of attendance at steering committee meetings reflected
top-management attendance and was obtained from steering committee minutes recorded
by the quality circle program coordinator. The range of scores for upper- management
attendance varied from 40% to 90%. A median split was employed to divide
upper-management attendance into high and low groups. The cut-off score was 78. The
mean and standard deviation of these variables are presented in Table 1.
Middle-Management Attendance. Middle-level managers were invited to attend QC
meetings. The number of meetings they actually attended, i.e., middle - management
attendance, was drawn from QC minutes recorded by the facilitator. Since such
appearances occured on an ad hoc basis and the rate of attendance was about 100% in
most cases, thus such appearances were tallied by the number of occurrences rather
than as a percentage. General supervisors, superintendents, managers, directors,
vice presidents (from other areas or division), industrial engineers, safety
engineers, supervisors from other areas, and technical support personnel were
included in the tally. The range of scores for middle-management attendance varied
10
Quality Circle
10
from 0 to 80. That is, one QC had never invited any middle-level manager to their
meetings, whereas the other QC had invited managers to their meetings 80 times. A
median split was again used to divide middle-management attendance into high and low
groups. The cut-off score was 17.5.
Lower-Management Attendance. Lower-management attendance was reflected as a
percentage of the number of QC meetings held where the first-line supervisor was
present. This was done because the leadership in QCs was not a very stable
measurement, whereas the supervisor of a QC was. Whether or not the supervisor
actually served as a leader of the QC was not included as a factor. The range of
scores for lower-management involvement varied from 0% to 100%. A high level of
attendance might mean that the supervisor attended the QC meetings very often or he
or she was the leader of the QC. The score of 88 was used as a cut-off point for a
median split. It should be pointed out that management attendance for these three
levels of managers was not manipulated by the researchers of the present study.
QC Effectiveness Variables
Motivation to Attend. It has been suggested that the amount of time an
individual spent on the target activity during the free-choice period (e.g., Amabile,
De.Tong, & Lepper, 1976; Deci, 1971, 1975; Lepper & Greene, 1975; Lepper, Greene, &
Nisbett, 1973; Tang, 1985, 1986, 1987; Tang & Baumeister, 1984; Tang, Liu, &
Vermillion, 1987; Shelley & Oldham, 1985) and his or her willingness to participate
in future expo-iments (cf. Amabile et al., 1975; Stew, Calder, Hess, & Sandelands,
1980) were considered different measures of intrinsic motivation. It should be
pointed out also that in the U.S., "QC membership" has been completely voluntary in
most organizations. Thus, no employee would be forced to attend QC meetings.
Following this line of reasoning, it was reasonable to believe that employees'
membership in QCs and their participation in QC-related meetings represented their
11
Quality Circle
11
motivation to attend QC (cf. Tang, Tollison, & Whiteside, 1987c).
Attendance Rate. QC members' attendance rate at QC meetings was obtained from
the QC minutes. Total actual hours of meetings attended across the life of the QC
were divided by the total possible hours across the life of the QC to obtain an
overall attendance percentage. This measure varied from 54.72 to 92.9Z.
QC Size. QC size reflected the number of members in a QC. QC size was examined
by averaging the number of QC members across the life of the QC in the three-year
period. QC size varied from 3 to 26 members.
Task Peformance. QC facilitators' cumulative project status reports were used to
examine QCle problem-solving activities. The reports were updated monthly and
reflected the dates QC projects were started, presented, accepted, implemented, or
dropped and whether or not a project report had been filed.
Project Attempted. The number of projects attempted was determined by examining
the facilitators' cumulative project status reports. The number of projects
attempted varied from 1 to 14 projects.
Project Dropped. The number of projects dropped for each QC was also examined in
the present study. The minimum and maximum of scores were 0 and 6, respectively.
However, the reasons for dropping the project were not available from the archival
data of QC programs.
Rate of Failure. The rate of failure was calculated by dividing the number of
projects dropped by the number of projects attempted. The rate of failure varied
from 0 to 1.00. Titus, for some QCs, the rate of failure was 100%.
Costs of Implementation. Costs of implementation and cost savings were recorded
following each presentation and were tallied ovet the period of time during which
each QC was in operation. Total costs of project implementation reflected estimates
submitted to the QC by plant engineering, industrial engineering, or purchasing,
12
Quality Circle
12
i.e., middle-level managers in the present study. The range of costs varied from 0 to
217,564 dollars.
Cost Savings. Total cost savings reflected labor reduction, efficient materials
usage, and met:Line downtime reduction as determined by QC members and industrial
engineers (i.e., middle-level managers) based on the collection of data in various
formats. The range of savings varied from 0 to 764,266 dollars. In the present
study, costs of implementation and cost savings were not yet available from 3 QCs.
QC Tenure. Finally, QC tenure was defined as the length of time the circle had
existed, as expressed in manufacturing days. The minimum and maximum of QC tenure
were 37 and 734 days, respectively,
R& cults
The means, standard deviations, and correlations amiGiag variables are presented
in Table 1. The major purpose of the present study was to examine the effect of
mangement attendance on QC effectiveness. All dependent variables (except QC tenure)
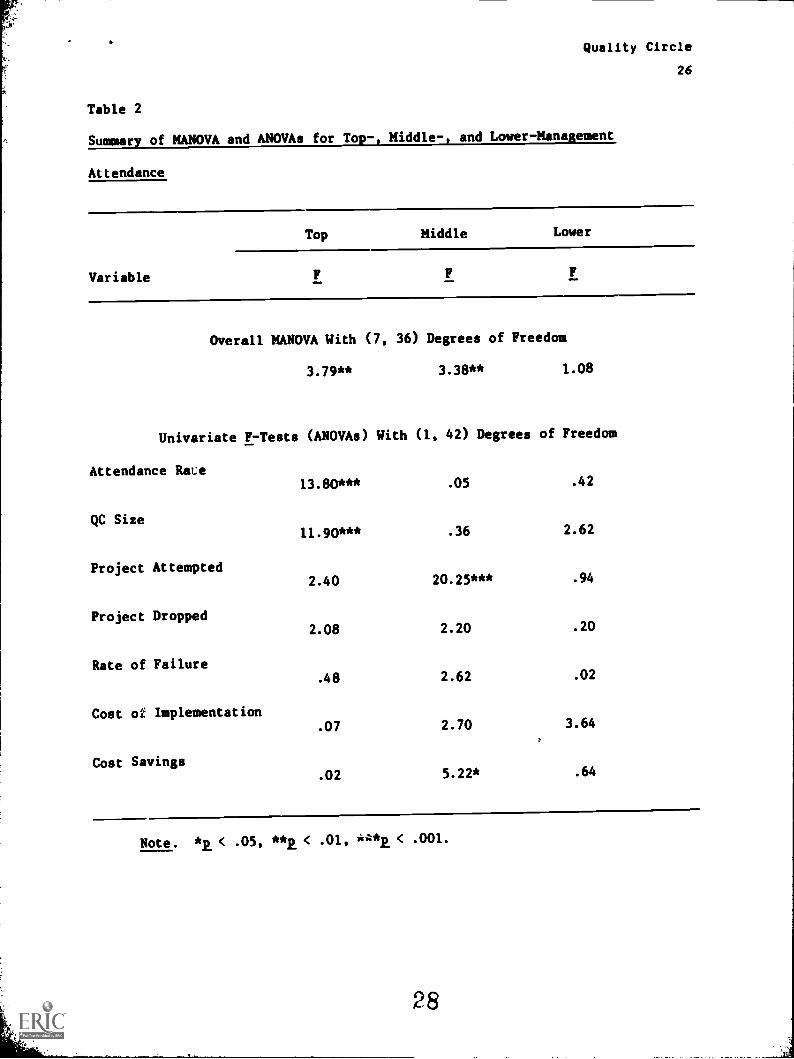
were analyzed in three separate sets of multivariate analyses of variance (MANOVAs),
using upper-, middle-, and lower-management attendance as the independent variable,
respectively (sc.;. Table 2). Significiant results were further analyzed by ANOVAs.
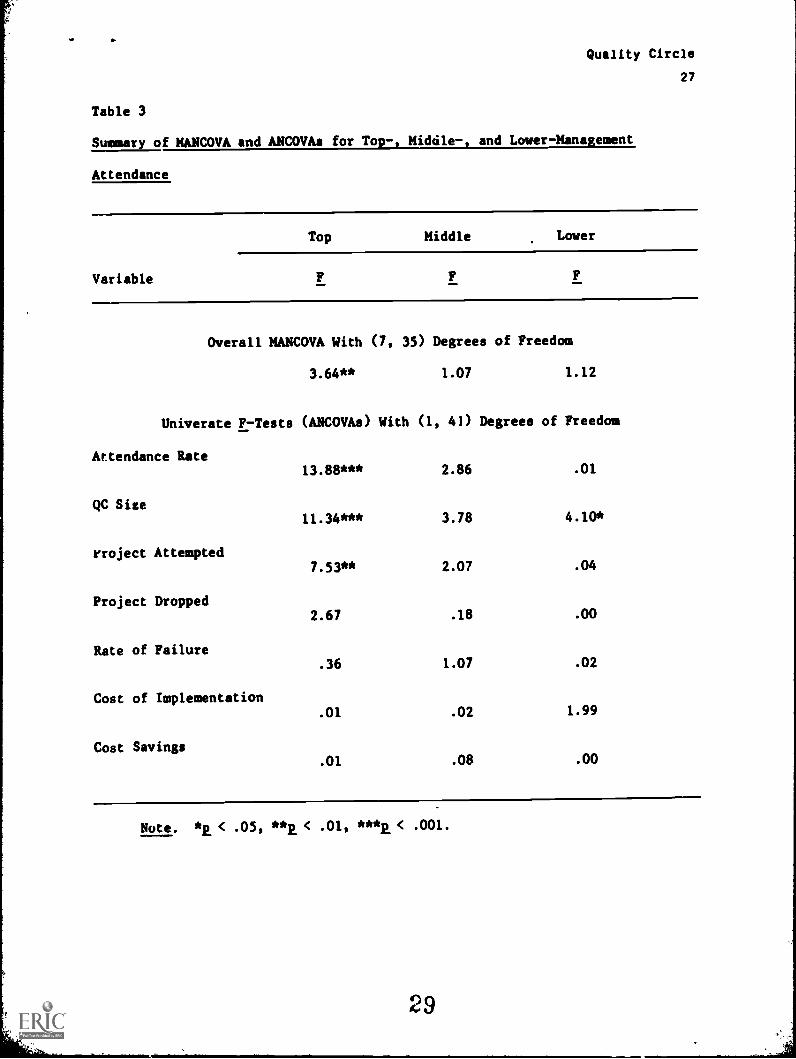
Further, three separate ws of multivariate analyses of covariance (MANCOVAs) were
also performed using QC tenure as a covariate, for upper-, middle-, and
lower-mangement attendance, respectively (see Table 3).
Insert Table 1 about here
Top-Management Attendance
It was hypothesized that QCs with a high level of upper-management attendance
would have a significantly higher level of motivation to attend than would QCs with a
13
Quality Circle
13
low level of upper-managment attendance. The results of a MANOVA supported this
hypothesis, F (7, 36) 3.79, .004, Wilks lambda - .58. Since the overall MANOVA
was significant, thus further univariate F-tests ( ANOVAs) were conducted. The
results of these ANOVAs showed this difference to reside in members' attervisnce rate
at QC meetings, F (1, 42) 13.80, E .001, omega squared - .110 and QC size, F (1,
42) - 11.90, ito .001, omega squared - .180 (see Table 2).
More specifically, attendance in QCs with higher upper-management attendance was
significantly higher (M 83.52%) than in QCs with low upper-management attendance (M
u 77.01%). Membership (QC size) in QCs with a high level of management attendance
was also higher (M - 10.40) than in QCs with a lou level of attendance (M .0 7.67).
Further, the results of a MANCOVA showed that the effect of upper-management
attendance on QC effectiveness was significant, when QC tenure was treated as a
covariate, F (7, 35) - 3.64, - .005, Wilke lambda - .73 (see Table 3). Thus, the
significant relationship between upper-management attendance and QC effectiveness was
not affected by QC tenure. The results of Table 3 further revealed that QCs with high
top-management attendance differed from QCs with low attendance on QC members'
attendance rite, F (1, 41) 13.88, P .001, QC size, F (1, 41) u 11.34, ito .002,
and the number of projects attempted, F (1, 41) - 7.53, 2 .009.
Insert Table 2 and 3 about here
Middle-Management Attendance
It was also hypothesized that QCs with a high level of middle-management
attendance world have a significantly higher level of QC effectiveness in terms of
the number of projects attempted and cost savings than would QCs with a low level of
middle-management attendance. The results of a MANOVA supported the hypothesis, F
Quality Circle
14
(7, 16) 3.39, p .007, Wilks lambda .60. Again, further ANOVAs were performed
In order to locate the sources of the significant overall MANOVA. The results of
univariate F-tests showed that the effect of middle- management attendance had
significant relationships with the number of QC projects attempted, F (1, 42) 20.55,
2. .001, omega squared .304, and cost savings, F (1, 42) 5.22, p .027, omega
squared .088.
The present results surested that QCs with a high level of middle-management
attendance had attempted to solve more QC projects (M 6.35) than had those with a
low level of attendance (M 2.89). Further, QCs with high management attendance
also had a significantly higher amount of cost savings (M $146,410) than had QCs
with low management attendance (M $40,970). However, when the results were
analyzed in aMANCOVA when QC tenure was controlled as a covariate, the same effect
fatted to reach significance, F (7, 35) 1.07, p - .401, Wilke lambda .82 (see
Table 3). Thus, the significant impacts of middle-management attendance on QC
effectiveness were related to QC tenure.
Lower - Management Attendance
It was predicted that no significant differences would be expected between QCs
with a high or low level of lower-management attendance. The results of a MANOVA
showed that the effect of lower-management attendance on QC effectiveness failed to
reach significance, F (7, 36) 1.08, p .398, Wilks lambda .83. A similar
pattern of result was also found in a MANCOVA, F (7, 35) 1.12, p .372, Wilke
lambda .82. Thus, lower-management attendance had no impact on QC effectiveness.
Correlational Data
Since the independent variables examined in the present study were not
manipulated, the correlations among these variables were examined. The results of
Table 1 showed that the three levels of management attendance were not significantly
Quality Circle
15
correlated. FIrther, upper-management attendance was significantly correlated with
the attetIdance rate at QC meetings and QC membership (QC size). Middle-management
attendance was correlated with the attendance rate at QC meetings, the number of
projects attempted, cost savings, and QC tenure. However, lower-management
attendance was not related to any of these variables.
Further, the attendance rate at QC meetings was associated with QC size. QC
tenure was significantly correlated with the number of projects attempted, costs of
QC project implementation, and cost savings. QC tenure was negatively correlated
with the rate of failure (dropped/attempted). However, QC tenure was not
significantly correlated with the number of projects dropped. Therefore, dropping a
QC project does not seem to be related to the life of a QC. However, a high rate of
failure may be related to the survival of a QC. The number of projects attempted was
positively correlated with the number of projects dropped, costs of QC project
implementation and cost savings. Finally, cost of implementation and cost savings
were positively correlated.
Discussion
One of the strengths of this paper is also related to its weaknesses, namely,
the data for the research are archival and not self-report. Therefore, many of the
probleNs that are characteristic of self-report data are absent. A major weakness of
the present study is that QCs are not formed randomly, and that they come from areas
that have some relationship among them (related by technology, output, etc.). Thus,
it will not be the case that observations based upon these units will be independent
of one another. Further, some of these QCs may have the same steering committee and
consequently the same upper management. Thus, the scores related to upper-management
attendance may not be completely indepedent. Given the warnings concerning the
weakness of the archival data of QCs, the prescat study attempts to empirically
i6
Quality Circle
16
document the relationshp between management attendance and the effectiveness of
quality circles.
The results of the present study suggest that upper-management attendance, as
measured by the attendance rate at steering committee meetings, is significantly
related to members' attendance rate at QC meetings, the number of members involved in
QC activities, and the number of projects attempted. Further, the relationship
between upper-management attendance and motivation to attend is not affected by QC
tenure.
It is possible that upper-management attendance is related to QC members' high
motivation to attend QCs and problem - solving activities, because QC activities,
according to Marks, Mirvis, Hackett, and Grady (1986), are expected to lead to
"improved working conditions and greater opportunities for expression and
self-development for participating employees" (p. 61). Further, Dean (1985) stated
that the desire for greater involvement in the organization and a belief that QCs
will be instrumental in solving problems of quality, productivity, and working
conditions relate significantly to an individual's decision to join a circle.
Because management attendance was not manipulated by the present researchers, it
is also possible that these managerial behaviors may themselves be a product of QC
performance and members' active involvements in QC-related activities and not
necessarily a cause of it. It is plausible that certain QCs try to work on
interesting and important projects. These projects attract more members to get
involved in QC meetings which in turn, may have demanded upper management personnel
to attend QC steering committee meetings. Further, managers are more likely to
attend acing committee meetings if the number of projects and type of projects are
consistent with managers' expectations and the projects involved thousands of dolars
in costs of implementation and cost savings. The implication here is that upper-level
17
Quality Circle
17
management may be more likely to attend because of the cost impact; their attendance
may not result in greater cost savings.
Tt is reasonable to expect that upper-level managers have "power" in an
organization (cf. French & Raven, 1959), thus, these managers' participation and
involvement in QC activities may led to a high level of "perceived demand
characteristics" (cf. Salomon, 1984) and may have created a modeling effect for QC
members, thus, QC members also have a high level of involvement and participation in
QC-related activities (cf. Bandura, 1977). It is suggested that QC members'
subjective perceptions and feelings should be measured directly in future studies.
Directors, industrial engineers, safety engineers, managers, and other
supporting personnel are invited to attend QC meetings. These middle-level managers
may be able to offer their knowledge, expertise, information, and related resources
to those QCs and help them select the right QC projects and start the process.
Further, middle-level managers also help QCs calculate the cost savings.
Therefore, middle-management attendance may bear a significant relationship to the
number of QC projects attempted and costs savings.
It is reasonable to believe that the number of projects QCs attempted and cost
savings are accumulative in nature over the years. Therefore, when QC tenure is
controlled as a constant, the relationship between management attendance and these
two variables disappears. The results of the present study strongly support the
notion that QC programs can save the company some money (e.g., Bocker & Overgaard,
1982; Wayne, Griffin, & Bateman, 1986) and middle-management attendance is strongly
related Co cost savings.
The relationship between lower-management (first-line supervisor) attendance and
QC effectiveness is not significant. It is plausible that QC workers may have
considered the "first-line supervisor" as "one of us", thus, the presence,
18
Fin
Quality Circle
18
involvement, and visibiity of the first-line supervisor do not lead to a high level
of perceived demand characteristics and may not create the modeling effect for QC
members. It is also possible that lower-level managers may have less "power" than
upper- and middle-level managers (cf. French & Raven, 1959), thus, lower-level
managers' involvement is not significantly related to QC members' involvement and
performance in QCs. It is also very likely that the workers were afraid not to
attend but that while they attended they were just going through the motions.
However, it is easy to understand that the consequences of social loafing in front of
a first-line supervisor, a middle-level manager, and a top-level manager are probably
not the same. In the case of a top-level manager, the consequences can be very
fatal. Finally, it is plausible that the lack of significant results may be related
to the lack of variation on this variable. An examination of the standard deviation
of lower-management attendance suggests that this may not be the case. These
suggestions can be used to support the notion that first-line supervisors may not
been perceived as a real part of the company management (cf., Bittel & Ramsey, 1982;
Driscoll et al., 1978; Schlesinger & Klein, 1982).
In the present study, the three different measures of management attendance were
not manipulated by the present researchers. Thus, causal assertions may be tempered.
Further, the three levels of management attendance reflect management personnel's
attendance of QC steering committee meetings and/or QC meetings. There is a big
difference between attending steering committee meetings and attending QC sessions.
Thus, a direct comparison of two different types of attendance may not be feasible.
It is suggested that other forms of management involvement and support, QC members'
subjective perceptions of management involvement, support, and the modeling effect
should be examined directly in future research.
Quality Circle
19
References
Amabile, T. M., DeJong, W., & Lepper, M. R. (1976). Effects of externally
imposed deadlines on subsequent intrinsic motivation. Journal of
Personality and Social Psychology, 34 (1), 92-98.
Bandura, A. (1977). Social learning theory. Englewood Cliffs, NJ:
Prentice-Hall.
Barrick, M. R., & Alexander, R. A. (1987). A review of quality circle
efficacy and the existence of positive-findings bias. Personnel
Psychology, 40, 579-592.
Btttel, L. R., & Ramsey, J. E. (1982). The limited, traditional world of
supervisors, Harvard Business Review, 60 (4), 26-31, 36.
Blocker, H., & Overgaard, H. (1982). Japanese quality circles: A
managerial response to the productivity problem. International
Management Review, 22, 13-16.
Cole, R. E. (1971). Japanese blue collar. Berkeley: University of
California Press.
Cole, R. E., & Tachiki, D. S. (1983). Japanese quality circles:
Preliminary comparisons. The Quality Circles Journal, 6, 11-16.
Dean, J. W. (1985). The decision to participate in quality circles.
Journal of Applied Behavioral Science, 21 (3), 317-327.
Deci, E. L. (1971). Effects of externally mediated rewards on intrinsic
motivation. Journal of Personality and Social Psychology,
18, 105-115.
Deci, E. L. (1975). Intrinsic motivation. New York: Plenum Press.
Driscoll, J. W., Carroll, D. J., & Sprecher, T. A. (1978). The first-level
supervisor: Still "the man in the middle." Sloan Management
Review, 19, (2), 25-37.
Quality Circle
20
French, J. R. P., & Raven, B. (1959). The bases of social power. In
D. Cartwright (Ed.), Studies of social power. Ann Arbor, MI:
institute for Social Research.
Garvin, D. A. (1986). Quality problems, policies, and attitudes in the
United States and Japan: An exploratory study. Academy of
Managenent Journal, 29 (4), 653-673.
Gibson, P. (1981). Short-term fad or long-term fundamental: The need
for research 'nix, the quality circle process. The Quality Circles
Journal, 4, 25-26.
Goodman, P. S. (1983). Sustaining quality circles: Inherent problems
some strategies. The Quality Circles Journal, 6, 6-8.
Holcomb, L., & Berger L. (1986). Perceptual differences in attitudes
on quality circles. Quality Circle Digest, 6, 46-53.
Ingle, S. (1982). Quality circles master guide: Increasing productivity
with people power. Englewood Cliffs, NJ: Prentice-Hall.
Lawler, E. E. (1986). High inv lvenent management. San Francisco,
CA: Jossey-Bass Publishers.
Lawler, E. E., & Mohrman, S. A. (1985). Quality circles after the fad.
Harvard Business Review, 65-71.
Lepper, M. R., & Greene, D. (1975). Turning play into work: Effects of
adult surveillance and extrinsic rewards on children's intrinsic
motivation. Journal of Personality and Social Psychology,
31, 479-486.
Lepper, M. R., Greene, D., & Nisbett, R. E. (1973). Undermining children's
intrinsic interest with extrinsic reward: A test of the
"overjustification" hypothesis. Journal of Personality and Social
Psychology, 28, 129-137.
21
Quality Circle
21
Marks, M. L., Mirvis, P. H., Hackett, R. J., and Grady, J. F. (1986).
Employee participation in a quality circle program: Impact on
quality of work life, productivity, and absenteeism. Journal
of Applied Psychology, 71, 61-69.
Rogow, S. (1981). The first-line supervisor, the linchpin in the
Japanese quality control circle, Industrial Management, 23,
(1), 19-23.
Orne, M. T. (1962). On the social psychology of the psychological
experiment: With particular reference to demand characteristics
and their implications. American Psychologists, 17, 776-783.
Rafaeli, A. (1985). Quality circles and employees attitudes.
Personnel Psychology, 38, 603-615.
Meter, W. S. (1983). Quality control circles: Development and
Implementation. In Quality Circle Papers: A Compilation.
Milwaukee: ASQC, 1-10.
Roethlisberger, F. J. (1945). The foreman: Master and victim of double
talk. Harvard Business Review, 23, 283-298.
Salomon, G. (1984). Television is "easy" and print is "tough": The
differential investment of mental effort in learning as a
function of perceptions and attributions. Journal of Educational
Psychology, 76 (4), 647-658.
Schlesinger, L. A., & Klein, J. A. (1982). The first-line supervisor:
Past, present, and future. Working paper No. 83-70, Havard
Business School, Harvard University, Boston. Reprint. 1986. In
J. W. Lorsch (Ed.), Handbook of organisational behavior.
Englewood Cliffs, NJ: Prentice-Hall.
22
Quality Circle
Shelley, C. E., & Oldham, G. R. (1985). Effects of goal difficulty and
expected external evaluation on intrinsic motivation: A
laboratory study. Academy_ of Management Journal, 28 (3), 628-640.
Stew, B. M., Calder, B. J., Hess, R. R., & Sandelands, L. E. 1980.
Intrinsic motivation and norms about payment. Journal-of
Personality, 48, 1-14.
Tang, T. L. P. (1985). Effects of the Protestant work ethic and effort
performance feedback on intrinsic motivation. Paper presented at
the National and Western Region Conference of the Association of
Human Resources Management and Organizational Behavior, Denver, CO.
Tang, T. L. P. (1986). Effects of Type A personality and task labels
(work vs. leisure) on task preference. Journal-of Leisure
Research, 18 (1), 1-11.
Tang, T. L. P. (1987). Effects of the Protestant work ethic and
perceived challenge on task preference. Paper submitted for.
publication.
Tang, T. L. P., 11 Baumeister, R. F. (1984). Effects of personal values,
perceived surveillance, and task labels on task preference: The
Ideology of turning play into work. Journal of Applied Psychology,
69 (1), 99-105.
Tang, T. L. P., Liu, H., & Vermillion, W. H. (1987). Effects of self-
esteem and task labels (difficult vs. easy) on intrinsic motivation,
goal setting, and task performance. Journal of General.Psychology,
114 (3), 249-262.
23
22
Quality Circle
23
Tang, T. L. P., Tollison, P. S., & Whiteside, H. D. (1986, March). Quality
circle effectiveness II: Effects of management support, self
vs. other initiation, and collar color. Paper presented at the
32nd Annual Meeting of the Southeastern Psychological Association,
Kissimmee, FL.
Tang, T. L. P., Tollison, P. S., & Whiteside, H. D. (1987a, April)
Quality circle effectiveness as a function of upper-management support,
circle initiation, and collar color. Paper presented at the 33rd
Annual Convention of the Southwestern Psychological Association,
New Orleans, LA.
Tang, T. L. P., Tollison, P. S., & Whiteside, H. D. (1987b, March). The
survivel of quality circles: An examination of the major
in- process differences between active and inactive quality circles.
Paper presented at the 33rd Annual Meeting of the Southeastern
Psychological Association, Atlanta, GA.
Tang, T. L. P., Tollison, P. S., & Whiteside, H. D. (1987c). The
effect of quality circle initiation on motivation to attend quality
circle meetings and on task performance. Personnel Psychology, 40,
799-814.
Tollison, P. S. (1986a). Evaluating program success: Incremental
measurement of in-process goals. Paper presented at the 18th
Annual Conference of the International Association for Quality
Circles, Baltimore, MD.
Tollison, P. S. (1986b). The business of business. Quality Circle
Digest, 6 (10): 85-89.
Quality Circle
Tollison, P. S., Tang, T. L. P., & Whiteside, H. D. (1986, March). Quality
circle effectiveness I: A correlational study. Paper presented
at the 32nd Annual Meeting of the Southeastern Psychological
Association, Kissimmee, FL.
Wayne, S. J., Griffin, R. W., & Bateman, T. S. (1986). Improving the
effectiveness of quality circle. Personnel Administrator,
31 (3), 79-88.
Wray, D. E. (1949). Marginal men of industry: The foreman. American
Journal of Sociology, 54, 298-301.
25
24
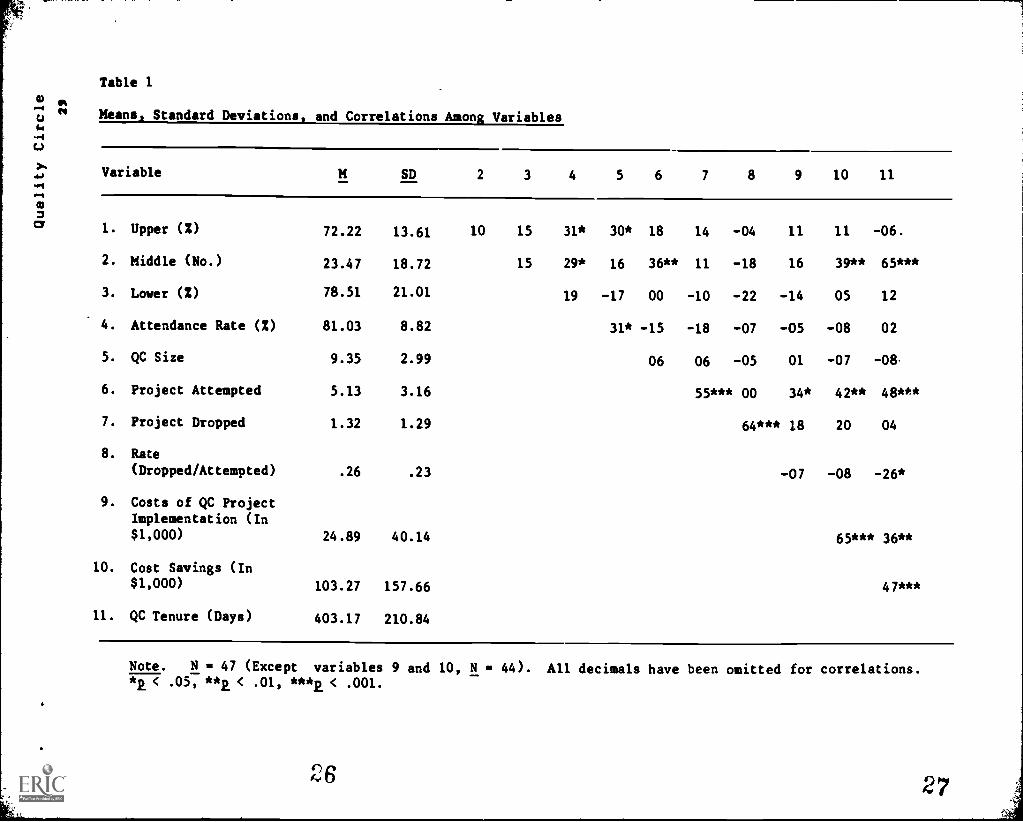
Table 1
Means, Standard Deviations, and Correlations Among Variables
Variable SD 2 3 4 5 6 7 8 9 10 11
1.
2.
3.
4.
5.
6.
7.
8.
9.
10.
11.
Upper (2)
Middle (No.)
Lower (2)
Attendance Rate (%)
QC Size
Project Attempted
Project Dropped
Rate
(Dropped/Attempted)
Costs of QC ProjectImplementation (In$1,000)
Cost Savings (In$1,000)
QC Tenure (Days)
72.22
23.47
78.51
81.03
9.35
5.13
1.32
.26
24.89
103.27
403.17
13.61
18.72
21.01
8.82
2.99
3.16
1.29
.23
40.14
157.66
210.84
10 15
15
31*
29*
19
30*
16
-17
31*
18
36**
00
-15
06
14
11
-10
-18
06
55***
-04
-18
-22
-07
-05
00
64***
11
16
-14
-05
01
34*
18
-07
11
39**
05
-08
-07
42**
20
-08
65***
-06.
65***
12
02
-08.
48***
04
-26*
36**
47***
Note. N = 47 (Except variables 9 and 10, N = 44). All decimals have been omitted for correlations.< .05, **E < .01, ***E < .001.
Quality Circle
26
Table 2
Summary of MANOVA and ANOVAs for Top-, Middle-, and Lower-Management
Attendance
Top Middle Lower
Variable
Overall MANOVA With (7, 36) Degrees of Freedom
3.79** 3.38** 1.08
Univariate F-Tests (ANOVAs) With (1, 42) Degrees of Freedom
Attendance Rate
QC Size
13.80***
11.90***
.05
.36
.42
2.62
Project Attempted2.40 20.25*** .94
Project Dropped2.08 2.20 .20
Rate of Failure.48 2.62 .02
Cost of Implementation.07 2.70 3.64
Cost Savings.02 5.22* .64
Note. *2. < .05, **2. < .01, igA*2. < .001.
28
Quality Circle
27
Table 3
Summary of MANCOVA and ANCOVAs for Top-, Middle-, and Lower-Management
Attendance
Top Middle Lower
Variable
Overall MANCOVA With (7, 35) Degrees of Freedom
3.64** 1.07 1.12
Univerate F-Tests (ABCOVAs) With (1, 41) Degrees of Freedom
Attendance Rate13.88*** 2.86 .01
QC Size11.34*** 3.78 4.10*
Project Attempted7.53** 2.07 .04
Project Dropped2.67 .18 .00
Rate of Failure.36 1.07 .02
Cost of Implementation.01 .02 1.99
Cost Savings.01 .08 .00
Note. *p < .05, * *p < .01, ***k. < .001.
29