!do not print! front cover goes here · !do not print! front cover goes here see separate artwork...
TRANSCRIPT
!DO NOT PRINT!
FRONT COVERGOES HERE
SEE SEPARATE ARTWORK SUPPLIEDFF GROUP_STATS 11_COVER_AW
Registered Number 614802952 Weeks Ended 28 May 2011
!DO NOT PRINT!
INSIDE FRONT COVERGOES HERE
SEE SEPARATE ARTWORK SUPPLIEDFF GROUP_STATS 11_COVER_AW
Registered Number 614802952 Weeks Ended 28 May 2011
FatFace GroupLimited(formerly Fat Face World Limited)
Directors’ Report & ConsolidatedFinancial Statements

ContentsSection One: Business ReviewGroup Chairman’s Statement 2Business Review and Directors’ Report 4Statement of Directors’ Responsibilities 10Independent Auditor’s Report 11
Section Two: Financial StatementsConsolidated Income Statement 13Statement of Comprehensive Income 14Statement of Financial Position 15Statement of Changes in Equity 16Cash Flow Statements 18
Section Three: NotesNotes to the Financial Statements 20
Life is out there...fatface.com
2 / Directors’ Report & Consolidated Financial Statements
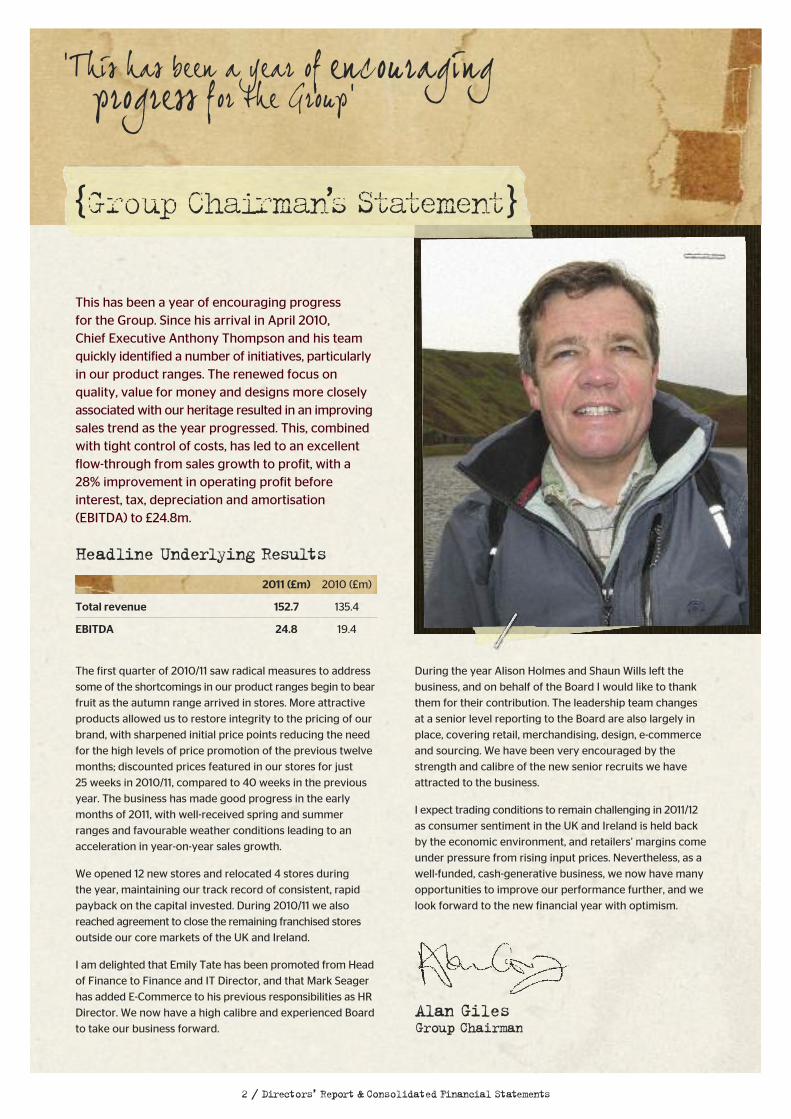
This has been a year of encouraging progress for the Group. Since his arrival in April 2010, Chief Executive Anthony Thompson and his teamquickly identified a number of initiatives, particularlyin our product ranges. The renewed focus onquality, value for money and designs more closelyassociated with our heritage resulted in an improvingsales trend as the year progressed. This, combinedwith tight control of costs, has led to an excellentflow-through from sales growth to profit, with a28% improvement in operating profit beforeinterest, tax, depreciation and amortisation(EBITDA) to £24.8m.
‘This has been a year of encouraging progress for the Group’
During the year Alison Holmes and Shaun Wills left the
business, and on behalf of the Board I would like to thank
them for their contribution. The leadership team changes
at a senior level reporting to the Board are also largely in
place, covering retail, merchandising, design, e-commerce
and sourcing. We have been very encouraged by the
strength and calibre of the new senior recruits we have
attracted to the business.
I expect trading conditions to remain challenging in 2011/12
as consumer sentiment in the UK and Ireland is held back
by the economic environment, and retailers’ margins come
under pressure from rising input prices. Nevertheless, as a
well-funded, cash-generative business, we now have many
opportunities to improve our performance further, and we
look forward to the new financial year with optimism.
Alan GilesGroup Chairman
The first quarter of 2010/11 saw radical measures to address
some of the shortcomings in our product ranges begin to bear
fruit as the autumn range arrived in stores. More attractive
products allowed us to restore integrity to the pricing of our
brand, with sharpened initial price points reducing the need
for the high levels of price promotion of the previous twelve
months; discounted prices featured in our stores for just
25 weeks in 2010/11, compared to 40 weeks in the previous
year. The business has made good progress in the early
months of 2011, with well-received spring and summer
ranges and favourable weather conditions leading to an
acceleration in year-on-year sales growth.
We opened 12 new stores and relocated 4 stores during
the year, maintaining our track record of consistent, rapid
payback on the capital invested. During 2010/11 we also
reached agreement to close the remaining franchised stores
outside our core markets of the UK and Ireland.
I am delighted that Emily Tate has been promoted from Head
of Finance to Finance and IT Director, and that Mark Seager
has added E-Commerce to his previous responsibilities as HR
Director. We now have a high calibre and experienced Board
to take our business forward.
2011 (£m) 2010 (£m)
Total revenue 152.7 135.4
EBITDA 24.8 19.4
Headline Underlying Results
{GroupChairman’sStatement}

3 / Directors’ Report & Consolidated Financial Statements
SectionOne:
BusinessReview
4 / Directors’ Report & Consolidated Financial Statements
{Business Review & Directors’Report}
BusinessReview
Principal ActivitiesFat Face is a UK based retailer, specialising in the design and sale of active lifestyle clothing and related accessories.From a few sweatshirts in 1988, the Fat Face brand hasgrown to what it has become today. The Group offers a wide range of womenswear, menswear, childrenswear,footwear and accessories. Distribution is via three mainchannels: 190 stores in the UK and Ireland, home shoppingchannel and wholesale.
TradingWhilst the retail sector continued to face tough marketconditions, the initiatives put in place, particularly focused onimproving the product ranges over the last year, have meantthat the Group saw trading improve as the year progressed.
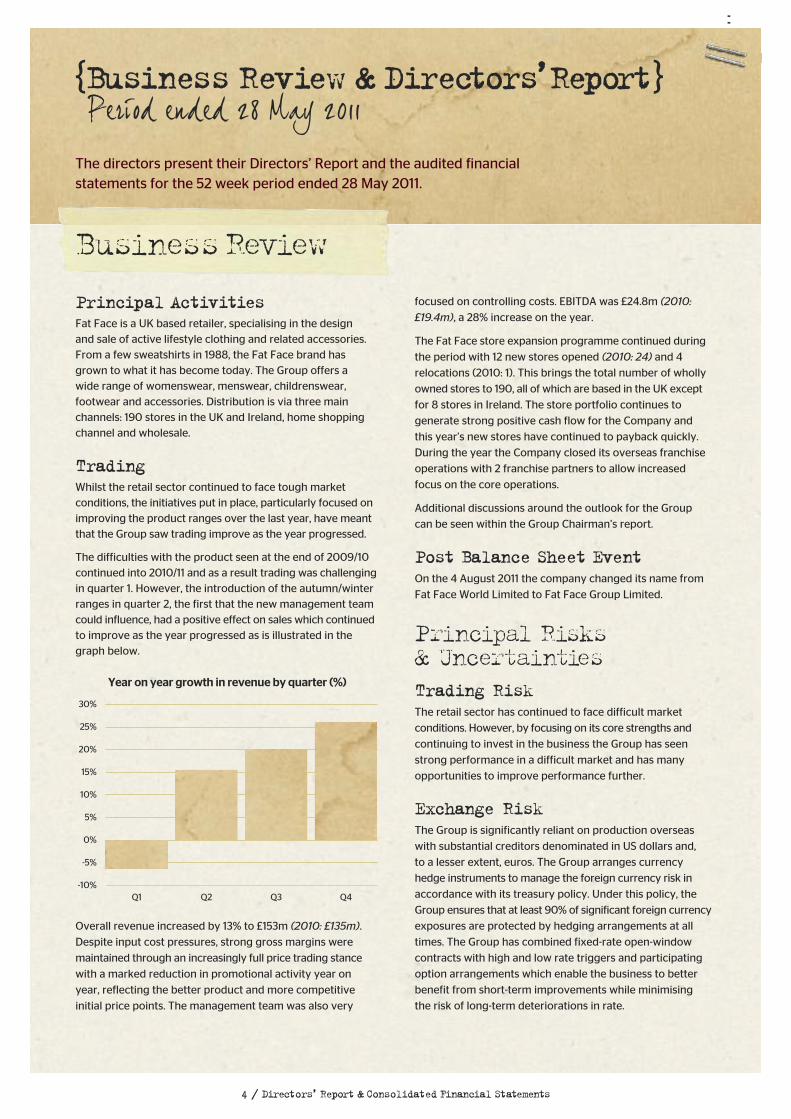
The difficulties with the product seen at the end of 2009/10continued into 2010/11 and as a result trading was challengingin quarter 1. However, the introduction of the autumn/winterranges in quarter 2, the first that the new management teamcould influence, had a positive effect on sales which continuedto improve as the year progressed as is illustrated in thegraph below.
Overall revenue increased by 13% to £153m (2010: £135m).
Despite input cost pressures, strong gross margins were
maintained through an increasingly full price trading stance
with a marked reduction in promotional activity year on
year, reflecting the better product and more competitive
initial price points. The management team was also very
The directors present their Directors’ Report and the audited financialstatements for the 52 week period ended 28 May 2011.
Year on year growth in revenue by quarter (%)
-5%
-10%
0%
5%
10%
15%
20%
25%
30%
Period ended 28 May 2011
3.93.93.93.93.93.93.9
Q1 Q2 Q3 Q4
focused on controlling costs. EBITDA was £24.8m (2010:
£19.4m), a 28% increase on the year.
The Fat Face store expansion programme continued during
the period with 12 new stores opened (2010: 24) and 4
relocations (2010: 1). This brings the total number of wholly
owned stores to 190, all of which are based in the UK except
for 8 stores in Ireland. The store portfolio continues to
generate strong positive cash flow for the Company and
this year’s new stores have continued to payback quickly.
During the year the Company closed its overseas franchise
operations with 2 franchise partners to allow increased
focus on the core operations.
Additional discussions around the outlook for the Group
can be seen within the Group Chairman’s report.
Post Balance Sheet EventOn the 4 August 2011 the company changed its name from
Fat Face World Limited to Fat Face Group Limited.
Principal Risks & UncertaintiesTrading RiskThe retail sector has continued to face difficult market
conditions. However, by focusing on its core strengths and
continuing to invest in the business the Group has seen
strong performance in a difficult market and has many
opportunities to improve performance further.
Exchange RiskThe Group is significantly reliant on production overseas
with substantial creditors denominated in US dollars and,
to a lesser extent, euros. The Group arranges currency
hedge instruments to manage the foreign currency risk in
accordance with its treasury policy. Under this policy, the
Group ensures that at least 90% of significant foreign currency
exposures are protected by hedging arrangements at all
times. The Group has combined fixed-rate open-window
contracts with high and low rate triggers and participating
option arrangements which enable the business to better
benefit from short-term improvements while minimising
the risk of long-term deteriorations in rate.
5 / Directors’ Report & Consolidated Financial Statements
These are monitored via the risk register which has been
introduced during this financial year. The directors oversee
the development of internal control processes to ensure that
these risks are managed appropriately. Executive directors
and operational management are delegated with the task
of implementing these processes and reporting to the Board
on their outcomes.
Topics included on the register or which are reviewed
regularly by the Board include:
Health and SafetyThe directors recognise the importance of health and safety
at work. The health and safety of the Group’s employees,
customers, contractors, sites and equipment is of great
importance. There is a comprehensive structure of processes
and procedures to mitigate the health and safety risk, including
risk assessments, accident reporting, and nominated health
and safety representatives across the business. Policies and
procedures are reviewed and audited regularly to make
safety management more robust and fully up to date.
Ethical TradingWith a large global supplier base, the directors recognise
that there is a potential risk that certain suppliers may not
work within the required ethical standards of the Group.
This could result in a poor perception of the Group in the
market and could have a negative impact on the brand.
The Group has developed an ethical trading policy with
which it ensures that all suppliers are in agreement. It is also
a member of the Ethical Trading Initiative. For further details
please refer to the Corporate Social Responsibility section
of this report.
SectionOne:
BusinessReview
Euro denominated sales are more than sufficient to offset
the exchange risk arising from purchases denominated in
euros. The excess euro cash generated from sales is not
sufficient to represent a material risk to the business.
Financial RiskThe Group manages its exposure to interest rate risk by the
use of an interest rate cap covering most of its variable rate
debt. In addition, detailed reporting and cash forecasting
ensures that the Group’s liquidity is maintainable into the
medium term.
The Group’s external financing arrangements include
conventional covenant tests as is customary with agreements
of this type. The Group’s performance against those tests is
measured on a quarterly basis and management maintain
ongoing forecasts of performance to ensure that all tests
can be met. The Group met all covenants tested during
the period.
Liability RiskThe Group maintains usual commercial insurance policies for
a business of this type. The Group undertakes a critical review
of all coverage limits and the applicability of deductibles and
franchises during each annual review process.
-----In addition to the risks above, the Board has a policy of
ongoing identification and review of key business risks which
may restrict or seriously impact the ability of the Group to
carry on its operations or may damage the brand.

6 / Directors’ Report & Consolidated Financial Statements
Key PerformanceIndicatorsA key performance indicator (KPI) scorecard is currently beingdeveloped to allow the directors to review detailed informationcovering a range of financial and non-financial indicators for the Group. Some of the key indicators which are alreadybeing monitored include:
• operating profit before depreciation (EBITDA)
• payroll % to sales
• labour turnover rate
• cash
Corporate SocialResponsibilitySuppliersFat Face’s supplier base is crucial to meeting the Group’srequired quality and ethical standards and ensuring that the product is available on time. Through a combination of extending the supplier base and managing the existingsuppliers, the Group is able to reduce any over-reliance onparticular suppliers and improve on the competitiveness of the product.
The Group continues to ensure that all suppliers are awareof and agree to the Group’s ethical and operating standardswhich are fully documented and shared with suppliers. In addition to ensuring that all local laws are adhered to,these require:
• remuneration for employees must be fair andcommensurate with the work undertaken;
• children may not be employed;
• no discrimination on the basis of race, gender, religion or ethnic background;
• no forced labour;
• no inappropriate disciplinary practices;
• freedom of association for all employees; and
• health & safety policies must be established and enforced.
To underpin the Group’s commitment in this area, Fat Face is a member of the Ethical Trading Initiative. Under thisinitiative the Group agrees to audit the ethical standards of its suppliers and make the results of these audits available to other members. Equally, the Group is able to access theinvestigations carried out by other members into its current and potential suppliers.
Fat Face seeks to ensure that terms of payment specifiedand agreed with suppliers are not exceeded.
At the year end there were 54 days purchases in tradepayables (2010: 45).
SectionOne:
BusinessReview
7 / Directors’ Report & Consolidated Financial Statements
EmployeesThe Group is committed to valuing diversity, thereby seeking
to ensure the effective use of people in the best interests of
both the Group and its employees. It is the policy of Fat Face
to provide employment and development opportunities to
persons regardless of age, race, colour, religion, sex, sexual
preference, marital status, nationality, ethnic origin or
disability. It is Group policy to wherever possible retain in
employment employees who become disabled, providing
retraining opportunities where appropriate.
EnvironmentThe Group continually reviews its production processes to
ensure that it produces high quality product in ways that
reduce the impact on the environment. The Group recycled
321 (2010: 302) tonnes of cardboard out of Fat Base and
plastic out of many stores.
The Group continues to encourage better waste
management and energy efficiency around the business.
During the period Fat Face has installed around 70 smart
meters to around 60 stores across the estate which will
measure emissions within those stores, and this will provide
information to stores allowing them to control their energy
usage more efficiently.
All product suppliers are required to have an environmental
policy signed by their Chief Executive.
CommunityThe Group is committed to supporting the local
community, both in respect of employment and social
responsibility. As part of this the Group has worked with
the Education Business Partnership to encourage young
people into industry.
Proposed DividendThe directors do not recommend the payment of a dividend
(2010: nil).
Political& CharitableContributionsThe Group made no political contributions during the
current or preceding period.
In February 2009 the Fat Face Foundation was founded.
This is a registered charity with the objective of enabling
people to actively enjoy the outdoors and respect the
environments we play in. Most of the funding for the
Foundation has come from the sale of Foundation
associated products by the Group.
Donations to UK charities by the Group
during the year amounted to £87,981
(2010: £29,029), which was all donated to
the Foundation (2010: £28,573). During
the year, the Fat Face Foundation made
donations of £21,883 (2010: £24,705).
8 / Directors’ Report & Consolidated Financial Statements
Toby Bowhill(Appointed 28 June 2011)
Appointed Brand Director in May 2010, Toby joined Fat Faceafter spending eight years at Abercrombie and Fitch latterlyin the role of Hollister & Ruehl Concept Director.
Simon Pickering(Appointed 28 June 2011)
Appointed Design and Buying Director, Simon held a SeniorDirector role within the Arcadia Group, responsible for BHSand Burton. He is a former Director of Gap Europe,responsible for Menswear. Simon has previously held seniorbuying roles in Debenhams and Burton group.
Mark Seager (Appointed 28 June 2011)
Mark joined Fat Face in January 1997 as a store manager. Heprogressed through the retail channel with various field andcentrally based operational roles before taking on the wholesale,licensing and franchise programmes in 2008. In 2010 Markwas promoted to E-Commerce and HR Director.
Shaun Wills (Resigned 25 November 2010)
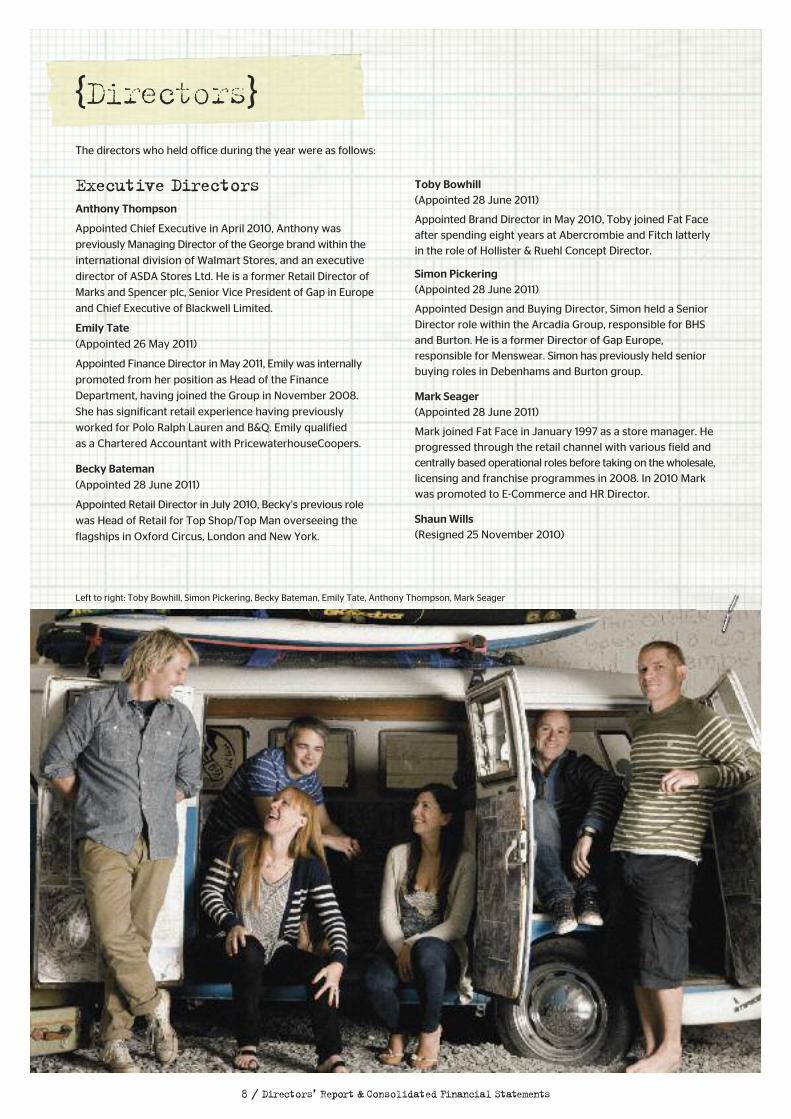
Left to right: Toby Bowhill, Simon Pickering, Becky Bateman, Emily Tate, Anthony Thompson, Mark Seager
{Directors}The directors who held office during the year were as follows:
Executive DirectorsAnthony Thompson
Appointed Chief Executive in April 2010, Anthony was
previously Managing Director of the George brand within the
international division of Walmart Stores, and an executive
director of ASDA Stores Ltd. He is a former Retail Director of
Marks and Spencer plc, Senior Vice President of Gap in Europe
and Chief Executive of Blackwell Limited.
Emily Tate(Appointed 26 May 2011)
Appointed Finance Director in May 2011, Emily was internally
promoted from her position as Head of the Finance
Department, having joined the Group in November 2008.
She has significant retail experience having previously
worked for Polo Ralph Lauren and B&Q. Emily qualified
as a Chartered Accountant with PricewaterhouseCoopers.
Becky Bateman(Appointed 28 June 2011)
Appointed Retail Director in July 2010, Becky’s previous role
was Head of Retail for Top Shop/Top Man overseeing the
flagships in Oxford Circus, London and New York.
SectionOne:
BusinessReview
ShareholdersBridgepoint has been Fat Face Group Limited’s majority
shareholder since 2007. For details of their shareholding
please refer to note 26. Bridgepoint hold the investment
within its Bridgepoint Europe III Fund. Guy Weldon and
Benoit Alteirac are monitoring the fund’s investment on
behalf of Bridgepoint.
Going ConcernIn adopting the going concern basis for preparing the
financial statements, the directors have considered the
principal activities as well as the business risks as set out
on pages 4 to 5. Based on the Group’s improved trading
performance in the period, cash flow forecasts and
projections and notwithstanding the net liabilities of
£22,213,000 (2010: £24,097,000), the Board continues to
be satisfied that the Group will be able to operate within
the level of its facilities for the foreseeable future (see note 17
in the financial statements for details of the Group facilities).
For this reason the Group continues to adopt the going
concern principle in preparing its financial statements.
Disclosure of Information to AuditorsThe directors who held office at the date of approval of this
Directors’ Report confirm that, so far as they are each aware,
there is no relevant audit information of which the Group’s
auditors are unaware; and each director has taken all the steps
that they ought to have taken as a director to make themselves
aware of any relevant audit information and to establish that
the Group’s auditors are aware of that information.
AuditorsPursuant to Section 487 of the Companies Act 2006, the
auditors will be deemed to be reappointed and KPMG LLP
will therefore continue in office.
By order of the board:
Anthony ThompsonChief Executive Officer
Unit 3, Ridgway, Havant, Hampshire PO9 1QJ
22 August 2011
9 / Directors’ Report & Consolidated Financial Statements
Non-Executive DirectorsAlan Giles
Alan Giles is Chairman of the Group. He was previously
Chief Executive of HMV Group from 1999 to 2006.
He formed HMV Group as a leveraged buy-out and led the
Group through its London Stock Exchange IPO in 2002.
He is a non-executive director of Rentokil Initial plc and
The Office of Fair Trading, an Associate Fellow at Said
Business School, University of Oxford and Honorary Visiting
Professor at Cass Business School.
Guy Weldon(Appointed by Bridgepoint)
Guy Weldon is a Bridgepoint partner and is responsible
for Bridgepoint’s UK investment activities as well as being
a member of the European Consumer investment team.
He joined Bridgepoint in 1990 and is based in its
London office.
Benoit Alteirac(Appointed by Bridgepoint on 28 June 2011)
Benoit joined Bridgepoint in 2002 and is also a member
of Bridgepoint’s European consumer investment team.
He is based in Bridgepoint’s London office.
Patrick Fox(Appointed by Bridgepoint, resigned 28 June 2011)
The Group provides Directors’ and Officers’ insurance protection
for all of the directors of the companies in the Group with
a £10,000,000 (2010: £10,000,000) limit of indemnity.
{Statementof Directors’Responsibilities}
10 / Directors’ Report & Consolidated Financial Statements
The directors are responsible for preparing the Directors' Report and the financial statements in accordance with applicable
law and regulations.
Company law requires the directors to prepare group and parent company financial statements for each financial year.
Under that law they have elected to prepare both the Group and the parent company financial statements in accordance
with IFRSs as adopted by the EU and applicable law.
Under company law the directors must not approve the financial statements unless they are satisfied that they give a true
and fair view of the state of affairs of the Group and parent company and of their profit or loss for that period.
In preparing each of the Group and parent company financial statements, the directors are required to:
• select suitable accounting policies and then apply them consistently;
• make judgments and estimates that are reasonable and prudent;
• state whether they have been prepared in accordance with IFRSs as adopted by the EU; and
• prepare the financial statements on the going concern basis unless it is inappropriate to presume that the Group
and the parent c ompany will continue in business.
The directors are responsible for keeping adequate accounting records that are sufficient to show and explain the group and
parent company's transactions and disclose with reasonable accuracy at any time the financial position of the group and parent
company and enable them to ensure that the financial statements comply with the Companies Act 2006. They have general
responsibility for taking such steps as are reasonably open to them to safeguard the assets of the group and to prevent and
detect fraud and other irregularities.
in respect of the Directors’ Reportand the Financial Statements
{Independent Auditor’s Report}
• the Group financial statements have been properly prepared
in accordance with IFRSs as adopted by the EU;
• the parent company financial statements have been properly
prepared in accordance with IFRSs as adopted by the EU
and as applied in accordance with the provisions of the
Companies Act 2006; and
• the financial statements have been prepared in accordance
with the requirements of the Companies Act 2006.
Opinion on Other Matter Prescribedby the Companies Act 2006In our opinion the information given in the Directors’ Report
for the financial year for which the financial statements are
prepared is consistent with the financial statements.
Matters on Which we are Requiredto Report by ExceptionWe have nothing to report in respect of the following matters
where the Companies Act 2006 requires us to report to you if,
in our opinion:
• adequate accounting records have not been kept by the
parent company, or returns adequate for our audit have
not been received from branches not visited by us; or
• the parent company financial statements are not in
agreement with the accounting records and returns; or
• certain disclosures of directors' remuneration specified
by law are not made; or
• we have not received all the information and explanations
we require for our audit.
W SmithSenior Statutory Auditor
For and on behalf of KPMG LLP, Statutory Auditor
Chartered Accountants, Dukes Keep
Marsh Lane, Southampton SO14 3EX
22 August 2011
SectionOne:
BusinessReview
11 / Directors’ Report & Consolidated Financial Statements
to the Members of Fat Face Group Limited(formerly Fat Face World Limited)
We have audited the financial statements of Fat Face Group
Limited (formerly Fat Face World Limited) for the period ended
28 May 2011 set out on pages 13 to 43. The financial reporting
framework that has been applied in their preparation is
applicable law and International Financial Reporting Standards
(IFRSs) as adopted by the EU and, as regards the parent
company financial statements, as applied in accordance with
the provisions of the Companies Act 2006.
This report is made solely to the company's members,
as a body, in accordance with Chapter 3 of Part 16 of the
Companies Act 2006. Our audit work has been undertaken
so that we might state to the company's members those
matters we are required to state to them in an auditor’s
report and for no other purpose. To the fullest extent
permitted by law, we do not accept or assume responsibility
to anyone other than the company and the company's
members, as a body, for our audit work, for this report,
or for the opinions we have formed.
Respective Responsibilities of Directors & AuditorAs explained more fully in the Directors' Responsibilities
Statement set out on page 10, the directors are responsible
for the preparation of the financial statements and for being
satisfied that they give a true and fair view. Our responsibility
is to audit, and express an opinion on, the financial statements
in accordance with applicable law and International Standards
on Auditing (UK and Ireland). Those standards require us to
comply with the Auditing Practices Board's (APB's) Ethical
Standards for Auditors.
Scope of the Audit of theFinancial StatementsA description of the scope of an audit of financial
statements is provided on the APB’s website at:
www.frc.org.uk/apb/scope/private.cfm
Opinion on Financial StatementsIn our opinion:
• the financial statements give a true and fair view of the state
of the Group’s and of the parent company's affairs as at 28
May 2011 and of the Group’s loss for the period then ended;

12 / Directors’ Report & Consolidated Financial Statements
Note Trading Non- 2011 Trading Non- 2010Results Recurring Results Recurring
2011 Items 2010 Items£000 £000 £000 £000 £000 £000
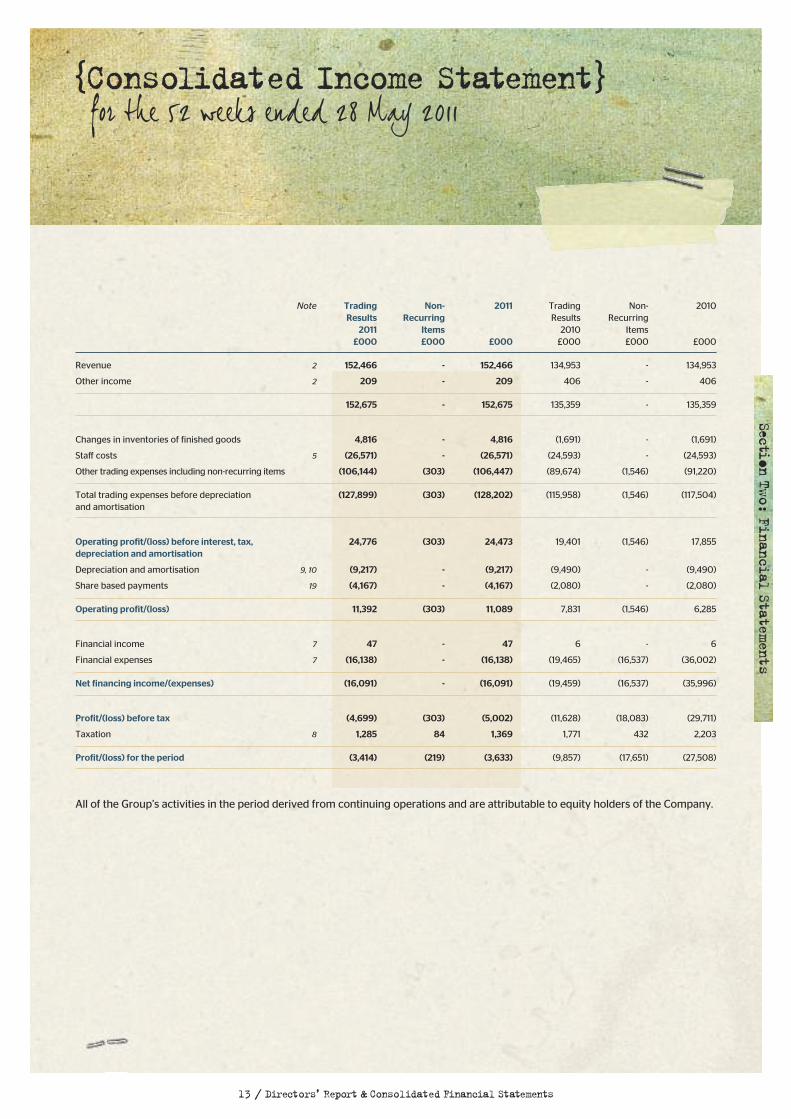
Revenue 2 152,466 - 152,466 134,953 - 134,953
Other income 2 209 - 209 406 - 406
152,675 - 152,675 135,359 - 135,359
Changes in inventories of finished goods 4,816 - 4,816 (1,691) - (1,691)
Staff costs 5 (26,571) - (26,571) (24,593) - (24,593)
Other trading expenses including non-recurring items (106,144) (303) (106,447) (89,674) (1,546) (91,220)
Total trading expenses before depreciation (127,899) (303) (128,202) (115,958) (1,546) (117,504)and amortisation
Operating profit/(loss) before interest, tax, 24,776 (303) 24,473 19,401 (1,546) 17,855depreciation and amortisation
Depreciation and amortisation 9, 10 (9,217) - (9,217) (9,490) - (9,490)
Share based payments 19 (4,167) - (4,167) (2,080) - (2,080)
Operating profit/(loss) 11,392 (303) 11,089 7,831 (1,546) 6,285
Financial income 7 47 - 47 6 - 6
Financial expenses 7 (16,138) - (16,138) (19,465) (16,537) (36,002)
Net financing income/(expenses) (16,091) - (16,091) (19,459) (16,537) (35,996)
Profit/(loss) before tax (4,699) (303) (5,002) (11,628) (18,083) (29,711)
Taxation 8 1,285 84 1,369 1,771 432 2,203
Profit/(loss) for the period (3,414) (219) (3,633) (9,857) (17,651) (27,508)
All of the Group’s activities in the period derived from continuing operations and are attributable to equity holders of the Company.
13 / Directors’ Report & Consolidated Financial Statements
SectionTwo:
FinancialStatements
{Consolidated Income Statement}for the 52 weeks ended 28 May 2011
Group Group Company Company2011 2010 2011 2010
£000 £000 £000 £000
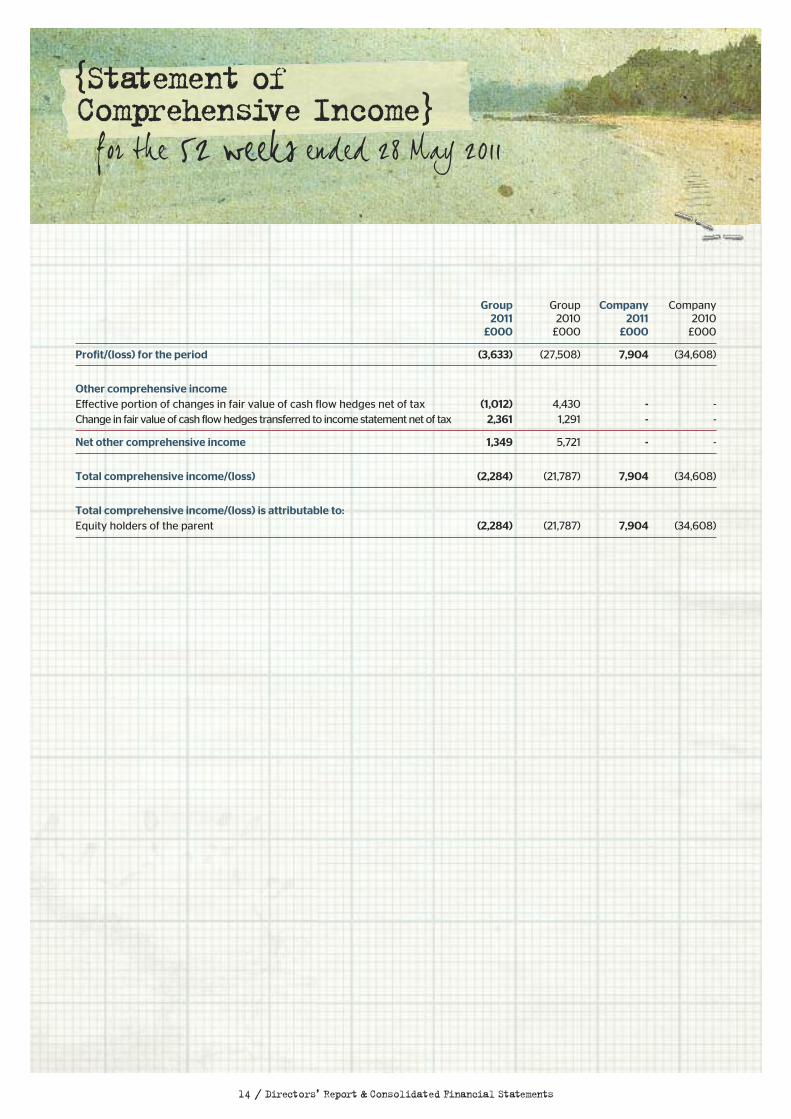
Profit/(loss) for the period (3,633) (27,508) 7,904 (34,608)
Other comprehensive incomeEffective portion of changes in fair value of cash flow hedges net of tax (1,012) 4,430 - -Change in fair value of cash flow hedges transferred to income statement net of tax 2,361 1,291 - -
Net other comprehensive income 1,349 5,721 - -
Total comprehensive income/(loss) (2,284) (21,787) 7,904 (34,608)
Total comprehensive income/(loss) is attributable to:Equity holders of the parent (2,284) (21,787) 7,904 (34,608)
14 / Directors’ Report & Consolidated Financial Statements
{Statement of Comprehensive Income}
for the 52 weeks ended 28 May 2011
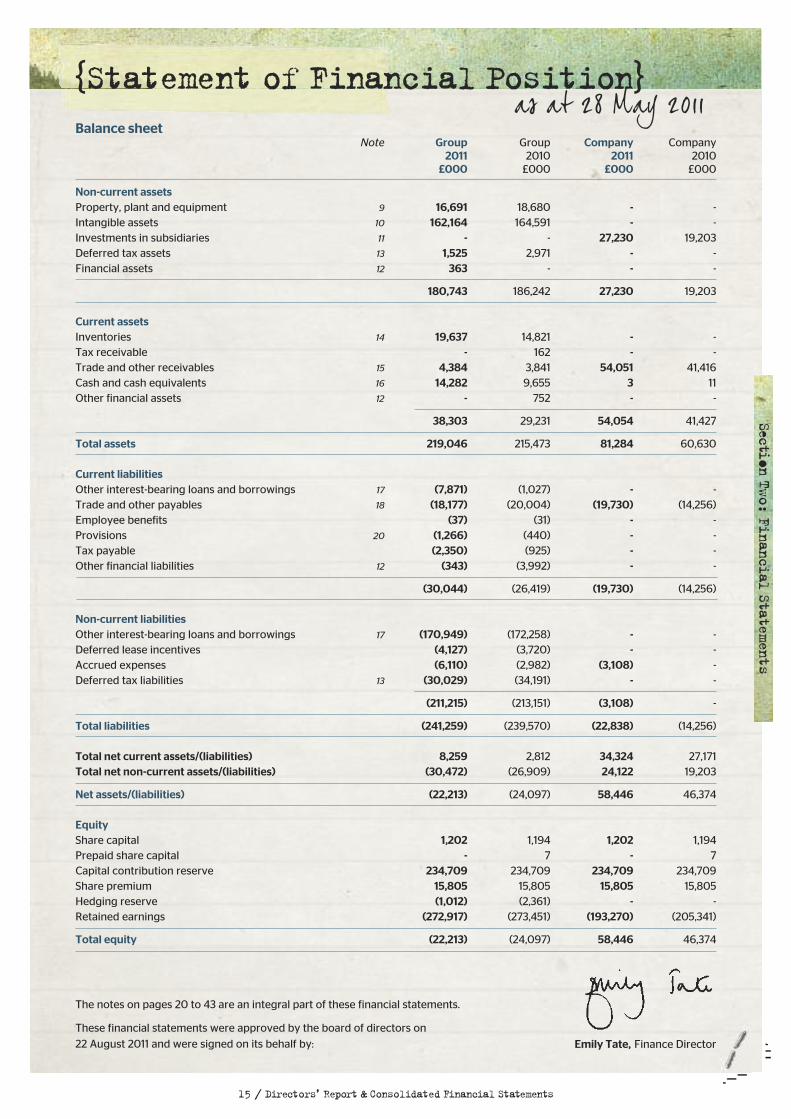
Balance sheetNote Group Group Company Company
2011 2010 2011 2010£000 £000 £000 £000
Non-current assetsProperty, plant and equipment 9 16,691 18,680 - -Intangible assets 10 162,164 164,591 - -Investments in subsidiaries 11 - - 27,230 19,203Deferred tax assets 13 1,525 2,971 - -Financial assets 12 363 - - -
180,743 186,242 27,230 19,203
Current assetsInventories 14 19,637 14,821 - -Tax receivable - 162 - -Trade and other receivables 15 4,384 3,841 54,051 41,416Cash and cash equivalents 16 14,282 9,655 3 11Other financial assets 12 - 752 - -
38,303 29,231 54,054 41,427
Total assets 219,046 215,473 81,284 60,630
Current liabilitiesOther interest-bearing loans and borrowings 17 (7,871) (1,027) - -Trade and other payables 18 (18,177) (20,004) (19,730) (14,256)Employee benefits (37) (31) - -Provisions 20 (1,266) (440) - -Tax payable (2,350) (925) - -Other financial liabilities 12 (343) (3,992) - -
(30,044) (26,419) (19,730) (14,256)
Non-current liabilitiesOther interest-bearing loans and borrowings 17 (170,949) (172,258) - -Deferred lease incentives (4,127) (3,720) - -Accrued expenses (6,110) (2,982) (3,108) -Deferred tax liabilities 13 (30,029) (34,191) - -
(211,215) (213,151) (3,108) -
Total liabilities (241,259) (239,570) (22,838) (14,256)
Total net current assets/(liabilities) 8,259 2,812 34,324 27,171Total net non-current assets/(liabilities) (30,472) (26,909) 24,122 19,203
Net assets/(liabilities) (22,213) (24,097) 58,446 46,374
EquityShare capital 1,202 1,194 1,202 1,194Prepaid share capital - 7 - 7Capital contribution reserve 234,709 234,709 234,709 234,709Share premium 15,805 15,805 15,805 15,805Hedging reserve (1,012) (2,361) - -Retained earnings (272,917) (273,451) (193,270) (205,341)
Total equity (22,213) (24,097) 58,446 46,374
The notes on pages 20 to 43 are an integral part of these financial statements.
These financial statements were approved by the board of directors on
22 August 2011 and were signed on its behalf by:
{Statement of Financial Position}as at 28 May 2011
15 / Directors’ Report & Consolidated Financial Statements
SectionTwo:
FinancialStatements
Emily Tate, Finance Director
16 / Directors’ Report & Consolidated Financial Statements
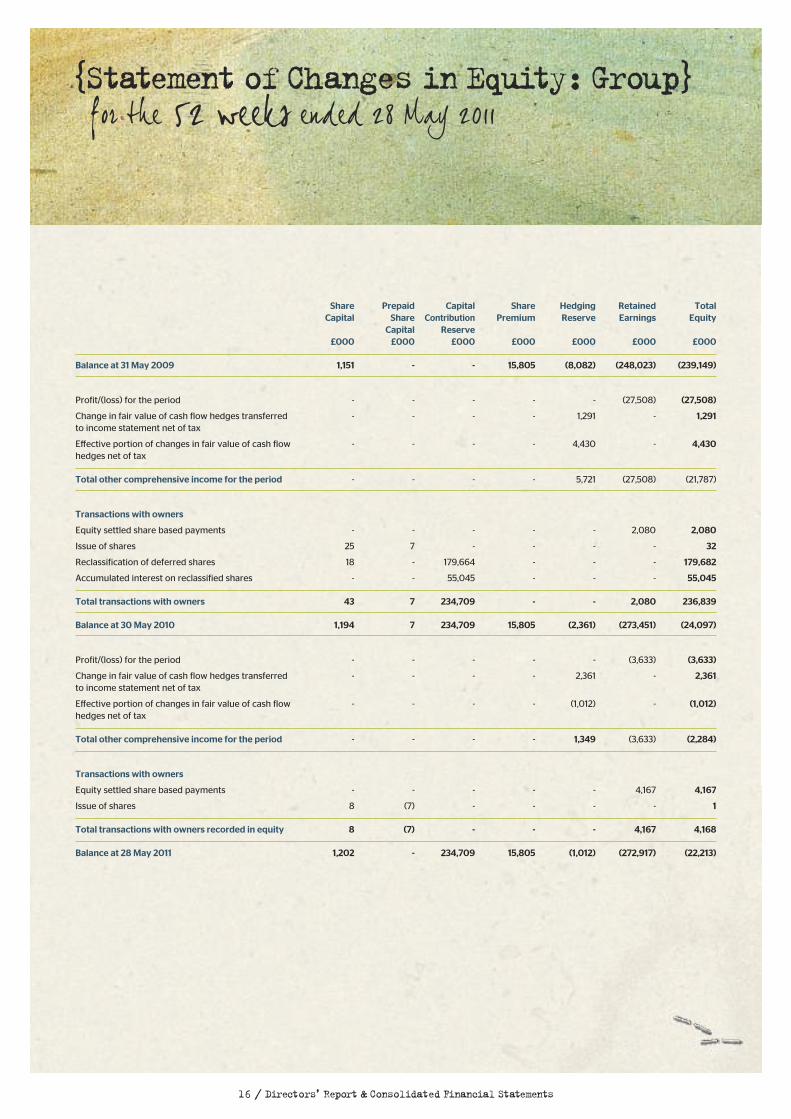
Share Prepaid Capital Share Hedging Retained TotalCapital Share Contribution Premium Reserve Earnings Equity
Capital Reserve£000 £000 £000 £000 £000 £000 £000
Balance at 31 May 2009 1,151 - - 15,805 (8,082) (248,023) (239,149)
Profit/(loss) for the period - - - - - (27,508) (27,508)
Change in fair value of cash flow hedges transferred - - - - 1,291 - 1,291to income statement net of tax
Effective portion of changes in fair value of cash flow - - - - 4,430 - 4,430hedges net of tax
Total other comprehensive income for the period - - - - 5,721 (27,508) (21,787)
Transactions with owners
Equity settled share based payments - - - - - 2,080 2,080
Issue of shares 25 7 - - - - 32
Reclassification of deferred shares 18 - 179,664 - - - 179,682
Accumulated interest on reclassified shares - - 55,045 - - - 55,045
Total transactions with owners 43 7 234,709 - - 2,080 236,839
Balance at 30 May 2010 1,194 7 234,709 15,805 (2,361) (273,451) (24,097)
Profit/(loss) for the period - - - - - (3,633) (3,633)
Change in fair value of cash flow hedges transferred - - - - 2,361 - 2,361to income statement net of tax
Effective portion of changes in fair value of cash flow - - - - (1,012) - (1,012)hedges net of tax
Total other comprehensive income for the period - - - - 1,349 (3,633) (2,284)
Transactions with owners
Equity settled share based payments - - - - - 4,167 4,167
Issue of shares 8 (7) - - - - 1
Total transactions with owners recorded in equity 8 (7) - - - 4,167 4,168
Balance at 28 May 2011 1,202 - 234,709 15,805 (1,012) (272,917) (22,213)
{StatementofChanges in Equity:Group}for the 52 weeks ended 28 May 2011
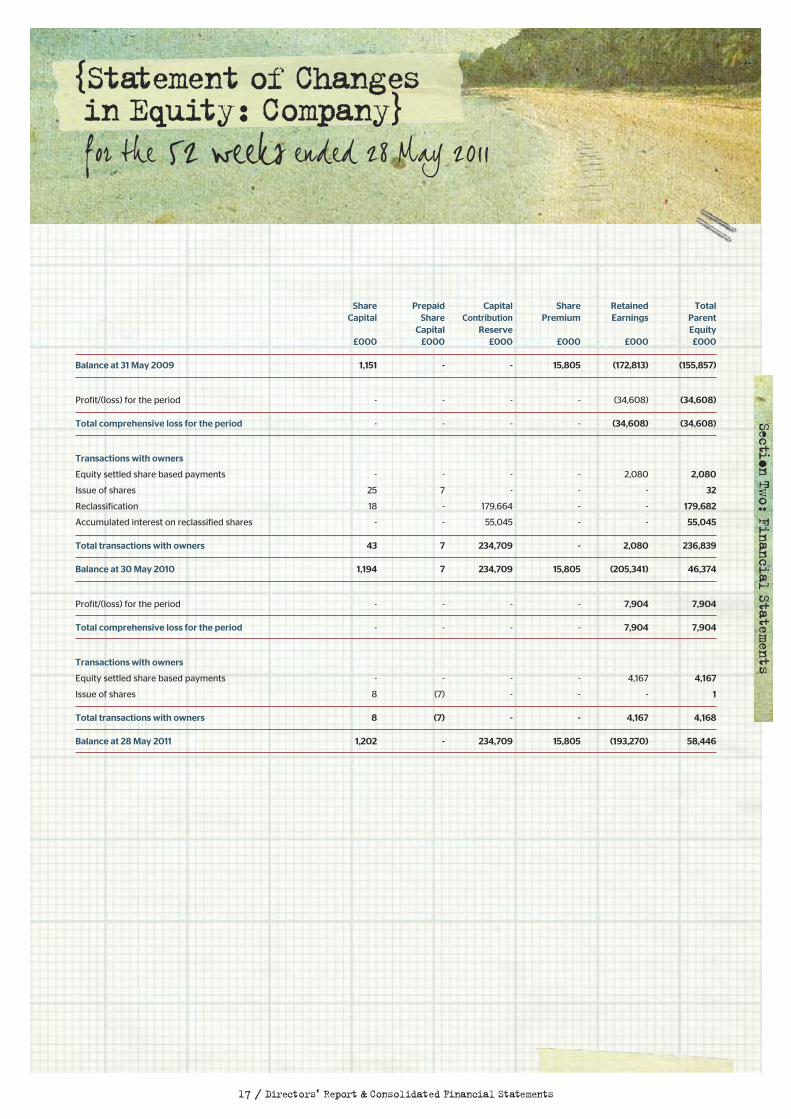
Share Prepaid Capital Share Retained TotalCapital Share Contribution Premium Earnings Parent
Capital Reserve Equity£000 £000 £000 £000 £000 £000
Balance at 31 May 2009 1,151 - - 15,805 (172,813) (155,857)
Profit/(loss) for the period - - - - (34,608) (34,608)
Total comprehensive loss for the period - - - - (34,608) (34,608)
Transactions with owners
Equity settled share based payments - - - - 2,080 2,080
Issue of shares 25 7 - - - 32
Reclassification 18 - 179,664 - - 179,682
Accumulated interest on reclassified shares - - 55,045 - - 55,045
Total transactions with owners 43 7 234,709 - 2,080 236,839
Balance at 30 May 2010 1,194 7 234,709 15,805 (205,341) 46,374
Profit/(loss) for the period - - - - 7,904 7,904
Total comprehensive loss for the period - - - - 7,904 7,904
Transactions with owners
Equity settled share based payments - - - - 4,167 4,167
Issue of shares 8 (7) - - - 1
Total transactions with owners 8 (7) - - 4,167 4,168
Balance at 28 May 2011 1,202 - 234,709 15,805 (193,270) 58,446
{Statementof Changesin Equity:Company}
SectionTwo:
FinancialStatements
for the 52 weeks ended 28 May 2011
17 / Directors’ Report & Consolidated Financial Statements

Note Group Group Company Company2011 2010 2011 2010
£000 £000 £000 £000
Cash flows from operating activities
Profit/(loss) before tax for the year (5,002) (29,711) 12,160 (29,302)
Adjustments for:
Depreciation, amortisation and impairment 9,10,11 9,217 9,490 - 31,719
Equity settled share-based payment expenses 19 4,167 2,080 - -
Financial income 7 (47) (6) (16,499) (20,598)
Financial expense 7 16,138 36,001 4,108 16,536
(Gain)/loss on sale of property, plant and equipment - (5) - -
Cash generated from operations 24,473 17,849 (231) (1,645)
Change in trade and other receivables (748) (226) 102 (12)
Change in inventory (4,816) 1,691 - -
Change in trade and other payables 5,221 1,062 120 1,447
Change in provisions and employee benefits 7 (89) - -
24,137 20,286 (9) (210)
Tax paid (1,004) (750) - -
Net cash from operating activities 23,133 19,536 (9) (210)
Cash flows from investing activities
Proceeds from sale of property, plant and equipment - 43 - -
Interest received 7 47 6 - -
Acquisition of property, plant and equipment 9 (5,390) (8,843) - -
Lease incentives, net of amortisation 1,082 3,741 - -
Acquisition of other intangible assets 10 (9) (34) - -
Net cash from investing activities (4,270) (5,087) - -
Cash flows from financing activities
Proceeds from the issue of share capital 21 1 32 1 32
Proceeds from new loans 17 - 176,427 - -
Acquisition of a hedging instrument 17 (997) - - -
Interest paid (12,206) (18,510) - -
Repayment of borrowings 17 (357) (168,260) - -
Net cash from financing activities (13,559) (10,311) 1 32
Net increase/(decrease) in cash and cash equivalents 5,304 4,138 (8) (178)
Cash and cash equivalents at start of period 8,978 4,840 11 189
Cash and cash equivalents at end of period 16 14,282 8,978 3 11
{Cash Flow Statements}for 52 weeks ended 28 May 2011
18 / Directors’ Report & Consolidated Financial Statements

19 / Directors’ Report & Consolidated Financial Statements
SectionTwo:
FinancialStatements
20 / Directors’ Report & Consolidated Financial Statements
(Forming part of theFinancial Statements)
{Notes to the Financial Statements}
1.Accounting PoliciesFat Face Group Limited (formerly Fat Face World Limited)
(the ‘Company’) is a company incorporated in the UK.
The Group financial statements consolidate those of the
Company and its subsidiaries (together referred to as the
‘Group’). The parent company financial statements present
information about the Company as a separate entity and
not about its Group.
Both the parent company financial statements and the Group
financial statements have been prepared and approved by the
directors in accordance with International Financial Reporting
Standards as adopted by the EU (‘Adopted IFRSs’). On publishing
the parent company financial statements here together with the
Group financial statements, the Company is taking advantage
of the exemption in s408 of the Companies Act 2006 not to
present its individual income statement and related notes
that form a part of these approved financial statements.
The following new standards and amendments to standards
are mandatory for the first time for financial years beginning
on or after 1 January 2010.
• IFRS 3 (revised), ‘Business combinations’, and consequential
amendments to IAS 27, ‘Consolidated and separate financial
statements’, IAS28, ‘Investments in associates’, and IAS 31,
‘Interests in joint ventures’, are effective prospectively to
business combinations when the acquisition date is on
or after the beginning of the first annual reporting period
beginning on or after 1 July 2009. The revised standard
continues to apply the acquisition method to business
combinations but with some significant changes
compared with IFRS 3.
Whilst the revised standard has been applied, there have
been no acquisitions with the Group since 1 July 2009,
and therefore no impact has been reflected within the
statutory accounts.
Adopted IFRS not yet applied The following new standards, amendments and interpretations
have been issued but are not effective for the financial year
and have not been early adopted.
• Revised IAS 24 (revised). ‘Related party disclosures’,
issued in November 2009. It supersedes IAS 24, ‘Related
party disclosures’ issued in 2003. IAS 24 (revised) is
mandatory for periods beginning on or after 1 January
2011. Earlier application in whole or in part is permitted.
The revised standard clarified and simplified the definition
of a related party. The Group will apply the revised
standard for 2011/12 financial statements.
The accounting policies set out below have, unless otherwisestated, been applied consistently to all periods presented inthese consolidated financial statements.
Judgements made by the directors, in the application of theseaccounting policies that have significant effect on the financialstatements and estimates with a significant risk of materialadjustment in the next year are discussed in notes 10, 19 and20, and in the lives of intangible assets as noted below.
Measurement conventionThe financial statements are prepared on an historical costbasis with the exception of derivative financial instrumentswhich are stated at their fair value.
Basis of consolidation – subsidiariesSubsidiaries are entities controlled by the Group. Controlexists when the Group has the power, directly or indirectly,to govern the financial and operating policies of an entity so as to obtain benefits from its activities. In assessing control,potential voting rights that are currently exercisable orconvertible are taken into account. The financial statements of subsidiaries are included in the consolidated financialstatements from the date that control commences until the date that control ceases.
Foreign currencyTransactions in foreign currencies are translated at theforeign exchange rate ruling at the date of the transaction.Monetary assets and liabilities denominated in foreigncurrencies at the balance sheet date are translated at theforeign exchange rate ruling at that date. Foreign exchangedifferences arising on translation are recognised in theincome statement. Non-monetary assets and liabilities thatare measured in terms of historical cost in a foreign currencyare translated using the exchange rate at the date of thetransaction. Non-monetary assets and liabilities denominatedin foreign currencies that are stated at fair value are translatedat foreign exchange rates ruling at the date of transactionthe fair value was determined.
Exchange differences related to qualifying hedges are takendirectly to the translation reserve. They are released into the income statement upon disposal.
Where the Group holds applicable hedged positions, the accounting policy is reported below.
CurrenciesThe Group uses sterling as its presentational and functionalcurrency and all values have been rounded to the nearestthousand unless otherwise stated.
The Company uses sterling as its functional currency.
21 / Directors’ Report & Consolidated Financial Statements
SectionThree:
Notes
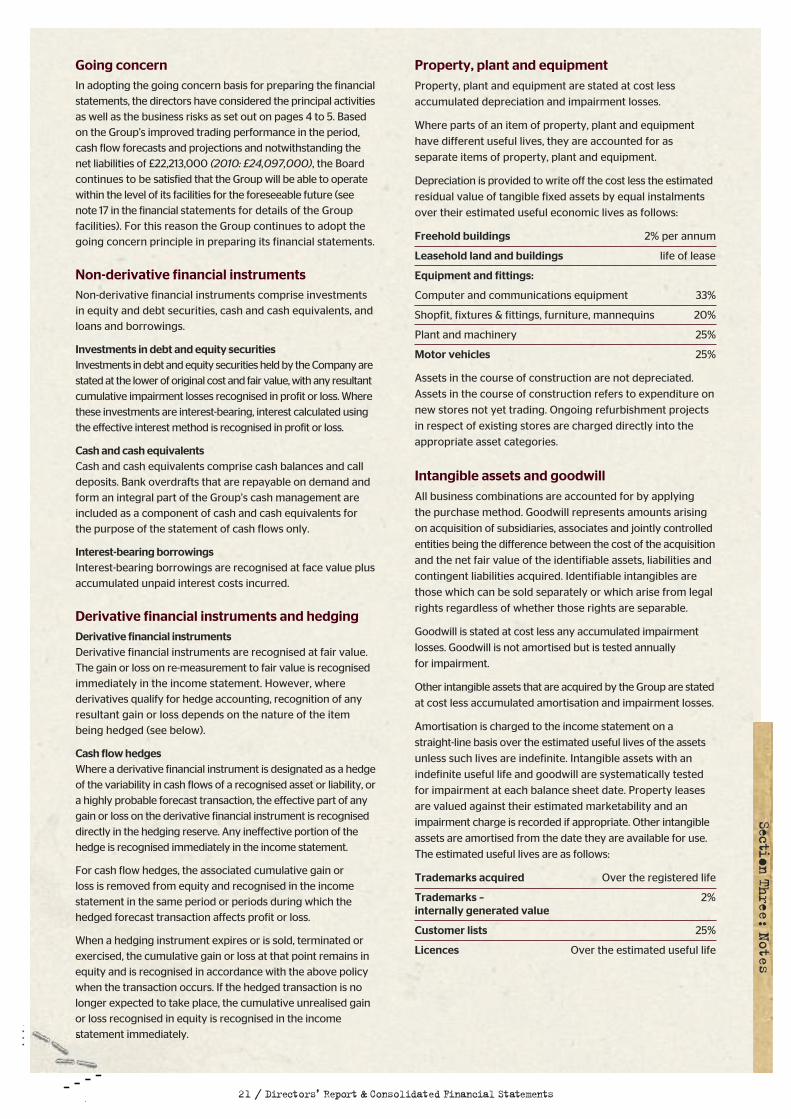
Property, plant and equipmentProperty, plant and equipment are stated at cost less
accumulated depreciation and impairment losses.
Where parts of an item of property, plant and equipment
have different useful lives, they are accounted for as
separate items of property, plant and equipment.
Depreciation is provided to write off the cost less the estimated
residual value of tangible fixed assets by equal instalments
over their estimated useful economic lives as follows:
Freehold buildings 2% per annum
Leasehold land and buildings life of lease
Equipment and fittings:
Computer and communications equipment 33%
Shopfit, fixtures & fittings, furniture, mannequins 20%
Plant and machinery 25%
Motor vehicles 25%
Assets in the course of construction are not depreciated.
Assets in the course of construction refers to expenditure on
new stores not yet trading. Ongoing refurbishment projects
in respect of existing stores are charged directly into the
appropriate asset categories.
Intangible assets and goodwillAll business combinations are accounted for by applying
the purchase method. Goodwill represents amounts arising
on acquisition of subsidiaries, associates and jointly controlled
entities being the difference between the cost of the acquisition
and the net fair value of the identifiable assets, liabilities and
contingent liabilities acquired. Identifiable intangibles are
those which can be sold separately or which arise from legal
rights regardless of whether those rights are separable.
Goodwill is stated at cost less any accumulated impairment
losses. Goodwill is not amortised but is tested annually
for impairment.
Other intangible assets that are acquired by the Group are stated
at cost less accumulated amortisation and impairment losses.
Amortisation is charged to the income statement on a
straight-line basis over the estimated useful lives of the assets
unless such lives are indefinite. Intangible assets with an
indefinite useful life and goodwill are systematically tested
for impairment at each balance sheet date. Property leases
are valued against their estimated marketability and an
impairment charge is recorded if appropriate. Other intangible
assets are amortised from the date they are available for use.
The estimated useful lives are as follows:
Trademarks acquired Over the registered life
Trademarks – 2% internally generated value
Customer lists 25%
Licences Over the estimated useful life
Going concernIn adopting the going concern basis for preparing the financialstatements, the directors have considered the principal activitiesas well as the business risks as set out on pages 4 to 5. Basedon the Group’s improved trading performance in the period,cash flow forecasts and projections and notwithstanding thenet liabilities of £22,213,000 (2010: £24,097,000), the Boardcontinues to be satisfied that the Group will be able to operatewithin the level of its facilities for the foreseeable future (seenote 17 in the financial statements for details of the Groupfacilities). For this reason the Group continues to adopt thegoing concern principle in preparing its financial statements.
Non-derivative financial instrumentsNon-derivative financial instruments comprise investmentsin equity and debt securities, cash and cash equivalents, andloans and borrowings.
Investments in debt and equity securitiesInvestments in debt and equity securities held by the Company arestated at the lower of original cost and fair value, with any resultantcumulative impairment losses recognised in profit or loss. Wherethese investments are interest-bearing, interest calculated usingthe effective interest method is recognised in profit or loss.
Cash and cash equivalentsCash and cash equivalents comprise cash balances and calldeposits. Bank overdrafts that are repayable on demand andform an integral part of the Group’s cash management areincluded as a component of cash and cash equivalents for the purpose of the statement of cash flows only.
Interest-bearing borrowingsInterest-bearing borrowings are recognised at face value plusaccumulated unpaid interest costs incurred.
Derivative financial instruments and hedgingDerivative financial instrumentsDerivative financial instruments are recognised at fair value.The gain or loss on re-measurement to fair value is recognisedimmediately in the income statement. However, wherederivatives qualify for hedge accounting, recognition of anyresultant gain or loss depends on the nature of the itembeing hedged (see below).
Cash flow hedgesWhere a derivative financial instrument is designated as a hedgeof the variability in cash flows of a recognised asset or liability, ora highly probable forecast transaction, the effective part of anygain or loss on the derivative financial instrument is recogniseddirectly in the hedging reserve. Any ineffective portion of thehedge is recognised immediately in the income statement.
For cash flow hedges, the associated cumulative gain or loss is removed from equity and recognised in the incomestatement in the same period or periods during which thehedged forecast transaction affects profit or loss.
When a hedging instrument expires or is sold, terminated orexercised, the cumulative gain or loss at that point remains inequity and is recognised in accordance with the above policywhen the transaction occurs. If the hedged transaction is nolonger expected to take place, the cumulative unrealised gainor loss recognised in equity is recognised in the incomestatement immediately.
22 / Directors’ Report & Consolidated Financial Statements
Employee benefitsDefined contribution plansThe Group operates a defined contribution pension plan
under which the Group pays fixed contributions into a
separate entity and will have no legal or constructive obligation
to pay further amounts. Obligations for contributions to
defined contribution pension plans are recognised as an
expense in the income statement as incurred.
Share-based payment transactionsSome employees of Fat Face Limited, an indirect subsidiary,
have been granted shares in the Company. In these consolidated
financial statements the fair value of shares acquired is
recognised as an employee expense with a corresponding
increase in equity. The company financial statements also
record an increase investment in subsidiaries and
corresponding increase in equity.
The fair value is measured at grant date and spread over the
period during which the employees become unconditionally
entitled to the fair value of the shares. The fair value of the
shares acquired is measured using an EBITDA multiple,
taking into account the terms and conditions upon which
the shares were granted. The amount recognised as an
expense is adjusted to reflect the forecast number of shares
expected to be forfeit without reaching full fair value.
During 2009/10, the directors of the company considered that
the fair value of C2 shares issued in the Company could not
be estimated reliably. In accordance with IFRS 2 the group
adopted the intrinsic value methodology for these shares,
whereby the intrinsic value of this share based payment is
remeasured at each reporting date, with changes recognised
in profit or loss until the instrument is settled.
RevenueRevenue represents the invoiced amounts of goods sold
and services provided during the period, stated net of value
added tax.
Revenue arising from the sale of gift vouchers is deferred
and recognised at the point of redemption.
Revenue arising from wholesale and franchise sales is
recognised when invoiced.
ExpensesOperating lease paymentsPayments made under operating leases are recognised in the
income statement on a straight-line basis over the term of the
lease. Lease incentives received are recognised in the income
statement as an integral part of the total lease expense.
Net financing costsNet financing costs comprise interest payable, finance
charges on finance leases, interest receivable on funds
invested, and foreign exchange gains and losses that are
recognised in the income statement.
Interest income and interest payable is recognised in profit
or loss as it accrues, using the effective interest method.
1.Accounting Policies(continued)
Trade and other receivablesTrade and other receivables are recognised at their nominal
amount, less any impairment losses and provisions for bad
and doubtful debts.
InventoriesInventories are stated at the lower of cost and net realisable
value. Cost is based on the weighted average principle and
includes expenditure incurred in acquiring the inventories
and bringing them to their existing location and condition.
As required by IFRS 3, at date of acquisition of subsidiary
entities the fair value of inventory is established by reference
to its present location and condition, which may vary from
historic cost in the acquired entity.
Lease incentivesContributions received from landlords are deemed to be
incentives and as such are recognised as deferred income
and subsequently released over the life of the lease.
Trade and other payablesTrade and other payables are recognised at face value.
Impairment The carrying amounts of the Company’s and Group’s
assets other than inventories and deferred tax assets are
reviewed at each balance sheet date to determine whether
there is any indication of impairment. If any such indication
exists, the asset’s recoverable amount is estimated.
An impairment loss is recognised whenever the carrying
amount of an asset or its cash generating exceeds its
recoverable amount. Impairment losses are recognised
in the income statement.
The results of the impairment review on groups of assets
are disclosed in the relevant notes below.
Interest-bearing borrowingsInterest-bearing borrowings are recognised initially at fair
value less attributable transaction costs. Subsequent to initial
recognition, interest-bearing borrowings are stated at amortised
cost with any difference between cost and redemption value
being recognised in the income statement over the period
of the borrowings on an effective interest basis.
The effective interest basis is the implicit interest rate which,
over the life of an investment or liability, will compound to the
expected final asset or liability value, including all of the costs
and revenues expected from that asset or liability over its life.
Debt instruments issued by Group companies that are
held by other Group companies are reported net in these
Consolidated Financial Statements.

23 / Directors’ Report & Consolidated Financial Statements
SectionThree:
Notes
ProvisionsA provision is recognised in the balance sheet when the
Group has a present legal or constructive obligation as a
result of a past event, that can be reliably measured and
it is probable that an outflow of economic benefits will be
required to settle the obligation.
TaxationTax on the profit or loss for period comprises current and
deferred tax. Tax is recognised in the income statement except
to the extent that it relates to items recognised directly in
equity, in which case it is recognised in equity.
Current tax is the expected tax payable on the taxable income
for the period, using tax rates enacted or substantively enacted
at the balance sheet date, and any adjustment to tax payable
in respect of previous years.
Deferred tax is provided on temporary differences between
the carrying amounts of assets and liabilities for financial
reporting purposes and the amounts used for taxation purposes.
The following temporary differences are not provided for:
• the initial recognition of goodwill;
• the initial recognition of assets or liabilities that affect
neither accounting nor taxable profit other than in a
business combination; and
• differences relating to investments in subsidiaries to
the extent that they will probably not reverse in the
foreseeable future.
The amount of deferred tax provided is based on the expected
manner of realisation or settlement of the carrying amount of
assets and liabilities, using tax rates enacted or substantively
enacted at the balance sheet date.
A deferred tax asset is recognised only to the extent that it is
probable that future taxable profits will be available against
which the asset can be utilised.
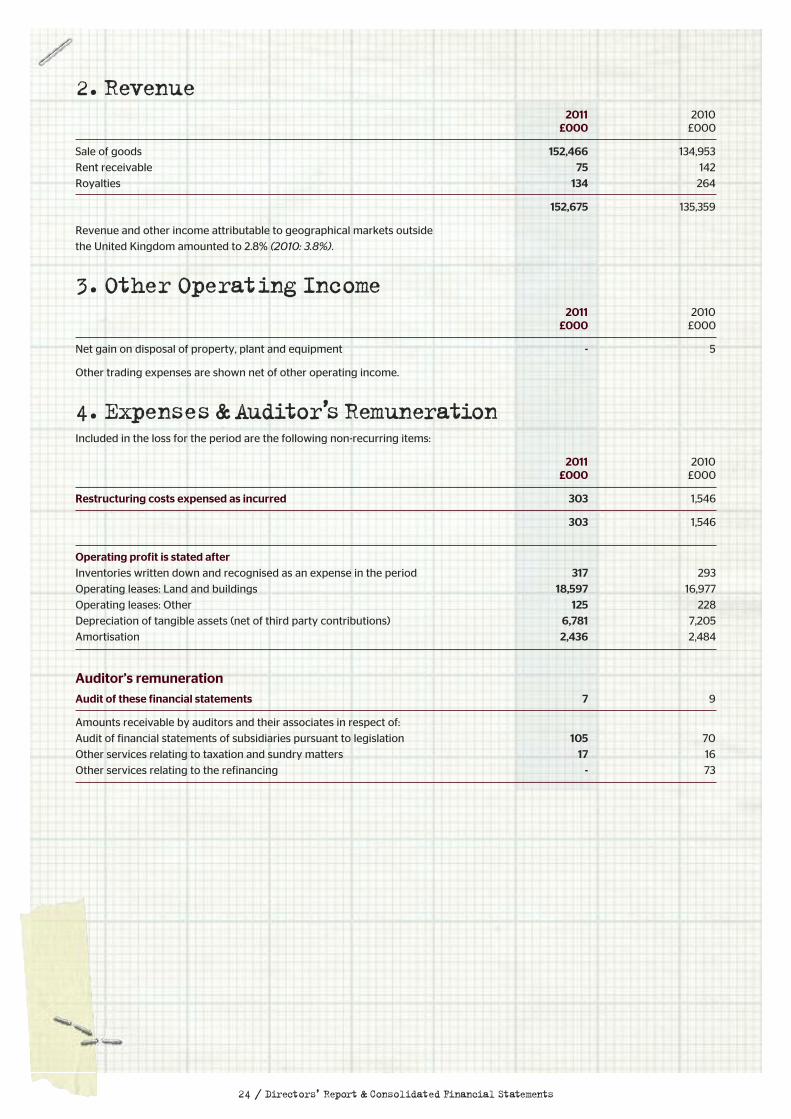
2.Revenue2011 2010
£000 £000
Sale of goods 152,466 134,953
Rent receivable 75 142
Royalties 134 264
152,675 135,359
Revenue and other income attributable to geographical markets outside
the United Kingdom amounted to 2.8% (2010: 3.8%).
3.Other OperatingIncome2011 2010
£000 £000
Net gain on disposal of property, plant and equipment - 5
Other trading expenses are shown net of other operating income.
4.Expenses&Auditor’s RemunerationIncluded in the loss for the period are the following non-recurring items:
2011 2010£000 £000
Restructuring costs expensed as incurred 303 1,546
303 1,546
Operating profit is stated afterInventories written down and recognised as an expense in the period 317 293
Operating leases: Land and buildings 18,597 16,977
Operating leases: Other 125 228
Depreciation of tangible assets (net of third party contributions) 6,781 7,205
Amortisation 2,436 2,484
Auditor’s remunerationAudit of these financial statements 7 9
Amounts receivable by auditors and their associates in respect of:
Audit of financial statements of subsidiaries pursuant to legislation 105 70
Other services relating to taxation and sundry matters 17 16
Other services relating to the refinancing - 73
24 / Directors’ Report & Consolidated Financial Statements

SectionThree:
Notes
25 / Directors’ Report & Consolidated Financial Statements
5.Staff Numbers & Costs The contracted number of persons employed by the Group (excluding non-executive directors) during the period, analysed by category, was as follows:
Group GroupNumber of employees 2011 2010
Fat Base (head office) 274 299Stores 1,809 1,698
Total 2,083 1,997
The Company had no employees during the period.
The aggregate payroll costs of these persons were as follows:2011 2010
£000 £000
Wages and salaries 24,701 22,641Social security costs 1,753 1,797Other pension costs 90 128Healthcare costs 27 27
Total before share based payments 26,571 24,593Share based payments (see note 19) 4,167 2,080
Total 30,738 26,673
6.Directors’EmolumentsDirectors’ emoluments on behalf of the group are as follows:
2011 2010£000 £000
Directors’ emoluments 825 824Company contributions to defined contribution pension plans - 11Share based payments 946 1,396
Total 1,771 2,231
The aggregate of emoluments of the highest paid director was £576,042(2010: £375,304), and company pension contributions of nil (2010 £11,143)were made to a defined contribution scheme on their behalf.
Number of Directors 2011 2010
Retirement benefits are accruing to the following number of directors under:Defined contribution benefit plans: - -
The amount accrued in respect of directors’ pensions at 28 May 2011 was nil (2010: nil).
7.FinanceIncome & Expense2011 2010
£000 £000
Bank interest income 19 6Net foreign exchange gain 28 -
Financial income 47 6
Bank interest expense 11,566 19,219Exit fee accrual 3,108 -Other interest payable 1,464 237Net foreign exchange loss - 9
Finance expense 16,138 19,465
Of the Bank interest expenses £5,337,700 relates to cash interest payable on bank debt (2010: £13,950,000) with the remainderrelating to payment in kind (PIK) interest which is added to the loan principal. Other interest payable consists of non-cash intereston loan notes which is added to the loan principal (see note 17).
26 / Directors’ Report & Consolidated Financial Statements
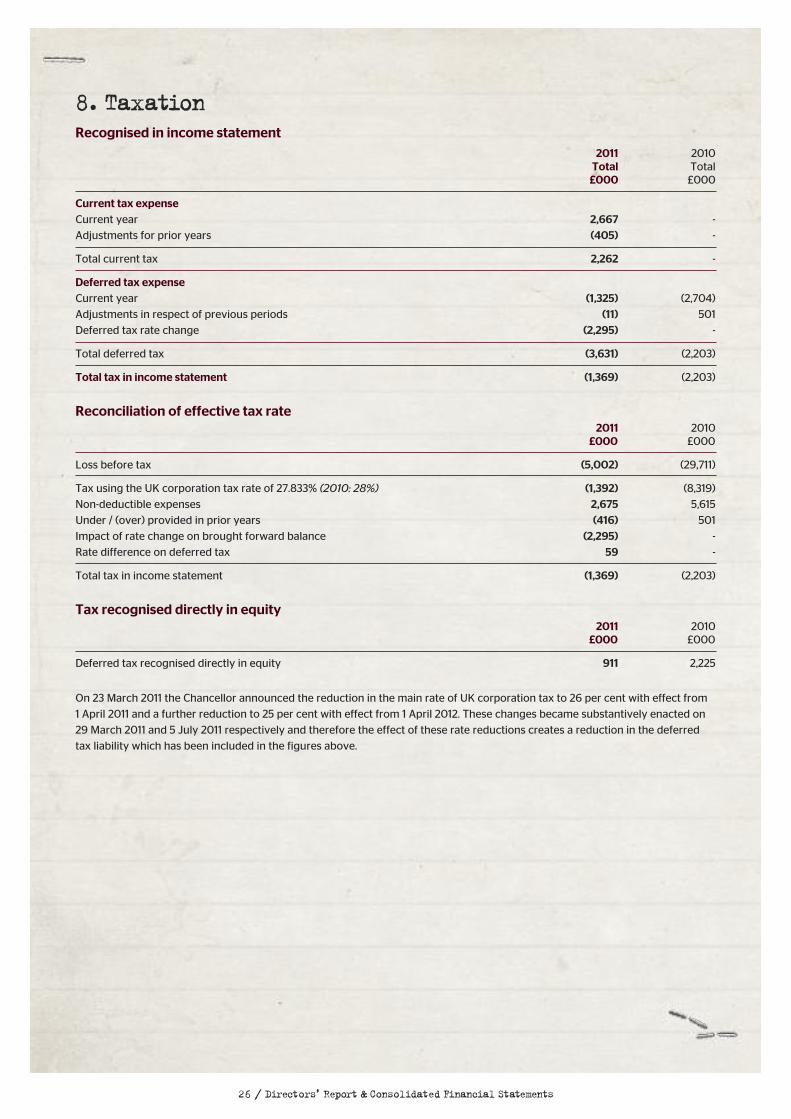
8.TaxationRecognised in income statement
2011 2010Total Total£000 £000
Current tax expenseCurrent year 2,667 -
Adjustments for prior years (405) -
Total current tax 2,262 -
Deferred tax expenseCurrent year (1,325) (2,704)
Adjustments in respect of previous periods (11) 501
Deferred tax rate change (2,295) -
Total deferred tax (3,631) (2,203)
Total tax in income statement (1,369) (2,203)
Reconciliation of effective tax rate2011 2010
£000 £000
Loss before tax (5,002) (29,711)
Tax using the UK corporation tax rate of 27.833% (2010: 28%) (1,392) (8,319)
Non-deductible expenses 2,675 5,615
Under / (over) provided in prior years (416) 501
Impact of rate change on brought forward balance (2,295) -
Rate difference on deferred tax 59 -
Total tax in income statement (1,369) (2,203)
Tax recognised directly in equity2011 2010
£000 £000
Deferred tax recognised directly in equity 911 2,225
On 23 March 2011 the Chancellor announced the reduction in the main rate of UK corporation tax to 26 per cent with effect from
1 April 2011 and a further reduction to 25 per cent with effect from 1 April 2012. These changes became substantively enacted on
29 March 2011 and 5 July 2011 respectively and therefore the effect of these rate reductions creates a reduction in the deferred
tax liability which has been included in the figures above.
27 / Directors’ Report & Consolidated Financial Statements
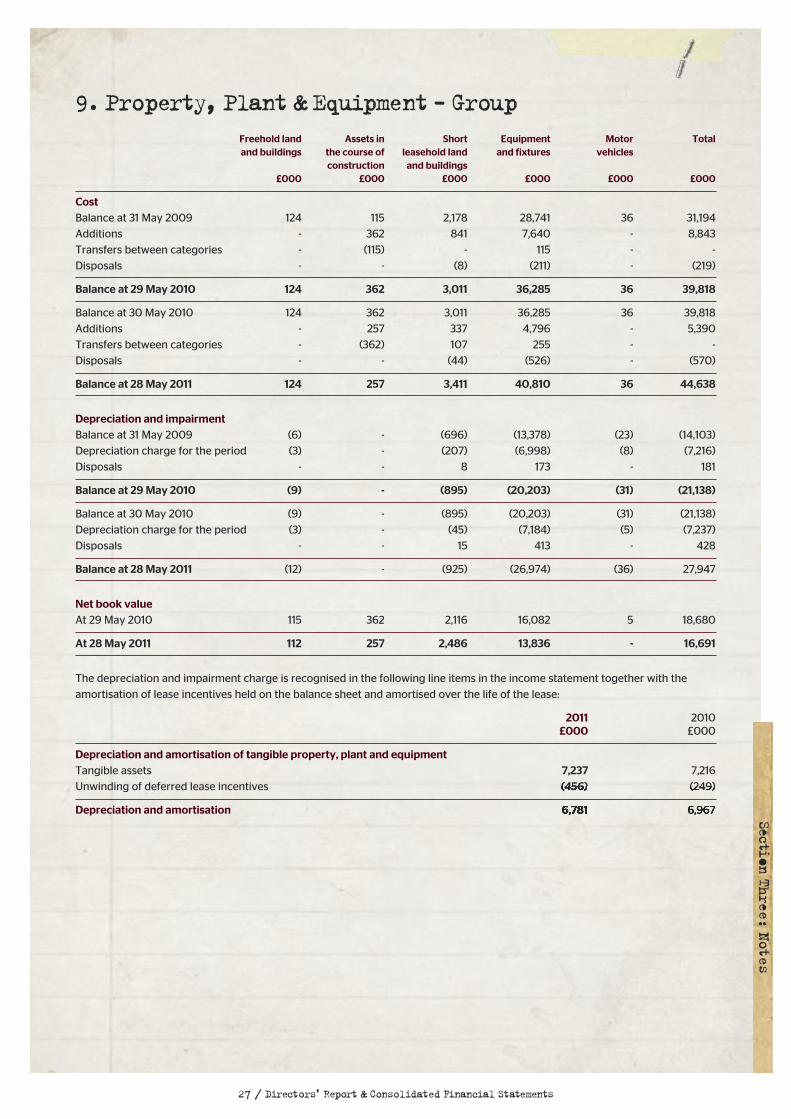
9.Property, Plant& Equipment - GroupFreehold land Assets in Short Equipment Motor Totaland buildings the course of leasehold land and fixtures vehicles
construction and buildings£000 £000 £000 £000 £000 £000
CostBalance at 31 May 2009 124 115 2,178 28,741 36 31,194
Additions - 362 841 7,640 - 8,843
Transfers between categories - (115) - 115 - -
Disposals - - (8) (211) - (219)
Balance at 29 May 2010 124 362 3,011 36,285 36 39,818
Balance at 30 May 2010 124 362 3,011 36,285 36 39,818
Additions - 257 337 4,796 - 5,390
Transfers between categories - (362) 107 255 - -
Disposals - - (44) (526) - (570)
Balance at 28 May 2011 124 257 3,411 40,810 36 44,638
Depreciation and impairment Balance at 31 May 2009 (6) - (696) (13,378) (23) (14,103)
Depreciation charge for the period (3) - (207) (6,998) (8) (7,216)
Disposals - - 8 173 - 181
Balance at 29 May 2010 (9) - (895) (20,203) (31) (21,138)
Balance at 30 May 2010 (9) - (895) (20,203) (31) (21,138)
Depreciation charge for the period (3) - (45) (7,184) (5) (7,237)
Disposals - - 15 413 - 428
Balance at 28 May 2011 (12) - (925) (26,974) (36) 27,947
Net book valueAt 29 May 2010 115 362 2,116 16,082 5 18,680
At 28 May 2011 112 257 2,486 13,836 - 16,691
The depreciation and impairment charge is recognised in the following line items in the income statement together with the
amortisation of lease incentives held on the balance sheet and amortised over the life of the lease:
2011 2010£000 £000
Depreciation and amortisation of tangible property, plant and equipmentTangible assets 7,237 7,216
Unwinding of deferred lease incentives (456) (249)
Depreciation and amortisation 6,781 6,967 SectionThree:
Notes
28 / Directors’ Report & Consolidated Financial Statements
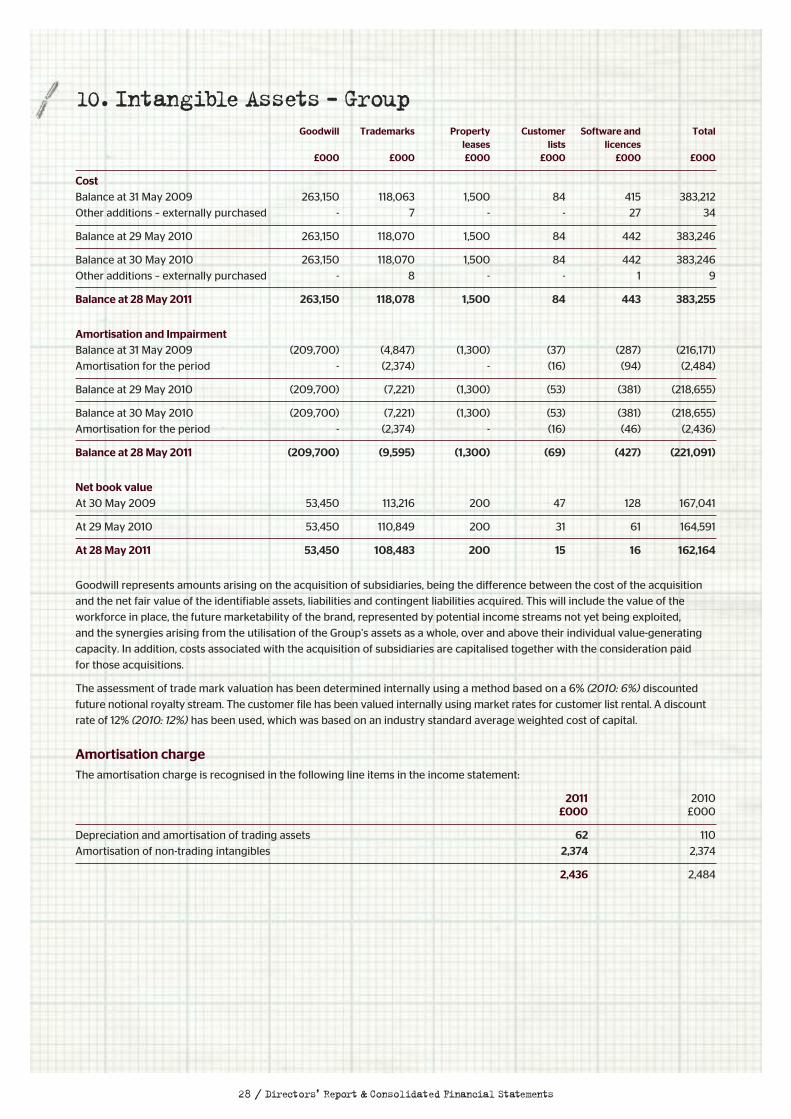
10.Intangible Assets - GroupGoodwill Trademarks Property Customer Software and Total
leases lists licences£000 £000 £000 £000 £000 £000
CostBalance at 31 May 2009 263,150 118,063 1,500 84 415 383,212
Other additions – externally purchased - 7 - - 27 34
Balance at 29 May 2010 263,150 118,070 1,500 84 442 383,246
Balance at 30 May 2010 263,150 118,070 1,500 84 442 383,246
Other additions – externally purchased - 8 - - 1 9
Balance at 28 May 2011 263,150 118,078 1,500 84 443 383,255
Amortisation and ImpairmentBalance at 31 May 2009 (209,700) (4,847) (1,300) (37) (287) (216,171)
Amortisation for the period - (2,374) - (16) (94) (2,484)
Balance at 29 May 2010 (209,700) (7,221) (1,300) (53) (381) (218,655)
Balance at 30 May 2010 (209,700) (7,221) (1,300) (53) (381) (218,655)
Amortisation for the period - (2,374) - (16) (46) (2,436)
Balance at 28 May 2011 (209,700) (9,595) (1,300) (69) (427) (221,091)
Net book valueAt 30 May 2009 53,450 113,216 200 47 128 167,041
At 29 May 2010 53,450 110,849 200 31 61 164,591
At 28 May 2011 53,450 108,483 200 15 16 162,164
Goodwill represents amounts arising on the acquisition of subsidiaries, being the difference between the cost of the acquisition
and the net fair value of the identifiable assets, liabilities and contingent liabilities acquired. This will include the value of the
workforce in place, the future marketability of the brand, represented by potential income streams not yet being exploited,
and the synergies arising from the utilisation of the Group’s assets as a whole, over and above their individual value-generating
capacity. In addition, costs associated with the acquisition of subsidiaries are capitalised together with the consideration paid
for those acquisitions.
The assessment of trade mark valuation has been determined internally using a method based on a 6% (2010: 6%) discounted
future notional royalty stream. The customer file has been valued internally using market rates for customer list rental. A discount
rate of 12% (2010: 12%) has been used, which was based on an industry standard average weighted cost of capital.
Amortisation chargeThe amortisation charge is recognised in the following line items in the income statement:
2011 2010£000 £000
Depreciation and amortisation of trading assets 62 110
Amortisation of non-trading intangibles 2,374 2,374
2,436 2,484
29 / Directors’ Report & Consolidated Financial Statements
SectionThree:
Notes
Impairment testingThe Group’s management has reviewed the carrying value
of goodwill for possible impairment based on the group of
cash generating units which comprise the lowest level at
which goodwill is monitored. This is equivalent to the business
as a whole. As in previous years, the Group’s management
has determined that the income approach (which is equivalent
to utilising the ‘value in use’ valuation technique) is the most
appropriate method for valuing the business at the current
stage of its development in the present market. The Group’s
management does not believe an impairment of the
goodwill in the business is required (2010: nil).
Income stream forecasts The key revenue driver for the business will continue to be
the development of the retail portfolio. The directors believe
that there is significant capacity for growth through improving
sales densities, relocating and refitting stores in successful
markets and expanding the portfolio. However, longer term
forecasts are inherently less reliable and the impairment
assessment consequently includes very prudent growth
assumptions beyond 2015. No material overseas expansion
of the brand has been included.
Cost growth forecasts Costs are assumed to grow at a reasonable rate to support
the continued expansion.
Discount RateThe Group’s weighted average cost of capital (WACC) as
adjusted for a market based interest rate and capital structure
has been used as a discount rate in the calculation. WACC –
what stakeholders could reasonably expect as an average
return for their investment – has been estimated at 14%
(2010: 14%).
This calculation has been built up by comparing the equity
returns expected from a range of similar companies, both UK
and overseas, and adjusting this for specific Group factors
such as debt structure, company size, and the effects of a
private, rather than public, equity structure.
The equivalent pre-tax discount rate is also 14% (2010: 14%).
SensitivityThe key assumptions as noted above are revenue
generation and the WACC used. A decrease in revenue in
each year of 1% would reduce the valuation of the business
by approximately £13m. An increase in the WACC from
14% to 15% would reduce the valuation of the business
by approximately £22m.
30 / Directors’ Report & Consolidated Financial Statements
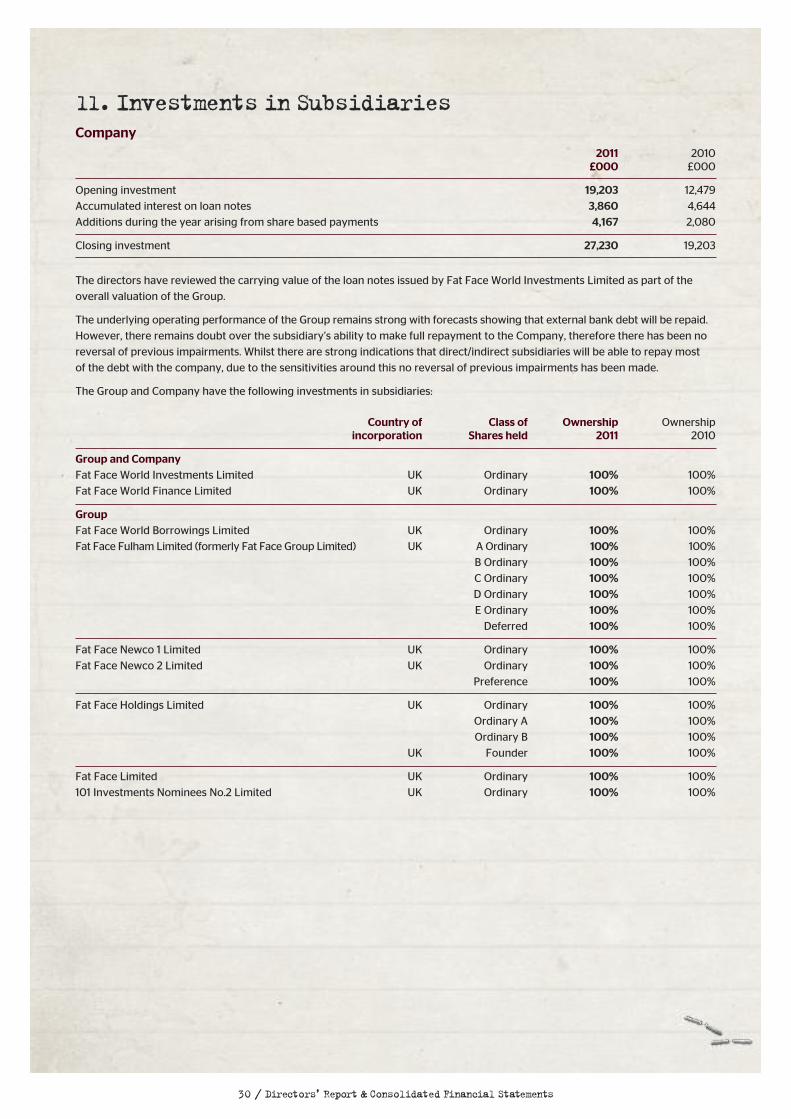
11.Investments in SubsidiariesCompany
2011 2010£000 £000
Opening investment 19,203 12,479
Accumulated interest on loan notes 3,860 4,644
Additions during the year arising from share based payments 4,167 2,080
Closing investment 27,230 19,203
The directors have reviewed the carrying value of the loan notes issued by Fat Face World Investments Limited as part of the
overall valuation of the Group.
The underlying operating performance of the Group remains strong with forecasts showing that external bank debt will be repaid.
However, there remains doubt over the subsidiary’s ability to make full repayment to the Company, therefore there has been no
reversal of previous impairments. Whilst there are strong indications that direct/indirect subsidiaries will be able to repay most
of the debt with the company, due to the sensitivities around this no reversal of previous impairments has been made.
The Group and Company have the following investments in subsidiaries:
Country of Class of Ownership Ownershipincorporation Shares held 2011 2010
Group and CompanyFat Face World Investments Limited UK Ordinary 100% 100%
Fat Face World Finance Limited UK Ordinary 100% 100%
GroupFat Face World Borrowings Limited UK Ordinary 100% 100%
Fat Face Fulham Limited (formerly Fat Face Group Limited) UK A Ordinary 100% 100%
B Ordinary 100% 100%
C Ordinary 100% 100%
D Ordinary 100% 100%
E Ordinary 100% 100%
Deferred 100% 100%
Fat Face Newco 1 Limited UK Ordinary 100% 100%
Fat Face Newco 2 Limited UK Ordinary 100% 100%
Preference 100% 100%
Fat Face Holdings Limited UK Ordinary 100% 100%
Ordinary A 100% 100%
Ordinary B 100% 100%
UK Founder 100% 100%
Fat Face Limited UK Ordinary 100% 100%
101 Investments Nominees No.2 Limited UK Ordinary 100% 100%
31 / Directors’ Report & Consolidated Financial Statements
SectionThree:
Notes
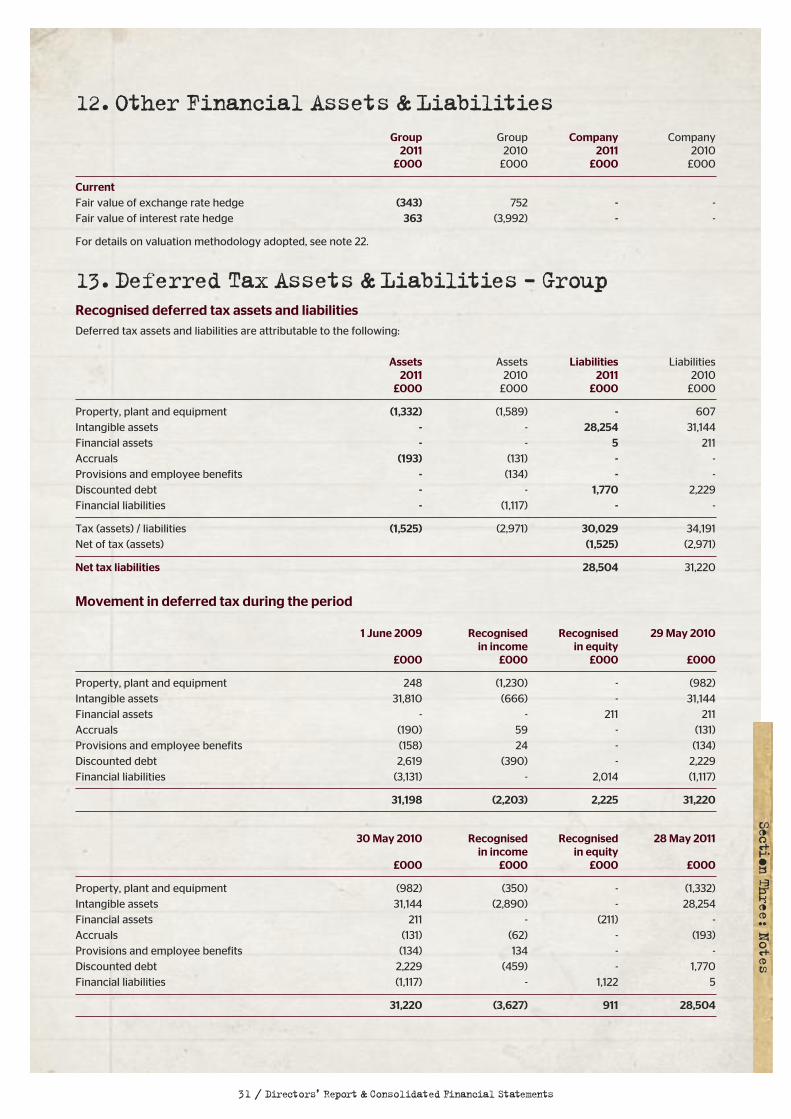
12.Other Financial Assets & LiabilitiesGroup Group Company Company2011 2010 2011 2010
£000 £000 £000 £000
CurrentFair value of exchange rate hedge (343) 752 - -Fair value of interest rate hedge 363 (3,992) - -
For details on valuation methodology adopted, see note 22.
13.Deferred Tax Assets & Liabilities - GroupRecognised deferred tax assets and liabilities Deferred tax assets and liabilities are attributable to the following:
Assets Assets Liabilities Liabilities2011 2010 2011 2010
£000 £000 £000 £000
Property, plant and equipment (1,332) (1,589) - 607Intangible assets - - 28,254 31,144Financial assets - - 5 211Accruals (193) (131) - -Provisions and employee benefits - (134) - -Discounted debt - - 1,770 2,229Financial liabilities - (1,117) - -
Tax (assets) / liabilities (1,525) (2,971) 30,029 34,191Net of tax (assets) (1,525) (2,971)
Net tax liabilities 28,504 31,220
Movement in deferred tax during the period
1 June 2009 Recognised Recognised 29 May 2010in income in equity
£000 £000 £000 £000
Property, plant and equipment 248 (1,230) - (982)Intangible assets 31,810 (666) - 31,144Financial assets - - 211 211Accruals (190) 59 - (131)Provisions and employee benefits (158) 24 - (134)Discounted debt 2,619 (390) - 2,229Financial liabilities (3,131) - 2,014 (1,117)
31,198 (2,203) 2,225 31,220
30 May 2010 Recognised Recognised 28 May 2011in income in equity
£000 £000 £000 £000
Property, plant and equipment (982) (350) - (1,332)Intangible assets 31,144 (2,890) - 28,254Financial assets 211 - (211) -Accruals (131) (62) - (193)Provisions and employee benefits (134) 134 - -Discounted debt 2,229 (459) - 1,770Financial liabilities (1,117) - 1,122 5
31,220 (3,627) 911 28,504
32 / Directors’ Report & Consolidated Financial Statements
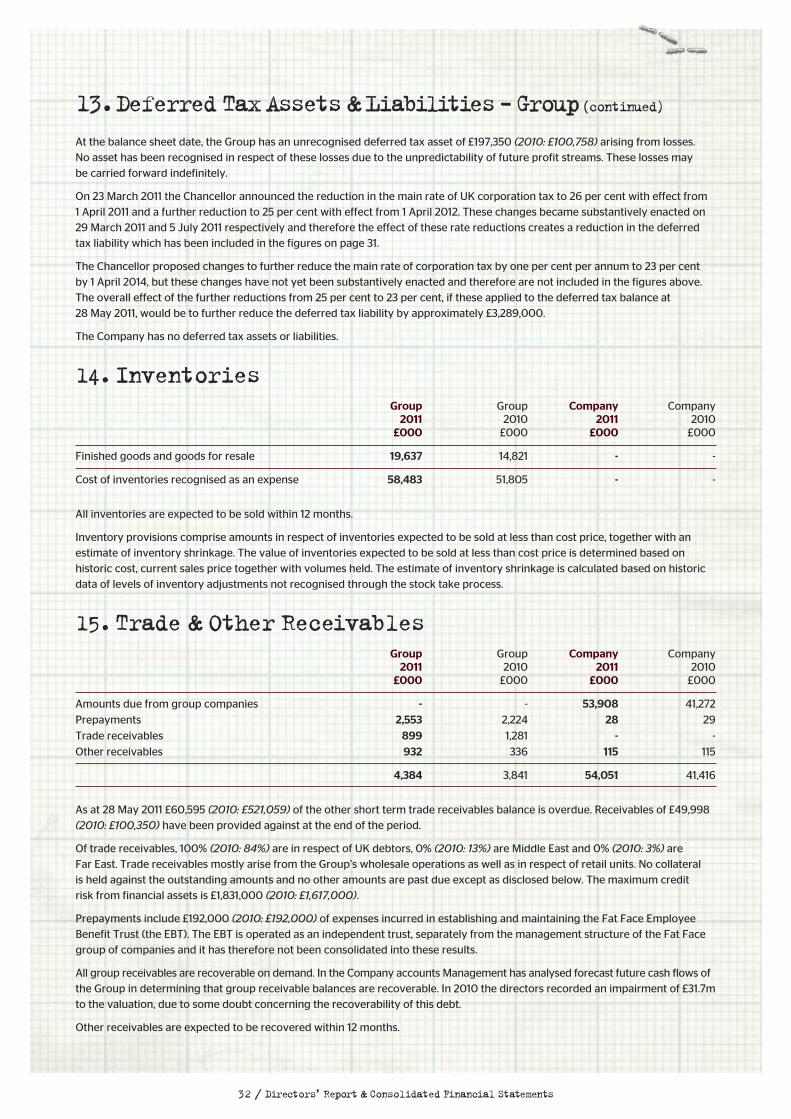
13.DeferredTaxAssets&Liabilities -Group(continued)
At the balance sheet date, the Group has an unrecognised deferred tax asset of £197,350 (2010: £100,758) arising from losses. No asset has been recognised in respect of these losses due to the unpredictability of future profit streams. These losses may be carried forward indefinitely.
On 23 March 2011 the Chancellor announced the reduction in the main rate of UK corporation tax to 26 per cent with effect from 1 April 2011 and a further reduction to 25 per cent with effect from 1 April 2012. These changes became substantively enacted on29 March 2011 and 5 July 2011 respectively and therefore the effect of these rate reductions creates a reduction in the deferredtax liability which has been included in the figures on page 31.
The Chancellor proposed changes to further reduce the main rate of corporation tax by one per cent per annum to 23 per cent by 1 April 2014, but these changes have not yet been substantively enacted and therefore are not included in the figures above.The overall effect of the further reductions from 25 per cent to 23 per cent, if these applied to the deferred tax balance at 28 May 2011, would be to further reduce the deferred tax liability by approximately £3,289,000.
The Company has no deferred tax assets or liabilities.
14.InventoriesGroup Group Company Company2011 2010 2011 2010
£000 £000 £000 £000
Finished goods and goods for resale 19,637 14,821 - -
Cost of inventories recognised as an expense 58,483 51,805 - -
All inventories are expected to be sold within 12 months.
Inventory provisions comprise amounts in respect of inventories expected to be sold at less than cost price, together with anestimate of inventory shrinkage. The value of inventories expected to be sold at less than cost price is determined based onhistoric cost, current sales price together with volumes held. The estimate of inventory shrinkage is calculated based on historicdata of levels of inventory adjustments not recognised through the stock take process.
15.Trade & Other ReceivablesGroup Group Company Company2011 2010 2011 2010
£000 £000 £000 £000
Amounts due from group companies - - 53,908 41,272
Prepayments 2,553 2,224 28 29
Trade receivables 899 1,281 - -
Other receivables 932 336 115 115
4,384 3,841 54,051 41,416
As at 28 May 2011 £60,595 (2010: £521,059) of the other short term trade receivables balance is overdue. Receivables of £49,998 (2010: £100,350) have been provided against at the end of the period.
Of trade receivables, 100% (2010: 84%) are in respect of UK debtors, 0% (2010: 13%) are Middle East and 0% (2010: 3%) are Far East. Trade receivables mostly arise from the Group’s wholesale operations as well as in respect of retail units. No collateral is held against the outstanding amounts and no other amounts are past due except as disclosed below. The maximum credit risk from financial assets is £1,831,000 (2010: £1,617,000).
Prepayments include £192,000 (2010: £192,000) of expenses incurred in establishing and maintaining the Fat Face EmployeeBenefit Trust (the EBT). The EBT is operated as an independent trust, separately from the management structure of the Fat Facegroup of companies and it has therefore not been consolidated into these results.
All group receivables are recoverable on demand. In the Company accounts Management has analysed forecast future cash flows ofthe Group in determining that group receivable balances are recoverable. In 2010 the directors recorded an impairment of £31.7mto the valuation, due to some doubt concerning the recoverability of this debt.
Other receivables are expected to be recovered within 12 months.
33 / Directors’ Report & Consolidated Financial Statements
SectionThree:
Notes
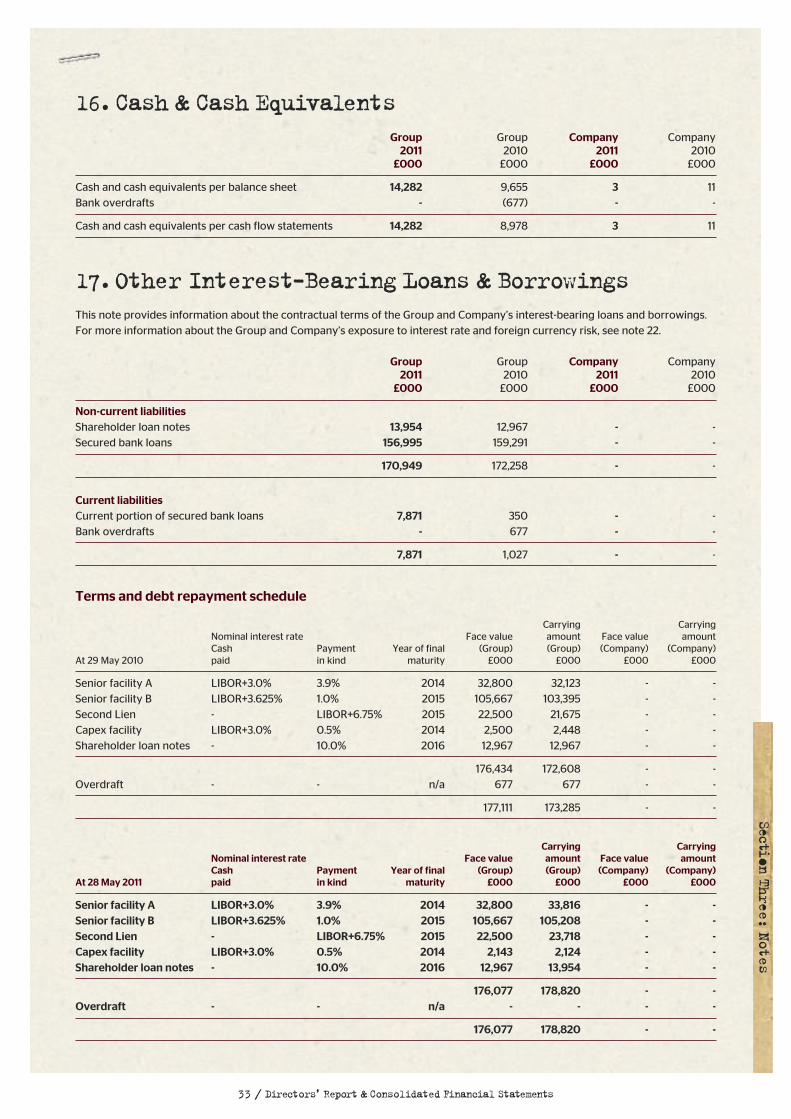
16.Cash & Cash EquivalentsGroup Group Company Company2011 2010 2011 2010
£000 £000 £000 £000
Cash and cash equivalents per balance sheet 14,282 9,655 3 11Bank overdrafts - (677) - -
Cash and cash equivalents per cash flow statements 14,282 8,978 3 11
17.Other Interest-Bearing Loans & BorrowingsThis note provides information about the contractual terms of the Group and Company’s interest-bearing loans and borrowings.For more information about the Group and Company’s exposure to interest rate and foreign currency risk, see note 22.
Group Group Company Company2011 2010 2011 2010
£000 £000 £000 £000
Non-current liabilitiesShareholder loan notes 13,954 12,967 - -Secured bank loans 156,995 159,291 - -
170,949 172,258 - -
Current liabilitiesCurrent portion of secured bank loans 7,871 350 - -Bank overdrafts - 677 - -
7,871 1,027 - -
Terms and debt repayment schedule
Carrying CarryingNominal interest rate Face value amount Face value amountCash Payment Year of final (Group) (Group) (Company) (Company)
At 29 May 2010 paid in kind maturity £000 £000 £000 £000
Senior facility A LIBOR+3.0% 3.9% 2014 32,800 32,123 - -Senior facility B LIBOR+3.625% 1.0% 2015 105,667 103,395 - -Second Lien - LIBOR+6.75% 2015 22,500 21,675 - -Capex facility LIBOR+3.0% 0.5% 2014 2,500 2,448 - -Shareholder loan notes - 10.0% 2016 12,967 12,967 - -
176,434 172,608 - -Overdraft - - n/a 677 677 - -
177,111 173,285 - -
Carrying CarryingNominal interest rate Face value amount Face value amountCash Payment Year of final (Group) (Group) (Company) (Company)
At 28 May 2011 paid in kind maturity £000 £000 £000 £000
Senior facility A LIBOR+3.0% 3.9% 2014 32,800 33,816 - -Senior facility B LIBOR+3.625% 1.0% 2015 105,667 105,208 - -Second Lien - LIBOR+6.75% 2015 22,500 23,718 - -Capex facility LIBOR+3.0% 0.5% 2014 2,143 2,124 - -Shareholder loan notes - 10.0% 2016 12,967 13,954 - -
176,077 178,820 - -Overdraft - - n/a - - - -
176,077 178,820 - -
17.Other Interest-BearingLoans&Borrowings(continued)
The Group’s banking facilities include a £20m revolving credit facility from which the capex facility loan above is drawn. A repayment
of £357k was made in May 2011 on the capex facility. Of the remaining £17.5m, Fat Face Limited, an indirect subsidiary of the Company,
has drawn £10m under an Ancillary Facilities agreement. This provides overdraft, guarantee, and supplier credit facilities for the
day-to-day operations of the Group. The Group has paid a non-utilisation fee of 1% on the remaining £7.5m revolving credit facility
plus any unutilised portion of the Ancillary Facilities Agreement.
The Group’s banking facilities are subject to EBITDA, interest and cash cover covenants typical for borrowings of this nature.
All of the direct and indirect subsidiaries of the Company are obligors and joint guarantors of the Group’s banking facilities.
The Group has entered into a security document which comprises fixed and floating charges over the Group’s assets, together
with assignments (by way of security) of insurance policies, specified bank accounts and certain specified contracts.
All Group term facilities and borrowings are denominated in sterling. All term facilities and borrowings are carried at face value
net of unamortised acquisition costs plus (where applicable) accumulated unpaid dividends and interest.
Some of the Group’s subsidiaries (including the principal operating company) have entered into long-standing security documents
in favour of the banking syndicate which comprise fixed and floating charges over each company’s assets, together with assignments
(by way of security) of insurance policies, specified bank accounts and certain specified contracts.
GroupDuring the period the Group capitalised £473,761 (2010: £3,970,000) of costs associated with debt facilities, which are being
amortised over the life of the associated debt. Of the total debt costs capitalised to date, £728,281 (2010: £3,958,000) was
amortised in the period.
CompanyThe Company incurred no costs associated with the establishment of new debt facilities during the period (2010: nil).
34 / Directors’ Report & Consolidated Financial Statements
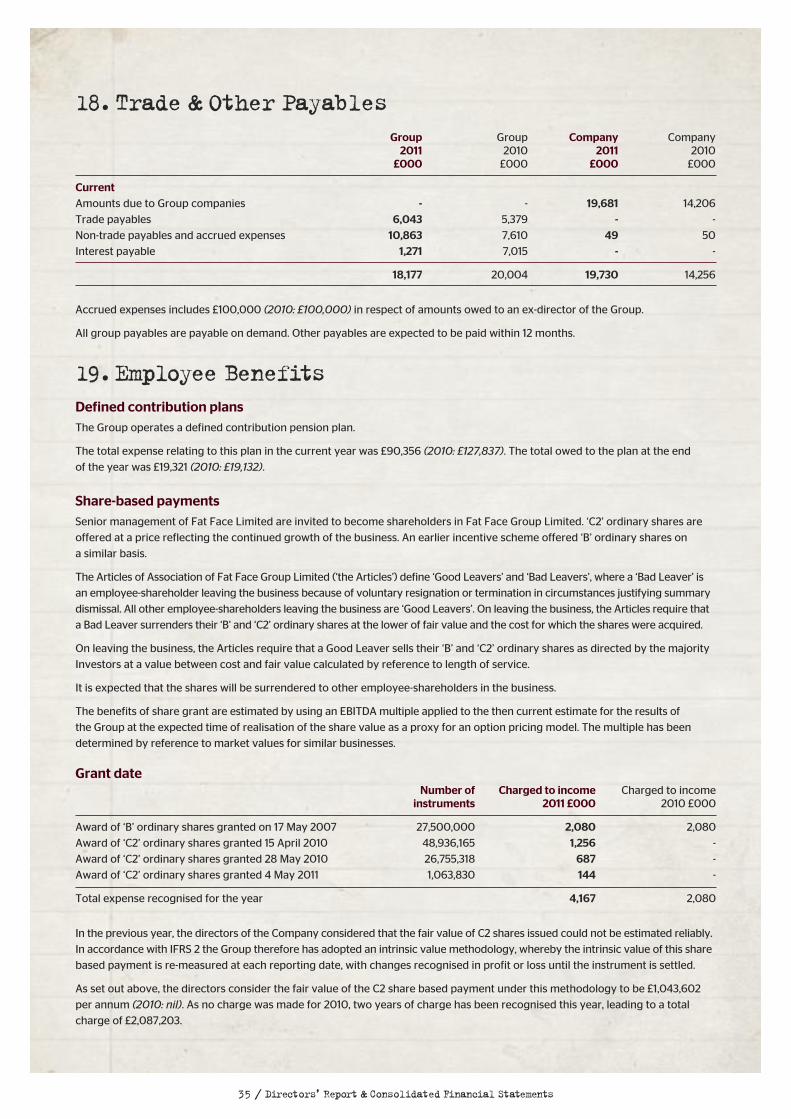
18.Trade & Other PayablesGroup Group Company Company2011 2010 2011 2010
£000 £000 £000 £000
CurrentAmounts due to Group companies - - 19,681 14,206
Trade payables 6,043 5,379 - -
Non-trade payables and accrued expenses 10,863 7,610 49 50
Interest payable 1,271 7,015 - -
18,177 20,004 19,730 14,256
Accrued expenses includes £100,000 (2010: £100,000) in respect of amounts owed to an ex-director of the Group.
All group payables are payable on demand. Other payables are expected to be paid within 12 months.
19.Employee BenefitsDefined contribution plansThe Group operates a defined contribution pension plan.
The total expense relating to this plan in the current year was £90,356 (2010: £127,837). The total owed to the plan at the end
of the year was £19,321 (2010: £19,132).
Share-based paymentsSenior management of Fat Face Limited are invited to become shareholders in Fat Face Group Limited. ‘C2’ ordinary shares are
offered at a price reflecting the continued growth of the business. An earlier incentive scheme offered ‘B’ ordinary shares on
a similar basis.
The Articles of Association of Fat Face Group Limited (‘the Articles’) define ‘Good Leavers’ and ‘Bad Leavers’, where a ‘Bad Leaver’ is
an employee-shareholder leaving the business because of voluntary resignation or termination in circumstances justifying summary
dismissal. All other employee-shareholders leaving the business are ‘Good Leavers’. On leaving the business, the Articles require that
a Bad Leaver surrenders their ‘B’ and ‘C2’ ordinary shares at the lower of fair value and the cost for which the shares were acquired.
On leaving the business, the Articles require that a Good Leaver sells their ‘B’ and ‘C2’ ordinary shares as directed by the majority
Investors at a value between cost and fair value calculated by reference to length of service.
It is expected that the shares will be surrendered to other employee-shareholders in the business.
The benefits of share grant are estimated by using an EBITDA multiple applied to the then current estimate for the results of
the Group at the expected time of realisation of the share value as a proxy for an option pricing model. The multiple has been
determined by reference to market values for similar businesses.
Grant dateNumber of Charged to income Charged to income
instruments 2011 £000 2010 £000
Award of ‘B’ ordinary shares granted on 17 May 2007 27,500,000 2,080 2,080
Award of ‘C2’ ordinary shares granted 15 April 2010 48,936,165 1,256 -
Award of ‘C2’ ordinary shares granted 28 May 2010 26,755,318 687 -
Award of ‘C2’ ordinary shares granted 4 May 2011 1,063,830 144 -
Total expense recognised for the year 4,167 2,080
In the previous year, the directors of the Company considered that the fair value of C2 shares issued could not be estimated reliably.
In accordance with IFRS 2 the Group therefore has adopted an intrinsic value methodology, whereby the intrinsic value of this share
based payment is re-measured at each reporting date, with changes recognised in profit or loss until the instrument is settled.
As set out above, the directors consider the fair value of the C2 share based payment under this methodology to be £1,043,602
per annum (2010: nil). As no charge was made for 2010, two years of charge has been recognised this year, leading to a total
charge of £2,087,203.
35 / Directors’ Report & Consolidated Financial Statements

36 / Directors’ Report & Consolidated Financial Statements
20.ProvisionsOnerous lease Dilapidation Total
provision £000 provision £000 £000
Balance at 30 May 2009 250 287 537
Provisions utilised during the year - (192) (192)
Provisions created during the year - 95 95
Balance at 29 May 2010 250 190 440
Balance at 30 May 2010 250 190 440
Provisions utilised during the year - (190) (190)
Provisions created during the year 709 307 1,016
Balance at 28 May 2011 959 307 1,266
Current 959 307 1,266
The onerous lease provision is made to cover the lease costs of properties that do not generate a positive net contribution.
The dilapidations provision is made to cover the costs of returning properties to the condition required by the lease on exit
and is based on management’s assessment of the store relocation programme and the current state of properties in the
Group’s portfolio.

37 / Directors’ Report & Consolidated Financial Statements
SectionThree:
Notes
21.Capital & ReservesShare capital
Preference Deferred Preferred C1 C2 OrdinaryIn thousands of shares shares shares ordinary shares shares shares shares
On issue at 31 May 2009 – fully paid 179,682 - 15,138 - - 100,000
Issued for cash - - - 471,063 75,691 -
Reclassified as deferred shares (179,682) 179,682 - - - -
On issue at 29 May 2010 – fully paid - 179,682 15,138 471,063 75,691 100,000
Prepaid shares at 29 May 2010 - - - 131,774 14,256 -
Total shares paid up at 29 May 2010 - 179,682 15,138 602,837 89,947 100,000Issued for cash - - - - 10,638 -
Total shares paid up at 28 May 2011 - 179,682 15,138 602,837 100,585 100,000
2011 2011 2010Authorised Alloted, called up Authorised, allotted,
and fully paid called up and fully paid£000 £000 £000
Share capitalA Ordinary shares of £0.01 each 725 725 725
B Ordinary shares of £0.01 each 275 275 275
Deferred shares of £1.00 each 18 18 18
Preferred ordinary shares of £0.01 each 151 151 151
C1 Shares of £0.000047 each 28 28 22
C2 Shares of £0.000047 each 5 5 3
1,202 1,202 1,194
Prepaid C1 Shares of £0.000047 each - - 6
Prepaid C2 Shares of £0.000047 each - - 1
1,202 1,202 1,201
Share premiumDeferred shares 179,664 179,664
Shares classified in equity 180,866 180,865
The holders of A and B ordinary shares and C1 shares are entitled to receive dividends as declared from time to time and are
entitled to one vote per share at meetings of the Company.
The holders of C2 shares are entitled to receive dividends as declared from time to time but are not entitled to vote at meetings
of the Company.
During the prior period, the Company issued new share capital, designated C1 shares and C2 shares, fully paid up to a value of
£0.000047 each, for a total consideration of £25,697 settled in cash. Additional amounts were received at the end of that year
totalling £6,863 in respect of C1 and C2 shares that were allocated at the end of the previous financial period but issued at the
beginning of this financial period. Additional C2 shares have been issued during this financial period for total consideration of £500.
During the prior period, the redeemable preference shares were reclassified as deferred shares with no dividend rights and
curtailed rights on capital distribution. Accordingly the principal waived on these shares together with the dividend accumulated
to March 2010 was reclassified as a capital contribution.
Cash flow hedging reserveThe hedging reserve comprises the effective portion of the cumulative net change in the fair value of cash flow hedging
instruments related to hedged transactions that have not yet occurred – see note 22.
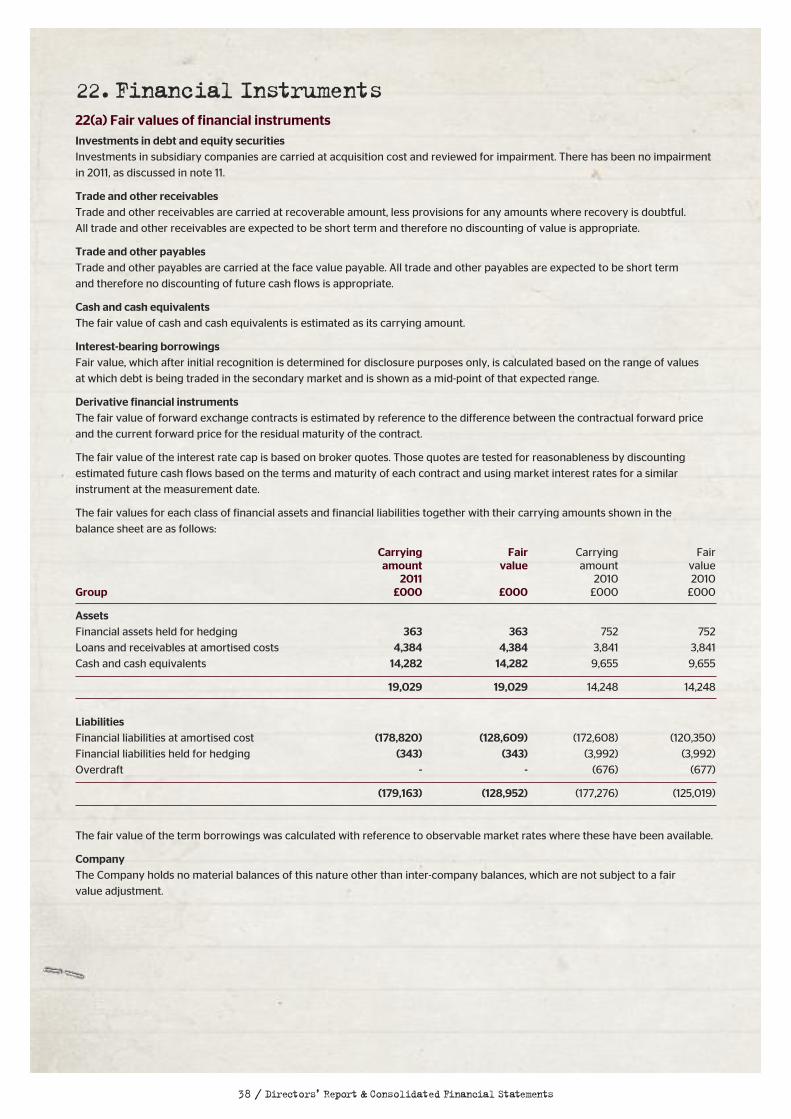
38 / Directors’ Report & Consolidated Financial Statements
22.Financial Instruments22(a) Fair values of financial instrumentsInvestments in debt and equity securitiesInvestments in subsidiary companies are carried at acquisition cost and reviewed for impairment. There has been no impairment
in 2011, as discussed in note 11.
Trade and other receivablesTrade and other receivables are carried at recoverable amount, less provisions for any amounts where recovery is doubtful.
All trade and other receivables are expected to be short term and therefore no discounting of value is appropriate.
Trade and other payablesTrade and other payables are carried at the face value payable. All trade and other payables are expected to be short term
and therefore no discounting of future cash flows is appropriate.
Cash and cash equivalentsThe fair value of cash and cash equivalents is estimated as its carrying amount.
Interest-bearing borrowingsFair value, which after initial recognition is determined for disclosure purposes only, is calculated based on the range of values
at which debt is being traded in the secondary market and is shown as a mid-point of that expected range.
Derivative financial instrumentsThe fair value of forward exchange contracts is estimated by reference to the difference between the contractual forward price
and the current forward price for the residual maturity of the contract.
The fair value of the interest rate cap is based on broker quotes. Those quotes are tested for reasonableness by discounting
estimated future cash flows based on the terms and maturity of each contract and using market interest rates for a similar
instrument at the measurement date.
The fair values for each class of financial assets and financial liabilities together with their carrying amounts shown in the
balance sheet are as follows:
Carrying Fair Carrying Fairamount value amount value
2011 2010 2010Group £000 £000 £000 £000
AssetsFinancial assets held for hedging 363 363 752 752
Loans and receivables at amortised costs 4,384 4,384 3,841 3,841
Cash and cash equivalents 14,282 14,282 9,655 9,655
19,029 19,029 14,248 14,248
LiabilitiesFinancial liabilities at amortised cost (178,820) (128,609) (172,608) (120,350)
Financial liabilities held for hedging (343) (343) (3,992) (3,992)
Overdraft - - (676) (677)
(179,163) (128,952) (177,276) (125,019)
The fair value of the term borrowings was calculated with reference to observable market rates where these have been available.
CompanyThe Company holds no material balances of this nature other than inter-company balances, which are not subject to a fair
value adjustment.
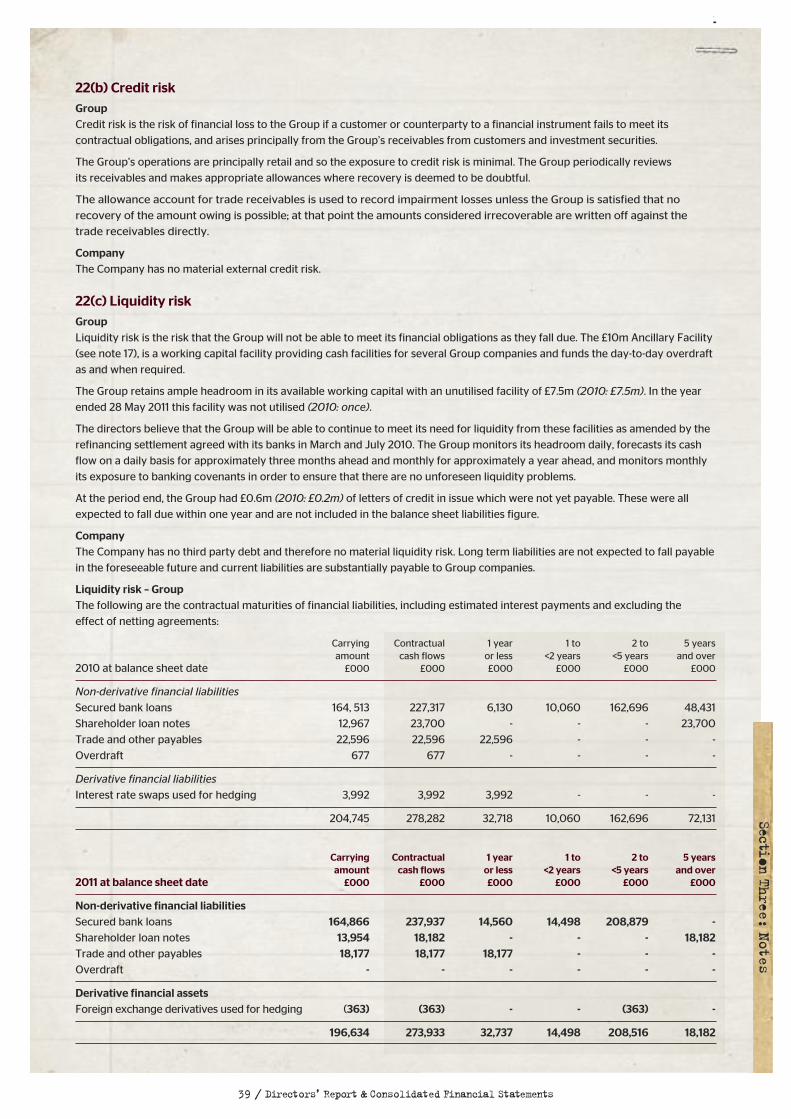
SectionThree:
Notes
39 / Directors’ Report & Consolidated Financial Statements
22(b) Credit riskGroupCredit risk is the risk of financial loss to the Group if a customer or counterparty to a financial instrument fails to meet its
contractual obligations, and arises principally from the Group’s receivables from customers and investment securities.
The Group’s operations are principally retail and so the exposure to credit risk is minimal. The Group periodically reviews
its receivables and makes appropriate allowances where recovery is deemed to be doubtful.
The allowance account for trade receivables is used to record impairment losses unless the Group is satisfied that no
recovery of the amount owing is possible; at that point the amounts considered irrecoverable are written off against the
trade receivables directly.
CompanyThe Company has no material external credit risk.
22(c) Liquidity riskGroupLiquidity risk is the risk that the Group will not be able to meet its financial obligations as they fall due. The £10m Ancillary Facility
(see note 17), is a working capital facility providing cash facilities for several Group companies and funds the day-to-day overdraft
as and when required.
The Group retains ample headroom in its available working capital with an unutilised facility of £7.5m (2010: £7.5m). In the year
ended 28 May 2011 this facility was not utilised (2010: once).
The directors believe that the Group will be able to continue to meet its need for liquidity from these facilities as amended by the
refinancing settlement agreed with its banks in March and July 2010. The Group monitors its headroom daily, forecasts its cash
flow on a daily basis for approximately three months ahead and monthly for approximately a year ahead, and monitors monthly
its exposure to banking covenants in order to ensure that there are no unforeseen liquidity problems.
At the period end, the Group had £0.6m (2010: £0.2m) of letters of credit in issue which were not yet payable. These were all
expected to fall due within one year and are not included in the balance sheet liabilities figure.
CompanyThe Company has no third party debt and therefore no material liquidity risk. Long term liabilities are not expected to fall payable
in the foreseeable future and current liabilities are substantially payable to Group companies.
Liquidity risk – GroupThe following are the contractual maturities of financial liabilities, including estimated interest payments and excluding the
effect of netting agreements:
Carrying Contractual 1 year 1 to 2 to 5 yearsamount cash flows or less <2 years <5 years and over
2010 at balance sheet date £000 £000 £000 £000 £000 £000
Non-derivative financial liabilities
Secured bank loans 164, 513 227,317 6,130 10,060 162,696 48,431
Shareholder loan notes 12,967 23,700 - - - 23,700
Trade and other payables 22,596 22,596 22,596 - - -
Overdraft 677 677 - - - -
Derivative financial liabilities
Interest rate swaps used for hedging 3,992 3,992 3,992 - - -
204,745 278,282 32,718 10,060 162,696 72,131
Carrying Contractual 1 year 1 to 2 to 5 yearsamount cash flows or less <2 years <5 years and over
2011 at balance sheet date £000 £000 £000 £000 £000 £000
Non-derivative financial liabilitiesSecured bank loans 164,866 237,937 14,560 14,498 208,879 -Shareholder loan notes 13,954 18,182 - - - 18,182Trade and other payables 18,177 18,177 18,177 - - -Overdraft - - - - - -
Derivative financial assetsForeign exchange derivatives used for hedging (363) (363) - - (363) -
196,634 273,933 32,737 14,498 208,516 18,182
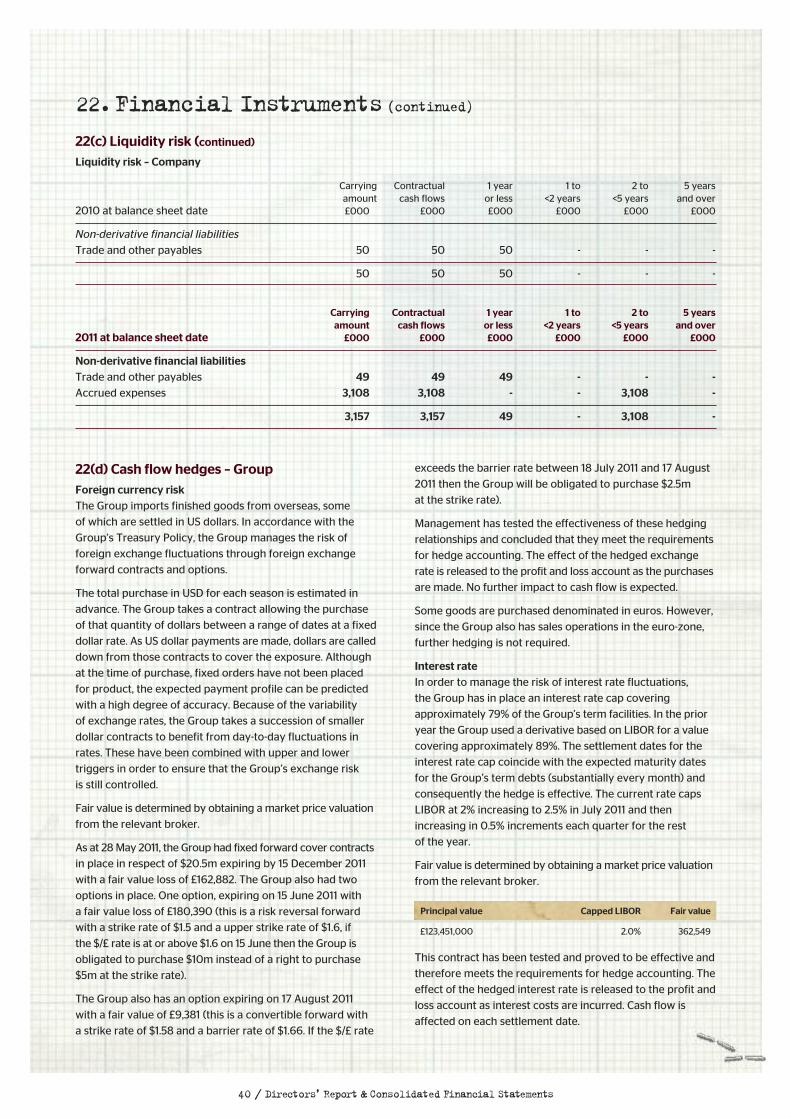
22.Financial Instruments(continued)
22(c) Liquidity risk (continued)Liquidity risk – Company
Carrying Contractual 1 year 1 to 2 to 5 yearsamount cash flows or less <2 years <5 years and over
2010 at balance sheet date £000 £000 £000 £000 £000 £000
Non-derivative financial liabilities
Trade and other payables 50 50 50 - - -
50 50 50 - - -
Carrying Contractual 1 year 1 to 2 to 5 yearsamount cash flows or less <2 years <5 years and over
2011 at balance sheet date £000 £000 £000 £000 £000 £000
Non-derivative financial liabilitiesTrade and other payables 49 49 49 - - -Accrued expenses 3,108 3,108 - - 3,108 -
3,157 3,157 49 - 3,108 -
40 / Directors’ Report & Consolidated Financial Statements
22(d) Cash flow hedges – GroupForeign currency riskThe Group imports finished goods from overseas, some
of which are settled in US dollars. In accordance with the
Group’s Treasury Policy, the Group manages the risk of
foreign exchange fluctuations through foreign exchange
forward contracts and options.
The total purchase in USD for each season is estimated in
advance. The Group takes a contract allowing the purchase
of that quantity of dollars between a range of dates at a fixed
dollar rate. As US dollar payments are made, dollars are called
down from those contracts to cover the exposure. Although
at the time of purchase, fixed orders have not been placed
for product, the expected payment profile can be predicted
with a high degree of accuracy. Because of the variability
of exchange rates, the Group takes a succession of smaller
dollar contracts to benefit from day-to-day fluctuations in
rates. These have been combined with upper and lower
triggers in order to ensure that the Group’s exchange risk
is still controlled.
Fair value is determined by obtaining a market price valuation
from the relevant broker.
As at 28 May 2011, the Group had fixed forward cover contracts
in place in respect of $20.5m expiring by 15 December 2011
with a fair value loss of £162,882. The Group also had two
options in place. One option, expiring on 15 June 2011 with
a fair value loss of £180,390 (this is a risk reversal forward
with a strike rate of $1.5 and a upper strike rate of $1.6, if
the $/£ rate is at or above $1.6 on 15 June then the Group is
obligated to purchase $10m instead of a right to purchase
$5m at the strike rate).
The Group also has an option expiring on 17 August 2011
with a fair value of £9,381 (this is a convertible forward with
a strike rate of $1.58 and a barrier rate of $1.66. If the $/£ rate
exceeds the barrier rate between 18 July 2011 and 17 August
2011 then the Group will be obligated to purchase $2.5m
at the strike rate).
Management has tested the effectiveness of these hedging
relationships and concluded that they meet the requirements
for hedge accounting. The effect of the hedged exchange
rate is released to the profit and loss account as the purchases
are made. No further impact to cash flow is expected.
Some goods are purchased denominated in euros. However,
since the Group also has sales operations in the euro-zone,
further hedging is not required.
Interest rateIn order to manage the risk of interest rate fluctuations,
the Group has in place an interest rate cap covering
approximately 79% of the Group’s term facilities. In the prior
year the Group used a derivative based on LIBOR for a value
covering approximately 89%. The settlement dates for the
interest rate cap coincide with the expected maturity dates
for the Group’s term debts (substantially every month) and
consequently the hedge is effective. The current rate caps
LIBOR at 2% increasing to 2.5% in July 2011 and then
increasing in 0.5% increments each quarter for the rest
of the year.
Fair value is determined by obtaining a market price valuation
from the relevant broker.
This contract has been tested and proved to be effective and
therefore meets the requirements for hedge accounting. The
effect of the hedged interest rate is released to the profit and
loss account as interest costs are incurred. Cash flow is
affected on each settlement date.
Principal value Capped LIBOR Fair value
£123,451,000 2.0% 362,549
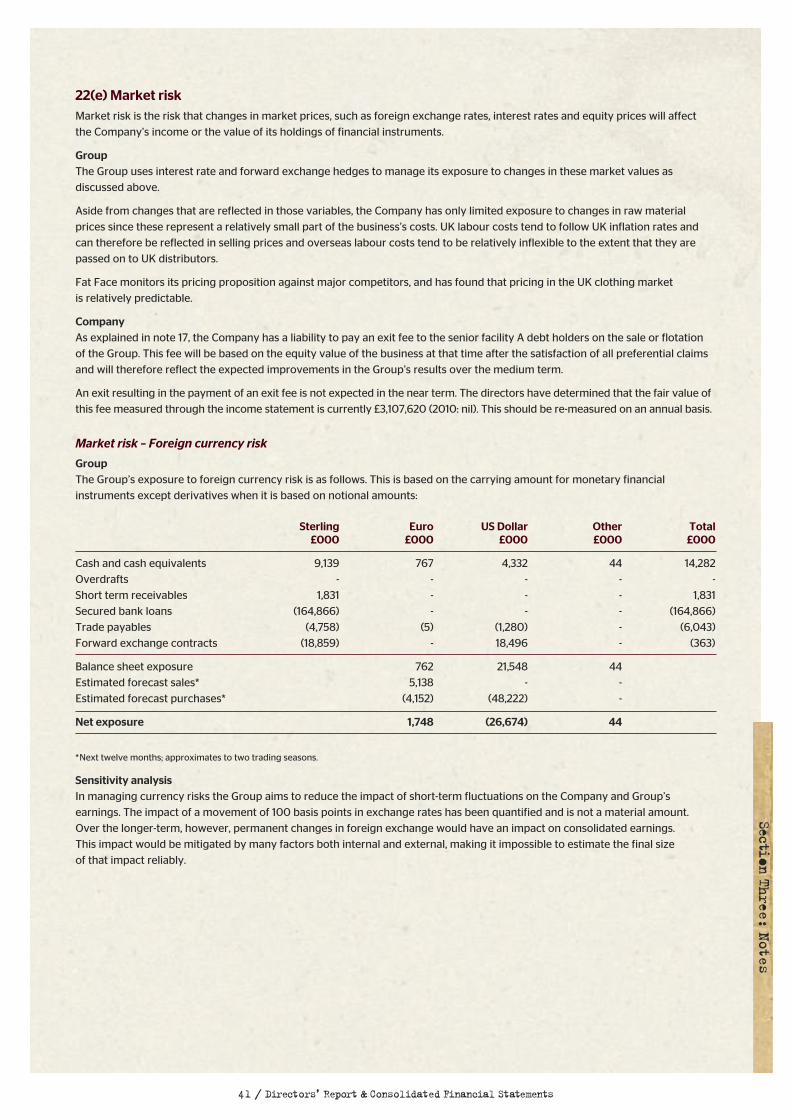
22(e) Market riskMarket risk is the risk that changes in market prices, such as foreign exchange rates, interest rates and equity prices will affect
the Company’s income or the value of its holdings of financial instruments.
GroupThe Group uses interest rate and forward exchange hedges to manage its exposure to changes in these market values as
discussed above.
Aside from changes that are reflected in those variables, the Company has only limited exposure to changes in raw material
prices since these represent a relatively small part of the business’s costs. UK labour costs tend to follow UK inflation rates and
can therefore be reflected in selling prices and overseas labour costs tend to be relatively inflexible to the extent that they are
passed on to UK distributors.
Fat Face monitors its pricing proposition against major competitors, and has found that pricing in the UK clothing market
is relatively predictable.
CompanyAs explained in note 17, the Company has a liability to pay an exit fee to the senior facility A debt holders on the sale or flotation
of the Group. This fee will be based on the equity value of the business at that time after the satisfaction of all preferential claims
and will therefore reflect the expected improvements in the Group’s results over the medium term.
An exit resulting in the payment of an exit fee is not expected in the near term. The directors have determined that the fair value of
this fee measured through the income statement is currently £3,107,620 (2010: nil). This should be re-measured on an annual basis.
Market risk – Foreign currency risk
GroupThe Group’s exposure to foreign currency risk is as follows. This is based on the carrying amount for monetary financial
instruments except derivatives when it is based on notional amounts:
Sterling Euro US Dollar Other Total£000 £000 £000 £000 £000
Cash and cash equivalents 9,139 767 4,332 44 14,282
Overdrafts - - - - -
Short term receivables 1,831 - - - 1,831
Secured bank loans (164,866) - - - (164,866)
Trade payables (4,758) (5) (1,280) - (6,043)
Forward exchange contracts (18,859) - 18,496 - (363)
Balance sheet exposure 762 21,548 44
Estimated forecast sales* 5,138 - -
Estimated forecast purchases* (4,152) (48,222) -
Net exposure 1,748 (26,674) 44
*Next twelve months; approximates to two trading seasons.
Sensitivity analysisIn managing currency risks the Group aims to reduce the impact of short-term fluctuations on the Company and Group’s
earnings. The impact of a movement of 100 basis points in exchange rates has been quantified and is not a material amount.
Over the longer-term, however, permanent changes in foreign exchange would have an impact on consolidated earnings.
This impact would be mitigated by many factors both internal and external, making it impossible to estimate the final size
of that impact reliably.
41 / Directors’ Report & Consolidated Financial Statements
SectionThree:
Notes
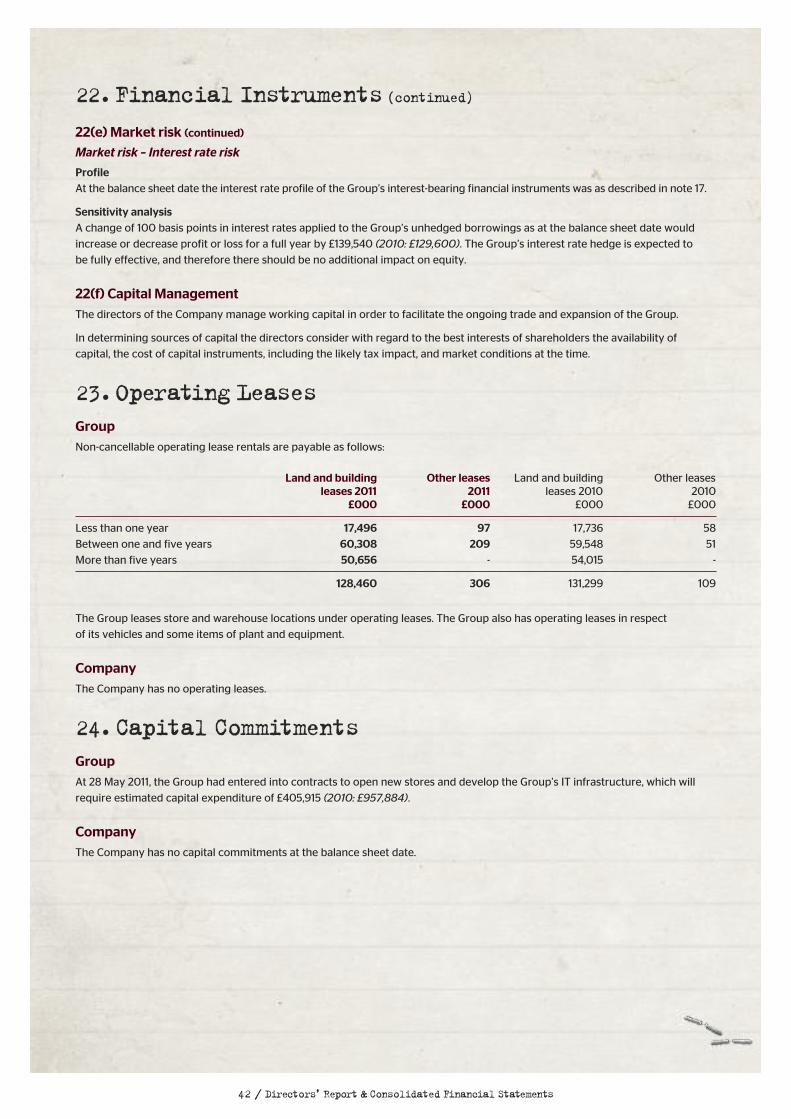
42 / Directors’ Report & Consolidated Financial Statements
22.Financial Instruments(continued)
22(e) Market risk (continued)Market risk – Interest rate risk
ProfileAt the balance sheet date the interest rate profile of the Group’s interest-bearing financial instruments was as described in note 17.
Sensitivity analysisA change of 100 basis points in interest rates applied to the Group’s unhedged borrowings as at the balance sheet date would
increase or decrease profit or loss for a full year by £139,540 (2010: £129,600). The Group’s interest rate hedge is expected to
be fully effective, and therefore there should be no additional impact on equity.
22(f) Capital ManagementThe directors of the Company manage working capital in order to facilitate the ongoing trade and expansion of the Group.
In determining sources of capital the directors consider with regard to the best interests of shareholders the availability of
capital, the cost of capital instruments, including the likely tax impact, and market conditions at the time.
23.Operating LeasesGroupNon-cancellable operating lease rentals are payable as follows:
Land and building Other leases Land and building Other leases leases 2011 2011 leases 2010 2010
£000 £000 £000 £000
Less than one year 17,496 97 17,736 58
Between one and five years 60,308 209 59,548 51
More than five years 50,656 - 54,015 -
128,460 306 131,299 109
The Group leases store and warehouse locations under operating leases. The Group also has operating leases in respect
of its vehicles and some items of plant and equipment.
CompanyThe Company has no operating leases.
24.Capital CommitmentsGroupAt 28 May 2011, the Group had entered into contracts to open new stores and develop the Group’s IT infrastructure, which will
require estimated capital expenditure of £405,915 (2010: £957,884).
CompanyThe Company has no capital commitments at the balance sheet date.
SectionThree:
Notes
43 / Directors’ Report & Consolidated Financial Statements
25.Related PartiesDuring the period the Group incurred an annual management charge of £100,000 to Bridgepoint Advisers Limited (2010: £129,000).
During the period the Group continued to lease two (2010: three) properties on an arm’s length basis from The 1604 Partnership,
owned by Tim Slade and Jules Leaver, who were directors of several Group companies until 2005 and remain shareholders in
Fat Face Group Limited. Details of transactions with this partnership are as follows:
2011 2010
£000 £000
Value of transactionLease of property 44 51
The maximum value outstanding during the year was nil (2010: nil). The amount outstanding at year end was nil (2010: nil).
During the period the Group paid nil (2010: £4,123) to a former director in respect of consultancy fees.
During the period the Group paid £35,748 in total to companies owned by family members of a director. All of these transactions
were carried out on an arm’s length basis with the appropriate approval by members of the board.
Transactions with key management personnelDirectors of the Company control, or have held in trust on their behalf, 3.03% (2010: 5%) of the voting shares of Fat Face Group Limited.
The compensation of key management personnel (the directors) is as disclosed in note 6.
26.Ultimate Parent Company& Parent Company of Larger GroupThe Company is the ultimate parent company of the Fat Face Group of Companies incorporated in England. The ultimate
controlling party is the Bridgepoint Europe III Fund managed by Bridgepoint Advisers Limited which holds 79% of the ordinary
share capital of the Company and controls syndicated holdings of a further 12%.
No other g roup financial statements include the results of the Company.

Life is out there...fatface.com

!DO NOT PRINT!
INSIDE REAR COVERGOES HERE
SEE SEPARATE ARTWORK SUPPLIEDFF GROUP_STATS 11_COVER_AW
Fat Face Group Limited(formerly Fat Face World Limited)
Unit 1 Ridgway, Havant, Hampshire PO9 1QJt:02392 441 100 / e:[email protected] / w:fatface.com

!DO NOT PRINT!
REAR COVERGOES HERE
SEE SEPARATE ARTWORK SUPPLIEDFF GROUP_STATS 11_COVER_AW
Fat Face Group Limited(formerly Fat Face World Limited)
Unit 1 Ridgway, Havant, Hampshire PO9 1QJt:02392 441 100 / e:[email protected] / w:fatface.com
{Walker Report}
Outlook - trends and factorsaffecting future performanceThe outlook for the economy for the year ahead is likely to
be challenging. Rising inflation and unemployment have put
pressure on consumers’ disposable income and the fear of
a ‘double dip’ recession has dampened customer sentiment
and as such we expect that the trading environment will be
difficult throughout 2011/12. We expect our margins to remain
under pressure as a result of rising input prices and the full
year effect of the VAT rise. We are confident though that the
actions we have taken over the last 12 months have improved
the business and made it better able to weather the
uncertainty and emerge strongly as the economy improves.
Financial positionThe Fat Face Group is financed by bank debt. At 28th May
2011, outstanding net debt was £165m (2010: £160m). The
Group’s banking facilities also include a £20m revolving
credit facility from which the £2.5m capex facility loan is
drawn. Of the remaining £17.5m, Fat Face Limited, an indirect
subsidiary of the Group, has drawn £10m under an ancillary
facilities agreement. This provides overdraft, guarantee and
supplier credit facilities for the day-to-day operations of the
Group. All Group facilities and borrowings are denominated
in sterling. During the financial year, a repayment of £357k
was made in May 2011 on the capex facility.
The cost of servicing the bank debt was £11.6m (2010: £19.2m),
of which cash interest was £5.3m (2010: £14.0m) and
‘payment in kind’ (PIK) interest was £6.2m (2010: £5.2m). The
Group’s banking facilities are subject to EBITDA, interest and
cash cover covenants typical for borrowings of this nature.
Addendum
Additional Walker disclosureIn November 2007, David Walker published “Guidelines for
Disclosure and Transparency in Private Equity” (the Walker
report) which recommended that portfolio companies of
private equity firms make certain additional disclosure in their
financial statements.
Fat Face Group Limited is a portfolio company as defined
in the Walker report, and subsequently amended by the
Guidelines Monitoring Group, and the Board of Directors has
agreed to adopt the recommendations in the Walker report.
The financial statements for the year ended 28 May 2011 are
the first year of adoption of these recommendations and as
an addendum to the financial statements the Group has
provided the additional disclosures detailed below.
Strategic prioritiesGiven the encouraging progress in stabilising the business
that has been made during the year, a key focus for the next
financial year will be the development of the longer term
strategy for the Group. The Group will be undertaking a
strategic review in the first half of next year, which is likely
to include the following key areas:
• Continued product and range development
• UK property strategy
• Development of the e-commerce business
• Possible international expansion