do japanese insurers benefit from a catastrophic event?: market reactions to the 1995...
TRANSCRIPT
Journal of the Japanese and International Economies 16, 92–108 (2002)doi:10.1006/jjie.2001.0477, available online at http://www.idealibrary.com on
Do Japanese Insurers Benefit from A Catastrophic Event?1
Market Reactions to the 1995 Hanshin–Awaji Earthquake
Nobuyoshi Yamori
Graduate School of Economics, Nagoya University, Nagoya, 464–8601, JapanE-mail: [email protected] or [email protected]
and
Takeshi Kobayashi
School of Economics, Chukyo University, Nagoya, 466–8666, Japan
Received December 10, 1999; revised May 24, 2001; published online January 8, 2002
Yamori, Nobuyoshi, and Kobayashi, Takeshi—Do Japanese Insurers Benefit From ACatastrophic Event? Market Reactions to the 1995 Hanshin-Awaji Earthquake
Several studies have examined the “gaining from loss” hypothesis, whereby insurancecompanies’ market valuation increases after a natural disaster because the anticipated sub-sequent increase in demand for coverage is presumed by investors to outweigh the effectsof capital outflow from insurance companies for claims payments. Previous studies inves-tigating how stock markets assessed the impact of big earthquakes in the United States(e.g., the 1989 Loma Prieta earthquake) found that insurance firm values did indeed in-crease following such catastrophes. This is the first paper to test this hypothesis using acase outside the United States. Specifically, we investigate how the Japanese stock marketreassessed domestic insurance firm values after the 1995 Hanshin–Awaji earthquake. Con-trary to the findings based on U.S. earthquakes, we found negative stock price reactions.Another important finding is that Japanese stock markets were notably efficient in assessing
1 This paper was originally written while the first author was a visiting scholar at the Center for PacificBasin Monetary and Economic Studies of the Federal Reserve Bank of San Francisco. The authorsappreciate Mark Spiegel, Ramon Moreno, Guillermo Pinczuk, Diemer Smith, and participants in theWest Coast Japan Economic Seminar for their valuable comments. Also, comments given by ProfessorTakeo Hoshi (Editor of the Journal of Japanese and International Economies) and two anonymousreferees of the journal allowed us to improve the paper substantially. The authors thank the Marine andFire Insurance Association of Japan for answering our questions about Japanese earthquake insurance.Finally, the first author thanks the Shikishima Foundation for its financial support.
92
0889-1583/02 $35.00c© 2002 Elsevier Science (USA)
All rights reserved.
JAPANESE INSURERS AND EARTHQUAKES 93
information following the earthquake. J. Japan. Int. Econ., March 2002, 16(1), pp. 92–108.Graduate School of Economics, Nagoya University, Nagoya, 464-8601, Japan and Schoolof Economics, Chukyo University, Nagoya, 466-8666, Japan. c© 2002 Elsevier Science (USA)
Journal of Economic Literature Classification Numbers: G-22, G-14.
Key Words: Hanshin-Awaji earthquake; earthquake insurance; gaining from loss; Japaneseinsurance companies; event study.
1. INTRODUCTION
The Hanshin–Awaji earthquake occurred in South Hyogo at 5:14 a.m. on January17, 1995. The earthquake, which registered 7.2 on the Richter scale, resulted in5,502 deaths and 41,527 injuries.2 In addition, 100,282 commercial and residentialbuildings were completely destroyed, 108,402 were half destroyed, and 185,756were partially destroyed. Insurance companies paid approximately 77 billion yenin earthquake insurance payments. While these payments were less than 10%of the estimated total loss, these were the largest insurance payments since theestablishment of the Japanese earthquake insurance system in 1966.3
It is reasonable to assume that the potentially large insurance payments coveringthese catastrophic losses would negatively affect insurers’ stock prices. However,most previous studies have shown that insurers benefited from a catastrophic eventbecause of subsequent increased demand for insurance coverage. For example,Shelor et al. (1992) found that the 1989 San Francisco (Loma Prieta) earthquakewas followed by an increase in insurers’ stock prices.
While several previous studies found that insurers’ stock prices respond posi-tively to a big earthquake, these studies covered only U.S. earthquakes and insurers.In this paper, we investigate the impact of the Hanshin–Awaji earthquake on the eq-uity values of Japanese insurance companies. This is the first attempt to empiricallyinvestigate a non-U.S. stock market reaction to a large earthquake.
The implications of this paper are important for Japanese regulators and in-vestors, since earthquakes of a magnitude higher than 8.0 on the Richter scaleare expected in the near future for the Tokai and South Kanto Metropolitan ar-eas, which include Tokyo. As earthquake insurance payments resulting from theseearthquakes are estimated to exceed 1.8 trillion yen, the earthquakes could seri-ously damage the financial position of Japanese insurance companies.4 However,as previous U.S. studies suggest, if such an earthquake is likely to benefit insurers,then investors and regulators of insurance companies need be less concerned aboutpotential bankruptcy risks due to earthquakes. Therefore, to assess the potential
2 These numbers were estimated by the Fire Department of the Japanese Government.3 Total estimated loss was about 10 trillion yen (including 3.9 trillion yen in residential losses).4 There are several estimations regarding human and financial losses caused by these earthquakes.
For example, according to Tokyo Yomiuri Shinbun (January 18, 1995), the National Land Agencyestimates that the South Kanto earthquake will kill 152,000 people and Tokai Bank estimates that thefinancial losses caused by the South Kanto earthquake will amount to 80.4 trillion yen.
94 YAMORI AND KOBAYASHI
impact of future earthquakes, it is instructive to investigate the impact of theHanshin–Awaji earthquake on Japanese insurance companies.
This paper consists of seven sections. Following this introduction, Section 2 re-views previous studies. Section 3 describes how the Japanese earthquake insuranceindustry is different from its U.S. counterpart. In Section 4, we detail the data andmethodology used in this paper. Section 5 discusses the results for the portfolio,and Section 6 considers the relationship between exposure and market response.Finally, Section 7 provides the conclusion of this paper.
2. PREVIOUS STUDIES
As previous studies (e.g., Shelor et al., 1992) point out, an earthquake has bothunfavorable and favorable effects on the equity values of insurance firms. The unfa-vorable effect of catastrophic events is due to the rapid depletion of insurers’ surplusaccounts for claims payments, which in turn leads investors to discount insurancefirm stock values. However, insurers may benefit from an isolated catastrophicevent because of subsequent increased demand for coverage. We empirically in-vestigate whether the increases in this induced demand outweigh the depletion ofsurplus accounts.
In fact, several papers have investigated the impact of catastrophic disasters (e.g.,earthquakes and hurricanes) on insurers’ stock prices.5 Two studies of insurancestock prices following the 1989 San Francisco (Loma Prieta) earthquake have beenpublished. One is Shelor et al. (1992), and the other is Aiuppa et al. (1993).6
Shelor et al. (1992) found that average stock prices of property-liability insur-ers rose after the 1989 San Francisco earthquake. Using a different sample andmethodology, Aiuppa et al. (1993) also found that earthquake insurers offeringcoverage in California experienced significant stock price increases.7 Therefore,both studies support the “gaining from loss” hypothesis that insurers could benefitfrom earthquakes because of subsequent increased coverage.
The impact of the 1994 Los Angeles (Northridge) earthquake on insurancefirm’s values is studied by Aiuppa and Krueger (1995) and Lamb and Kennedy(1997). Lamb and Kennedy (1997) found significant positive abnormal returnsfor exposed insurers and insignificant negative abnormal returns for unexposed
5 There are some papers dealing with the impact of catastrophic events other than earthquakes andhurricanes on stock prices. Davidson and Thornton (1985) investigated the effect of an overheated coreat the Three Mile Island nuclear power plant on stock prices of insurance companies. They found nosignificant negative impact caused by that event. Also, Davidson et al. (1987), investigating the impactof airplane crashes on stock prices, found that airplane crashes did not generate a significant prolongednegative impact on airline shareholders.
6 Shelor et al. (1992) maintained that there were no analyses of the impact of catastrophic losses oninsurance firm values at that time.
7 Aiuppa et al. (1993) found that insurers not offering coverage in California experienced a declinein their stock prices.
JAPANESE INSURERS AND EARTHQUAKES 95
insurers after the Los Angeles earthquake. This is consistent with the San Franciscostudies.
Aiuppa and Krueger (1995), using a sample different from Lamb and Kennedy(1997), obtained significant negative abnormal stock returns on the day of theearthquake for both exposed and unexposed insurers. Though their result appearsdifferent from previous studies, their results are essentially similar since the cumu-lative abnormal returns for the ten-day period after the earthquake are positive forexposed insurers. Furthermore, Aiuppa and Krueger (1995) found that unexposedinsurers suffered greater losses than exposed insurers from the earthquake. Thisresult indicates that stock market investors considered the information associatedwith the earthquake as relatively favorable for insurers with premium volume inCalifornia. Therefore, previous studies dealing with large U.S. earthquakes haveuniformly provided evidence supporting the gaining from loss hypothesis.
The results of studies on the impact of Hurricanes Hugo and Andrew are also ofinterest. Lamb (1995) investigated the impact of Hurricane Andrew on insurancefirm values and Cargle (1996) investigated the impact of Hurricane Hugo on in-surance firm values. Unlike the above earthquake studies, these hurricane studiesfound significant negative abnormal returns for exposed insurers and insignificantresponses for unexposed insurers.
3. JAPANESE EARTHQUAKE INSURANCE
Japan has frequently suffered from big earthquakes. For example, the KantoGreat Earthquake, which struck the Tokyo metropolitan area in 1923, resulted in99,331 deaths and left 43,476 missing. The financial losses were estimated at about5.5 billion yen, which was three and a half times as large as the annual expendituresof the national government, or 36.8% of the GNP at that time.8
Although earthquake insurance was badly needed for many years, private in-surers hesitated to provide earthquake insurance coverage because damage couldbe too severe and widespread. Finally, responding to political pressure after the1964 Niigata earthquake, the Japanese government proposed the establishmentof the Japanese Earthquake Insurance Act, which was made effective in 1966.The Earthquake Insurance Act has been modified several times since its establish-ment. The main characteristics of the Earthquake Insurance Act at the time of theHanshin–Awaji earthquake were as follows.
(1) Japanese earthquake insurance covered only residential buildings andhousehold belongings. Only people who bought fire insurance were eligible forearthquake insurance coverage. Japanese fire insurance does not cover any lossescaused by an earthquake. For example, when a house was lost due to a fire caused
8 GNP in 1923 is estimated at 14.9 billion yen. The source is “Estimates of Long-Term EconomicStatistics of Japan Since 1868, Vol. 1,” edited by K. Ohkawa, N. Takayama, and Y. Yamamoto (ToyoKeizai Shinposha, Tokyo, 1974).
96 YAMORI AND KOBAYASHI
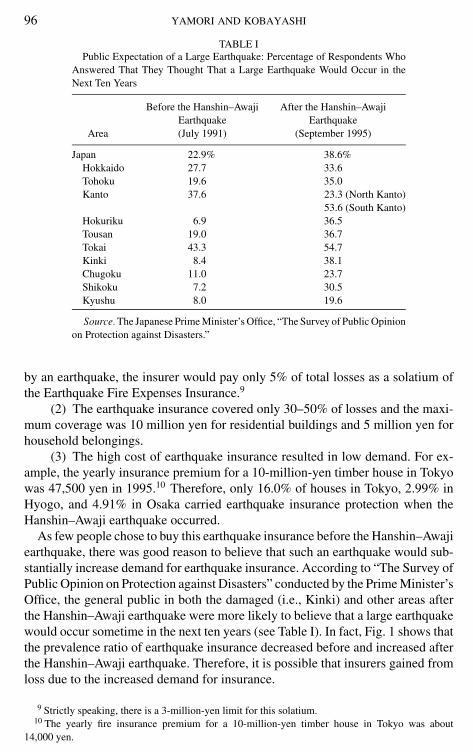
TABLE IPublic Expectation of a Large Earthquake: Percentage of Respondents Who
Answered That They Thought That a Large Earthquake Would Occur in theNext Ten Years
Before the Hanshin–Awaji After the Hanshin–AwajiEarthquake Earthquake
Area (July 1991) (September 1995)
Japan 22.9% 38.6%Hokkaido 27.7 33.6Tohoku 19.6 35.0Kanto 37.6 23.3 (North Kanto)
53.6 (South Kanto)Hokuriku 6.9 36.5Tousan 19.0 36.7Tokai 43.3 54.7Kinki 8.4 38.1Chugoku 11.0 23.7Shikoku 7.2 30.5Kyushu 8.0 19.6
Source. The Japanese Prime Minister’s Office, “The Survey of Public Opinionon Protection against Disasters.”
by an earthquake, the insurer would pay only 5% of total losses as a solatium ofthe Earthquake Fire Expenses Insurance.9
(2) The earthquake insurance covered only 30–50% of losses and the maxi-mum coverage was 10 million yen for residential buildings and 5 million yen forhousehold belongings.
(3) The high cost of earthquake insurance resulted in low demand. For ex-ample, the yearly insurance premium for a 10-million-yen timber house in Tokyowas 47,500 yen in 1995.10 Therefore, only 16.0% of houses in Tokyo, 2.99% inHyogo, and 4.91% in Osaka carried earthquake insurance protection when theHanshin–Awaji earthquake occurred.
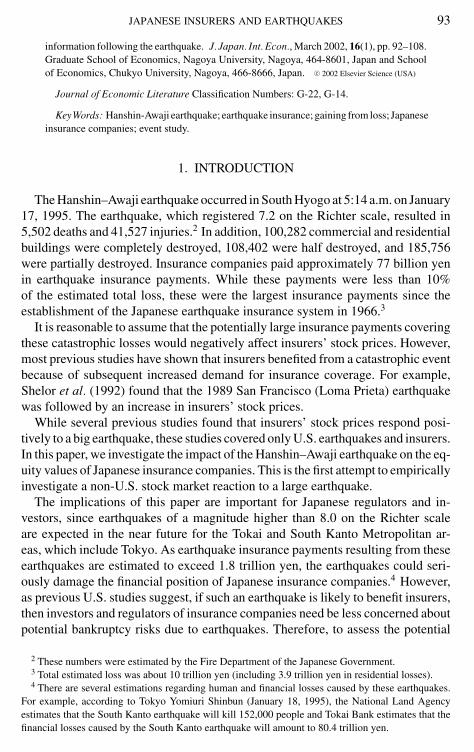
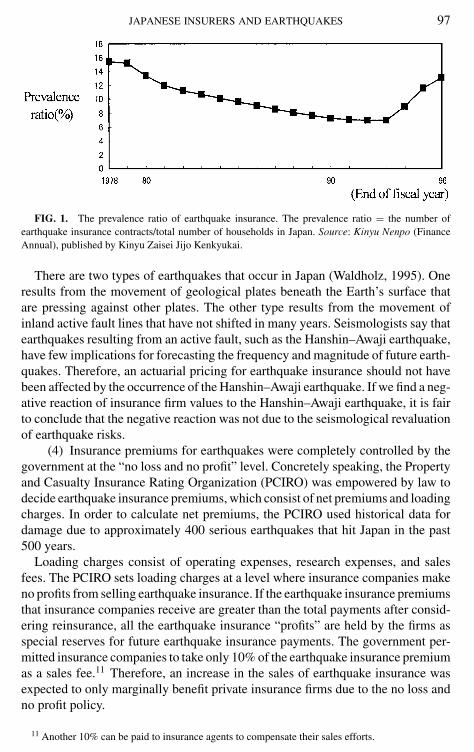
As few people chose to buy this earthquake insurance before the Hanshin–Awajiearthquake, there was good reason to believe that such an earthquake would sub-stantially increase demand for earthquake insurance. According to “The Survey ofPublic Opinion on Protection against Disasters” conducted by the Prime Minister’sOffice, the general public in both the damaged (i.e., Kinki) and other areas afterthe Hanshin–Awaji earthquake were more likely to believe that a large earthquakewould occur sometime in the next ten years (see Table I). In fact, Fig. 1 shows thatthe prevalence ratio of earthquake insurance decreased before and increased afterthe Hanshin–Awaji earthquake. Therefore, it is possible that insurers gained fromloss due to the increased demand for insurance.
9 Strictly speaking, there is a 3-million-yen limit for this solatium.10 The yearly fire insurance premium for a 10-million-yen timber house in Tokyo was about
14,000 yen.
JAPANESE INSURERS AND EARTHQUAKES 97
FIG. 1. The prevalence ratio of earthquake insurance. The prevalence ratio = the number ofearthquake insurance contracts/total number of households in Japan. Source: Kinyu Nenpo (FinanceAnnual), published by Kinyu Zaisei Jijo Kenkyukai.
There are two types of earthquakes that occur in Japan (Waldholz, 1995). Oneresults from the movement of geological plates beneath the Earth’s surface thatare pressing against other plates. The other type results from the movement ofinland active fault lines that have not shifted in many years. Seismologists say thatearthquakes resulting from an active fault, such as the Hanshin–Awaji earthquake,have few implications for forecasting the frequency and magnitude of future earth-quakes. Therefore, an actuarial pricing for earthquake insurance should not havebeen affected by the occurrence of the Hanshin–Awaji earthquake. If we find a neg-ative reaction of insurance firm values to the Hanshin–Awaji earthquake, it is fairto conclude that the negative reaction was not due to the seismological revaluationof earthquake risks.
(4) Insurance premiums for earthquakes were completely controlled by thegovernment at the “no loss and no profit” level. Concretely speaking, the Propertyand Casualty Insurance Rating Organization (PCIRO) was empowered by law todecide earthquake insurance premiums, which consist of net premiums and loadingcharges. In order to calculate net premiums, the PCIRO used historical data fordamage due to approximately 400 serious earthquakes that hit Japan in the past500 years.
Loading charges consist of operating expenses, research expenses, and salesfees. The PCIRO sets loading charges at a level where insurance companies makeno profits from selling earthquake insurance. If the earthquake insurance premiumsthat insurance companies receive are greater than the total payments after consid-ering reinsurance, all the earthquake insurance “profits” are held by the firms asspecial reserves for future earthquake insurance payments. The government per-mitted insurance companies to take only 10% of the earthquake insurance premiumas a sales fee.11 Therefore, an increase in the sales of earthquake insurance wasexpected to only marginally benefit private insurance firms due to the no loss andno profit policy.
11 Another 10% can be paid to insurance agents to compensate their sales efforts.
98 YAMORI AND KOBAYASHI
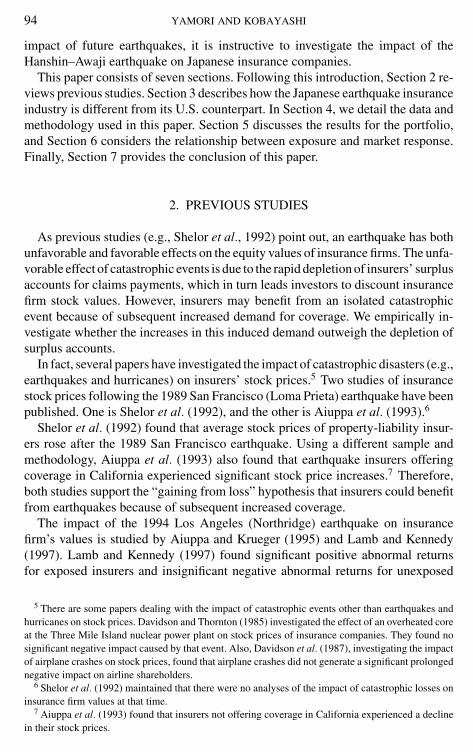
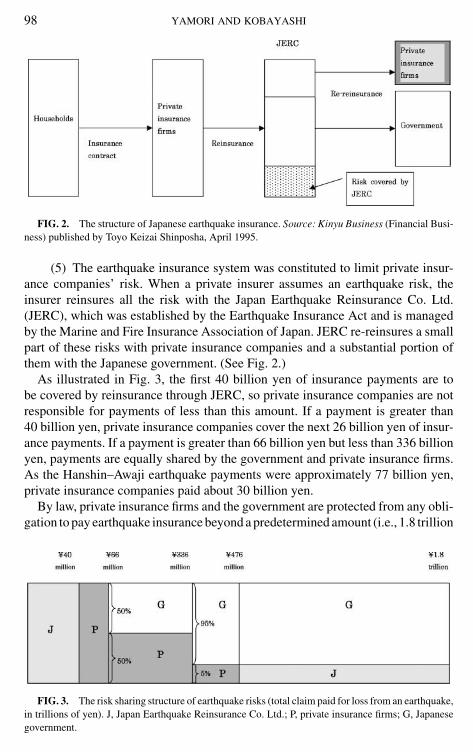
FIG. 2. The structure of Japanese earthquake insurance. Source: Kinyu Business (Financial Busi-ness) published by Toyo Keizai Shinposha, April 1995.
(5) The earthquake insurance system was constituted to limit private insur-ance companies’ risk. When a private insurer assumes an earthquake risk, theinsurer reinsures all the risk with the Japan Earthquake Reinsurance Co. Ltd.(JERC), which was established by the Earthquake Insurance Act and is managedby the Marine and Fire Insurance Association of Japan. JERC re-reinsures a smallpart of these risks with private insurance companies and a substantial portion ofthem with the Japanese government. (See Fig. 2.)
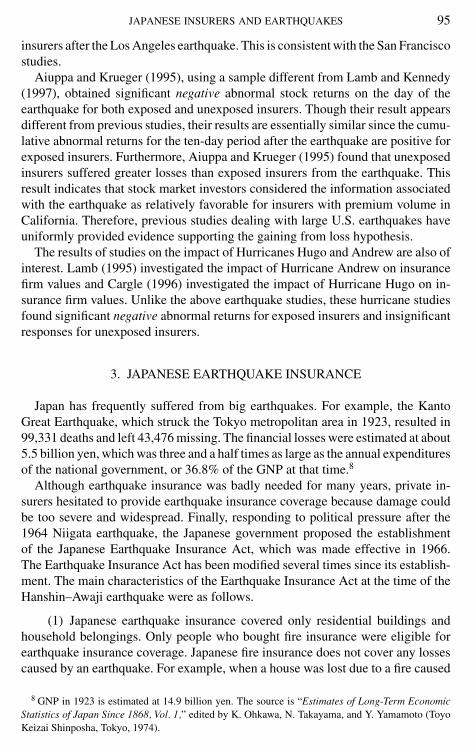
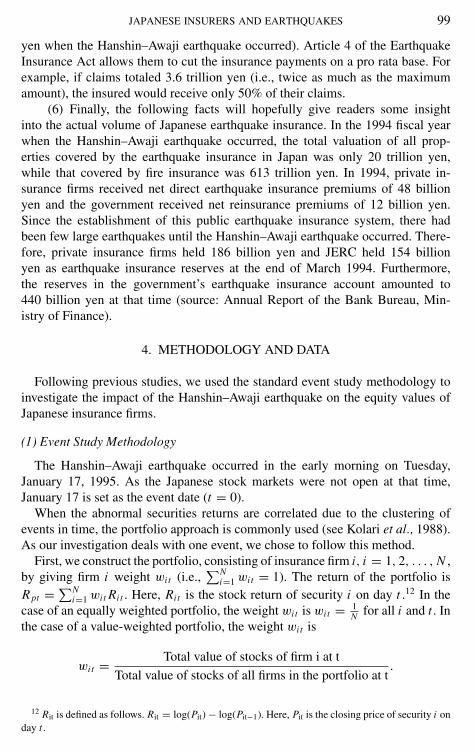
As illustrated in Fig. 3, the first 40 billion yen of insurance payments are tobe covered by reinsurance through JERC, so private insurance companies are notresponsible for payments of less than this amount. If a payment is greater than40 billion yen, private insurance companies cover the next 26 billion yen of insur-ance payments. If a payment is greater than 66 billion yen but less than 336 billionyen, payments are equally shared by the government and private insurance firms.As the Hanshin–Awaji earthquake payments were approximately 77 billion yen,private insurance companies paid about 30 billion yen.
By law, private insurance firms and the government are protected from any obli-gation to pay earthquake insurance beyond a predetermined amount (i.e., 1.8 trillion
FIG. 3. The risk sharing structure of earthquake risks (total claim paid for loss from an earthquake,in trillions of yen). J, Japan Earthquake Reinsurance Co. Ltd.; P, private insurance firms; G, Japanesegovernment.
JAPANESE INSURERS AND EARTHQUAKES 99
yen when the Hanshin–Awaji earthquake occurred). Article 4 of the EarthquakeInsurance Act allows them to cut the insurance payments on a pro rata base. Forexample, if claims totaled 3.6 trillion yen (i.e., twice as much as the maximumamount), the insured would receive only 50% of their claims.
(6) Finally, the following facts will hopefully give readers some insightinto the actual volume of Japanese earthquake insurance. In the 1994 fiscal yearwhen the Hanshin–Awaji earthquake occurred, the total valuation of all prop-erties covered by the earthquake insurance in Japan was only 20 trillion yen,while that covered by fire insurance was 613 trillion yen. In 1994, private in-surance firms received net direct earthquake insurance premiums of 48 billionyen and the government received net reinsurance premiums of 12 billion yen.Since the establishment of this public earthquake insurance system, there hadbeen few large earthquakes until the Hanshin–Awaji earthquake occurred. There-fore, private insurance firms held 186 billion yen and JERC held 154 billionyen as earthquake insurance reserves at the end of March 1994. Furthermore,the reserves in the government’s earthquake insurance account amounted to440 billion yen at that time (source: Annual Report of the Bank Bureau, Min-istry of Finance).
4. METHODOLOGY AND DATA
Following previous studies, we used the standard event study methodology toinvestigate the impact of the Hanshin–Awaji earthquake on the equity values ofJapanese insurance firms.
(1) Event Study Methodology
The Hanshin–Awaji earthquake occurred in the early morning on Tuesday,January 17, 1995. As the Japanese stock markets were not open at that time,January 17 is set as the event date (t = 0).
When the abnormal securities returns are correlated due to the clustering ofevents in time, the portfolio approach is commonly used (see Kolari et al., 1988).As our investigation deals with one event, we chose to follow this method.
First, we construct the portfolio, consisting of insurance firm i, i = 1, 2, . . . , N ,by giving firm i weight wi t (i.e.,
∑Ni=1 wi t = 1). The return of the portfolio is
Rpt = ∑Ni=1 wi t Rit . Here, Rit is the stock return of security i on day t .12 In the
case of an equally weighted portfolio, the weight wi t is wi t = 1N for all i and t . In
the case of a value-weighted portfolio, the weight wi t is
wi t = Total value of stocks of firm i at t
Total value of stocks of all firms in the portfolio at t.
12 Rit is defined as follows. Rit = log(Pit) − log(Pit−1). Here, Pit is the closing price of security i onday t .
100 YAMORI AND KOBAYASHI
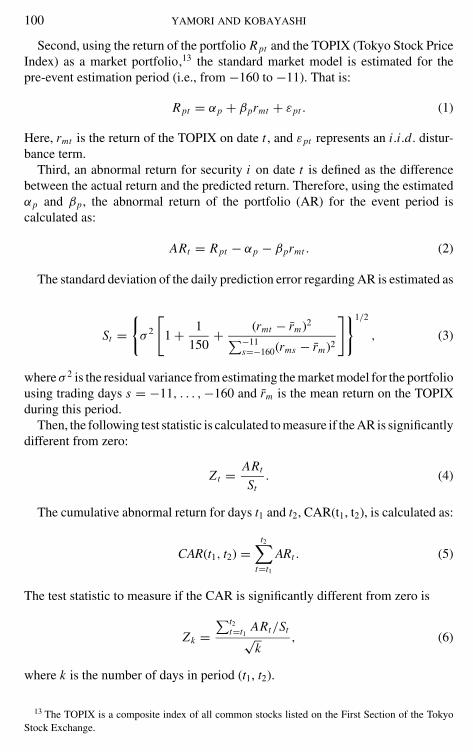
Second, using the return of the portfolio Rpt and the TOPIX (Tokyo Stock PriceIndex) as a market portfolio,13 the standard market model is estimated for thepre-event estimation period (i.e., from −160 to −11). That is:
Rpt = αp + βprmt + εpt . (1)
Here, rmt is the return of the TOPIX on date t , and εpt represents an i.i.d. distur-bance term.
Third, an abnormal return for security i on date t is defined as the differencebetween the actual return and the predicted return. Therefore, using the estimatedαp and βp, the abnormal return of the portfolio (AR) for the event period iscalculated as:
ARt = Rpt − αp − βprmt . (2)
The standard deviation of the daily prediction error regarding AR is estimated as
St ={
σ 2
[1 + 1
150+ (rmt − r̄m)2∑−11
s=−160(rms − r̄m)2
]}1/2
, (3)
where σ 2 is the residual variance from estimating the market model for the portfoliousing trading days s = −11, . . . , −160 and r̄m is the mean return on the TOPIXduring this period.
Then, the following test statistic is calculated to measure if the AR is significantlydifferent from zero:
Zt = ARt
St. (4)
The cumulative abnormal return for days t1 and t2, CAR(t1, t2), is calculated as:
CAR(t1, t2) =t2∑
t=t1
ARt . (5)
The test statistic to measure if the CAR is significantly different from zero is
Zk =∑t2
t=t1ARt/St√k
, (6)
where k is the number of days in period (t1, t2).
13 The TOPIX is a composite index of all common stocks listed on the First Section of the TokyoStock Exchange.
JAPANESE INSURERS AND EARTHQUAKES 101
(2) Data
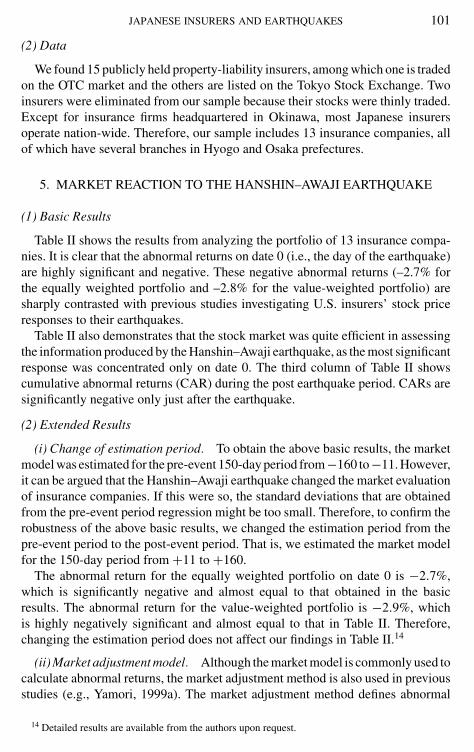
We found 15 publicly held property-liability insurers, among which one is tradedon the OTC market and the others are listed on the Tokyo Stock Exchange. Twoinsurers were eliminated from our sample because their stocks were thinly traded.Except for insurance firms headquartered in Okinawa, most Japanese insurersoperate nation-wide. Therefore, our sample includes 13 insurance companies, allof which have several branches in Hyogo and Osaka prefectures.
5. MARKET REACTION TO THE HANSHIN–AWAJI EARTHQUAKE
(1) Basic Results
Table II shows the results from analyzing the portfolio of 13 insurance compa-nies. It is clear that the abnormal returns on date 0 (i.e., the day of the earthquake)are highly significant and negative. These negative abnormal returns (–2.7% forthe equally weighted portfolio and –2.8% for the value-weighted portfolio) aresharply contrasted with previous studies investigating U.S. insurers’ stock priceresponses to their earthquakes.
Table II also demonstrates that the stock market was quite efficient in assessingthe information produced by the Hanshin–Awaji earthquake, as the most significantresponse was concentrated only on date 0. The third column of Table II showscumulative abnormal returns (CAR) during the post earthquake period. CARs aresignificantly negative only just after the earthquake.
(2) Extended Results
(i) Change of estimation period. To obtain the above basic results, the marketmodel was estimated for the pre-event 150-day period from−160 to−11. However,it can be argued that the Hanshin–Awaji earthquake changed the market evaluationof insurance companies. If this were so, the standard deviations that are obtainedfrom the pre-event period regression might be too small. Therefore, to confirm therobustness of the above basic results, we changed the estimation period from thepre-event period to the post-event period. That is, we estimated the market modelfor the 150-day period from +11 to +160.
The abnormal return for the equally weighted portfolio on date 0 is −2.7%,which is significantly negative and almost equal to that obtained in the basicresults. The abnormal return for the value-weighted portfolio is −2.9%, whichis highly negatively significant and almost equal to that in Table II. Therefore,changing the estimation period does not affect our findings in Table II.14
(ii) Market adjustment model. Although the market model is commonly used tocalculate abnormal returns, the market adjustment method is also used in previousstudies (e.g., Yamori, 1999a). The market adjustment method defines abnormal
14 Detailed results are available from the authors upon request.
102 YAMORI AND KOBAYASHI
TABLE IIReaction to the Hanshin–Awaji Earthquake: Basic Results
(Estimation Period [−160, −11])
Date Abnormal returns t-statistics Cumulative abnormal returns
(1) Equally weighted portfolio0 −0.0272 −6.1082∗∗∗ −0.0272∗∗∗1 −0.0039 −0.8791 −0.0311∗∗∗2 0.0045 1.0017 −0.0266∗∗3 0.0034 0.7396 −0.0233∗4 −0.0059 −1.1462 −0.0292∗∗5 0.0082 1.8121∗ −0.02106 −0.0060 −1.3307 −0.02707 −0.0022 −0.4878 −0.02928 0.0004 0.0857 −0.02889 −0.0081 −1.6337 −0.0368∗
(2) Value-weighted portfolio0 −0.0282 −3.2873∗∗∗ −0.0282∗∗∗1 −0.0046 −0.5302 −0.0328∗∗∗2 0.0112 1.3069 −0.02153 0.0103 1.1964 −0.01124 −0.0029 −0.3274 −0.01425 0.0044 0.5153 −0.00976 −0.0119 −1.3765 −0.02167 −0.0026 −0.2968 −0.02418 0.0004 0.0466 −0.02379 −0.0105 −1.1868 −0.0342
∗∗∗Significant at 1% level.∗∗Significant at 5% level.∗Significant at 10% level.
returns as the difference between the return of security i and the return of themarket portfolio. In other words, the market adjustment method means that β inthe market model (i.e., Eq. (1)) is constrained to be unit. We find that the marketadjustment method produces the same results as the market model method in thesense that the abnormal returns on date 0 are highly significant and negative.15
6. MARKET RESPONSE AND EXPOSURE
(1) Abnormal Returns for Individual Firms
As shown above, the Hanshin–Awaji earthquake had a negative impact on stockvalues for the insurance industry in Japan. One interesting question is whetherinsurance companies were equally affected by the earthquake or not. To answerthis question, we apply event study analysis to individual companies.
15 The results based on the market adjustment model are not shown due to space limitation. Detailedresults are available from the authors upon request.
JAPANESE INSURERS AND EARTHQUAKES 103
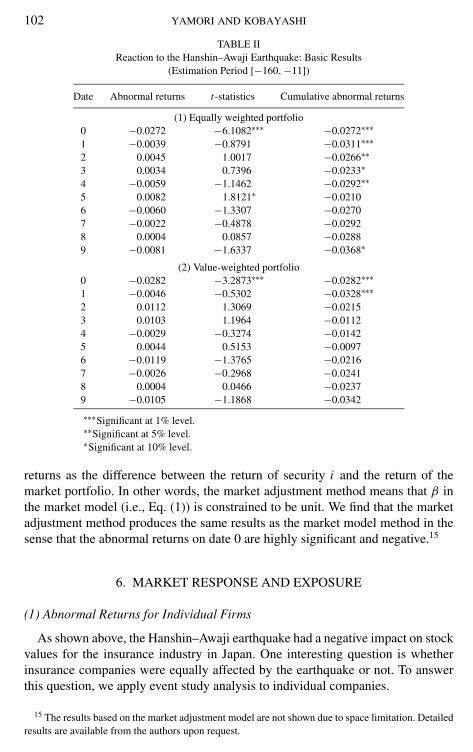
TABLE IIIAbnormal Returns and Cumulative Abnormal Returns: Individual Firms
AR(0) CAR(0, 1) CAR(0, 9)
Chiyoda Fire and Marine −0.0449∗∗∗ −0.0086 −0.0245Dai-Tokyo Fire and Marine −0.0185 −0.0425∗∗ −0.0026Dowa Fire and Marine −0.0304∗ −0.0472∗∗ −0.0559∗∗Fuji Fire and Marine −0.0380∗∗ −0.0209 −0.0485Koa Fire and Marine −0.0121 −0.0420∗∗ −0.0711∗Mitsui Marine and Fire −0.0454∗∗∗ −0.0247∗ −0.0290Nichido Fire and Marine −0.0428∗∗∗ −0.0684∗∗∗ −0.0711∗∗Nippon Fire and Marine −0.0078 −0.0450∗∗ −0.0457Nissan Fire and Marine 0.0043 0.0063 −0.0109Nissin Fire and Marine −0.0353∗∗ −0.0231 −0.0257Sumitomo Marine and Fire −0.0286∗∗∗ −0.0315∗∗ −0.0468Tokio Marine and Fire −0.0278∗∗ −0.0337∗ −0.0253Yasuda Fire and Marine −0.0258∗∗∗ −0.0216 −0.0139
∗∗∗Significant at 1% level.∗∗Significant at 5% level.∗Significant at 10% level.
Table III shows each company’s abnormal returns and cumulative abnormalreturns, which are obtained by estimating the market model for the pre-event esti-mation period. Except Nissan Fire and Marine Insurance, all insurance companiesrecorded negative abnormal returns on the event day, while all companies recordednegative cumulative abnormal returns for the period of day 0 to +9. AR(0) for ninecompanies and CAR(0, 1) for eight companies are significantly negative at the 10%critical value. Therefore, we can conclude that the Hanshin–Awaji earthquake hada negative impact on all individual companies, but that the magnitude of the impactvaried among companies.
(2) Exposure Measures
One of the main questions addressed by the literature surveyed in Section 2 iswhether the market reaction depends on the exposure to a catastrophic event. Thisis of interest for several reasons.
First, an attempt to investigate this problem may be an immediate answer to thequestion of why the impact of the Hanshin–Awaji earthquake on insurance firmsvaried. While it seems reasonable to presume that exposure and the degree of impactare closely correlated, the results of previous studies are mixed in terms of therelationship between exposure and market response. The four earthquake studiessurveyed in Section 2 concluded that the U.S. stock market regarded exposedinsurance firms more favorably than unexposed firms, while the two hurricanestudies surveyed in Section 2 reached the opposite conclusion.
Second, addressing this question sheds light on the Japanese stock market’s abil-ity to discriminate among insurers based on their exposures. An investigation into
104 YAMORI AND KOBAYASHI
the relationship between market response and insurers’ exposure to catastrophicevents is useful because the Japanese stock market is commonly believed to beless sophisticated than its U.S. counterpart.
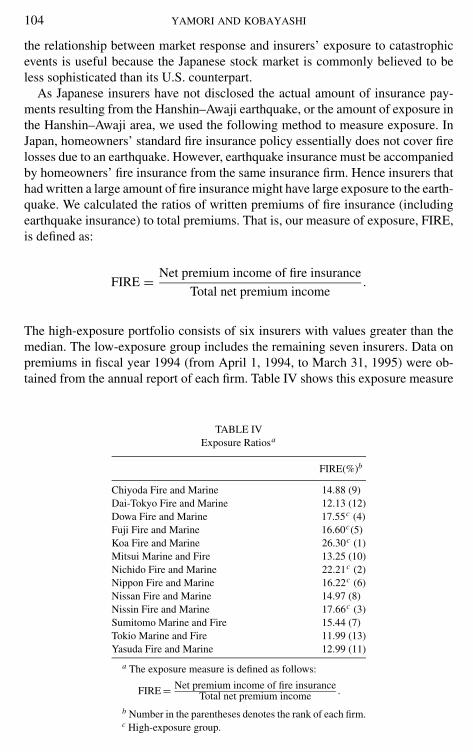
As Japanese insurers have not disclosed the actual amount of insurance pay-ments resulting from the Hanshin–Awaji earthquake, or the amount of exposure inthe Hanshin–Awaji area, we used the following method to measure exposure. InJapan, homeowners’ standard fire insurance policy essentially does not cover firelosses due to an earthquake. However, earthquake insurance must be accompaniedby homeowners’ fire insurance from the same insurance firm. Hence insurers thathad written a large amount of fire insurance might have large exposure to the earth-quake. We calculated the ratios of written premiums of fire insurance (includingearthquake insurance) to total premiums. That is, our measure of exposure, FIRE,is defined as:
FIRE = Net premium income of fire insurance
Total net premium income.
The high-exposure portfolio consists of six insurers with values greater than themedian. The low-exposure group includes the remaining seven insurers. Data onpremiums in fiscal year 1994 (from April 1, 1994, to March 31, 1995) were ob-tained from the annual report of each firm. Table IV shows this exposure measure
TABLE IVExposure Ratiosa
FIRE(%)b
Chiyoda Fire and Marine 14.88 (9)Dai-Tokyo Fire and Marine 12.13 (12)Dowa Fire and Marine 17.55c (4)Fuji Fire and Marine 16.60c(5)Koa Fire and Marine 26.30c (1)Mitsui Marine and Fire 13.25 (10)Nichido Fire and Marine 22.21c (2)Nippon Fire and Marine 16.22c (6)Nissan Fire and Marine 14.97 (8)Nissin Fire and Marine 17.66c (3)Sumitomo Marine and Fire 15.44 (7)Tokio Marine and Fire 11.99 (13)Yasuda Fire and Marine 12.99 (11)
a The exposure measure is defined as follows:
FIRE = Net premium income of fire insuranceTotal net premium income .
b Number in the parentheses denotes the rank of each firm.c High-exposure group.
JAPANESE INSURERS AND EARTHQUAKES 105
TABLE VReaction to the Hanshin–Awaji Earthquake and Exposurea
High-exposure portfolio Low-exposure portfolio
Cumulative CumulativeEvent Abnormal abnormal Abnormal abnormaldate returns t-statistic returns returns t-statistic returns
0 −0.0289 −4.8751∗∗∗ −0.0289∗∗∗ −0.0267 −5.1614∗∗∗ −0.0267∗∗∗1 −0.0125 −2.1155∗∗ −0.0415∗∗∗ 0.0043 0.8367 −0.0223∗∗∗2 0.0050 0.8298 −0.0365∗∗∗ 0.0023 0.4354 −0.0201∗∗3 0.0006 0.0985 −0.0359∗∗∗ 0.0059 1.1258 −0.01424 −0.0033 −0.4845 −0.0392∗∗∗ −0.0128 −2.1484∗∗ −0.0270∗∗5 0.0020 0.3307 −0.0373∗∗ 0.0190 3.6332∗∗∗ −0.00806 0.0071 1.1875 −0.0302∗ −0.0139 −2.6636∗∗∗ −0.02187 −0.0081 −1.3595 −0.0382∗∗ 0.0050 0.9675 −0.01688 0.0022 0.3714 −0.0360∗∗ 0.0025 0.4827 −0.01449 −0.0069 −1.0482 −0.0429∗∗ −0.0075 −1.3124 −0.0219
a Exposure is measured by the ratio of net premium income for fire insurance to total net premiumincome.
∗∗∗Significant at 1% level.∗∗Significant at 5% level.∗Significant at 10% level.
of individual insurance firms in our sample as well as the rank of eachfirm.16,17
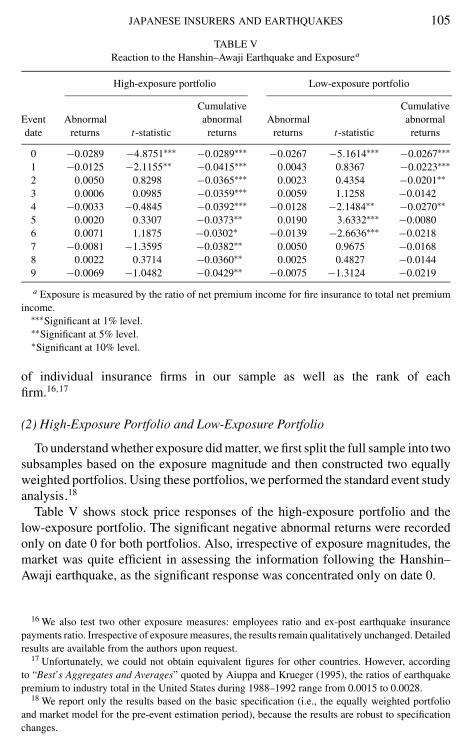
(2) High-Exposure Portfolio and Low-Exposure Portfolio
To understand whether exposure did matter, we first split the full sample into twosubsamples based on the exposure magnitude and then constructed two equallyweighted portfolios. Using these portfolios, we performed the standard event studyanalysis.18
Table V shows stock price responses of the high-exposure portfolio and thelow-exposure portfolio. The significant negative abnormal returns were recordedonly on date 0 for both portfolios. Also, irrespective of exposure magnitudes, themarket was quite efficient in assessing the information following the Hanshin–Awaji earthquake, as the significant response was concentrated only on date 0.
16 We also test two other exposure measures: employees ratio and ex-post earthquake insurancepayments ratio. Irrespective of exposure measures, the results remain qualitatively unchanged. Detailedresults are available from the authors upon request.
17 Unfortunately, we could not obtain equivalent figures for other countries. However, accordingto “Best’s Aggregates and Averages” quoted by Aiuppa and Krueger (1995), the ratios of earthquakepremium to industry total in the United States during 1988–1992 range from 0.0015 to 0.0028.
18 We report only the results based on the basic specification (i.e., the equally weighted portfolioand market model for the pre-event estimation period), because the results are robust to specificationchanges.
106 YAMORI AND KOBAYASHI
TABLE VIMean Difference between High- and Low-Exposure Groups
AR(0) CAR(0, 1) CAR(0, 9)
FIRE Mean for High exposure group −0.0277 −0.0411 −0.0530Mean for Low exposure group −0.0267 −0.0223 −0.0219Mean difference −0.0011 −0.0188 −0.0311t statistic −0.1206 −1.9891* −3.5541∗∗∗
∗∗∗Significant at 1% level.∗∗Significant at 5% level.*Significant at 10% level.
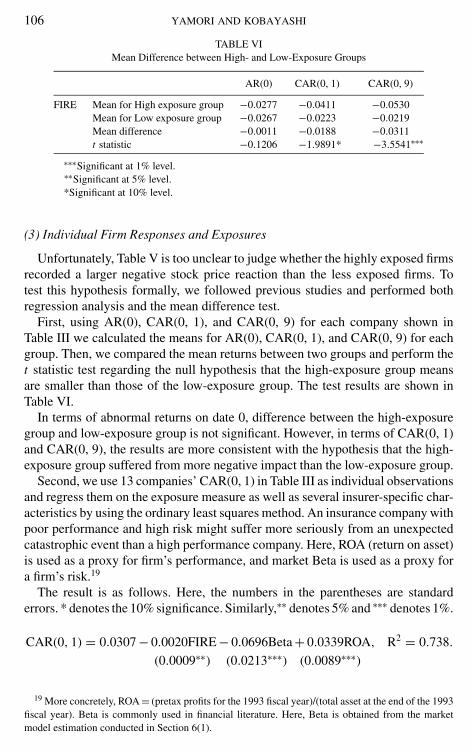
(3) Individual Firm Responses and Exposures
Unfortunately, Table V is too unclear to judge whether the highly exposed firmsrecorded a larger negative stock price reaction than the less exposed firms. Totest this hypothesis formally, we followed previous studies and performed bothregression analysis and the mean difference test.
First, using AR(0), CAR(0, 1), and CAR(0, 9) for each company shown inTable III we calculated the means for AR(0), CAR(0, 1), and CAR(0, 9) for eachgroup. Then, we compared the mean returns between two groups and perform thet statistic test regarding the null hypothesis that the high-exposure group meansare smaller than those of the low-exposure group. The test results are shown inTable VI.
In terms of abnormal returns on date 0, difference between the high-exposuregroup and low-exposure group is not significant. However, in terms of CAR(0, 1)and CAR(0, 9), the results are more consistent with the hypothesis that the high-exposure group suffered from more negative impact than the low-exposure group.
Second, we use 13 companies’ CAR(0, 1) in Table III as individual observationsand regress them on the exposure measure as well as several insurer-specific char-acteristics by using the ordinary least squares method. An insurance company withpoor performance and high risk might suffer more seriously from an unexpectedcatastrophic event than a high performance company. Here, ROA (return on asset)is used as a proxy for firm’s performance, and market Beta is used as a proxy fora firm’s risk.19
The result is as follows. Here, the numbers in the parentheses are standarderrors. * denotes the 10% significance. Similarly,∗∗ denotes 5% and ∗∗∗ denotes 1%.
CAR(0, 1) = 0.0307 − 0.0020FIRE − 0.0696Beta + 0.0339ROA, R2 = 0.738.
(0.0009∗∗) (0.0213∗∗∗) (0.0089∗∗∗)
19 More concretely, ROA = (pretax profits for the 1993 fiscal year)/(total asset at the end of the 1993fiscal year). Beta is commonly used in financial literature. Here, Beta is obtained from the marketmodel estimation conducted in Section 6(1).
JAPANESE INSURERS AND EARTHQUAKES 107
Negative coefficients for Beta and positive coefficients for ROA are consistentwith our expectations. The regression records a relatively high R2, and the coef-ficient for FIRE is significantly negative. This negative coefficient for FIRE hassharply different implications from U.S. earthquake results. Namely, the high-exposure group in Japan recorded larger negative cumulative abnormal returnsthan the low-exposure group. This is rather similar to the results of U.S. hurricanestudies.
7. CONCLUDING REMARKS
This paper is the first attempt to investigate the reaction of insurer’ stock pricesin a non-U.S. stock market to a big earthquake. Specifically, we investigated theimpact of the 1995 Hanshin–Awaji earthquake on Japanese insurance companies.The Hanshin–Awaji earthquake resulted in a significant negative stock price re-sponse for Japanese property-liability insurance companies. Therefore, our studyof the Hanshin–Awaji earthquake raises significant doubts about the hypothesisthat Japanese insurers would benefit from a future catastrophic event. This is con-trary to previous studies examining the San Francisco earthquake and the LosAngeles earthquake, but consistent with the studies dealing with hurricanes in theUnited States.
Our research suggests that, although a catastrophic event tends to increase thedemand for insurance and the Japanese earthquake insurance system limits theinsurers’ financial obligations due to an earthquake, investors and regulators shouldhave serious concerns about the potential impact of the expected strong earthquakeson the financial condition of Japanese insurance firms. Another significant findingis that these results demonstrate that Japanese stock markets were highly efficientin assessing the information following the Hanshin–Awaji earthquake.
As discussed in Section 3, unique characteristics of Japanese earthquake insur-ance may contribute to the difference between the United States and Japan in stockmarket reactions to large earthquakes. Particularly, it is notable that the price ofearthquake insurance in Japan is strictly regulated and set at the no loss and noprofit level by the government. However, further research is needed to understandwhy the United States and Japanese reactions are so different.
REFERENCES
Aiuppa, T. A., Carney, R. J., and Krueger, T. M. (1993). An examination of insurance stock pricesfollowing the 1989 Loma Prieta Earthquake, J. Ins. Issues Practices 16, 1–14.
Aiuppa, T. A., and Krueger, T. M. (1995). Insurance stock prices following the 1994 Los Angelesearthquake, J. Ins. Issues 18, 1–13.
Bowen, R. M., Castanias, R. P., and Daley, L. A. (1983). Intra-industry effects of the accident at ThreeMiles Island, J. Finan. Quant. Anal. 18, 87–111.
108 YAMORI AND KOBAYASHI
Cagle, J. A. B. (1996). Natural disasters, insurer stock prices, and market discrimination: The case ofHurricane Hugo, J. Ins. Issues 19, 53–68.
Davidson, W. N., Chandy, P. R., and Cross, M. (1987). Large losses, risk management and stock returnsin the airline industry, J. Risk Ins. 54, 162–172.
Davidson, W. N., and Thornton, J. (1985). The effect of Three Mile Island on stock return in theproperty and liability insurance industry, J. Ins. Issues Practices 8, 17–31.
Hill, J., and Schneeweis, T. (1983). The effect of Three Mile Island on electric utility stock prices: Anote, J. Finance 38, 1285–1292.
Kolari, J., Mahajan, A., and Saunders, E. M. (1988). The effect of changes in reserve requirements onbank stock prices, J. Banking Finance 12, 183–198.
Lamb, R. P. (1995). An exposure-based analysis of property-liability insurer stock values aroundHurricane Andrew, J. Risk Ins. 62, 111–123.
Lamb, R. P., and Kennedy, W. F. (1997). Insurer stock prices and market efficiency around the LosAngeles earthquake, J. Ins. Issues Spring, 10–24.
Shelor, R. M., Anderson, D. C., and Cross, M. L. (1992). Gaining from loss: Property-liability insurerstock values in the aftermath of the 1989 California earthquake, J. Risk Ins. 59, 476–488.
Waldholz, M. (1995). International: Even as buildings become sturdier, quakes always have the upperhand, The Wall Street Journal, January 18, Section A, p. 10.
Yamori, N. (1999a). Stock market reaction to the bank liquidation in Japan: A case for the informationaleffect hypothesis, J. Finan. Serv. Res. 15, 57–68.
Yamori, N. (1999b). An empirical investigation of the Japanese corporate demand for insurance,J. Risk Ins. 66, 239–252.