dna quantitation by real time pcr: advanced issuesdna.fiu.edu/advanced dna typing lectures/an...
TRANSCRIPT

DNA Quantitation byReal Time PCR: Advanced Issues
Department of Chemistry
Florida International University
Miami, FL 33199
3/15/2011
1. Brief introduction to Quantiatitve PCR

3/15/2011
Calculation of the Quantity of DNA in a Cell
1. Molecular Weight of a DNA Basepair = 618g/mol A =:
313 g/mol; T: 304 g/mol; A-T base pairs = 617 g/molG = 329 g/mol; C: 289 g/mol; G-C base pairs = 618 g/mol
2. Molecular Weight of DNA = 1.85 x10¹² g/mol
There are 3 billion base pairs in a haploid cell ~3 x 10⁹ bp (~3 x 10⁹ bp) x (618 g/mol/bp) = 1.85 x 10¹² g/mol
3. Quantity of DNA in a Haploid Cell = 3 picograms1 mole = 6.02 x 10²³ molecules (1.85 x 10¹² g/mol) x (1 mole/6.02 x 1023 molecules)= 3.08 x 10⁻¹² g = 3.08 picograms (pg)A diploid human cell contains ~6 pg genomic DNA
4. One ng of DNA contains the DNA from 167 diploid cells
1 ng genomic DNA (1000 pg)/6pg/cell = ~333 copies of each locus
(2 per 167 diploid genomes)
3/15/2011
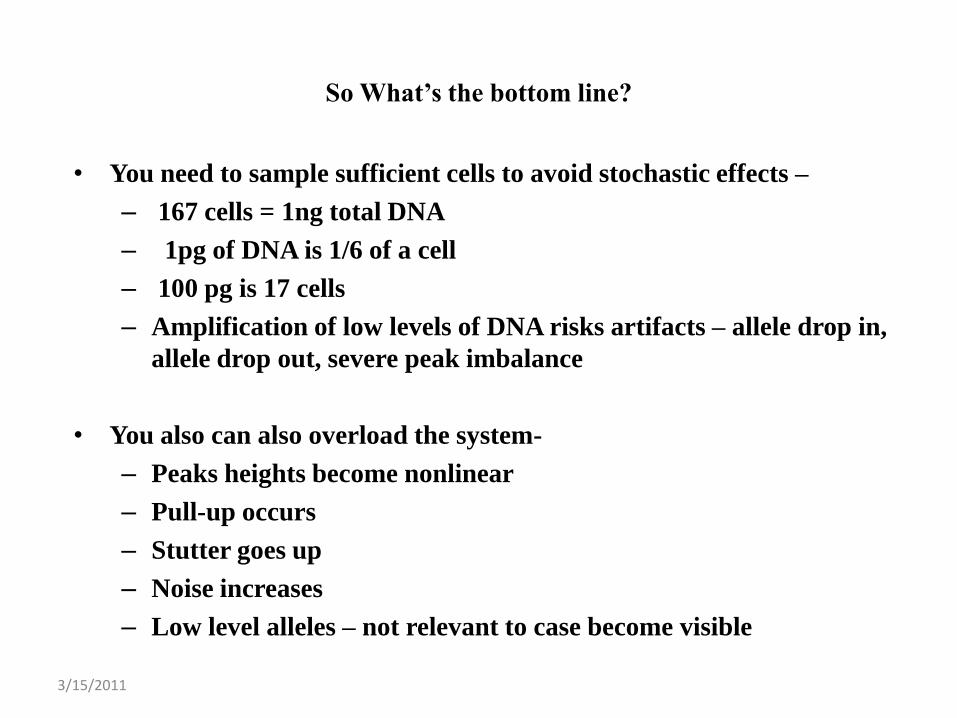
So What’s the bottom line?
• You need to sample sufficient cells to avoid stochastic effects –
– 167 cells = 1ng total DNA
– 1pg of DNA is 1/6 of a cell
– 100 pg is 17 cells
– Amplification of low levels of DNA risks artifacts – allele drop in,
allele drop out, severe peak imbalance
• You also can also overload the system-
– Peaks heights become nonlinear
– Pull-up occurs
– Stutter goes up
– Noise increases
– Low level alleles – not relevant to case become visible

3/15/2011
Why do you want to be in the DNA quantitation “sweet spot”?
Higher quality data which results in easier data interpretation– No allele dropout– Peaks on-scale with no pull-up from dye bleedthrough– No split peaks from partial adenylation
• STR kits, especially those amplifying more loci, are optimized for a narrow range of input DNA– Overall peak balance is predicated on input levels– Temperatures and concentrations of primers critical in
proper multiplex amplifications

3/15/2011
Impact of DNA Amount into PCR
• Too much DNA– Off-scale peaks
– Split peaks (+/-A)
– Locus-to-locus imbalance
• Too little DNA– Heterozygote peak imbalance
– Allele drop-out
– Locus-to-locus imbalance
D3S1358
-A
+A
10 ng template(overloaded)
2 ng template(suggested level)
DNA Size (bp)
Rel
ativ
e Fl
uo
resc
ence
(R
FUs) 100 pg
template
5 pg template
DNA Size (bp)
Stochastic effect when amplifying low levels of DNA produces allele dropout
Reason that DNA Quantitation is Important Prior to Multiplex Amplification
Generally 0.5 – 2.0 ng DNA template is best for STR kits

3/15/2011
Issue: Need Human-Specific DNA Quantitation• All sources of DNA are extracted when biological evidence from a crime
scene is processed to isolate the DNA present.
• Thus, non-human DNA such as bacterial, fungal, plant, or animal material may also be present in the total DNA recovered from the sample along with the relevant human DNA of interest.
• For this reason, the DNA Advisory Board (DAB) Standard 9.3 requires human-specific DNA quantitation so that appropriate levels of human DNA can be included in the subsequent PCR amplification.
• Multiplex STR typing works best with a fairly narrow range of human DNA – typically 0.5 to 2.0 ng of input DNA works best with commercial STR kits.

How was it done in the past?
• UV/vis – monitor DNA at 260/280 The ratio for a pure sample is 1.8, less if protein or impurity is present
• Problem: Non specific – dyes, inhibitors interfere, no quality info
• Yield gel – Separate genomic DNA on an agarose gel stain with ethidium bromide
• Problem: Non human specific, hard to estimate quantity if degraded
• Fluorescence – Add an intercalating dye like Sybr Green to a DNA sample. Only DNA provides a fluorescence enhancement
• Problem: Non human specific – no quality information
• Slot blot –ssDNA is bound to a nylon membrane and probed with colorimetric reaction.
• Problem: subjective, time consuming, poor sensitivity
• Aluquant – attach bioluminescent probe to DNA
• Problem: poor sensitivity

3/15/2011
Big issue – sensitivity and dynamic range
Quantiblot-ECL 40 pg - 2.0 ng
ACES 2.0 40 pg - 4.0 ng(ACES tended to work better on degraded DNA)
Real Time PCR (1-23) pg - 16 ng(depending on method)
RTPCR has lower detection limit and larger dynamic range

3/15/2011
Quantitative PCR
• What is rtPCR or qPCR?
• How does it work?
• How does it compare to traditional methods of Human DNA quantitation?
• What techniques are available?
• What systems are available?

Advantages of QPCR
• The ability to monitor the progress of the PCR reaction as it occurs in real time
• The ability to precisely measure the amount of amplicon at each cycle
• An increased dynamic range of detection
• The combination of amplification and detection in a single tube, which eliminates post-PCR manipulations

Forensic advantages of qPCR
• An automatable procedure for determination of DNA quantity
• The estimate of DNA quantity is the amount of amplifiable DNA – and is directly related to the process of STR typing
• Internal controls and melt curves permit detection of PCR inhibition
• The capability to detect both autosomal and Y DNA template
• Extreme sensitivity is possible with multicopy loci

Disadvantages of QPCR
• The precision is not much better than that of slot blots• Internal controls do not always respond to inhibition• Concentration of DNA template mixture may vary between
qPCR reaction and STR reaction affecting inhibitor concentration, esp. at low and high concentrations– ie. a 20uL reaction mixture contains 2 uL of template for real
time while a 25uL STR reaction mixture contains up to 10uL of DNA template.
• Reagents are expensive and require a complex series of events
• Improper pipetting of standards will cause large errors in precision.

3/15/2011
History• RtPCR is a very recently developed technique
– Developed by Higuchi in 1993
– Used a modified thermal cycler with a UV detector and a CCD camera
– Ethidium bromide was used as intercalating reporter. As [dsDNA] increased fluorescence increased
• First paper on qPCR:– Higuchi, R.; Fockler, C.; Dollinger, G.; Watson, R. “Kinetic PCR analysis:
real-time monitoring of DNA amplification reactions” Biotechnology (N Y). 1993 Sep;11(9):1026-30
• Warning: RT-PCR also means reverse transcriptase PCR which is used when working with RNA

3/15/2011
PCR amplification
• Theoretically the quantity of PCR template T doubles with each cycle.
• After 2 cycles the quantity of product is 2T
• After N cycles the quantity of product is
– Thus there is a exponential relationship between the original quantity of product and the amount of template
TP n)2(

3/15/2011
PCR Product Amount is Proportional to the Amount of Input DNA Template
Exponential PCR
0.00E+00
1.00E+09
2.00E+09
3.00E+09
4.00E+09
5.00E+09
6.00E+09
7.00E+09
8.00E+09
9.00E+09
1.00E+10
0 5 10 15 20 25 30 35
# Cycles
ng
pro
du
ct
During the exponential expansion of the
PCR the amount of product produced is
proportional to the amount of template. Here
we show the total amount of product
following 32 cycles.
2ng template
1ng template
0.5ng template

3/15/2011
What is qPCR?
• To use PCR as a Quantitative technique, the reaction must be clearly defined
• In fact there are several stages to a PCR reaction– Baseline stage
– Exponential stage
– Plateau stage
baseline
exponential
plateau

3/15/2011
PCR plateaus
• PCR product can not double forever– Limited by
– Amount of primer
– Taq polymerase activity
– Reannealing of product strands
• Reach plateau– No more increase in product

So can you use regular PCR for quantitation?
• Methods:
1. End point detection – measure amount of product produced after a set number of cyclesproblem: limiting reagent effects, sequence effects
2. `3. End point detection with modified internal standard -
measure amount of product produced while simultaneously amplifying an internal standard with very similar sequenceproblem: cost of developing proper internal standard, increased sample manipulation
3/15/2011

3/15/2011
Problem #1: End point plateau does not depend on T
0
5
10
15
20
25
0 10 20 30 40Cycle
PC
R p
rod
uc
t
Equal template in all tubes
Even if same amount of template, different tubes will reach different PCR plateaus
Karen CarletonHubbard Center for Genome Studies and Department of Zoology

3/15/2011
Problem #2: For endpoint detection, how many cycles should you do?
0
2
4
6
8
10
12
14
16
0 10 20 30 40Cycle
PC
R p
rod
uc
t
Different wells reach plateau at different cycle numbers. If you stopped this
reaction at 33 cycles, how much variation in quantity?
Karen CarletonHubbard Center for Genome Studies and Department of Zoology
33

3/15/2011
Issues for quantitation by non RT-PCR methods
• In spite of its use in mixture resolution,
PCR is not technically a quantitative
technique
• The time and rate at which plateau
appears varies with temperature, tube
position, inhibitors, matrix
• Once plateau appears, increase in
product concentration is non linear
• Standards can be added but they must
have the same primer binding sites and
similar sequence to target

3/15/2011http://env1.gist.ac.kr/joint_unugist/file/g_class11_real_time_pcr_vt.pdf
Solution:
Use data when still in exponential phase . PCR product will be proportional to initial template

3/15/2011
Real Time PCR
• Quantitation of DNA is a based on the number of cycles required to reach a threshold intensity, Ct.
• The greater the amount of starting DNA, the sooner this threshold value is reached.
Ct
http://www.med.sc.edu:85/pcr/realtime-home.htm

3/15/2011
Quantitation using the PCR Reaction
• PCR proceeds exponentially doubling each cycle:
Yn= Yn+1(1+Ec)
Where Ec is the efficiency (Ec = 1 for a perfect amplification) and Yn is the yield of product for a particular cycle
• During the exponential stage of the reaction Ec is relatively constant and the reaction yield Y is a function of the quantity of
input DNA, X
Y = X (1+ Ec)n

3/15/2011
Effect of efficiency on [DNA]
• Ec is a function of:
• Hybridization efficiency
• Quantity of reactants/target DNA
• Temperature
http://www.med.sc.edu:85/pcr/realtime-home.htm

3/15/2011http://env1.gist.ac.kr/joint_unugist/file/g_class11_real_time_pcr_vt.pdf

3/15/2011
Quantitation using Ct
• The log of DNA template concentration vs Ct is plotted using a series of stds yielding a calibration curve
• The unknown is then run and the number of cycles required to reach threshold, Ct is compared to the calibration curve.

3/15/2011
0.0 ng
5.0 ng
1.3 ng
0.31 ng
0.078 ng
Ct
Development of a standard curve
(reagent blank)

3/15/2011
The output data is plotted on a log scale and the fractional #
cycles required to reach Ct is measured

3/15/2011
Standard curve
Plot the cycle # at threshold CT vs log of concentration
Concentration = 10^(-0.297*CT+ 4.528)
Nanograms – note semilog scale
Cyc
le #
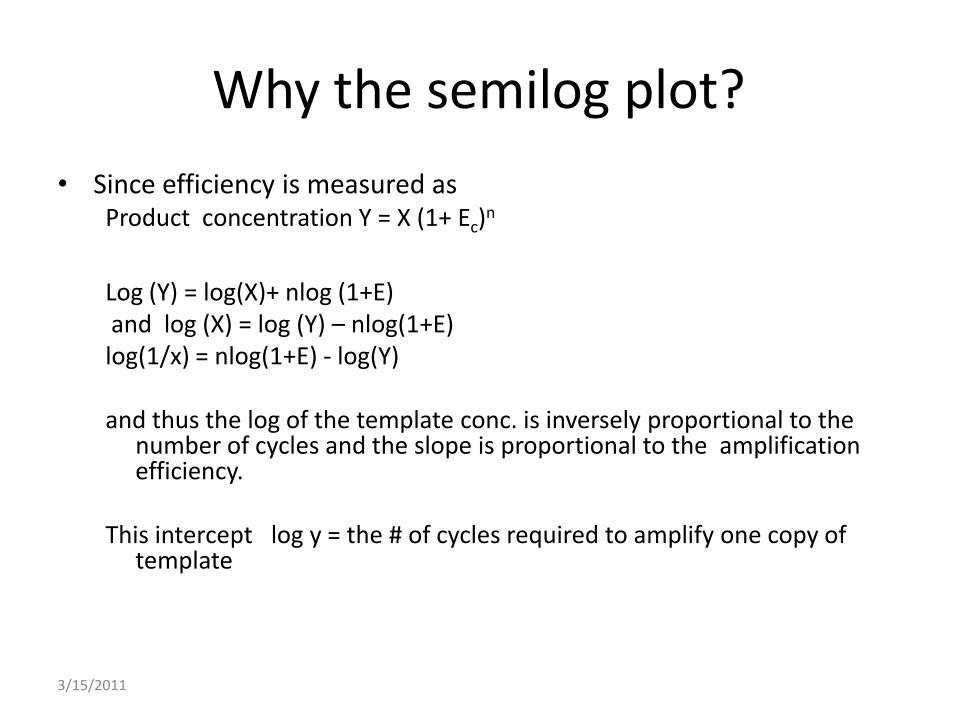
Why the semilog plot?
• Since efficiency is measured asProduct concentration Y = X (1+ Ec)
n
Log (Y) = log(X)+ nlog (1+E) and log (X) = log (Y) – nlog(1+E)log(1/x) = nlog(1+E) - log(Y)
and thus the log of the template conc. is inversely proportional to the number of cycles and the slope is proportional to the amplification efficiency.
This intercept log y = the # of cycles required to amplify one copy of template
3/15/2011

3/15/2011http://env1.gist.ac.kr/joint_unugist/file/g_class11_real_time_pcr_vt.pdf

Pete Vallone, STR workshop NSFTC 2006, STRbase

3/15/2011
Regression Analysis
Goal is to produce the best fit line through a field of points. To do this minimize the sum of the squares of the residuals (+/- deviations) from the line.
RSS is the residual sum of squares

Correllation Coefficient R2
The correlation coefficient is a measure of how straight the line is. It compares two hypotheses
1: there is no correlation – null hypothesis; 2: there is a correlation
correlation no correlationhttp://www.curvefit.com/linear_regression.htm

3/15/2011
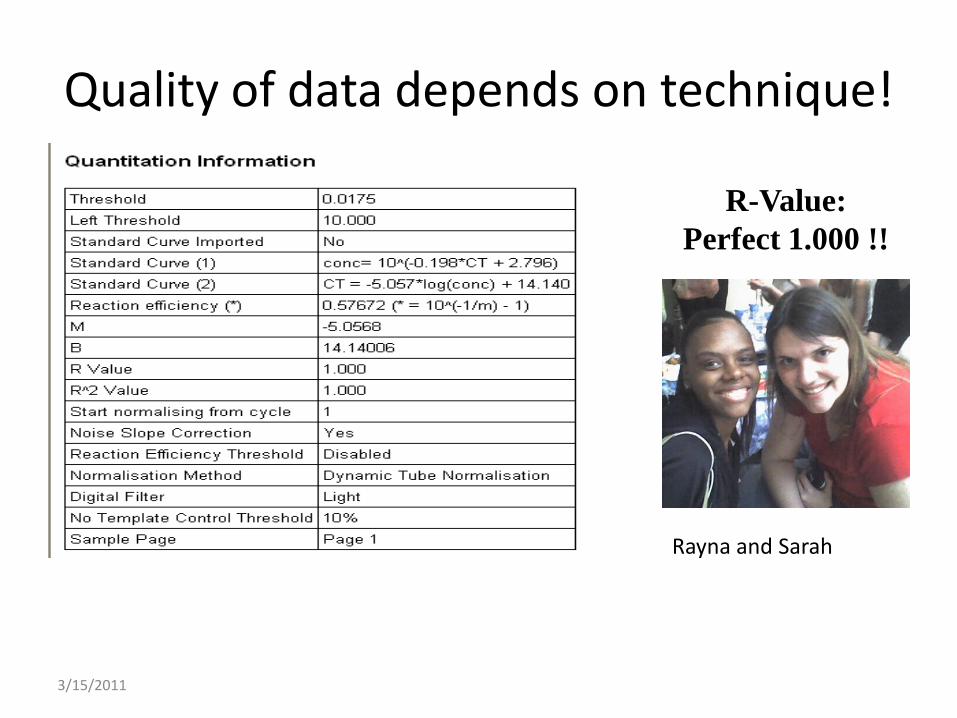
What does this mean for Quantifiler? Or Duo?
R2 value is above 0.99 All is good
R2 value is between 0.99 and 0.98 There is a wrong value enteredThere is a pipetting issue with sample loading or serial dilutionThere is a problem with the 23pg standard
R2 value is lower than 0.98 There isThere is a wrong value enteredThere is a pipetting issue with sample loading or serial dilutionThere is major problem with the 23pg standard
Note that for duo, at 23pg the male amplicon contains 7 DNA copies and the autosomal DNA contains 14 copies. At these copy numbers (especially for the male DNA there are major stochastic issues)

3/15/2011
Best fit line Alternate possibilities given the error
Notice 2 things: 1. The ability to define the mean value improves at the center of the regression line2. The error in the measurement is very high at the ends.3. The error is unknown above and below the endpoints.
Regression Analysis
http://www.curvefit.com/linear_regression.htm

3/15/2011
Sensitivity and precision for single locus Taqman probe
The figure illustrates the problem when analyzing samples below 20 pg (qPCR/single locus probes.) Reproducibility suffers from stochaistic effects on amplification. Note that the general standard for low copy DNA is <100pg

3/15/2011
Detection Methods• Fluorescent intercalating dye - SYBR Green
– Fluorescence increases with concentration of dsDNA• Taqman probes
– Fluorescence increases as quenched probe is digested • Molecular beacons
– Fluorescence increases as quenched probe hybridizes to template. The more dsDNA the more fluorescence
• Fret Probes– When probes bind fluorescence increases. The more
dsDNA produced, the more fluorescence• Plexor
– Primers are labeled with isomeric base +fluor. Complementary base contains quencher. The more dsDNAproduced, the lower the fluorescence becomes.
3/15/2011
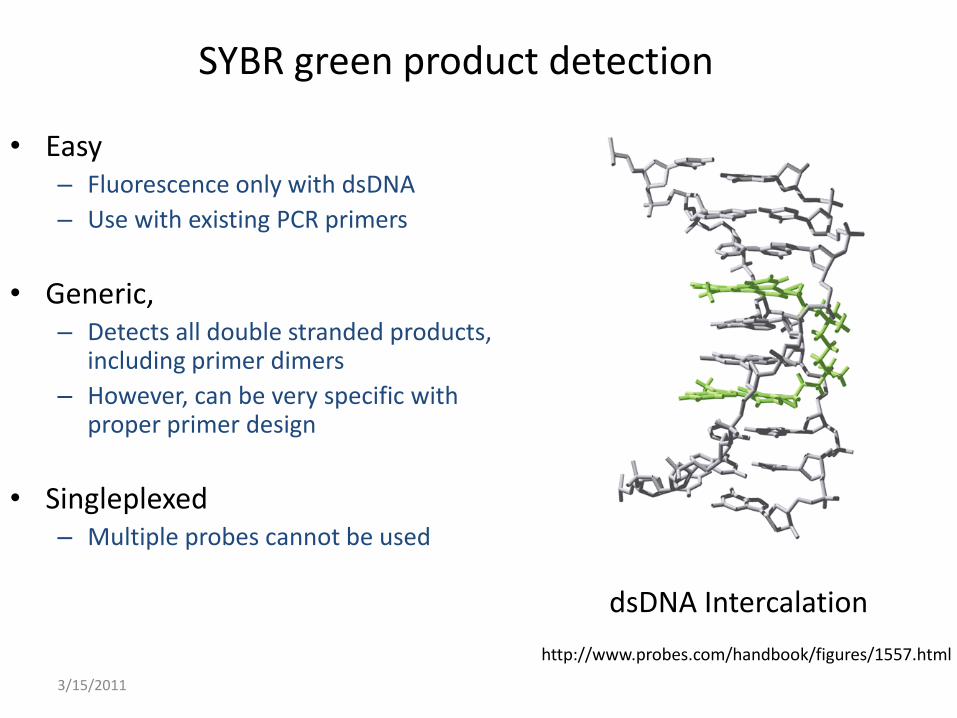
SYBR green product detection
• Easy– Fluorescence only with dsDNA
– Use with existing PCR primers
• Generic, – Detects all double stranded products,
including primer dimers
– However, can be very specific with proper primer design
• Singleplexed– Multiple probes cannot be used
dsDNA Intercalation
http://www.probes.com/handbook/figures/1557.html

Alu Sequence
• Family of repetitive elements amplified immensely during primate evolution
• 500,000 to 1,000,000 copies in the human genome (6-13%)
• Consensus sequence is ~280bp in length
• Two similar monomers connected by an A rich region
• Postulated to be derived from retroposons
• Divided into families - J family (oldest - 80 million years), Y family (youngest - 3-4 million years old)
• Large number of copies in the human genome make Alu an excellent target or marker for human DNA

3/15/2011http://www1.qiagen.com/literature/Brochure.aspx?id=2000149

3/15/2011
1000pg
100pg
10 pg
Calibration curve for Multilocus ALU qPCR
Note reproducibility of curve

No Template Control
The NTC always has
Ct of about 27-29
cycles due to
ambient human DNA
in air & water
With Alus present at
1,000’s of copies/
cell, the Ct of NTC
represents ~1/1000
of a single cell
Seen by others
(JFS 45:1307, 2000)
If any sample does not cross
threshold by 28-30 cycles
(like NTC) then inhibitors
MUST be present
NTC

Taqman
Taqman is a highly specific real time procedure that evolved to measure gene expression
1. Primers are designed to target a particular location on the genome. Prime binding sites are invariant,
2. A 20-30 bp probe is designed to target a specific variable region within the amplicon. (deletion, SNP, etc)
3. The probe contains two dyes, a reporter and a quencher, thus its fluorescence is low. Probe binds during annealing step.
4. Exonuclease activity of Taq during extension destroys the probe and releases the reporting dye from the quencher
5. Fluorescence increases as probes are destroyed during each amplification cycle.

3/15/2011http://www1.qiagen.com/literature/Brochure.aspx?id=2000149
Region to be probed(if mutation is not present, primers will amplify but probe will not bind.)

3/15/2011
Molecular beacons
– Consist of ssDNA with an internal complementary sequence that keeps reporter and quencher dyes close → No fluorescence
– Following denaturation, beacon anneals to template, separating both dyes and yielding fluorescence proportional to PCR product concentration
Reporter
QuencherMolecular beacon

3/15/2011
Molecular Beacons
• Improved specificity and multiplexing– Non-specific amplification will not produce a signal
– Can multiplex several probes (quantify nuclear, Y, int std.)
• Can be tricky to design– Loop portion – binds to DNA template
– Stem portion – must be complementary to other stem
– Probe must denature from template below 72º so Taq polymerase does not chew it up during extension step
Tanneal< Tm < Text
Above Tm loop structure reforms and probe leaves template

Fret Probes
Fret probes work in an opposite manner to Taqman and Molecular Beacons. Fret stands for flourescence energy transfer1. Primers are designed to target a particular location on the
genome. Prime binding sites are invariant,2. Two probes are designed facing each other on a strand. The
5’ and 3’ ends of the probes face each other and are labeled with energy transfer dyes.
3. If the two probes lay next to each other the two dyes interact and fluorescence enhancement is seen during the annealing step.
4. At extension, the probes melt off and fluorescence enhancement is gone.

3/15/2011http://www1.qiagen.com/literature/Brochure.aspx?id=2000149

PlexorTM for Real-Time PCR
1. Primers are designed to target a particular location on the genome. Primers are contain methyl cytocine at the 5’ end.
2. During the amplification step a complimentary (iso-dGTP) binds specifically to the methyl cytocine
3. As a result, the initial fluorescence signal from the unincorporated primers decreases as they are incorporated into the accumulating dsDNA strands.
4. Since the quenching step occurs in a primer and not a probe molecule, plexor permits the application of melt curve analysis in multiple channels.

PlexorTM for Real-Time PCR
Figure 1: Base pairing between isoguanine (iso-dG) and 5´-methylisocytosine (iso-dC)
Frackman, S., Ekenberg, S., Hoffman, K., Krenke, B., Sprecher, C., Storts, D., PlexorTM Technology:A New Chemistry for Real-Time PCR, Promega Corporation, 2005

PlexorTM for Real-Time PCR
Figure 2: Quenching of the fluorescent signal by dabcyl during product accumulationNote : only one of the two primers is labeled with the reporter dye.
Reporter
5’
3’
3’
5’
ReporterReporter
Iso-dG + Quencher
Taq
Reporter
Iso-dC
Iso-dC
Iso-dG + Quencher
Iso-dC
Iso-dC
Taq
TaqTaq
Taq

Amplification CurvesPlexorTM vs. SYBR Green
Plexor fluorescence↓ as
amplification↑
SYBR Green fluorescence ↑ as
amplification↑
http://www.promega.com/plexorhy/system.htm
http://www.capitalbio.com/life_sciences/bioanalysis_kit/capitalbio__real-time__qpcr__universal__kits

If the real time PCR detection system is based on SybrGreen or Plexor, fluorescence will be a function of the amount of dsDNA.
If the temperature is increases the two strands melt and the fluorescence is altered.
The dsDNA melting temperature is a function of length, GC content and conformation
The shape of the curve can be used to detect SNPs, primer dimers, and inhibitor binding
Melting Curves

The melt curve analysis can be generated by allowing the product to form dsDNA from 60oC-95oC
Melting temperature (Tm)- the temperature at which amplicondisassociation occurs
Characterizes amplicon homogeneity Inhibition
Melting Curves and TM
Figure 4: Melt curves with derived Tm

3/15/2011
Melt curve analysisABI 7500

D) SNP ANALYSIS by
QPCR melt curves
C/C
C/A
A/A
Melt Curves derived from the change in fluorescence
as temperature is increased
Homozygote alleles in yellow and blue
Heterozygote alleles in red and green

3/15/2011
Effects of LCN and inhibition with different detection methods
• SYBR Green– Multilocus probes (Alu), one color– If no sample, amplification of contaminants occurs at high cycle
#– If inhibition, no result or poor efficiency curve– Melt curve reveals inhibition if inhibitor binds DNA
• Probes (Taqman, Mol. beacons)– Multiplex targeted probes – Quant Y, nuclear DNA, int. std– If no sample, internal control amplifies but sample doesn’t.– If inhibition, poor amplification of internal control may be seen
• Plexor– Multiplex targeted primers – nuclear, Y , int. std.– No sample, internal control amplifies– Inhibition is revealed by changes in internal control– Melt may also be affected by inhibition. (no sample no melt
curve)

3/15/2011
Effects of Inhibitors on Alu Assay
• Use Alu sequence, present at 1,000’s of copies/cell – Assay is sensitive to ambient human DNA
in air and water
– Normal Reagent blanks have a Ct at about 27-29 cycles
• If inhibitors are present – no amplification occurs or efficiency is altered – Thus low level ambient DNA serves as an
internal control for inhibitors
• For non Alu based RtPCR, an internal standard is required to detect inhibition
Reagent Blank

3/15/2011
Use of internal positive control to detect humic acid inhibition
Autosomal
Y
IPC

3/15/2011

3/15/2011
Single vs Multilocus Targets
• Multilocus Primer binding– Primers bind at multiple locations throughout the genome – sensitive– Syber green requires no special kit –Inexpensive– Plexor permits multiplexing based on 20 Y and 10 autosomal DNA loci
• Single Locus Probes (Taqman, Mol. beacons)– Single location in genome– an internal std. is used to check for amplification and correct for
changes in efficiency– Lower sensitivity due to noise at low copy number
• Choice: Sensitivity (SYBR green, Plexor) vs direct correspondence between copy number and [DNA] (Taqman)
• Also the probe method is more specific – both primer and probe must bind to get signal.
3/15/2011
Quality of data depends on technique!
R-Value:
Perfect 1.000 !!
Rayna and Sarah
Reproducible pipetting is critical
• Set up experiment so you are never pipettingless than 2 uL. (dilute stds with appropriate amounts of TE prior to analysis)
• Make sure that the sample is well mixed prior to amplification
• Be aware of the potential for DNA loss due to degradation and adsorption on tube walls.

• Tips for Improving Pipetting Technique
• Operator technique has a major impact on pipetting performance.
• Prewet the pipette tip—Aspirate and expel an amount of the sample liquid at least three times before taking a sample for delivery. Evaporation in the tip can cause a significant loss of sample before delivery. Prewetting increases humidity in the tip, thus reducing the amount of variation in sample evaporation.
• Work at temperature equilibrium—Allow liquids and equipment to equilibrate to ambient temperature. The volume delivered varies with air pressure, relative humidity, and vapor pressure of the sample; all of which are temperature dependent.
• Examine the pipette tip before dispensing—Wipe the tip carefully and only if there is liquid on the outside. Otherwise, sample liquid may be wicked from the tip.
• Use standard-mode pipetting—For all but viscous samples, standard-mode (also called forward-mode) pipetting yields better accuracy and precision than reverse-mode pipetting. In reverse-mode, the plunger is depressed completely (e.g., past the first stop) to aspirate the sample.
• Pause after aspiration—Pause with the tip in the liquid for one to two seconds after aspirating the sample. This is important because the liquid in the tip bounces slightly when the plunger stops.
• Lift the pipette straight out—Do not touch the tip to the sides of the container. Surface tension causes the sample to vary if the exit angle varies, particularly for small volumes.
• Minimize handling of the pipette and tip—Set the pipette down between deliveries. Body heat transferred to equipment during handling disrupts temperature equilibrium.
• Immerse the tip properly—Immerse the tip 2-5mm below the meniscus and well clear of the container walls and bottom during sample aspiration, otherwise volume is affected.
• Use the correct pipette tip—Securely attach a high-quality tip designed for use with the pipette and appropriate for the size of the container.
• Use consistent plunger pressure and speed—Depress and release the plunger smoothly. Pipettes are precision instruments and give more consistent results when operated with care.

3/15/2011
RT-qPCR Instruments Available
• Corbett Research Rotorgene
– Phenix Research, Hayward, CA
• ABI 7300 or 7500 Sequence Detection Systems
– Applied Biosystems Foster City, CA
• BioRad iCycler iQ Real-Time Detection System
• Plus many more
Corbett Rotorgene ABI 7500 BioRad iCycler

3/15/2011
Thermal Cycling System : Peltier-based systemBlock Format: 96-well blockSample Ramp Rate Standard Mode: +/-1.6°C/sec
9600 Emulation Mode: +0.8 and -1.6°C/secPeak Block Ramp Rate 2.5°C/secTemperature Range 4°C-100°CTemperature Accuracy +/-0.25°C (35°C to 95°C)Temperature Uniformity +/-0.50°C, 30 seconds after clock start.Optical System Tungsten- halogen lamp excitation source.
Five-excitation filters, five-emission filters, CCD
ABI 7500
http://www3.appliedbiosystems.com/cms/groups/mcb_marketing/documents/generaldocuments/cms_040315.pdf

3/15/2011http://env1.gist.ac.kr/joint_unugist/file/g_class11_real_time_pcr_vt.pdf

3/15/2011http://www1.qiagen.com/literature/Brochure.aspx?id=2000149

3/15/2011
Thermal Cycling System : Hot Air based systemBlock Format: Rotory Peak Block Ramp Rate 15°C/secTemperature Range Ambient -100°CTemperature Accuracy +/-0.25°C (35°C to 95°C)Temperature resolution +/-0.02°COptical System Tungsten- halogen lamp excitation source.
Five-excitation filters, five-emission filters, CCD
Rotogene Q

3/15/2011
Qiagen Rotogene 6000

3/15/2011
• Assay reagent costs:
– Quantifiler: $2.46/sample (only permits 2 µL/sample)
– SYBR Green: $0.80/sample (up to 10 µL/sample)
– QuantiBlot: $0.54/sample (5 µL/sample)
Due to convenience and the presence of the internal control DNA, most labs will utilize kit based systems like Plexor HY or Quantifiler Duo.
http://www.cstl.nist.gov/biotech/strbase/DNAquant.htm
REAGENT COSTs

Advanced Issues with QPCR
• Multiplexing capability – currently A,Y, and IPC– But, as many as 5 different dyes can be
simultaneously detected• This might permit mtDNA, and a degradation assay to
be added
• Multiple RNA markers for tissue typing could be developed
• Melt curve analysis can be used– Prescreen DNA for the presence of alleles
– Detect inhibition
– Tissue type by detecting methylation markers

How to use Y quantification in casework
• Use it as a presumptive test for the presence of male DNA. - find and amplify the most probabtive samples
• Use it for an estimate of amplification success. If Y ratio is above 10% then Autosomal STR analysis may provide a useful result.
• Use it to estimate the amount of DNA template to get a useful Y STR result.

What does ABI say?
ABI Product Literature

But be careful with what you read!
Utilizing Quantifiler duo as an aid to evidence processing
• Duo gives the quantity of human autosomal DNA permitting proper dilution of sample prior to amplification
• Duo permits the quantification of Y DNA, and reveals its presence.
• The internal control sequence permits the determination of the presence of certain inhibitors
• The ratio of male to autosomal DNA permits the determination of the presence of a M/F mixture and the likelyhood of success of mixture interpretation. It also indicates if a sample should be processed for Y STRs.

Examining this sample, One can conclude that an approximate 1: 1 mixture exists.
http://www3.appliedbiosystems.com/cms/groups/applied_markets_marketing/documents/generaldocuments/cms_053411.pdf


1:1 mixture of Male/Female DNA Notice how balance within loci varies due to peak balance and peak overlap/stutter issues.
2:1
http://www3.appliedbiosystems.com/cms/groups/applied_markets_marketing/documents/generaldocuments/cms_053411.pdf
1:1
2:1
2:1
1:1
1:1
Of course its not that simple!
2:1

What About Plexor?
• Plexor offers pretty much the same information • Is male DNA there• How much Male DNA is present• The male/Female ratio
• But there is a concern: multicopy analysis may mean that the A/Y ratio will be a bit less accurate.
• However, accuracy does not seem to be a high point of either assay since both are based on the linearity of a semilog plot.
• Conventional wisdom: Plexor - sensitivity, Duo - accuracy
• Ultimate question in any case is how well does it amp in your laboratory!

QPCR and Inhibition
• There is a limit to how quantification reaction can detect inhibitors with the IPC
• Only 2μL DNA is added to a 25uL real time reaction
• Up to 10μL added to 25uL STR reaction (5x more)
• If extract was further concentrated to 10μL, a much higher concentration of inhibitor in STR reaction may exist

QPCR and Inhibition
• Inhibition can be detected by poor amplification of IPC
• For non taqman methods, melt curves may also be used
Effect of Phenol on Plexor melt curves

IPC can be used effectively for inhibition detection
Results with quantifiler


3/15/2011

3/15/2011
Conclusions
• RTPCR is a homogeneous PCR based method for human specific quantification
– Is easily automated, provides electronic storage of data
– SYBR green or targeted probes can be used
• Results give quantity of amplifiable DNA – not necessarily overall quantity
– Inhibition can be detected
– Multiplexing can be used
• Big advantages are speed , dynamic range, and automation
• Main issues are quantifying effects of inhibition and degradation on the quality of results.

Thank you