dna-based approaches for evaluating historical demography in terrestrial vertebrates
TRANSCRIPT
REVIEW ARTICLE
DNA-based approaches for evaluating historicaldemography in terrestrial vertebrates
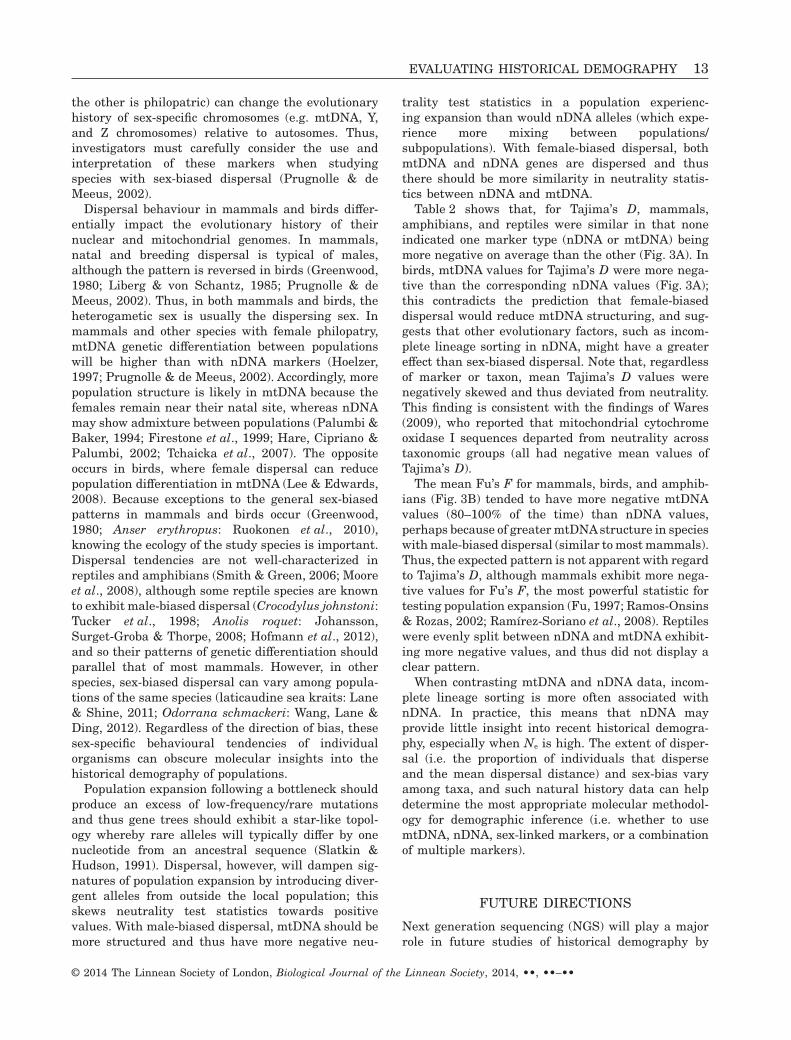
ANNA L. FAHEY1*, ROBERT E. RICKLEFS2 and J. ANDREW DEWOODY1,3
1Departments of Forestry and Natural Resource, Purdue University, West Lafayette, Indiana 47907,USA2Department of Biology, University of Missouri at St Louis, St Louis, MO 63121, USA3Biological Sciences, Purdue University, West Lafayette, Indiana 47907, USA
Received 5 December 2013; revised 27 January 2014; accepted for publication 27 January 2014
Contemporary DNA sequences can provide information about the historical demography of a species. However,different molecular markers are informative under different circumstances. In particular, mitochondrial (mt)DNAis uniparentally inherited and haploid in most vertebrates and thus has a smaller effective population size thandiploid, biparentally inherited nuclear (n)DNA. Here, we review the characteristics of mtDNA and nDNA in thecontext of historical demography. In particular, we address how their contrasting rates of evolution and sex-biaseddispersal can lead to different demographic inferences. We do so in the context of an extensive review of thevertebrate literature that describes the use of mtDNA and nDNA sequence data in demographic reconstruction. Wediscuss the effects of coalescence, effective population size, substitution rates, and sex-biased dispersal oninformative timeframes and expected patterns of genetic differentiation. We argue that mtDNA variationin specieswith male-biased dispersal can imply deviations from neutrality that do not reflect actual population expansion orselection. By contrast, mtDNA can be more informative when coalescence has occurred within the recent past,which appears to be the case with many vertebrates. We also compare the application and interpretation ofdemographic and neutrality test statistics in historical demography studies. © 2014 The Linnean Society ofLondon, Biological Journal of the Linnean Society, 2014, ••, ••–••.
ADDITIONAL KEYWORDS: amphibians – birds – coalescence – mammals – mitochondrial genes – neu-trality test statistics – nuclear genes – reptiles – sex-biased dispersal – substitution rates.
INTRODUCTION
In contemporary populations, ecologists use data onbirths, deaths, and migration rates to predict demo-graphic trends. These data are generally unavailablefor historic populations. Rogers & Harpending (1992)first realized that ‘episodes of population growth anddecline leave characteristic signatures in the distri-bution of nucleotide differences between pairs ofindividuals’. Accordingly, evolutionary biologists canuse DNA sequences to test demographic hypothesesconcerning historical populations (e.g. exponentialgrowth, bottlenecks).
For most animal species, mitochondrial (mt)DNAsequences have been the easiest to generate and
analyze. Conserved regions of the mtDNA genomeprovide locations where primers can be anchoredto amplify orthologous genes in diverse taxa,making amplification and sequencing relativelystraightforward (Moritz, Dowlin & Brown, 1987). Themitochondrial genome is usually inherited maternallyas a single, nonrecombining unit and its haploidnature reduces the complications associated withmultiple-site haplotype reconstruction (Clark, 1990;Stephens, Smith & Donnelly, 2001). Clonal inheritanceand haploidy mean that the effective population size(Ne) of mtDNA is only one-quarter that of nuclear(n)DNA (Brown, George & Wilson, 1979; Moritz et al.,1987; Palumbi, Cipriano & Hare, 2001). Mitochondrialgene sequences also tend to be more variable thannuclear gene sequences because of the relativelyhigher nucleotide substitution rates of mtDNA (Brown*Corresponding author. E-mail: [email protected]
bs_bs_banner
Biological Journal of the Linnean Society, 2014, ••, ••–••. With 3 figures
© 2014 The Linnean Society of London, Biological Journal of the Linnean Society, 2014, ••, ••–•• 1
et al., 1979). Thus, mtDNA can be used to discerndemographic signals over shorter time periods. Moreo-ver, because mtDNA achieves monophyly faster thannDNA, mtDNA genes are more likely to be congruentwith a species tree than any singlenuclear gene(Moore, 1995).
Despite these positive attributes, mtDNA also haslimitations for demographic reconstruction. Forexample, selection on a given mitochondrial gene, orany part of the nuclear genome that interacts withmtDNA, will impact the entire mtDNA moleculebecause of its nonrecombining nature (Galtier et al.,2009; Karl et al., 2012). In the case of historicaldemography, this will lead to inferences that reflectonly the most recent selective sweep, effectivelyerasing any prior demographic history of the species.The haploid and nonrecombining aspects of mtDNAare therefore a double-edged sword because theyallow convenient haplotypeinference and the genera-tion of resolved evolutionary trees, although selectivesweeps or introgression can blur demographic signals(Ballard & Whitlock, 2004).
To offset issues with mtDNA and add a complemen-tary perspective from nDNA, many researchers arenow pushing for the use of both sets of markers indemographic studies (Edwards et al., 2005; Bazin,Glemin & Galtier, 2006; Galtier et al., 2009; Dupuis,Roe & Sperling, 2012). The use of both genomesprovides multiple independent samples of geneticdiversity from both sets of parents. However, nDNAtends to be less polymorphic than mtDNA, and somore sampling (i.e. nucleotides and loci) is required toprovide statistical power equivalent to that often pro-vided by a single mitochondrial gene. Furthermore,nDNA substitution rates among genes vary more thanmtDNA rates (Yang & Nielsen, 1998) and thus diver-gence estimates based on nDNA data are oftensubject to much wider confidence intervals.
In this review, we consider the effectiveness ofmtDNA and nDNA gene sequences in reconstructingthe demographic histories of terrestrial vertebrates(mammals, birds, amphibians, and reptiles). Forexample, variation in dispersal tendencies amongvertebrates, notably male-biased in mammals andfemale-biased in birds, has the potential to makeuniparentally inherited markers (e.g. mtDNA) moreor less effective than nDNA in different taxonomicgroups. We also review the efficacy of differentmethods for inferring historical demography.
COALESCENCE AND EFFECTIVEPOPULATION SIZE
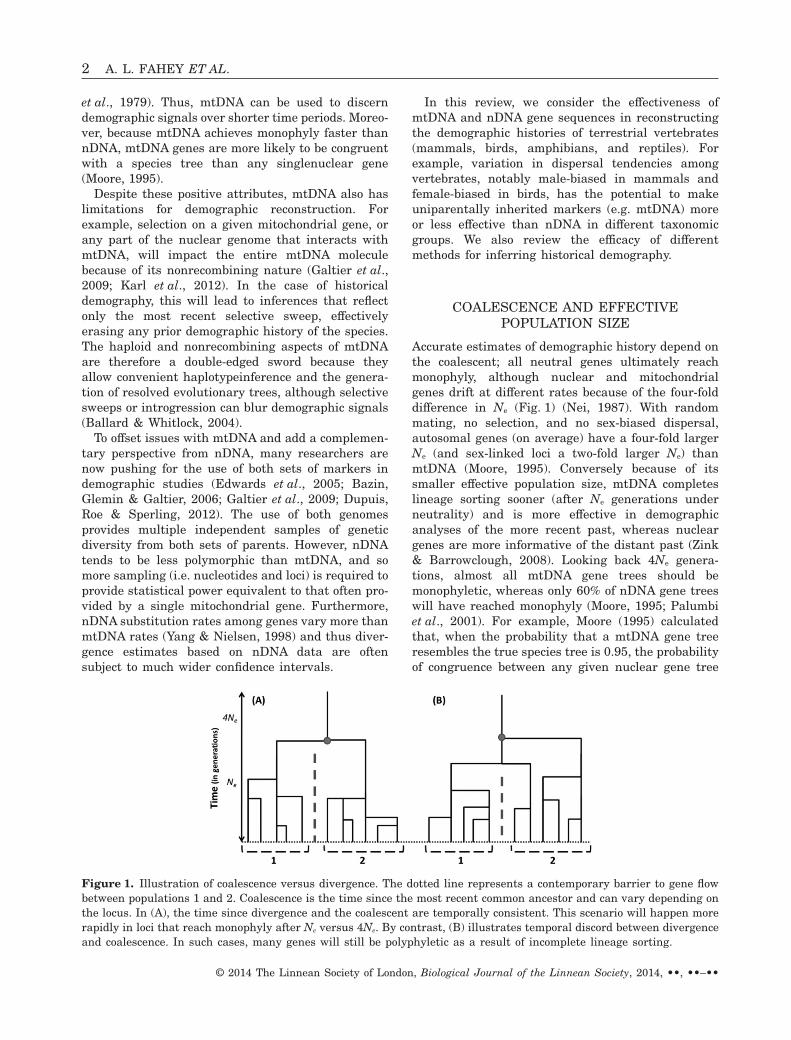
Accurate estimates of demographic history depend onthe coalescent; all neutral genes ultimately reachmonophyly, although nuclear and mitochondrialgenes drift at different rates because of the four-folddifference in Ne (Fig. 1) (Nei, 1987). With randommating, no selection, and no sex-biased dispersal,autosomal genes (on average) have a four-fold largerNe (and sex-linked loci a two-fold larger Ne) thanmtDNA (Moore, 1995). Conversely because of itssmaller effective population size, mtDNA completeslineage sorting sooner (after Ne generations underneutrality) and is more effective in demographicanalyses of the more recent past, whereas nucleargenes are more informative of the distant past (Zink& Barrowclough, 2008). Looking back 4Ne genera-tions, almost all mtDNA gene trees should bemonophyletic, whereas only 60% of nDNA gene treeswill have reached monophyly (Moore, 1995; Palumbiet al., 2001). For example, Moore (1995) calculatedthat, when the probability that a mtDNA gene treeresembles the true species tree is 0.95, the probabilityof congruence between any given nuclear gene tree
Figure 1. Illustration of coalescence versus divergence. The dotted line represents a contemporary barrier to gene flowbetween populations 1 and 2. Coalescence is the time since the most recent common ancestor and can vary depending onthe locus. In (A), the time since divergence and the coalescent are temporally consistent. This scenario will happen morerapidly in loci that reach monophyly after Ne versus 4Ne. By contrast, (B) illustrates temporal discord between divergenceand coalescence. In such cases, many genes will still be polyphyletic as a result of incomplete lineage sorting.
2 A. L. FAHEY ET AL.
© 2014 The Linnean Society of London, Biological Journal of the Linnean Society, 2014, ••, ••–••
and the species tree would be only 0.62. When fivenuclear genes are considered, the probability that allare congruent with the true species tree is then only0.625 (or 0.09) (i.e. less than 1 in 10). Moore (1995)also found that depending on the method, confidencein congruence requires from 16 to upwards of 40nuclear genes.
Moore’s example assumed neutrality, panmixia,and random mating, although departures from theseassumptions can influence estimates of Ne, of coales-cent events, and, ultimately, of historical demography.For example, the Ne of a nuclear gene can be equiva-lent to, or smaller than, that of a mitochondrial genewhen a small proportion of males sire the next gen-eration, as in populations with highly polygynousmating systems (Hoelzer, 1997). Additionally, popula-tion genetic structure can bias estimates of Ne ifdifferentiation is more pronounced in one sex, increas-ing Ne for the philopatric sex relative to the dispers-ing sex (Hoelzer, 1997; Prugnolle & de Meeus, 2002).Finally, selection can also confound the reconstructionof evolutionary history by fixing selected genes,thereby creating the appearance of rapid coalescence.This could be interpreted as population expansion,although it represents the demographic expansiononly of those lineages bearing the beneficial allele(Slatkin & Hudson, 1991). Fortunately, selectivesweeps of mtDNA appear to be rare and actualempirical evidence for mtDNA selection is surpris-ingly sparse (Karl et al., 2012).
THE CENTRAL ROLE OF SUBSTITUTIONRATES IN HISTORICAL INFERENCE
Accurate reconstruction of population demographyrequires that the markers used for inference provideinsights into the appropriate historical timeframe(e.g. genes that evolve slowly are poor choices forinvestigations into the Pleistocene epoch). Further-more, accurate estimates of molecular evolutionaryrates require measures of the sequence divergencebetween two species, conversion of divergence esti-mates into nucleotide substitutions, and estimates ofthe time since divergence for the species in question(Bromham & Penny, 2003; Ellegren, 2007; Ho, 2007).Unfortunately, molecular evolutionary rates varyacross genomes and among species (Arbogast et al.,2002; Bromham & Penny, 2003; Smith & Donoghue,2008) and can also be time-dependent (Ho et al.,2011). Additionally, fossil-calibrated species diver-gence estimates are difficult to obtain for taxonomicgroups that are underrepresented in the fossil record(e.g. birds; Ellegren, 2007). An extensive study com-paring nuclear gene substitution rates betweenchicken and turkey (Axelsson et al., 2005) found the
mean intronic divergence to be 10.7%, which trans-lates to a mean neutral mutation rate of 0.12–0.15%per site per million years (Ellegren, 2007). This isapproximately twice the mean rate of 21 orthologousgenes compared between ducks and chickens (vanTuinen & Hedges, 2001; Ellegren, 2007). Further-more, these estimates are based on mean substitutionrates across the genome; in mammals, substitutionrates vary considerably across chromosomes and indifferent regions along a chromosome (MGSC, 2002;CSAC, 2005). Thus, the uncertainties associated withmolecular evolutionary rates can undermine efforts toaccurately date historical demographies.
Brown et al. (1979) provided one of the first esti-mates of mtDNA evolutionary rates: they determinedthat there were 0.02 substitutions per base pair permillion years (approximately 10 times the rate esti-mated for the nDNA genome) in a sample of primatespecies. Subsequently, a substitution estimate of 2%mtDNA per million years has become a general rule ofthumb for birds (Lovette, 2004; Weir & Schluter,2008). However, this rate varies considerably amongtaxa (Ballard & Whitlock, 2004; Galtier et al., 2009;Eo & DeWoody, 2010). For example, Nabholz, Glémin& Galtier (2008) measured lineage-specific mutationrates based on more than 1500 species (using fossilsand synonymous versus nonsynonymous substitutiondata) and determined that mtDNA substitution ratescan vary100-fold among mammalian species and30-fold among birds.
It logically follows that, if accurate substitutionrates are required for accurate clocks, and if substi-tution rates vary dramatically among genes andspecies, then independent rate estimates may berequired for different genes in each species (Fig. 1).Because this is a major challenge in studies of non-model species (Ellegren, 2007; Ho, 2007), the nextbest option is to incorporate data from a closely-related species (Lovette, 2004) and/or to incorporateuncertainty (i.e. a range of substitution rates) intoanalyses of divergence and Ne (Bos et al., 2008). Manystudies now use a range of substitution rates to morerealistically bracket estimated time intervals (Lopes,Miño & Del Lama, 2007; Townsend et al., 2007;Bellemain, Bermingham & Ricklefs, 2008; Faheyet al., 2012).
Once reasonable substitution rate estimates are tohand, the divergence and expansion times for aspecies or population can be computed. The substitu-tion rate per se does not affect the ability to computecoalescent times, although the substitution rateand divergence time determine the density ofpolymorphisms in a sample and thus the power of agiven marker. For neutral markers, Ne determinesthe range of coalescent times that may be estimatedfrom standing levels of genetic diversity. Thus, the
EVALUATING HISTORICAL DEMOGRAPHY 3
© 2014 The Linnean Society of London, Biological Journal of the Linnean Society, 2014, ••, ••–••
shallower perspective of mtDNA should provideinsights into recent (Quaternary) processes comparedto the deeper evolutionary perspective provided bynDNA sequences (Zink & Barrowclough, 2008).
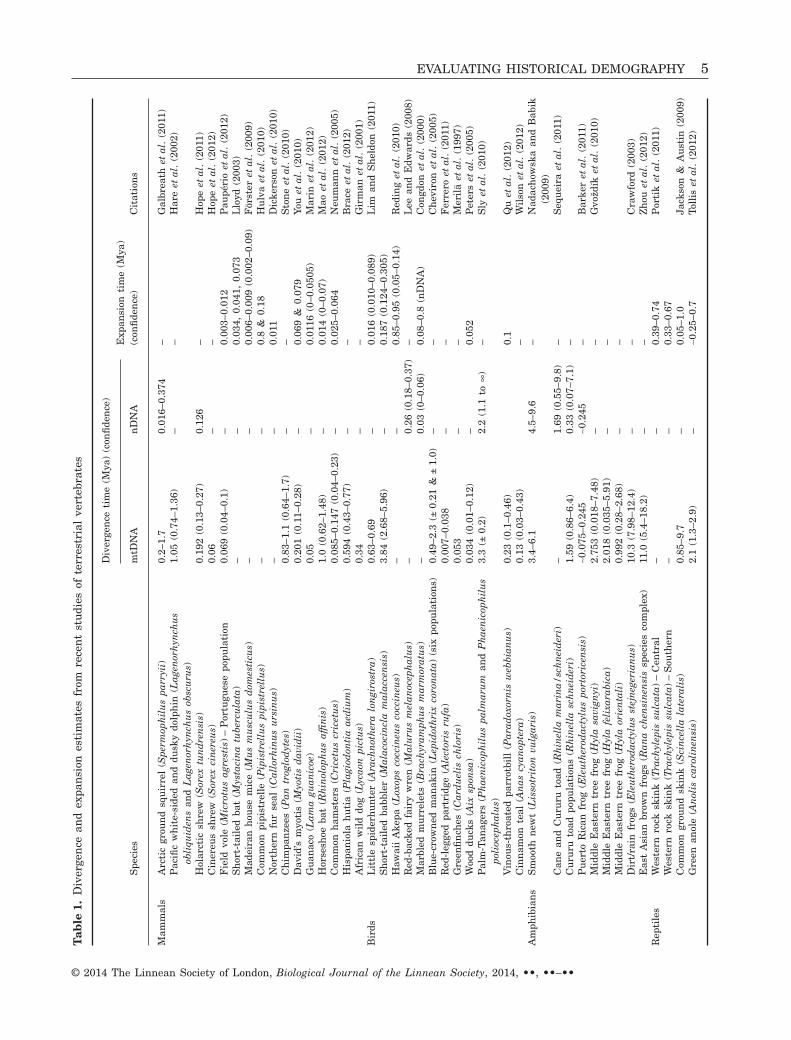
What have we learned about the divergence andexpansion of historical vertebrate populations usingmolecular data from contemporary populations? Wereviewed 36 published nDNA and mtDNA studies ofvertebrate demography for estimates of divergenceand expansion. These studies were chosen becausethey reported both mtDNA and nDNA sequence data,employed one or more of the neutrality test statisticsaddressed below, and inferred the historical demog-raphy of a terrestrial vertebrate. Among studies ofmammals and birds, we found that, across markers,all but one coalescence point occurred within thePleistocene epoch (Table 1). These findings are con-sistent with the findings of Turchetto-Zolet et al.(2012), who also found that lineage divergence timesfor South American mammals and birds werepredominately Pleistocene (only three of 38 had esti-mates > 2.6 Mya). By contrast, our review of diver-gence times for amphibian species revealed that onlyapproximately half of the amphibian divergence timeestimates fall within the Pleistocene (reptile data aretoo sparse for inference). Thus, Table 1 suggests thatmost contemporary mammalian and avian lineagescoalesced within the ‘recent’ evolutionary past (i.e.within the last approximately two million years),whereas genetic variation in reptile and amphibian(herpetofauna; herps) populations tends to coalescedeeper in time.
It could be argued that mtDNA sequences are themost appropriate markers for mammals and birdsbecause most nDNA genes will not have coalesced (i.e.achieved monophyly; Zink & Barrowclough, 2008).The divergence estimates in Table 1 are based pre-dominantly on mtDNA and thus may not properlyrepresent nDNA (Turchetto-Zolet et al., 2012). Unfor-tunately, extensive calibrations with fossil data andnDNA gene sequences are required to evaluate poten-tial bias of nDNA relative to mtDNA estimates. Therapid development of whole genome DNA sequencingwill undoubtedly help with this problem in the future(Baird et al., 2008; Meyer, Stenzel & Hofreiter, 2008;Hohenlohe et al., 2010; O’Neill et al., 2012; Puritz,Addison & Toonen, 2012; Zhan et al., 2013), although,even then, uncertainties remain that can cloud demo-graphic inference. These include an incomplete fossilrecord (which leads to imprecise estimates of diver-gence time) and the variation in nucleotide substitu-tion rate (between genomes within a species, as wellas within a genome between taxonomic lineages).Finally, variation in the categorical assignment oflineages to species can further confound comparativestudies (e.g. the taxonomic disparity known to exist
among the vertebrates; reptiles and amphibians areoften ‘lumped’ into far fewer taxa than are mammalsand birds) (Johns & Avise, 1998).
DEMOGRAPHIC AND NEUTRALITYTEST STATISTICS
Several tests have been developed to estimate the sizeand growth rate of historic populations. Many of thesecompare the observed sequence variation with thevariation expected under a neutral model. Threeclasses of statistics can detect changes in populationsize over time (Ramos-Onsins & Rozas, 2002;Ramírez-Soriano et al., 2008). Class I statistics arethose that use segregating site (mutation) frequenciesand the excess of rare mutations to determine popu-lation history. These statistics include: Tajima’s D(Tajima, 1989), which evaluates the observed distri-bution of polymorphisms compared with the meanpairwise difference expected under neutrality; Fu andLi’s D* and F* (Fu & Li, 1993), which compare thenumber of derived singleton mutations with the totalor mean number of derived nucleotide variants; andR2, which compares the mean number of nucleotidedifferences with the difference in nucleotide muta-tions between singletons (Ramos-Onsins & Rozas,2002). Class II statistics, such as Fu’s FS (Fu, 1997),use composite haplotypes to determine populationdemography. Finally, Class III statistics use the dis-tribution of pairwise sequence differences, also knownas the mismatch distribution, to test for deviationsfrom the null model of population expansion (Slatkin& Hudson, 1991; Rogers & Harpending, 1992;Harpending et al., 1993). Demographic expansion fol-lowing a population bottleneck often produces a star-like gene tree, where the majority of coalescenceevents occur near the root (Slatkin & Hudson, 1991).This means that a polymorphism at a singlenucleotide position will consist of a ‘new’ mutationand all other nucleotide sites will have the ‘ancestral’mutation; this can occur over the length of thesequence, and neutrality tests uncover significantexcess of this pattern (Slatkin & Hudson, 1991).
The neutrality test statistics (D, D*, F*, R2, and FS)test for departures from neutral expectations (Fu,1997; Ptak & Przeworski, 2002). Significantly nega-tive values of these statistics signify populationexpansion or selection. Selection must be consideredbecause it has the potential to influence gene gene-alogies and compromise demographic inferences. Thisis not to say that selection necessarily poisons adataset because neutrality test statistics can helpquantify the extent of selection (if any) and its poten-tial impact on historical inference.
FS and R2 are the most powerful statisticsfor testing population expansion (Fu, 1997;
4 A. L. FAHEY ET AL.
© 2014 The Linnean Society of London, Biological Journal of the Linnean Society, 2014, ••, ••–••
Tab
le1.
Div
erge
nce
and
expa
nsi
ones
tim
ates
from
rece
nt
stu
dies
ofte
rres
tria
lve
rteb
rate
s
Spe
cies
Div
erge
nce
tim
e(M
ya)
(con
fide
nce
)E
xpan
sion
tim
e(M
ya)
(con
fide
nce
)C
itat
ion
sm
tDN
An
DN
A
Mam
mal
sA
rcti
cgr
oun
dsq
uir
rel
(Spe
rmop
hil
us
parr
yii)
0.2–
1.7
0.01
6–0.
374
–G
albr
eath
etal
.(2
011)
Pac
ific
wh
ite-
side
dan
ddu
sky
dolp
hin
(Lag
enor
hyn
chu
sob
liqu
iden
san
dL
agen
orh
ynch
us
obsc
uru
s)1.
05(0
.74–
1.36
)–
–H
are
etal
.(2
002)
Hol
arct
icsh
rew
(Sor
extu
nd
ren
sis)
0.19
2(0
.13–
0.27
)0.
126
–H
ope
etal
.(2
011)
Cin
ereu
ssh
rew
(Sor
exci
ner
eus)
0.06
––
Hop
eet
al.
(201
2)F
ield
vole
(Mic
rotu
sag
rest
is)
–P
ortu
gues
epo
pula
tion
0.06
9(0
.04–
0.1)
–0.
003–
0.01
2P
aupé
rio
etal
.(2
012)
Sh
ort-
tail
edba
t(M
ysta
cin
atu
berc
ula
ta)
––
0.03
4,0.
041,
0.07
3L
loyd
(200
3)M
adei
ran
hou
sem
ice
(Mu
sm
usc
ulu
sd
omes
ticu
s)–
–0.
006–
0.00
9(0
.002
–0.0
9)F
örst
eret
al.
(200
9)C
omm
onpi
pist
rell
e(P
ipis
trel
lus
pipi
stre
llu
s)–
–0.
8&
0.18
Hu
lva
etal
.(2
010)
Nor
ther
nfu
rse
al(C
allo
rhin
us
urs
inu
s)–
–0.
011
Dic
kers
onet
al.
(201
0)C
him
pan
zees
(Pan
trog
lod
ytes
)0.
83–1
.1(0
.64–
1.7)
––
Sto
ne
etal
.(2
010)
Dav
id’s
myo
tis
(Myo
tis
dav
idii
)0.
201
(0.1
1–0.
28)
–0.
069
&0.
079
You
etal
.(2
010)
Gu
anac
o(L
ama
guan
icoe
)0.
05–
0.01
16(0
–0.0
505)
Mar
inet
al.
(201
2)H
orse
shoe
bat
(Rh
inol
oph
us
affi
nis
)1.
0(0
.62–
1.48
)–
0.01
4(0
–0.0
7)M
aoet
al.
(201
2)C
omm
onh
amst
ers
(Cri
cetu
scr
icet
us)
0.08
5–0.
147
(0.0
4–0.
23)
–0.
025–
0.06
4N
eum
ann
etal
.(2
005)
His
pan
iola
hu
tia
(Pla
giod
onti
aae
diu
m)
0.59
4(0
.43–
0.77
)–
–B
race
etal
.(2
012)
Afr
ican
wil
ddo
g(L
ycao
npi
ctu
s)0.
34–
–G
irm
anet
al.
(200
1)B
irds
Lit
tle
spid
erh
un
ter
(Ara
chn
oth
era
lon
giro
stra
)0.
63–0
.69
–0.
016
(0.0
10–0
.089
)L
iman
dS
hel
don
(201
1)S
hor
t-ta
iled
babb
ler
(Mal
acoc
incl
am
alac
cen
sis)
3.84
(2.6
8–5.
96)
–0.
187
(0.1
24–0
.305
)H
awai
iA
kepa
(Lox
ops
cocc
ineu
sco
ccin
eus)
––
0.85
–0.9
5(0
.05–
0.14
)R
edin
get
al.
(201
0)R
ed-b
acke
dfa
iry
wre
n(M
alu
rus
mel
anoc
eph
alu
s)–
0.26
(0.1
8–0.
37)
–L
eean
dE
dwar
ds(2
008)
Mar
bled
mu
rrel
ets
(Bra
chyr
amph
us
mar
mor
atu
s)–
0.03
(0–0
.06)
0.08
–0.8
(nD
NA
)C
ongd
onet
al.
(200
0)B
lue-
crow
ned
man
akin
(Lep
idot
hri
xco
ron
ata)
(six
popu
lati
ons)
0.49
–2.3
(±0.
21&
±1.
0)–
–C
hev
iron
etal
.(2
005)
Red
-leg
ged
part
ridg
e(A
lect
oris
rufa
)0.
007–
0.03
8–
–F
erre
roet
al.
(201
1)G
reen
fin
ches
(Car
du
elis
chlo
ris)
0.05
3–
–M
eril
äet
al.
(199
7)W
ood
duck
s(A
ixsp
onsa
)0.
034
(0.0
1–0.
12)
–0.
052
Pet
ers
etal
.(2
005)
Pal
m-T
anag
ers
(Ph
aen
icop
hil
us
palm
aru
man
dP
hae
nic
oph
ilu
spo
lioc
eph
alu
s)3.
3(±
0.2)
2.2
(1.1
to∞
)–
Sly
etal
.(2
010)
Vin
ous-
thro
ated
parr
otbi
ll(P
arad
oxor
nis
web
bian
us)
0.23
(0.1
–0.4
6)0.
1Q
uet
al.
(201
2)C
inn
amon
teal
(An
ascy
anop
tera
)0.
13(0
.03–
0.43
)–
Wil
son
etal
.(2
012)
Am
phib
ian
sS
moo
thn
ewt
(Lis
sotr
iton
vulg
aris
)3.
4–6.
14.
5–9.
6–
Nad
ach
owsk
aan
dB
abik
(200
9)C
ane
and
Cu
ruru
toad
(Rh
inel
lam
arin
a/sc
hn
eid
eri)
–1.
69(0
.55–
9.8)
–S
equ
eira
etal
.(2
011)
Cu
ruru
toad
popu
lati
ons
(Rh
inel
lasc
hn
eid
eri)
1.59
(0.8
6–6.
4)0.
33(0
.07–
7.1)
–P
uer
toR
ican
frog
(Ele
uth
erod
acty
lus
port
oric
ensi
s)∼0
.075
–0.2
45∼0
.245
–B
arke
ret
al.
(201
1)M
iddl
eE
aste
rntr
eefr
og(H
yla
savi
gnyi
)2.
753
(0.0
18–7
.48)
––
Gvo
ždík
etal
.(2
010)
Mid
dle
Eas
tern
tree
frog
(Hyl
afe
lixa
rabi
ca)
2.01
8(0
.035
–5.9
1)–
–M
iddl
eE
aste
rntr
eefr
og(H
yla
orie
nta
li)
0.99
2(0
.28–
2.68
)–
–D
irt/
rain
frog
s(E
leu
ther
odac
tylu
sst
ejn
eger
ian
us)
10.3
(7.9
8–12
.4)
––
Cra
wfo
rd(2
003)
Eas
tA
sian
brow
nfr
ogs
(Ran
ach
ensi
nen
sis
spec
ies
com
plex
)11
.0(5
.4–1
8.2)
––
Zh
ouet
al.
(201
2)R
epti
les
Wes
tern
rock
skin
k(T
rach
ylep
issu
lcat
a)–
Cen
tral
––
0.39
–0.7
4P
orti
ket
al.
(201
1)W
este
rnro
cksk
ink
(Tra
chyl
epis
sulc
ata)
–S
outh
ern
––
0.33
–0.6
7C
omm
ongr
oun
dsk
ink
(Sci
nce
lla
late
rali
s)0.
85–9
.7–
0.05
–1.0
Jack
son
&A
ust
in(2
009)
Gre
enan
ole
(An
olis
caro
lin
ensi
s)2.
1(1
.3–2
.9)
–∼ 0
.25–
0.7
Toll
iset
al.
(201
2)
EVALUATING HISTORICAL DEMOGRAPHY 5
© 2014 The Linnean Society of London, Biological Journal of the Linnean Society, 2014, ••, ••–••
Ramos-Onsins & Rozas, 2002; Ramírez-Soriano et al.,2008); R2 is more powerful with small sample sizesand FS is more powerful with large sample sizes.Although FS and R2 are generally the most suitablefor detecting population expansion, they do not workas well with recombination, which interconvertshaplotypes and, in this case, D, D* or F* are better.Fu and Li’s D* and F* have the most power when theelapsed time since expansion has been relativelyshort (Ramírez-Soriano et al., 2008); thus, these sta-tistics are most applicable to genes that coalescerapidly (e.g. mtDNA). Fu and Li’s D* and F* are morepowerful at distinguishing background selection thanTajima’s D, and thus if D* and F* are significant butD is not, this points more to selection than to popu-lation expansion (Fu, 1997).
Ptak & Przeworski (2002) found that Tajima’s D ismore negative when few individuals from multiplelocations are sampled compared to many individualsfrom only a few localities because more rare allelesare likely to be included in samples across the entiredistribution of a population. Similarly, X-linked locishow lower values of D than autosomal loci becauseX-linked loci have smaller effective population sizes(Ptak & Przeworski, 2002). These findings indicatethat neutrality tests (i.e. Tajima’s D) are better ableto detect population expansion when complete lineagesorting has occurred because they depend on thecoalescence of genes.
A significantly negative neutrality statistic implieseither selection on a given locus or population expan-sion. Because DNA studies of historical demographyshould employ multiple neutral markers, statisticalconcordance across loci is more likely to imply demo-graphic processes (which should act in a genome-widemanner) than selection (which is typically more locusspecific). Thus, population expansion is probably amore parsimonious explanation than selection acrossan entire genome when several loci have significantlynegative D. This conclusion would be further substan-tiated if one of the markers was mtDNA in origin;selection pressures differ between mtDNA and nDNA,whereas both are affected similarly by demographicprocesses such as expansion or contraction.
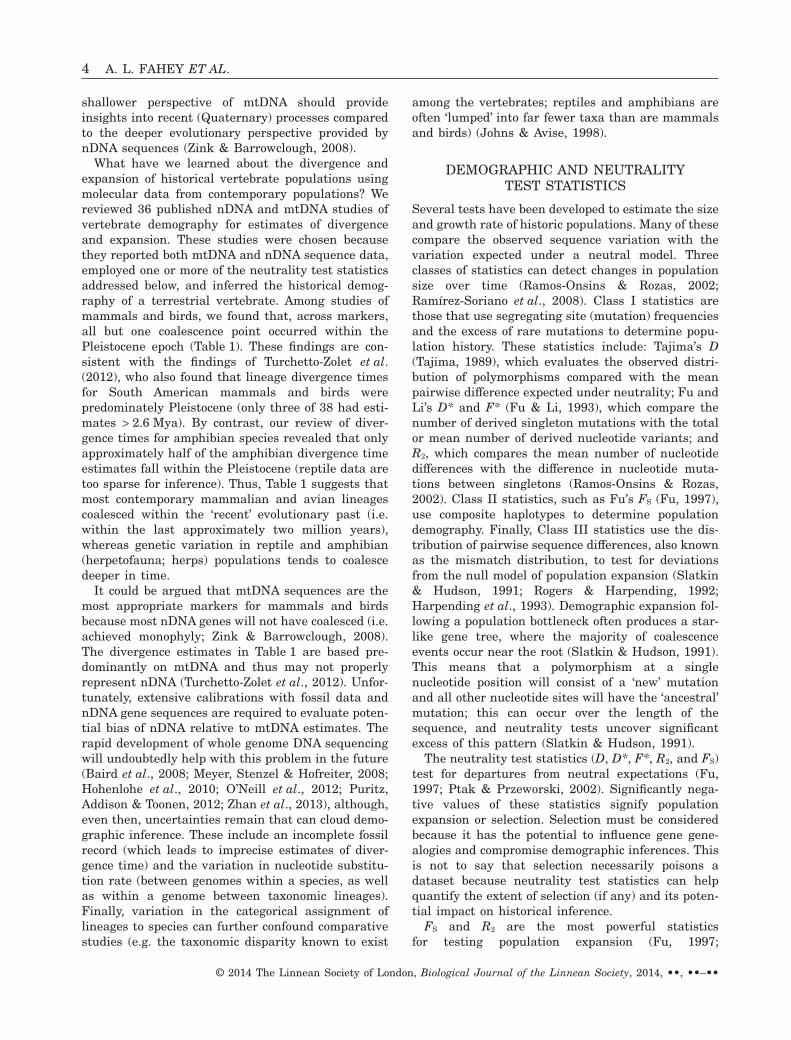
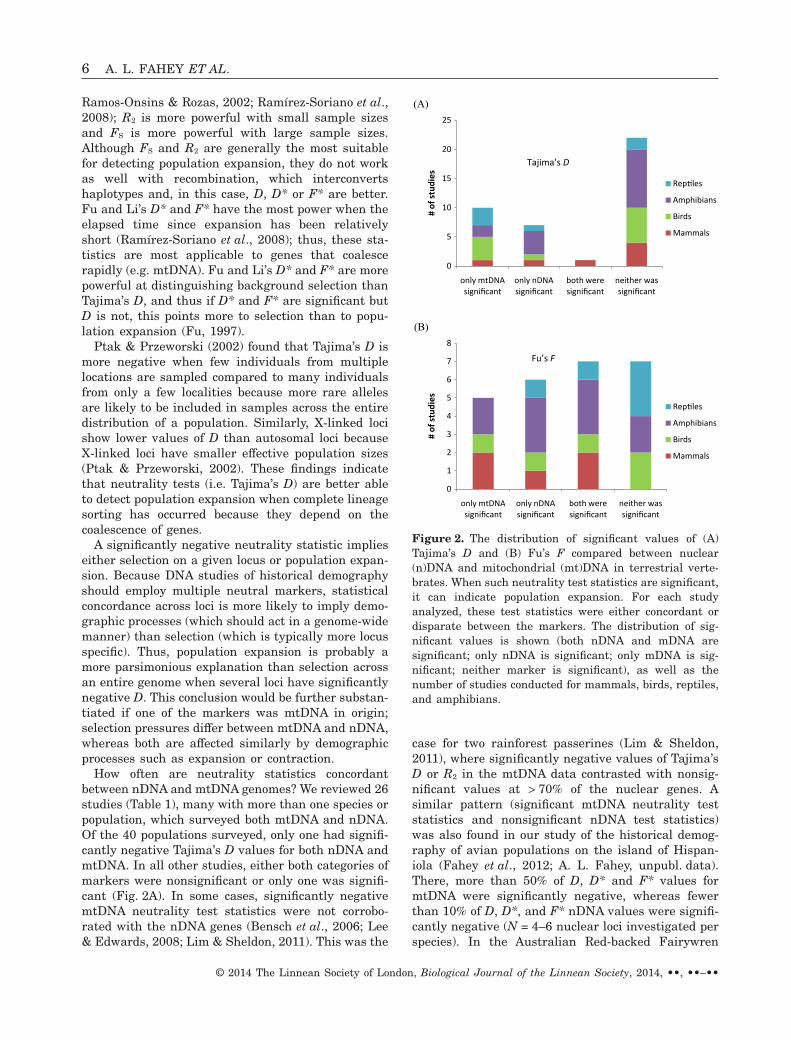
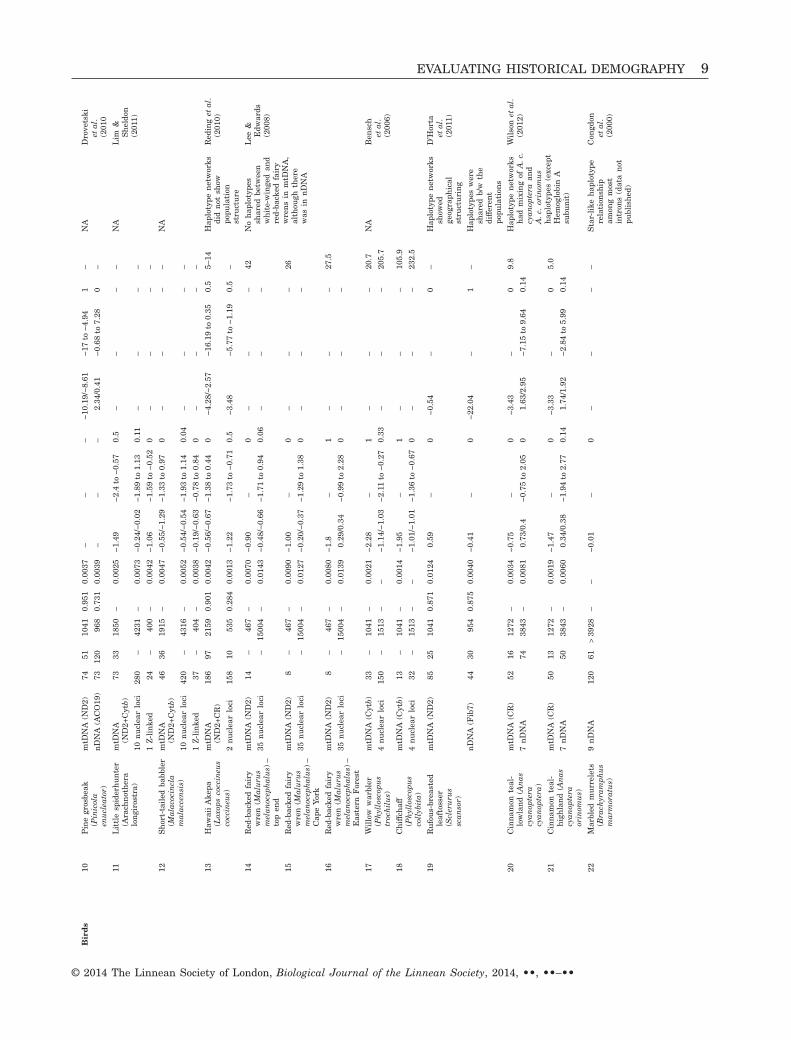
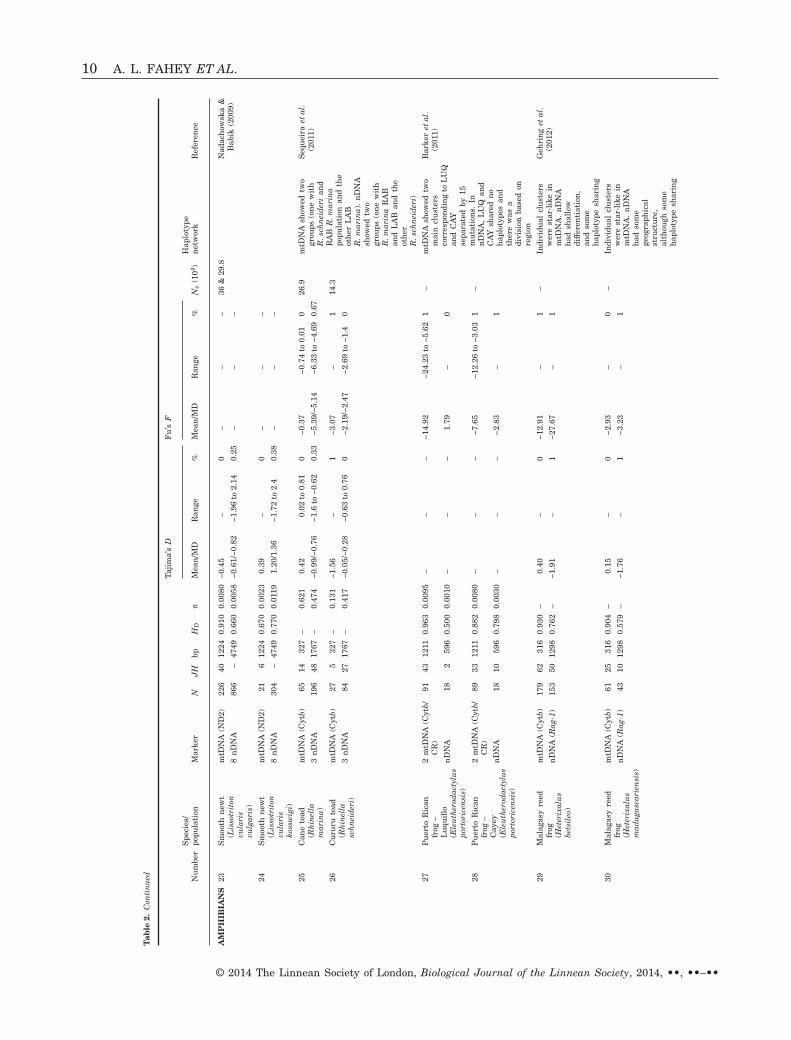
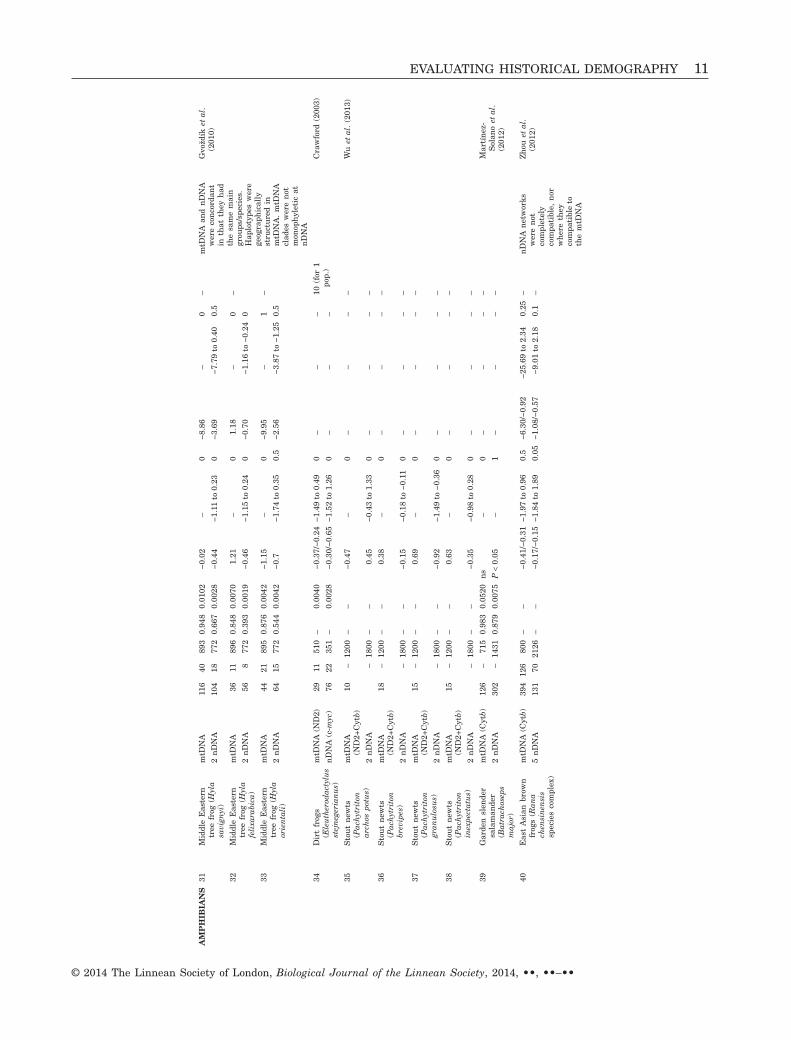
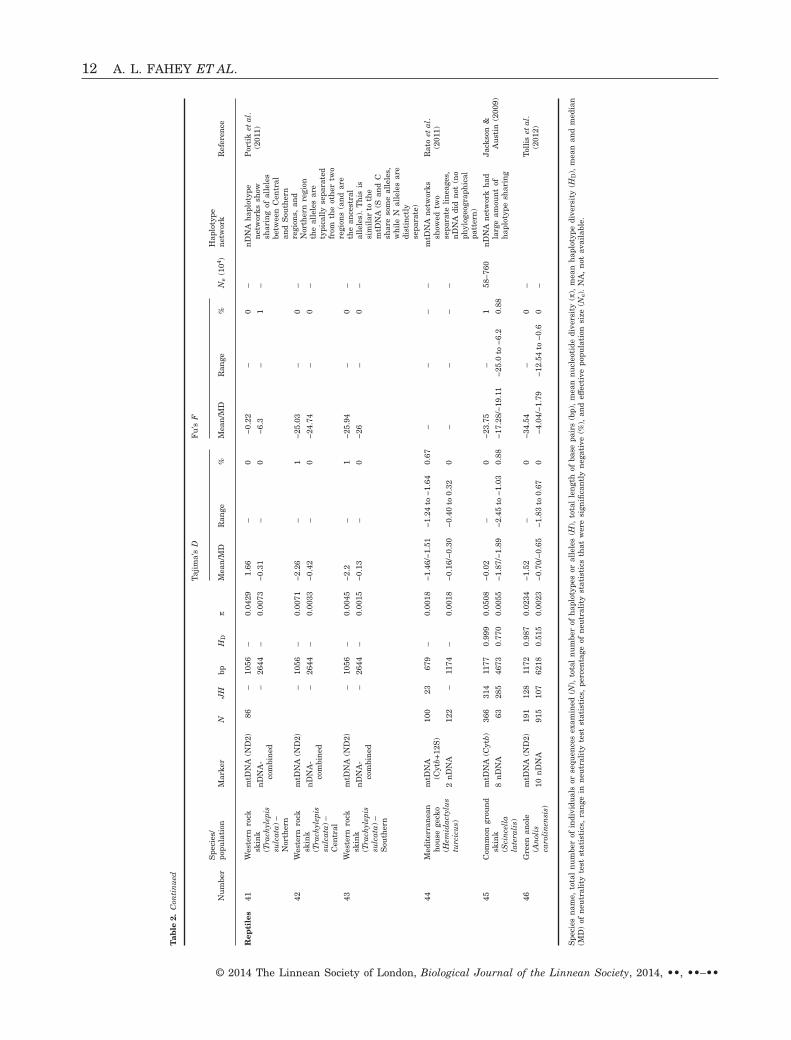
How often are neutrality statistics concordantbetween nDNA and mtDNA genomes? We reviewed 26studies (Table 1), many with more than one species orpopulation, which surveyed both mtDNA and nDNA.Of the 40 populations surveyed, only one had signifi-cantly negative Tajima’s D values for both nDNA andmtDNA. In all other studies, either both categories ofmarkers were nonsignificant or only one was signifi-cant (Fig. 2A). In some cases, significantly negativemtDNA neutrality test statistics were not corrobo-rated with the nDNA genes (Bensch et al., 2006; Lee& Edwards, 2008; Lim & Sheldon, 2011). This was the
case for two rainforest passerines (Lim & Sheldon,2011), where significantly negative values of Tajima’sD or R2 in the mtDNA data contrasted with nonsig-nificant values at > 70% of the nuclear genes. Asimilar pattern (significant mtDNA neutrality teststatistics and nonsignificant nDNA test statistics)was also found in our study of the historical demog-raphy of avian populations on the island of Hispan-iola (Fahey et al., 2012; A. L. Fahey, unpubl. data).There, more than 50% of D, D* and F* values formtDNA were significantly negative, whereas fewerthan 10% of D, D*, and F* nDNA values were signifi-cantly negative (N = 4–6 nuclear loci investigated perspecies). In the Australian Red-backed Fairywren
(A)
(B)
0
5
10
15
20
25
only mtDNA significant
only nDNA significant
both were significant
neither was significant
# of
stud
ies
Rep les
Amphibians
Birds
Mammals
0
1
2
3
4
5
6
7
8
only mtDNA significant
only nDNA significant
both were significant
neither was significant
# of
stud
ies
Rep les
Amphibians
Birds
Mammals
Tajima’s D
Fu’s F
Figure 2. The distribution of significant values of (A)Tajima’s D and (B) Fu’s F compared between nuclear(n)DNA and mitochondrial (mt)DNA in terrestrial verte-brates. When such neutrality test statistics are significant,it can indicate population expansion. For each studyanalyzed, these test statistics were either concordant ordisparate between the markers. The distribution of sig-nificant values is shown (both nDNA and mDNA aresignificant; only nDNA is significant; only mDNA is sig-nificant; neither marker is significant), as well as thenumber of studies conducted for mammals, birds, reptiles,and amphibians.
6 A. L. FAHEY ET AL.
© 2014 The Linnean Society of London, Biological Journal of the Linnean Society, 2014, ••, ••–••
(Malurus melanocephalus), the population with thehighest mean Tajima’s D at nDNA loci had the lowest(and significantly negative) mtDNA Tajima’s D, andthe population with the lowest mean Tajima’s D innDNA had the highest mtDNA statistics (Lee &Edwards, 2008). Although no values of D, D* and F*were significantly negative in a study of arctic groundsquirrels (Spermophilus parryii; Galbreath et al.,2011), the means of the values for nDNA genes werenegative and the mtDNA gene was positive for allthree statistics. Thus, the literature on Tajima’s Dhighlights the discordance between mtDNA andnDNA. In most cases, this conflict probably resultsbecause the species/populations surveyed originatedwithin the last approximately two million years, andthis timeframe captures the coalescence of mtDNAgenes but not nDNA genes (as a result of their four-fold greater Ne).
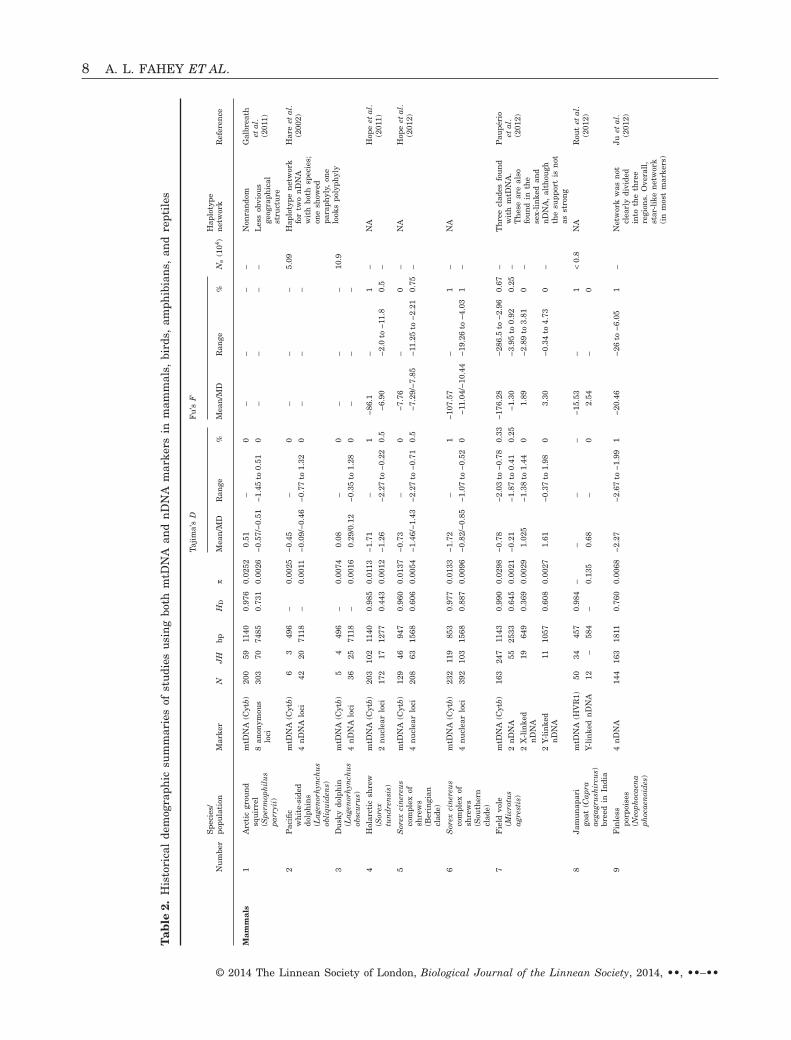
In our review, Fu’s F values were not as widelyreported as Tajima’s D but generally were more con-cordant between mtDNA and nDNA than wereTajima’s D values (Fig. 2B, Table 2). Over all taxa, themean F was negative (−23.6 for mtDNA; −6.82 fornDNA) and half of the values were significant. Therewere more significantly negative values of Fu’s F thanTajima’s D, perhaps because Fu’s F has greater sen-sitivity for detecting population expansion (Fu, 1997;Ramos-Onsins & Rozas, 2002; Ramírez-Soriano et al.,2008).
Two additional methods for determining historicaldemographic parameters are the mismatch distribu-tion (Slatkin & Hudson, 1991) and the Bayesianskyline plot (Pybus, Rambaut & Harvey, 2000;Drummond et al., 2005). Both of these tests not onlydetect population expansion or decline, but alsoprovide information on the timing of these eventsand historic population sizes. Mismatch distributionsare based on coalescent theory and require aparameterized demographic model to test for popula-tion growth (Slatkin & Hudson, 1991). The mismatchdistribution only shows a single demographic event(Rogers, 1995; Lloyd, 2003; Lim & Sheldon, 2011)because an initial expansion will overshadow anysubsequent expansions or minor bottlenecks. Mis-match distributions tend to have large confidenceintervals because they are based on the polymorphicsites contained within only a few haplotypes. They arequite conservative, meaning that it is often difficult toreject the null model of population expansion(Felsenstein, 1992; Schneider & Excoffier, 1999). Thus,mismatch distributions are best used in conjunctionwith the demographic statistics discussed above.
The Bayesian skyline plot, unlike the mismatchdistribution, does not require any a priori parametersand, instead, is a piecewise model (different points intime) of a constant population that uses genealogies
to determine historical population sizes (Pybus et al.,2000; Drummond et al., 2005; Ho & Shapiro, 2011).Therefore, the skyline plot tracks population sizechanges across time and can detect multiple signifi-cant demographic events. Although the skyline plotcan provide a more nuanced (and presumably morenatural) demographic history, it cannot detect popu-lation size changes between intervals, unless inter-vals are pooled, which in turn may diminish theability to detect population size changes (Strimmer &Pybus, 2001). A newer method for determining his-torical population sizes is the pairwise sequentialMarkovian coalescent (PSMC) analysis (Li & Durbin,2011). The PSMC is used to find the most recentcommon ancestor from diploid whole-genomesamples, enabling population estimates from thou-sands of independent loci. Prado-Martinez et al.(2013) used PSMC to analyze genome-wide singlenucleotide polymorphisms (SNPs) and determine theeffective population sizes of great ape species overtime. PSMC may be a more informative test thaneither the mismatch distribution or skyline plotbecause of its ability to analyze genomic data asopposed to single locus data.
Published mtDNA mismatch distributions andBayesian skyline plots are not always concordant. Forexample, Lim & Sheldon (2011) examined the histori-cal demography of two rainforest bird species insouth-east Asia and, in one of the populations, themtDNA based mismatch distribution (and neutralitytest statistics) showed signs of population expansion,whereas the extended Bayesian skyline plot using thecombined mtDNA and nDNA did not. They attributedthis discordance to the skyline plot’s inability toaccount for population structure (subpopulations)after a population has split. Any deviation from equi-librium (e.g. selection or sex-biased dispersal), incom-plete lineage sorting or incorrect substitution rateestimates can cause misinterpretations in both mis-match distribution and skyline plots (Ho & Shapiro,2011; Lim & Sheldon, 2011). In our view, the myriadcaveats associated with mismatch distributions andskyline plots mean that strong inferences are moreplausible when the two methods produce concordantresults.
SEX-BIASED DISPERSAL
The theory of coalescence for a particular gene isbased on the complete divergence of species/populations from one another. However, prior to theevolution of reproductive barriers, individuals dis-persing between populations may create anastomosesin gene trees. Thus, organismal dispersal tendenciesinfluence coalescence within gene trees. In particular,sex-biased dispersal (whereby one sex disperses and
EVALUATING HISTORICAL DEMOGRAPHY 7
© 2014 The Linnean Society of London, Biological Journal of the Linnean Society, 2014, ••, ••–••
Tab
le2.
His
tori
cal
dem
ogra
phic
sum
mar
ies
ofst
udi
esu
sin
gbo
thm
tDN
Aan
dn
DN
Am
arke
rsin
mam
mal
s,bi
rds,
amph
ibia
ns,
and
rept
iles
Nu
mbe
rS
peci
es/
popu
lati
onM
arke
rN
JH
bpH
Dπ
Taji
ma’
sD
Fu
’sF
Ne
(104 )
Hap
loty
pen
etw
ork
Ref
eren
ceM
ean
/MD
Ran
ge%
Mea
n/M
DR
ange
%
Mam
mal
s1
Arc
tic
grou
nd
squ
irre
l(S
perm
oph
ilu
spa
rryi
i)
mtD
NA
(Cyt
b)20
059
1140
0.97
60.
0252
0.51
–0
––
––
Non
ran
dom
Gal
brea
thet
al.
(201
1)8
anon
ymou
slo
ci30
370
7485
0.73
10.
0026
−0.5
7/−0
.51
−1.4
5to
0.51
0–
––
–L
ess
obvi
ous
geog
raph
ical
stru
ctu
re
2P
acifi
cw
hit
e-si
ded
dolp
hin
s(L
agen
orh
ynch
us
obli
quid
ens)
mtD
NA
(Cyt
b)6
349
6–
0.00
25−0
.45
–0
––
–5.
09H
aplo
type
net
wor
kfo
rtw
on
DN
Aw
ith
both
spec
ies;
one
show
edpa
raph
yly,
one
look
spo
lyph
yly
Har
eet
al.
(200
2)4
nD
NA
loci
4220
7118
–0.
0011
−0.0
9/−0
.46
−0.7
7to
1.32
0–
––
3D
usk
ydo
lph
in(L
agen
orh
ynch
us
obsc
uru
s)
mtD
NA
(Cyt
b)5
449
6–
0.00
740.
08–
0–
––
10.9
4n
DN
Alo
ci36
2571
18–
0.00
160.
29/0
.12
−0.3
5to
1.28
0–
––
4H
olar
ctic
shre
w(S
orex
tun
dre
nsi
s)
mtD
NA
(Cyt
b)20
310
211
400.
985
0.01
13−1
.71
–1
−86.
1–
1–
NA
Hop
eet
al.
(201
1)2
nu
clea
rlo
ci17
217
1277
0.44
30.
0012
−1.2
6−2
.27
to−0
.22
0.5
−6.9
0−2
.0to
−11.
80.
5–
5S
orex
cin
ereu
sco
mpl
exof
shre
ws
(Ber
ingi
ancl
ade)
mtD
NA
(Cyt
b)12
946
947
0.96
00.
0137
−0.7
3–
0−7
.76
–0
–N
AH
ope
etal
.(2
012)
4n
ucl
ear
loci
208
6315
680.
606
0.00
54−1
.46/
−1.4
3−2
.27
to−0
.71
0.5
−7.2
9/−7
.85
−11.
25to
−2.2
10.
75–
6S
orex
cin
ereu
sco
mpl
exof
shre
ws
(Sou
ther
ncl
ade)
mtD
NA
(Cyt
b)23
211
985
30.
977
0.01
33−1
.72
–1
−107
.57
–1
–N
A
4n
ucl
ear
loci
392
103
1568
0.88
70.
0096
−0.8
2/−0
.85
−1.0
7to
−0.5
20
−11.
04/−
10.4
4−1
9.26
to−4
.03
1–
7F
ield
vole
(Mic
rotu
sag
rest
is)
mtD
NA
(Cyt
b)16
324
711
430.
990
0.02
98−0
.78
−2.0
3to
−0.7
80.
33−1
76.2
8−2
86.5
to−2
.96
0.67
–T
hre
ecl
ades
fou
nd
wit
hm
tDN
A.
Th
ese
are
also
fou
nd
inth
ese
x-li
nke
dan
dn
DN
A,
alth
ough
the
supp
ort
isn
otas
stro
ng
Pau
péri
oet
al.
(201
2)2
nD
NA
5525
330.
645
0.00
21−0
.21
−1.8
7to
0.41
0.25
−1.3
0−3
.95
to0.
920.
25–
2X
-lin
ked
nD
NA
1964
90.
369
0.00
291.
025
−1.3
8to
1.44
01.
89−2
.89
to3.
810
–
2Y-
lin
ked
nD
NA
1110
570.
608
0.00
271.
61−0
.37
to1.
980
3.30
−0.3
4to
4.73
0–
8Ja
mu
nap
ari
goat
(Cap
raae
gagr
ush
ircu
s)br
eed
inIn
dia
mtD
NA
(HV
R1)
5034
457
0.98
4–
––
–−1
5.53
–1
<0.
8N
AR
out
etal
.(2
012)
Y-li
nke
dn
DN
A12
–58
4–
0.13
50.
68–
02.
54–
0
9F
inle
sspo
rpoi
ses
(Neo
phoc
aen
aph
ocae
noi
des
)
4n
DN
A14
416
318
110.
760
0.00
68−2
.27
−2.6
7to
−1.9
91
−20.
46−2
6to
−6.0
51
–N
etw
ork
was
not
clea
rly
divi
ded
into
the
thre
ere
gion
s.O
vera
ll,
star
-lik
en
etw
ork
(in
mos
tm
arke
rs)
Juet
al.
(201
2)
8 A. L. FAHEY ET AL.
© 2014 The Linnean Society of London, Biological Journal of the Linnean Society, 2014, ••, ••–••
Bir
ds
10P
ine
gros
beak
(Pin
icol
aen
ucl
eato
r)
mtD
NA
(ND
2)74
5110
410.
951
0.00
37–
––
−10.
19/−
8.61
−17
to−4
.94
1–
NA
Dro
vets
kiet
al.
(201
0n
DN
A(A
CO
19)
7312
096
80.
731
0.00
39–
––
2.34
/0.4
1−0
.68
to7.
280
–
11L
ittl
esp
ider
hu
nte
r(A
rach
not
her
alo
ngi
rost
ra)
mtD
NA
(ND
2+C
ytb)
7333
1850
–0.
0025
−1.4
9−2
.4to
−0.5
70.
5–
––
–N
AL
im&
Sh
eldo
n(2
011)
10n
ucl
ear
loci
280
–42
31–
0.00
73−0
.24/
−0.0
2−1
.89
to1.
130.
11–
––
–
1Z
-lin
ked
24–
400
–0.
0042
−1.0
6−1
.59
to−0
.52
0–
––
–
12S
hor
t-ta
iled
babb
ler
(Mal
acoc
incl
am
alac
cen
sis)
mtD
NA
(ND
2+C
ytb)
4636
1915
–0.
0047
−0.5
5/−1
.29
−1.3
3to
0.97
0–
––
–N
A
10n
ucl
ear
loci
420
–43
16–
0.00
52−0
.54/
−0.5
4−1
.93
to1.
140.
04–
––
–
1Z
-lin
ked
37–
404
–0.
0038
−0.1
9/−0
.63
−0.7
8to
0.84
0–
––
–
13H
awai
iA
kepa
(Lox
ops
cocc
ineu
sco
ccin
eus)
mtD
NA
(ND
2+C
R)
186
9721
590.
901
0.00
42−0
.56/
−0.6
7−1
.38
to0.
440
−4.2
8/−2
.57
−16.
19to
0.35
0.5
5–14
Hap
loty
pen
etw
orks
did
not
show
popu
lati
onst
ruct
ure
Red
ing
etal
.(2
010)
2n
ucl
ear
loci
158
1053
50.
284
0.00
13−1
.22
−1.7
3to
−0.7
10.
5−3
.48
−5.7
7to
−1.1
90.
5–
14R
ed-b
acke
dfa
iry
wre
n(M
alu
rus
mel
anoc
eph
alu
s)–
top
end
mtD
NA
(ND
2)14
–46
7–
0.00
70−0
.90
–0
––
–42
No
hap
loty
pes
shar
edbe
twee
nw
hit
e-w
inge
dan
dre
d-ba
cked
fair
yw
ren
sin
mtD
NA
,al
thou
ghth
ere
was
inn
DN
A
Lee
&E
dwar
ds(2
008)
35n
ucl
ear
loci
–15
004
–0.
0143
−0.4
8/−0
.66
−1.7
1to
0.94
0.06
––
–
15R
ed-b
acke
dfa
iry
wre
n(M
alu
rus
mel
anoc
eph
alu
s)–
Cap
eYo
rk
mtD
NA
(ND
2)8
–46
7–
0.00
90−1
.00
–0
––
–26
35n
ucl
ear
loci
–15
004
–0.
0127
−0.2
0/−0
.37
−1.2
9to
1.38
0–
––
16R
ed-b
acke
dfa
iry
wre
n(M
alu
rus
mel
anoc
eph
alu
s)–
Eas
tern
For
est
mtD
NA
(ND
2)8
–46
7–
0.00
80−1
.8–
1–
––
27.5
35n
ucl
ear
loci
–15
004
–0.
0139
0.29
/0.3
4−0
.99
to2.
280
––
–
17W
illo
ww
arbl
er(P
hyl
losc
opu
str
och
ilu
s)
mtD
NA
(Cyt
b)33
–10
41–
0.00
21−2
.28
–1
––
–20
.7N
AB
ensc
het
al.
(200
6)4
nu
clea
rlo
ci15
0–
1513
––
−1.1
4/−1
.03
−2.1
1to
−0.2
70.
33–
––
205.
7
18C
hif
fch
aff
(Ph
yllo
scop
us
coll
ybit
a)
mtD
NA
(Cyt
b)13
–10
41–
0.00
14−1
.95
–1
––
–10
5.9
4n
ucl
ear
loci
32–
1513
––
−1.0
1/−1
.01
−1.3
6to
−0.6
70
––
–23
2.5
19R
ufo
us-
brea
sted
leaf
toss
er(S
cler
uru
ssc
anso
r)
mtD
NA
(ND
2)85
2510
410.
871
0.01
240.
59–
0−0
.54
–0
–H
aplo
type
net
wor
kssh
owed
geog
raph
ical
stru
ctu
rin
g
D’H
orta
etal
.(2
011)
nD
NA
(Fib
7)44
3095
40.
875
0.00
40−0
.41
–0
−22.
04–
1–
Hap
loty
pes
wer
esh
ared
b/w
the
diff
eren
tpo
pula
tion
s
20C
inn
amon
teal
-lo
wla
nd
(An
ascy
anop
tera
cyan
opte
ra)
mtD
NA
(CR
)52
1612
72–
0.00
34−0
.75
–0
−3.4
3–
09.
8H
aplo
type
net
wor
ksh
adm
ixin
gof
A.c
.cy
anop
tera
and
A.c
.or
inom
us
hap
loty
pes
(exc
ept
Hem
oglo
bin
Asu
bun
it)
Wil
son
etal
.(2
012)
7n
DN
A74
3843
–0.
0081
0.73
/0.4
−0.7
5to
2.05
01.
63/2
.95
−7.1
5to
9.64
0.14
21C
inn
amon
teal
-h
igh
lan
d(A
nas
cyan
opte
raor
inom
us)
mtD
NA
(CR
)50
1312
72–
0.00
19−1
.47
–0
−3.3
3–
05.
0
7n
DN
A50
3843
–0.
0060
0.34
/0.3
8−1
.94
to2.
770.
141.
74/1
.92
−2.8
4to
5.99
0.14
22M
arbl
edm
urr
elet
s(B
rach
yram
phu
sm
arm
orat
us)
9n
DN
A12
061
>39
28–
–−0
.01
–0
––
––
Sta
r-li
keh
aplo
type
rela
tion
ship
amon
gm
ost
intr
ons
(dat
an
otpu
blis
hed
)
Con
gdon
etal
.(2
000)
EVALUATING HISTORICAL DEMOGRAPHY 9
© 2014 The Linnean Society of London, Biological Journal of the Linnean Society, 2014, ••, ••–••
Tab
le2.
Con
tin
ued N
um
ber
Spe
cies
/po
pula
tion
Mar
ker
NJ
Hbp
HD
π
Taji
ma’
sD
Fu
’sF
Ne
(104 )
Hap
loty
pen
etw
ork
Ref
eren
ceM
ean
/MD
Ran
ge%
Mea
n/M
DR
ange
%
AM
PH
IBIA
NS
23S
moo
thn
ewt
(Lis
sotr
iton
vula
ris
vulg
aris
)
mtD
NA
(ND
2)22
640
1224
0.91
00.
0080
−0.4
5–
0–
––
36&
29.8
Nad
ach
owsk
a&
Bab
ik(2
009)
8n
DN
A86
6–
4749
0.66
00.
0058
−0.6
1/−0
.82
−1.9
6to
2.14
0.25
––
–
24S
moo
thn
ewt
(Lis
sotr
iton
vula
ris
koss
wig
i)
mtD
NA
(ND
2)21
612
240.
670
0.00
230.
39–
0–
––
8n
DN
A30
4–
4749
0.77
00.
0119
1.20
/1.3
6−1
.72
to2.
40.
38–
––
25C
ane
toad
(Rh
inel
lam
arin
a)
mtD
NA
(Cyt
b)65
1432
7–
0.62
10.
420.
02to
0.81
0−0
.37
−0.7
4to
0.01
026
.9m
tDN
Ash
owed
two
grou
ps(o
ne
wit
hR
.sch
nei
der
ian
dR
AB
R.m
arin
apo
pula
tion
and
the
oth
erL
AB
R.m
arin
a).
nD
NA
show
edtw
ogr
oups
(on
ew
ith
R.m
arin
aR
AB
and
LA
Ban
dth
eot
her
R.s
chn
eid
eri)
Seq
uei
raet
al.
(201
1)3
nD
NA
196
4817
67–
0.47
4−0
.99/
−0.7
6−1
.6to
−0.6
20.
33−5
.39/
−5.1
4−6
.33
to−4
.69
0.67
26C
uru
ruto
ad(R
hin
ella
sch
nei
der
i)
mtD
NA
(Cyt
b)27
532
7–
0.13
1−1
.56
–1
−3.0
7–
114
.3
3n
DN
A84
2717
67–
0.41
7−0
.05/
−0.2
8−0
.63
to0.
760
−2.1
9/−2
.47
−2.6
9to
−1.4
0
27P
uer
toR
ican
frog
–L
uqu
illo
(Ele
uth
erod
acty
lus
port
oric
ensi
s)
2m
tDN
A(C
ytb/
CR
)91
4312
110.
963
0.00
95–
––
−14.
92−2
4.23
to−5
.62
1–
mtD
NA
show
edtw
om
ain
clu
ster
sco
rres
pon
din
gto
LU
Qan
dC
AY
sepa
rate
dby
15m
uta
tion
s.In
nD
NA
,L
UQ
and
CA
Ysh
ared
no
hap
loty
pes
and
ther
ew
asa
divi
sion
base
don
regi
on
Bar
ker
etal
.(2
011)
nD
NA
182
596
0.50
00.
0010
––
–1.
79–
0
28P
uer
toR
ican
frog
–C
ayey
(Ele
uth
erod
acty
lus
port
oric
ensi
s)
2m
tDN
A(C
ytb/
CR
)89
3312
110.
882
0.00
80–
––
−7.6
5−1
2.26
to−3
.03
1–
nD
NA
1810
596
0.79
80.
0030
––
–−2
.83
–1
29M
alag
asy
reed
frog
(Het
erix
alu
sbe
tsil
eo)
mtD
NA
(Cyt
b)17
962
316
0.93
0–
0.40
–0
−12.
91–
1–
Indi
vidu
alcl
ust
ers
wer
est
ar-l
ike
inm
tDN
A.
nD
NA
had
shal
low
diff
eren
tiat
ion
,an
dso
me
hap
loty
pesh
arin
g
Geh
rin
get
al.
(201
2)n
DN
A(R
ag-1
)15
350
1298
0.76
2–
−1.9
1–
1−2
7.67
–1
30M
alag
asy
reed
frog
(Het
erix
alu
sm
adag
asca
rien
sis)
mtD
NA
(Cyt
b)61
2531
60.
904
–0.
15–
0−2
.93
–0
–In
divi
dual
clu
ster
sw
ere
star
-lik
ein
mtD
NA
.n
DN
Ah
adso
me
geog
raph
ical
stru
ctu
re,
alth
ough
som
eh
aplo
type
shar
ing
nD
NA
(Rag
-1)
4310
1298
0.57
9–
−1.7
6–
1−3
.23
–1
10 A. L. FAHEY ET AL.
© 2014 The Linnean Society of London, Biological Journal of the Linnean Society, 2014, ••, ••–••
AM
PH
IBIA
NS
31M
iddl
eE
aste
rntr
eefr
og(H
yla
savi
gnyi
)
mtD
NA
116
4089
30.
948
0.01
02−0
.02
–0
−8.8
6–
0–
mtD
NA
and
nD
NA
wer
eco
nco
rdan
tin
that
they
had
the
sam
em
ain
grou
ps/s
peci
es.
Hap
loty
pes
wer
ege
ogra
phic
ally
stru
ctu
red
inm
tDN
A.
mtD
NA
clad
esw
ere
not
mon
oph
ylet
icat
nD
NA
Gvo
ždík
etal
.(2
010)
2n
DN
A10
418
772
0.66
70.
0028
−0.4
4−1
.11
to0.
230
−3.6
9−7
.79
to0.
400.
5
32M
iddl
eE
aste
rntr
eefr
og(H
yla
feli
xara
bica
)
mtD
NA
3611
896
0.84
80.
0070
1.21
–0
1.18
–0
–
2n
DN
A56
877
20.
393
0.00
19−0
.46
−1.1
5to
0.24
0−0
.70
−1.1
6to
−0.2
40
33M
iddl
eE
aste
rntr
eefr
og(H
yla
orie
nta
li)
mtD
NA
4421
895
0.87
60.
0042
−1.1
5–
0−9
.95
–1
–
2n
DN
A64
1577
20.
544
0.00
42−0
.7−1
.74
to0.
350.
5−2
.56
−3.8
7to
−1.2
50.
5
34D
irt
frog
s(E
leu
ther
odac
tylu
sst
ejn
eger
ian
us)
mtD
NA
(ND
2)29
1151
0–
0.00
40−0
.37/
−0.2
4−1
.49
to0.
490
––
–10
(for
1po
p.)
Cra
wfo
rd(2
003)
nD
NA
(c-m
yc)
7622
351
–0.
0028
−0.3
0/−0
.65
−1.5
2to
1.26
0–
––
35S
tou
tn
ewts
(Pac
hyt
rito
nar
chos
potu
s)
mtD
NA
(ND
2+C
ytb)
10–
1200
––
−0.4
7–
0–
––
–W
uet
al.
(201
3)
2n
DN
A–
1800
––
0.45
−0.4
3to
1.33
0–
––
–
36S
tou
tn
ewts
(Pac
hyt
rito
nbr
evip
es)
mtD
NA
(ND
2+C
ytb)
18–
1200
––
0.38
–0
––
––
2n
DN
A–
1800
––
−0.1
5−0
.18
to−0
.11
0–
––
–
37S
tou
tn
ewts
(Pac
hyt
rito
ngr
anu
losu
s)
mtD
NA
(ND
2+C
ytb)
15–
1200
––
0.69
–0
––
––
2n
DN
A–
1800
––
−0.9
2−1
.49
to−0
.36
0–
––
–
38S
tou
tn
ewts
(Pac
hyt
rito
nin
expe
ctat
us)
mtD
NA
(ND
2+C
ytb)
15–
1200
––
0.63
–0
––
––
2n
DN
A–
1800
––
−0.3
5−0
.98
to0.
280
––
––
39G
arde
nsl
ende
rsa
lam
ande
r(B
atra
chos
eps
maj
or)
mtD
NA
(Cyt
b)12
6–
715
0.98
30.
0520
ns
–0
––
––
Mar
tín
ez-
Sol
ano
etal
.(2
012)
2n
DN
A30
2–
1431
0.87
90.
0075
P<
0.05
–1
––
––
40E
ast
Asi
anbr
own
frog
s(R
ana
chen
sin
ensi
ssp
ecie
sco
mpl
ex)
mtD
NA
(Cyt
b)39
412
680
0–
–−0
.41/
−0.3
1−1
.97
to0.
960.
5−6
.30/
−0.9
2−2
5.69
to2.
340.
25–
nD
NA
net
wor
ksw
ere
not
com
plet
ely
com
pati
ble,
nor
wh
ere
they
com
pati
ble
toth
em
tDN
A
Zh
ouet
al.
(201
2)5
nD
NA
131
7021
26–
–−0
.17/
−0.1
5−1
.84
to1.
890.
05−1
.08/
−0.5
7−9
.01
to2.
180.
1–
EVALUATING HISTORICAL DEMOGRAPHY 11
© 2014 The Linnean Society of London, Biological Journal of the Linnean Society, 2014, ••, ••–••
Tab
le2.
Con
tin
ued
Nu
mbe
rS
peci
es/
popu
lati
onM
arke
rN
JH
bpH
Dπ
Taji
ma’
sD
Fu
’sF
Ne
(104 )
Hap
loty
pen
etw
ork
Ref
eren
ceM
ean
/MD
Ran
ge%
Mea
n/M
DR
ange
%
Rep
tile
s41
Wes
tern
rock
skin
k(T
rach
ylep
issu
lcat
a)–
Nor
ther
n
mtD
NA
(ND
2)86
–10
56–
0.04
291.
66–
0−0
.22
–0
–n
DN
Ah
aplo
type
net
wor
kssh
owsh
arin
gof
alle
les
betw
een
Cen
tral
and
Sou
ther
nre
gion
s,an
dN
orth
ern
regi
onth
eal
lele
sar
ety
pica
lly
sepa
rate
dfr
omth
eot
her
two
regi
ons
(an
dar
eth
ean
cest
ral
alle
les)
.T
his
issi
mil
arto
the
mtD
NA
(San
dC
shar
eso
me
alle
les,
wh
ile
Nal
lele
sar
edi
stin
ctly
sepa
rate
)
Por
tik
etal
.(2
011)
nD
NA
-co
mbi
ned
–26
44–
0.00
73−0
.31
–0
−6.3
–1
–
42W
este
rnro
cksk
ink
(Tra
chyl
epis
sulc
ata)
–C
entr
al
mtD
NA
(ND
2)–
1056
–0.
0071
−2.2
6–
1−2
5.03
–0
–
nD
NA
-co
mbi
ned
–26
44–
0.00
33−0
.42
–0
−24.
74–
0–
43W
este
rnro
cksk
ink
(Tra
chyl
epis
sulc
ata)
–S
outh
ern
mtD
NA
(ND
2)–
1056
–0.
0045
−2.2
–1
−25.
94–
0–
nD
NA
-co
mbi
ned
–26
44–
0.00
15−0
.13
–0
−26
–0
–
44M
edit
erra
nea
nh
ouse
geck
o(H
emid
acty
lus
turc
icu
s)
mtD
NA
(Cyt
b+12
S)
100
2367
9–
0.00
18−1
.46/
−1.5
1−1
.24
to−1
.64
0.67
––
––
mtD
NA
net
wor
kssh
owed
two
sepa
rate
lin
eage
s,n
DN
Adi
dn
ot(n
oph
ylog
eogr
aph
ical
patt
ern
)
Rat
oet
al.
(201
1)
2n
DN
A12
2–
1174
–0.
0018
−0.1
6/−0
.30
−0.4
0to
0.32
0–
––
–
45C
omm
ongr
oun
dsk
ink
(Sci
nce
lla
late
rali
s)
mtD
NA
(Cyt
b)36
631
411
770.
999
0.05
08−0
.02
–0
−23.
75–
158
–760
nD
NA
net
wor
kh
adla
rge
amou
nt
ofh
aplo
type
shar
ing
Jack
son
&A
ust
in(2
009)
8n
DN
A63
285
4673
0.77
00.
0055
−1.8
7/−1
.89
−2.4
5to
−1.0
30.
88−1
7.28
/−19
.11
−25.
0to
−6.2
0.88
46G
reen
anol
e(A
nol
isca
roli
nen
sis)
mtD
NA
(ND
2)19
112
811
720.
987
0.02
34−1
.52
–0
−34.
54–
0–
Toll
iset
al.
(201
2)10
nD
NA
915
107
6218
0.51
50.
0023
−0.7
0/−0
.65
−1.8
3to
0.67
0−4
.04/
−1.7
9−1
2.54
to−0
.60
–
Spe
cies
nam
e,to
tal
nu
mbe
rof
indi
vidu
als
orse
quen
ces
exam
ined
(N),
tota
ln
um
ber
ofh
aplo
type
sor
alle
les
(H),
tota
lle
ngt
hof
base
pair
s(b
p),
mea
nn
ucl
eoti
dedi
vers
ity
(π),
mea
nh
aplo
type
dive
rsit
y(H
D),
mea
nan
dm
edia
n(M
D)
ofn
eutr
alit
yte
stst
atis
tics
,ra
nge
inn
eutr
alit
yte
stst
atis
tics
,pe
rcen
tage
ofn
eutr
alit
yst
atis
tics
that
wer
esi
gnifi
can
tly
neg
ativ
e(%
),an
def
fect
ive
popu
lati
onsi
ze(N
e).
NA
,n
otav
aila
ble.
12 A. L. FAHEY ET AL.
© 2014 The Linnean Society of London, Biological Journal of the Linnean Society, 2014, ••, ••–••
the other is philopatric) can change the evolutionaryhistory of sex-specific chromosomes (e.g. mtDNA, Y,and Z chromosomes) relative to autosomes. Thus,investigators must carefully consider the use andinterpretation of these markers when studyingspecies with sex-biased dispersal (Prugnolle & deMeeus, 2002).
Dispersal behaviour in mammals and birds differ-entially impact the evolutionary history of theirnuclear and mitochondrial genomes. In mammals,natal and breeding dispersal is typical of males,although the pattern is reversed in birds (Greenwood,1980; Liberg & von Schantz, 1985; Prugnolle & deMeeus, 2002). Thus, in both mammals and birds, theheterogametic sex is usually the dispersing sex. Inmammals and other species with female philopatry,mtDNA genetic differentiation between populationswill be higher than with nDNA markers (Hoelzer,1997; Prugnolle & de Meeus, 2002). Accordingly, morepopulation structure is likely in mtDNA because thefemales remain near their natal site, whereas nDNAmay show admixture between populations (Palumbi &Baker, 1994; Firestone et al., 1999; Hare, Cipriano &Palumbi, 2002; Tchaicka et al., 2007). The oppositeoccurs in birds, where female dispersal can reducepopulation differentiation in mtDNA (Lee & Edwards,2008). Because exceptions to the general sex-biasedpatterns in mammals and birds occur (Greenwood,1980; Anser erythropus: Ruokonen et al., 2010),knowing the ecology of the study species is important.Dispersal tendencies are not well-characterized inreptiles and amphibians (Smith & Green, 2006; Mooreet al., 2008), although some reptile species are knownto exhibit male-biased dispersal (Crocodylus johnstoni:Tucker et al., 1998; Anolis roquet: Johansson,Surget-Groba & Thorpe, 2008; Hofmann et al., 2012),and so their patterns of genetic differentiation shouldparallel that of most mammals. However, in otherspecies, sex-biased dispersal can vary among popula-tions of the same species (laticaudine sea kraits: Lane& Shine, 2011; Odorrana schmackeri: Wang, Lane &Ding, 2012). Regardless of the direction of bias, thesesex-specific behavioural tendencies of individualorganisms can obscure molecular insights into thehistorical demography of populations.
Population expansion following a bottleneck shouldproduce an excess of low-frequency/rare mutationsand thus gene trees should exhibit a star-like topol-ogy whereby rare alleles will typically differ by onenucleotide from an ancestral sequence (Slatkin &Hudson, 1991). Dispersal, however, will dampen sig-natures of population expansion by introducing diver-gent alleles from outside the local population; thisskews neutrality test statistics towards positivevalues. With male-biased dispersal, mtDNA should bemore structured and thus have more negative neu-
trality test statistics in a population experienc-ing expansion than would nDNA alleles (which expe-rience more mixing between populations/subpopulations). With female-biased dispersal, bothmtDNA and nDNA genes are dispersed and thusthere should be more similarity in neutrality statis-tics between nDNA and mtDNA.
Table 2 shows that, for Tajima’s D, mammals,amphibians, and reptiles were similar in that noneindicated one marker type (nDNA or mtDNA) beingmore negative on average than the other (Fig. 3A). Inbirds, mtDNA values for Tajima’s D were more nega-tive than the corresponding nDNA values (Fig. 3A);this contradicts the prediction that female-biaseddispersal would reduce mtDNA structuring, and sug-gests that other evolutionary factors, such as incom-plete lineage sorting in nDNA, might have a greatereffect than sex-biased dispersal. Note that, regardlessof marker or taxon, mean Tajima’s D values werenegatively skewed and thus deviated from neutrality.This finding is consistent with the findings of Wares(2009), who reported that mitochondrial cytochromeoxidase I sequences departed from neutrality acrosstaxonomic groups (all had negative mean values ofTajima’s D).
The mean Fu’s F for mammals, birds, and amphib-ians (Fig. 3B) tended to have more negative mtDNAvalues (80–100% of the time) than nDNA values,perhaps because of greater mtDNA structure in specieswith male-biased dispersal (similar to most mammals).Thus, the expected pattern is not apparent with regardto Tajima’s D, although mammals exhibit more nega-tive values for Fu’s F, the most powerful statistic fortesting population expansion (Fu, 1997; Ramos-Onsins& Rozas, 2002; Ramírez-Soriano et al., 2008). Reptileswere evenly split between nDNA and mtDNA exhibit-ing more negative values, and thus did not display aclear pattern.
When contrasting mtDNA and nDNA data, incom-plete lineage sorting is more often associated withnDNA. In practice, this means that nDNA mayprovide little insight into recent historical demogra-phy, especially when Ne is high. The extent of disper-sal (i.e. the proportion of individuals that disperseand the mean dispersal distance) and sex-bias varyamong taxa, and such natural history data can helpdetermine the most appropriate molecular methodol-ogy for demographic inference (i.e. whether to usemtDNA, nDNA, sex-linked markers, or a combinationof multiple markers).
FUTURE DIRECTIONS
Next generation sequencing (NGS) will play a majorrole in future studies of historical demography by
EVALUATING HISTORICAL DEMOGRAPHY 13
© 2014 The Linnean Society of London, Biological Journal of the Linnean Society, 2014, ••, ••–••
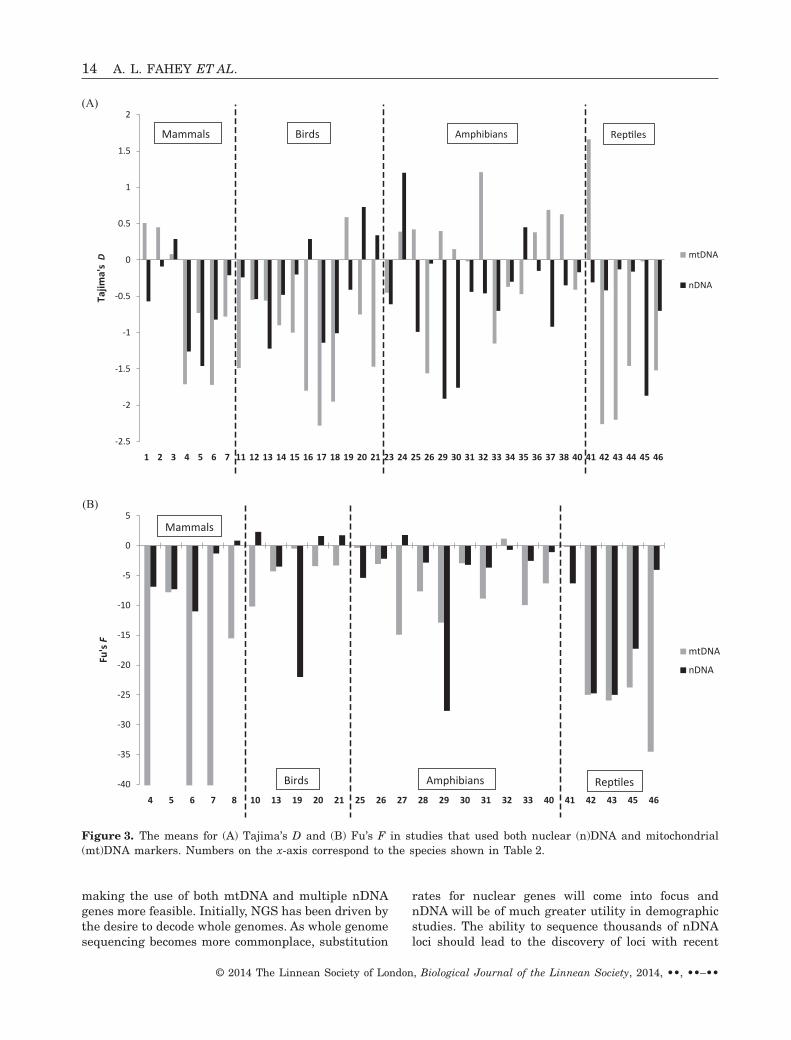
making the use of both mtDNA and multiple nDNAgenes more feasible. Initially, NGS has been driven bythe desire to decode whole genomes. As whole genomesequencing becomes more commonplace, substitution
rates for nuclear genes will come into focus andnDNA will be of much greater utility in demographicstudies. The ability to sequence thousands of nDNAloci should lead to the discovery of loci with recent
(A)
-2.5
-2
-1.5
-1
-0.5
0
0.5
1
1.5
2
1 2 3 4 5 6 7 11 12 13 14 15 16 17 18 19 20 21 23 24 25 26 29 30 31 32 33 34 35 36 37 38 40 41 42 43 44 45 46
Tajim
a's D mtDNA
nDNA
Rep lesMammals Birds Amphibians
(B)
-40
-35
-30
-25
-20
-15
-10
-5
0
5
4 5 6 7 8 10 13 19 20 21 25 26 27 28 29 30 31 32 33 40 41 42 43 45 46
Fu's F
mtDNA
nDNA
Mammals
Birds Amphibians Rep les
Figure 3. The means for (A) Tajima’s D and (B) Fu’s F in studies that used both nuclear (n)DNA and mitochondrial(mt)DNA markers. Numbers on the x-axis correspond to the species shown in Table 2.
14 A. L. FAHEY ET AL.
© 2014 The Linnean Society of London, Biological Journal of the Linnean Society, 2014, ••, ••–••
coalescence that might better complement mDNA.Zhan et al. (2013) used whole genome sequences ofperegrine and saker falcons to model the demographichistory of both species. They used hundreds of thou-sands of polymorphisms to infer that both species hadincurred Pleistocene bottlenecks, although the per-egrine underwent a second bottleneck approximately20 000 years ago (presumably because of habitatdiminution).
NGS has also led to increased sample sizes; robustpopulation studies require the ability to sequencemultiple genes from many individuals. One way totag and multiplex multiple individuals with NGS isrestriction-site associated DNA (RAD) tags (Bairdet al., 2008; Hohenlohe et al., 2010). This methodallows for the identification of thousands of SNPsfrom multiple individuals for population genomicstudies, and has been beneficial in studies of quanti-tative trait loci. RAD tags allow investigators tosequence a random sample of the genome in multipleindividuals, although they do not enable researchersto target specific genes. Parallel tagged sequencingallows for the identification of double-stranded DNA,such as polymerase chain reaction products(amplicons), within a pooled NGS project (Meyeret al., 2008; O’Neill et al., 2012). O’Neill et al. (2012)used this approach for a large-scale tiger salamanderproject to sequence 95 nuclear loci from 93 individu-als; using a similar approach, Puritz et al. (2012)sequenced five nDNA loci for 20 individuals in each of16 different populations of two sea star species. Thesestudies illustrate the potential power of NGS forrevealing the evolutionary history of populations.
CONCLUDING REMARKS
Historical demographic analyses are generally basedon departures from the ideal population: one thatevolves neutrally, has no recombination or selection,and has equal effective population sizes between thesexes. In reality, we do not know the extent to whichmost species deviate from these ideal conditions.Adaptive potential and dispersal ability can factorinto the effects that climate and habitat changes willhave on a species. For example, the finding thatpopulations of butterflies lacked barriers to gene flowallowed investigators to determine whether geneticdrift or adaptive change created observed patterns ofgenetic variation (Norgate et al., 2009).
The accurate timing of population growth or declinecan help determine whether a particular geographicalbarrier has been the historical cause of differentiationbetween two populations or whether it simply limitscontemporary gene flow (Cheviron et al., 2005). Forexample, Qu et al. (2010) found that avian species onthe Tibetan plateau experienced population expan-
sion concomitant with the retreat of the glaciers,whereas species on the edge of the plateau were lessaffected by ice and therefore showed more stablepopulation sizes throughout the Pleistocene. Theattributes of a species (e.g. habitat preferences anddispersal ability), in addition to their evolutionaryhistory, determine contemporary population structureand future adaptation capabilities.
Knowledge of the level of sex-biased dispersal, rela-tive timeframes of species divergence, and effectivepopulation size are needed for informed decisions onthe best marker type for any given study where timeand/or resources are limited. For example, specieswith male-biased dispersal should have more mtDNAstructure and therefore the use of nDNA markers (inaddition to mtDNA) will help prevent biases whendetermining population structure. The timing ofdiversification is another important parameter thatinfluences marker choice. Whereas some sisterspecies separations date to the Pliocene, many verte-brate divergences occurred during the Pleistocene(Avise & Walker, 1998) and thus mtDNA genes shouldprovide more resolution than nDNA because of thelimited time for sorting of nDNA lineages, dependingon Ne.
The design, implementation, and interpretation ofdemographic studies on evolutionary timeframes arecomplex. Nevertheless, evolutionary biologists haveused contemporary DNA sequence data to providedetailed insights into recent historical demography.These studies are usually synthetic, requiring theassimilation of natural history, geology, climate, andevolutionary data. We expect that with the recent andimpending advances in molecular methodologies,novel analytical methods (particularly those that dealwith genome-level data) will emerge and provide evenmore comprehensive insight into historical processes.As we better understand organic evolution inresponse to historic environmental factors, we willacquire the capacity to better predict future demo-graphic trends in the face of a changing planet.
ACKNOWLEDGEMENTS
We thank the Provost’s Office at Purdue Universityfor financial support through the University FacultyScholar program (JAD), as well as the Curators of theUniversity of Missouri and the Alexander vonHumboldt Foundation (RER). We also thank threeanonymous reviewers for their insightful commentsthat helped improve this manuscript.
REFERENCES
Arbogast BS, Edwards SV, Wakeley J, Beerli P,Slowinski JB. 2002. Estimating divergence times from
EVALUATING HISTORICAL DEMOGRAPHY 15
© 2014 The Linnean Society of London, Biological Journal of the Linnean Society, 2014, ••, ••–••
molecular data on phylogenetic and population genetictimescales. Annual Review of Ecology and Systematics 33:707–740.
Avise JC, Walker D. 1998. Pleistocene phylogeographiceffects on avian populations and the speciation process.Proceedings of the Royal Society of London Series B, Bio-logical Sciences 265: 457–463.
Axelsson E, Webster MT, Smith NGC, Burt DW, EllegrenH. 2005. Comparison of the chicken and turkey genomesreveals a higher rate of nucleotide divergence onmicrochromosomes than macrochromosomes. GenomeResearch 15: 120–125.
Baird NA, Etter PD, Atwood TS, Currey MC, Shiver AL,Lewis ZA, Selker EU, Cresko WA, Johnson EA. 2008.Rapid SNP discovery and genetic mapping using sequencedRAD markers. PLoS ONE 3: e3376.
Ballard JWO, Whitlock MC. 2004. The incomplete naturalhistory of mitochondria. Molecular Ecology 13: 729–744.
Barker BS, Waide RB, Cook JA. 2011. Deep intra-islanddivergence of a montane forest endemic: phylogeography ofthe Puerto Rican frog Eleutherodactylus portoricensis(Anura: Eleutherodactylidae). Journal of Biogeography 38:2311–2325.
Bazin E, Glemin S, Galtier N. 2006. Population size doesnot influence mitochondrial genetic diversity in animals.Science 31: 570–571.
Bellemain E, Bermingham E, Ricklefs RE. 2008. Thedynamic evolutionary history of the bananaquit (Coerebaflaveola) in the Caribbean revealed by a multigene analysis.BMC Evolutionary Biology 8: 240.
Bensch S, Irwin DE, Irwin JH, Kvist L, Åkesson S. 2006.Conflicting patterns of mitochondrial and nuclear DNAdiversity in Phylloscopus warblers. Molecular Ecology 15:161–171.
Bos DH, Gopurenko D, Williams RN, DeWoody JA. 2008.Inferring population history and demography usingmicrosatellites, mitochondrial DNA, and major histocompat-ibility complex (MHC) genes. Evolution 62: 1458–1468.
Brace S, Barnes I, Powell A, Pearson R, Woolaver LG,Thomas MG, Turvey ST. 2012. Population history of theHispaniolan hutia Plagiodontia aedium (Rodentia:Capromyidae): testing the model of ancient differentiationon a geographically complex Caribbean island. MolecularEcology 21: 2239–2253.
Bromham L, Penny D. 2003. The modern molecular clock.Nature Reviews Genetics 4: 216–224.
Brown WM, George M, Wilson A. 1979. Rapid evolution ofanimal mitochondrial DNA. Proceedings of the NationalAcademy of Sciences of the United States of America 72:1967–1971.
Cheviron ZA, Hackett SJ, Capparella AP. 2005. Complexevolutionary of a Neotropical lowland forest bird(Lepidothrix coronata) and its implications for historicalhypotheses of the origin of Neotropical avian diversity.Molecular Phylogenetics and Evolution 36: 338–357.
Clark AG. 1990. Inference of haplotypes from PCR-amplifiedsamples of diploid populations. Molecular Biology and Evo-lution 7: 111–122.
Congdon BC, Piatt JF, Martin K, Friesen VL. 2000.Mechanisms of population differentiation in marbledmurrelets: historical versus contemporary processes. Evolu-tion 54: 974–986.
Crawford AJ. 2003. Huge populations and old species ofCosta Rican and Panamanian dirt frogs inferred frommitochondrial and nuclear gene sequences. MolecularEcology 12: 2525–2540.
CSAC. 2005. Chimpanzee sequencing and analysis consor-tium initial sequence of the chimpanzee genome and com-parison with the human genome. Nature 437: 69–87.
D’Horta FM, Cabanne GS, Meyer D, Miyaki CY. 2011.The genetic effects of Late Quaternary climatic changes overa tropical latitudinal gradient: diversification of an AtlanticForest passerine. Molecular Ecology 20: 1923–1935.
Dickerson BR, Ream RR, Vignieri SN, Bentzen P. 2010.Population structure as revealed by mtDNA andmicrosatellites in northern fur seals, Callorhinus ursinus,throughout their range. PLOS ONE 5: e10671.
Drovetski SV, Zink RM, Ericson PGP, Fadeev IV. 2010.A multilocus study of pine grosbeak phylogeography sup-ports the pattern of greater intercontinental divergence inHolarctic boreal forest birds than in birds inhabiting otherhigh-latitude habitats. Journal of Biogeography 37: 696–706.
Drummond AJ, Rambaut A, Shapiro B, Pybus OG. 2005.Bayesian coalescent inference of past population dynamicsfrom molecular sequences. Molecular Biology and Evolution22: 1185–1192.
Dupuis JR, Roe AD, Sperling FAH. 2012. Multi-locusspecies delimitation in closely related animals and fungi:one marker is not enough. Molecular Ecology 21: 4422–4436.
Edwards SV, Kingan SB, Calkins JD, Balakrishnan CN,Jennings WB, Swanson WJ, Sorenson MD. 2005. Spe-ciation in birds: genes, geography, and sexual selection.Proceedings of the National Academy of Sciences of theUnited States of America102: 6550–6557.
Ellegren H. 2007. Molecular evolutionary genomics of birds.Cytogenetic and Genome Research 117: 120–130.
Eo SH, DeWoody JA. 2010. Evolutionary rates ofmitochondrial genomes correspond to diversification ratesand to contemporary species richness in birds and reptiles.Proceedings of the Royal Society B 277: 3587–3592.
Fahey AL, Latta SC, Ricklefs R, DeWoody JA. 2012.Comparative historical demography of migratory and non-migratory birds from the Caribbean island of Hispaniola.Evolutionary Biology 39: 400–414.
Felsenstein J. 1992. Estimating effective population sizefrom samples of sequences: inefficiency of pairwise andsegregating sites as compared to phylogenetic estimates.Genetical Research 59: 139–147.
Ferrero ME, Blanco-Aguiar JA, Lougheed SC,Sánchez-Barbudo I, de Nova PJG, Villafuerte R,Dávila JA. 2011. Phylogeography and genetic structure ofthe red-legged partridge (Alectoris rufa): more evidence forrefugia within the Iberian glacial refugium. MolecularEcology 20: 2628–2642.
16 A. L. FAHEY ET AL.
© 2014 The Linnean Society of London, Biological Journal of the Linnean Society, 2014, ••, ••–••
Firestone KB, Elphinstone MS, Sherwin WB, HouldenBA. 1999. Phylogeographical population structure of thetiger quolls Dasyurus maculatus (Dasyuridae: Marsupialia),an endangered carnivorous marsupial. Molecular Ecology 8:1613–1625.
Förster DW, Gündüz I, Nunes AC, Gabriel S,Ramalhinho MG, Mathias ML, Britton-Davidian J,Searle JB. 2009. Molecular insights into the colonizationand chromosomal diversification of Madeiran house mice.Molecular Ecology 18: 4477–4494.
Fu Y. 1997. Statistical tests of neutrality of mutations againstpopulation growth, hitchhiking and background selection.Genetics 147: 915–925.
Fu Y, Li WH. 1993. Statistical tests of neutrality of muta-tions. Genetics 133: 693–709.
Galbreath KE, Cook JA, Eddingsaas AA, DeChaine EG.2011. Diversity and demography in Beringia: multilocustests of paleodistribution models reveal the complex historyof arctic ground squirrels. Evolution 65: 1879–1896.
Galtier N, Nabholz B, Glémin S, Hurst GDD. 2009.Mitochondrial DNA as a marker of molecular diversity: areappraisal. Molecular Ecology 18: 4541–4550.
Gehring PS, Pabijan M, Randrianirina JE, Glaw F,Vences M. 2012. The influence of riverine barriers onphylogeographic patterns of Malagasy reed frogs(Heterixalus). Molecular Phylogenetics and Evolution 64:618–632.
Girman DJ, Vilá C, Geffen E, Creel S, Mills MGL,McNutt JW, Ginsberg J, Kat PW, Mamiya KH, WayneRK. 2001. Patterns of population subdivision, gene flow andgenetic variability in the African wild dog (Lycaon pictus).Molecular Ecology 10: 1703–1723.
Greenwood PJ. 1980. Mating systems, philopatry and dis-persal in birds and mammals. Animal Behaviour 28: 1140–1162.
Gvoždík V, Moravec J, Klütsch C, Kotlík P. 2010.Phylogeography of the Middle Eastern tree frogs (Hyla,Hylidae, Amphibia) as inferred from nuclear and mitochon-drial DNA variation, with a description of a new species.Molecular Phylogenetics and Evolution 55: 1146–1166.
Hare MP, Cipriano F, Palumbi SR. 2002. Genetic evidenceon the demographic of speciation in allopatric dolphinspecies. Evolution 56: 804–816.
Harpending HC, Sherry AR, Rogers AR, Stoneking M.1993. Genetic structure of ancient human populations.Current Anthropology 34: 483–496.
Ho SYW. 2007. Calibrating molecular estimates of substitu-tion rates and divergence times in birds. Journal of AvianBiology 38: 409–414.
Ho SYW, Lanfear R, Bromham L, Phillips MJ, SoubrierJ, Rodrigo AG, Cooper A. 2011. Time-dependent rates ofmolecular evolution. Molecular Ecology 20: 3087–3101.
Ho SYW, Shapiro B. 2011. Skyline-plot methods for estimat-ing demographic history from nucleotide sequences. Molecu-lar Ecology Resources 11: 423–434.
Hoelzer GA. 1997. Inferring phylogenies from mtDNA vari-ation: mitochondrial-gene trees versus nuclear-gene treesrevisited. Evolution 51: 622–626.
Hofmann S, Fritzsche P, Solhøy T, Dorge T, Miehe G.2012. Evidence of sex-biased dispersal in Thermophisbaileyi inferred from microsatellite markers. Herpetologia68: 514–522.
Hohenlohe PA, Bassham S, Etter PD, Stiffler N, JohnsonEA, Cresko WA. 2010. Population genomics of paralleladaptation in threespine stickleback using sequenced RADtags. PLoS Genetics 6: e1000862.
Hope AG, Speer KA, Demboski JR, Talbot SL, Cook JA.2012. A climate for speciation: rapid spatial diversificationwithin the Sorex cinereus complex of shrews. MolecularPhylogenetics and Evolution 64: 671–684.
Hope AG, Waltari E, Fedorov VB, Goropashnaya AV,Talbot SL, Cook JA. 2011. Persistence and diversificationof the Holarctic shrew, Sorex tundrensis (Family Soricidae),in response to climate change. Molecular Ecology 20: 4346–4370.
Hulva P, Fornusková A, Chudárková A, Evin A,Allegrini B, Benda P, Bryja J. 2010. Mechanisms ofradiation in a bat group from the genus Pipistrellus inferredby phylogeography, demography and population genetics.Molecular Ecology 19: 5417–5431.
Jackson ND, Austin CC. 2009. The combined effects ofrivers and refugia generate extreme cryptic fragmentationwithin the common ground skink (Scincella lateralis). Evo-lution 64: 409–428.
Johansson H, Surget-Groba Y, Thorpe RS. 2008.Microsatellite data show evidence for male-biased dispersalin the Caribbean lizard Anolis roquet. Molecular Ecology 17:4425–4432.
Johns GC, Avise JC. 1998. A comparative summary ofgenetic distances in the vertebrates from the mitochondrialcytochrome b gene. Molecular Biology and Evolution 15:1481–1490.
Ju J, Yang M, Xu S, Zhou K, Yang G. 2012. High levelpopulation differentiation of finless porpoises (Neophocaenaphocaenoides) in Chinese waters revealed by sequence vari-ability of four nuclear introns. Molecular Biology Reports39: 7755–7762.
Karl SA, Toonen RJ, Grant WS, Bowen BW. 2012.Common misconceptions in molecular ecology: echoes of themodern synthesis. Molecular Ecology 21: 4171–4189.
Lane A, Shine R. 2011. Intraspecific variation in the direc-tion and degree of sex-biased dispersal among sea-snakepopulations. Molecular Ecology 20: 1870–1876.
Lee JY, Edwards SV. 2008. Divergence across Australia’sCarpentarian barrier: statistical phylogeography of the red-backed fairy wren (Malurus melanocephalus). Evolution 62:3117–3134.
Li H, Durbin R. 2011. Inference of human population historyfrom individual whole-genome sequences. Nature 475: 493–496.
Liberg O, von Schantz T. 1985. Sex-biased philopatry anddispersal in birds and mammals: the Oedipus hypothesis.American Naturalist 126: 129–135.
Lim HC, Sheldon FH. 2011. Multilocus analysis of theevolutionary dynamics of rainforest bird populations inSoutheast Asia. Molecular Ecology 20: 3414–3438.
EVALUATING HISTORICAL DEMOGRAPHY 17
© 2014 The Linnean Society of London, Biological Journal of the Linnean Society, 2014, ••, ••–••
Lloyd BD. 2003. The demographic history of the NewZealand short-tailed bat Mystacina tuberculata inferredfrom modified control region sequences. Molecular Ecology12: 1895–1911.
Lopes IF, Miño CI, Del Lama SN. 2007. Genetic diversityand evidence of recent demographic expansion in waterbirdpopulations from the Brazilian Pantanal. BrazialianJournal of Biology 67: 849–857.
Lovette IJ. 2004. Mitochondrial dating and the mixedsupport for the ‘2% rule’ in birds. The Auk 121: 1–6.
Mao X, He G, Hua P, Jones G, Zhang S, Rossiter SJ.2012. Historical introgression and the persistence of ghostalleles in the intermediate horseshoe bat (Rhinolophusaffinis). Molecular Ecology 22: 1035–1050.
Marin JC, González BA, Poulin E, Casey CS, JohnsonWE. 2012. The influence of the arid Andean high plateau onthe phylogeography and population genetics of guanaco(Lama guanicoe) in South America. Molecular Ecology 22:463–482.
Martínez-Solano Í, Peralta-García A, Jockusch EL,Wake DB, Vázquez-Domínguez E, Parra-Olea G.2012. Molecular systematic of Batrachoseps (Caudata,Plethodontidae) in southern California and Baja California:mitochondrial-nuclear DNA discordance and the evolution-ary history of B. major. Molecular Phylogenetics and Evo-lution 63: 131–149.
Merilä J, Björklund M, Baker AJ. 1997. Historical demog-raphy and present day population structure of the green-finch, Carduelis chloris – an analysis of mtDNA control-region sequences. Evolution 51: 946–956.
Meyer M, Stenzel U, Hofreiter M. 2008. Parallel taggedsequencing on the 454 platform. Nature Protocols 3: 267–278.
MGSC. 2002. Mouse genome sequencing consortium: initialsequencing and comparative analysis of the mouse genome.Nature 420: 520–562.
Moore JA, Miller HC, Daugherty CH, Nelson NJ. 2008.Fine-scale genetic structure of a long-lived reptile reflectsrecent habitat modification. Molecular Ecology 17: 4630–4641.
Moore WS. 1995. Inferring phylogenies from mtDNA varia-tion: mitochondrial-gene trees versus nuclear-gene trees.Evolution 49: 718–726.
Moritz C, Dowlin TE, Brown WM. 1987. Evolution ofanimal mitochondrial DNA: relevance for population biologyand systematic. Annual Review of Ecology and Systematics18: 269–292.
Nabholz B, Glémin S, Galtier N. 2008. Strong variation ofmitochondrial mutation rate across mammals – the longev-ity hypothesis. Molecular Biology and Evolution 25: 120–130.
Nadachowska K, Babik W. 2009. Divergence in the face ofgene flow: the case of two newts (Amphibia: Salaman-dridae). Molecular Biology and Evolution 26: 829–841.
Nei M. 1987. Molecular evolutionary genetics. New York, NY:Columbia University Press.
Neumann K, Michaux JR, Maak S, Jansman HAH,Kayser A, Mundt G, Gattermann R. 2005. Genetic
spatial structure of European common hamsters (Cricetuscricetus) − a result of repeated range expansion and demo-graphic bottlenecks. Molecular Ecology 14: 1473–1483.
Norgate M, Chamings J, Pavlova A, Bull JK, MurrayND, Sunnucks P. 2009. Mitochondrial DNA indicates latePleistocene divergence of populations of Heteronymphamerope, an emerging model in environmental changebiology. PLoS ONE 4: e7950.
O’Neill EM, Schwartz R, Bullock CT, Williams JS,Shaffer HB, Aguilar-Miguel X, Parra-Olea G, WeisrockDW. 2012. Parallel tagged amplicon sequencing revealsmajor lineages and phylogenetic structure in the NorthAmerican tiger salamander (Ambystoma tigrinum) speciescomplex. Molecular Ecology 22: 111–129.
Palumbi SR, Baker CS. 1994. Contrasting population struc-ture from the nuclear intron sequences and mtDNA ofhumpback whales. Molecular Biology and Evolution 11:426–435.
Palumbi SR, Cipriano F, Hare MP. 2001. Predictingnuclear gene coalescence from mitochondrial data: thethree-times rule. Evolution 55: 859–868.
Paupério J, Herman JS, Melo-Ferreira J, Jaarola M,Alves PC, Searle JB. 2012. Cryptic speciation in the fieldvole: a multilocus approach confirms three highly divergentlineages in Eurasia. Molecular Ecology 21: 6015–6032.
Peters JL, Gretes W, Omland KE. 2005. Late Pleistocenedivergence between eastern and western populations ofwood ducks (Aix sponsa) inferred by the ‘isolation withmigration’ coalescent method. Molecular Ecology 14: 3407–3418.
Portik DM, Bauer AM, Jackman TR. 2011. Bridging thegap: western rock skinks (Trachylepis sulcata) have a shorthistory in South Africa. Molecular Ecology 20: 1744–1758.
Prado-Martinez J, Sudmant PH, Kidd JM, Li H, KelleyJL, Lorente-Galdos B, Veeramah KR, Woerner AE,O’Connor TD, Santpere G, Cagan A, Theunert C,Casals F, Laayouni H, Munch K, Hobolth A, HalagerAE, Malig M, Hernandez-Rodriguez J, Hernando-Herraez I, Prüfer K, Pybus M, Johnstone L,Lachmann M, Alkan C. 2013. Great ape genetic diversityand population history. Nature 499: 471–475.
Prugnolle F, de Meeus T. 2002. Inferring sex-biased dis-persal from population genetic tools: a review. Heredity 88:161–165.
Ptak SE, Przeworski M. 2002. Evidence for populationgrowth in humans is confounded by fine-scale populationstructure. Trends in Genetics 18: 559–563.
Puritz JB, Addison JA, Toonen RJ. 2012. Next-generationphylogeography: a targeted approach for multilocussequencing of non-model organisms. PLoS ONE 7: e34241.
Pybus OG, Rambaut A, Harvey PH. 2000. An integratedframework for the inference of viral population history fromreconstructed genealogies. Genetics 155: 1429–1437.
Qu Y, Lei F, Zhang R, Lu X. 2010. Comparativephylogeography of five avian species: implications for Pleis-tocene evolutionary history in the Qinghai-Tibetan plateau.Molecular Ecology 19: 338–351.
18 A. L. FAHEY ET AL.
© 2014 The Linnean Society of London, Biological Journal of the Linnean Society, 2014, ••, ••–••
Qu Y, Zhang R, Quan Q, Song G, Li SH, Lei F. 2012.Incomplete lineage sorting or secondary admixture: disen-tangling historical divergence from recent gene flow in thevinous-throated parrotbill (Paradoxornis webbianus).Molecular Ecology 21: 6117–6133.
Ramírez-Soriano A, Ramos-Onsins SE, Rozas J, CalafellF, Navarro A. 2008. Statistical analysis of neutrality testsunder demographic expansions, contractions, and bottle-necks with recombination. Genetics 179: 555–567.
Ramos-Onsins SE, Rozas J. 2002. Statistical properties ofnew neutrality tests against population growth. MolecularBiology and Evolution 19: 2092–2100.
Rato C, Carranza S, Harris DJ. 2011. When selectiondeceives phylogeographic interpretation: the case of theMediterranean house gecko, Hemidactylus turcicus(Linnaeus, 1758). Molecular Phylogenetics and Evolution58: 365–373.
Reding DM, Freed LA, Cann RL, Fleischer RC. 2010.Spatial and temporal patterns of genetic diversity in anendangered Hawaiian honeycreeper, the Hawaii Akepa(Loxops coccineus coccineus). Conservation Genetics 11: 225–240.
Rogers AR. 1995. Genetic evidence for a Pleistocene popula-tion explosion. Evolution 49: 608–615.
Rogers AR, Harpending HC. 1992. Population growthmakes waves in the distribution of pairwise genetic differ-ences. Molecular Biology and Evolution 9: 552–569.
Rout PK, Thangraji K, Mandal A, Roy R. 2012. Geneticvariation and population structure in jamunapari goatsusing microsatellites, mitochondrial DNA, and milk proteingenes. Scientific World Journal 2012: 2012–618909.
Ruokonen M, Aarvak T, Chesser RK, Lundqvists AC,Merilä J. 2010. Temporal increase in mtDNA diversity in adeclining population. Molecular Ecology 19: 2408–2417.
Schneider S, Excoffier L. 1999. Estimation of past demo-graphic parameters from the distribution of pairwise differ-ences when the mutation rates vary among sites: applicationto human mitochondrial DNA. Genetics 152: 1079–1089.
Sequeira F, Sodré D, Ferrand N, Bernardi JAR,Sampaio I, Schneider H, Vallinoto M. 2011. Hybridiza-tion and massive mtDNA unidirectional introgressionbetween the closely related Neotropical toads Rhinellamarina and R. schneideri inferred from the mtDNA andnuclear markers. BMC Evolutionary Biology 11: 264–278.
Slatkin M, Hudson RR. 1991. Pairwise comparisons ofmitochondrial DNA sequences in stable and exponentiallygrowing populations. Genetics 129: 555–562.
Sly ND, Townsend AK, Rimmer CC, Townsend JM, LattaS, Lovette IJ. 2010. Phylogeography and conservationgenetics of the Hispaniolan endemic Palm-Tanagers (Aves:Phaenicophilus). Conservation Genetics 11: 2121–2129.
Smith MA, Green DM. 2006. Sex, isolation and fidelity:unbiased long-distance dispersal in a terrestrial amphibian.Ecography 29: 649–658.
Smith SA, Donoghue MJ. 2008. Rates of molecular evolu-tion are linked to life history in flowering plants. Science322: 86–89.
Stephens M, Smith NJ, Donnelly P. 2001. A new statisticalmethod for haplotype reconstruction from population data.American Journal of Human Genetics 68: 978–989.
Stone AC, Battistuzzi FU, Kubatko LS, Perry Jr GH,Trudeau E, Lin H, Kumar S. 2010. More reliable esti-mates of divergence times in Pan using complete mtDNAsequences and accounting for population structure. Philo-sophical Transactions of the Royal Society of London SeriesB, Biological Sciences 365: 3277–3288.
Strimmer K, Pybus OG. 2001. Exploring the demographichistory of DNA sequences using the generalized skylineplot. Molecular Biology and Evolution 18: 2298–2305.
Tajima F. 1989. Statistical method for testing the neutralmutation hypothesis by DNA polymorphism. Genetics 123:585–595.
Tchaicka L, Eizirik E, de Oliveira TG, Cândido JF Jr,Freitas TRO. 2007. Phylogeography and populationhistory of the crab-eating fox (Cerdocyon thous). MolecularEcology 16: 819–838.
Tollis M, Ausubel G, Ghimire D, Boissinot S. 2012. Multi-locus phylogeographic and population genetic analysis ofAnolis carolinensis historical demography of a genomicmodel species. PLoS ONE 7: e38474.
Townsend AK, Rimmer CC, Latta SC, Lovette IJ.2007. Ancient differentiation in the single-island avianradiation of endemic Hispaniolan Chat-Tanagers (Aves:Calyptophilus). Molecular Ecology 16: 3634–3642.
Tucker AD, McCallum HI, Limpus CJ, McDonald KR.1998. Sex-biased dispersal in a long lived polygynous reptile(Crocodylus johnstoni). Behavior Ecology and Sociobiology44: 85–90.
van Tuinen M, Hedges SB. 2001. Calibration of avian mole-cular clocks. Molecular Biology and Evolution 18: 206–213.
Turchetto-Zolet AC, Pinheiro F, Salgueiro F,Palma-Silva C. 2012. Phylogeographical patterns shedlight on the evolutionary process in South America. Molecu-lar Ecology 22: 1193–1213.
Wang Y, Lane A, Ding P. 2012. Sex-biased dispersal of a frog(Odorrana schmackeri) is affected by patch isolation andresource limitation in a fragmented landscape. PLoS ONE7: e47683.
Wares JP. 2009. Natural distributions of mitochondrialsequence diversity support new null hypotheses. Evolution64: 1136–1142.
Weir JT, Schluter D. 2008. Calibrating the avian molecularclock. Molecular Ecology 17: 2321–2328.
Wilson RE, Peters JL, McCracken KG. 2012. Genetic andphenotypic divergence between low- and high-altitude popu-lations of two recently diverged cinnamon teal subspecies.Evolution 67: 170–184.
Wu Y, Wang Y, Jiang K, Hanken J. 2013. Significance ofpre-Quaternary climate change for montane species diver-sity: insights from Asian salamanders (Salamandridae:Pachytriton). Molecular Phylogenetics and Evolution 66:380–390.
Yang Z, Nielsen R. 1998. Synonymous and nonsynonymousrate variation in nuclear genes of mammals. Journal ofMolecular Evolution 46: 409–418.
EVALUATING HISTORICAL DEMOGRAPHY 19
© 2014 The Linnean Society of London, Biological Journal of the Linnean Society, 2014, ••, ••–••
You Y, Sun K, Xu L, Wang L, Jiang T, Liu S, Lu G,Berquist SW, Feng J. 2010. Pleistocene glacial cycleeffects on the phylogeography of the Chinese endemic batspecies, Myotis davidii. BMC Evolutionary Biology 10:208.
Zhan XJ, Pan SK, Wang JY, Dixon A, He J, Muller MG,Ni PX, Hu L, Liu Y, Hou HL, Chen YP, Xia JQ, Luo Q,Xu PW, Chen Y, Liao SG, Cao CC, Gao SK, Wang ZB,Yue Z, Li GQ, Yin Y, Fox NC, Wang J, Bruford MW.2013. Peregrine and saker falcon genome sequences provide
insights into evolution of a predatory lifestyle. NatureGenetics 45: 563–566.
Zhou WW, Wen Y, Fu J, Xu YB, Jin JQ, Ding L, Min MS,Che J, Zhang YP. 2012. Speciation in the Ranachensinensis species complex and its relationship to the upliftof the Qinghai-Tibetan Plateau. Molecular Ecology 21: 960–973.
Zink RM, Barrowclough GF. 2008. Mitochondrial DNAunder siege in avian phylogeography. Molecular Ecology 17:2107–2121.
20 A. L. FAHEY ET AL.
© 2014 The Linnean Society of London, Biological Journal of the Linnean Society, 2014, ••, ••–••