dna barcoding of livestock and poultry breeds/strains · pdf file1 bangko sentral ng pilipinas...
TRANSCRIPT
1
Bangko Sentral ng Pilipinas (BSP) Professorial Chair Lecture in Animal Science
DNA BARCODING OF LIVESTOCK AND POULTRY BREEDS/STRAINS IN THE PHILIPPINES
Dr. Orville L. Bondoc, Ph.D.
Professor 12, Animal and Dairy Sciences Cluster College of Agriculture, University of the Philippines Los Baños
ABSTRACT
We have sequenced the DNA barcodes (i.e. cytochrome c oxidase subunit I or
COI gene of the mitochondrial genome) of common breeds/strains of farm animals (mammals – buffalo, cattle, goat, sheep, pigs, dogs, and cat; poultry – chickens, quail, turkey, guinea fowl, ducks, geese, pigeons, and ostrich) in the Philippines.
DNA was extracted from blood samples. The DNA barcode of the livestock and
poultry breed/strain was amplified by polymerase chain reaction (PCR) method. Sequence divergences (“Kimura 2 parameter” or K2P differences) of the DNA barcode between the groups or taxa and a library of common livestock and poultry breeds/strains were analyzed. A neighbour-joining (NJ) tree based on COI barcodes was also created to provide graphic representation of sequence divergences among the breed/strain specimens to confirm identification.
Our analyses indicate that DNA barcodes can be an effective tool for both
differentiating and identifying most breeds/strains of livestock and poultry animals (except cattle and commercial hybrid chickens) in the Philippines. Hybrid or crossbred animals will be difficult to distinguish from their dam breed/strain because mitochondrial DNA is maternally inherited. We demonstrated that DNA barcodes can be used to quantify intra-specific diversity and recognize sibling species among common livestock and poultry breeds/strains. We also developed a local online database called the “UPLB-DA DNA Barcoding Project: a library information system for the Philippine livestock and poultry sector” and runs in parallel with the Barcode of Life Data systems.
DNA barcoding has vast potential applications in the areas of animal production
and health such as genetic improvement and conservation, tracking of invasive species, and labeling of breeding animals and traditional animal products. The library of a standardized gene region, i.e. mitochondrial COI sequences or DNA barcodes could also provide insight into evolutionary processes in the development of popular breeds/strains of farm animals and their wild types (e.g., Philippine red jungle fowls). Through DNA barcoding, livestock and poultry breeds/strains could be identified to quickly assess biodiversity and help speed up cataloguing of biodiversity. Conservationists/taxonomists as well as farmers could spot genetically distinct specimens, speeding up cataloguing of new breeds/strains before they become extinct.
2
TOPIC OUTLINE I. Introduction
A. Historical milestones in DNA barcoding B. Effectiveness of DNA barcoding as an identification tool C. Benefits and limitations of DNA barcoding D. Practical applications of DNA barcoding
II. Generating DNA barcodes for livestock and poultry breeds/strains A. Field sampling and blood collection B. Laboratory analysis (DNA extraction, purification, elution, amplification, and
sequencing) C. DNA barcodes generated for common livestock and poultry breeds/strains
in the Philippines D. COI sequence analysis
III. Evolutionary analysis of livestock and poultry breeds/strains using DNA
barcodes A. Among livestock (mammals) families/species
1. Among ruminant breeds/strains 2. Among pig breeds/strains
B. Among poultry (avian) families/species 1. Among chicken breed/strains 2. Among duck breeds/strains
IV. Recommendations and future plans A. Local DNA barcode library (database), laboratory equipment and standard
protocols B. Applications of DNA barcodes in the local livestock and poultry industry
1. Identification of breeds in local genetic improvement and conservation programs
2. Tracking of invasive species 3. Product labeling in the marketing and trade of animal products
C. Establishment of a national DNA barcode library for agriculture
3
I. Introduction
DNA barcoding refers to the use of DNA sequence analysis of a uniform target gene to enable species identification. Inspired by the barcode on products in supermarkets (i.e. Uniform Product Code barcodes on manufactured goods), DNA barcoding is a new method for identifying and classifying species of organisms using the cytochrome c oxidase subunit I (COI) in the mitochondrial genome. It is currently used as the standard barcode marker for animals especially birds, fishes, amphibians, and lepidopterans, with a species discrimination rate of more than 95%.
This paper highlights the earlier investigations of sequencing the “biological
barcode” region of a segment of the mitochondrial gene (i.e. COI) for animal species identification (and discovery) and their extension to important breeds/strains of common farm animals in the Philippines. These livestock and poultry species represent less than one percent of nearly 500 mammalian species and less than half percent of 1250 bird species in mainland Southeast Asia (Robson, 2000; Francis, 2008). The regional numbers are nearly doubled if the archipelagos of Indonesia and the Philippines are included (Corbet and Hill 1992), representing about 20% of the global totals for both groups.
The professorial chair lecture initially provides a review of the discovery and
significance of the mtDNA COI gene in discriminating closely allied animal species. It also presents the results of local studies to evaluate the genetic diversity of livestock and poultry breeds/strains and commercial hybrids/crosses in the Philippines using DNA barcodes. Finally, future programs and plans that shall promote the use of DNA barcodes as a reliable, cost-effective and accessible tool to advance the local animal industry and the Philippine agriculture sector in general, are given.
A. Historical milestones in DNA barcoding In the past, polymerase chain reaction or PCR-based approaches were used for
species identification in bacterial studies, microbial biodiversity surveys, pathogenic diagnoses (i.e. culture-independent ID systems), taxonomy, food and forensic molecular identification (Teletchea et al., 2008). Comparisons of anonymous markers (e.g., microsatellites, minisatellites, amplified fragment length polymorphisms, gene markers, single nucleotide polymorphisms, large scale or directed sequencing, mitochondrial genotyping, y chromosome genotyping, etc.) were later used to measure genetic diversity. In the Philippines, genetic polymorphisms and distances in native farm animals have been documented and compared at the species level using blood typing, karyotyping and electrophoretic methods in the 1970s and other polymorphic DNA in the 1990s. DNA finger printing eventually replaced blood typing and biochemical polymorphisms previously used in verifying parentage in farm animals (Bondoc, 2000).
4
Mitochondrial DNA (mtDNA) in particular, has been widely employed in phylogenetic studies of animals because it evolves much more rapidly than nuclear DNA, resulting in the accumulation of differences between closely related species (Brown et al. 1979; Moore 1995; Mindell et al. 1997). Mitochondrial sequence divergences are found to be strongly linked to the process of speciation. The mitochondrial genome is approximately 16-17 kbp in size in most animals. It encodes 22 tRNAs, 2 rRNAs, and 13 polypeptides (Chinnery and Schon, 2003). It is maternally inherited, does not undergo recombination, is a valuable molecule in investigating phylogenetic relationships among populations, species, and subspecies, and can be used to evaluate the maternal genetic constitution for a specific population. Mitochondrial DNA is likewise more abundant (also has greater sequence differences among species) than nuclear DNA and therefore easier to recover, especially from small or partially degraded samples (Stoeckle and Hebert, 2008). DNA Barcodes
The idea of establishing an identification system for all plant and animal life using genetic sequences from a uniform locus was first proposed in 2003. (The underlying concept however goes back 30 years to Carl Woese of the University of Illinois, who first showed that DNA sequences could be used to reconstruct the Tree of Life.)
Hebert et al. (2003a) first provided proof that DNA barcoding can distinguish at
least some species through an analysis of relatively short sequences of DNA (i.e. cytochrome c oxidase subunit I or COI) among closely related species across diverse phyla in the animal kingdom. To complement the inherent limitations of morphology-based systems of taxonomic classification of the huge array of organisms in the tree of life, DNA barcoding promises rapid automated identifications by shifting the process of species recognition from traditional morphological approaches to one based on discrete genetic codes. This gene region is easily recovered and it provides good resolution, as evidenced by the fact that deep sequence divergences were the rule between 13,000 closely related pairs of animal species across diverse phyla in the animal kingdom (Hebert et al. 2003b). Since its initial proposal as a tool for rapid identification of species, DNA barcoding has gained considerable validation. DNA barcodes are also proving to be a useful tool for identifying genetically distinct units worthy of more intense taxonomic study.
The gene for barcoding animals however, is not practical for plants because the
plant genome has evolved quite differently. Recently, the CBOL Plant Working Group (2009) recommended a combination of chloroplast genes, i.e. RuBisCO large subunit (rbcL) and maturase K (matK) as the standard barcode for plants. More than one locus is needed because of the much lower nucleotide substitution rate in the plastid genome than in the animal mitochondrial genome (Fazekas et al., 2008).
5
Consortium for the Barcode of Life (CBOL) In 2004, the Consortium for the Barcode of Life (CBOL) that includes 150
institutions from 45 countries was established as an international collaboration of natural history museums, herbaria, biological repositories, and biodiversity inventory sites, together with academic and commercial experts in genomics, taxonomy, electronics, and computer science. The initial organizational support for CBOL is provided by a 2.5 year grant from the Alfred P. Sloan Foundation. The mission of CBOL is to rapidly accelerate compiling of DNA barcodes of known and newly discovered plant and animal species, establish a public library of sequences linked to named specimens, and promote development of portable devices for DNA barcoding. The CBOL plans to process five million specimens from 500,000 species by 2014. (Stoeckle and Hebert, 2008).
DNA sequences (barcodes) for the identification of all animal and plant life is
systematically recorded through the International Barcode of Life (iBOL) Project. The DNA Barcode of Life project aims to develop and promote the use of a standardized, rapid and inexpensive species identification method accessible to non-specialists. Such accurate, reliable, practical, and cost-effective tool shall assign unidentified specimens to their correct species, and at the same time expand the interest and activity in taxonomy.
In this regard, a public and global online database was also established called
the Barcode of Life Data systems or BOLD (see www.barcodinglife.org). The BOLD is an informatics workbench aiding the acquisition, storage, analysis and publication of DNA barcode records (Ratnasingham and Hebert, 2007). The BOLD is a repository for specimen and sequence records that form the basic data of all barcode studies. It provides the vehicle for collaboration across geographically dispersed research communities by coupling flexible security and data entry features with web-based delivery. The DNA barcode database at the Biodiversity Institute of Ontario (BIO), University of Guelph, Canada is expanding allowing the world to use its resources. BOLD since 2008 has over 460,000 records from more than 46,000 species spanning the animal kingdom, with particularly dense records for birds, fishes, butterflies and moths. Each of these records contains the species name, barcode sequence, collection location, links to the voucher specimen, photographs and other biological data.
Past barcode surveys have already identified new taxonomic units, either as
named species, provisional species, evolutionarily significant units (ESUs), or molecular operational taxonomic units (MOTUs) in 4-40% of the species examined (Meyer and Paulay, 2005; Monaghan et al., 2005; Saunders, 2005; Smith et al., 2005; Hajibabaei et al., 2006; Scheffer et al., 2006). These results suggest that “an iterative process of DNA barcoding … followed by taxonomic study” will be a productive path to cataloguing biodiversity (Barber and Boyce, 2006).
6
B. Effectiveness of DNA barcoding as an identification tool While different gene targets or protocols may be needed for certain taxonomic
groups, the genes targeted for DNA barcoding should be sufficiently conserved to be amplified with broad range primers, yet divergent enough to resolve closely related species. For animals, mitochondrial genes are attractive targets because they are shared across diverse taxa and do not contain introns that can complicate amplification using PCR. A two percent divergence between two mtDNA barcodes constitutes a species (Hebert et al. 2003a).
The barcode region for animals is a 650-base fragment of the 5’- end of the
mitochondrial gene cytochrome c oxidase I (COI, cox1), which provides a reliable sequence read through a single pass in conventional cycle-sequencing platforms. Other useful properties of the COI gene in animals include: (1) it is present in all eukaryotes, (2) it contains enough sequence diversity to differentiate most animal species (with the exception of Cnidaria), (3) it is short enough to be readily amplified and sequenced, (4) it can be amplified from diverse phyla with broad-range primers, and (5) it is relatively abundant in each cell (as a mitochondrial gene), facilitating recovery from suboptimal specimens including those from museum collections preserved in formalin.
The effectiveness of DNA barcoding (i.e. more than 95% of species possess
unique COI barcode sequences and that there is higher inter-species than intra-species variability) has already been demonstrated in large group of animals such as: birds (Hebert et al., 2004a; Yoo et al., 2006; Kerr et al., 2007 and 2009), fish (Ward et al., 2005), spiders (Barret and Hebert, 2005), Lepidopterans (Hebert et al., 2004b; Janzen et al., 2005; Hajibabaei et al., 2006) and other groups of organisms, including plants (Kress et al, 2005; Chase et al., 2007), macroalgae (Saunders, 2005), fungi (Summerbell et al. 2005), protists (Scicluna et al., 2006), and bacteria (Sogin et al., 2006).
C. Benefits and limitations of DNA barcoding
Benefits
DNA barcoding as a uniform, practical method for species identification could benefit the biological scientific community, educators, and interested public. Some benefits from DNA barcoding are enumerated as follows (Hebert et al., 2003a): 1. DNA barcoding contributes to conservation biology, including biodiversity
surveys,
2. DNA barcoding enables identifications where traditional methods (based on more than 250 years of classical taxonomy developed by Carl Linnaeus) are unrevealing,
7
3. DNA barcoding provides efficient method for mapping the extent of species,
4. DNA barcoding facilitates species identification, including flagging specimens that represent undescribed taxa (new species), and
5. DNA barcoding provides insight into the evolutionary history of life (e.g., help identify cryptic species; reveal causes of mtDNA inheritance disturbance).
Furthermore, DNA barcoding is becoming available to an increasingly wide
community especially when sequencing costs decrease as new technologies for DNA analysis become faster, cheaper, and usable in field biology. Amplification and sequencing are thus inexpensive per specimen. Sequences can also be made publicly available through the Internet. Limitations
There are however limitations to the use of DNA barcoding. Some are discussed below.
1. There is no universal DNA barcode gene, no single gene that is conserved in all
domains of life and exhibits enough sequence divergence for species discrimination. There is no gene that can serve as an ideal barcode for all species, i.e. genes can be invariant within species but different among species. Even with genetically distinct species that differ by more than 2% from their nearest neighbours (i.e. equivalent to a level which separated several pairs of morphologically distinct species), a simple threshold value, especially based on a single gene, is not sufficient basis for species recognition (e.g., Baker and Bradley, 2006). DNA barcoding can however be a rapid, relatively inexpensive first step in species discovery (Stoeckle and Hebert, 2008).
2. DNA-based species identification depends on distinguishing intra-specific from inter-specific genetic variation - which are unknown and may differ between groups. Hence, more data giving a better representation of biodiversity need to be collected (e.g., Santamaria et al., 2007). DNA barcoding can undoubtedly be a useful tool to assign unknown specimens to pre-defined groups (i.e. species as defined by classical taxonomy), but never a method for identifying these groups in the first place (Nielsen and Matz, 2006). The fact that it is possible to assign a sequence from a specimen to a predefined group does not mean that the group itself deserves taxonomic recognition. There will always be a possibility that one or more of the database species were undersampled. Thus, a taxonomic decision should be made on the basis of independent lines of evidence.
8
3. DNA barcoding is not optimal for the study of deep evolutionary relationships. Furthermore, it may be difficult to resolve recently diverged species or new species that have arisen through hybridization. Barcoding does not use nuclear data, but hybridization, or divergent selection, on mitochondrial and nuclear DNA can cause such inconsistent patterns of inheritance (Funk and Omland, 2003).
4. DNA barcoding seeks comprehensive coverage for species, but focuses on their delineation rather than their relationships. Barcoding is not meant to and does not provide evolutionary information about taxa; rather, it is intended only as a means of “yes” or “no” identification based on predetermined units (Rubinoff, 2006). DNA barcoding complement current research areas in molecular phylogenetics and population genetics as it provides background information that will be helpful in the selection of taxa for further analyses (Hajibababei et al., 2007).
5. Hybridization in will lead to shared or very similar sequences at COI and other gene loci. Because mitochondrial DNA is maternally inherited, a COI barcode will assign F1 hybrids to the species of their female parent (Hebert et al., 2004a). With crossbreeding commonly practiced in farm animals, we expect that more intensive study will also reveal such shared sequences.
D. Practical applications of DNA barcoding
DNA barcoding can distinguish individuals of a species because genetic variation between species exceeds that within species. It (generally) contributes powerfully to taxonomic and biodiversity research. It (specifically) complements taxonomy, molecular phylogenetics (deal with evolutionary relationships among deeper clades), and population genetics (deal with variation within and among populations of a single species).
While DNA barcoding was primarily developed as a sophisticated tool for both the identification of known species and the discovery of new ones, the discrete DNA barcodes can be used as the primary source of information in medicine, agriculture, health, fraud, smuggling, exploring our planet's prehistoric life. For example, the applications of DNA barcoding have already been demonstrated in conservation genetics and molecular ecology (Rubinoff, 2006; Ward et al., 2008), forensics (Dawnay et al., 2007), and paleo-ecological/ ancient DNA studies (Willerslev et al., 2007).
In biodiversity assessment studies, DNA barcoding may be used in facilitating species identification, highlighting cases of range expansion for known species, flagging previously overlooked species, and enabling identifications where traditional methods cannot be applied. DNA barcodes are especially useful to (1) distinguish species differences in animals by overcoming the deficits of morphological approaches to species discrimination, (2) quantify intra-specific diversity, (3)
9
recognize sibling species, (4) be objective in taxonomic decisions in all life stages, and (5) allow single laboratories to execute taxon diagnoses (Hebert et al., 2003a).
While the taxonomy of animals remains largely reliant on dated morphological
studies, molecular data such as DNA barcodes promise to expedite a newly detailed understanding of this fauna. DNA barcoding may be used to identify animal species that cannot be distinguished by traditional methods or require expensive equipment or advanced training. Although levels of genetic differentiation do not dictate taxonomic status, barcode analysis illuminates those taxa and those segments of their ranges where further research is justified. Furthermore, taxonomic decisions cannot be based simply on COI sequences, but barcode surveys are a powerful tool for rapidly identifying those species in need of further investigation. II. Generating DNA Barcodes for Livestock and Poultry Breeds/Strains
A. Field sampling and blood collection
A stratified sampling design was used to provide an overview of COI diversity
within each taxonomic assemblage. At least a single individual from each farm animal species was examined to ascertain COI sequence divergences among species. Two or more breeds/strains of each species were then used to provide a general sense of intra-specific sequence divergences, as well as a preliminary indication of variation in each species. Members of the same breed/strain are expected to have the same mtDNA COI sequences.
All blood samples however were taken with appropriate permissions from DA
research breeding farms/centers, private farm owners, smallholder farmers and local authorities who provided authoritative animal records and identifications.
Blood samples were obtained from live animal specimens without harming them
whenever possible. Blood was extracted using hypodermic needle (gauge 20 or 22 for mammals and gauge 25 for poultry species) through the jugular vein of ruminants, horses, and pigs and wing vein for poultry. Specifically, blood was extracted from the cephalic vein in cat and dogs, ear vein in rabbits and pigs, and the aorta of quails. Fresh blood samples are placed in FTA cards and allowed to dry for 3 days under room temperature.
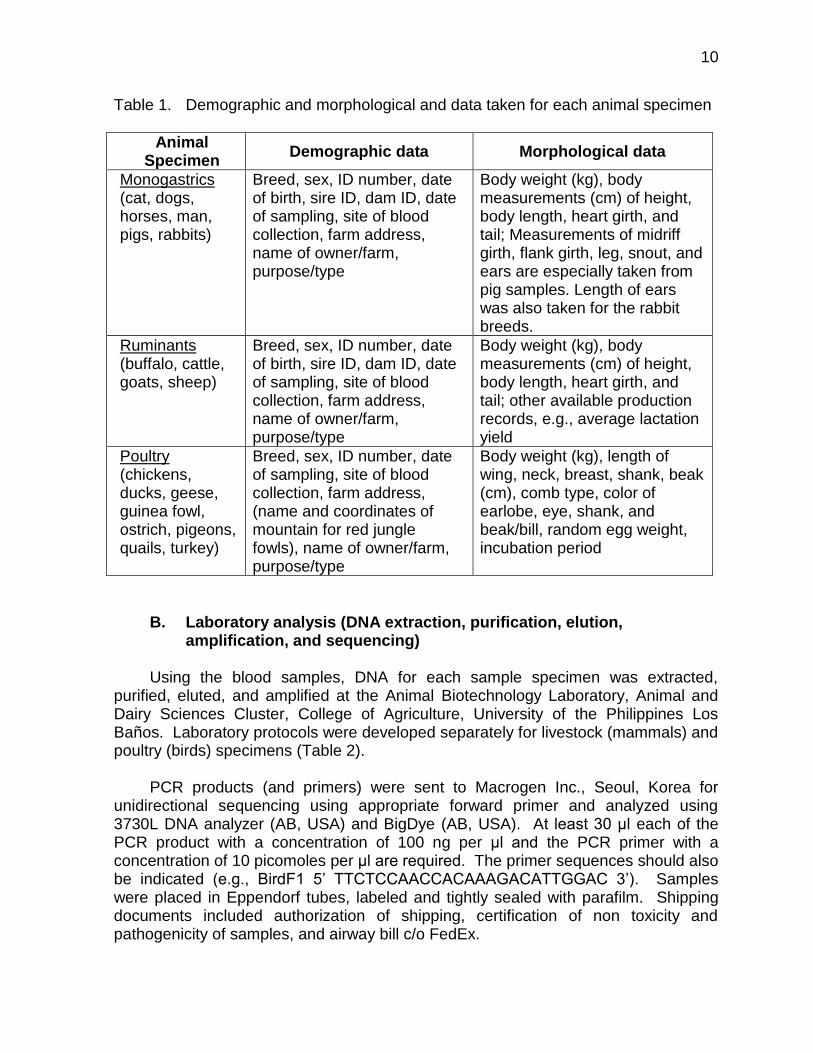
Demographic and morphological data were taken for each animal specimen (Table 1). A total of 7,527 digital images (i.e. colored pictures and 1-minute video) ~ 80.4 gigabytes were recorded in the local DNA barcode library for the livestock and poultry sector.
10
Table 1. Demographic and morphological and data taken for each animal specimen
Animal Specimen
Demographic data Morphological data
Monogastrics (cat, dogs, horses, man, pigs, rabbits)
Breed, sex, ID number, date of birth, sire ID, dam ID, date of sampling, site of blood collection, farm address, name of owner/farm, purpose/type
Body weight (kg), body measurements (cm) of height, body length, heart girth, and tail; Measurements of midriff girth, flank girth, leg, snout, and ears are especially taken from pig samples. Length of ears was also taken for the rabbit breeds.
Ruminants (buffalo, cattle, goats, sheep)
Breed, sex, ID number, date of birth, sire ID, dam ID, date of sampling, site of blood collection, farm address, name of owner/farm, purpose/type
Body weight (kg), body measurements (cm) of height, body length, heart girth, and tail; other available production records, e.g., average lactation yield
Poultry (chickens, ducks, geese, guinea fowl, ostrich, pigeons, quails, turkey)
Breed, sex, ID number, date of sampling, site of blood collection, farm address, (name and coordinates of mountain for red jungle fowls), name of owner/farm, purpose/type
Body weight (kg), length of wing, neck, breast, shank, beak (cm), comb type, color of earlobe, eye, shank, and beak/bill, random egg weight, incubation period
B. Laboratory analysis (DNA extraction, purification, elution,
amplification, and sequencing)
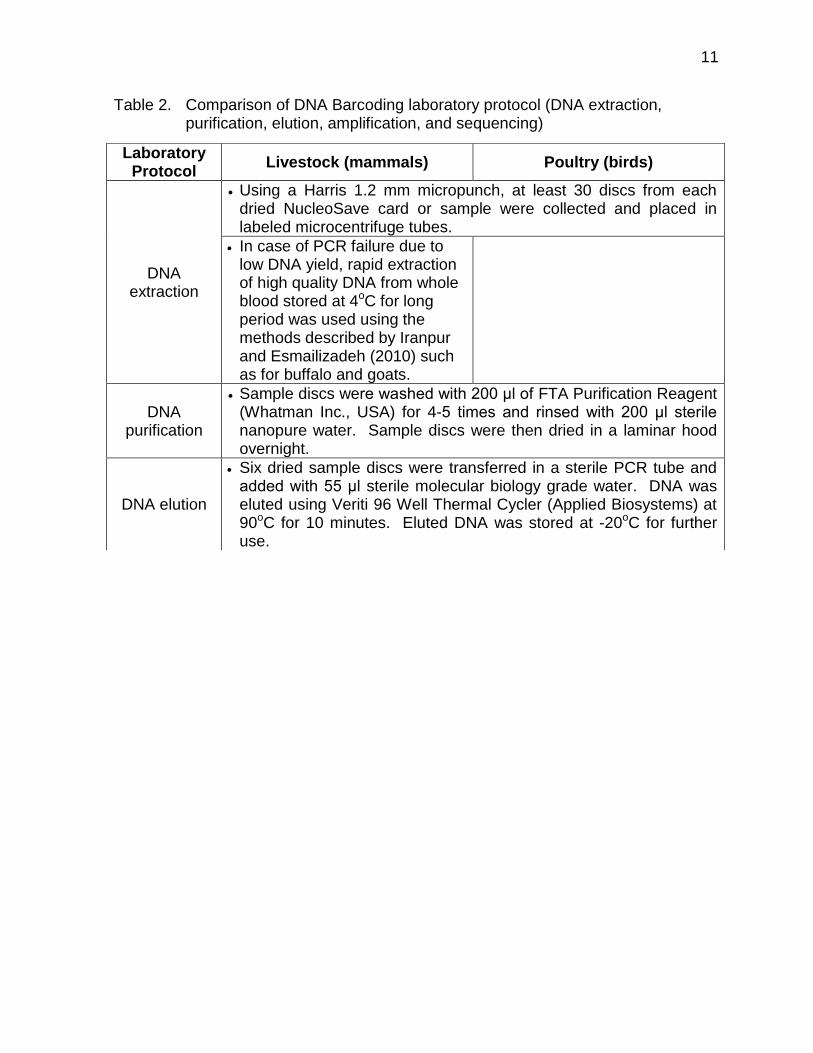
Using the blood samples, DNA for each sample specimen was extracted, purified, eluted, and amplified at the Animal Biotechnology Laboratory, Animal and Dairy Sciences Cluster, College of Agriculture, University of the Philippines Los Baños. Laboratory protocols were developed separately for livestock (mammals) and poultry (birds) specimens (Table 2).
PCR products (and primers) were sent to Macrogen Inc., Seoul, Korea for
unidirectional sequencing using appropriate forward primer and analyzed using 3730L DNA analyzer (AB, USA) and BigDye (AB, USA). At least 30 μl each of the PCR product with a concentration of 100 ng per μl and the PCR primer with a concentration of 10 picomoles per μl are required. The primer sequences should also be indicated (e.g., BirdF1 5’ TTCTCCAACCACAAAGACATTGGAC 3’). Samples were placed in Eppendorf tubes, labeled and tightly sealed with parafilm. Shipping documents included authorization of shipping, certification of non toxicity and pathogenicity of samples, and airway bill c/o FedEx.
11
Table 2. Comparison of DNA Barcoding laboratory protocol (DNA extraction, purification, elution, amplification, and sequencing)
Laboratory Protocol
Livestock (mammals) Poultry (birds)
DNA extraction
Using a Harris 1.2 mm micropunch, at least 30 discs from each dried NucleoSave card or sample were collected and placed in labeled microcentrifuge tubes.
In case of PCR failure due to low DNA yield, rapid extraction of high quality DNA from whole blood stored at 4oC for long period was used using the methods described by Iranpur and Esmailizadeh (2010) such as for buffalo and goats.
DNA purification
Sample discs were washed with 200 μl of FTA Purification Reagent (Whatman Inc., USA) for 4-5 times and rinsed with 200 μl sterile nanopure water. Sample discs were then dried in a laminar hood overnight.
DNA elution
Six dried sample discs were transferred in a sterile PCR tube and added with 55 μl sterile molecular biology grade water. DNA was eluted using Veriti 96 Well Thermal Cycler (Applied Biosystems) at 90oC for 10 minutes. Eluted DNA was stored at -20oC for further use.
12
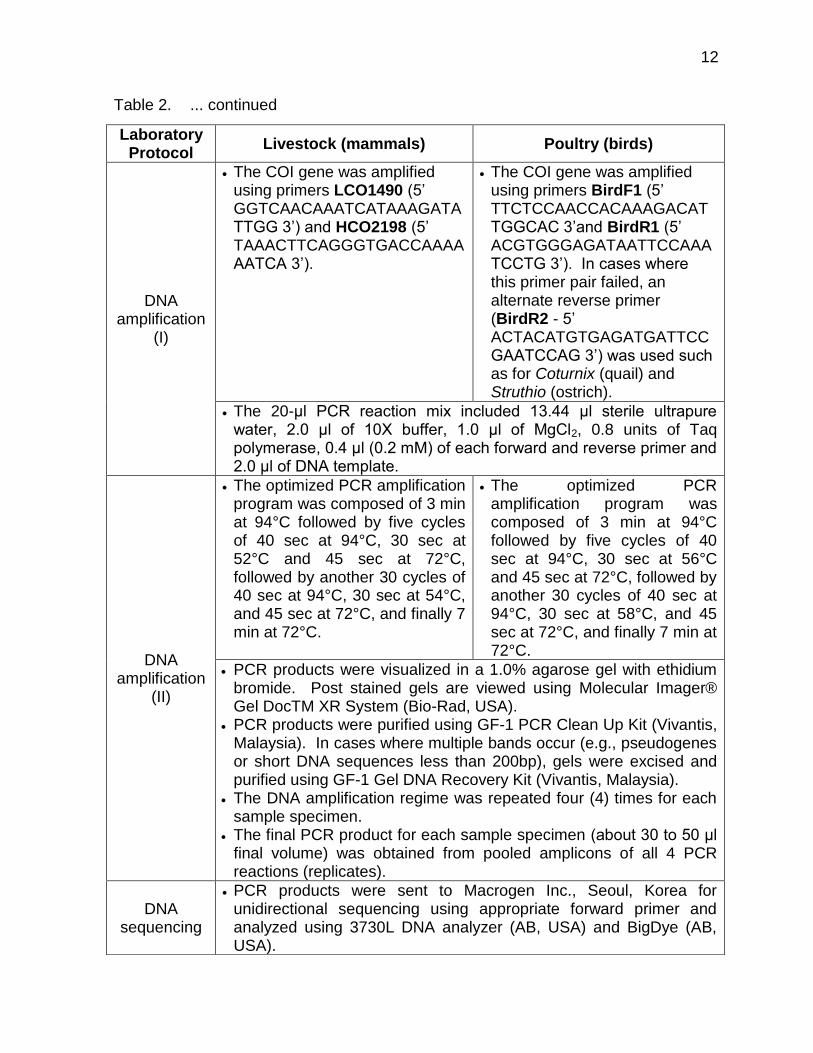
Table 2. ... continued
Laboratory Protocol
Livestock (mammals) Poultry (birds)
DNA amplification
(I)
The COI gene was amplified using primers LCO1490 (5’ GGTCAACAAATCATAAAGATATTGG 3’) and HCO2198 (5’ TAAACTTCAGGGTGACCAAAAAATCA 3’).
The COI gene was amplified using primers BirdF1 (5’ TTCTCCAACCACAAAGACATTGGCAC 3’and BirdR1 (5’ ACGTGGGAGATAATTCCAAATCCTG 3’). In cases where this primer pair failed, an alternate reverse primer (BirdR2 - 5’ ACTACATGTGAGATGATTCCGAATCCAG 3’) was used such as for Coturnix (quail) and Struthio (ostrich).
The 20-μl PCR reaction mix included 13.44 μl sterile ultrapure water, 2.0 μl of 10X buffer, 1.0 μl of MgCl2, 0.8 units of Taq polymerase, 0.4 μl (0.2 mM) of each forward and reverse primer and 2.0 μl of DNA template.
DNA amplification
(II)
The optimized PCR amplification program was composed of 3 min at 94°C followed by five cycles of 40 sec at 94°C, 30 sec at 52°C and 45 sec at 72°C, followed by another 30 cycles of 40 sec at 94°C, 30 sec at 54°C, and 45 sec at 72°C, and finally 7 min at 72°C.
The optimized PCR amplification program was composed of 3 min at 94°C followed by five cycles of 40 sec at 94°C, 30 sec at 56°C and 45 sec at 72°C, followed by another 30 cycles of 40 sec at 94°C, 30 sec at 58°C, and 45 sec at 72°C, and finally 7 min at 72°C.
PCR products were visualized in a 1.0% agarose gel with ethidium bromide. Post stained gels are viewed using Molecular Imager® Gel DocTM XR System (Bio-Rad, USA).
PCR products were purified using GF-1 PCR Clean Up Kit (Vivantis, Malaysia). In cases where multiple bands occur (e.g., pseudogenes or short DNA sequences less than 200bp), gels were excised and purified using GF-1 Gel DNA Recovery Kit (Vivantis, Malaysia).
The DNA amplification regime was repeated four (4) times for each sample specimen.
The final PCR product for each sample specimen (about 30 to 50 μl final volume) was obtained from pooled amplicons of all 4 PCR reactions (replicates).
DNA sequencing
PCR products were sent to Macrogen Inc., Seoul, Korea for unidirectional sequencing using appropriate forward primer and analyzed using 3730L DNA analyzer (AB, USA) and BigDye (AB, USA).
13
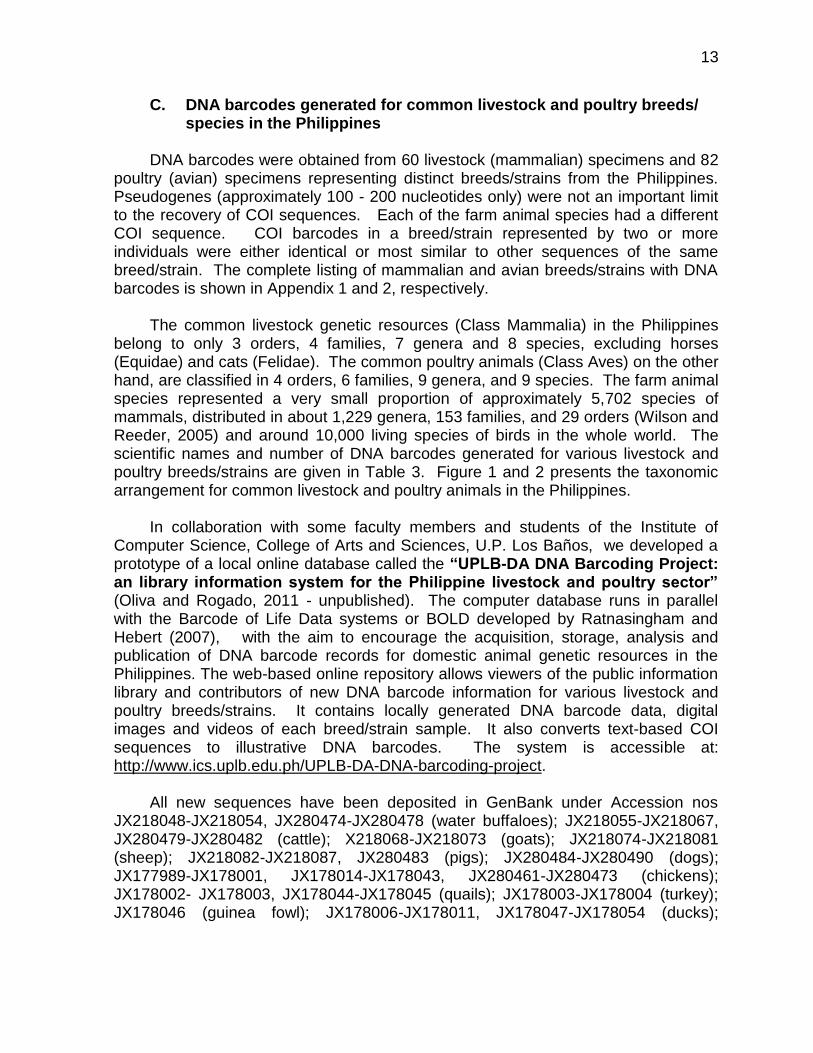
C. DNA barcodes generated for common livestock and poultry breeds/ species in the Philippines
DNA barcodes were obtained from 60 livestock (mammalian) specimens and 82
poultry (avian) specimens representing distinct breeds/strains from the Philippines. Pseudogenes (approximately 100 - 200 nucleotides only) were not an important limit to the recovery of COI sequences. Each of the farm animal species had a different COI sequence. COI barcodes in a breed/strain represented by two or more individuals were either identical or most similar to other sequences of the same breed/strain. The complete listing of mammalian and avian breeds/strains with DNA barcodes is shown in Appendix 1 and 2, respectively.
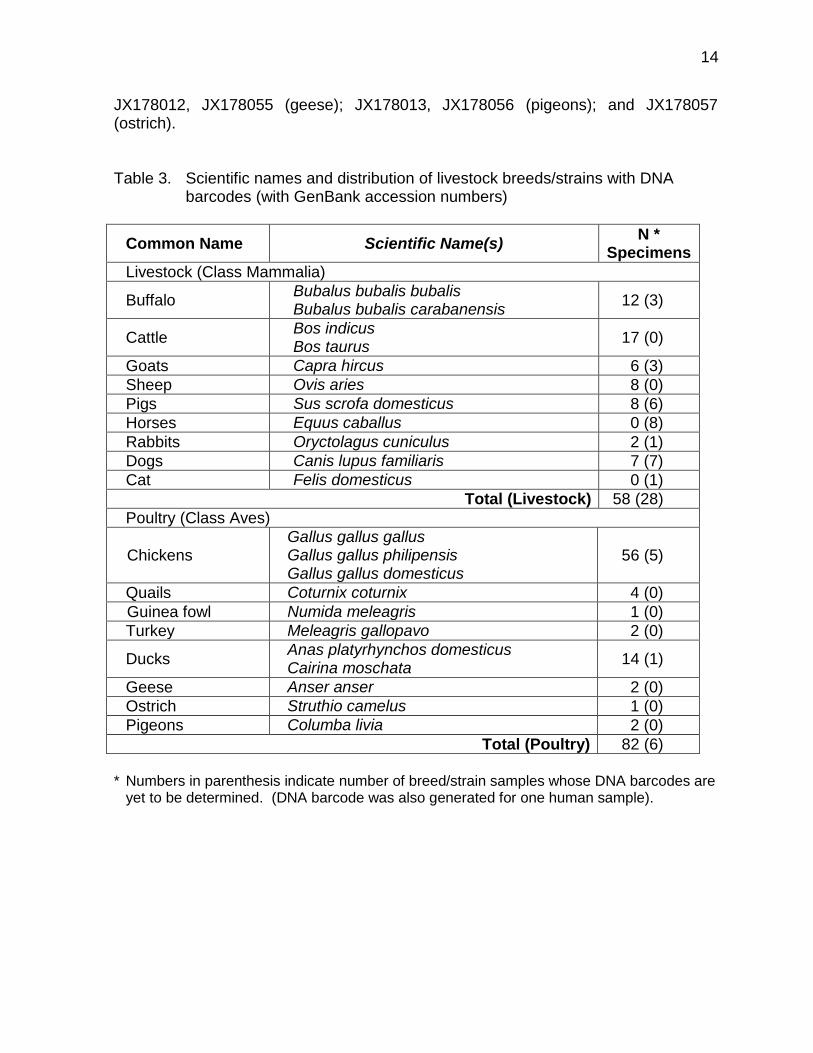
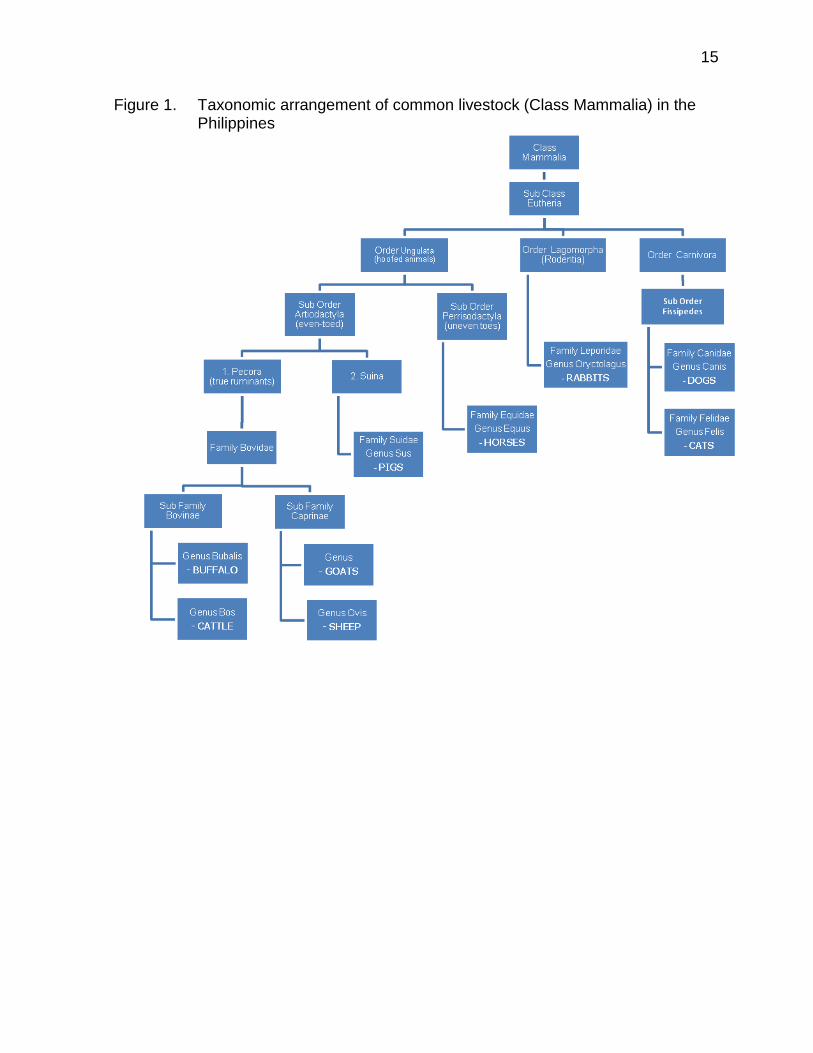
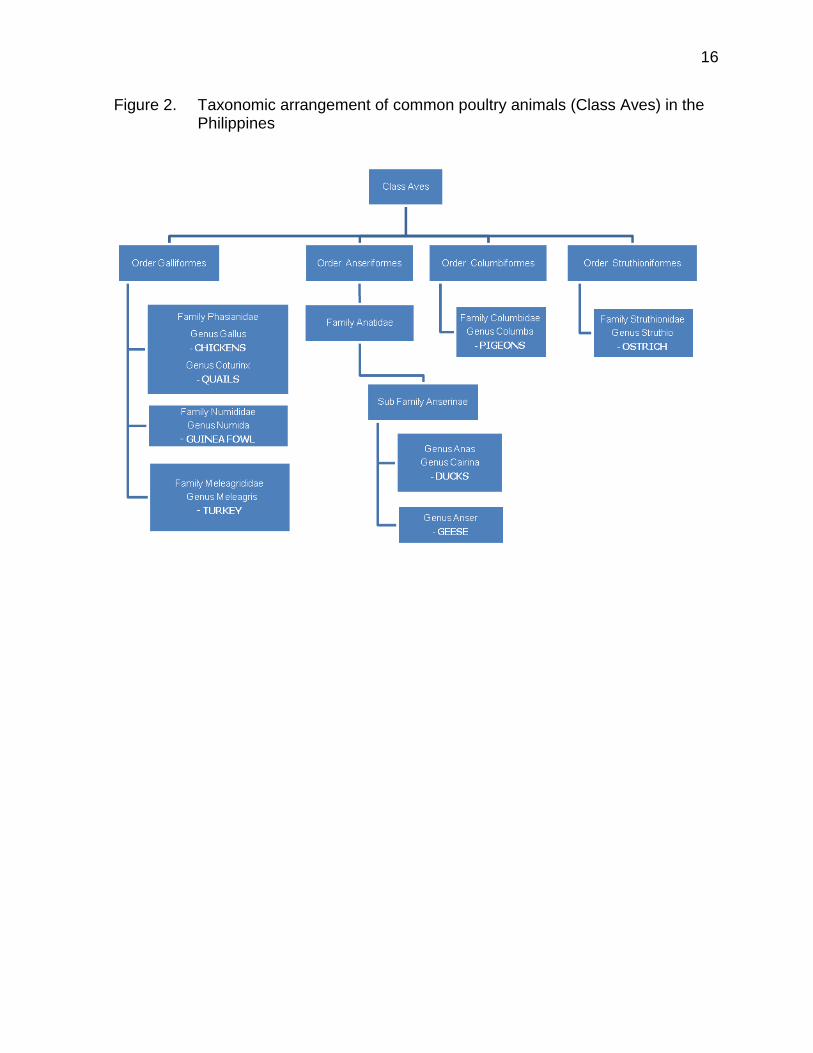
The common livestock genetic resources (Class Mammalia) in the Philippines
belong to only 3 orders, 4 families, 7 genera and 8 species, excluding horses (Equidae) and cats (Felidae). The common poultry animals (Class Aves) on the other hand, are classified in 4 orders, 6 families, 9 genera, and 9 species. The farm animal species represented a very small proportion of approximately 5,702 species of mammals, distributed in about 1,229 genera, 153 families, and 29 orders (Wilson and Reeder, 2005) and around 10,000 living species of birds in the whole world. The scientific names and number of DNA barcodes generated for various livestock and poultry breeds/strains are given in Table 3. Figure 1 and 2 presents the taxonomic arrangement for common livestock and poultry animals in the Philippines.
In collaboration with some faculty members and students of the Institute of Computer Science, College of Arts and Sciences, U.P. Los Baños, we developed a prototype of a local online database called the “UPLB-DA DNA Barcoding Project: an library information system for the Philippine livestock and poultry sector” (Oliva and Rogado, 2011 - unpublished). The computer database runs in parallel with the Barcode of Life Data systems or BOLD developed by Ratnasingham and Hebert (2007), with the aim to encourage the acquisition, storage, analysis and publication of DNA barcode records for domestic animal genetic resources in the Philippines. The web-based online repository allows viewers of the public information library and contributors of new DNA barcode information for various livestock and poultry breeds/strains. It contains locally generated DNA barcode data, digital images and videos of each breed/strain sample. It also converts text-based COI sequences to illustrative DNA barcodes. The system is accessible at: http://www.ics.uplb.edu.ph/UPLB-DA-DNA-barcoding-project.
All new sequences have been deposited in GenBank under Accession nos
JX218048-JX218054, JX280474-JX280478 (water buffaloes); JX218055-JX218067, JX280479-JX280482 (cattle); X218068-JX218073 (goats); JX218074-JX218081 (sheep); JX218082-JX218087, JX280483 (pigs); JX280484-JX280490 (dogs); JX177989-JX178001, JX178014-JX178043, JX280461-JX280473 (chickens); JX178002- JX178003, JX178044-JX178045 (quails); JX178003-JX178004 (turkey); JX178046 (guinea fowl); JX178006-JX178011, JX178047-JX178054 (ducks);
14
JX178012, JX178055 (geese); JX178013, JX178056 (pigeons); and JX178057 (ostrich). Table 3. Scientific names and distribution of livestock breeds/strains with DNA
barcodes (with GenBank accession numbers)
Common Name Scientific Name(s) N *
Specimens
Livestock (Class Mammalia)
Buffalo Bubalus bubalis bubalis Bubalus bubalis carabanensis
12 (3)
Cattle Bos indicus Bos taurus
17 (0)
Goats Capra hircus 6 (3)
Sheep Ovis aries 8 (0)
Pigs Sus scrofa domesticus 8 (6)
Horses Equus caballus 0 (8)
Rabbits Oryctolagus cuniculus 2 (1)
Dogs Canis lupus familiaris 7 (7)
Cat Felis domesticus 0 (1)
Total (Livestock) 58 (28)
Poultry (Class Aves)
Chickens Gallus gallus gallus Gallus gallus philipensis Gallus gallus domesticus
56 (5)
Quails Coturnix coturnix 4 (0)
Guinea fowl Numida meleagris 1 (0)
Turkey Meleagris gallopavo 2 (0)
Ducks Anas platyrhynchos domesticus Cairina moschata
14 (1)
Geese Anser anser 2 (0)
Ostrich Struthio camelus 1 (0)
Pigeons Columba livia 2 (0)
Total (Poultry) 82 (6)
* Numbers in parenthesis indicate number of breed/strain samples whose DNA barcodes are
yet to be determined. (DNA barcode was also generated for one human sample).
15
Figure 1. Taxonomic arrangement of common livestock (Class Mammalia) in the Philippines
16
Figure 2. Taxonomic arrangement of common poultry animals (Class Aves) in the Philippines

17
D. COI sequence analysis
Evolutionary analyses were conducted in MEGA5 (Tamura et al., 2007), consisting of diversity analysis, distance analysis, and phylogeny analysis. The COI sequences were aligned using ClustalW (Thompson et al., 1994), (http://www.ebi.ac.uk/clustalw/). The evolutionary distance between a pair of sequences was measured by the number of nucleotide substitutions (i.e. transition and/or transversion) or differences occurring between them. Groups of taxa within a farm species (congeneric) were created based on their evolutionary relatedness or based on the geographic origin of the breed/strain. Diversity analysis
Diversity analysis involved the calculation of sequence divergence using the
Kimura 2-parameter or K2P model (Kimura, 1980) and the standard errors of the estimates using the bootstrap method. Standard error estimate(s) were obtained by a bootstrap procedure (1000 replicates), Nei and Kumar (2000). Kimura’s two parameter model of base substitution (1980) corrects for multiple hits, taking into account transitional and transversional substitution rates, while assuming that the four nucleotide frequencies are the same and that rates of substitution do not vary among sites. A genetic diversity within the taxa (intra-specific divergence) of 2% may justify the effectiveness of COI barcodes as an identification tool to discriminate among species of mammals and birds (Hebert et. al., 2003a). A sequence threshold of ten times the average intraspecific variation could be used to identify those cases where a current species might represent more than one taxon (Hebert et al., 2004a). Distance analysis
To test whether genetic distances within species (or group) are less than those between species (or group), the evolutionary distances were computed using the Kimura 2-parameter method (Kimura, 1980) with their variances estimated by a bootstrap approach. The average distance between sequence pairs are in the units of the number of base substitutions per site (i.e. d units). Codon positions included were 1st+2nd+3rd+Noncoding. All positions containing gaps and missing data were eliminated. Within group mean distance was estimated as the average evolutionary divergence over sequence pairs within groups. Between group difference was used to estimate the evolutionary divergence over sequence pairs between groups. Net between group mean distances was an estimate of net evolutionary divergence between groups of sequences. The net average distances between groups of taxa is given by dA = dXY – ((dX + dY)/2), where, dXY is the average distance between groups X and Y, and dX and dY are the mean within-group distances. Phylogeny analysis
Phylogeny analysis to infer the evolutionary history used the Neighbour-Joining (NJ) method. To more stringently test the discriminatory power of COI barcodes, we
18
examined the nearest-neighbour distance, the minimum genetic distance between a species and its closest congeneric relative. The NJ method has the advantage of speed, and performs strongly when sequence divergences are low, so it is generally appropriate for recovering intra- and interspecies phylogeny (Hebert et al, 2004a). High bootstrap support for species nodes suggests neighbour-joining analysis of COI barcode sequences will be widely effective (e.g., Ward et al. 2005; Hajibabaei et al. 2006). Another way of identifying species in need of taxonomic scrutiny involves the search for taxa whose specimens from two or more distinct clusters with high bootstrap support (i.e. 98%) in a neighbour-joining tree.
A NJ tree of K2P distances was created to provide a graphic representation of
the pattern of divergences among taxa or animal breeds/strains (Saitou and Nei, 1987). The NJ method uses distance measures to correct for multiple hits at the same sites, and chooses a topology showing the smallest value of the sum of all branches as an estimate of the correct tree. The bootstrap consensus tree inferred from 500 replicates is taken to represent the evolutionary history of the taxa analyzed. Branches corresponding to partitions reproduced in less than 50% bootstrap replicates are collapsed. The percentage of replicate trees in which the associated taxa clustered together in the bootstrap test (500 replicates) are shown next to the branches (Felsenstein, 1985). As a general rule, if the bootstrap value for a given interior branch is 95% or higher, then the topology at that branch is considered "correct". The tree is drawn to scale, with branch lengths in the same units as those of the evolutionary distances used to infer the phylogenetic tree. While the NJ method does not require the assumption of a constant rate of evolution so it produces an unrooted tree, MEGA, for ease of inspection, displays NJ trees in a manner similar to rooted trees. Comparison with COI sequences found in the Genbank, NCBI
Locally-generated COI gene sequences were also compared with GenBank sequence data from the National Center for Biotechnology Information (NCBI - http://www.ncbi.nlm.nih.gov.).
III. Evolutionary Analysis of Livestock and Poultry Breeds/Strains Using DNA Barcodes A. Among livestock (mammals) families/species On the average, 11.0 breeds/strains (range 3 - 17) per livestock species were
analyzed. The amount of genetic differentiation among 5 families of livestock (mammals) was 56.7% (Table 4). Mean within family distance was 52.8% based on the 5 families represented by multiple specimens (weighted equally regardless of the number of individuals). The lowest genetic diversity was found in Suidae - pigs (17.6%) and highest in Bovidae - buffalo, cattle, goats, and sheep (44.0%). The large mean genetic diversity in the different livestock families (also based on the distance-
19
based criterion) suggest the importance of DNA barcodes in differentiating unknown meat and milk products to their correct and proper species classification. This means that a suspected meat product may be determined of its true origin, i.e. beef, pork, mutton, chevon, or “hot” meat - from dog or cat (Bondoc and Israel, 2011a - unpublished).
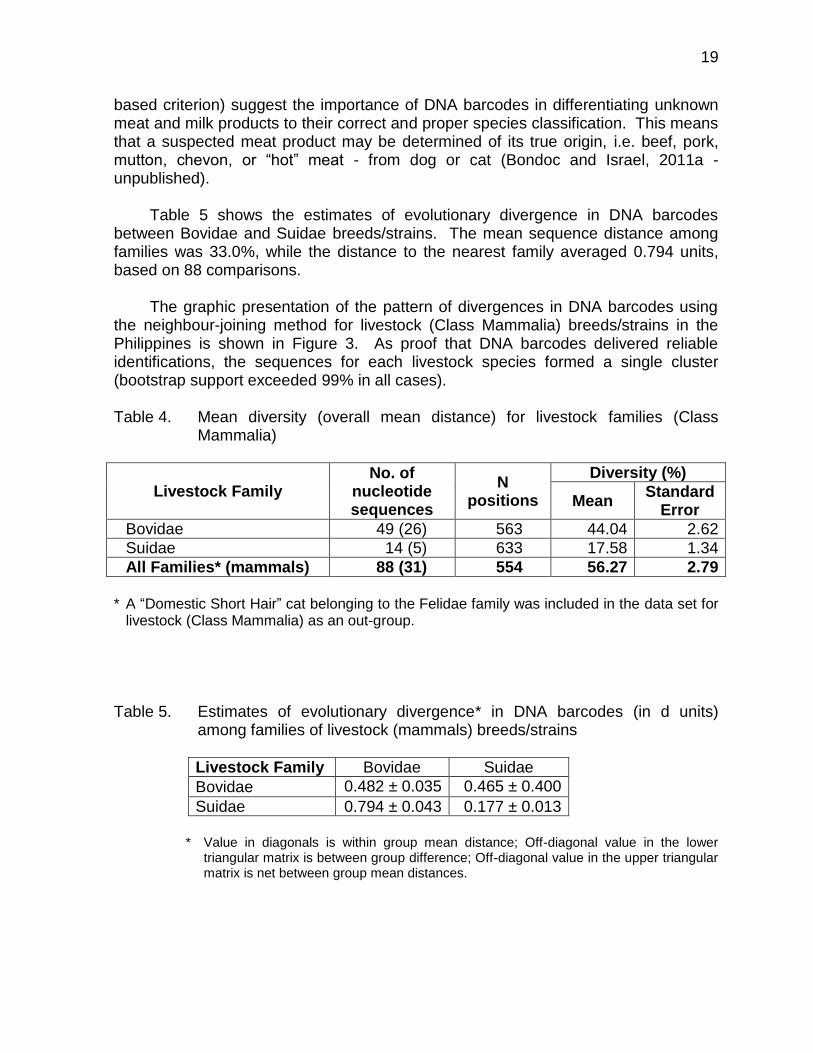
Table 5 shows the estimates of evolutionary divergence in DNA barcodes between Bovidae and Suidae breeds/strains. The mean sequence distance among families was 33.0%, while the distance to the nearest family averaged 0.794 units, based on 88 comparisons.
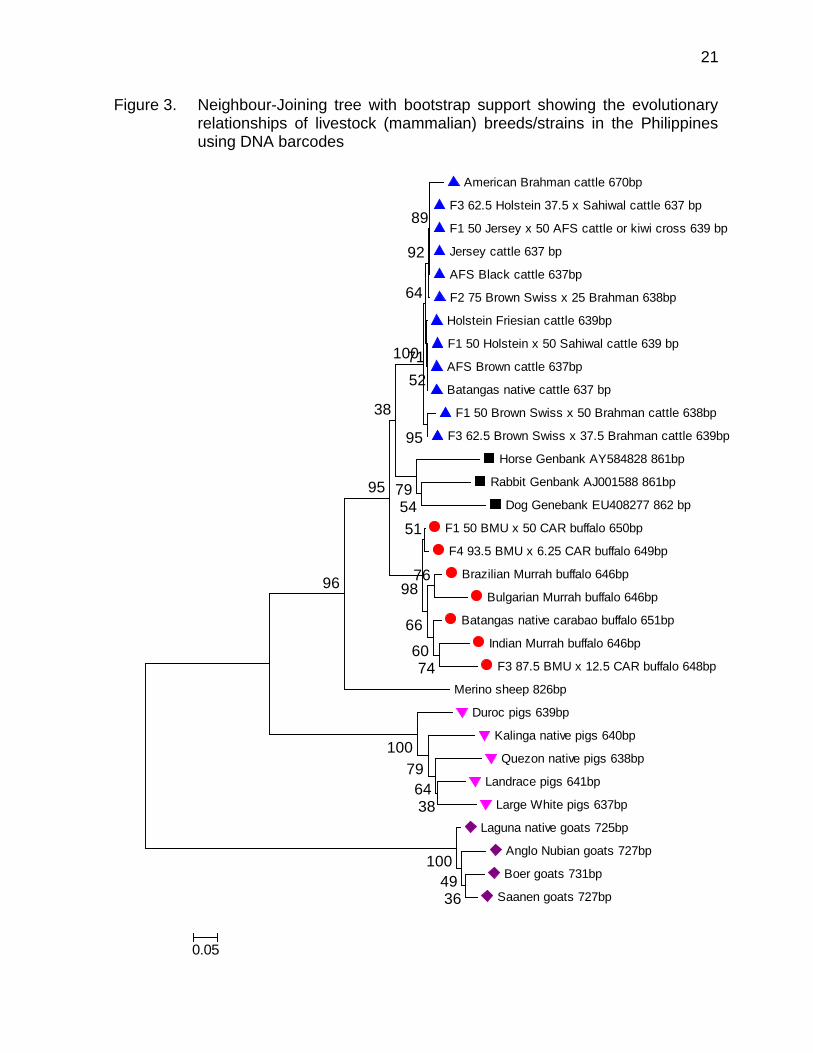
The graphic presentation of the pattern of divergences in DNA barcodes using the neighbour-joining method for livestock (Class Mammalia) breeds/strains in the Philippines is shown in Figure 3. As proof that DNA barcodes delivered reliable identifications, the sequences for each livestock species formed a single cluster (bootstrap support exceeded 99% in all cases). Table 4. Mean diversity (overall mean distance) for livestock families (Class
Mammalia)
Livestock Family No. of
nucleotide sequences
N positions
Diversity (%)
Mean Standard
Error
Bovidae 49 (26) 563 44.04 2.62
Suidae 14 (5) 633 17.58 1.34
All Families* (mammals) 88 (31) 554 56.27 2.79
* A “Domestic Short Hair” cat belonging to the Felidae family was included in the data set for
livestock (Class Mammalia) as an out-group.
Table 5. Estimates of evolutionary divergence* in DNA barcodes (in d units)
among families of livestock (mammals) breeds/strains
Livestock Family Bovidae Suidae
Bovidae 0.482 ± 0.035 0.465 ± 0.400
Suidae 0.794 ± 0.043 0.177 ± 0.013
* Value in diagonals is within group mean distance; Off-diagonal value in the lower
triangular matrix is between group difference; Off-diagonal value in the upper triangular matrix is net between group mean distances.
20
A.1. Among ruminant breeds/strains
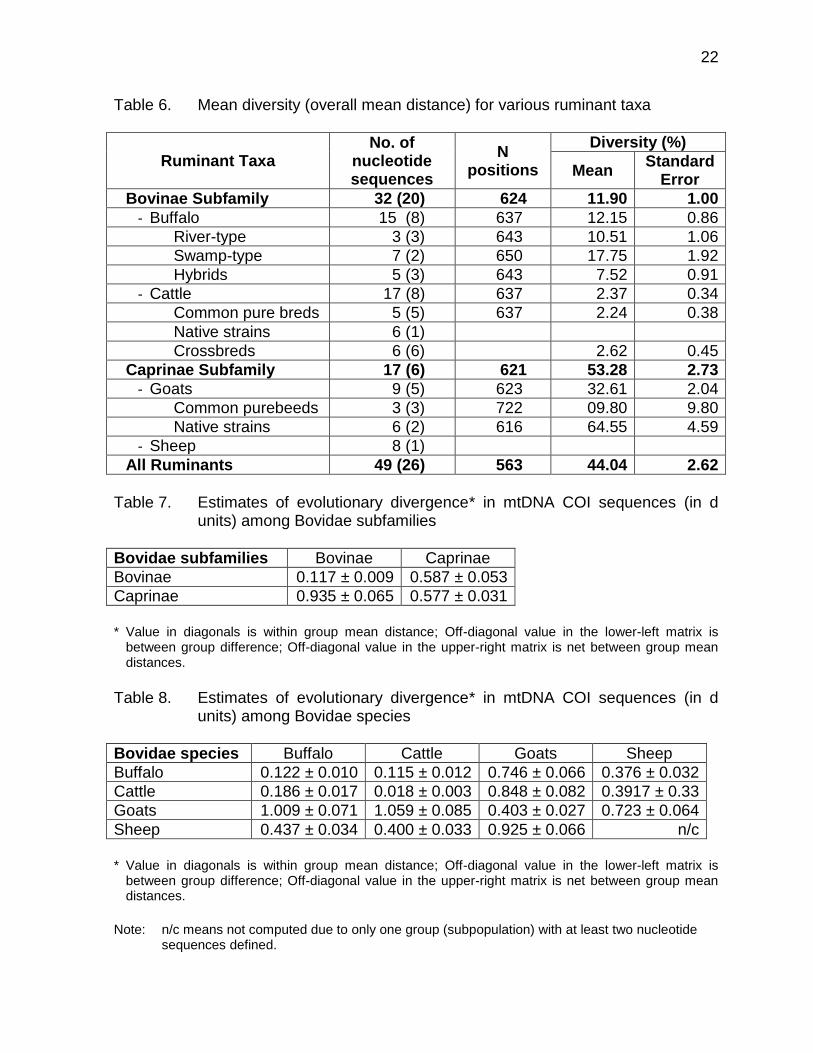
The coefficients of evolutionary differentiation among ruminant breeds/strains (i.e. within the Bovidae family) are shown in Table 6. Higher diversity was found in livestock breeds/strains belonging to the Caprinae subfamily (53.3%) than the Bovinae subfamily (11.9%). The lower mean diversity in the Bovinae subfamily is due to the low divergence among cattle breeds/strains and the presence of several crossbred specimens in the data set. In Table 7, the average genetic distance within each subfamily (d=0.347s) was lower than the mean sequence distance between the subfamilies (d=0.935).
The amount of genetic differentiation among the ruminant species was 44.0%
(Table 6). The mean sequence intraspecific distance was 0.181 units, based on 4 species represented by multiple specimens (weighted equally regardless of the number of individuals). Based on 49 ruminant breeds/strains in the data set, the minimum distance to the nearest species (congener) was 0.186 units (Table 8).
COI sequence variation between ruminant species was generally much greater than that within ruminant species, and no two species shared barcodes. Using the distance-based criterion (base on diagnostic nucleotide substitutions), COI sequence information enabled assignment of specimens to known species. DNA barcodes can also be an effective tool for both differentiating and identifying breeds/strains of buffalo, goats, and sheep but not for cattle (Bondoc and Israel, 2011b - unpublished).
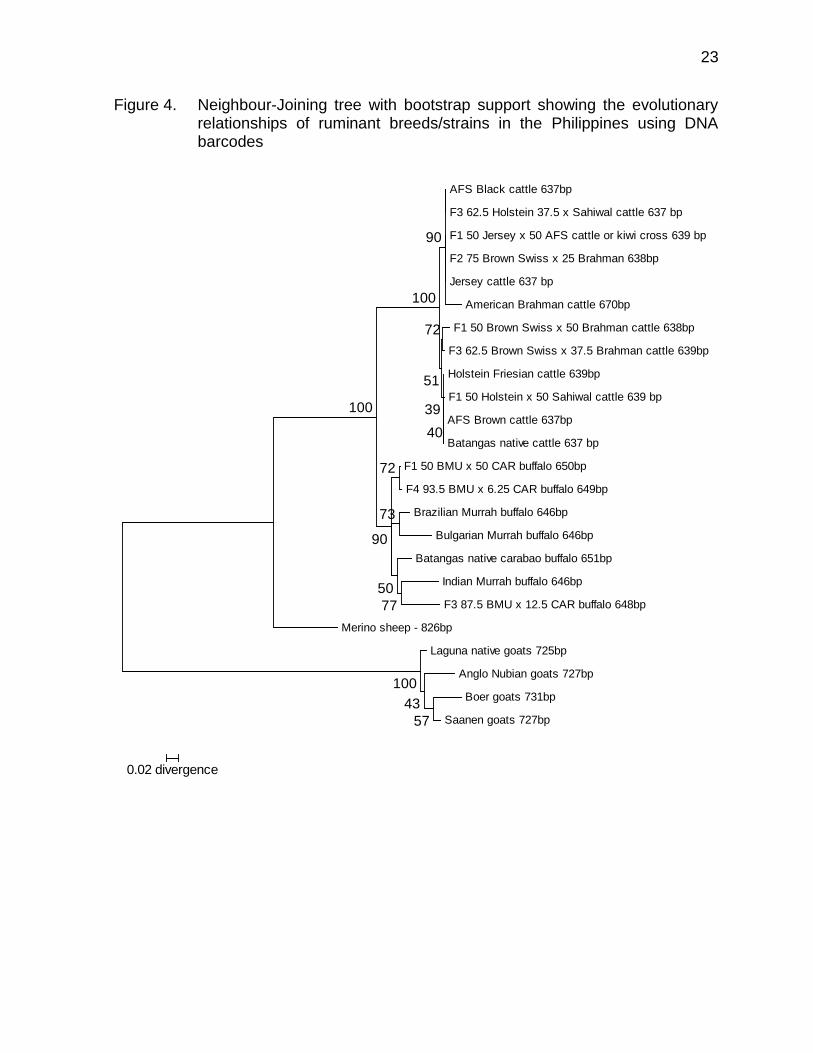
The pattern of divergences in DNA barcodes using the neighbour-joining method for ruminant breeds/strains in the Philippines is shown in Figure 4. As proof that DNA barcodes delivered reliable identifications, the sequences for each livestock family formed a single cluster (average bootstrap support for livestock families nodes with multiple individuals was 100%).
21
Figure 3. Neighbour-Joining tree with bootstrap support showing the evolutionary relationships of livestock (mammalian) breeds/strains in the Philippines using DNA barcodes
American Brahman cattle 670bp
F3 62.5 Holstein 37.5 x Sahiwal cattle 637 bp
F1 50 Jersey x 50 AFS cattle or kiwi cross 639 bp
Jersey cattle 637 bp
AFS Black cattle 637bp
F2 75 Brown Swiss x 25 Brahman 638bp
Holstein Friesian cattle 639bp
F1 50 Holstein x 50 Sahiwal cattle 639 bp
AFS Brown cattle 637bp
Batangas native cattle 637 bp
F1 50 Brown Swiss x 50 Brahman cattle 638bp
F3 62.5 Brown Swiss x 37.5 Brahman cattle 639bp
Horse Genbank AY584828 861bp
Rabbit Genbank AJ001588 861bp
Dog Genebank EU408277 862 bp
F1 50 BMU x 50 CAR buffalo 650bp
F4 93.5 BMU x 6.25 CAR buffalo 649bp
Brazilian Murrah buffalo 646bp
Bulgarian Murrah buffalo 646bp
Batangas native carabao buffalo 651bp
Indian Murrah buffalo 646bp
F3 87.5 BMU x 12.5 CAR buffalo 648bp
Merino sheep 826bp
Duroc pigs 639bp
Kalinga native pigs 640bp
Quezon native pigs 638bp
Landrace pigs 641bp
Large White pigs 637bp
Laguna native goats 725bp
Anglo Nubian goats 727bp
Boer goats 731bp
Saanen goats 727bp3649
100
3864
79
100
96
74
76
60
66
51
98
547995
38
95
100
52
71
64
92
89
0.05
22
Table 6. Mean diversity (overall mean distance) for various ruminant taxa
Ruminant Taxa No. of
nucleotide sequences
N positions
Diversity (%)
Mean Standard
Error
Bovinae Subfamily 32 (20) 624 11.90 1.00
- Buffalo 15 (8) 637 12.15 0.86
River-type 3 (3) 643 10.51 1.06
Swamp-type 7 (2) 650 17.75 1.92
Hybrids 5 (3) 643 7.52 0.91
- Cattle 17 (8) 637 2.37 0.34
Common pure breds 5 (5) 637 2.24 0.38
Native strains 6 (1)
Crossbreds 6 (6) 2.62 0.45
Caprinae Subfamily 17 (6) 621 53.28 2.73
- Goats 9 (5) 623 32.61 2.04
Common purebeeds 3 (3) 722 09.80 9.80
Native strains 6 (2) 616 64.55 4.59
- Sheep 8 (1)
All Ruminants 49 (26) 563 44.04 2.62
Table 7. Estimates of evolutionary divergence* in mtDNA COI sequences (in d
units) among Bovidae subfamilies
Bovidae subfamilies Bovinae Caprinae
Bovinae 0.117 ± 0.009 0.587 ± 0.053
Caprinae 0.935 ± 0.065 0.577 ± 0.031
* Value in diagonals is within group mean distance; Off-diagonal value in the lower-left matrix is
between group difference; Off-diagonal value in the upper-right matrix is net between group mean distances.
Table 8. Estimates of evolutionary divergence* in mtDNA COI sequences (in d
units) among Bovidae species
Bovidae species Buffalo Cattle Goats Sheep
Buffalo 0.122 ± 0.010 0.115 ± 0.012 0.746 ± 0.066 0.376 ± 0.032
Cattle 0.186 ± 0.017 0.018 ± 0.003 0.848 ± 0.082 0.3917 ± 0.33
Goats 1.009 ± 0.071 1.059 ± 0.085 0.403 ± 0.027 0.723 ± 0.064
Sheep 0.437 ± 0.034 0.400 ± 0.033 0.925 ± 0.066 n/c
* Value in diagonals is within group mean distance; Off-diagonal value in the lower-left matrix is
between group difference; Off-diagonal value in the upper-right matrix is net between group mean distances.
Note: n/c means not computed due to only one group (subpopulation) with at least two nucleotide
sequences defined.
23
Figure 4. Neighbour-Joining tree with bootstrap support showing the evolutionary relationships of ruminant breeds/strains in the Philippines using DNA barcodes
AFS Black cattle 637bp
F3 62.5 Holstein 37.5 x Sahiwal cattle 637 bp
F1 50 Jersey x 50 AFS cattle or kiwi cross 639 bp
F2 75 Brown Swiss x 25 Brahman 638bp
Jersey cattle 637 bp
American Brahman cattle 670bp
F1 50 Brown Swiss x 50 Brahman cattle 638bp
F3 62.5 Brown Swiss x 37.5 Brahman cattle 639bp
Holstein Friesian cattle 639bp
F1 50 Holstein x 50 Sahiwal cattle 639 bp
AFS Brown cattle 637bp
Batangas native cattle 637 bp
F1 50 BMU x 50 CAR buffalo 650bp
F4 93.5 BMU x 6.25 CAR buffalo 649bp
Brazilian Murrah buffalo 646bp
Bulgarian Murrah buffalo 646bp
Batangas native carabao buffalo 651bp
Indian Murrah buffalo 646bp
F3 87.5 BMU x 12.5 CAR buffalo 648bp
Merino sheep - 826bp
Laguna native goats 725bp
Anglo Nubian goats 727bp
Boer goats 731bp
Saanen goats 727bp
90
72
40
39
51
100
77
73
72
50
90
100
57
43
100
0.02 divergence
24
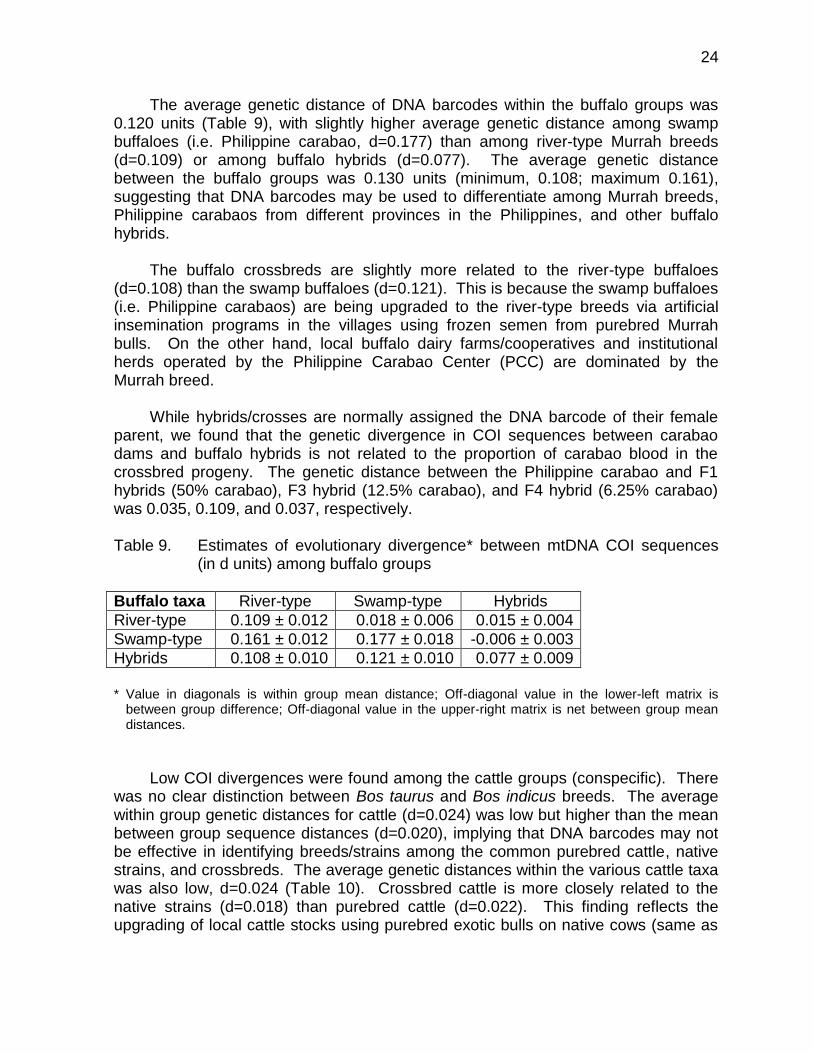
The average genetic distance of DNA barcodes within the buffalo groups was 0.120 units (Table 9), with slightly higher average genetic distance among swamp buffaloes (i.e. Philippine carabao, d=0.177) than among river-type Murrah breeds (d=0.109) or among buffalo hybrids (d=0.077). The average genetic distance between the buffalo groups was 0.130 units (minimum, 0.108; maximum 0.161), suggesting that DNA barcodes may be used to differentiate among Murrah breeds, Philippine carabaos from different provinces in the Philippines, and other buffalo hybrids.
The buffalo crossbreds are slightly more related to the river-type buffaloes (d=0.108) than the swamp buffaloes (d=0.121). This is because the swamp buffaloes (i.e. Philippine carabaos) are being upgraded to the river-type breeds via artificial insemination programs in the villages using frozen semen from purebred Murrah bulls. On the other hand, local buffalo dairy farms/cooperatives and institutional herds operated by the Philippine Carabao Center (PCC) are dominated by the Murrah breed.
While hybrids/crosses are normally assigned the DNA barcode of their female parent, we found that the genetic divergence in COI sequences between carabao dams and buffalo hybrids is not related to the proportion of carabao blood in the crossbred progeny. The genetic distance between the Philippine carabao and F1 hybrids (50% carabao), F3 hybrid (12.5% carabao), and F4 hybrid (6.25% carabao) was 0.035, 0.109, and 0.037, respectively. Table 9. Estimates of evolutionary divergence* between mtDNA COI sequences
(in d units) among buffalo groups
Buffalo taxa River-type Swamp-type Hybrids
River-type 0.109 ± 0.012 0.018 ± 0.006 0.015 ± 0.004
Swamp-type 0.161 ± 0.012 0.177 ± 0.018 -0.006 ± 0.003
Hybrids 0.108 ± 0.010 0.121 ± 0.010 0.077 ± 0.009
* Value in diagonals is within group mean distance; Off-diagonal value in the lower-left matrix is
between group difference; Off-diagonal value in the upper-right matrix is net between group mean distances.
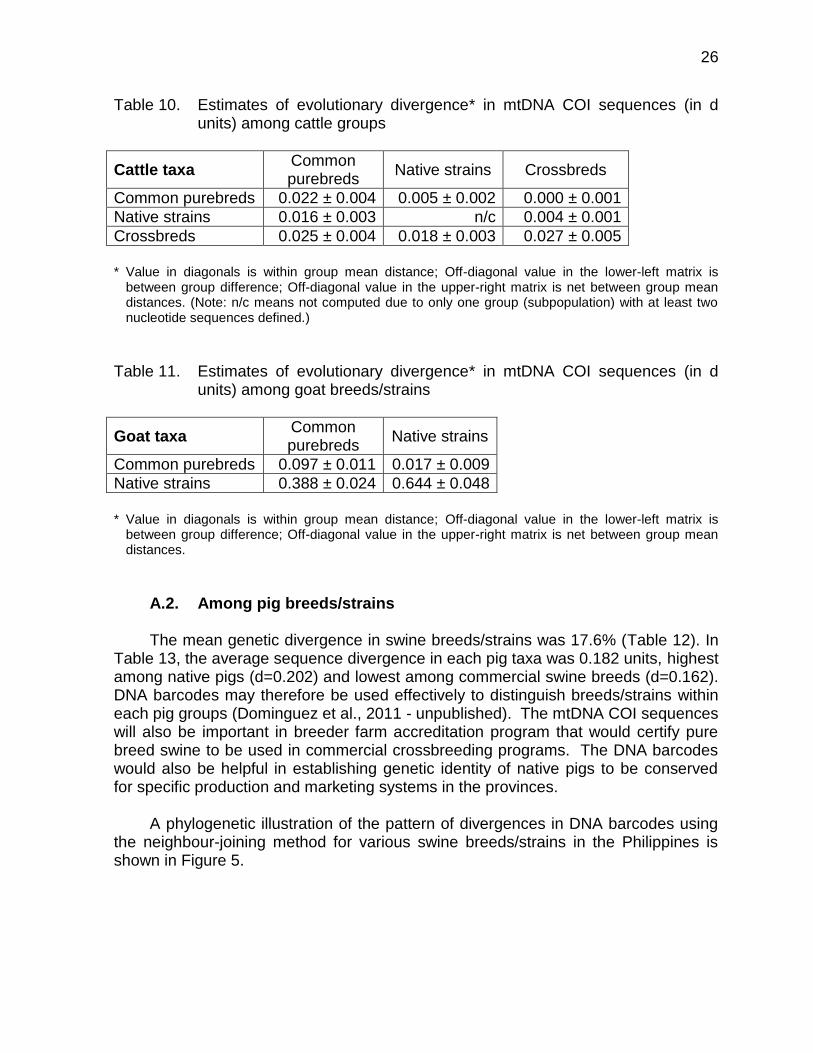
Low COI divergences were found among the cattle groups (conspecific). There was no clear distinction between Bos taurus and Bos indicus breeds. The average within group genetic distances for cattle (d=0.024) was low but higher than the mean between group sequence distances (d=0.020), implying that DNA barcodes may not be effective in identifying breeds/strains among the common purebred cattle, native strains, and crossbreds. The average genetic distances within the various cattle taxa was also low, d=0.024 (Table 10). Crossbred cattle is more closely related to the native strains (d=0.018) than purebred cattle (d=0.022). This finding reflects the upgrading of local cattle stocks using purebred exotic bulls on native cows (same as
25
in the carabao upgrading program) and mtDNA COI is known to be maternally inherited in crossbred progenies through their native dams.
Unlike in buffaloes, we found that the low genetic divergence in COI sequences
between purebred American Brahman and its crossbred progeny is positively related to the proportion of Brahman blood in the crossbred progeny. The genetic distance between Brahman and F1 crossbred cattle (50% Brahman), F3 hybrid (37.5% Brahman), and F2 hybrid (25% Brahman) was 0.067, 0.050, and 0.028, respectively.
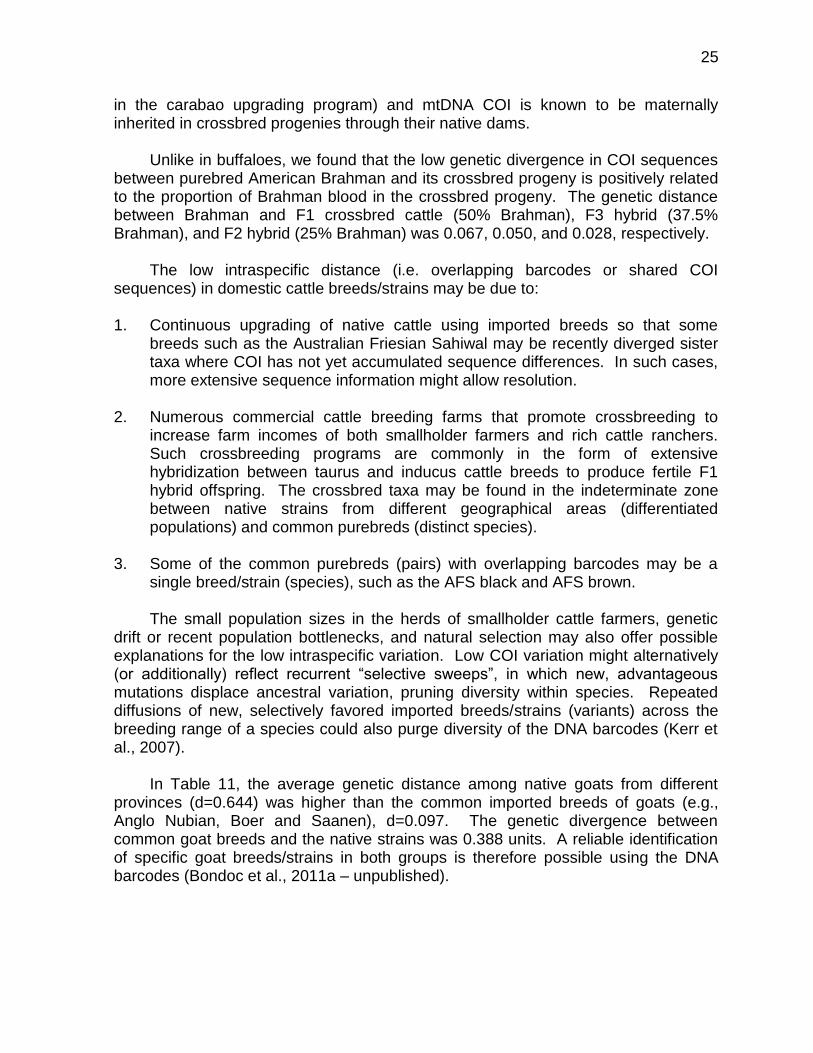
The low intraspecific distance (i.e. overlapping barcodes or shared COI
sequences) in domestic cattle breeds/strains may be due to:
1. Continuous upgrading of native cattle using imported breeds so that some breeds such as the Australian Friesian Sahiwal may be recently diverged sister taxa where COI has not yet accumulated sequence differences. In such cases, more extensive sequence information might allow resolution.
2. Numerous commercial cattle breeding farms that promote crossbreeding to increase farm incomes of both smallholder farmers and rich cattle ranchers. Such crossbreeding programs are commonly in the form of extensive hybridization between taurus and inducus cattle breeds to produce fertile F1 hybrid offspring. The crossbred taxa may be found in the indeterminate zone between native strains from different geographical areas (differentiated populations) and common purebreds (distinct species).
3. Some of the common purebreds (pairs) with overlapping barcodes may be a
single breed/strain (species), such as the AFS black and AFS brown.
The small population sizes in the herds of smallholder cattle farmers, genetic drift or recent population bottlenecks, and natural selection may also offer possible explanations for the low intraspecific variation. Low COI variation might alternatively (or additionally) reflect recurrent “selective sweeps”, in which new, advantageous mutations displace ancestral variation, pruning diversity within species. Repeated diffusions of new, selectively favored imported breeds/strains (variants) across the breeding range of a species could also purge diversity of the DNA barcodes (Kerr et al., 2007).
In Table 11, the average genetic distance among native goats from different provinces (d=0.644) was higher than the common imported breeds of goats (e.g., Anglo Nubian, Boer and Saanen), d=0.097. The genetic divergence between common goat breeds and the native strains was 0.388 units. A reliable identification of specific goat breeds/strains in both groups is therefore possible using the DNA barcodes (Bondoc et al., 2011a – unpublished).
26
Table 10. Estimates of evolutionary divergence* in mtDNA COI sequences (in d units) among cattle groups
Cattle taxa Common purebreds
Native strains Crossbreds
Common purebreds 0.022 ± 0.004 0.005 ± 0.002 0.000 ± 0.001
Native strains 0.016 ± 0.003 n/c 0.004 ± 0.001
Crossbreds 0.025 ± 0.004 0.018 ± 0.003 0.027 ± 0.005
* Value in diagonals is within group mean distance; Off-diagonal value in the lower-left matrix is
between group difference; Off-diagonal value in the upper-right matrix is net between group mean distances. (Note: n/c means not computed due to only one group (subpopulation) with at least two nucleotide sequences defined.)
Table 11. Estimates of evolutionary divergence* in mtDNA COI sequences (in d
units) among goat breeds/strains
Goat taxa Common purebreds
Native strains
Common purebreds 0.097 ± 0.011 0.017 ± 0.009
Native strains 0.388 ± 0.024 0.644 ± 0.048
* Value in diagonals is within group mean distance; Off-diagonal value in the lower-left matrix is
between group difference; Off-diagonal value in the upper-right matrix is net between group mean distances.
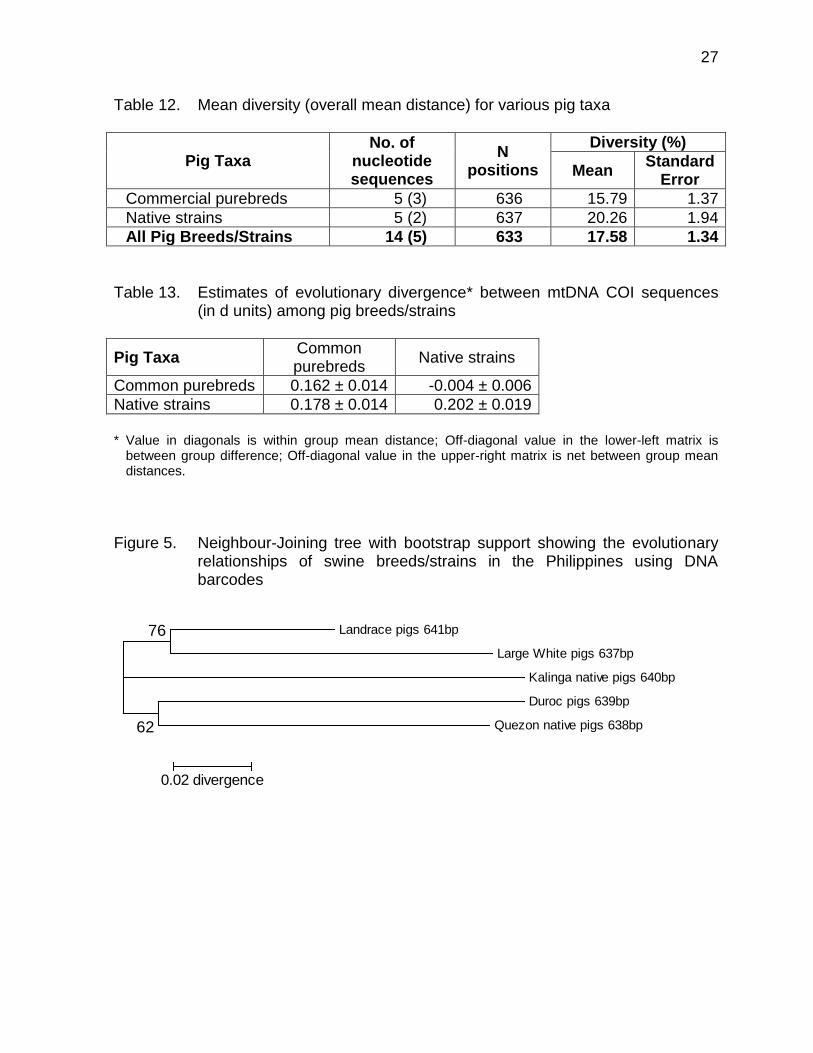
A.2. Among pig breeds/strains The mean genetic divergence in swine breeds/strains was 17.6% (Table 12). In
Table 13, the average sequence divergence in each pig taxa was 0.182 units, highest among native pigs (d=0.202) and lowest among commercial swine breeds (d=0.162). DNA barcodes may therefore be used effectively to distinguish breeds/strains within each pig groups (Dominguez et al., 2011 - unpublished). The mtDNA COI sequences will also be important in breeder farm accreditation program that would certify pure breed swine to be used in commercial crossbreeding programs. The DNA barcodes would also be helpful in establishing genetic identity of native pigs to be conserved for specific production and marketing systems in the provinces.
A phylogenetic illustration of the pattern of divergences in DNA barcodes using the neighbour-joining method for various swine breeds/strains in the Philippines is shown in Figure 5.
27
Table 12. Mean diversity (overall mean distance) for various pig taxa
Pig Taxa No. of
nucleotide sequences
N positions
Diversity (%)
Mean Standard
Error
Commercial purebreds 5 (3) 636 15.79 1.37
Native strains 5 (2) 637 20.26 1.94
All Pig Breeds/Strains 14 (5) 633 17.58 1.34
Table 13. Estimates of evolutionary divergence* between mtDNA COI sequences
(in d units) among pig breeds/strains
Pig Taxa Common purebreds
Native strains
Common purebreds 0.162 ± 0.014 -0.004 ± 0.006
Native strains 0.178 ± 0.014 0.202 ± 0.019
* Value in diagonals is within group mean distance; Off-diagonal value in the lower-left matrix is
between group difference; Off-diagonal value in the upper-right matrix is net between group mean distances.
Figure 5. Neighbour-Joining tree with bootstrap support showing the evolutionary
relationships of swine breeds/strains in the Philippines using DNA barcodes
Landrace pigs 641bp
Large White pigs 637bp
Kalinga native pigs 640bp
Duroc pigs 639bp
Quezon native pigs 638bp
76
62
0.02 divergence
28
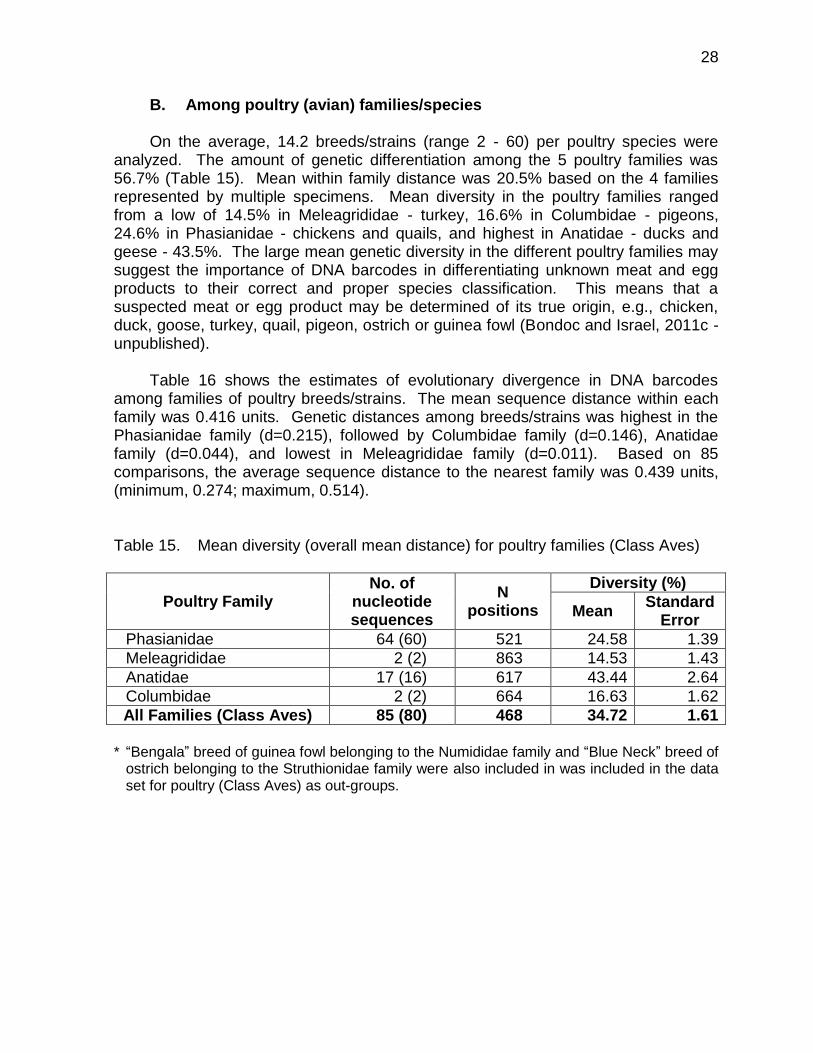
B. Among poultry (avian) families/species
On the average, 14.2 breeds/strains (range 2 - 60) per poultry species were analyzed. The amount of genetic differentiation among the 5 poultry families was 56.7% (Table 15). Mean within family distance was 20.5% based on the 4 families represented by multiple specimens. Mean diversity in the poultry families ranged from a low of 14.5% in Meleagrididae - turkey, 16.6% in Columbidae - pigeons, 24.6% in Phasianidae - chickens and quails, and highest in Anatidae - ducks and geese - 43.5%. The large mean genetic diversity in the different poultry families may suggest the importance of DNA barcodes in differentiating unknown meat and egg products to their correct and proper species classification. This means that a suspected meat or egg product may be determined of its true origin, e.g., chicken, duck, goose, turkey, quail, pigeon, ostrich or guinea fowl (Bondoc and Israel, 2011c - unpublished).
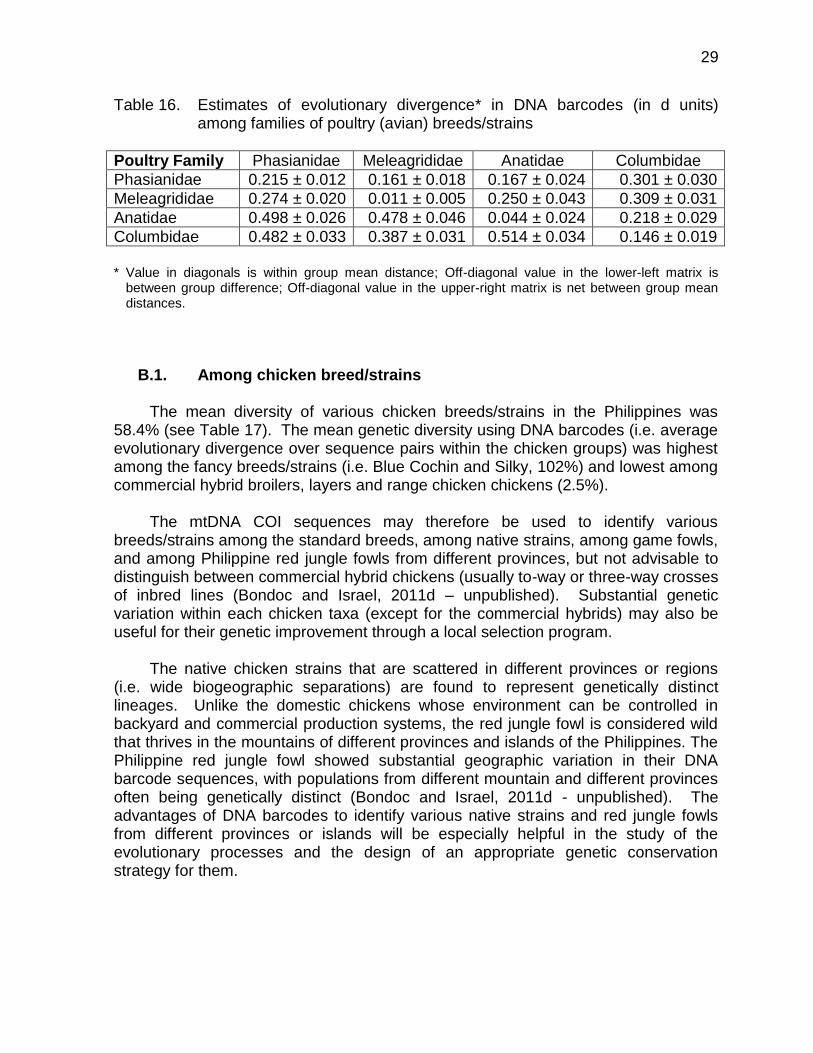
Table 16 shows the estimates of evolutionary divergence in DNA barcodes
among families of poultry breeds/strains. The mean sequence distance within each family was 0.416 units. Genetic distances among breeds/strains was highest in the Phasianidae family (d=0.215), followed by Columbidae family (d=0.146), Anatidae family (d=0.044), and lowest in Meleagrididae family (d=0.011). Based on 85 comparisons, the average sequence distance to the nearest family was 0.439 units, (minimum, 0.274; maximum, 0.514). Table 15. Mean diversity (overall mean distance) for poultry families (Class Aves)
Poultry Family No. of
nucleotide sequences
N positions
Diversity (%)
Mean Standard
Error
Phasianidae 64 (60) 521 24.58 1.39
Meleagrididae 2 (2) 863 14.53 1.43
Anatidae 17 (16) 617 43.44 2.64
Columbidae 2 (2) 664 16.63 1.62
All Families (Class Aves) 85 (80) 468 34.72 1.61
* “Bengala” breed of guinea fowl belonging to the Numididae family and “Blue Neck” breed of
ostrich belonging to the Struthionidae family were also included in was included in the data set for poultry (Class Aves) as out-groups.
29
Table 16. Estimates of evolutionary divergence* in DNA barcodes (in d units) among families of poultry (avian) breeds/strains
Poultry Family Phasianidae Meleagrididae Anatidae Columbidae
Phasianidae 0.215 ± 0.012 0.161 ± 0.018 0.167 ± 0.024 0.301 ± 0.030
Meleagrididae 0.274 ± 0.020 0.011 ± 0.005 0.250 ± 0.043 0.309 ± 0.031
Anatidae 0.498 ± 0.026 0.478 ± 0.046 0.044 ± 0.024 0.218 ± 0.029
Columbidae 0.482 ± 0.033 0.387 ± 0.031 0.514 ± 0.034 0.146 ± 0.019
* Value in diagonals is within group mean distance; Off-diagonal value in the lower-left matrix is
between group difference; Off-diagonal value in the upper-right matrix is net between group mean distances.
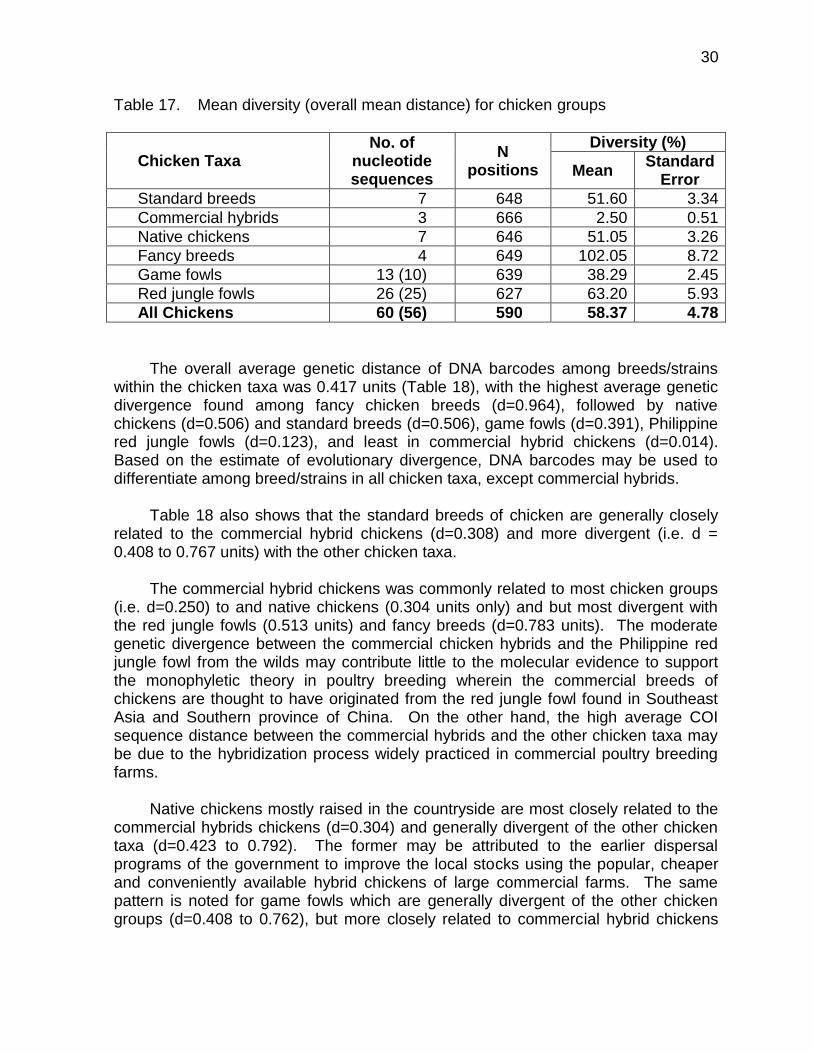
B.1. Among chicken breed/strains The mean diversity of various chicken breeds/strains in the Philippines was
58.4% (see Table 17). The mean genetic diversity using DNA barcodes (i.e. average evolutionary divergence over sequence pairs within the chicken groups) was highest among the fancy breeds/strains (i.e. Blue Cochin and Silky, 102%) and lowest among commercial hybrid broilers, layers and range chicken chickens (2.5%).
The mtDNA COI sequences may therefore be used to identify various
breeds/strains among the standard breeds, among native strains, among game fowls, and among Philippine red jungle fowls from different provinces, but not advisable to distinguish between commercial hybrid chickens (usually to-way or three-way crosses of inbred lines (Bondoc and Israel, 2011d – unpublished). Substantial genetic variation within each chicken taxa (except for the commercial hybrids) may also be useful for their genetic improvement through a local selection program.
The native chicken strains that are scattered in different provinces or regions
(i.e. wide biogeographic separations) are found to represent genetically distinct lineages. Unlike the domestic chickens whose environment can be controlled in backyard and commercial production systems, the red jungle fowl is considered wild that thrives in the mountains of different provinces and islands of the Philippines. The Philippine red jungle fowl showed substantial geographic variation in their DNA barcode sequences, with populations from different mountain and different provinces often being genetically distinct (Bondoc and Israel, 2011d - unpublished). The advantages of DNA barcodes to identify various native strains and red jungle fowls from different provinces or islands will be especially helpful in the study of the evolutionary processes and the design of an appropriate genetic conservation strategy for them.
30
Table 17. Mean diversity (overall mean distance) for chicken groups
Chicken Taxa No. of
nucleotide sequences
N positions
Diversity (%)
Mean Standard
Error
Standard breeds 7 648 51.60 3.34
Commercial hybrids 3 666 2.50 0.51
Native chickens 7 646 51.05 3.26
Fancy breeds 4 649 102.05 8.72
Game fowls 13 (10) 639 38.29 2.45
Red jungle fowls 26 (25) 627 63.20 5.93
All Chickens 60 (56) 590 58.37 4.78
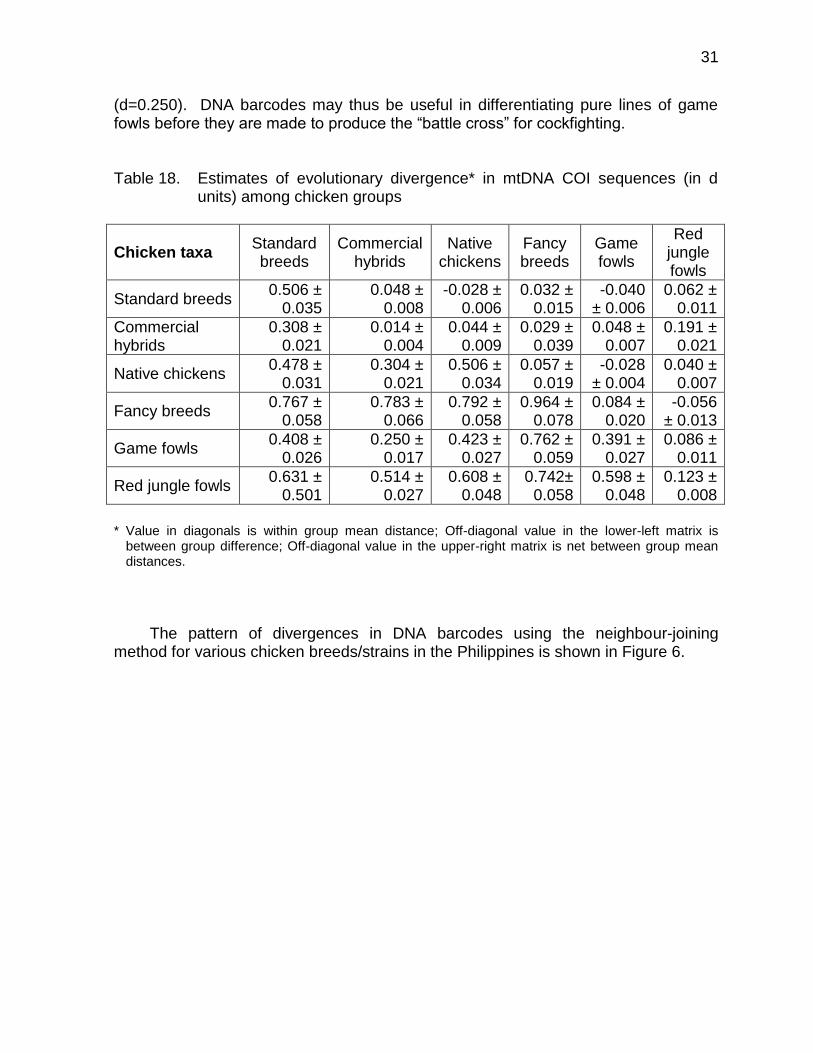
The overall average genetic distance of DNA barcodes among breeds/strains within the chicken taxa was 0.417 units (Table 18), with the highest average genetic divergence found among fancy chicken breeds (d=0.964), followed by native chickens (d=0.506) and standard breeds (d=0.506), game fowls (d=0.391), Philippine red jungle fowls (d=0.123), and least in commercial hybrid chickens (d=0.014). Based on the estimate of evolutionary divergence, DNA barcodes may be used to differentiate among breed/strains in all chicken taxa, except commercial hybrids.
Table 18 also shows that the standard breeds of chicken are generally closely
related to the commercial hybrid chickens (d=0.308) and more divergent (i.e. d = 0.408 to 0.767 units) with the other chicken taxa.
The commercial hybrid chickens was commonly related to most chicken groups
(i.e. d=0.250) to and native chickens (0.304 units only) and but most divergent with the red jungle fowls (0.513 units) and fancy breeds (d=0.783 units). The moderate genetic divergence between the commercial chicken hybrids and the Philippine red jungle fowl from the wilds may contribute little to the molecular evidence to support the monophyletic theory in poultry breeding wherein the commercial breeds of chickens are thought to have originated from the red jungle fowl found in Southeast Asia and Southern province of China. On the other hand, the high average COI sequence distance between the commercial hybrids and the other chicken taxa may be due to the hybridization process widely practiced in commercial poultry breeding farms.
Native chickens mostly raised in the countryside are most closely related to the
commercial hybrids chickens (d=0.304) and generally divergent of the other chicken taxa (d=0.423 to 0.792). The former may be attributed to the earlier dispersal programs of the government to improve the local stocks using the popular, cheaper and conveniently available hybrid chickens of large commercial farms. The same pattern is noted for game fowls which are generally divergent of the other chicken groups (d=0.408 to 0.762), but more closely related to commercial hybrid chickens
31
(d=0.250). DNA barcodes may thus be useful in differentiating pure lines of game fowls before they are made to produce the “battle cross” for cockfighting. Table 18. Estimates of evolutionary divergence* in mtDNA COI sequences (in d
units) among chicken groups
Chicken taxa Standard breeds
Commercial hybrids
Native chickens
Fancy breeds
Game fowls
Red jungle fowls
Standard breeds 0.506 ±
0.035 0.048 ±
0.008 -0.028 ±
0.006 0.032 ±
0.015 -0.040
± 0.006 0.062 ±
0.011
Commercial hybrids
0.308 ± 0.021
0.014 ± 0.004
0.044 ± 0.009
0.029 ± 0.039
0.048 ± 0.007
0.191 ± 0.021
Native chickens 0.478 ±
0.031 0.304 ±
0.021 0.506 ±
0.034 0.057 ±
0.019 -0.028
± 0.004 0.040 ±
0.007
Fancy breeds 0.767 ±
0.058 0.783 ±
0.066 0.792 ±
0.058 0.964 ±
0.078 0.084 ±
0.020 -0.056
± 0.013
Game fowls 0.408 ±
0.026 0.250 ±
0.017 0.423 ±
0.027 0.762 ±
0.059 0.391 ±
0.027 0.086 ±
0.011
Red jungle fowls 0.631 ±
0.501 0.514 ±
0.027 0.608 ±
0.048 0.742±
0.058 0.598 ±
0.048 0.123 ±
0.008
* Value in diagonals is within group mean distance; Off-diagonal value in the lower-left matrix is
between group difference; Off-diagonal value in the upper-right matrix is net between group mean distances.
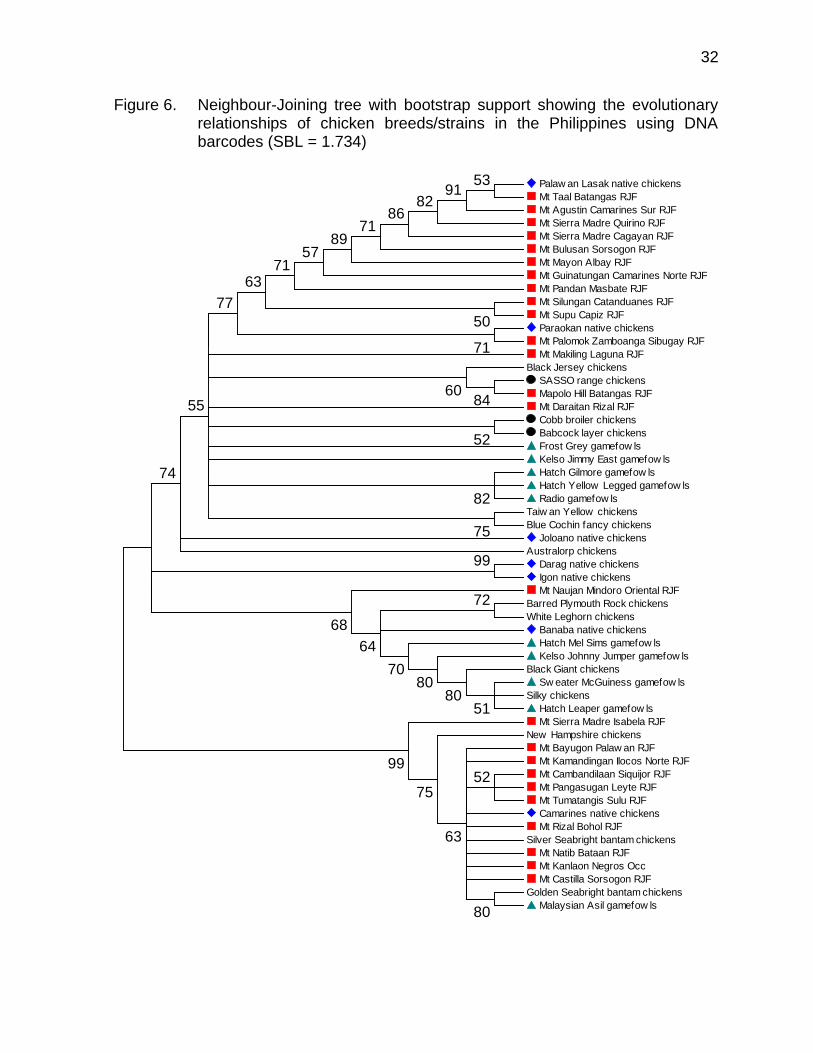
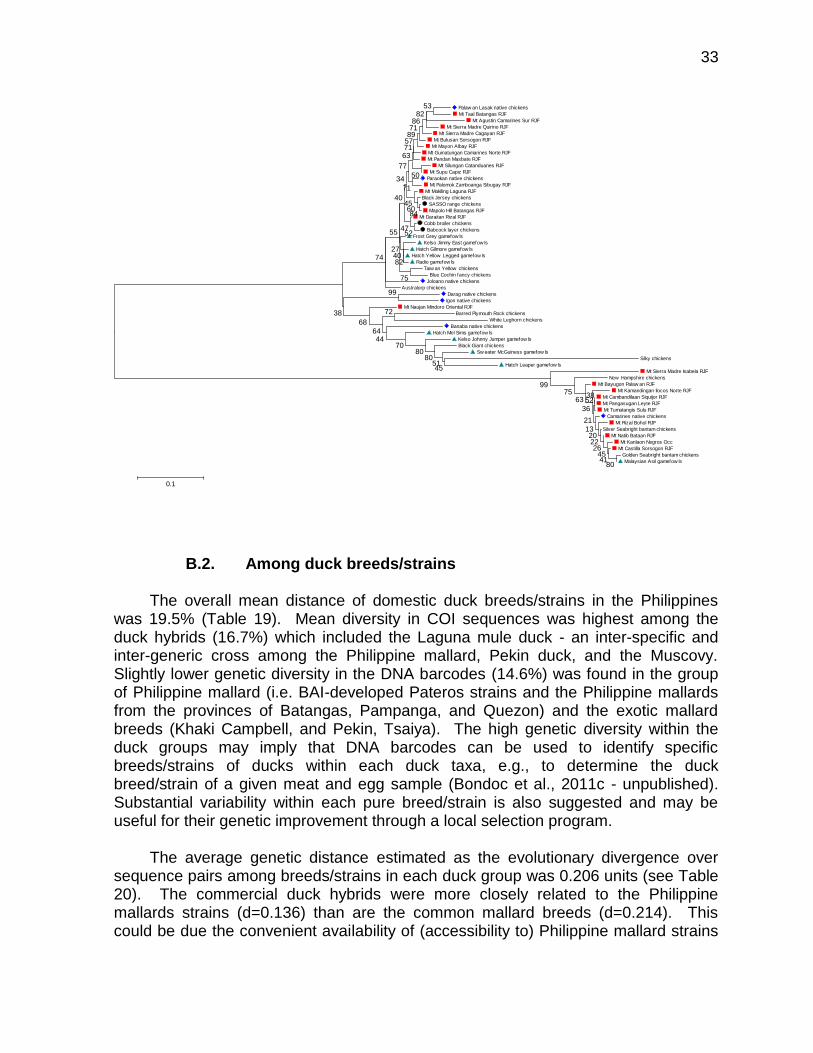
The pattern of divergences in DNA barcodes using the neighbour-joining
method for various chicken breeds/strains in the Philippines is shown in Figure 6.
32
Figure 6. Neighbour-Joining tree with bootstrap support showing the evolutionary relationships of chicken breeds/strains in the Philippines using DNA barcodes (SBL = 1.734)
Palaw an Lasak native chickens
Mt Taal Batangas RJF
Mt Agustin Camarines Sur RJF
Mt Sierra Madre Quirino RJF
Mt Sierra Madre Cagayan RJF
Mt Bulusan Sorsogon RJF
Mt Mayon Albay RJF
Mt Guinatungan Camarines Norte RJF
Mt Pandan Masbate RJF
Mt Silungan Catanduanes RJF
Mt Supu Capiz RJF
Paraokan native chickens
Mt Palomok Zamboanga Sibugay RJF
Mt Makiling Laguna RJF
Black Jersey chickens
SASSO range chickens
Mapolo Hill Batangas RJF
Mt Daraitan Rizal RJF
Cobb broiler chickens
Babcock layer chickens
Frost Grey gamefow ls
Kelso Jimmy East gamefow ls
Hatch Gilmore gamefow ls
Hatch Yellow Legged gamefow ls
Radio gamefow ls
Taiw an Yellow chickens
Blue Cochin fancy chickens
Joloano native chickens
Australorp chickens
Darag native chickens
Igon native chickens
Mt Naujan Mindoro Oriental RJF
Barred Plymouth Rock chickens
White Leghorn chickens
Banaba native chickens
Hatch Mel Sims gamefow ls
Kelso Johnny Jumper gamefow ls
Black Giant chickens
Sw eater McGuiness gamefow ls
Silky chickens
Hatch Leaper gamefow ls
Mt Sierra Madre Isabela RJF
New Hampshire chickens
Mt Bayugon Palaw an RJF
Mt Kamandingan Ilocos Norte RJF
Mt Cambandilaan Siquijor RJF
Mt Pangasugan Leyte RJF
Mt Tumatangis Sulu RJF
Camarines native chickens
Mt Rizal Bohol RJF
Silver Seabright bantam chickens
Mt Natib Bataan RJF
Mt Kanlaon Negros Occ
Mt Castilla Sorsogon RJF
Golden Seabright bantam chickens
Malaysian Asil gamefow ls
99
5391
8286
7189
84
82
5180
80
5771
71
50
63
77
75
60
52
55
74
72
70
64
68
80
99
75
63
52
33
B.2. Among duck breeds/strains
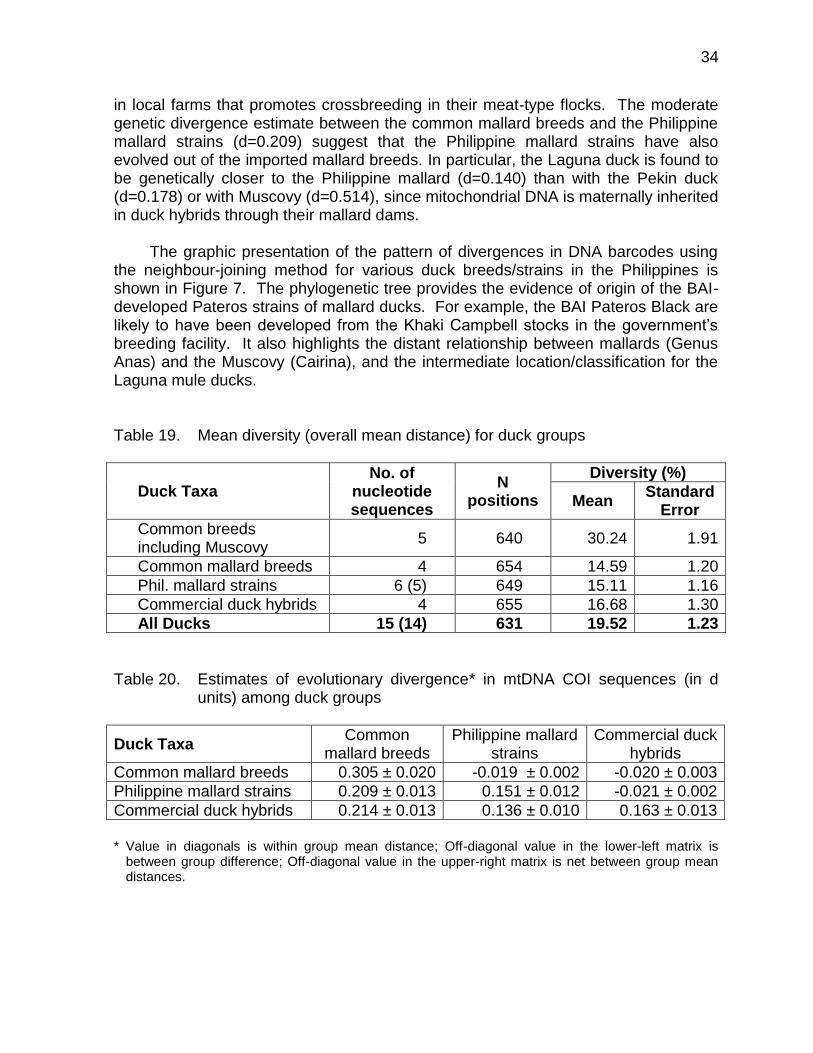
The overall mean distance of domestic duck breeds/strains in the Philippines was 19.5% (Table 19). Mean diversity in COI sequences was highest among the duck hybrids (16.7%) which included the Laguna mule duck - an inter-specific and inter-generic cross among the Philippine mallard, Pekin duck, and the Muscovy. Slightly lower genetic diversity in the DNA barcodes (14.6%) was found in the group of Philippine mallard (i.e. BAI-developed Pateros strains and the Philippine mallards from the provinces of Batangas, Pampanga, and Quezon) and the exotic mallard breeds (Khaki Campbell, and Pekin, Tsaiya). The high genetic diversity within the duck groups may imply that DNA barcodes can be used to identify specific breeds/strains of ducks within each duck taxa, e.g., to determine the duck breed/strain of a given meat and egg sample (Bondoc et al., 2011c - unpublished). Substantial variability within each pure breed/strain is also suggested and may be useful for their genetic improvement through a local selection program.
The average genetic distance estimated as the evolutionary divergence over sequence pairs among breeds/strains in each duck group was 0.206 units (see Table 20). The commercial duck hybrids were more closely related to the Philippine mallards strains (d=0.136) than are the common mallard breeds (d=0.214). This could be due the convenient availability of (accessibility to) Philippine mallard strains
Palaw an Lasak native chickens
Mt Taal Batangas RJF
Mt Agustin Camarines Sur RJF
Mt Sierra Madre Quirino RJF
Mt Sierra Madre Cagayan RJF
Mt Bulusan Sorsogon RJF
Mt Mayon Albay RJF
Mt Guinatungan Camarines Norte RJF
Mt Pandan Masbate RJF
Mt Silungan Catanduanes RJF
Mt Supu Capiz RJF
Paraokan native chickens
Mt Palomok Zamboanga Sibugay RJF
Mt Makiling Laguna RJF
Black Jersey chickens
SASSO range chickens
Mapolo Hill Batangas RJF
Mt Daraitan Rizal RJF
Cobb broiler chickens
Babcock layer chickens
Frost Grey gamefow ls
Kelso Jimmy East gamefow ls
Hatch Gilmore gamefow ls
Hatch Yellow Legged gamefow ls
Radio gamefow ls
Taiw an Yellow chickens
Blue Cochin fancy chickens
Joloano native chickens
Australorp chickens
Darag native chickens
Igon native chickens
Mt Naujan Mindoro Oriental RJF
Barred Plymouth Rock chickens
White Leghorn chickens
Banaba native chickens
Hatch Mel Sims gamefow ls
Kelso Johnny Jumper gamefow ls
Black Giant chickens
Sw eater McGuiness gamefow ls
Silky chickens
Hatch Leaper gamefow ls
Mt Sierra Madre Isabela RJF
New Hampshire chickens
Mt Bayugon Palaw an RJF
Mt Kamandingan Ilocos Norte RJF
Mt Cambandilaan Siquijor RJF
Mt Pangasugan Leyte RJF
Mt Tumatangis Sulu RJF
Camarines native chickens
Mt Rizal Bohol RJF
Silver Seabright bantam chickens
Mt Natib Bataan RJF
Mt Kanlaon Negros Occ
Mt Castilla Sorsogon RJF
Golden Seabright bantam chickens
Malaysian Asil gamefow ls
99
5382
8671
89
84
82
4551
8080
5771
71
50
63
77
75
60
5247
45
34
40
4027
55
74
72
7044
64
68
38
80
9975
4145
63
2622
36
2013
21
3852
0.1
34
in local farms that promotes crossbreeding in their meat-type flocks. The moderate genetic divergence estimate between the common mallard breeds and the Philippine mallard strains (d=0.209) suggest that the Philippine mallard strains have also evolved out of the imported mallard breeds. In particular, the Laguna duck is found to be genetically closer to the Philippine mallard (d=0.140) than with the Pekin duck (d=0.178) or with Muscovy (d=0.514), since mitochondrial DNA is maternally inherited in duck hybrids through their mallard dams.
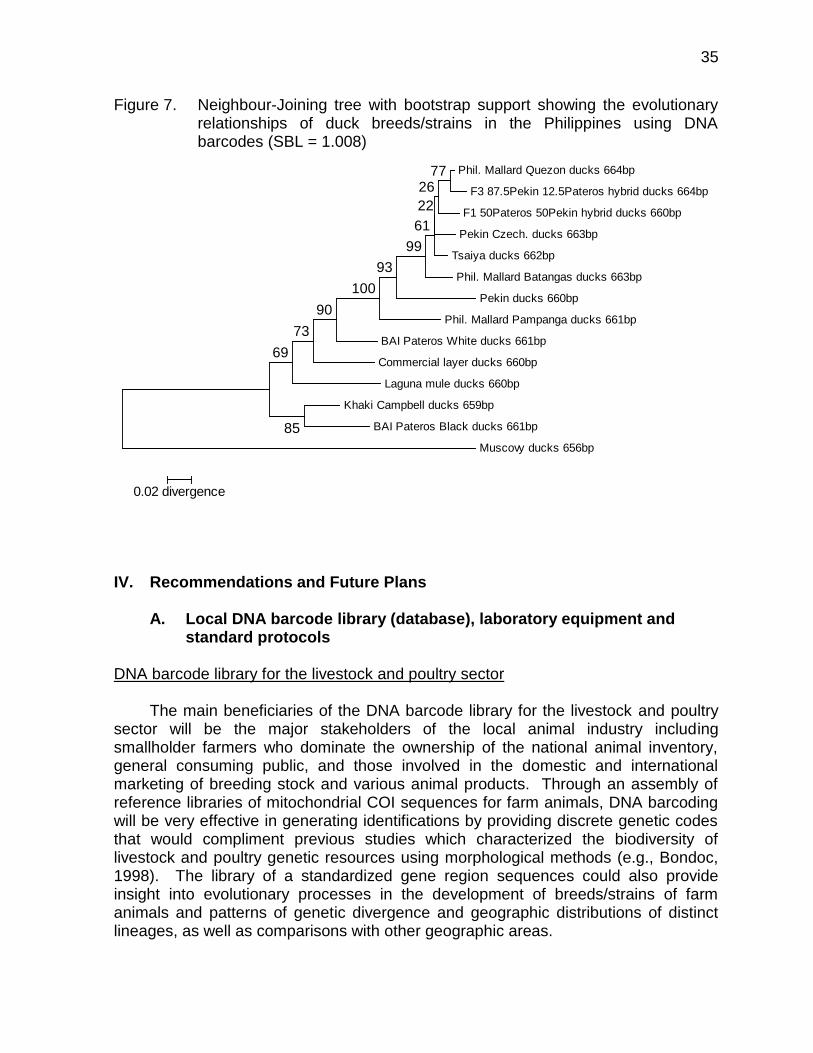
The graphic presentation of the pattern of divergences in DNA barcodes using
the neighbour-joining method for various duck breeds/strains in the Philippines is shown in Figure 7. The phylogenetic tree provides the evidence of origin of the BAI-developed Pateros strains of mallard ducks. For example, the BAI Pateros Black are likely to have been developed from the Khaki Campbell stocks in the government’s breeding facility. It also highlights the distant relationship between mallards (Genus Anas) and the Muscovy (Cairina), and the intermediate location/classification for the Laguna mule ducks. Table 19. Mean diversity (overall mean distance) for duck groups
Duck Taxa No. of
nucleotide sequences
N positions
Diversity (%)
Mean Standard
Error
Common breeds including Muscovy
5 640 30.24 1.91
Common mallard breeds 4 654 14.59 1.20
Phil. mallard strains 6 (5) 649 15.11 1.16
Commercial duck hybrids 4 655 16.68 1.30
All Ducks 15 (14) 631 19.52 1.23
Table 20. Estimates of evolutionary divergence* in mtDNA COI sequences (in d
units) among duck groups
Duck Taxa Common
mallard breeds Philippine mallard
strains Commercial duck
hybrids
Common mallard breeds 0.305 ± 0.020 -0.019 ± 0.002 -0.020 ± 0.003
Philippine mallard strains 0.209 ± 0.013 0.151 ± 0.012 -0.021 ± 0.002
Commercial duck hybrids 0.214 ± 0.013 0.136 ± 0.010 0.163 ± 0.013
* Value in diagonals is within group mean distance; Off-diagonal value in the lower-left matrix is
between group difference; Off-diagonal value in the upper-right matrix is net between group mean distances.
35
Figure 7. Neighbour-Joining tree with bootstrap support showing the evolutionary relationships of duck breeds/strains in the Philippines using DNA barcodes (SBL = 1.008)
IV. Recommendations and Future Plans
A. Local DNA barcode library (database), laboratory equipment and
standard protocols DNA barcode library for the livestock and poultry sector
The main beneficiaries of the DNA barcode library for the livestock and poultry sector will be the major stakeholders of the local animal industry including smallholder farmers who dominate the ownership of the national animal inventory, general consuming public, and those involved in the domestic and international marketing of breeding stock and various animal products. Through an assembly of reference libraries of mitochondrial COI sequences for farm animals, DNA barcoding will be very effective in generating identifications by providing discrete genetic codes that would compliment previous studies which characterized the biodiversity of livestock and poultry genetic resources using morphological methods (e.g., Bondoc, 1998). The library of a standardized gene region sequences could also provide insight into evolutionary processes in the development of breeds/strains of farm animals and patterns of genetic divergence and geographic distributions of distinct lineages, as well as comparisons with other geographic areas.
Phil. Mallard Quezon ducks 664bp
F3 87.5Pekin 12.5Pateros hybrid ducks 664bp
F1 50Pateros 50Pekin hybrid ducks 660bp
Pekin Czech. ducks 663bp
Tsaiya ducks 662bp
Phil. Mallard Batangas ducks 663bp
Pekin ducks 660bp
Phil. Mallard Pampanga ducks 661bp
BAI Pateros White ducks 661bp
Commercial layer ducks 660bp
Laguna mule ducks 660bp
Khaki Campbell ducks 659bp
BAI Pateros Black ducks 661bp
Muscovy ducks 656bp
7726
22
61
99
93
100
90
85
69
73
0.02 divergence
36
In future studies, more members of a genus (or taxa) from more than one
geographic region should be examined (i.e. broad survey of sequence diversity at COI), rather than a random sample of imprecisely defined close relatives. Increased intra- and interspecies sampling (as well as supplementation of the mitochondrial barcodes with nuclear ones) is recommended to bring greater reliability to the identification of breeds/strains. In fact, the DNA barcoding project should be expanded to cover other important areas in the animal production and health sector such as:
a. endemic pest and disease organisms and/or their vectors b. forage pastures c. important milk and meat pathogens in food safety and food processing
technologies d. farm by-products and waste microorganisms
Additional information on morphology, ecology, adaptive differences, and genetic data from the mitochondrial and nuclear genomes of livestock and poultry breeds/strains should be routinely updated in the database as these may tell different, equally valid, stories about the evolution, placement, and importance of a taxon (Rubinoff, 2006).
The locally-derived COI gene sequences should be compared with published
sequences of other breeds/strains found in the GenBank NCBI. Animal biotechnology laboratory, equipment and standard DNA barcoding protocols
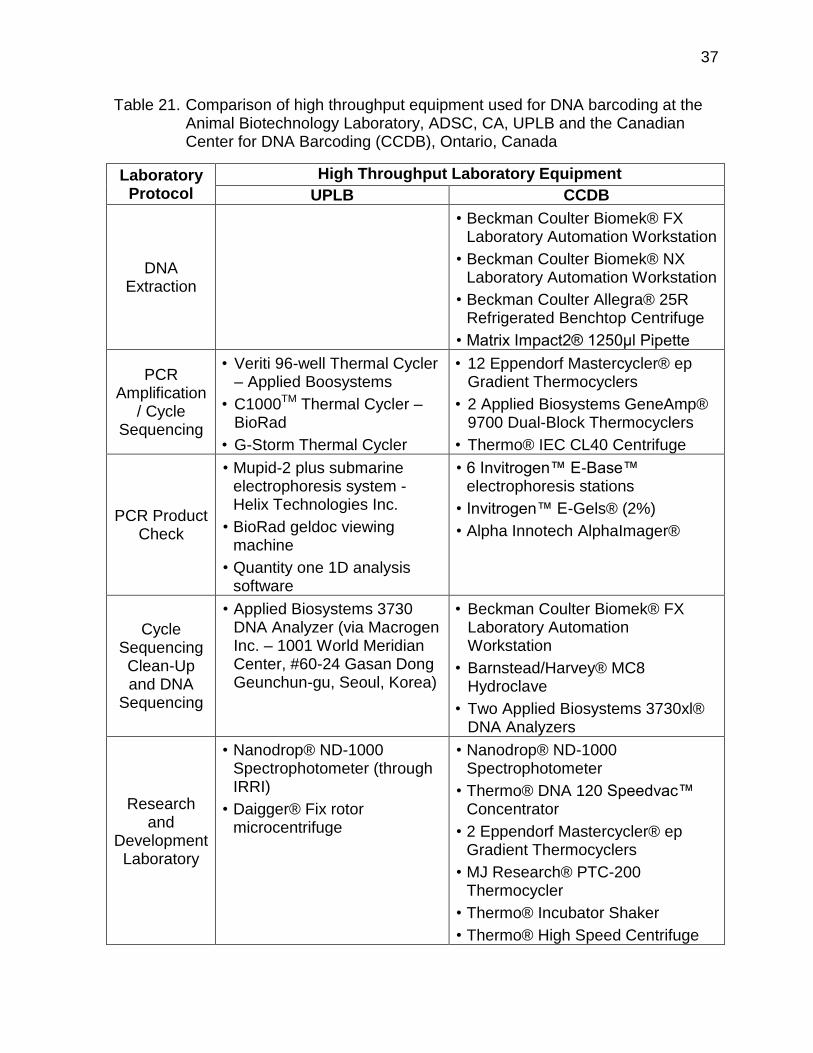
Table 21 shows a comparison of the high throughput equipment used for DNA barcoding at the Animal Biotechnology Laboratory, ADSC, CA, UPLB and the Canadian Center for DNA Barcoding (CCDB), Ontario, Canada. In the near future, the local biotechnology laboratories should be equipped with instruments that may allow extraction of DNA from tissue, hair, feathers, semen, milk and other animal parts apart from the usual blood samples. To easily recover the mtDNA COI gene of livestock and poultry breeds/strains and generate a good resolution, the optimized DNA barcoding protocols (i.e. DNA extraction, purification, elution, and amplification) should be made available to the local scientific community. The standard laboratory protocols can be used and shared by researchers and graduate students in collaboration with the Department of Agriculture’s regulatory agencies and bureaus involved in data collection and laboratory analysis through the assistance of various local government units. Through the inter-laboratory and institutional collaborations, new research projects can be developed to demonstrate the practical uses of DNA barcodes in the animal production and health subsector.
37
Table 21. Comparison of high throughput equipment used for DNA barcoding at the Animal Biotechnology Laboratory, ADSC, CA, UPLB and the Canadian Center for DNA Barcoding (CCDB), Ontario, Canada
Laboratory Protocol
High Throughput Laboratory Equipment
UPLB CCDB
DNA Extraction
• Beckman Coulter Biomek® FX Laboratory Automation Workstation
• Beckman Coulter Biomek® NX Laboratory Automation Workstation
• Beckman Coulter Allegra® 25R Refrigerated Benchtop Centrifuge
• Matrix Impact2® 1250μl Pipette
PCR Amplification
/ Cycle Sequencing
• Veriti 96-well Thermal Cycler – Applied Boosystems
• C1000TM Thermal Cycler – BioRad
• G-Storm Thermal Cycler
• 12 Eppendorf Mastercycler® ep Gradient Thermocyclers
• 2 Applied Biosystems GeneAmp® 9700 Dual-Block Thermocyclers
• Thermo® IEC CL40 Centrifuge
PCR Product Check
• Mupid-2 plus submarine electrophoresis system - Helix Technologies Inc.
• BioRad geldoc viewing machine
• Quantity one 1D analysis software
• 6 Invitrogen™ E-Base™ electrophoresis stations
• Invitrogen™ E-Gels® (2%)
• Alpha Innotech AlphaImager®
Cycle Sequencing Clean-Up and DNA
Sequencing
• Applied Biosystems 3730 DNA Analyzer (via Macrogen Inc. – 1001 World Meridian Center, #60-24 Gasan Dong Geunchun-gu, Seoul, Korea)
• Beckman Coulter Biomek® FX Laboratory Automation Workstation
• Barnstead/Harvey® MC8 Hydroclave
• Two Applied Biosystems 3730xl® DNA Analyzers
Research and
Development Laboratory
• Nanodrop® ND-1000 Spectrophotometer (through IRRI)
• Daigger® Fix rotor microcentrifuge
• Nanodrop® ND-1000 Spectrophotometer
• Thermo® DNA 120 Speedvac™ Concentrator
• 2 Eppendorf Mastercycler® ep Gradient Thermocyclers
• MJ Research® PTC-200 Thermocycler
• Thermo® Incubator Shaker
• Thermo® High Speed Centrifuge
38
B. Applications of DNA barcodes in the local livestock and poultry
industry DNA barcoding has vast potential applications in the areas of animal production
and health through broad research categories such as genetic improvement and conservation, tracking of invasive species, and labeling of breeding animals and traditional animal products. It can be used as the primary source of information in biodiversity analysis (comparative genomics) to track threats to certain species and predict animals’ responses to climate change, pollution, emerging diseases and invasive competitors.
1. Identification of breeds in local genetic improvement and conservation programs
Genetic improvement
DNA barcodes can be applied to live animals with little disturbance to provide a new, reliable method for the identification of individuals and for verification of parentage in local selection and crossbreeding programs. They may be required in local accreditation programs for nucleus and multiplier breeding farms, stock farms, breeding centers/stations; breed certification and registry work; and establishment of breed standards especially with the lack or absence of pedigree records and animal performance records in both small and large breeding farms.
In a local selection program for example, DNA barcodes may be used to
ascertain pedigrees, reconstruct phylogenies, identify phylogeographic patterns, and estimate patterns of gene flow in elite/nucleus purebred herds/flocks - which are traditionally validated through pedigree records and computation of relationship coefficients among individuals, lines, or sub-populations (Bondoc, 2008).
In commercial crossbreeding programs, DNA barcodes can be used to resolve
disputes about purity/ homozygosity of breeding populations and differences among breeds, lines, or strains in multiplier and base herds (e.g., Bondoc, 2005). There could also be wider applications of inter-specific and inter-generic crossing systems and new breed development programs currently employed in buffaloes (e.g., river and swamp type), cattle (e.g., taurus and indicus species), and ducks (Anas and Cairina genera). Genetic conservation
Breed/strain comparison studies based on DNA barcode sequences would provide the scientific imprints that can be used to protect, preserve and lay exclusive (access) claims to the native/indigenous domestic animal genetic resources considered as national treasures and symbols of our identity and cultural heritage
39
(e.g., Bondoc, 2000). DNA barcodes should be used in pre-screening important breeds/strains that are considered for conservation and/or cryopreservation in their pure form. DNA barcodes may be used to monitor and image biodiversity by cataloguing all important livestock and poultry breeds/strains. This provides a quick assessment of biodiversity and cataloguing of new breeds/strains before they become extinct. Stock/breeding farms and demonstration parks (e.g., UPLB CA Agripark, per province or per region) and should then establish reference collections that can serve as a basis for future research including the description of native genetic resources.
The analysis of DNA barcodes of common livestock and poultry breeds/strains
species may also aid conservation and research by helping determine species groups needing more detailed analysis, and by facilitating the recognition of the appropriate units and scales conservation planning (Francis et al., 2010). For example, using the high level of genetic divergence in DNA barcodes, conservation of biodiversity of native strains and wild types (e.g., Philippine red jungle fowl) will require protection for the complete suite of species within each geographic sub-region such as a mountain, island, or province, through designation of more than one farm or location/reserve in the province and more ecological studies and field surveys in each area. Genetically distinct populations, whether or not they are considered different species, are likely to have distinct ecological requirements which need to be studied and ensure effective conservation planning. For some species, it may be necessary to define areas of conservation importance at smaller scales, such as different ecoregions.
2. Tracking of invasive species DNA barcoding may be used by regulatory agencies in testing and tracking of
invasive pests to allow port inspectors who may intercept shipments harboring harmful species at borders including smuggled animals and imported feeds with forbidden items likely to spread illnesses.
DNA barcoding may aid public health authorities to identify carrier of infectious
diseases and other disease vectors to enable proper and timely application of quarantine and target control methods. Farmers could also benefit by identifying pest species invading local breeding farms and warehouses. Medical doctors and veterinarians in particular, could rapidly diagnose fungal pathogens and parasites.
DNA barcodes may also be used in introgression studies involving exotic breeds
to upgrade performance of farm animals raised by smallholder farmers. Studying the introgression patterns of introduced breeds/strains and their geographical distribution in local breeding centers/stations are important to assess the effectiveness of local animal dispersal programs.
40
3. Product labeling in the marketing and trade of animal products Consumers should be able to check animal products (i.e. breeding animals,
meat, milk and eggs) to be sure what they are buying, is what is advertised (e.g., native “lechon” or roasted pigs, native “organically-raised” chickens, etc.).
DNA barcodes generated from blood, muscle, dried skins, feathers, tissues
preserved in alcohol, frozen tissues, and mtDNA purified in Cesium chloride gradient can be used to promote proper labeling of breeding animals including breed certificates required for imported and threatened breeds/strains of livestock and poultry animals. They may also be used to test for adulteration and contamination of new and traditional animal products. DNA barcoding likewise, can be utilized to prevent and control smuggling, illegal trade, and poaching of threatened breeds/strains and other domestic animal genetic resources in violation of national and international laws such as the Animal Welfare Act (e.g., prohibiting the consumption of dog meat). Further study is required to determine the origin of such genetic variation and the taxonomic status of these farm species.
C. Establishment of a national DNA barcode library for agriculture
Based on the applied biotechnology research project initially implemented as a
collaborative effort between UPLB and the Department of Agriculture (DA) to assemble a standardized reference library for DNA-based identification of common livestock and poultry breeds/strains in the Philippines, we recommend the establishment of a national DNA barcode library for crops, livestock and fisheries to improve the capacity of the Philippine agriculture and fisheries sector to monitor and image genetic biodiversity with proposed societal and economic impacts. As a valuable tool for highlighting areas in need for further taxonomic research, DNA barcodes can hopefully facilitate international collaboration.
Economically-important specimens, both introduced or endemic/indigenous may
be contributed to the national barcode library by other molecular biology laboratories in the country in cooperation with local farmers and fisher folks, DA agencies and service bureaus (e.g., BAI, NMIS, PAHC, PCC), state colleges and universities (SCUs), DOST and DENR service and research facilities, and other government agencies/bureau (e.g., Bureau of Customs, Department of National Defense, Department of Interior and Local Government).
In the long term, separate national DNA barcode libraries useful in species
identification and biodiversity studies may also be established for other concerns in agriculture such as crop science, crop protection, food science, and agricultural systems. For example, DNA barcoding projects are currently implemented for tilapia fish and rice at the Bureau of Fisheries and Aquatic Research (BFAR) and Philippine Rice Research Institute (PhilRice), respectively through the DA Biotechnology Implementation Program.
41
Acknowledgments
This work was supported by research funds granted through the Philippines’ Department of Agriculture (DA) Biotechnology Implementation Program. We also thank the managers and owners of private and government breeding farms for their assistance in the collection of samples and Mr. Walter Krystel C. Israel, Mr. Jorge Michael D. Dominguez, and Mr. Nestor Ebuenga, Jr. for preparing specimens and assistance in molecular work.
Literature Cited Avise, J.C. 2004. Molecular Markers, Natural History, and Evolution. Mass.
Sunderland: Sinauer Associates. 684 pp. Baker, R.J. and Bradley, R.D. 2006. Speciation in mammals and the genetic species
concept. Journal of Mammalogy. 87: 643-662. Barber, P., and Boyce, S.L. 2006. Estimating diversity of Indo-Pacificcoral reef
stomatopods through DNA barcoding of stomatod larvae. Philos. Trans. R. Soc. Lond. B. Biol. Sci. 273: 2053-2061.
Barrett, R.D.H., and Hebert, P.D.N. 2005. Identifying spiders through DNA
barcodes.Can. J. Zool. 83 : 481-491. Bondoc, O.L. 1998. Biodiversity of Livestock and Poultry Genetic Resources in the
Philippines. Los Baños: IAS-CA/UPLB and PCARRD/DOST. 141 pp. Bondoc, O.L. 2000. Conservation and management of livestock and poultry genetic
resources. Philipp. Agric. Scientist. 83 (1): 98-111. Bondoc, O.L. 2008. Animal Breeding: Principles and Practice in the Philippine
Context. University of the Philippines Press, Diliman, Quezon City. 386 pp. Brown, W.M., George, M., and Wilson, A.C. 1979. Rapid evolution of animal
mitochondrial DNA. Proc Natl. Acad. Sci. USA. 76: 1967-1971. Chase, M.W., Cowan, R.S., Hollingsworth, P.M., van den Berg, C., Madriñan, S.,
Peterson, G., Seberg, O., Jorgensen, T., Cameroon, K.M., Carine, M., Pedersen, N., Hedderson, T.A.J., Conrad, F., Salazar, G.A., Richardson, J.E., Hollingsworth, M.L., Barraclough T.G., Kelly, L., and Wilkinson, M. 2007. A proposal for standardized protocol to barcode all land plants. Taxon. 56: 295-299.
42
CBOL Plant Working Group (2009) A DNA barcode for land plants. Proceedings of the National Academy of Sciences, USA, 106: 12794-12797.
Chinnery, P.F. and Schon, E.A. 2003. Mitochondria. J Neurol Neurosurg Psychiatry.
74: 1188-1199. Corbet, G.B., and Hill, J.E. 1992. The Mammals of the Indomalayan Region. Oxford:
Oxford University Press. 488 pp. Dawney, N.R., Ogden, R., McEwing, R., Carvalho, G.R. and Thorpe, R.S. 2007.
Validation of the barcoding gene COI for use in forensic genetic species identification. Forensic Sci. Int. 173: 1-6.
Fazekas, A.J., Burgess, K.S., Kesanakurti, P.R., Graham, S.W., Newmaster, S.G.,
Husband, B.C., Percy, D.M., Hajibabaei, M., and Barrett, S.C.H. 2008 Multiple multilocus DNA barcodes from the plastid genome discriminate plant species equally well. PLoS ONE. 3(7): e2802. doi:10.1371/journal.pone.0002802.
Felsenstein, J. 1985. Confidence limits on phylogenies: An approach using the
bootstrap. Evolution. 39: 783-791. Francis, C.M. 2008. A Field Guide to the Mammals of South-East Asia. London: New
Holland Publishers. 392 pp. Francis, C.M., Borisenko, A.V., Ivanova, N.V., Eger, J.L. Lim, B.K., Guille´n-Servent,
A., Kruskop, S.V., Mackie, I. and Hebert, P.D.N. 2010. The role of DNA barcodes in understanding and conservation of mammal diversity in Southeast Asia. Plos ONE. 5(9): 12575, 12 pp.
Funk, D.J., and Omland, K.E. 2003. Species-level paraphyly and polyphyly:
frequency, causes, and consequences, with insights from animal mitochondrial DNA. Annual Review of Ecology and Systematics. 34: 397-423.
Hajibabaei, M., Janzen, D.H., Burns, J.M., Hallwachs, W., and Hebery, P.D.N. 2006.
DNA barcodes distinguish species of tropical Lepidoptera. Proc. Natl. Acad. Sci. U.S.A. 103: 968-971.
Hebert, P.D.N., Cywinska, A., Ball, S.L. and DeWaard, J.R. (2003a) Biological
identifications through DNA barcodes. Proc R Soc Lond. B. Biol. Sci. 270: 313-321.
Hebert, P.D.N., Ratnasingham, S. and DeWaard, J.R. (2003b) Barcoding animal life:
Cytochrome c oxidase subunit 1 divergences among closely related species. Proc. R. Soc. Lond. B. Biol. Sci. 270: S596-S599.
43
Hebert, P.D.N., Stoeckle, M.Y., Zemlak, T.S., and Francis, C.M. 2004a. Identification of birds through DNA barcodes. Plos Biol. 2: e312. 10: 1657-1663
Hebert, P.D.N., Penton, E.H., Burns, J.M., Janzen, D.H., and Hallwachs, W. 2004b.
Ten species in one: DNA barcoding reveals cryptic species in the neotropical skipper butterfly Astraptes fulgerator. Proc. Natl. Acad. Sci. U.S.A. 10: 14812-14817.
Iranpur, V.M. and A.K. Esmailizadeh. 2010. Rapid extraction of high quality DNA from
whole blood stored at 4oC for long period. Protocol Online PID. http://www.protocol-online.org.
Janzen, D.H., Hajibabajei, M., Burns, J.M., Hallwachs, W., Remigio, E., Hebert,
P.D.N. 2005. Wedding biodiversity inventory of a large and complex Lepidoptera fauna with DNA barcoding. Philos. Trans. R. Soc. Lond. B. Biol. Sci. 360: 1835-1845.
Kerr, K.C.R., Stoeckle, M.Y., Dove, C.J., Weigt, L.A., Francis, C.M. and Hebert,
P.D.N. 2007. Comprehensive DNA barcode coverage of North American birds. Molecular Ecology Notes. 7: 535-543.
Kerr, K.C.R., Lijtmaer, D.A., Barreira, A.S., Hebert, P.D.N. and Tubaro, P.L. 2009.
Probing evolutionary patterns in Neotropical birds through DNA barcodes. PLoS ONE. 4: e4379.
Kimura, M. 1980. A simple method for estimating evolutionary rate of base
substitutions through comparative studies of nucleotide sequences. Journal of Molecular Evolution. 16: 111-120.
Kress, W.J., Wurdack, K.J., Zimmer, E.A., Weigt, L.A., and Janzen, D.H. 2005. Use
of DNA barcodes to identify flowering plants. Proc. Natl. Acad. Sci. U.S.A. 102: 8369-8374.
Meyer, C.P., Paulay, G. 2005. DNA barcoding: error rates based on comprehensive
sampling. Public Library of Science Biology. 3: 2229-2237. Mindell, D.P., Sorenson, M.D., Huddleston, C.J., Miranda, H.C., Knight, A., Sawchuk,
S.J. and Yuri, T. 1997. Phylogenetic relationships among and within select avian orders based on mitochondrial DNA. In: Mindell, D.P., editor. Avian molecular evolution and systematics. New York: Academic Press. pp. 214-247.
Monaghan, M.T., Balke, M., Gregory, T.R., and Vogler, A.P. 2005. DNA-based
species delineation in tropical beetles using mitochondrial and nuclear markers. Philos. Trans. R. Soc. Lond. B. Biol. Sci. 360: 1925-1933.
44
Moore, W.S. 1995. Inferring phylogenies from mtDNA variation: Mitochondrial-gene trees versus nuclear-gene trees. Evolution. 49: 718-726.
Nei, M. and Kumar, S. 2000. Molecular Evolution and Phylogenetics. Oxford
University Press, New York. Ratnasingham, S. and P.D.N. Hebert. 2007. BOLD: The Barcode of Life Data System
(www.barcodinglife.org). Molecular Ecology Notes. 1-10. Robson, C. 2000. A Field Guide to the Birds of South-East Asia. London: New
Holland. 504 pp. Rubinoff, D. 2006. Utility of mitochondrial DNA barcodes in species conservation.
Conserv. Biol. 20: 1026-1033. Saitou, N. and Nei, M. 1987. The neighbour-joining method: A new method for
reconstructing phylogenetic trees. Molecular Biology and Evolution 4: 406-425. Santamaria, M., Lanave, C., Vicario, S. And Saccone, C. 2007. Variability of the
mitochondrial genome in mammals at the inter-species/intra-species boundary. Biol. Chem. 388: 943-946.
Saunders, G.W. 2005. Applying DNA barcoding to red macroalgae: a preliminary
appraisal holds promise for future applications. Philos. Trans. R. Soc. Lond. B. Biol. Sci. 360: 1879-1888.
Scheffer, S.J., Lewis, M.L., Joshi, R.C. 2006. DNA barcoding applied to invasive
leafminers (Diptera: Agromyzidae) in the Philippines. Annals of the Entomological Society of America. 99: 204-210.
Scicluna, S.M., Tawari, B., and Clark, C.G.l. 2006. DNA barcoding of blastocystis.
Protist. 157: 77-85. Smith, M.A., Fisher, B.L., Hebert, P.D.N. 2005. DNA barcoding for effective
biodiversity assessment of a hyperdiverse arthropod group: the ants of Madagascar. Philos. Trans. R. Soc. Lond. B. Biol. Sci. 360: 1825-1834.
Sogin, M.L., Morrison, H.G., Huber, J.A., Mark Welch, D., Huse, S.M., Neal, P.R.,
Arrieta, J.M., and Herndl, G.J., 2006. Microbial diversity in the deep sea and the underexplored ‘rare biosphere’. Proc. Natl. Acad. Sci.
Stoeckle, M.Y. and P.D.N. Hebert. 2008 (October). Barcode of Life. Scientific
American. pp. 82-88. Summerbell, R.C., Levesque, C.A., Seifert, K.A., Bovers, M., Fell, J.W., Diaz, M.R.,
Boekhout, T., Stalpers, J.A., and Crous, P.W. 2005. Microcoding: the second
45
step in DNA barcoding. Philos. Trans. R. Soc. Lond. B. Biol. Sci. 360: 1897-1903.
Tamura, K., Dudley, J., Nei, M., and Kumar, S. 2007. MEGA4: Molecular
Evolutionary Genetics Analysis (MEGA) software version 4.0. Molecular Biology and Evolution. 24: 1596-1599.
Teletchea F, Bernillon J, Duffraisse M, Laudet V, Hänni C. 2008. Microarray-based
identification of vertebrate species in food and forensic samples: the need for Integrative taxonomy. Journal of Applied Ecology. 45: 967-975.
Thompson, J.D., Higgins, D.G., and Gibson, T.J. 1994. ClustalW -improving the sensitivity of progressive multiple sequence alignment through sequence weighting, position-specific gap penalties and weight matrix choice. Nucleic Acids Res. 22: 4673-4680.
Ward, R.D., Zemlak, T.S., Innes, B.H., and Last, P.R. 2005. DNA barcoding
Australia’s fish species. Phil. Trans. R. Soc. Lond. B. Biol. Sci. 360, 1847-1857. Ward, R., Holmes, B., White, W. and Last, P. 2008. DNA barcoding Australian
chondrichthyans: results and potential uses in conservation. Marine Freshw. Res. 59: 57-71.
Willeslev, E., Hansen, A.J., Binladen, J., Brand, T.B., Gilbert, M.T.P., Shapiro, B.,
Bunce, M., Wiuf, C., Gilichinsky, D.A. and Cooper, A. 2003. Diverse plant and animal genetic records from Holocene and Pleistocene sediments. Science. 300: 791-795.
Wilson, D.E. and Reeder, D.M. (eds). 2005. Mammal Species of the World: A
Taxonomic and Geographic Reference. Third Edition. Johns Hopkins University Press, Baltimore, Maryland, USA, 2000 p.
Yoo, H.S., Eah, J.Y., Kim, J.S., Kim, Y.J., Min, M.S., Paek, W.K., Lee, H., and Kim,
C.B. 2006. DNA barcoding Korean birds. Mol. Cells. 22 (3): 323-327. Publications Bondoc, O.L. 2013. Genetic diversity and relationship of common poultry breeds and
strains (Class Aves) in the Philippines based on cytochrome c oxidase I gene sequence. Asia Life Sciences. 22 (1): 1-19.
Bondoc, O.L. 2012. DNA barcoding of red jungle fowls (Gallus gallus philipensis
Hatchi-suka) from different mountains areas in the Philippines. Journal of Environmental Science and Management. (Accepted July 2012).
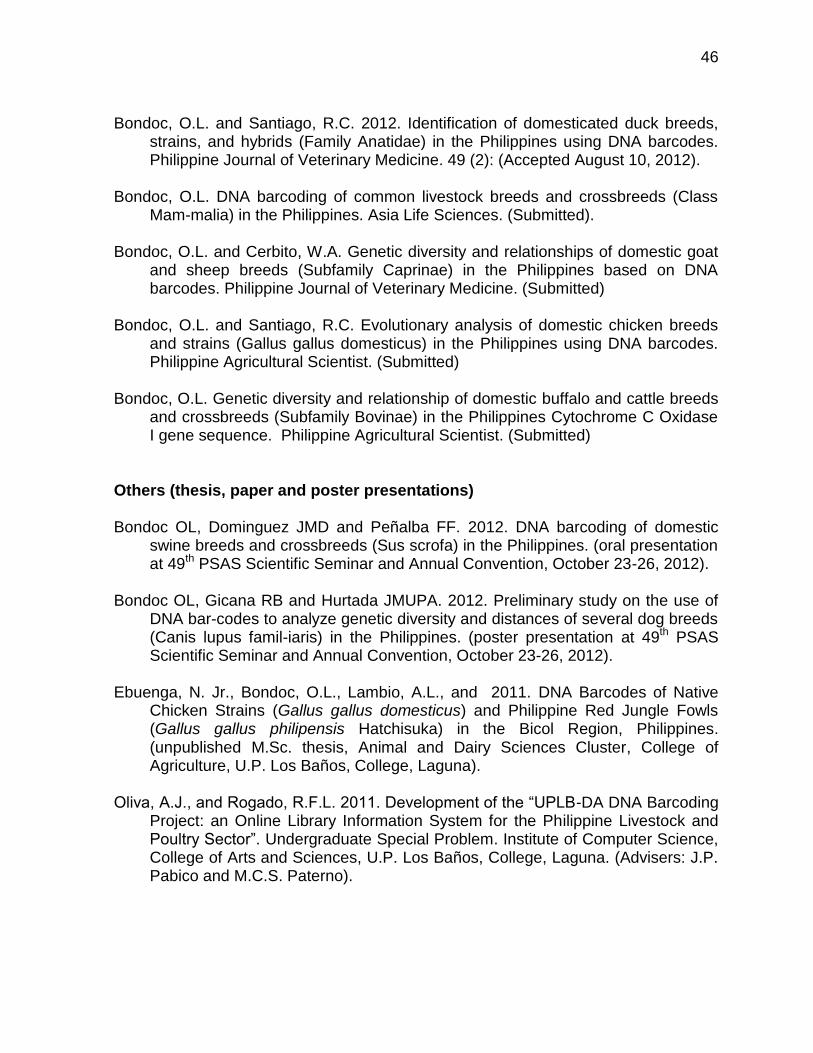
46
Bondoc, O.L. and Santiago, R.C. 2012. Identification of domesticated duck breeds,
strains, and hybrids (Family Anatidae) in the Philippines using DNA barcodes. Philippine Journal of Veterinary Medicine. 49 (2): (Accepted August 10, 2012).
Bondoc, O.L. DNA barcoding of common livestock breeds and crossbreeds (Class
Mam-malia) in the Philippines. Asia Life Sciences. (Submitted). Bondoc, O.L. and Cerbito, W.A. Genetic diversity and relationships of domestic goat
and sheep breeds (Subfamily Caprinae) in the Philippines based on DNA barcodes. Philippine Journal of Veterinary Medicine. (Submitted)
Bondoc, O.L. and Santiago, R.C. Evolutionary analysis of domestic chicken breeds
and strains (Gallus gallus domesticus) in the Philippines using DNA barcodes. Philippine Agricultural Scientist. (Submitted)
Bondoc, O.L. Genetic diversity and relationship of domestic buffalo and cattle breeds
and crossbreeds (Subfamily Bovinae) in the Philippines Cytochrome C Oxidase I gene sequence. Philippine Agricultural Scientist. (Submitted)
Others (thesis, paper and poster presentations) Bondoc OL, Dominguez JMD and Peñalba FF. 2012. DNA barcoding of domestic
swine breeds and crossbreeds (Sus scrofa) in the Philippines. (oral presentation at 49th PSAS Scientific Seminar and Annual Convention, October 23-26, 2012).
Bondoc OL, Gicana RB and Hurtada JMUPA. 2012. Preliminary study on the use of
DNA bar-codes to analyze genetic diversity and distances of several dog breeds (Canis lupus famil-iaris) in the Philippines. (poster presentation at 49th PSAS Scientific Seminar and Annual Convention, October 23-26, 2012).
Ebuenga, N. Jr., Bondoc, O.L., Lambio, A.L., and 2011. DNA Barcodes of Native
Chicken Strains (Gallus gallus domesticus) and Philippine Red Jungle Fowls (Gallus gallus philipensis Hatchisuka) in the Bicol Region, Philippines. (unpublished M.Sc. thesis, Animal and Dairy Sciences Cluster, College of Agriculture, U.P. Los Baños, College, Laguna).
Oliva, A.J., and Rogado, R.F.L. 2011. Development of the “UPLB-DA DNA Barcoding
Project: an Online Library Information System for the Philippine Livestock and Poultry Sector”. Undergraduate Special Problem. Institute of Computer Science, College of Arts and Sciences, U.P. Los Baños, College, Laguna. (Advisers: J.P. Pabico and M.C.S. Paterno).
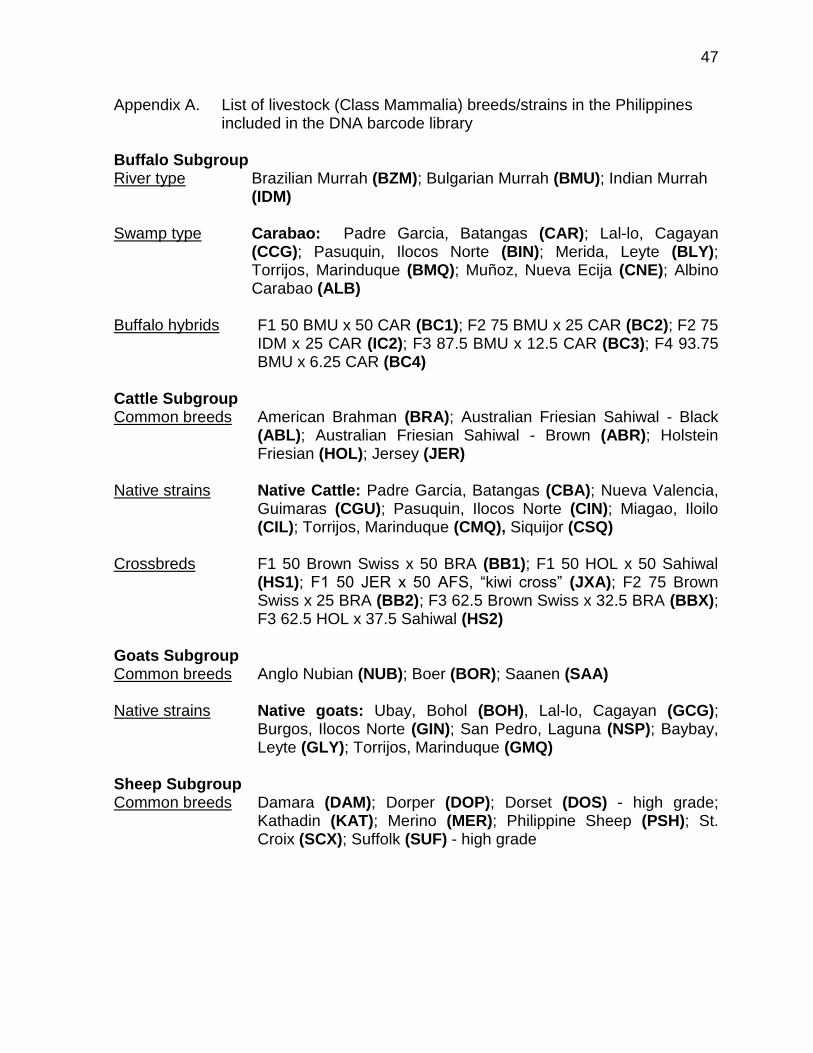
47
Appendix A. List of livestock (Class Mammalia) breeds/strains in the Philippines included in the DNA barcode library
Buffalo Subgroup River type Brazilian Murrah (BZM); Bulgarian Murrah (BMU); Indian Murrah
(IDM) Swamp type Carabao: Padre Garcia, Batangas (CAR); Lal-lo, Cagayan
(CCG); Pasuquin, Ilocos Norte (BIN); Merida, Leyte (BLY); Torrijos, Marinduque (BMQ); Muñoz, Nueva Ecija (CNE); Albino Carabao (ALB)
Buffalo hybrids F1 50 BMU x 50 CAR (BC1); F2 75 BMU x 25 CAR (BC2); F2 75
IDM x 25 CAR (IC2); F3 87.5 BMU x 12.5 CAR (BC3); F4 93.75 BMU x 6.25 CAR (BC4)
Cattle Subgroup Common breeds American Brahman (BRA); Australian Friesian Sahiwal - Black
(ABL); Australian Friesian Sahiwal - Brown (ABR); Holstein Friesian (HOL); Jersey (JER)
Native strains Native Cattle: Padre Garcia, Batangas (CBA); Nueva Valencia,
Guimaras (CGU); Pasuquin, Ilocos Norte (CIN); Miagao, Iloilo (CIL); Torrijos, Marinduque (CMQ), Siquijor (CSQ)
Crossbreds F1 50 Brown Swiss x 50 BRA (BB1); F1 50 HOL x 50 Sahiwal
(HS1); F1 50 JER x 50 AFS, “kiwi cross” (JXA); F2 75 Brown Swiss x 25 BRA (BB2); F3 62.5 Brown Swiss x 32.5 BRA (BBX); F3 62.5 HOL x 37.5 Sahiwal (HS2)
Goats Subgroup Common breeds Anglo Nubian (NUB); Boer (BOR); Saanen (SAA)
Native strains Native goats: Ubay, Bohol (BOH), Lal-lo, Cagayan (GCG); Burgos, Ilocos Norte (GIN); San Pedro, Laguna (NSP); Baybay, Leyte (GLY); Torrijos, Marinduque (GMQ)
Sheep Subgroup Common breeds Damara (DAM); Dorper (DOP); Dorset (DOS) - high grade;
Kathadin (KAT); Merino (MER); Philippine Sheep (PSH); St. Croix (SCX); Suffolk (SUF) - high grade
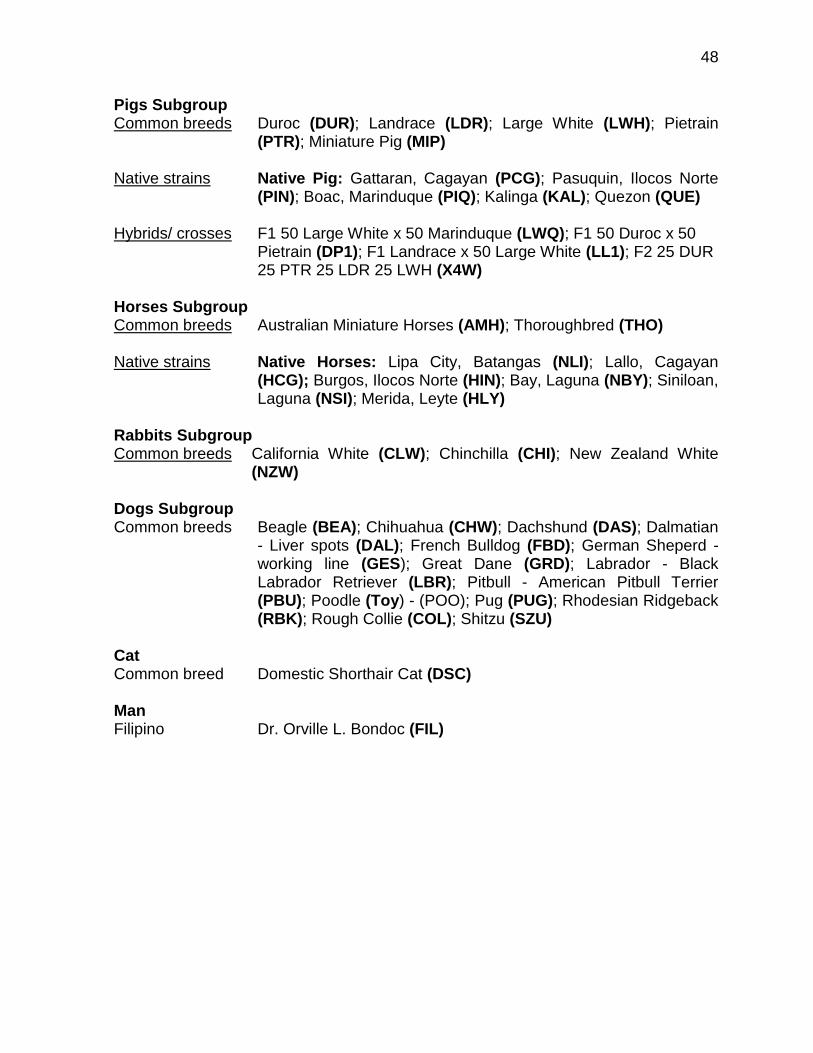
48
Pigs Subgroup Common breeds Duroc (DUR); Landrace (LDR); Large White (LWH); Pietrain
(PTR); Miniature Pig (MIP)
Native strains Native Pig: Gattaran, Cagayan (PCG); Pasuquin, Ilocos Norte (PIN); Boac, Marinduque (PIQ); Kalinga (KAL); Quezon (QUE)
Hybrids/ crosses F1 50 Large White x 50 Marinduque (LWQ); F1 50 Duroc x 50 Pietrain (DP1); F1 Landrace x 50 Large White (LL1); F2 25 DUR 25 PTR 25 LDR 25 LWH (X4W)
Horses Subgroup Common breeds Australian Miniature Horses (AMH); Thoroughbred (THO)
Native strains Native Horses: Lipa City, Batangas (NLI); Lallo, Cagayan (HCG); Burgos, Ilocos Norte (HIN); Bay, Laguna (NBY); Siniloan, Laguna (NSI); Merida, Leyte (HLY)
Rabbits Subgroup Common breeds California White (CLW); Chinchilla (CHI); New Zealand White
(NZW)
Dogs Subgroup Common breeds Beagle (BEA); Chihuahua (CHW); Dachshund (DAS); Dalmatian
- Liver spots (DAL); French Bulldog (FBD); German Sheperd - working line (GES); Great Dane (GRD); Labrador - Black Labrador Retriever (LBR); Pitbull - American Pitbull Terrier (PBU); Poodle (Toy) - (POO); Pug (PUG); Rhodesian Ridgeback (RBK); Rough Collie (COL); Shitzu (SZU)
Cat Common breed Domestic Shorthair Cat (DSC) Man Filipino Dr. Orville L. Bondoc (FIL)
49
Appendix 2. List of poultry (Class Aves) breeds/strains in the Philippines included in the DNA barcode library
Chickens Subgroup Common breeds Australorp (AUS); Barred Plymouth Rock (BPR); Black Giant
(BLG); Black Jersey (BLJ); New Hampshire (NHS); Rhode Island Red (RIR); Taiwan Yellow (TWY); White Leghorn (WLH)
Commercial Hybrids Commercial Layer/ Babcock (LAY); Commercial Broiler/ Cobb
(BRO); SASSO (SAS) Native strains Native chickens: Banaba (BAN); Camarines (BIC); Darag
(DAR); Igon (IGN); Joloano (JOL); Palawan Lasak (PAL); Paraoakan (PAR)
Fancy breeds Golden Seabright Bantam (GSB); Silver Seabright Bantam
(SSB); Blue Cochin (BCO); Silky (SIL) Game fowls Malaysian Asil (ASI); Frost Grey (FRG); Jimmy East Grey (JEG);
Gilmore Hatch (GIH); Leaper Hatch (LEH); McLean Hatch (MLH); Mel Sims Hatch (MSH); Yellow Legged Hatch (YLH); Kelso Jimmy East (KJE); Kelso Johnny Jumper (KJJ); Radio (RAD); Sweater McGuiness (SMG); Sweater Possum (SPO)
Red jungle fowls Mt. Mayon, Tabaco, Albay (MAY); Mt. Natib, Orani, Bataan;
(ORA); Mapolo Hill, Dayapan, Ibaan, Batangas (DAY); Mt. Taal, Taal, Batangas (TAA); Mt. Bohol (BOH); Mt. Sierra Madre, Lallo, Cagayan (CAG); Mt. Guinatungan, Daet, Camarines Norte (CAN); Mt. Agustin, Pasacao, Camarines Sur (CAM); Mt. Supu, Agmalobo, Ivisan, Capiz (CPZ); Mt. Silungan Virac, Catanduanes (CTD); Mt. Banahaw, Dolores, Quezon (DOL); Mt. Kamandingan, Sarrat, Ilocos Norte (ILC); Mt. Sierra Madre, Ilagan, Isabel (ISB); Mt. Pasunganan, Baybay City, Leyte (LEY); Mt. Makiling, Los Baños, Laguna (MAK); Mt. Pandan, Monreal, Ticao Island, Masbate (MSB); Mt. Halcon - Naujan, Oriental Mindoro (MIN); Mt. Kanlaon, San Carlos, Negros Occidental (NEG); Mt. Palawan (PWN); Mt. Sierra Madre, Madela, Quirino (QUI); Mt. Daraitan, Antipolo - Tanay, Rizal (TAN); Mt. Cambandilaan, Larena, Siquijor (SQJ); Mt. Bulusan, Bulusan, Sorsogon (BUL); Mt. Castilla, Castilla, Sorsogon (SOR); Mt. Tumatangis, Inandan, Sulu (SUL); Mt. Palomok, Titay, Zamboanga Sibugay (ZAM)
Quails Subgroup
Common breeds Japanese Shuttle (JPS); Silver White (SWH); Taiwan Yellow (TAI); Tuxedo (TUX)
50
Guinea Fowl Subgroup Common breed Bengala (BEN)
Turkey Subgroup
Common breeds Broad Breasted Bronze (BBB); Nicholas White (NWH)
Ducks Subgroup
Common breeds Khaki Campbell (KCB); Pekin (PEK); Pekin - Czechoslovakia (PCZ); Tsaiya (TSA); Muscovy (MUS)
Philippine mallard strains BAI Pateros Black (PBL); BAI Pateros Khaki Brown (PKB); BAI
Pateros White (PWH); Philippine Mallard Batangas (PMB); Philippine Mallard Pampanga (PMP); Philippine Mallard Quezon (PMQ)
Commercial duck hybrids F1 50 Pateros x 50 Pekin (PP1); F3 87.5 Pekin x 12.5 Pateros
(PP2); Laguna - Mule Duck (LAD)
Geese Subgroup
Common breeds Toulouse (TOU); White Embden (WEM)
Ostrich Subgroup
Common breed Blue Neck (BNK) Pigeons Subgroup Common breeds Homing Pigeons (HPN); White Pigeons (WPN)
51
Individual Acknowledgements:
Andy Abella, Romy Almeda, Modesto Alonzo, Artemio Almoroto, Mr. Am’mak,
Amado Angeles, Bert Anido, Amando Apoderado, Ruben Arsinas, Edwin Atabay,
Fileteo Atendido, Joel Bagarinao, Philbert Baguilat, Elmer Bandian, Elmer Baure,
Elizabeth Beltran, Jose Bigcas, Josenieto Bihis, Peale Jon Bondoc ,
Eduardo Briones, Jaime Cabarles, Rodrigo Cachuela, Flomella Caguicla,
Jeric Paul Casilag, Dennis Castasus, John Paul Caunan, Josie Centeno,
Wilson Cerbito, Cenon Cerezo, Guada dela Cerna, Arnel del Barrio, Tintin Defensor,
Adena Detera, Dominador Discion, Jorge Dominguez, Adelino Dotaro, Willie Eda,
Nestor Ebuenga, Audi Edralin, Joselito Elizaga, Herminio Esguerra,
Celso Evangelista, Edward Foronda, Beatriz Garcia, Noel Genturo,
Francisco Geromo, Karlo Gicana, Rommel Herrera, Undin Hurtada, Peter Icalia,
Walter Israel, Tata Jimenez, Pedro Kauntaw, Reymundo Lagazo, Nancy Lapid,
Sabin Larrizabal, Raymund Ledesma, Roger Lopez Archie Lluz, Anastacia Lucas,
Jessie Malab, Bernard Malavi, Arnulfo Monleon, Rustico Morales,
Renelyn Morcoso, Gime Mortalla, Angela Oliva, Manuel Nalzaro, Gideo Napecole,
Jade Pabico, Bernie Patricio, Francisco Peñalba, Maying Pilapil, Mercy Porsuelo,
Antonio Rayos, Marichele Rebenque, Reli Ann Rogado, George Roxas,
Agapita Salces, Arturo Samodio, Edwin Sanchez, Mario Sandoval, Rene Santiago,
Julius Santos, Eduardo Soriano, Pablo Subong, Fidel Talay, Antonio Tamayo,
Rogelio Tamayo, Wedamar Tanaman, Tomas Tello, Loida Valenzuela, Anthony Yap.